In this section, different results are listed based on the chosen nominal qualitative variable. As a first step, all the inspections were analysed solely based on the quantitative variables to give an overview of the data.
3.1. Biplot Representation of all PSC Inspections 2012–2019
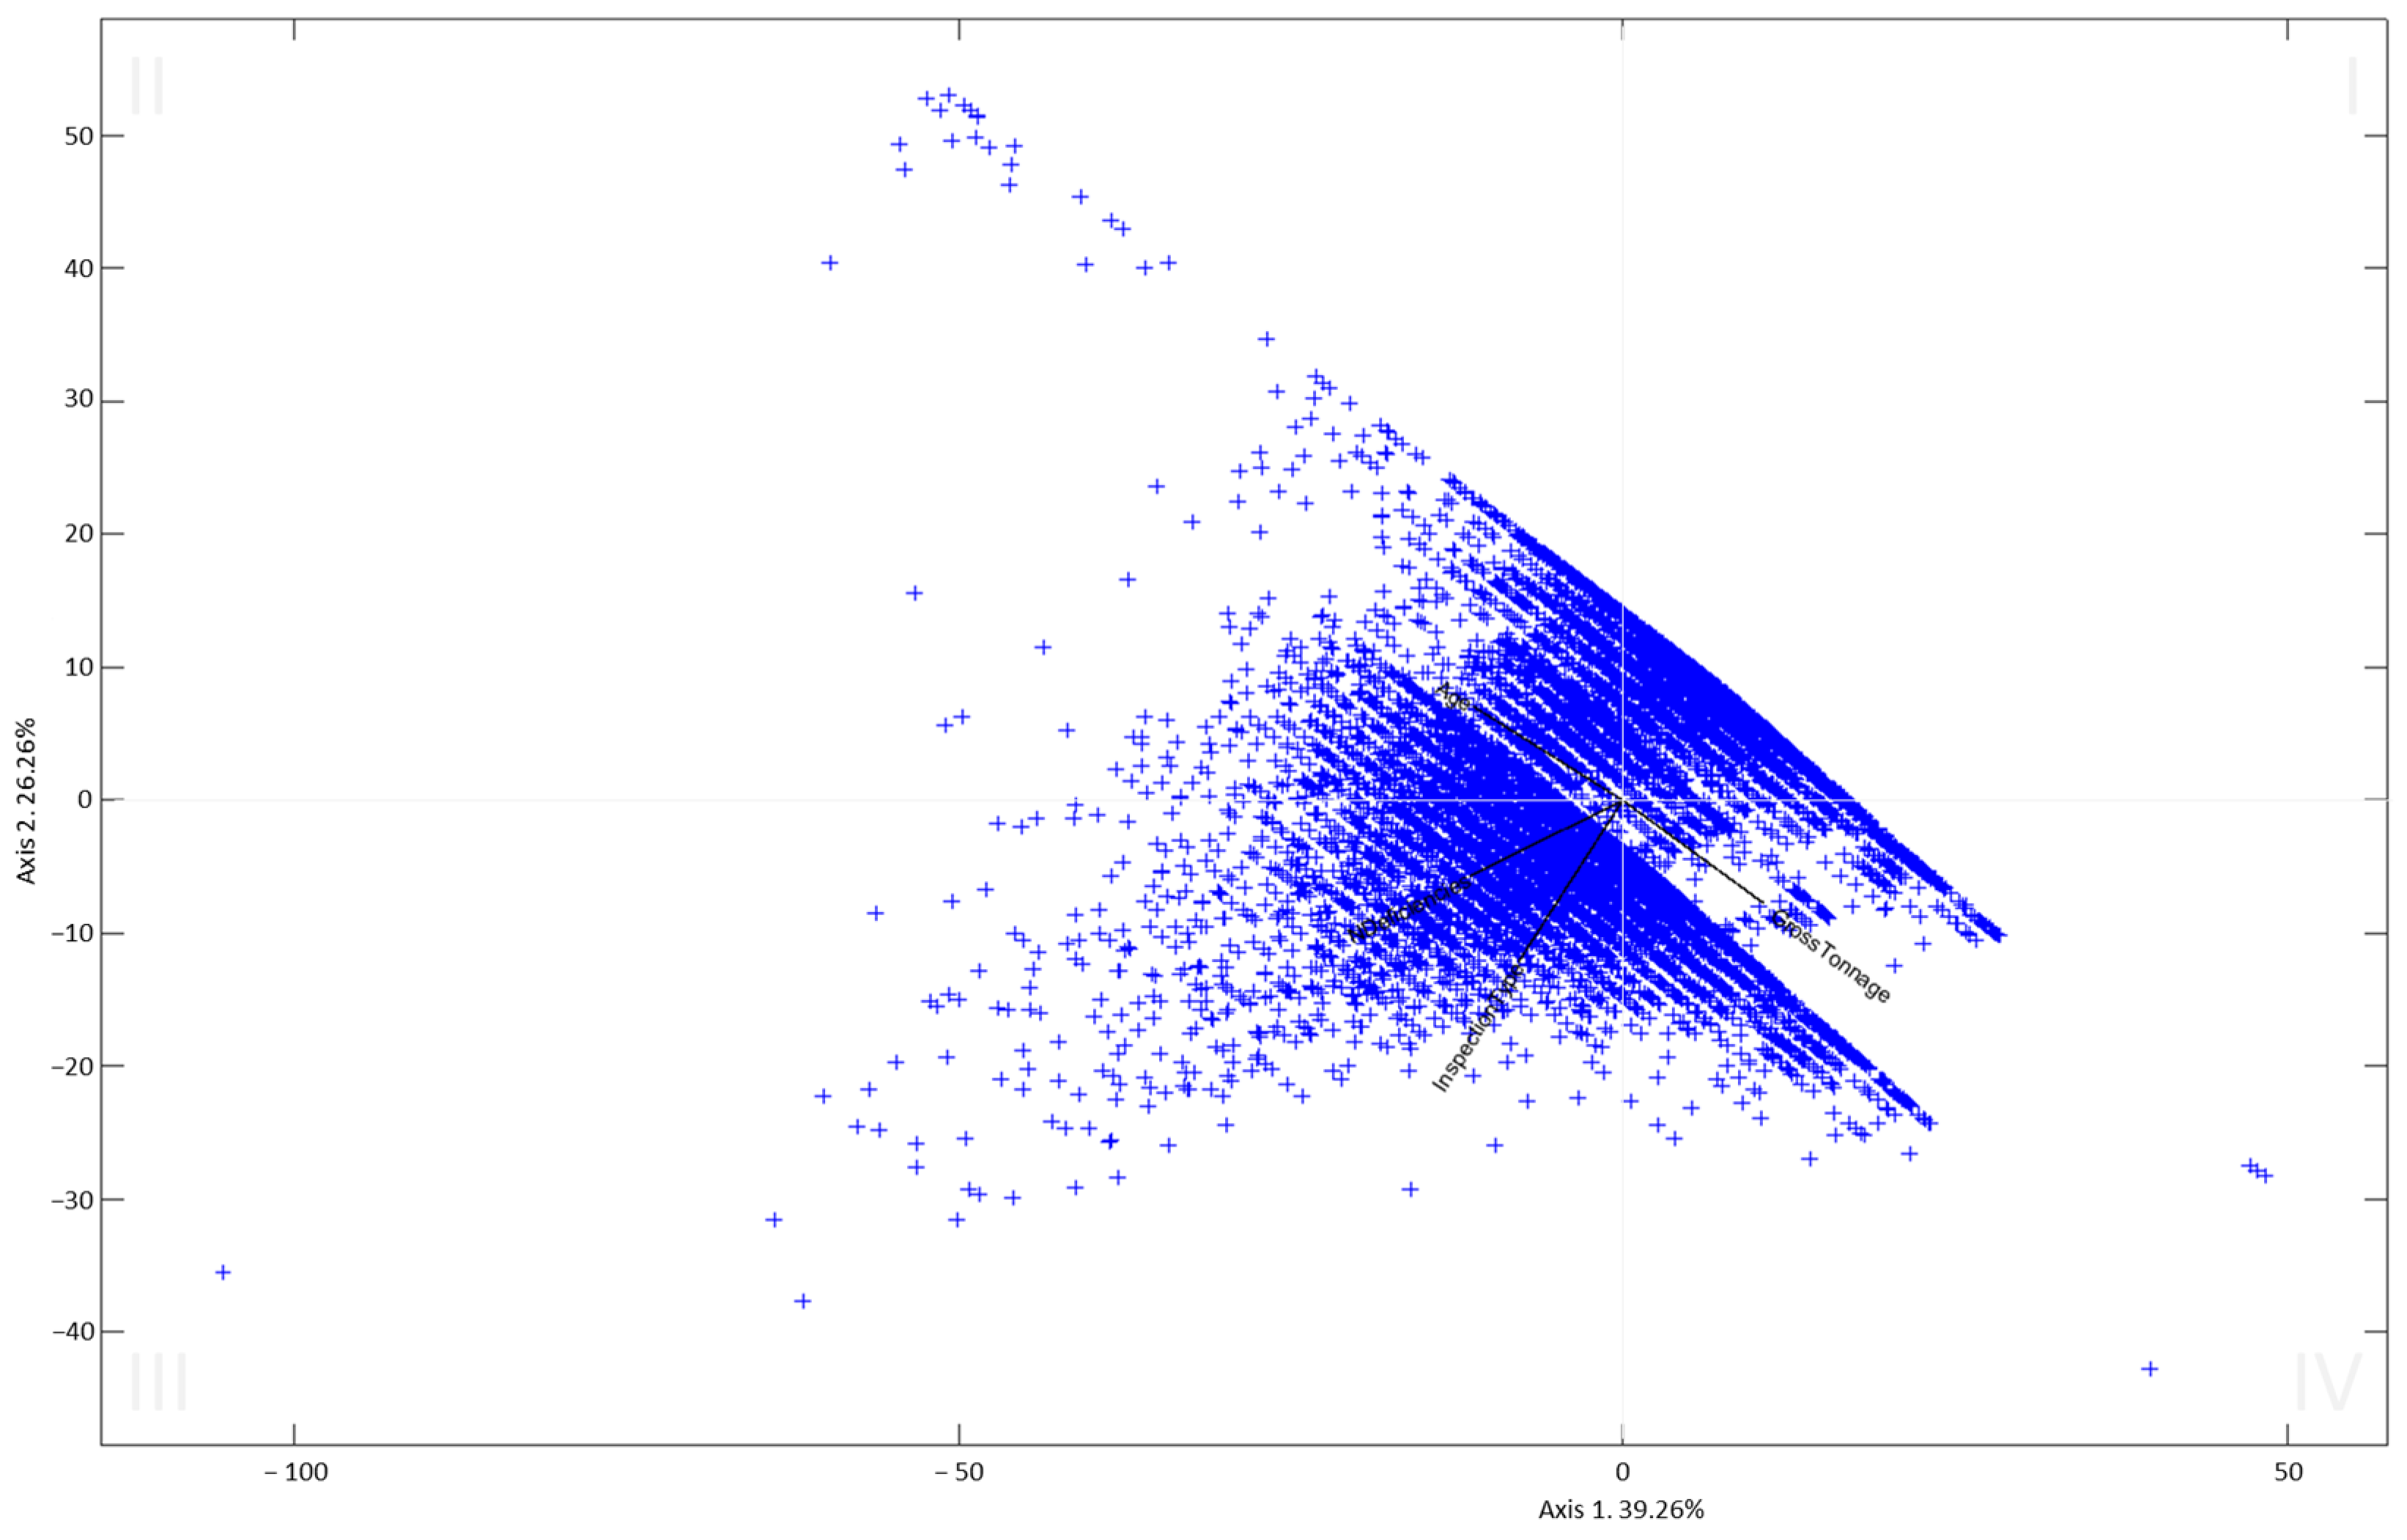
First, for purely exploratory purposes, the full sample, i.e., all the inspections conducted in the studied ports between 2012 and 2019, is presented (
Figure 1). For this, an HJ-Biplot analysis was performed to represent all of the individual PSC inspections (individuals; rows in the data matrix) based on their characteristics, age, ship dimensions, inspection type, and number of deficiencies found (variables; columns of the data matrix).
To correctly apply the HJ-Biplot method, it is essential to consider several measures, such as eigenvalues and explained variance (
Table 3) and the relative contribution of the factor to the element (
Table 4). These measures assist in pinpointing the variables accountable for the axis positions and the resultant configuration.
Naturally, the representation of such a high number of individuals makes interpretation difficult. What can be seen is that the data are distributed throughout the plane, showing a rich variability, an aspect that is of vital importance when carrying out a multivariate analysis. This translates to mixed traffic in the studied ports, that is to say, inspections are performed on new ships with generally few deficiencies, old ships with generally a lot of deficiencies, and also on medium-sized ships with a variety of deficiencies.
Likewise, hidden behind the points is the structure made by the study variables (
Figure 2), which indicates the position of the inspections and the points on the plane. The correlation between variables can be seen in the angles formed by the vectors; acute angles indicate direct relationships; right angles, close to 90°, refer to independent variables; and obtuse angles show inverse relationships. There is therefore a correlation between the age of a ship and the number of deficiencies; in particular, older ships are more likely to have a higher number of deficiencies.
There is also an inverse relationship between ship age and its gross tonnage; the older the ship, the smaller its dimensions are and, as seen before, the greater the number of deficiencies. These two results combined show a typical substandard ship’s profile. By contrast, the younger the ship, the bigger its dimensions, which can be associated with the worldwide tendency to build bigger ships continuously. A clear example is that of container ships, oil tankers, and noxious liquid substances tankers, which are ships that have proliferated in number and size in the last decade and that will be discussed in the next section.
To obtain specific conclusions, the following sections provide representations referring to the country of registry, inspection class, ship type, and port of inspection.
3.2. Biplot Representation of the Country of Registry of the Studied Ships
In this section, with the use of an HJ-Biplot, the country of registry of the studied ships will be projected onto the variables that record the ship’s dimensions, age, inspection type, and number of deficiencies found. Thus, it is possible to characterise each country of registry based on these parameters and, therefore, find the main distinguishing differences.
As in
Section 3.1, the eigenvalues and explained variance (
Table 5) and the relative contribution of the factor to the element (
Table 6) were calculated. This makes it possible to identify the variables responsible for the axis positions and thus the configuration of the factorial plane.
All the variables contribute substantially to the construction of the first two factorial axes. Gross tonnage, age, and the number of deficiencies have a higher weight on the first axis, and inspection type has a higher weight on the second axis. In addition, the first two axes explain 80% of the data variability. For this reason, the factorial plane made up of 1 and 2 will be used to represent the countries and variables (
Figure 3).
The 93 countries are distributed throughout the plane, which means that there are differences depending on where the ships are registered. The structure of the variables is maintained, i.e., the angles between vectors are similar to those in
Section 3.1, although in this case, the relationship between the number of deficiencies and the ship’s age is accentuated.
Thus, the countries situated on the right semi-plane have younger ships, which are also those with higher gross tonnage. These countries include, for example, Kuwait, Taiwan, Japan, Hong Kong, and Brazil (e.g., Kuwait ships on average have fewer than one deficiency, are 4 years old, and are 101,918 gross tons; in Taiwan, the ships on average have one or no deficiencies, are 2 years old; and are 83,684 gross tons).
Furthermore, countries in the upper-right half of the semi-plane (first quadrant) have a lower number of shortcomings. These countries include, for example, Belgium, Denmark, France, Germany, Norway, Low Countries, Ireland, the U.K., and the Isle of Man, as well as others such as Malaysia, Singapore, Japan, Taiwan, and the Marshall Islands. All these countries are found on the white list of the Paris MoU [
49]; they have new ships with few deficiencies and are represented by a white dot in reference to this list. All these results coincide to serve as a verification of the method.
Another group can be found on the left semi-plane, where grey and black points are situated, which refer to their position on the Paris MoU lists. On the left semi-plane are the countries with older ships, smaller dimensions, and a higher number of deficiencies. The further the point is to the left of the plane, the worse the characteristics are. Countries such as Tunisia, Algeria, Thailand, and Iran, which are near the vertical axis, have ships that are approximately 12 years old, with between four and six deficiencies and a maximum of 25,000 gross tons. Other countries like Egypt, Morrocco, Tuvalu, Saint Vincent and the Grenadines, Bulgaria, and Vanuatu, which are found further to the left, have ships that are on average 22 years old, with between five and seven deficiencies, and a maximum gross tonnage of less than 18,000 tons (except Tuvalu, whose gross tonnage is close to 30,000 tons). All of these countries are found on the Paris MoU grey list [
49].
Lastly, the countries found on the Paris MoU blacklist are the leftmost points on the plane, which have the worst characteristics. These are countries such as Albania, Congo, the Dominican Republic, the Cook Islands, San Cristobal Island (a.k.a. Chatham), Belize, and Comoros. The majority of these have ships with more than seven deficiencies, an average age of 25 years or more, and a gross tonnage mostly under 7000 tons (except the Dominican Republic, with 18,000 tons). It is important to note that Vanuatu (grey list in 2018) was placed on the blacklist in previous years. Other more extreme cases are those of Moldova, Togo, Palau, Tanzania, and Sierra Leone, which have ships with more than 10 deficiencies, an average age of over 30 years, and a gross tonnage below 5000 tons. Lebanon (grey list in 2018) should be mentioned because it was previously on the blacklist and has similar characteristics to these countries.
The derived classification is consistent with the performance lists published by the Paris MoU throughout the study period [
49]. Therefore, this method may be appropriate for future flag classification or for flags that have not yet been classified. For instance, Djibouti, Iceland, Equatorial Guinea, and Jamaica have not been classified yet, but they could be included in the Paris MoU blacklist as they share similar characteristics with those mentioned.
The efficacy of the methodology as a classifier was affirmed through a validation process, involving a comparison of the outcomes from this section with the 2019 performance list [
49].
3.3. Biplot Representation of the Different Types of Ships Found in This Study
Following a similar procedure to the previous section, ‘ship type’ was projected as a variable onto the variables that evaluate ship dimensions, age, inspection type, and number of deficiencies found. The main objective is to identify if ship type is related to a higher number of deficiencies or if it is irrelevant.
Of the 23 types of ships found in this study, only those with a minimum of 10 ships were selected for analysis, which left a total of 20 different types (leaving out ‘commercial yacht’, ‘high-speed cargo’ and ‘livestock carrier’). Before presenting the HJ-Biplot representation, the measures used to interpret them correctly are shown including the eigenvalues and explained variance (
Table 7) and the relative contribution of the factor to the element (
Table 8). With the first two factorial axes, 76% of the total information is explained; therefore, these are used in the following representation (
Figure 4).
The different types of ships are found in different areas on the plane; therefore, there are differences in the variables depending on ship type. The structure of the variables is maintained, accentuating the relationship between the number of deficiencies and the type of inspection.
Table 8 shows the contribution of the variables to the axes, where the number of deficiencies has a higher weight on the horizontal axis. This means that more problematic ships will be located on the right side of the plane, which includes ships such as ‘refrigerated cargo’, ‘Ro-Ro passenger ship’, and ‘general cargo multipurpose’; conversely, those found on the left are less problematic ships with fewer deficiencies, like ‘NLS tanker’, ‘oil tanker’, ‘gas carrier’ or ‘container’.
The majority of ship types are found away from the origin, which means that the representation is of optimal quality. In the upper semi-plane, the ships are older and of smaller dimensions like ‘special-purpose ships’ or ‘other special activities’; conversely, the newer and bigger ships are found in the third quadrant, such as ‘oil tankers’, ‘containers’, ‘bulk carriers’ or ‘NLS tankers’.
The bulk carrier stands out because it is one of the bigger ships and also has an important number of deficiencies.
The use of this methodology in the future could assist in examining how the fleet ages and how the maritime traffic changes in these ports based on ship type.
3.4. Biplot Representation of the Different Classification Societies Recorded in PSC Inspections
The PSC inspections can be differentiated by their classification societies; for this investigation, the data are heterogeneous and are made up of 30 different certificates. The process is similar to the previous sections but in this case, the classification societies are projected onto the variables that evaluate ship dimensions, age, inspection type, and number of deficiencies found, and the HJ-Biplot analysis searches for the similarities and differences between them. To interpret the analysis correctly, the eigenvalues and explained variance (
Table 9) are given, as well as the relative contribution of the factor to the element (
Table 10). The first two factorial axes explain 88% of the total information, and, therefore, are the two axes represented (
Figure 5).
The classification societies differ in terms of the variables examined. While the structure of the variables remains consistent with the previous sections, there is a more pronounced relationship between the type of inspection and the number of deficiencies in this context.
According to the variables observed in
Table 10, the first quadrant is defined by the type of inspection and the number of deficiencies. Classification societies in this quadrant have a higher number of deficiencies and undergo more extensive inspections. In contrast, classification societies in the third quadrant have fewer deficiencies and are subject to less comprehensive inspections. Gross tonnage is in the second quadrant, suggesting that classification societies in this quadrant are associated with large, young ships. Conversely, the fourth quadrant is characterised by lower gross tonnage and older ships associated with the classification societies in that quadrant.
Figure 5 has grey, black, and white dots representing the corresponding performance list of the Paris MoU classification societies. White corresponds to a high-performance level, grey to a medium-performance level, and black to a low- to very-low-performance level.
This implies that ships affiliated with classification societies such as INCLAMAR, VRS, ML, IS, and NASHA tend to exhibit a higher number of deficiencies. Conversely, classification societies like CCS, ABS, KRS, LR, NKK, and DNVGL are linked to larger, more recent ships with fewer deficiencies. These findings are consistent with the annual performance list of classification societies published by the Paris MoU at all classification levels; the first group mentioned is typically listed in the Paris MoU’s low- to very-low-performance category, while the second group tends to be listed in the high-performance category. The alignment of classification society positions with those in the Paris MoU performance lists [
50] suggests the potential usefulness of this method as a classification tool. The list published in 2019 was also compared as a verification test, and the results are consistent with this study.
A subsequent verification exercise was carried out with the classification societies belonging to the International Association of Classification Societies (IACS), including ABS, BV, CCS, DNV, IR, KR, LR, NKK, PRS, RINA, and RS. To be a part of this international association, classification societies must guarantee professional integrity and maintain the high-quality standards required by IACS. This is achieved through an initial assessment and periodic verification of these standards, which are also verified by independent accredited certification bodies. All IACS [
50] societies fall into the category with the lowest number of deficiencies, indicating an association with younger and larger ships.
3.5. Biplot Representation of the 10 Most Important Paris MoU Ports
Lastly, using the HJ-Biplot analysis, the 10 most important Paris MoU ports of the study period, from which the inspection data for this study were obtained, were projected onto the variables that evaluate the ship’s dimensions, age, inspection type, and number of deficiencies found. This makes it possible to characterise each port and find the main differences among them.
Various measures are essential to apply and interpret the HJ-Biplot correctly, specifically, eigenvalues and explained variance (
Table 11), and the relative contribution of the factor to the element (
Table 12).
The first two axes of the analysis explain 83% of the data variability; therefore, the 1–2 factorial plane is used to represent the ports and variables (
Figure 6).
In this representation, the relationship between variables is weaker than in previous sections; however, it is possible to characterise the ports based on these variables. The results show that the most exhaustive inspections are carried out in Marseille, Immingham, Antwerp, and Le Havre, whereas the least rigorous inspections occur in Amsterdam and Bremerhaven.
The ships with the highest number of deficiencies are found in Hamburg and Antwerp, whereas the opposite is found in Le Havre and Bremerhaven.
The port of Le Havre contains larger ships than the rest of the ports; the next in line are Amsterdam and Bremerhaven.
With respect to age, the oldest ships are found in Amsterdam, Bremerhaven, and Hamburg. It is important to note that although Amsterdam and Bremerhaven ports have old ships, the numbers of deficiencies found are low.


