Abstract
Due to natural and anthropogenic disturbances, natural gas hydrates with morphologies of nodules and chunks dissociate and release massive free gas, creating large cavities within fine-grained marine sediments. However, it is still a challenge to quantify the impact of gas cavities on mechanical properties of cavitied fine-grained marine sediments as there is a lack of efforts focusing on the inner structure visualization. In this study, an oedometer test and X-ray computed tomography scans are jointly conducted on marine clayey silt with gas cavities, and the confined compressibility as well as the inner structure change under an undrained condition are explored, followed by development of a theoretical model depicting the void ratio change. The results show that vertical loading induces a void ratio reduction, and the reduced void ratio can fully recover after being unloaded. Although being fully recovered, unrecovered changes of the inner structure still remain after being unloaded. Examples include closed cracks in the lower matrix, new occurring cracks in the upper matrix, and the fragmented gas cavity. In addition, the void ratio linearly increases with the increasing inverse of normalized pore gas pressure, while the coefficient of the effective stress linearly decreases with the increasing inverse of normalized vertical loading stress. The proposed theoretical model captures the essential physics behind undrained confined deformation of fine-grained marine sediments with gas cavities when subjected to loading and unloading.
1. Introduction
Marine sediments are the most expansive and largest pool of organic carbon on the planet [1], and the organic carbon experiences varieties of microorganism-driven processes (e.g., acetoclastic methanogenesis, hydrogenotrophic methanogenesis, methylotrophic methanogenesis, …) to produce methane when the burial depth is proper to meet a low permeability condition and create an anaerobic environment [2]. Produced methane in the anaerobic zone initially dissolves in pore water and then escapes from the liquid (i.e., gas exsolution) as dispersive gas bubbles [3], sometimes transforming into solid methane hydrate and accumulating in marine sediments below various seafloor locations on the earth. Examples include the Blake Ridge in the continental margin of North America [4], the northern Gulf of Mexico [5], the eastern Nankai Trough [6], the Krishna-Godavari Basin offshore eastern India [7], and the northern South China Sea (SCS) [8,9]. The marine sediments in the northern SCS are rich in fines (particle size < 75 μm) [10,11], and the pore throats are inherently small while the capillary pressure is innately high. Natural gas hydrates (mainly methane hydrate) formed in such sediments will displace the surrounding particles and exhibit morphologies of lenses/veins and nodules/chunks [12]. These types of natural gas hydrates mainly occur in a water-saturated environment, but when they coexist with cold seeps, a gas-rich environment will be available [13,14]. Natural gas hydrates beneath the ocean and permafrost potentially dissociate due to climate change, submarine earthquake, coastal development, fossil energy exploration and exploitation [15,16]. The dissociation will release massive gas [17] and create large voids (i.e., cavities) within fine-grained sediments, modifying the original mechanical properties [18]. This poses a great threat to the safety of ocean engineering and the sustainability of the ecological environment as even low methane emission can irreversibly affect global climate and the biosphere [19,20,21].
The compression of marine sediments closed to a rigid boundary (e.g., suction bucket, offshore pile, drilling wellbore) or far from the boundaries of a large area are laterally confined, and the laterally confined consolidation behavior of clayey silt with large voids occupied by gas bubbles is controlled by the compressibility and drainage capacity of pore fluids [22]. A double compressibility model [23] has been proposed to describe the consolidation process, and the total compressibility can be summarized by introducing two types of deformation mechanism [24]: one is the compression and dissolution of free gas induced by loading alterations, plus deformation of the soil matrix around gas voids due to local shearing; the other one is the soil matrix compression after drainage caused by changes in the operative stress. The deformation mechanism indicates that gas type, solubility, temperature, and stress state are crucial factors controlling the overall compressibility. However, it is still challenging to quantify the impact of gas voids based on the existing knowledge since there is a lack of research efforts concentrating on the microscopic structures within fine-grained sediments with gas bubbles. To the best of our knowledge, only a limited number of scanning electron microscope (SEM) tests [25,26,27] and X-ray computed tomography (CT) scans [28,29,30,31,32] have been conducted on fine-grained estuarine and marine sediments with gas bubbles, and all these gas bubbles are well surrounded by a saturated soil matrix. However, the soil matrix of hydrate-bearing sediments in the northern SCS [33,34] is not all saturated as the saturation of free gas can reach 32% in the mixing layer [35], and the free gas saturation could be much larger when near cold seeps. After complete dissociation of natural gas hydrates, how the microscopic structures evolve and how the bulk volume changes when subjected to relatively fast loading and unloading both remain elusive.
This study conducts an oedometer test to quantify the confined compressibility of fine-grained marine sediments with large cavities after complete dissociation of noduled methane hydrate, and X-ray CT scans are jointly performed to observe corresponding changes in the microscopic structures under an undrained condition. A theoretical model is proposed to depict the behavior of bulk volume change, and the collapse of gas cavities is analyzed, followed by a discussion on the initiation and development of capillary-driven cracks in the soil matrix. The results provide evidence for the peculiar geological structures related to natural gas hydrates and insights into soil mechanics for the special marine sediments frequently encountered in ocean engineering and environmental processes.
2. Experimental Methods
2.1. Experimental Apparatus and Materials
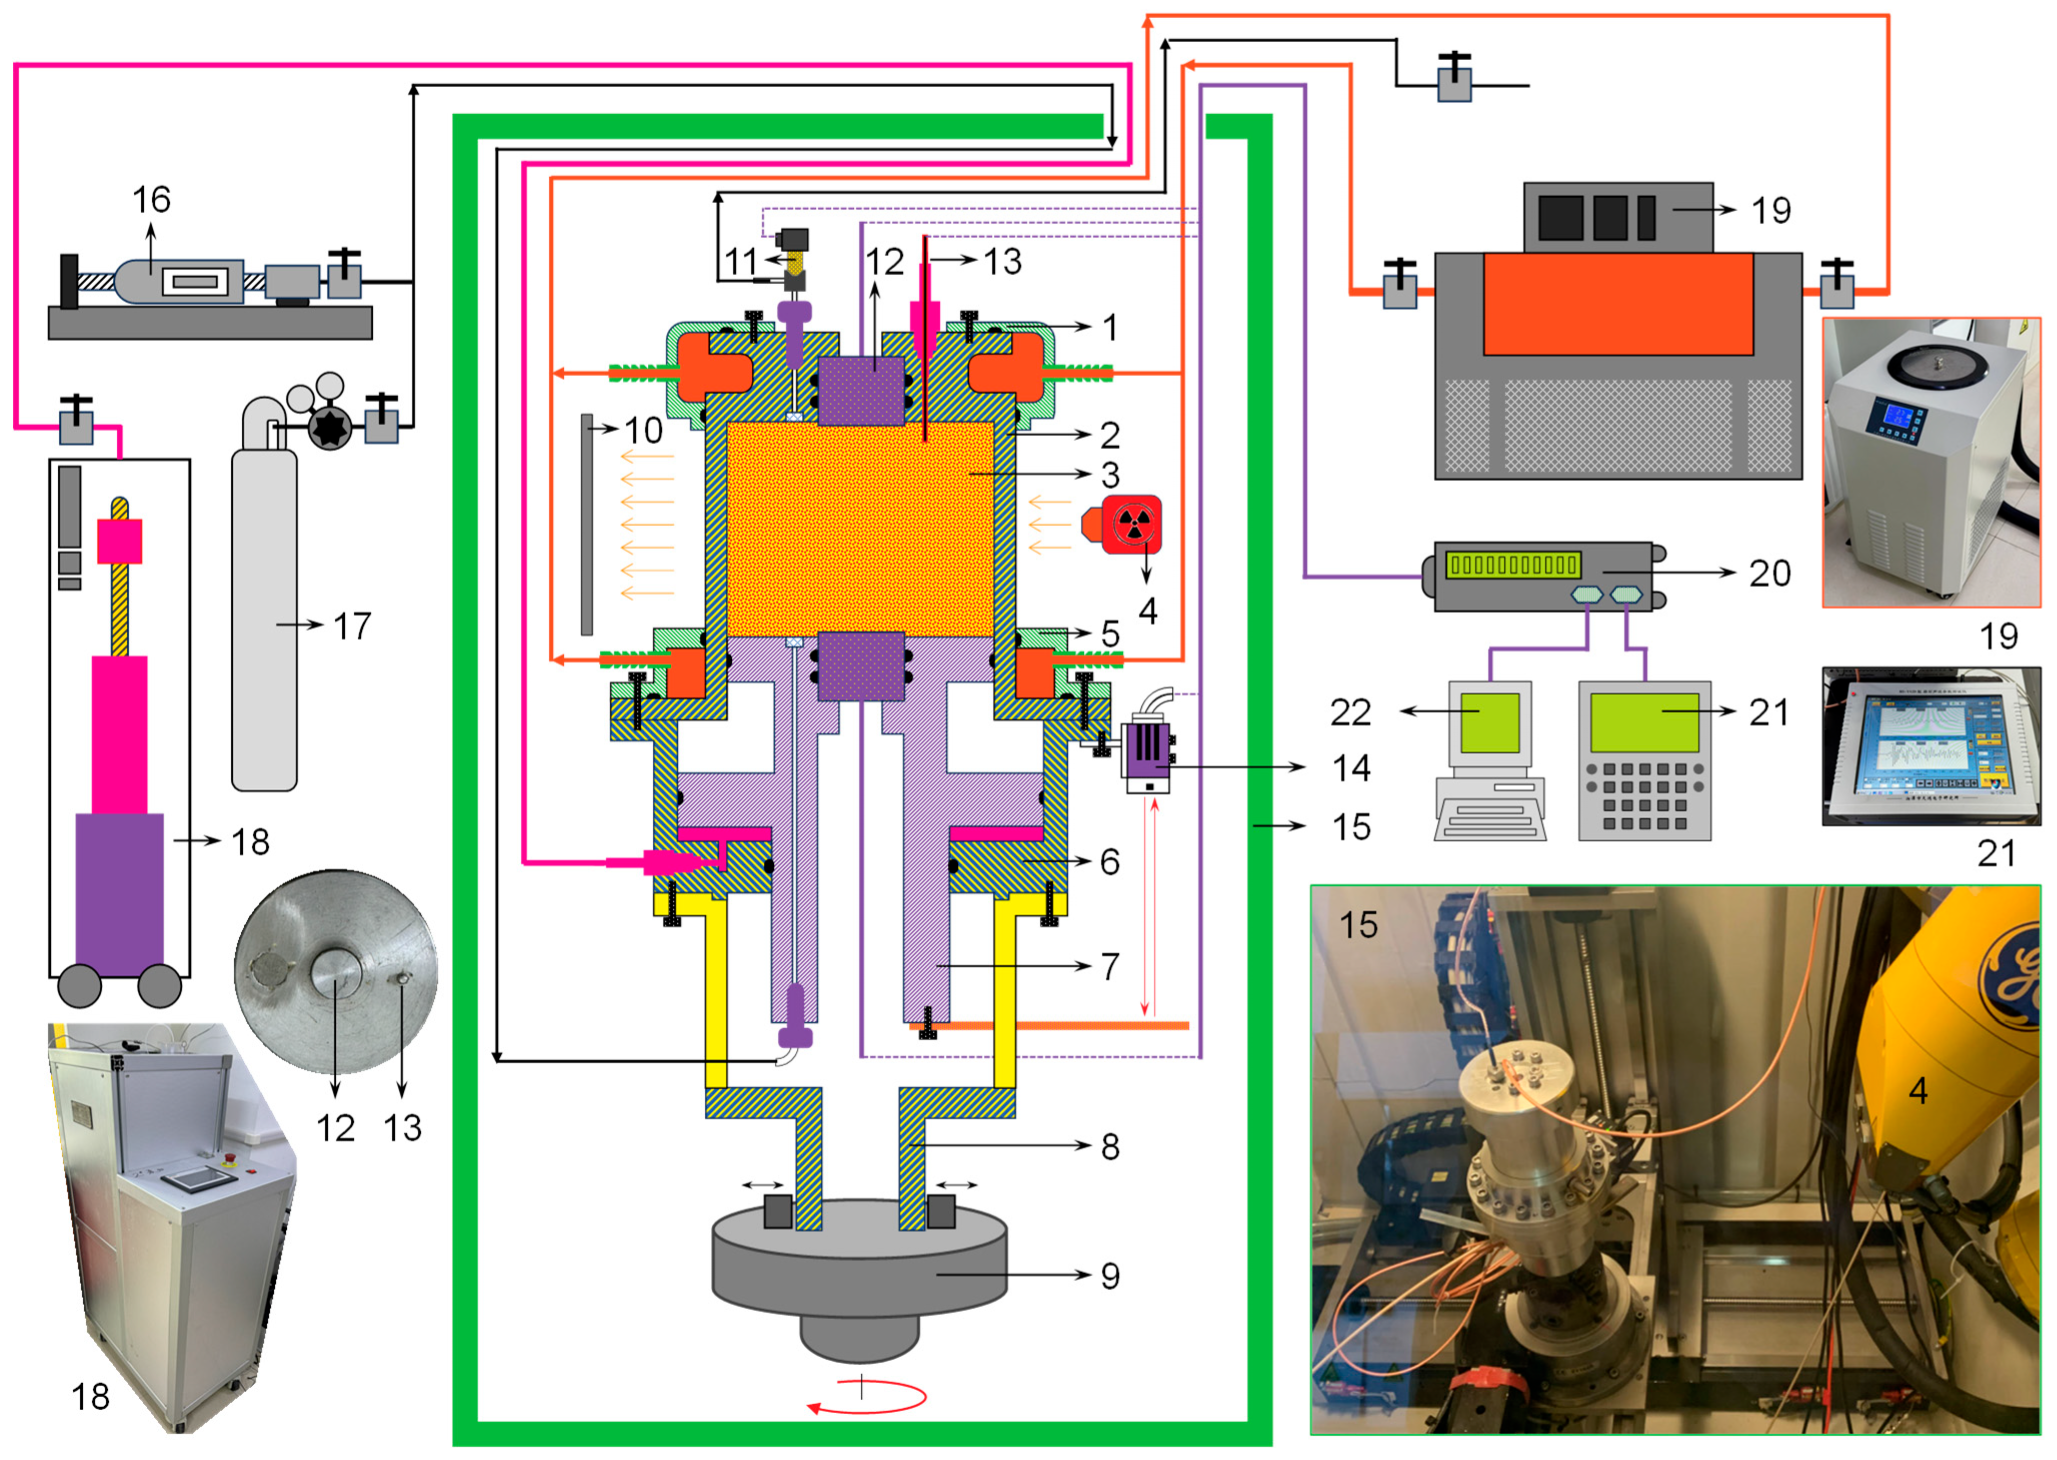
Figure 1 shows a schematic diagram of the multi-orientation system used in this study, including the physical appearance of several key parts. The oedometer cell is composed of a specimen barrel with an inner diameter of 61.8 mm, a piston sleeve with an inner diameter of 78 mm, and an I-shaped piston with a connecting rod diameter of 40 mm. The I-shaped piston with a maximum moving distance of 15 mm (i.e., a maximum compressive strain of 30%) is driven by a syringe pump (Qingdao ZRT Software, and Control Technology Co., Ltd., Qingdao, China) to compress the specimen from an initial height of 50 mm, and the compressive deformation is measured by using an IL-030 laser sensor (Keyence Corporation, Des Peres, MO, USA) with a repeated accuracy of 1 μm, a linearity of ±0.1% F.S, and a maximum range of 25 mm.

Figure 1.
Schematic diagram and physical appearance of the multi-orientation system. 1. Upper cooling jacket; 2. specimen barrel; 3. testing specimen; 4. X-ray generator; 5. bottom cooling jacket; 6. piston sleeve; 7. I-shaped piston; 8. supporting frame; 9. rotation stage; 10. X-ray detector; 11. pressure transducer; 12. acoustic transducer; 13. Pt100 thermometer; 14. laser sensor; 15. scanning room; 16. syringe pump for pore liquid injection; 17. gas cylinder; 18. syringe pump for axial loading; 19. thermostatic bath; 20. data logger; 21. acoustic tester; 22. industrial computer.
During the compression, the microscopic structures are periodically observed by using a Phoenix v|tome|x s X-ray CT scanner (GE Sensing & Inspection Technologies, Niskayuna, NY, USA), and the X-ray generator has two switchable tubes (i.e., 240 kV/320 W micro-focus high energy and 180 kV/15 W nano-focus high resolution tubes). New generated X-ray beams go through the specimen, and attenuated X-ray beams with inner structure information are received by the X-ray detector. All the received scanning data, when subjected to a specimen rotation upon its axis, are reconstructed by implementing a Graphics Processing Unit, and the reconstructed three-dimensional grayscale core is further processed by using various software as needed, including VG Studio Max 3.0 (Volume Graphics), Avizo 9.0 (Visualization Science Group), and ImageJ 1.46r [36]. This X-ray CT scanner has been used in previous studies to visualize the morphology of methane hydrate in fine-grained and coarse-grained sediments [37,38], to characterize the structure of fluid-occupied pores in hydrate-bearing porous media for theoretical and numerical modeling of hydraulic and electrical processes [39,40,41,42]. To ensure a better scanning effect, only upper and lower regions of the specimen barrel are surrounded by cooling jackets for temperature controlling, and refrigerant circulation through the cooling jackets is powered by using a BILON-W-501S thermostatic bath (Shanghai Bilon Instrument Co., Ltd., Shanghai, China). Temperature of the specimen is measured by using a Pt100 thermometer (Qingdao ZRT Software and Control Technology Co., Ltd., Qingdao, China) with a precision of ±0.15 °C, and pore pressure of the specimen is measured by using a PX429 pressure transducer (OMEGA Engineering, Inc., Panama, FL, USA) with an accuracy of ±0.08% and a maximum range of ~10.34 MPa (i.e., 1500 psi).
Compression wave velocity of the specimen is monitored by using a pair of acoustic transducers connected to an HS-CS4EL acoustic tester (Xiangtan Tianhong Electronics Research Institute, Xiangtan, China), and the penetration depth of each acoustic transducer is 1 mm. This seismic wave monitoring system has been used in previous studies to measure the wave velocity of hydrate-bearing sands [43,44].
Clayey silt recovered from Shenhu area of the northern SCS is applied in this study, and the sample depth is about 2 m below the seafloor (mbsf). The grain size distribution with a median size of 13.9 μm (Figure 2) is quite comparable with that of a sample recovered from Pearl River Mount basin of the northern SCS, and the sample depth 71.13 mbsf is much deeper [11]. Shenhu area is located on the northern slope of Baiyun Sag which is distributed in the central south of Pearl River Mount basin, and marine sediments with different depths in the gas hydrate stability zone are generally similar in geological characteristics [10,33]. In addition, specific gravity of the natural clayey silt applied in this study is 2.55, and the plastic index is 29. Note that the natural clayey silt has been used in previous studies to explore undrained shear properties of hydrate-free and hydrate-bearing sediments [45,46]. Methane gas with a purity of 99.99% (Qingdao Ludong Gas Expert Co., Ltd., Qingdao, China) and distilled water are used to form noduled methane hydrate in light of a published method [47], and the nodules are stored in a liquid nitrogen container for future use.
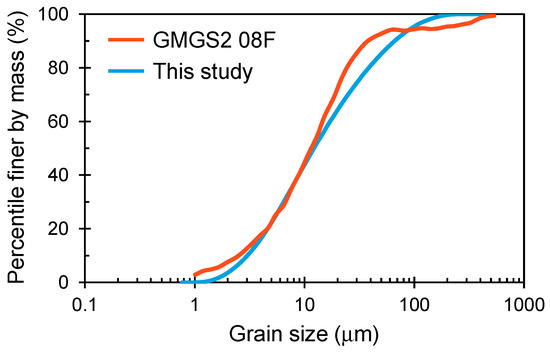
Figure 2.
Grain size distributions of natural clayey silts sampled in the northern South China Sea. The median grain size is 13.9 μm in this study and 11.6 μm for the GMGS2 08F sample. The sample depth in this study is about 2 m below the seafloor (mbsf) and 71.13 mbsf for the GMGS2 08F sample.
2.2. Experimental Procedures
Figure 3 shows the procedure used to prepare a specimen for oedometer test and X-ray CT scans. The specimen barrel is turned upside down and precooled by using a liquid nitrogen gun (Figure 3a). Then, a certain weight of air-dry clayey silt with a water content of 5.1% is carefully filled in the barrel and compacted to a third of the final height (Figure 3b) to simulate the gas-rich environment near cold seeps. Whereafter, some nodules of methane hydrate are taken out of the liquid nitrogen container, and one of the nodules is selected, weighed, and laid in the sediments (Figure 3c). After that, extra weight of air-dry clayey silt is quickly filled in the barrel to wrap the nodule up, and the final height is acquired by compacting as needed (Figure 3d). Finally, the piston sleeve holding the I-shaped piston at the suitable position (e.g., adapting to the final specimen height) is installed on the barrel with upper and lower drainage lines closed, followed by the supporting frame installation (Figure 3e), and the specimen preparation is finished, with the assembled cell ready for oedometer test and X-ray CT scans. In this study, the total weight of air-dry clayey silt filled in the specimen barrel is 112.7 g, and the total weight of the methane hydrate nodule is 16.4 g. The final height during specimen preparation (i.e., the initial height during oedometer test) is 50 mm, and the initial specimen volume is 149.9 cm3.
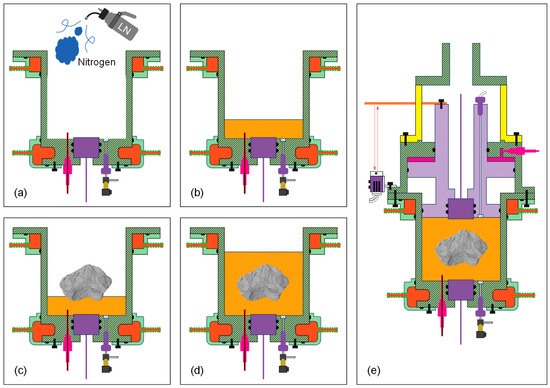
Figure 3.
Procedure of specimen preparation for oedometer test and X-ray CT scans. (a) Precooling the specimen barrel by liquid nitrogen. (b) Filling sediments in the barrel to a proper height. (c) Laying noduled methane hydrate in the sediments. (d) Filling sediments to the final height. (e) Installing the piston sleeve with the I-shaped piston at the initial position. These operations are performed as quickly as possible to reduce the dissociation of methane hydrate.
When the noduled methane hydrate is fully dissociated by raising the specimen temperature to 10 °C and keeping the temperature stability [48], an oedometer test is performed under an undrained condition. The vertical stress applied on the specimen increases from 1.0 MPa to 3.0 MPa over two loading steps (i.e., 2.0 MPa and 2.5 MPa), and then unloaded to 1.0 MPa over only one step (i.e., 2.0 MPa). Note that the vertical stress applied on the specimen is higher than the liquid pressure driven by the syringe pump (i.e., the setting pressure) due to the different pressed areas (i.e., 2998 mm2 and 3520 mm2) in Figure 1, and the conversion ratio is 0.852. The vertical deformation is measured continuously through the test, and the vertical stress will not change until the deformation reaches stability. When the vertical deformation stabilizes at each vertical stress level, an X-ray CT scan is subsequently performed, and an X-ray CT scan is also conducted when the specimen preparation has just been finished to observe the original state. In this study, the 180 kV/15 W nano-focus high-resolution X-ray tube is used, and the duration of each scan is about 22 min. Each of the X-ray CT scans acquires about 800 slices of grayscale top-view images, and the side length of a voxel is 65 μm. When the oedometer test and all the X-ray CT scans have been finished, the trapped methane gas is allowed to escape through the upper drainage line, and the total volume of escaped methane gas is measured by repelling water out of a measuring flask. The total amount of methane gas is determined as 61.8 millimoles after calculation, indicating that about half of the noduled methane hydrate has been dissociated when subjected to the specimen preparation process.
2.3. Image Processing and Phase Segmentation
Raw images of the specimen acquired during the X-ray CT scans are processed mainly by using Avizo 9.0 in this study. The Gaussian Filter module is firstly applied to smooth images and remove noises, allowing methane gas together with air-dry and moist clayey silt being clearly distinguished (Figure 4a). However, pore gas and water distributed in the clayey silt matrix cannot be well observed as the image resolution is not sufficient to show the details. These grayscale images are further processed to quantify structures of the soil matrix and the geometry of cavities. The Image Gradient module is firstly applied to better locate the phase boundary (Figure 4b), and then the Watershed Segmentation Wizard module is applied to segment the soil matrix and the cavities with the help of the distinguished boundary. A segmentation result is shown in Figure 4c, and red color stands for the soil matrix while blue color stands for the cavities.
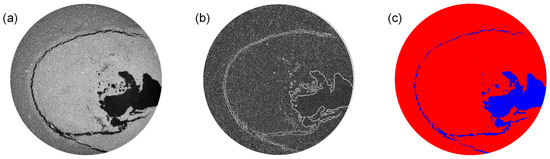
Figure 4.
Image processing and phase segmentation taken at a lower cross section when subjected to a vertical loading stress of 1.0 MPa as an example. (a) A grayscale image after noise reduction shows air-dry clayey silt as dark gray color, moist clayey silt as light gray color, and methane gas as black color. (b) A luminance image shows the boundary between methane gas and clayey silt. (c) A dichromatic image shows the segmentation result with red color standing for clayey silt and blue color standing for methane gas. Note that the blue color does not include the pore gas distributed in the clayey silt matrix as the image resolution is not sufficient to show the details.
3. Results
3.1. Undrained Compressibility and Expansivity
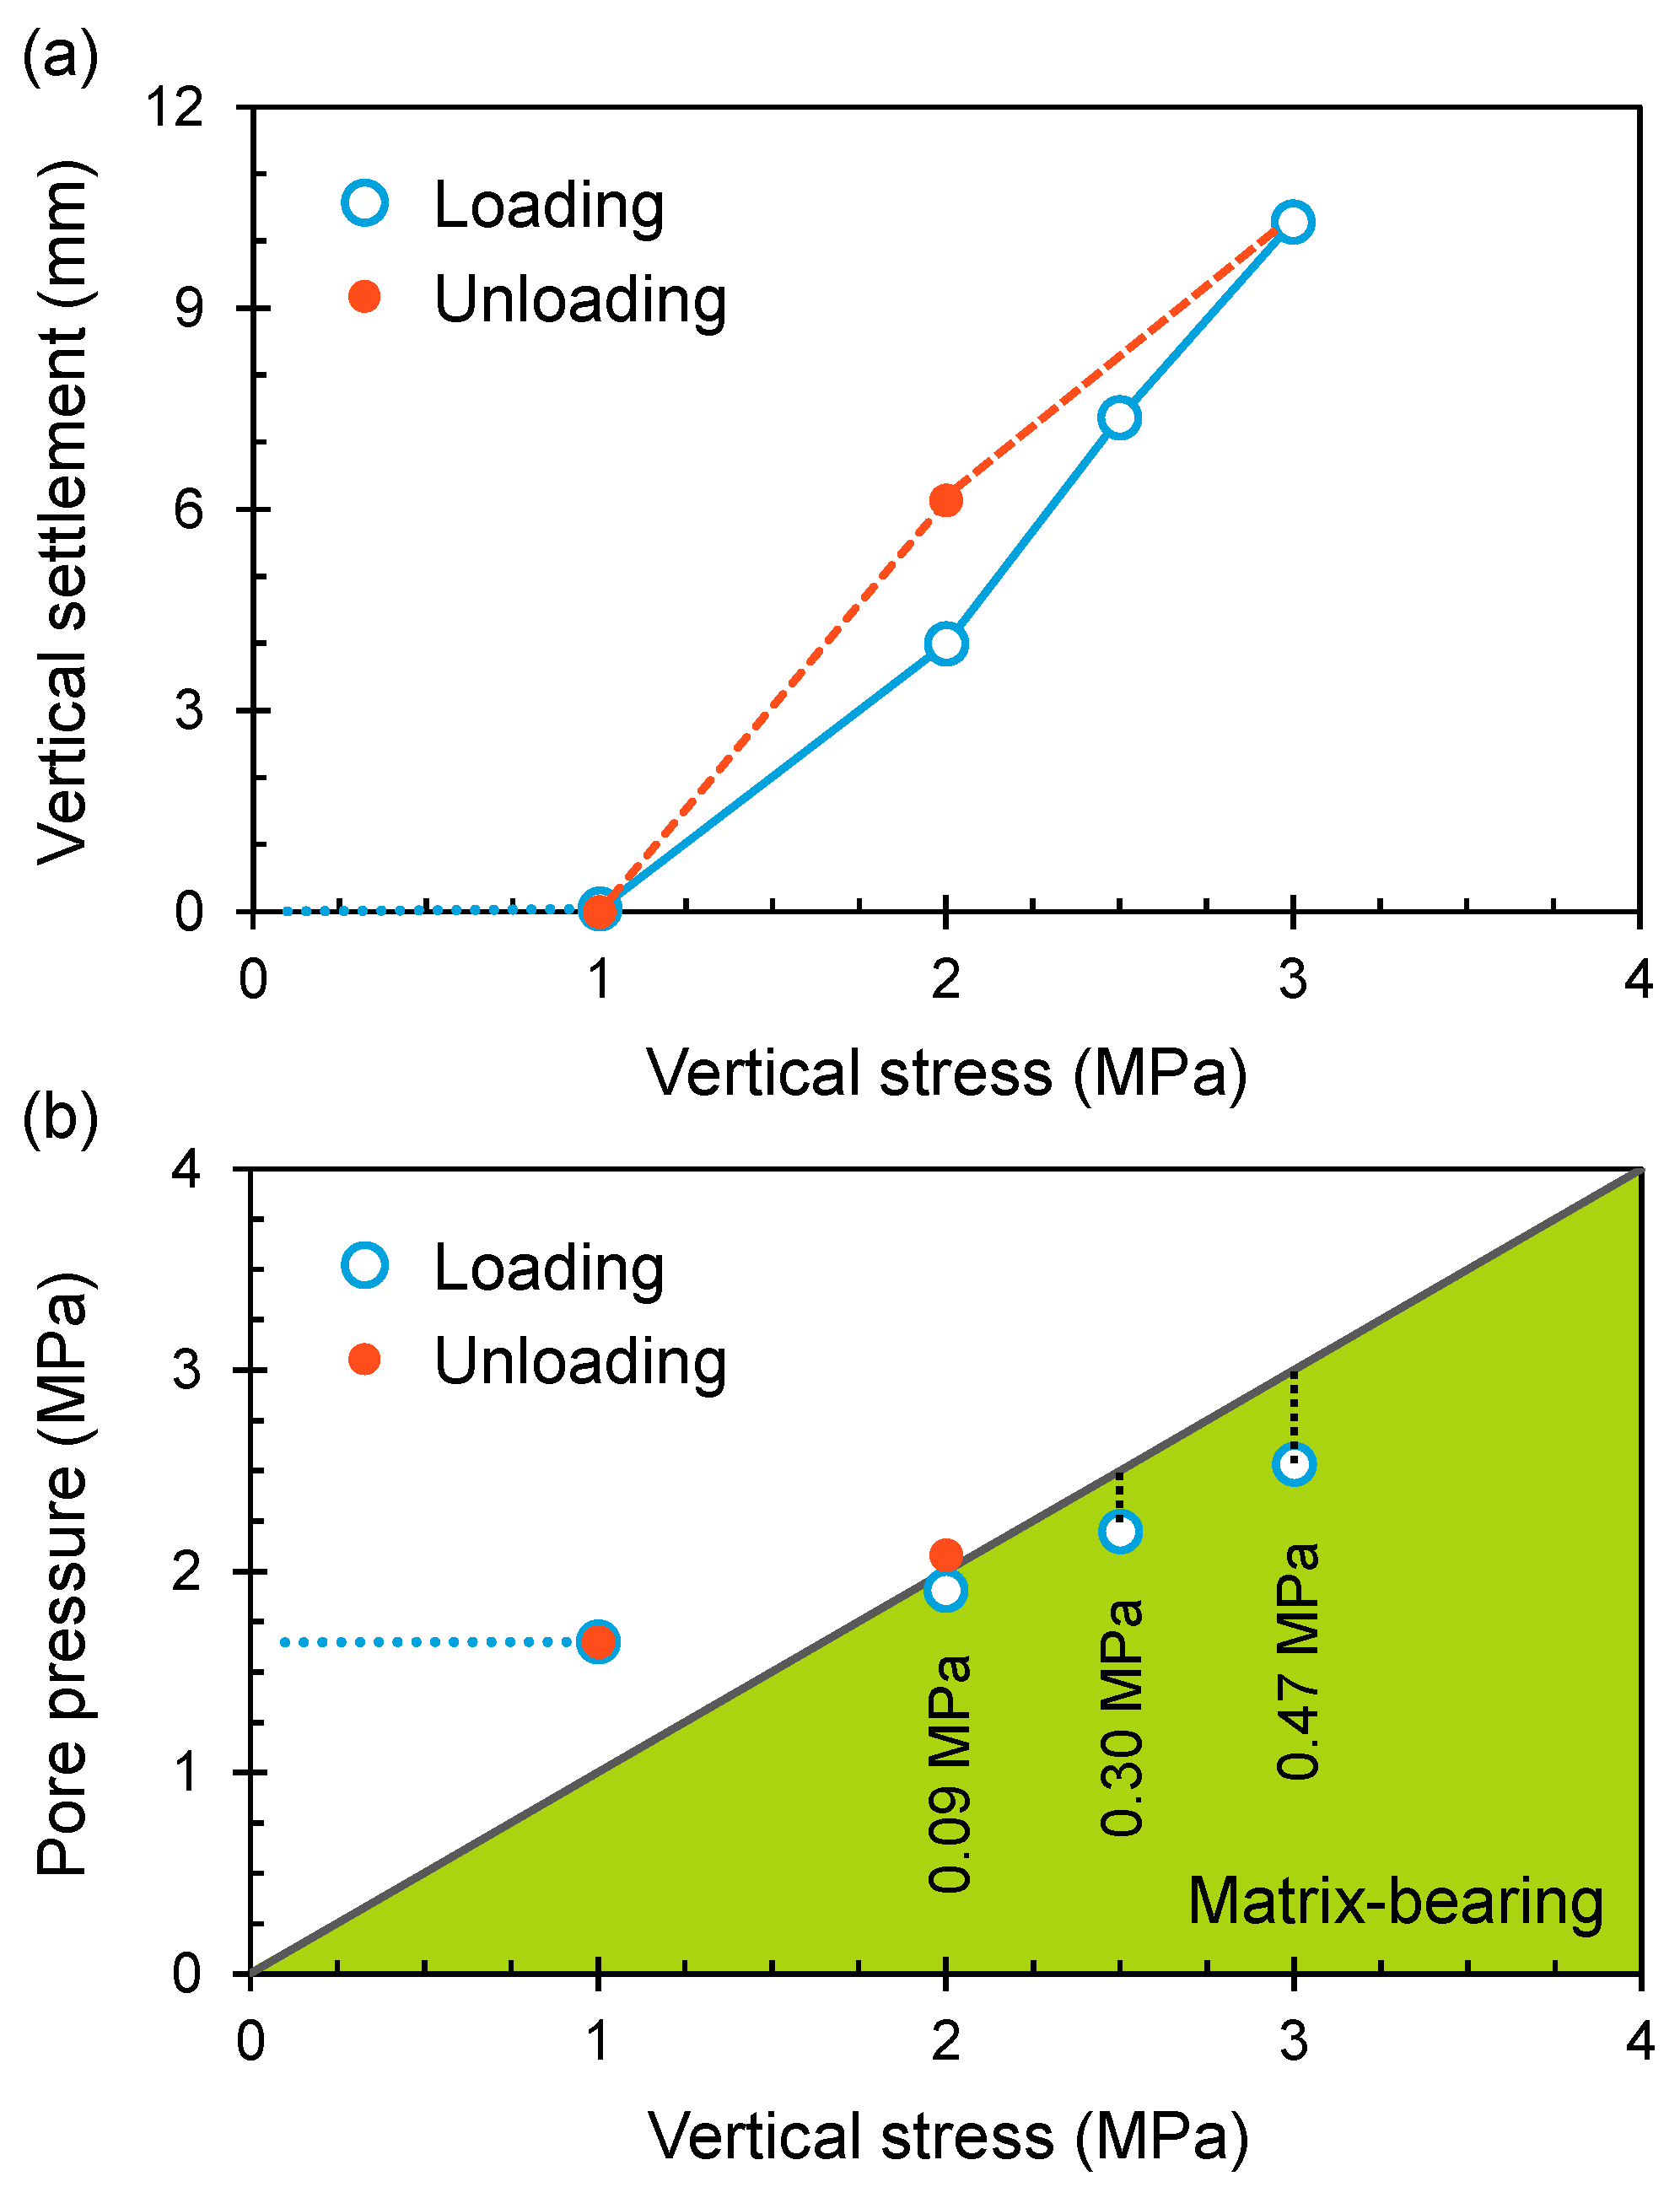
Figure 5 shows the vertical settlement and the pore pressure after deformation stabilization for all loading and unloading steps. The vertical settlement is 0.05 mm when a vertical stress of 1.0 MPa is applied, and the vertical settlement increases to 10.28 mm when the vertical stress increases to 3.0 MPa. After being unloaded back to 1.0 MPa, the vertical settlement completely rebounds to the initial value (i.e., 0.05 mm), but the unloading path does not coincide with the loading path (i.e., a hysteresis). This is largely due to the elastic deformation of free gas under an undrained condition [49]. These characteristics have been further confirmed by the pore pressure evolution (Figure 5b). The initial pore pressure is 1.65 MPa when a vertical stress of 1.0 MPa is applied, and the pore pressure when subjected to a loop of loading and unloading fully recovers to 1.65 MPa. In addition, the pore pressure increases to 2.53 MPa when the vertical stress increases to 3.0 MPa, and the pore pressure becomes increasingly smaller than the corresponding vertical stress when the vertical stress is high enough (i.e., the light green triangle in Figure 5b), indicating that the soil matrix begins to bear part of the vertical stress. The matrix-bearing stress increases from 0.09 MPa to 0.47 MPa when the vertical stress increases from 2.0 MPa to 3.0 MPa, and this is mainly due to the enhanced strength due to the matrix compression [18,27].
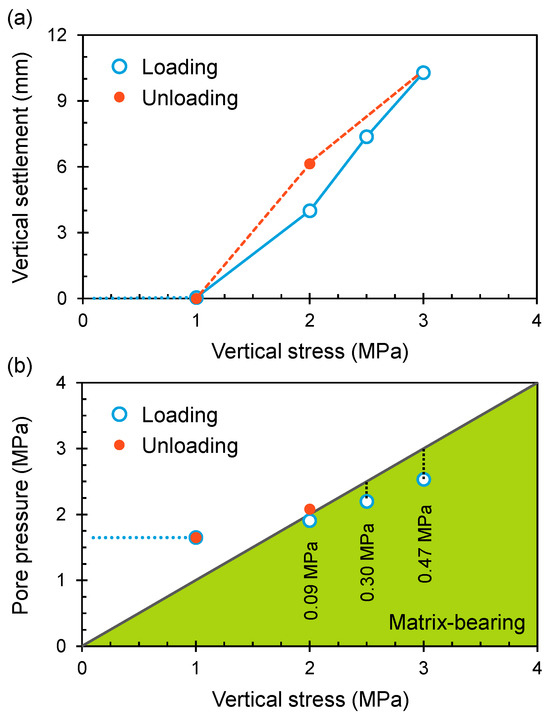
Figure 5.
Vertical settlement (a) and pore pressure (b) after deformation stabilization for all loading and unloading steps. The triangular area colored in light green represents conditions where the vertical stress is higher than the corresponding pore pressure, indicating that the soil matrix bears a part of the external stress (i.e., matrix-bearing).
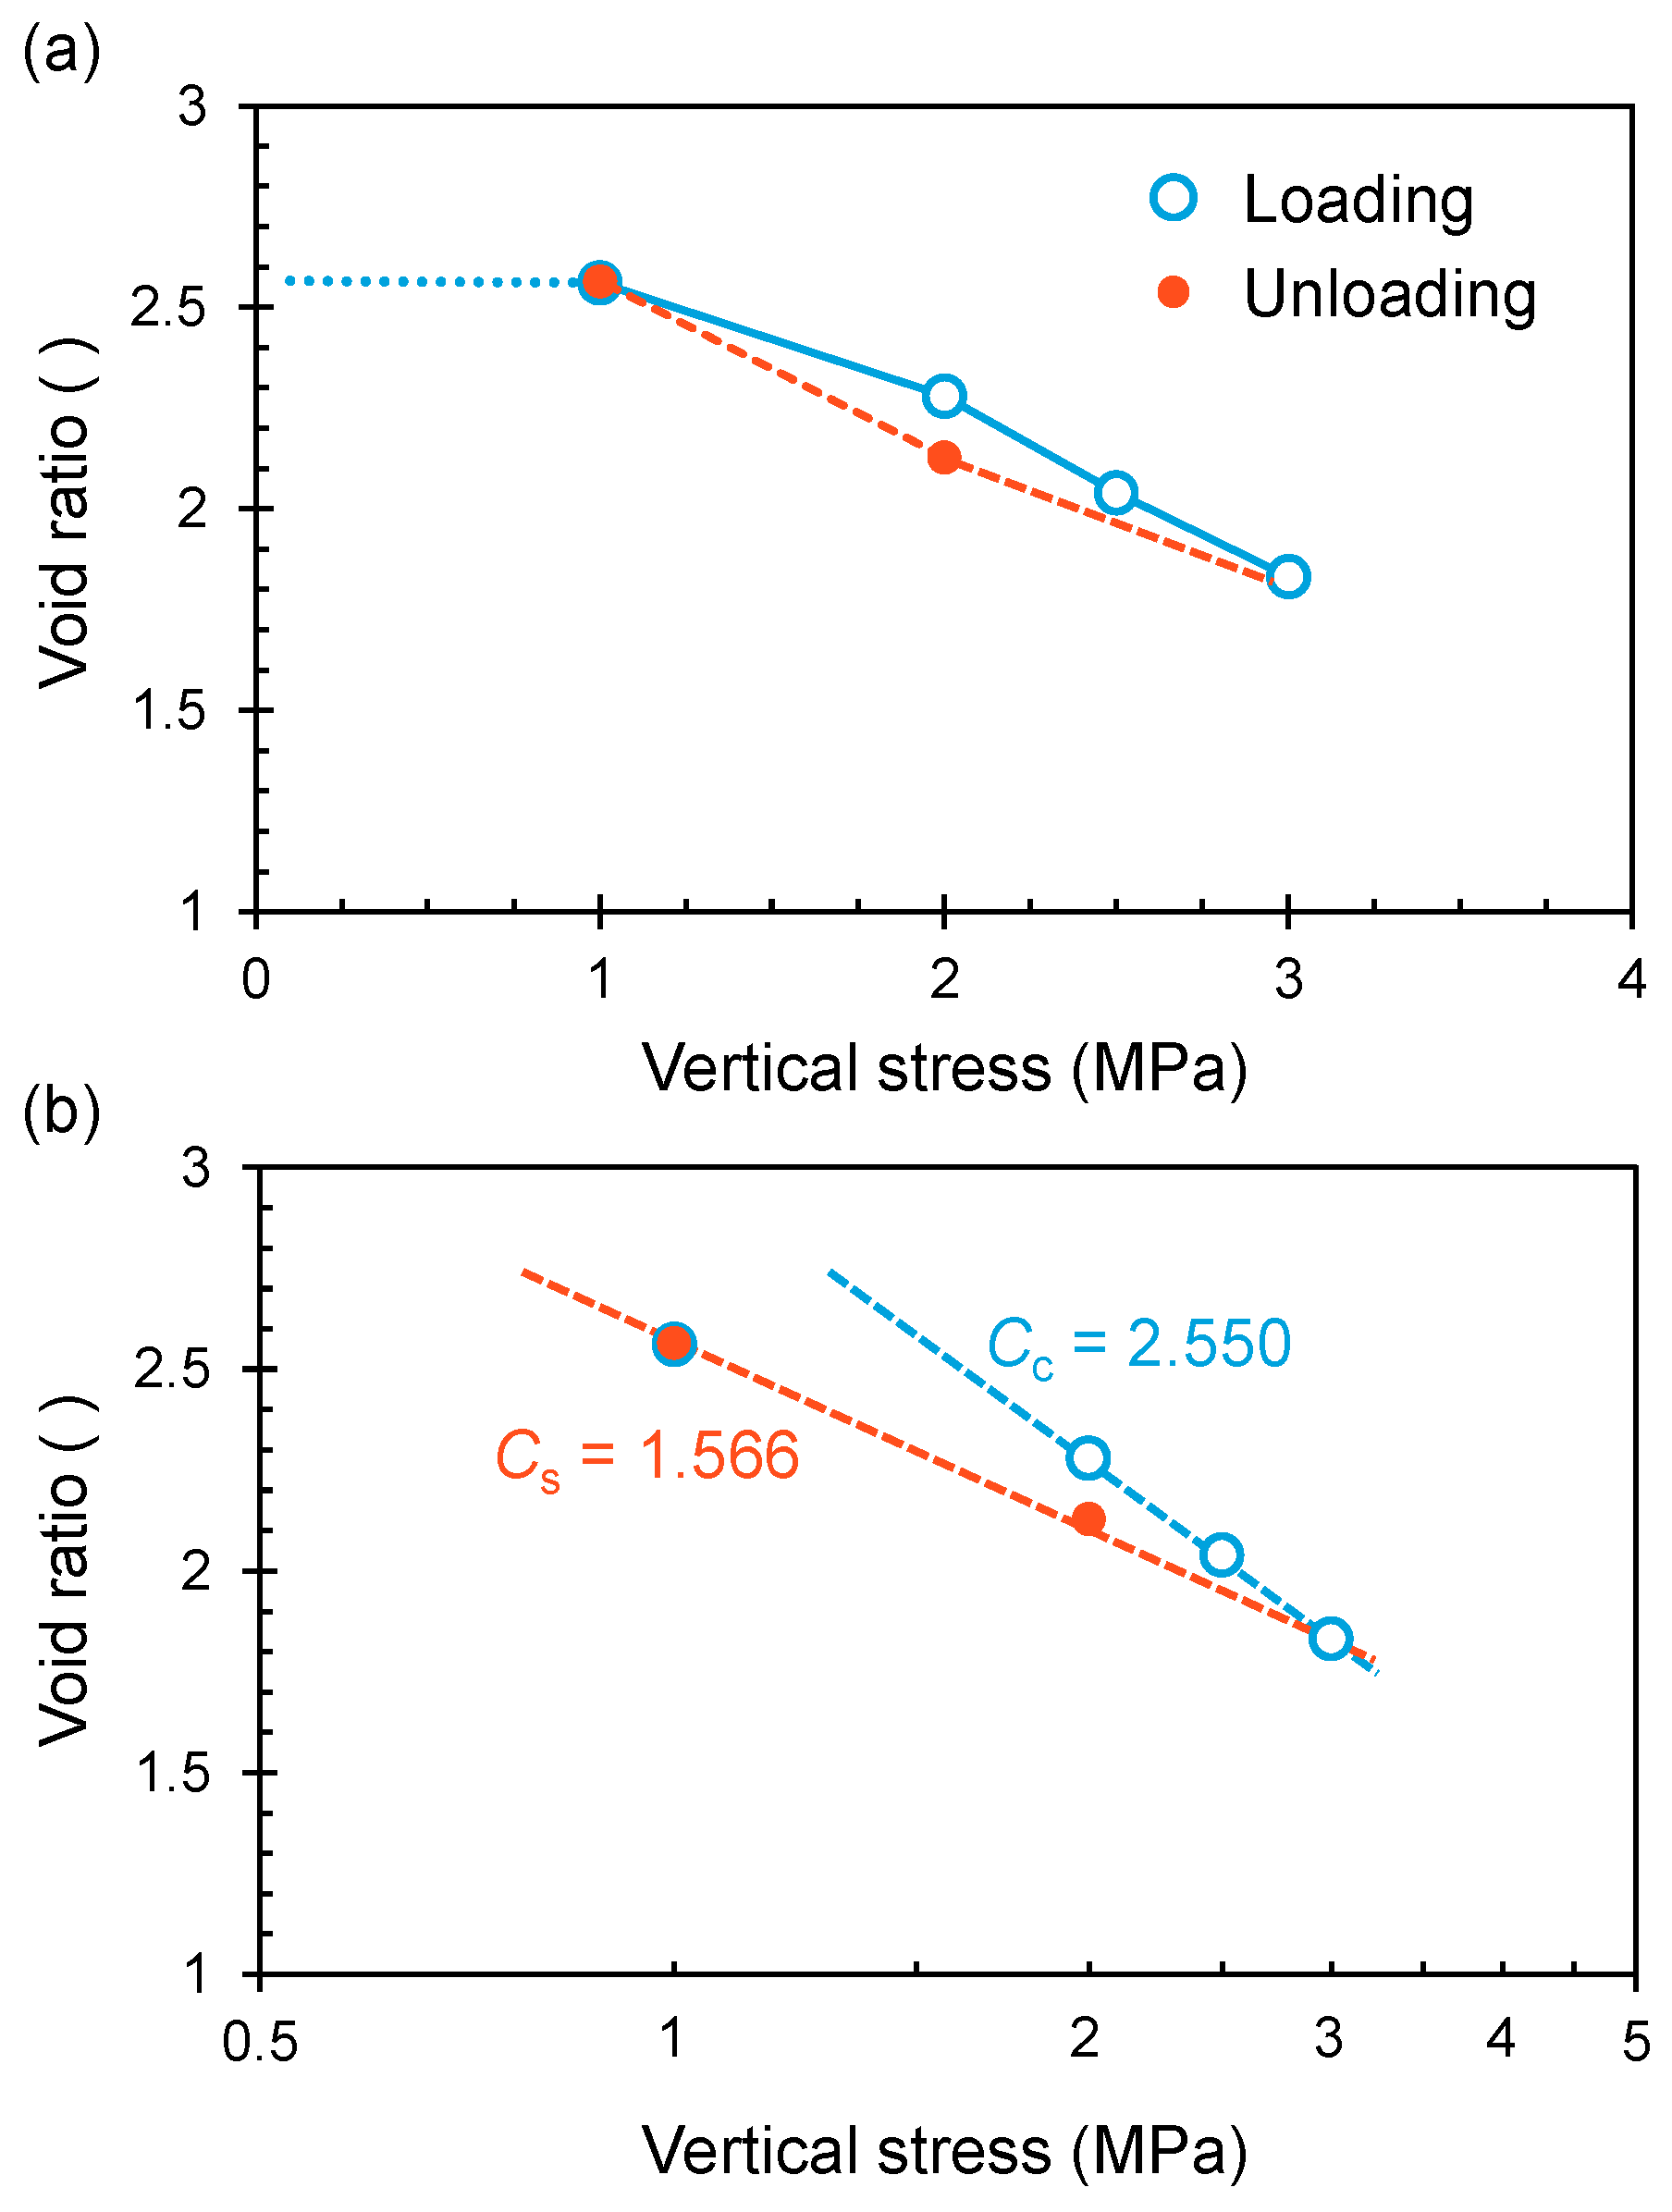
Figure 6 shows the void ratio after deformation stabilization for all loading and unloading steps. The void ratio slightly decreases from 2.565 to 2.561 when a vertical stress of 1.0 MPa is initially applied, and the void ratio further decreases to 1.832 when the vertical stress increases to 3.0 MPa. After being unloaded back to 1.0 MPa, the void ratio recovers and increases to 2.565 which is generally the same with the initial value (i.e., 2.565). There is also an obvious hysteresis when subjected to a loop of loading and unloading. On the semilogarithmic coordinate shown in Figure 6b, the overall compression curve has no obvious curvature at higher stresses which is consistent with the typical trend of marine sediments [50]. The compression index (i.e., the slope of the linear virgin compression curve on a semilogarithmic coordinate) is 2.550, and the swell index (i.e., the slope of the linear rebound curve of void ratio versus logarithm of vertical stress) is 1.566. In addition, the ratio of the swell index over the compression index in this study is 0.614. Note that the compression index in this study is much higher than that of natural marine sediments without cavities when subjected to similar external stresses. Examples include marine sediments recovered from the northern Gulf of Mexico [51], the Krishna-Godavari Basin [50], and the Ulleung Basin [52], with the compression index being 0.292 and 0.735, ranging from 0.10 to 0.15, and distributing between 0.50 and 1.50, respectively.
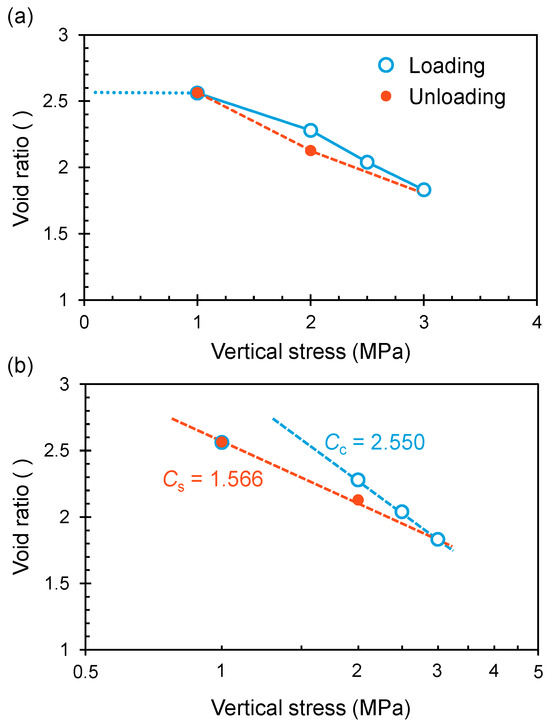
Figure 6.
Void ratio after deformation stabilization for all loading and unloading steps on normal (a) and semilogarithmic (b) coordinates. The compression index Cc is 2.550, and the swell index Cs is 1.566.
3.2. Evolved Inner Structures Due to Loading and Unloading
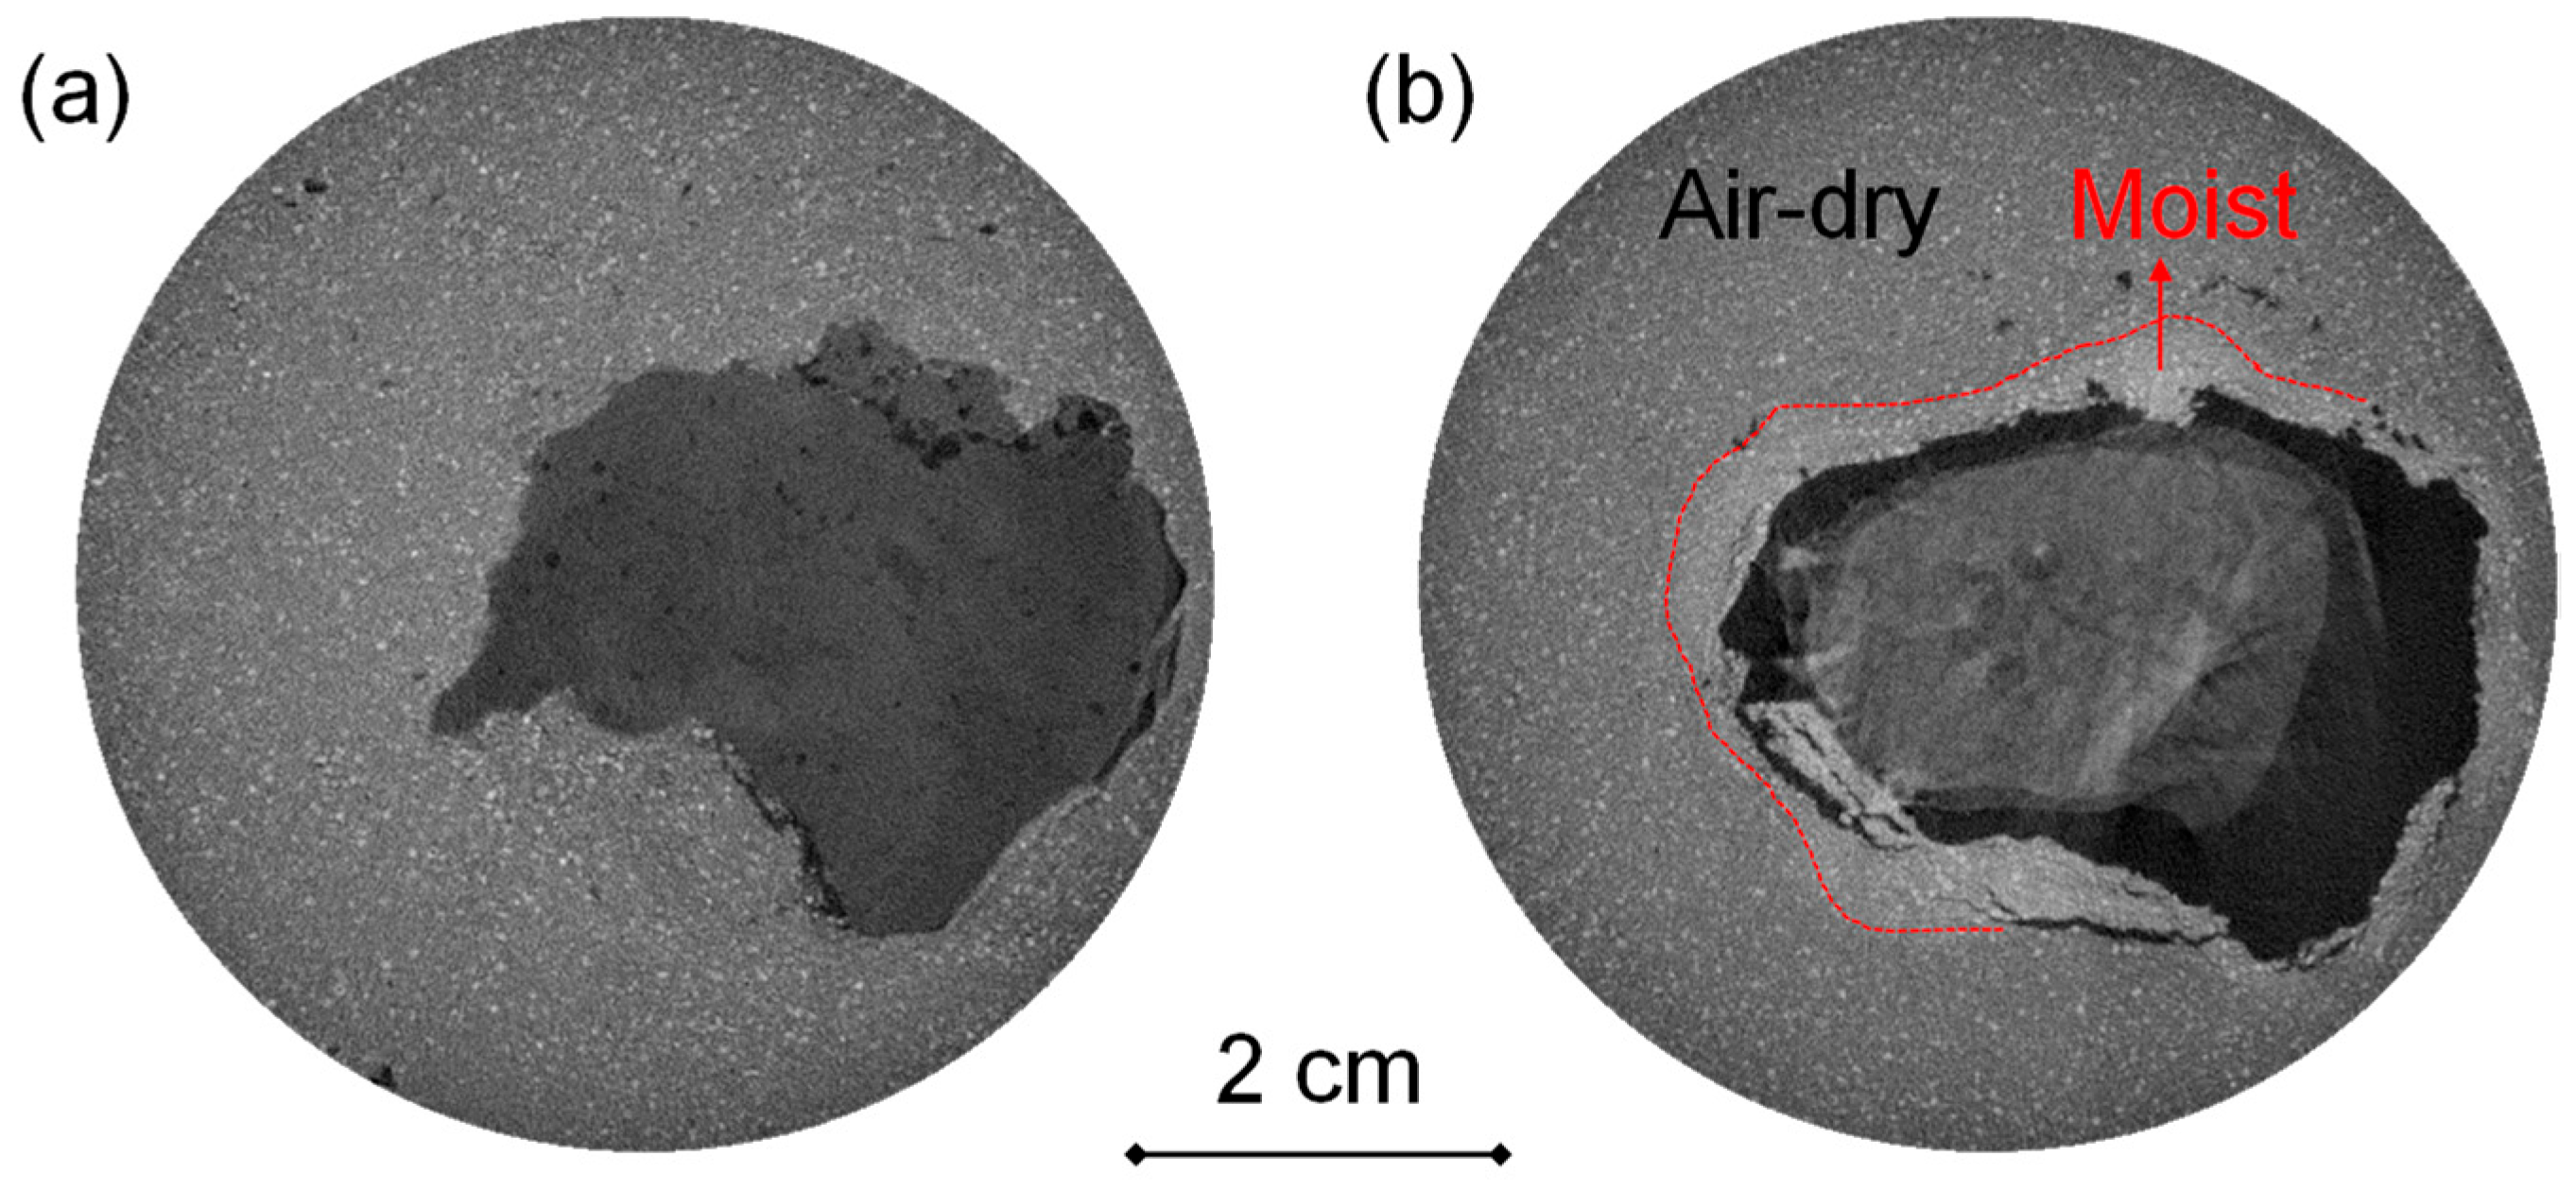
Figure 7a shows a top-view X-ray CT image of the specimen which has just been prepared. Methane hydrate barely dissociates, and the nodule is closely surrounded by the clayey silt matrix without a free gas interval between them. After a while (i.e., ~15 min), methane hydrate partially dissociates by heating, and the nodule becomes much smaller, losing the physical contact with the clayey silt matrix (Figure 7b). However, the clayey silt matrix does not severely collapse, leading to an obvious free gas interval between surfaces of the nodule and the matrix. In addition, the water coming from the dissociated methane hydrate is mainly absorbed by the underlying clayey silt, and several fractures occur in the lower part of the clayey silt matrix, generally dividing the lower matrix into air-dry and moist zones (Figure 7b). Note that there is no methane hydrate in pores of the air-dry matrix according to the procedure of specimen preparation.
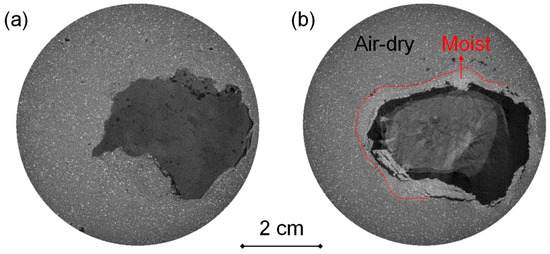
Figure 7.
Grayscale X-ray CT images of the specimen containing a methane hydrate nodule. Black color represents free gas. (a) Methane hydrate nodule in dark grays closely surrounded by air-dry clayey silt in light grays. (b) Decrescent nodule of methane hydrate together with surrounding clayey silt and free gas. Methane hydrate partially dissociates and releases some water which is absorbed by the nearby clayey silt, and the moist clayey silt is in silverish color. The ghost covering the nodule is a result of the structure system being unsteady due to methane hydrate dissociation during X-ray CT scanning. The time duration between these two subfigures is about 15 min.
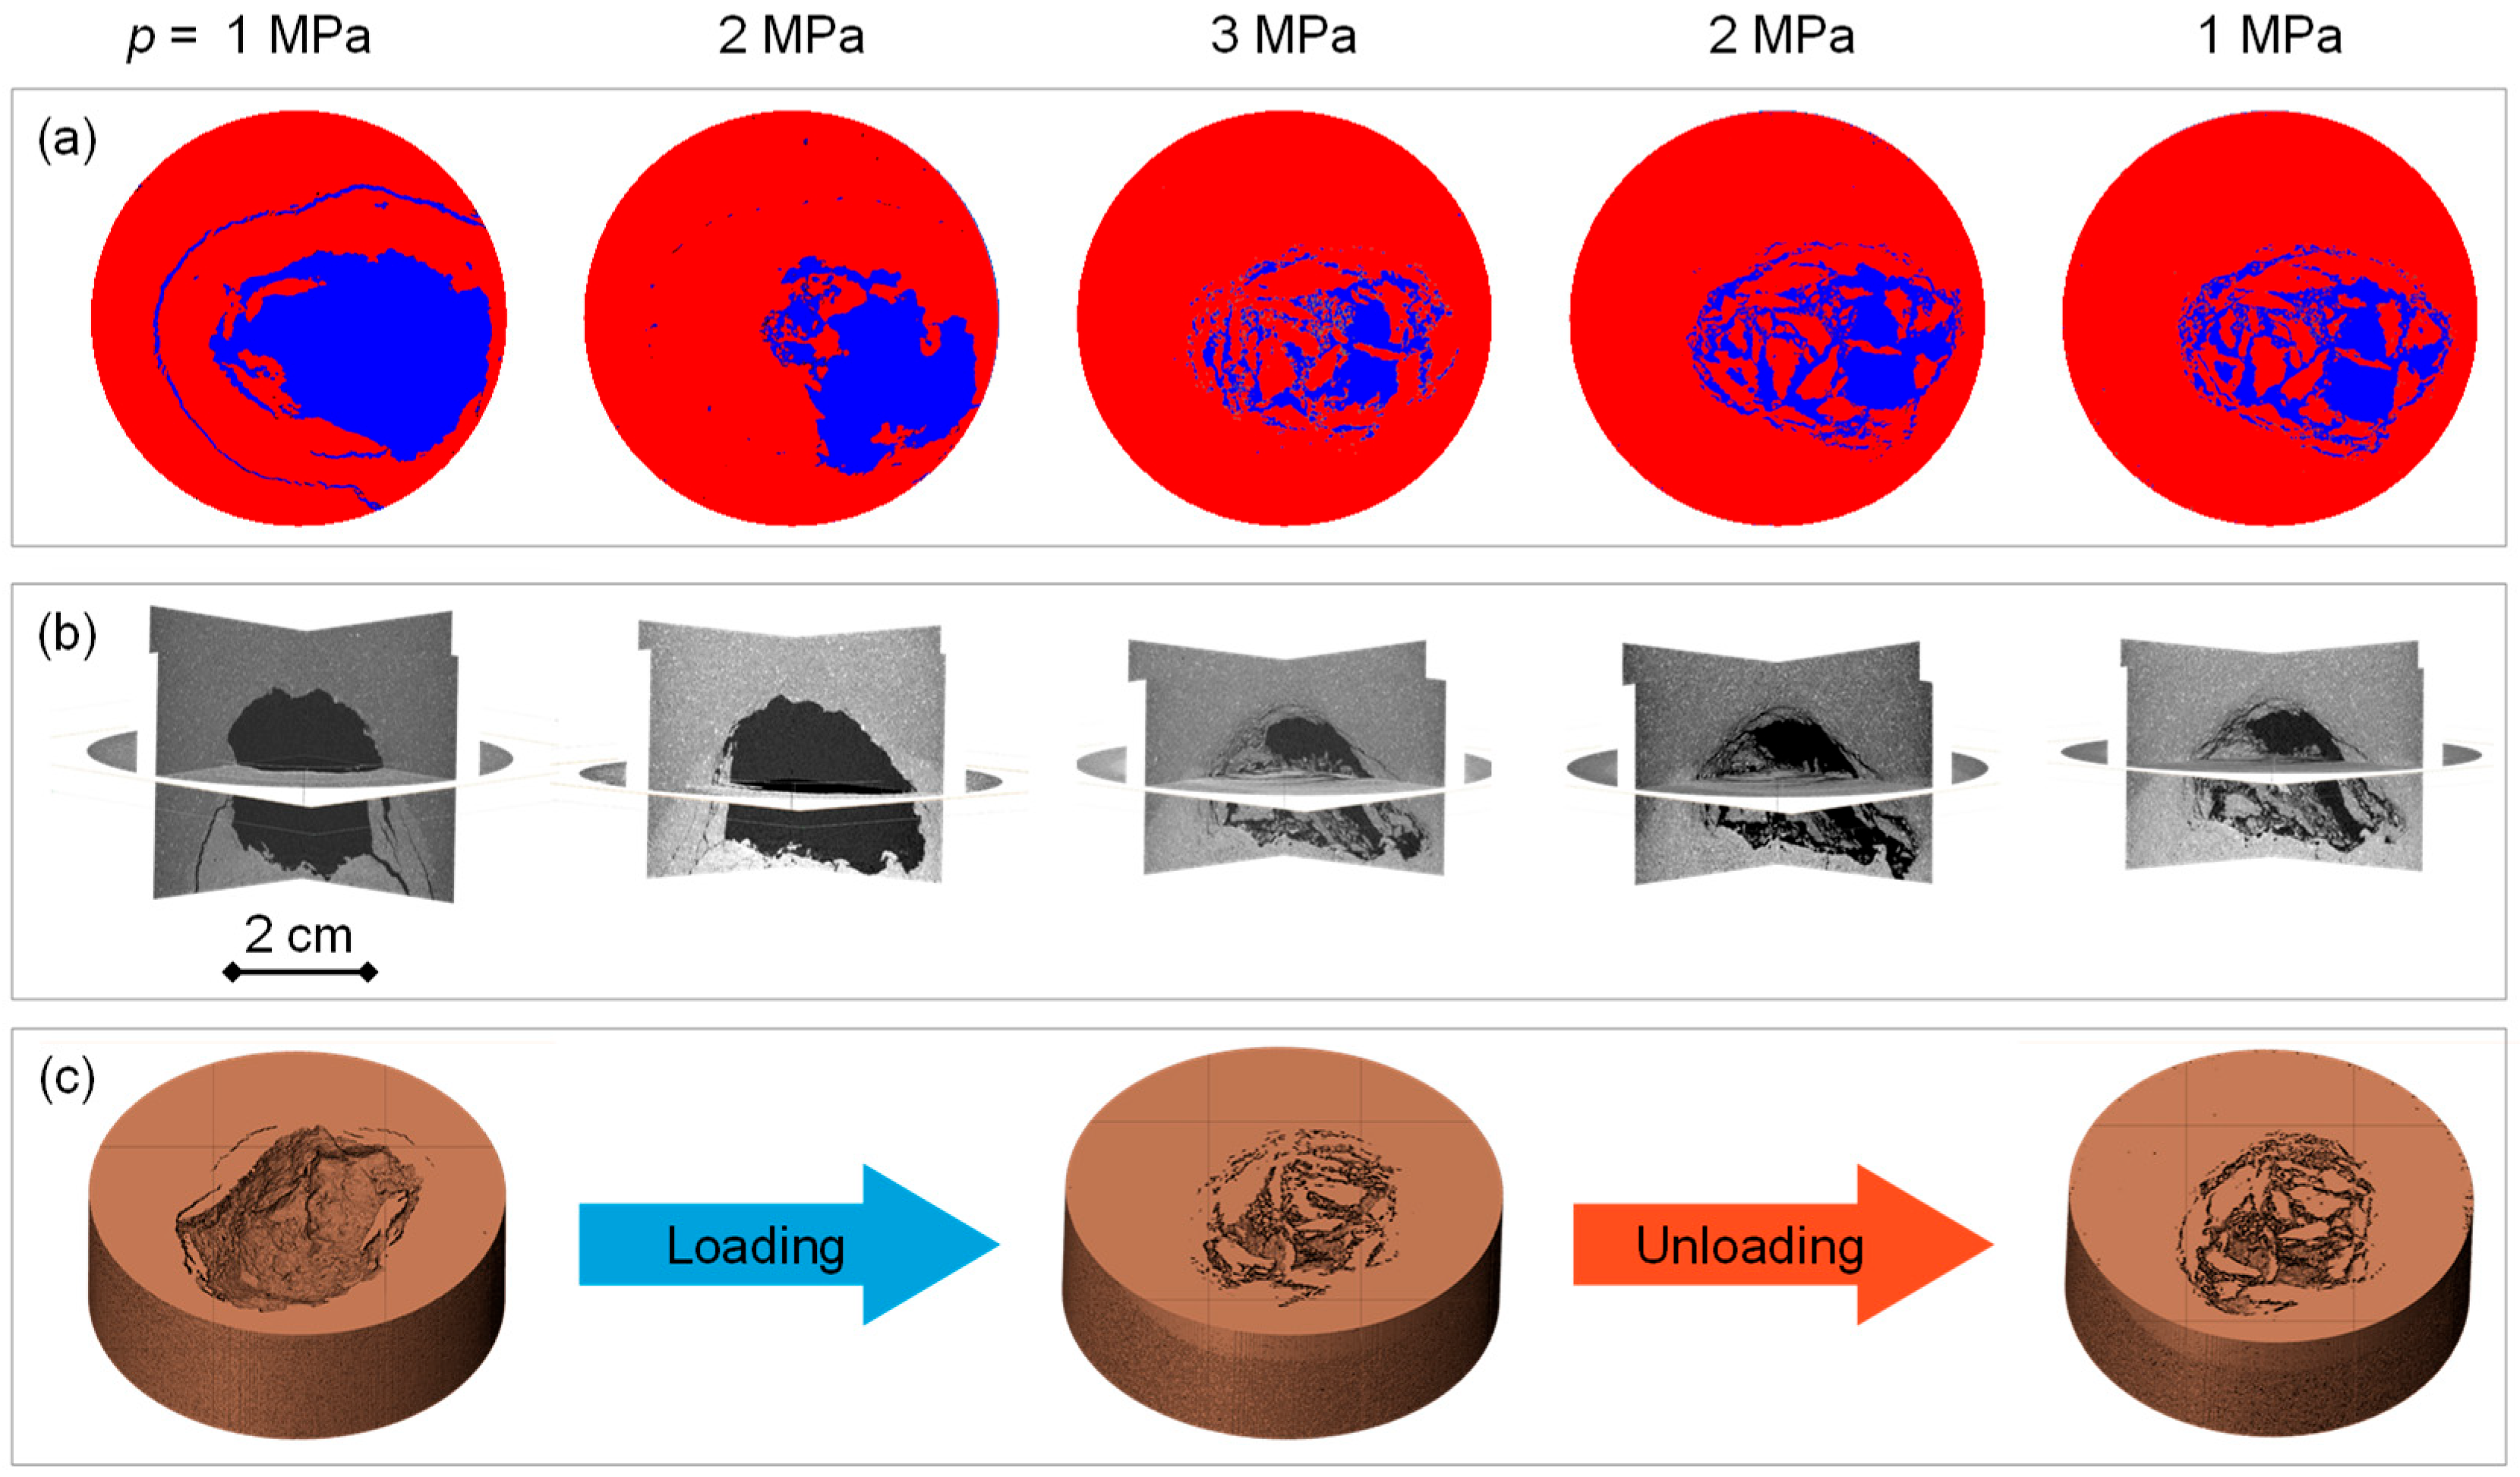
Figure 8a shows two-dimensional X-ray CT images of a cross section located in the lower half of the specimen after deformation stabilization for all loading and unloading steps. The clayey silt matrix is colored in red and gas cavities in blue. It is shown that the fractures still occur in the clayey silt matrix near the cavity when subjected to a vertical stress of 1.0 MPa. When the vertical stress increases to higher levels (e.g., 2.0 MPa and 3.0 MPa), the fractures gradually vanish and do not reappear even being unloaded to 1.0 MPa. In addition, the clayey silt matrix does not severely collapse when subjected to lower vertical stresses (e.g., 1.0 MPa and 2.0 MPa). When the vertical stress increases to 3.0 MPa, the clayey silt matrix collapses heavily, and the gas cavity becomes fragmented. After being unloaded to 1.0 MPa, the morphology of the fragmented cavity is generally unchanged. These characteristics have been further confirmed in three-dimensional perspective views of the specimen (Figure 8b), and gas cavities in a vertical section are clearly shown. Fractures in the lower half of the specimen gradually close when the vertical stress increases from 1.0 MPa to 3.0 MPa, and new fractures occur in the upper half of the specimen when being unloaded to 1.0 MPa, especially in the clayey silt matrix on the top of the gas cavity. The new occurred fractures are induced by the collapse of the gas cavity. When subjected to a loop of loading and unloading, the surface of the gas cavity changes from relatively smooth to severely fragmented (Figure 8c), indicating that unrecoverable alterations of the inner structures remain even if the void ratio can completely recover (Figure 6).
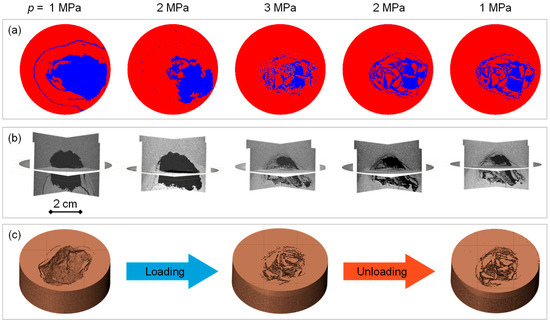
Figure 8.
Two-dimensional and three-dimensional X-ray CT images of the specimen after deformation stabilization for all loading and unloading steps. (a) Two-dimensional images of a cross section in the lower half of the specimen. Gas cavities are colored in blue, and the clayey silt matrix is colored in red. (b) Three-dimensional perspective views of the whole specimen. Gas cavities are in black, and the clayey silt matrix is in grays. (c) Three-dimensional opaque views of the lower half of the specimen. The clayey silt matrix is colored in brown. The symbol p represents the vertical stress.
4. Analyses and Discussion
4.1. Changing Void Ratio Related to Pore Gas Pressure and Vertical Loading Stress
During undrained loading and unloading, any change of the vertical stress results in an alteration of pore gas pressure and associated volume change. The volume change is a result of the compressibility of pore fluids (mainly gas) as the compressibility of sediment particles is negligible. The compressibility of pore gas includes the compressibility of free gas and the dissolution of gas into pore water. In this study, pore water within the specimen mainly originates from the noduled methane hydrate, and the total weight of water is 20.9 g which is very little. Thus, the dissolution of low-dissolving methane gas into such a little amount of water can be neglected without any detrimental impact. The void ratio e of the specimen can be easily calculated accordingly:
where ng is the total amount of methane gas, and ng = 0.0618 mol in this study; T is the specimen temperature, and T = 283 K in this study; Vs is the total volume of sediment particles, and Vs = 42.1 cm3 in this study; Vw is the total volume of pore water, and Vw = 20.9 cm3 in this study; R is the gas constant. Equation (1) can be rearranged in a dimensionless form as
where , , and , show a linear relationship between the inverse of the normalized pore gas pressure Πg and void ratio e.
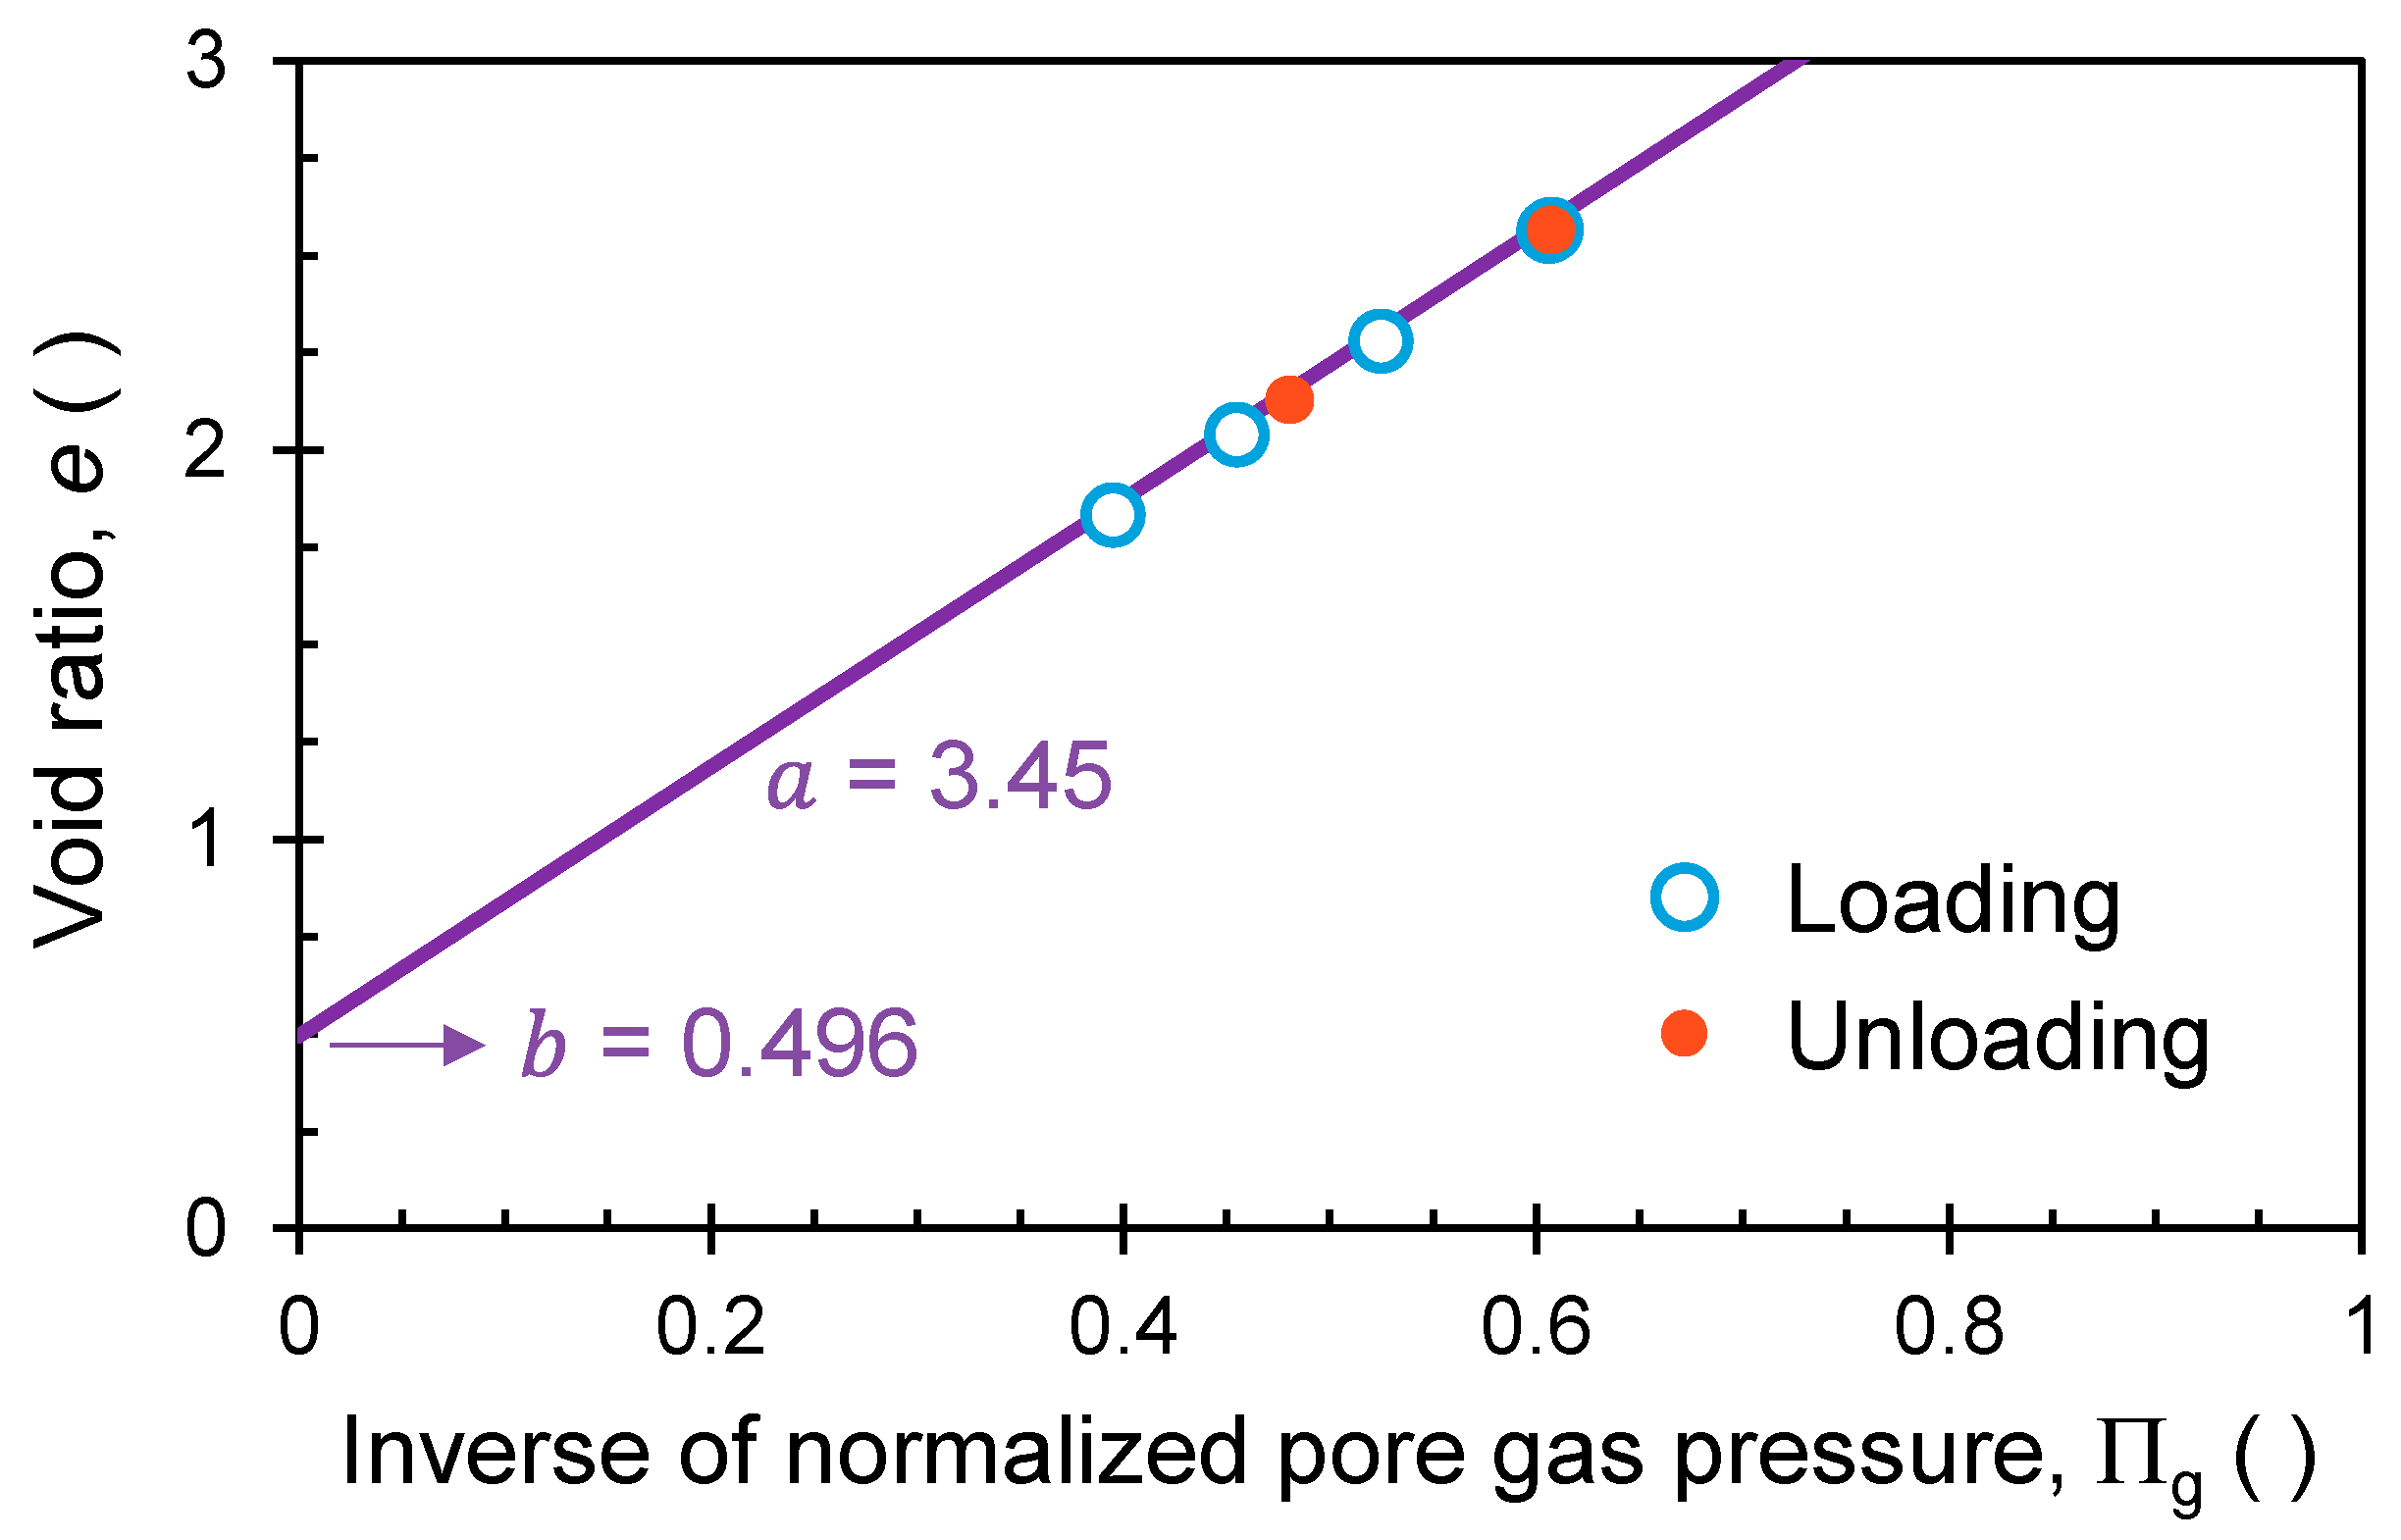
Figure 9 shows the void ratio evolved with pore gas pressure during loading and unloading after deformation stabilization. It is obvious that experimental data are well consistent with the line with a slope of 3.45 and an intercept of 0.496, indicating that deformation of the specimen in this study is mainly due to the free gas compression and expansion when subjected to loading and unloading, respectively. In addition, when the pore gas pressure increases extremely high, the reciprocal of normalized pore gas pressure Πg approaches zero, and the limit of void ratio is the intercept b which represents the void ratio corresponding to the specimen being water saturated.
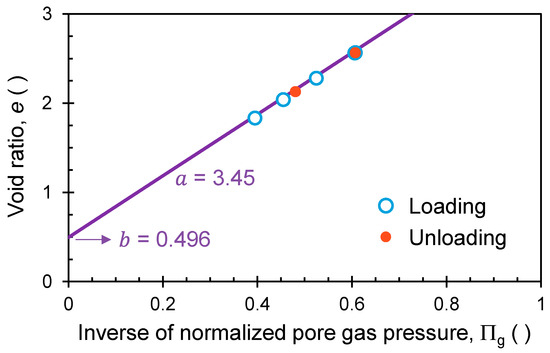
Figure 9.
Void ratio evolved with pore gas pressure during loading and unloading. The line represents Equation (2) with a slope of a = 3.45 and an intercept of b = 0.496.
According to Equation (2), the following equation can be obtained if the inverse of normalized vertical stress is similarly defined as .
where represents the matrix-bearing stress when subjected to a vertical stress. The following equation can be derived by finding a derivative of Equation (3):
Coefficient of compressibility av can be acquired from the following equation:
where the negative sign represents that the void ratio decreases with increasing vertical stress.
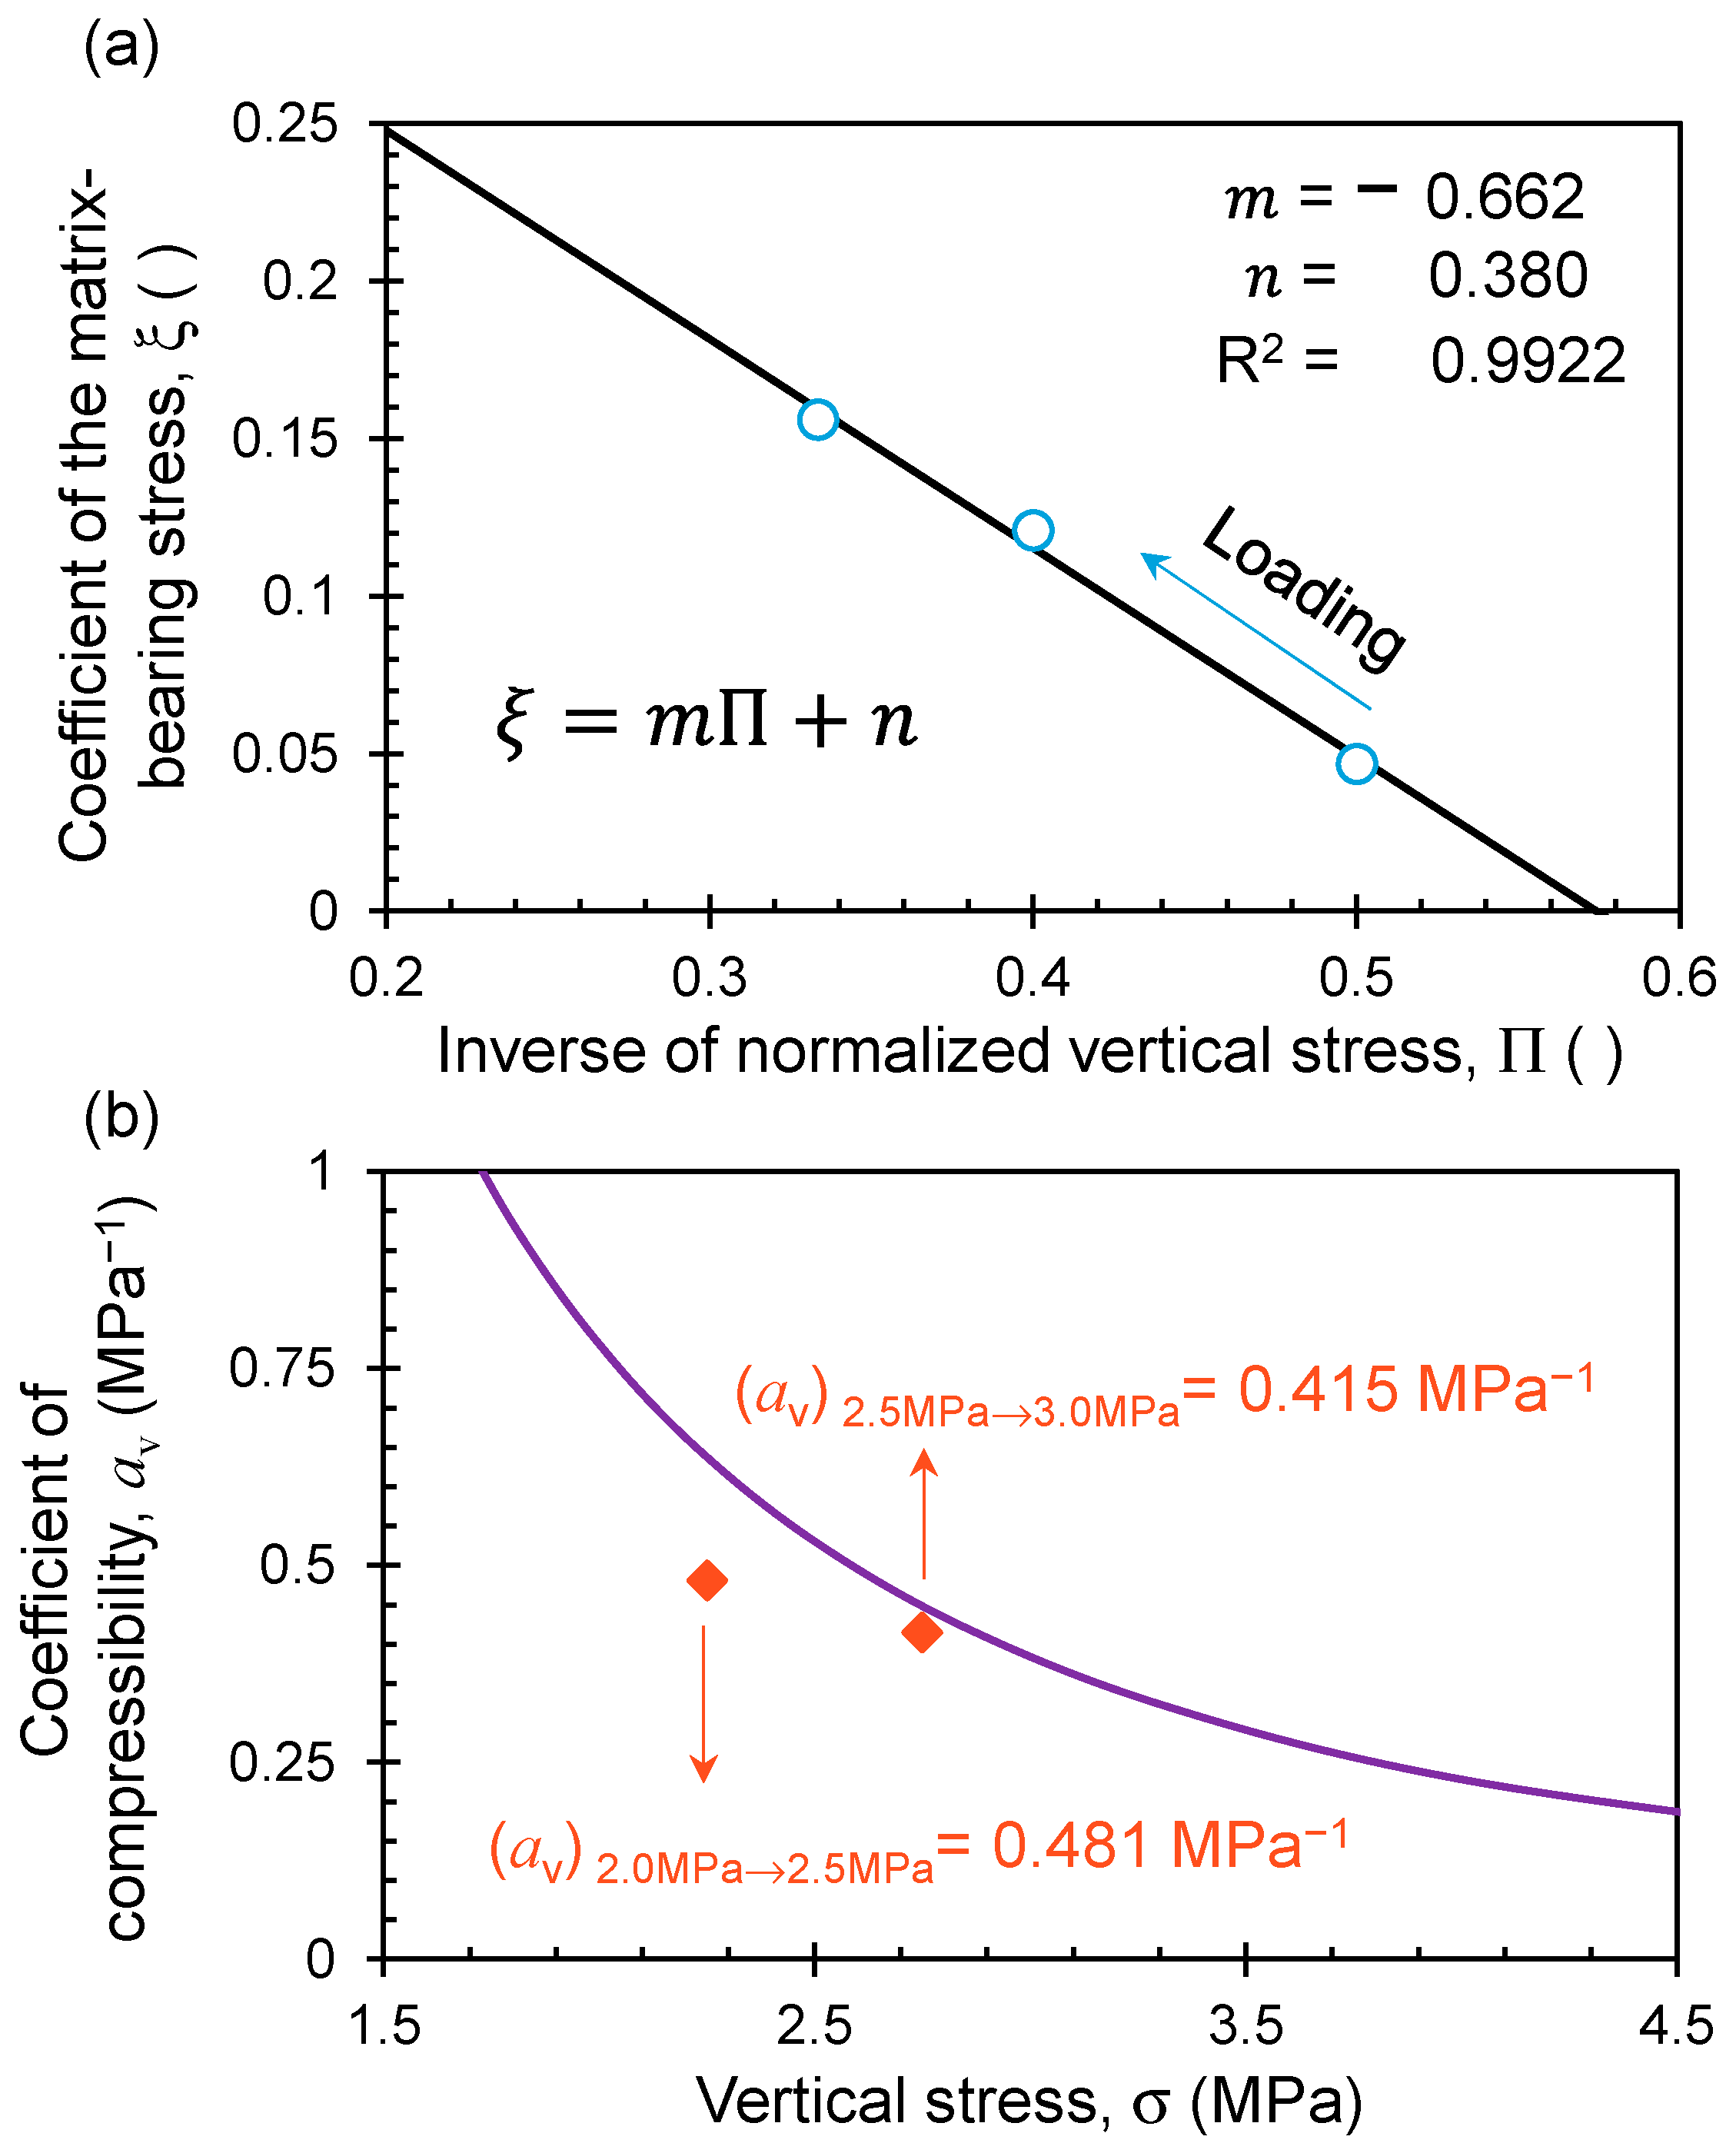
Figure 10a shows the coefficient of the matrix-bearing stress changing with the inverse of normalized vertical stress. It is obvious that the coefficient of the matrix-bearing stress decreases when the inverse of the normalized vertical stress increases, and the overall trend can be depicted by using a line with a slope of 0.662 and an intercept of 0.380. Thus, 0.662 in this study, and this value is substituted into Equation (5), allowing the coefficient of compressibility calculated under different vertical stresses when subjected to loading (Figure 10b). It is shown that the coefficient of compressibility decreases with increasing vertical stress. Equation (5) gives higher predictions than experimental data, yet still captures the essential physics of confined deformation when subjected to loading under an undrained condition.

Figure 10.
Coefficient of the matrix-bearing stress (a) and coefficient of compressibility (b) changing with vertical stress. The blue circles represent experimental data. The curve colored in purple represents Equation (5), and the diamonds in red-orange stand for experimental data calculated by using the increments of void ratio and vertical stress in Figure 6.
4.2. Wetting Crack Initiation and Development
The methane hydrate nodule initially stands on the air-dry clayey silt matrix (Figure 11a). Methane hydrate dissociates by heating and releases liquid water which is absorbed by the clayey silt matrix (Figure 11b), allowing a gas–water meniscus to be formed and suction development. According to unsaturated soil mechanics [53], the suction defined as the difference between pore gas pressure ug and pore water pressure uw among clayey silt particles (Figure 11c) can be calculated as
where Ts represents the pore water surface tension; θ is the contact angle and generally assumed to be zero as it is generally very small; Rs is the radius of the meniscus. The suction induces tensile stress along the gas–water interface, and the induced tensile stress tends to pull clayey silt particles together and rearrange the particles, leading to a volume shrinkage of the moist clayey silt (Figure 11d). When the induced tensile stress goes beyond the tensile strength of the clayey silt, cracks due to partial wetting initiate from the upper surface (Figure 11e). In addition, some cracks can develop deep inside the clayey silt matrix toward the lower interface with the help of the interfacial friction [54]. This kind of wetting cracks has been clearly observed in the lower matrix after methane hydrate dissociation and prior to being loaded under higher vertical stresses (Figure 11f). In summary, it is the soil suction that mainly influences the development of tensile stress and induces the initiation of wetting cracks.
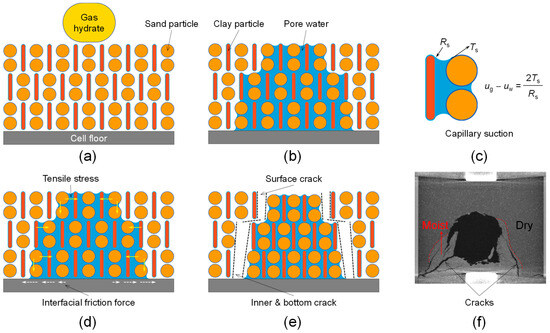
Figure 11.
Schematic illustration of wetting crack initiation and development. (a) A methane hydrate nodule initially stands on the air-dry clayey silt matrix. (b) The air-dry clayey silt matrix absorbs water coming from methane hydrate dissociation and the clayey silt becomes partially saturated. (c) Capillary suction develops among clay and silt particles. (d) Tensile stress develops along the gas–water interface and friction force generates in the bottom interface. (e) Surface crack initiates in the upper interface and develops deep inside. (f) Cracks in the lower half of the specimen matrix.
4.3. Implications to Peculiar Geological Structures Related to Natural Gas Hydrates
The present-day distribution of natural gas hydrates in nature has been intensively studied according to geological and geochemical anomalies [55,56]. However, the past occurrence of natural gas hydrates is very challenging to assess due to the lack of unequivocal proxies and proper methods to reconstruct paleoenvironmental conditions (e.g., pressure and temperature) which are basically required for the phase stability of natural gas hydrates [57]. Destabilization of natural gas hydrates in the geological history could be inferred according to authigenic carbonates near cold seeps where methane-enriched cold fluids escape from the seafloor [58]. The authigenic carbonates are normally of peculiar structures such as vacuolar-, spongy-, and vuggy-like fabrics. There are lots of cavities with different shapes distributed in these authigenic carbonates, and the cavities are empty or filled with carbonate cements, coarser sediments, and coquina debris [57]. These cavities have been interpreted as large voids previously occupied by natural gas hydrates preserved by the precipitation of methane-derived carbonates, and breccias with very angular shapes may result from collapses due to the destabilization of natural gas hydrates [58,59]. This interpretation and the evidence nature of authigenic carbonates are still not well constrained. The visualization of large cavities within fine-grained sediments after complete dissociation of methane hydrate during loading and unloading shows that large cavities are difficult to be fully closed even partial collapses occur. This provides direct evidence in the laboratory that the vacuolar-, spongy-, and vuggy-like fabrics of authigenic carbonates in nature originate from the destabilization of natural gas hydrates in the geological history.
5. Conclusions
This study jointly conducts an oedometer test and X-ray CT scans on marine clayey silt with gas cavities and explores the confined compressibility and the inner structure change under an undrained condition. The gas cavities are formed after heating-induced dissociation of noduled methane hydrate, and collapse of the clayey silt matrix when subjected to loading and unloading is analyzed, followed by a discussion on the initiation and growth of cracks after hydrate dissociation. Internal relation between pore gas pressure changes and void ratio alterations is revealed, allowing a theoretical model developed to depict the void ratio change.
Vertical loading induces a void ratio reduction with a compression index of 2.550, and the reduced void ratio can completely rebound after being unloaded with a swell index of 1.566. The void ratio linearly increases with the increasing inverse of normalized pore gas pressure, and the linearity is of a slope of 3.45 and an intercept of 0.496. The coefficient of the matrix-bearing stress (i.e., the effective stress) linearly decreases with the increasing inverse of normalized vertical loading stress, and the linearity is of a slope of −0.662 and an intercept of 0.380. The coefficient of compressibility decreases with the increasing vertical stress, and the proposed theoretical model can capture the essential physics of confined deformation when subjected to loading under an undrained condition.
Unrecovered changes of the inner structure still remain, although the void ratio can fully recover when being unloaded. Suction-induced cracks occur in the lower matrix after methane hydrate dissociation, and the cracks gradually close when the vertical stress increases to higher levels, but meanwhile, new cracks occur in the upper matrix. The clayey silt matrix collapses, and the gas cavity becomes much more fragmented when the vertical stress increases. These new occurring cracks and the fragmented gas cavity no longer change obviously when being unloaded to the initial vertical stress, leaving unrecovered inner structures within the specimen.
Author Contributions
Conceptualization, L.Y. and L.L.; Methodology, T.L., J.L. and Y.W.; Formal analysis, Y.W.; Investigation, L.Y., L.L. and T.L.; Resources, J.L., Z.W. and X.L.; Writing—original draft, L.Y.; Writing—review & editing, L.L., T.L., J.L., Y.W., Y.Z., Z.W. and X.L.; Visualization, Y.Z.; Supervision, T.L.; Project administration, L.L.; Funding acquisition, L.Y. and L.L. All authors have read and agreed to the published version of the manuscript.
Funding
This research was jointly funded by the Natural Science Foundation of Shandong Province (Grant No. ZR2022YQ54), the Science Foundation of Donghai Laboratory (Grant No. DH-2022KF0220), the Central Natural Disaster Prevention System Construction Project (Grant No. 2023330053), the Taishan Scholars Program (Grant No. tsqn202306297), the Zhejiang Provincial Natural Resources Science and Technology Project (Grant No. 2023-61), and the Zhejiang Provincial Geological Special Fund Project (Grant No. 2023013).
Institutional Review Board Statement
Not applicable.
Informed Consent Statement
Not applicable.
Data Availability Statement
Data are contained within the article.
Acknowledgments
Support for this work was jointly provided by the Natural Science Foundation of Shandong Province, the Science Foundation of Donghai Laboratory, the Central Natural Disaster Prevention System Construction Project, the Taishan Scholars Program, the Zhejiang Provincial Natural Resources Science and Technology Project, and the Zhejiang Provincial Geological Special Fund Project.
Conflicts of Interest
Author Xiang Liu was employed by the company Zhejiang Engineering Survey and Design Institute Group Co. Ltd. The remaining authors declare that the research was conducted in the absence of any commercial or financial relationships that could be construed as a potential conflict of interest.
References
- Sala, E.; Mayorga, J.; Bradley, D.; Cabral, R.B.; Atwood, T.B.; Auber, A.; Cheung, W.; Costello, C.; Ferretti, F.; Friedlander, A.M.; et al. Protecting the Global Ocean for Biodiversity, Food and Climate. Nature 2021, 592, 397–402. [Google Scholar] [CrossRef] [PubMed]
- Duan, X.; Yin, P.; Tsona, N.; Cao, K.; Xie, Y.; He, X.; Chen, B.; Chen, J.; Gao, F.; Yang, L.; et al. Biogenic Methane in Coastal Unconsolidated Sediment Systems: A Review. Environ. Res. 2023, 227, 115803. [Google Scholar] [CrossRef] [PubMed]
- Terzariol, M.; Sultan, N.; Apprioual, R.; Garziglia, S. Pore Habit of Gas in Gassy Sediments. J. Geophys. Res. Solid Earth 2021, 126, e2020JB021511. [Google Scholar] [CrossRef]
- Hornbach, M.J.; Saffer, D.M.; Holbrook, W.S.; Van Avendonk, H.J.A.; Gorman, A.R. Three-Dimensional Seismic Imaging of the Blake Ridge Methane Hydrate Province: Evidence for Large, Concentrated Zones of Gas Hydrate and Morphologically Driven Advection. J. Geophys. Res. Solid Earth 2008, 113, B07101. [Google Scholar] [CrossRef]
- Phillips, S.C.; Flemings, P.B.; Holland, M.E.; Schultheiss, P.J.; Waite, W.F.; Jang, J.; Petrou, E.G.; Hammon, H. High Concentration Methane Hydrate in a Silt Reservoir from the Deep-Water Gulf of Mexico. AAPG Bull. 2020, 104, 1971–1995. [Google Scholar] [CrossRef]
- Yamamoto, K.; Wang, X.-X.; Tamaki, M.; Suzuki, K. The Second Offshore Production of Methane Hydrate in the Nankai Trough and Gas Production Behavior from a Heterogeneous Methane Hydrate Reservoir. RSC Adv. 2019, 9, 25987–26013. [Google Scholar] [CrossRef] [PubMed]
- Shukla, K.M.; Kumar, P.; Yadav, U.S. Gas Hydrate Reservoir Identification, Delineation, and Characterization in the Krishna-Godavari Basin Using Subsurface Geologic and Geophysical Data from the National Gas Hydrate Program 02 Expedition, Offshore India. Mar. Pet. Geol. 2019, 108, 185–205. [Google Scholar] [CrossRef]
- Zhang, W.; Liang, J.; Wan, Z.; Su, P.; Huang, W.; Wang, L.; Lin, L. Dynamic Accumulation of Gas Hydrates Associated with the Channel-Levee System in the Shenhu Area, Northern South China Sea. Mar. Pet. Geol. 2020, 117, 104354. [Google Scholar] [CrossRef]
- Deng, W.; Liang, J.; Zhang, W.; Kuang, Z.; Zhong, T.; He, Y. Typical Characteristics of Fracture-Filling Hydrate-Charged Reservoirs Caused by Heterogeneous Fluid Flow in the Qiongdongnan Basin, Northern South China Sea. Mar. Pet. Geol. 2021, 124, 104810. [Google Scholar] [CrossRef]
- Kang, D.; Lu, J.; Zhang, Z.; Liang, J.; Kuang, Z.; Lu, C.; Kou, B.; Lu, Q.; Wang, J. Fine-Grained Gas Hydrate Reservoir Properties Estimated from Well Logs and Lab Measurements at the Shenhu Gas Hydrate Production Test Site, the Northern Slope of the South China Sea. Mar. Pet. Geol. 2020, 122, 104676. [Google Scholar] [CrossRef]
- Liu, C.; Meng, Q.; He, X.; Li, C.; Ye, Y.; Zhang, G.; Liang, J. Characterization of Natural Gas Hydrate Recovered from Pearl River Mouth Basin in South China Sea. Mar. Pet. Geol. 2015, 61, 14–21. [Google Scholar] [CrossRef]
- Dai, S.; Santamarina, J.C.; Waite, W.F.; Kneafsey, T.J. Hydrate Morphology: Physical Properties of Sands with Patchy Hydrate Saturation. J. Geophys. Res. Solid Earth 2012, 117, B11205. [Google Scholar] [CrossRef]
- Ghiassian, H.; Grozic, J.L.H. Strength Behavior of Methane Hydrate Bearing Sand in Undrained Triaxial Testing. Mar. Pet. Geol. 2013, 43, 310–319. [Google Scholar] [CrossRef]
- Zhang, W.; Liang, J.; Liang, Q.; Wei, J.; Wan, Z.; Feng, J.; Huang, W.; Zhao, J.; Meng, M.; Deng, W.; et al. Gas Hydrate Accumulation and Occurrence Associated with Cold Seep Systems in the Northern South China Sea: An Overview. Geofluids 2021, 2021, e5571150. [Google Scholar] [CrossRef]
- Yakushev, V.S.; Semenov, A.P.; Bogoyavlensky, V.I.; Medvedev, V.I.; Bogoyavlensky, I.V. Experimental Modeling of Methane Release from Intrapermafrost Relic Gas Hydrates When Sediment Temperature Change. Cold Reg. Sci. Technol. 2018, 149, 46–50. [Google Scholar] [CrossRef]
- Farahani, M.V.; Hassanpouryouzband, A.; Yang, J.; Tohidi, B. Insights into the Climate-Driven Evolution of Gas Hydrate-Bearing Permafrost Sediments: Implications for Prediction of Environmental Impacts and Security of Energy in Cold Regions. RSC Adv. 2021, 11, 14334–14346. [Google Scholar] [CrossRef]
- Sloan, E.D. Fundamental Principles and Applications of Natural Gas Hydrates. Nature 2003, 426, 353–363. [Google Scholar] [CrossRef] [PubMed]
- Liu, T.; Yang, X.; Zhang, Y. A Review of Gassy Sediments: Mechanical Property, Disaster Simulation and In-Situ Test. Front. Earth Sci. 2022, 10, 915735. [Google Scholar] [CrossRef]
- Walter, K.M.; Zimov, S.A.; Chanton, J.P.; Verbyla, D.; Chapin, F.S. Methane Bubbling from Siberian Thaw Lakes as a Positive Feedback to Climate Warming. Nature 2006, 443, 71–75. [Google Scholar] [CrossRef]
- Judd, A.G. The Global Importance and Context of Methane Escape from the Seabed. Geo-Mar. Lett. 2003, 23, 147–154. [Google Scholar] [CrossRef]
- Ruppel, C. Permafrost-Associated Gas Hydrate: Is It Really Approximately 1% of the Global System? J. Chem. Eng. Data 2015, 60, 429–436. [Google Scholar] [CrossRef]
- Nageswaran, S. Effect of Gas Bubbles on the Sea Bed Behaviour. University of Oxford. 1983. Available online: https://ora.ox.ac.uk/objects/uuid%3A1a17735d-dc1a-4866-8966-79ee1e7f9426 (accessed on 1 June 2024).
- Thomas, S.D. The Consolidation Behaviour of Gassy Soil. University of Oxford. 1987. Available online: https://ora.ox.ac.uk/objects/uuid%3Af13acb0c-3e1b-4122-b497-341869846561 (accessed on 1 June 2024).
- Kaminski, P.; Urlaub, M.; Grabe, J.; Berndt, C. Geomechanical Behaviour of Gassy Soils and Implications for Submarine Slope Stability: A Literature Analysis. In Subaqueous Mass Movements and Their Consequences: Advances in Process Understanding, Monitoring and Hazard Assessments; Geological Society of London: London, UK, 2020; Volume 500, ISBN 978-1-78620-499-8. [Google Scholar]
- Gardner, T.N.; Goringe, M.J. The Measurement of Gas Bubble Size Distributions in a Three Phase Laboratory Gassy Soil. Geotech. Test. J. 1988, 11, 49–55. [Google Scholar] [CrossRef]
- Sills, G.C.; Wheeler, S.J.; Thomas, S.D.; Gardner, T.N. Behaviour of Offshore Soils Containing Gas Bubbles. Géotechnique 1991, 41, 227–241. [Google Scholar] [CrossRef]
- Hong, Y.; Wang, L.Z.; Ng, C.W.W.; Yang, B. Effect of Initial Pore Pressure on Undrained Shear Behaviour of Fine-Grained Gassy Soil. Can. Geotech. J. 2017, 54, 1592–1600. [Google Scholar] [CrossRef]
- Abegg, F.; Anderson, A.L. The Acoustic Turbid Layer in Muddy Sediments of Eckernfoerde Bay, Western Baltic: Methane Concentration, Saturation and Bubble Characteristics. Mar. Geol. 1997, 137, 137–147. [Google Scholar] [CrossRef]
- Anderson, A.L.; Abegg, F.; Hawkins, J.A.; Duncan, M.E.; Lyons, A.P. Bubble Populations and Acoustic Interaction with the Gassy Floor of Eckernförde Bay. Cont. Shelf Res. 1998, 18, 1807–1838. [Google Scholar] [CrossRef]
- Johnson, B.D.; Boudreau, B.P.; Gardiner, B.S.; Maass, R. Mechanical Response of Sediments to Bubble Growth. Mar. Geol. 2002, 187, 347–363. [Google Scholar] [CrossRef]
- Barry, M.A.; Boudreau, B.P.; Johnson, B.D.; Reed, A.H. First-Order Description of the Mechanical Fracture Behavior of Fine-Grained Surficial Marine Sediments during Gas Bubble Growth. J. Geophys. Res. Earth Surf. 2010, 115. [Google Scholar] [CrossRef]
- Hong, Y.; Zhang, J.F.; Wang, L.Z.; Liu, T. On Evolving Size and Shape of Gas Bubble in Marine Clay under Multi-Stage Loadings: Microcomputed Tomography (μCT) Characterization and Cavity Contraction Analysis. Can. Geotech. J. 2020, 57, 1072–1091. [Google Scholar] [CrossRef]
- Ye, J.; Qin, X.; Xie, W.; Lu, H.; Ma, B.; Qiu, H.; Liang, J.; Lu, J.; Kuang, Z.; Lu, C.; et al. The Second Natural Gas Hydrate Production Test in the South China Sea. China Geol. 2020, 3, 197–209. [Google Scholar] [CrossRef]
- Li, J.; Ye, J.; Qin, X.; Qiu, H.; Wu, N.; Lu, H.; Xie, W.; Lu, J.; Peng, F.; Xu, Z.; et al. The First Offshore Natural Gas Hydrate Production Test in South China Sea. China Geol. 2018, 1, 5–16. [Google Scholar] [CrossRef]
- Qin, X.; Lu, J.; Lu, H.; Qiu, H.; Liang, J.; Kang, D.; Zhan, L.; Lu, H.; Kuang, Z. Coexistence of Natural Gas Hydrate, Free Gas and Water in the Gas Hydrate System in the Shenhu Area, South China Sea. China Geol. 2020, 3, 210–220. [Google Scholar] [CrossRef]
- Schneider, C.A.; Rasband, W.S.; Eliceiri, K.W. NIH Image to ImageJ: 25 Years of Image Analysis. Nat. Methods 2012, 9, 671–675. [Google Scholar] [CrossRef]
- Li, C.; Hu, G.; Zhang, W.; Ye, Y.; Liu, C.; Li, Q.; Sun, J. Influence of Foraminifera on Formation and Occurrence Characteristics of Natural Gas Hydrates in Fine-Grained Sediments from Shenhu Area, South China Sea. Sci. China Earth Sci. 2016, 59, 2223–2230. [Google Scholar] [CrossRef]
- Li, C.; Liu, C.; Hu, G.; Sun, J.; Hao, X.; Liu, L.; Meng, Q. Investigation on the Multiparameter of Hydrate-Bearing Sands Using Nano-Focus X-Ray Computed Tomography. J. Geophys. Res. Solid Earth 2019, 124, 2286–2296. [Google Scholar] [CrossRef]
- Liu, L.; Dai, S.; Ning, F.; Cai, J.; Liu, C.; Wu, N. Fractal Characteristics of Unsaturated Sands − Implications to Relative Permeability in Hydrate-Bearing Sediments. J. Nat. Gas Sci. Eng. 2019, 66, 11–17. [Google Scholar] [CrossRef]
- Zhang, Z.; Li, C.; Ning, F.; Liu, L.; Cai, J.; Liu, C.; Wu, N.; Wang, D. Pore Fractal Characteristics of Hydrate-Bearing Sands and Implications to the Saturated Water Permeability. J. Geophys. Res. Solid Earth 2020, 125, e2019JB018721. [Google Scholar] [CrossRef]
- Liu, L.; Zhang, Z.; Li, C.; Ning, F.; Liu, C.; Wu, N.; Cai, J. Hydrate Growth in Quartzitic Sands and Implication of Pore Fractal Characteristics to Hydraulic, Mechanical, and Electrical Properties of Hydrate-Bearing Sediments. J. Nat. Gas Sci. Eng. 2020, 75, 103109. [Google Scholar] [CrossRef]
- Zhang, Z.; Liu, L.; Li, C.; Cai, J.; Ning, F.; Meng, Q.; Liu, C. Fractal Analyses on Saturation Exponent in Archie’s Law for Electrical Properties of Hydrate-Bearing Porous Media. J. Pet. Sci. Eng. 2021, 196, 107642. [Google Scholar] [CrossRef]
- Bu, Q.; Xing, T.; Li, C.; Zhao, J.; Liu, C.; Wang, Z.; Zhao, W.; Kang, J.; Meng, Q.; Hu, G. Effect of Hydrate Microscopic Distribution on Acoustic Characteristics during Hydrate Dissociation: An Insight from Combined Acoustic-CT Detection Study. J. Mar. Sci. Eng. 2022, 10, 1089. [Google Scholar] [CrossRef]
- Bu, Q.; Meng, Q.; Dong, J.; Li, C.; Liu, C.; Zhao, J.; Wang, Z.; Zhao, W.; Kang, J.; Hu, G. Integration of Pore-Scale Visualization and an Ultrasonic Test System of Methane Hydrate-Bearing Sediments. Energies 2022, 15, 4938. [Google Scholar] [CrossRef]
- Wei, R.; Liu, L.; Jia, C.; Zhao, H.; Dong, X.; Bu, Q.; Liu, C.; Wu, N. Undrained Shear Properties of Shallow Clayey-Silty Sediments in the Shenhu Area of South China Sea. Sustainability 2023, 15, 1175. [Google Scholar] [CrossRef]
- Wei, R.; Liu, L.; Jia, C.; Dong, X.; Bu, Q.; Zhang, Y.; Liu, C.; Wu, N. Undrained Triaxial Shear Tests on Hydrate-Bearing Fine-Grained Sediments from the Shenhu Area of South China Sea. J. Mar. Sci. Eng. 2023, 11, 1604. [Google Scholar] [CrossRef]
- Sun, S.-C.; Liu, C.-L.; Meng, Q.-G. Hydrate Phase Equilibrium of Binary Guest-Mixtures Containing CO2 and N2 in Various Systems. J. Chem. Thermodyn. 2015, 84, 1–6. [Google Scholar] [CrossRef]
- Farahani, M.V.; Guo, X.; Zhang, L.; Yang, M.; Hassanpouryouzband, A.; Zhao, J.; Yang, J.; Song, Y.; Tohidi, B. Effect of Thermal Formation/Dissociation Cycles on the Kinetics of Formation and Pore-Scale Distribution of Methane Hydrates in Porous Media: A Magnetic Resonance Imaging Study. Sustain. Energy Fuels 2021, 5, 1567–1583. [Google Scholar] [CrossRef]
- Zhu, B.; Huang, J.; Wang, L.; Ye, Z. Precise Numerical Study on the Behaviour of Gassy Marine Soils Subjected to Thermal and Mechanical Loadings. Comput. Geotech. 2021, 137, 104269. [Google Scholar] [CrossRef]
- Kim, J.; Dai, S.; Jang, J.; Waite, W.F.; Collett, T.S.; Kumar, P. Compressibility and Particle Crushing of Krishna-Godavari Basin Sediments from Offshore India: Implications for Gas Production from Deep-Water Gas Hydrate Deposits. Mar. Pet. Geol. 2019, 108, 697–704. [Google Scholar] [CrossRef]
- Yun, T.S.; Narsilio, G.A.; Carlos Santamarina, J. Physical Characterization of Core Samples Recovered from Gulf of Mexico. Mar. Pet. Geol. 2006, 23, 893–900. [Google Scholar] [CrossRef]
- Lee, J.Y.; Kim, G.Y.; Kang, N.K.; Yi, B.Y.; Jung, J.W.; Im, J.H.; Son, B.K.; Bahk, J.J.; Chun, J.H.; Ryu, B.J.; et al. Physical Properties of Sediments from the Ulleung Basin, East Sea: Results from Second Ulleung Basin Gas Hydrate Drilling Expedition, East Sea (Korea). Mar. Pet. Geol. 2013, 47, 43–55. [Google Scholar] [CrossRef]
- Lu, N.; Likos, W. Unsaturated Soil Mechanics; Wiley: Hoboken, NJ, USA, 2004; ISBN 978-0-471-44731-3. [Google Scholar]
- Zeng, H.; Tang, C.; Cheng, Q.; Inyang, H.I.; Rong, D.; Lin, L.; Shi, B. Coupling Effects of Interfacial Friction and Layer Thickness on Soil Desiccation Cracking Behavior. Eng. Geol. 2019, 260, 105220. [Google Scholar] [CrossRef]
- Collett, T.; Bahk, J.-J.; Baker, R.; Boswell, R.; Divins, D.; Frye, M.; Goldberg, D.; Husebø, J.; Koh, C.; Malone, M.; et al. Methane Hydrates in Nature—Current Knowledge and Challenges. J. Chem. Eng. Data 2015, 60, 319–329. [Google Scholar] [CrossRef]
- Yanlong Li; Lele Liu; Yurong Jin; Nengyou Wu Characterization and Development of Marine Natural Gas Hydrate Reservoirs in Marine Clayey-Silt Reservoirs: A Review and Discussion. Adv. Geo-Energy Res. 2021, 5, 75–86. [CrossRef]
- Argentino, C.; Conti, S.; Fioroni, C.; Fontana, D. Evidences for Paleo-Gas Hydrate Occurrence: What We Can Infer for the Miocene of the Northern Apennines (Italy). Geosciences 2019, 9, 134. [Google Scholar] [CrossRef]
- Greinert, J.; Bohrmann, G.; Suess, E. Gas Hydrate-Associated Carbonates and Methane-Venting at Hydrate Ridge: Classification, Distribution, and Origin of Authigenic Lithologies. In Natural Gas Hydrates: Occurrence, Distribution, and Detection; American Geophysical Union (AGU): Washington, DC, USA, 2001; pp. 99–113. ISBN 978-1-118-66841-2. [Google Scholar]
- Bohrmann, G.; Torres, M.E. Gas Hydrates in Marine Sediments. In Marine Geochemistry; Schulz, H.D., Zabel, M., Eds.; Springer: Berlin/Heidelberg, Germany, 2006; pp. 481–512. ISBN 978-3-540-32144-6. [Google Scholar]


Disclaimer/Publisher’s Note: The statements, opinions and data contained in all publications are solely those of the individual author(s) and contributor(s) and not of MDPI and/or the editor(s). MDPI and/or the editor(s) disclaim responsibility for any injury to people or property resulting from any ideas, methods, instructions or products referred to in the content. |
© 2024 by the authors. Licensee MDPI, Basel, Switzerland. This article is an open access article distributed under the terms and conditions of the Creative Commons Attribution (CC BY) license (https://creativecommons.org/licenses/by/4.0/).