Abstract
Water scarcity will increase in the world in the coming decades due to climate change, especially in areas that currently already have water scarcity, such as the Mediterranean area. In these areas, to guarantee water resources, systems’ sustainability is necessary to improve demand management and the development of non-conventional resources, such as treated wastewater reuse or seawater desalination. These non-conventional resources are highly energy-consuming; so, reducing energy costs is a key element in developing their use in different sectors, including agriculture. Combining photovoltaic solar energy with seawater desalination by reverse osmosis will reduce the cost of producing water to below 0.36 EUR/m3; so, this resource can be attractive for agriculture, as demonstrated in this work. The arrangement of bifacial solar modules in horizontal single-axis tracking systems increases the energy amount generated from the sun in one hour or more, improving the facility’s efficiency and reducing the desalinated water cost. The greater distance between the solar module lines, with a ground coverage ratio (GCR) = 0.3, makes for a better environmental integration of the facility and allows the development of agrovoltaic strategies, such as native flora planting and pollinator colonization.
1. Introduction
Studies evaluating the climate change impact on water resources at the global and regional scales from the IPCC (Intergovernmental Panel on Climate Change) [1] agree that the climate change consequences will differ significantly between regions, very negatively affecting water availability in some regions, such as the Mediterranean area. As water scarcity grows in many regions of the world and with advances in desalination and reuse technology and the reduction in production costs, water managers can use these non-conventional resources to equilibrate the water balance in deficient water resource systems [2]. It is foreseeable that, in these regions, non-conventional resource use will be promoted, such as reclaimed water or seawater desalination, including renewable energy facilities to contribute to energy optimization and lower costs.
Desalination is a process that requires energy to produce freshwater from marine or brackish water. It requires separating saline water into two streams, one with a low concentration of dissolved salts (freshwater) and one with concentrated salts (brine). To date, there are two main categories of desalination technologies: thermal technologies, such as multi-stage flash (MSF), multiple-effect distillation (MED) and vapor compression (VC); and membrane technologies, such as reverse osmosis (RO) and electrodialysis (ED). Thermal desalination uses heat to vaporize freshwater. In contrast, membrane desalination (RO) uses high pressure from electrically powered pumps to separate freshwater from seawater or brackish water using a membrane. At present, RO (65%) and MSF (20%) are the prevailing techniques for sea and brackish water desalination [3]. Thermal processes are losing importance in the world, but they have not disappeared, and membrane technology is gaining more and more prominence. In Spain, most of the existing plants operate using membrane techniques, with reverse osmosis (RO) being the predominant one [4].
The brine return from the desalination plants can affect the marine flora and fauna at the discharge point; so, it must be carried out through dispersion infrastructure that ensures sufficient dilution to minimize these impacts. To date, worldwide chemical and biological monitoring programs have shown that brine discharge from desalination plants has localized minimal impacts on the marine environment [3].
Photovoltaic (PV) solar energy is one of the most competitive energy sources nowadays [5]. Combining this renewable energy with high energy-consuming hydraulic infrastructures allows significant energy cost savings, which, in turn, reduces operating costs, making these water resources more competitive. Now, there are some examples of this combination for pumping stations [6,7], wastewater treatment plants [8,9,10,11], and seawater desalination plants [12,13,14,15].
Solar-powered water pumping systems for irrigation [16] and other purposes generally have a high investment cost, but they have many features that make them attractive as an alternative source of power for water pumping. It is clean, as it produces no carbon emission during its operation lifetime, it generates no noise, and it has low operational and maintenance costs [6].
In wastewater treatment plants, solar photovoltaic systems can reduce the energy consumption of aeration tanks [17]. In California, in wastewater treatment plants, lower than 200,000 m3/day solar PV often represents the only source of renewable energy, producing 30–100% of the energy demand of these plants. For facilities with needs larger than 200,000 m3/day, PV is primarily installed in hybrid configurations with anaerobic digestion, where biogas contributes 25–65% to the overall energy demand and solar provides 8–30% [9].
Integrating solar energy systems with seawater desalination processes is an attractive and alternative solution to fossil fuels, but further research and development on solar energy systems are required to make their use in desalination economically viable [18]. The use of reverse osmosis (RO) desalination plants powered by a photovoltaic (PV) system is an attractive solution for small-scale applications [19]; so, it is still necessary to demonstrate its feasibility at a large scale.
Water desalination requires greater energy-specific consumption than wastewater treatment and water elevation; so, the energy costs are higher, making this resource less attractive to users nowadays. This explains that the main desalination use in the world is for urban supply, which with a greater payment capacity represents 60% water desalinated, followed by industrial use, with 30%, and only a small percentage, around 3%, corresponds to agriculture [20,21].
Seawater desalination reverse osmosis (SWRO) has a typical specific energy consumption between 3.1 and 4.5 kWh/m3 [22,23,24], with a representative value between 3.5 and 4.0 kWh/m3 [22,25,26,27]. The common energy consumption of SWRO desalination plants is in the order of 3.5 kWh/m3 [3], reaching 3 kWh/m3 in high-efficiency plants in some cases in the Canary Islands [28].
Depending on the type of treatment, wastewater treatment plants can have a specific energy consumption between 0.5 and 2 kWh/m3 [29], with usual values in the order of 1 kWh/m3 [30]. Comparatively, the energy consumption of wastewater treatments is equivalent to pumping water to a height of 250 m, while the SWRO energy consumption is equivalent to pumping water to 1000 m.
In semi-arid areas, such as the Mediterranean area, climate change will increase natural resource scarcity, making it necessary to adapt current water resource management to climate change. Improvements in irrigation efficiency, the reuse of treated wastewater for irrigation, and seawater desalination are some of the main adaptation measures necessary to maintain water sustainability in these basins [31].
Seawater desalination, regenerated wastewater reuse, and its elevation from production plants to irrigation areas require a large amount of energy; so, the cost of energy can represent a challenge to the use of these sources. Combining these sources with photovoltaic systems can make this resource viable.
Water from seawater desalination is usually more expensive than water coming from other water sources, such as regulated surface water in reservoirs or groundwater. For this reason, the use of desalinated water in agriculture is currently only justified for high added-value crops where the cost of the water is not a critical issue [32]. Although the use of desalinated water for water in the world is not significant, Spain has a use rate of more than 21% [33], with different projects underway for new desalination plants and the expansion of the existing ones, whose main water use is for agriculture. This work demonstrates the viability of implementing photovoltaic systems for seawater desalination to make this resource attractive for agriculture, so that it guarantees its viability for the future. Furthermore, this feasibility demonstration implies also the economic viability for the reuse of treated wastewater and water pumping if they are supplied by photovoltaic systems, because they have currently a lower cost than desalination.
This paper describes the research that served as the basis for reaching a complex 10-year agreement between the Spanish governmental administration and the agricultural users of the Segura basin. According to this agreement, they have to use water resources from desalination, together with the water resources coming from the Tajo–Segura water transfer and from the aquifers in the basin, which, according to hydrological planning, are going to be reduced in the coming years. Although the use of desalinated water means increasing the average cost that users are going to pay for water, this cost can be paid by them and provides them a greater guarantee in meeting demands.
2. Desalination in Spain
The fragile balance between water resources, water demand, and environmental requirements in some territories of Spain, exacerbated by climate change [34,35], can restrict activity development and intensify water conflicts. Planned and sustainable management of all resources, conventional and non-conventional, ensuring environmental protection, is a prioritized objective in water management in Spain today. Surface resources are already highly regulated; so, it is not expected that a significant number of new reservoirs will be built in the coming years. On the other hand, aquifers, especially those along the Mediterranean coast, have very high exploitation rates; so, a significant increase in groundwater collection is not expected either. Therefore, an increase in conventional resources is not foreseen in the future; hence, in territories with a more fragile water balance, wastewater reuse or seawater desalination, together with a greater management of demands, will play a key role in the future.
Within the integrated management of water resources framework, seawater or brackish desalination use has had growing importance in Spain in this century and represents a very important resource in some river basin districts, such as in the Segura river basin, the Andalusian Mediterranean river basins, the Canary Islands, the Balearic Islands, and the autonomous cities of Ceuta and Melilla. However, seawater desalination still has a high cost; so, its use in agriculture is only competitive under water scarcity conditions with high crop profitability or lack of water availability from other sources.
Desalination began in Spain in 1964, the year when the first plant was built in Lanzarote by a private initiative and with a modest production capacity (2000 m3/day—0.73 hm3/year). The success of this plant made the islands of Fuerteventura and Gran Canaria, and even Ceuta, see the possibility of being water self-sufficient by desalination. At the beginning of the 1970s, the water administration promoted the construction of seawater desalinated plants in Ceuta (4000 m3/day), Fuerteventura (4000 m3/day), and Gran Canaria (20,000 m3/day—7.3 hm3/year) [36].
Water cost, linked to energy cost, rose steeply in those years, and only the lack of alternatives caused the first peninsular desalination plant to come into operation in Almería in 1980, the Carboneras plant (2200 m3/day). Until the end of the century, new plants continued to be built in the eastern Canary Islands, in the Balearic Islands (Ibiza and Mallorca), and on the Mediterranean coast (Málaga and Almería). After the intense drought period between 1992 and 1995, high added-value agricultural areas in the southeastern Mediterranean Sea (Alicante, Murcia, and Almería) also opted to use desalination to increase the irrigation guarantee. It is estimated that, between 1995 and 2000, more than 200 desalination plants were built with capacities ranging from 500 m3/day to 10,000 m3/day [33]. The Global Program of Actions for the Management and Use of Water (the AGUA Program in Spanish), which was carried out from 2004 to 2011 by the Water State General Administration, included the construction of numerous desalination plants of very variable capacities. The Torrevieja plant in Alicante was the largest one, with a capacity of 80 hm3/year (220,000 m3/day) [37]. This plant was the largest reverse osmosis desalination plant in Europe and the second largest in the world.
The desalination capacity in Spain (>2,000,000 m3/day) and the volume supplied by these plants (Table 1) are concentrated in the Mediterranean basin and the islands (Figure 1), which have a more considerable lack of water availability and regularity.

Table 1.
Desalination capacity (m3/day) and annual production (hm3/year) in Spain.
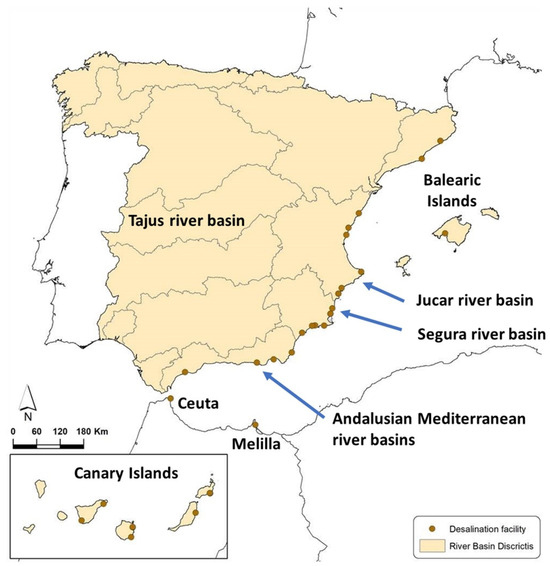
Figure 1.
Larger desalination facilities in Spain.
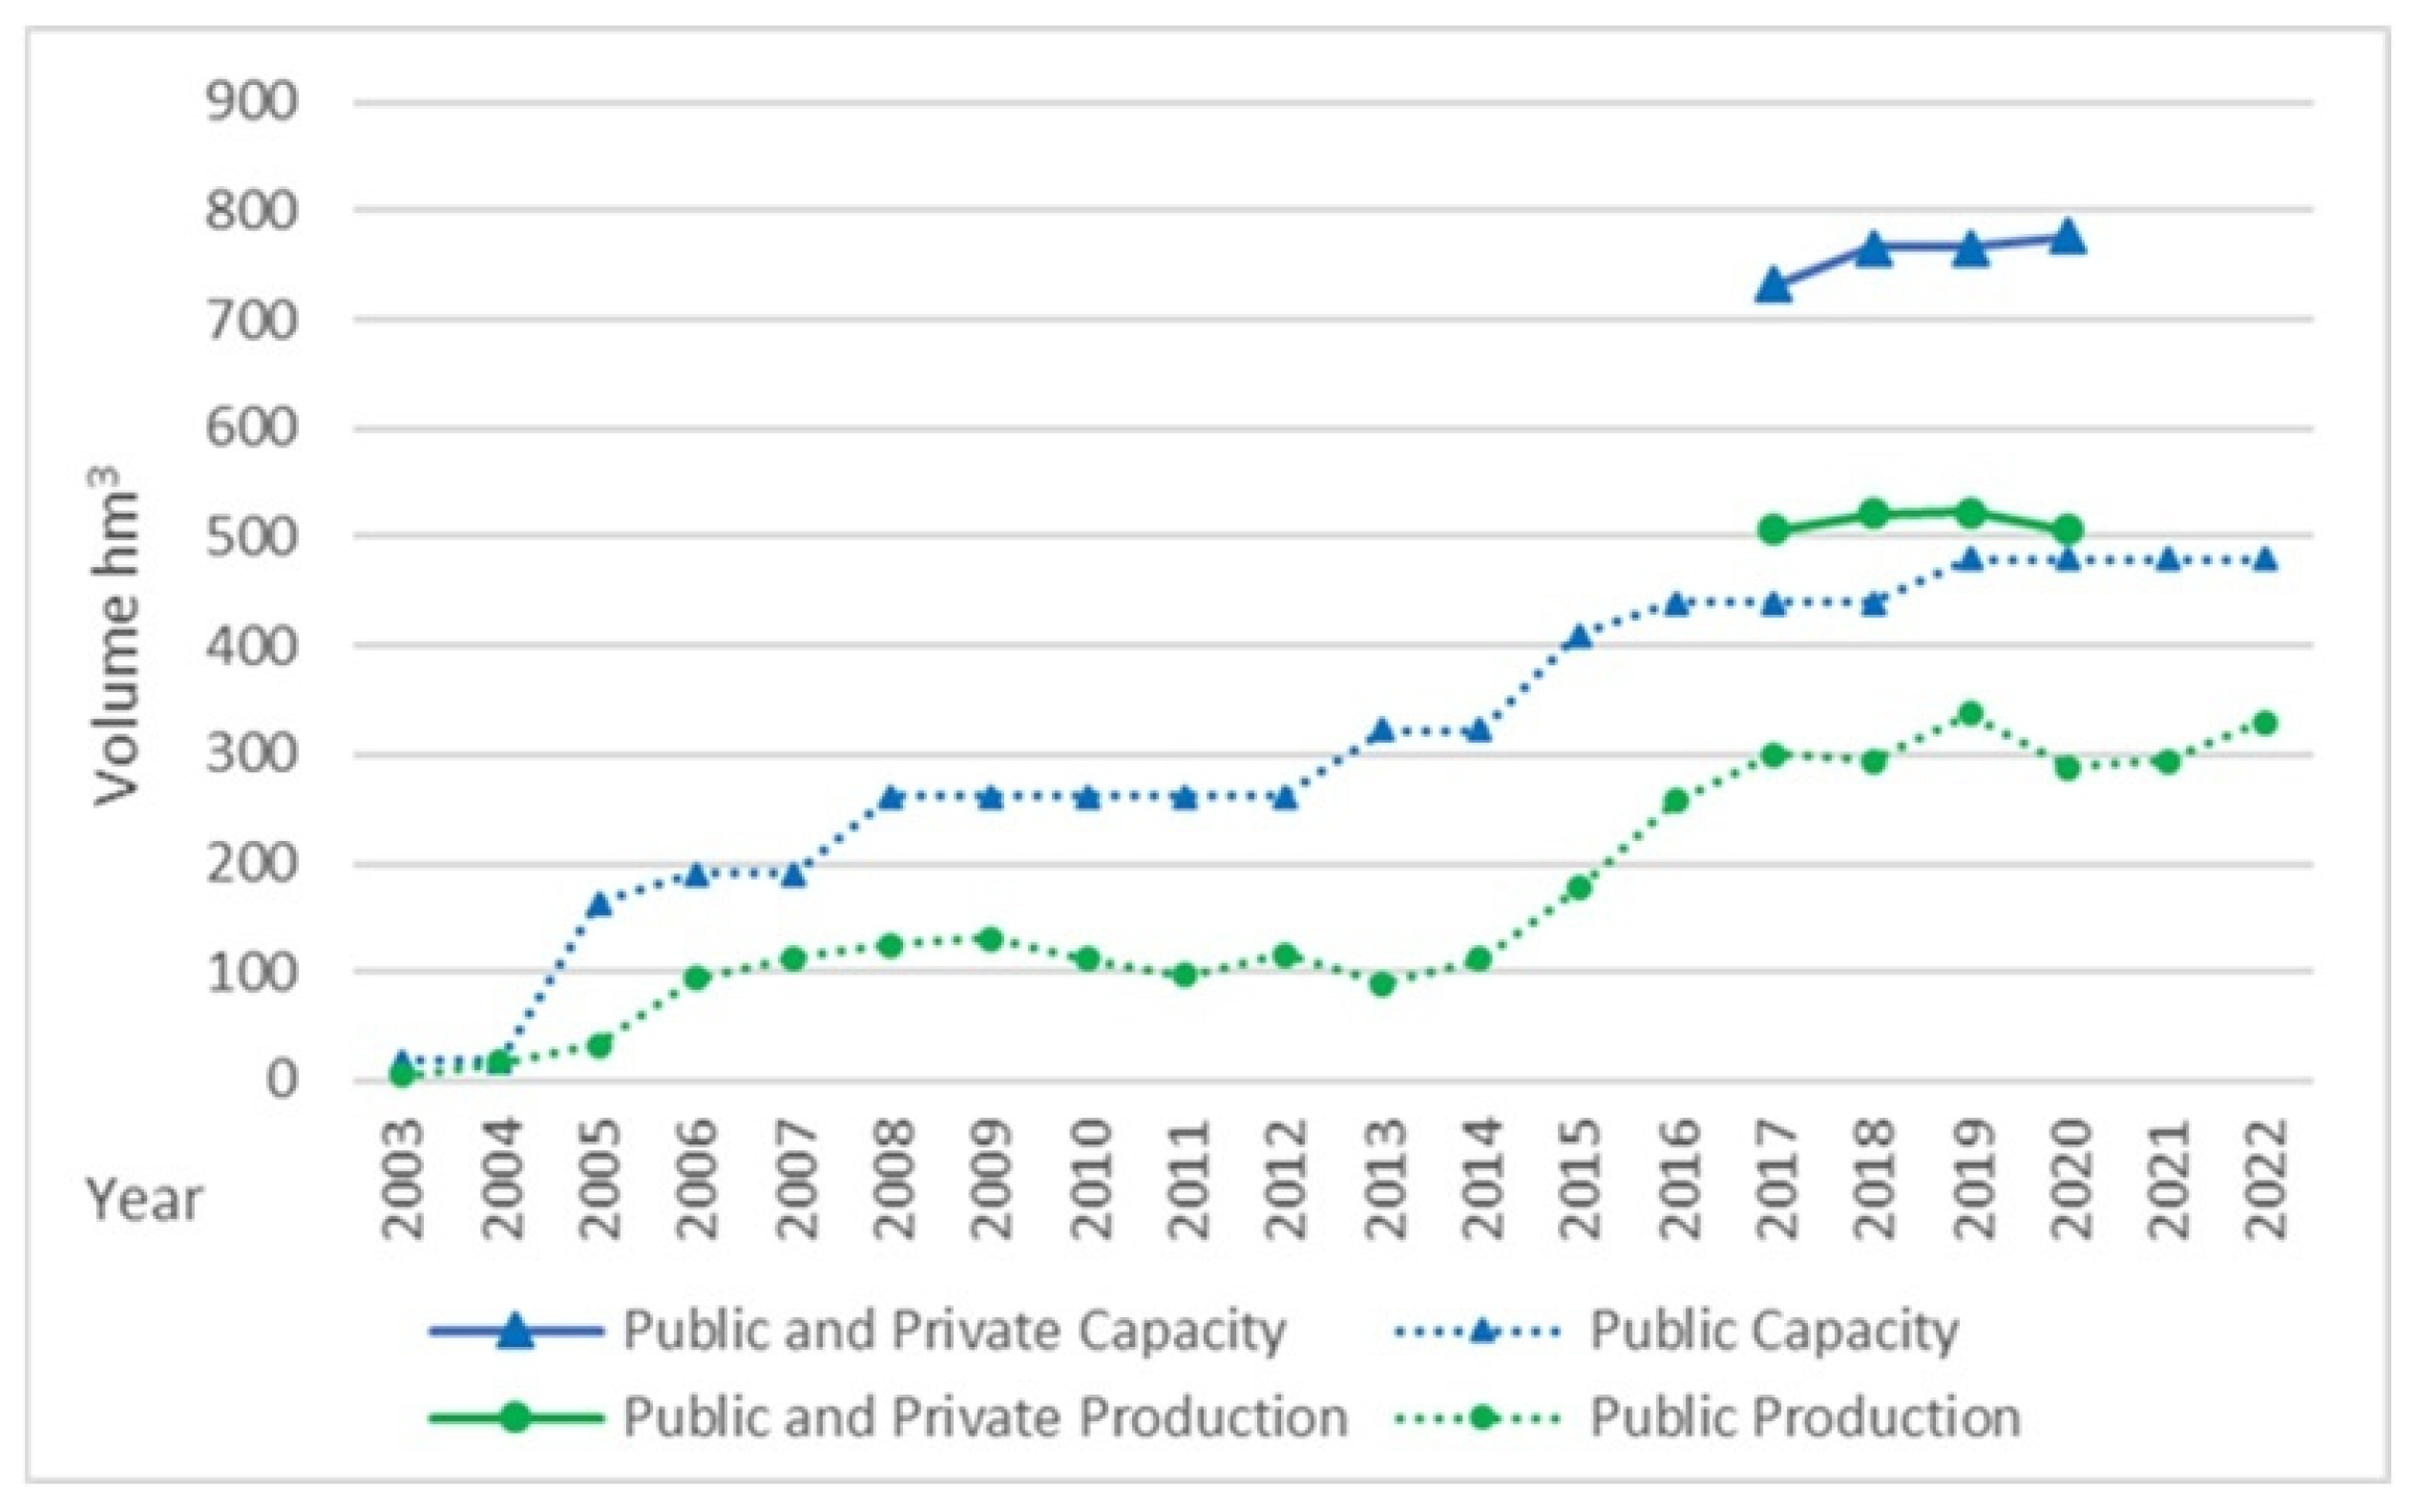
The annual volume produced in recent years has been just over 500 hm3/year and has remained stable. Its use has been especially relevant in the Segura river basin and in the Canary Islands [38]. Therefore, although for all regions of Spain the weight of desalination represents only 2% of the total demand served, in some of these regions (Melilla at 51%, Ceuta at 88%, Canary Islands at 33%, Balearic Islands at 7%, and Segura at 15%), it constitutes a very significant percentage of the water demand (Table 1).
Based on third cycle river basin management plans, for the period of 2022–2027, there are more than 200 desalination plants in Spain, of which, approximately, a third corresponds to public promotion facilities and the rest to privately promoted facilities. In general, private desalination plants are small self-consumption facilities that are used to meet high added-value demands, such as hotel facilities or large industries, although some also exist to guarantee the supply of agricultural demands. For this reason, most of them are in the islands.
On the contrary, public-promoted desalination plants are, in general, large facilities, and this the necessary investment for their development is much greater. The larger desalination plants in Spain have been promoted by public administrations, as in the case of the Water State General Administration, through the state companies “Aguas de las Cuencas Mediterráneas, SA (Acuamed)” and “Mancomunidad de los Canales del Taibilla OA”.
Two thirds of desalinated water production are from public facilities (Figure 2), and both private and public facilities’ productions have a high percentage of use (60–70%) with respect to their plants’ capacity. Furthermore, there is considerable growth in the public promotion of desalination plants in the last twenty years, evolving from essentially not investing on this technology to having a capacity of approximately 500 hm3/year.
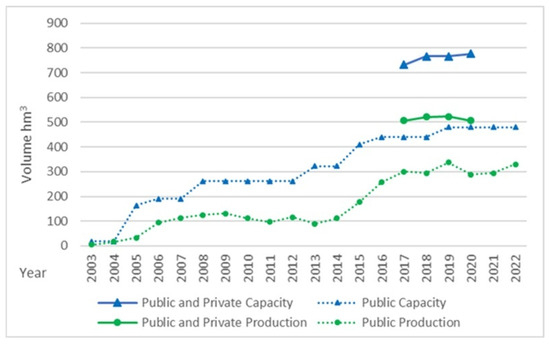
Figure 2.
Capacity and production of desalinated water in Spain from public and private facilities.
In Spain, the state-owned company Acuamed, before designing and building desalination plants, carries out the environmental impact studies required by legislation and the mathematical modeling of discharges and their mixture with marine water. In the construction of the plants, discharges by means of diffusers are installed, which guarantees a rapid mixing of brine with seawater, seeking to eliminate the risk to the most sensitive marine species and to the environment in general. During the operation phase, permanent monitoring stations are used to measure the quality of the receiving environment and the effluents. As it is very difficult to determine the impact on all marine organisms, indicators are used, such as Posidonia oceanica, a widespread species in the Mediterranean Sea that is very sensitive to changes in salinity and is protected in the EU. Possible effects on seagrass meadows and other marine organisms (reefs, echinoderms, and mollusks) are also monitored.
The Water General State Administration commitment to this technology is firm thanks to the guarantee offered by this water resource and its ability to lower water costs, due to technological improvements and the use of renewable energies as presented in this work. In fact, the Ministry for the Ecological Transition and Demographic Challenge is developing a program to expand the existing desalination facilities in Almería, Murcia, and Alicante, which involves an investment of around EUR 500 M and an increase in the desalination capacity to 109 hm3/year. This investment includes the implementation of photovoltaic facilities on each desalination plant.
The growth in and consolidation of desalination plants as a complementary resource in the integrated management of water resources will depend largely on their costs, including both amortization costs and operation and maintenance costs, which also include the cost of energy.
The total cost of desalinated water depends on the energy price, and both of them are also very sensitive to the plant size and its workload. In this way, the SWRO cost is about 0.3–1.0 EUR/m3 with a mean price of around 0.4 and 0.5 EUR/m3 [39,40]. The energy cost represents around 50–60% of the total cost [26,41].
In the area where the project is located, Murcia and Alicante, based on seven large seawater desalination plants, the total costs ranged between 0.63 and 0.72 EUR/m3 in 2012 [42], although these costs increased significantly if the facilities worked at a partial load. More recently, based on four seawater desalination plants of the Júcar river basin district, total cost ranged between 0.45 and 0.55 EUR/m3 for plants at a full load, values that doubled if they operated at half or low capacity [37].
In summary, the desalinated seawater cost has decreased from 2 EUR/m3 in the first plants built in Spain to 0.5 EUR/m3 in the most recent plants [43].
3. Pv Systems in The Segura River Basin
3.1. Study Case
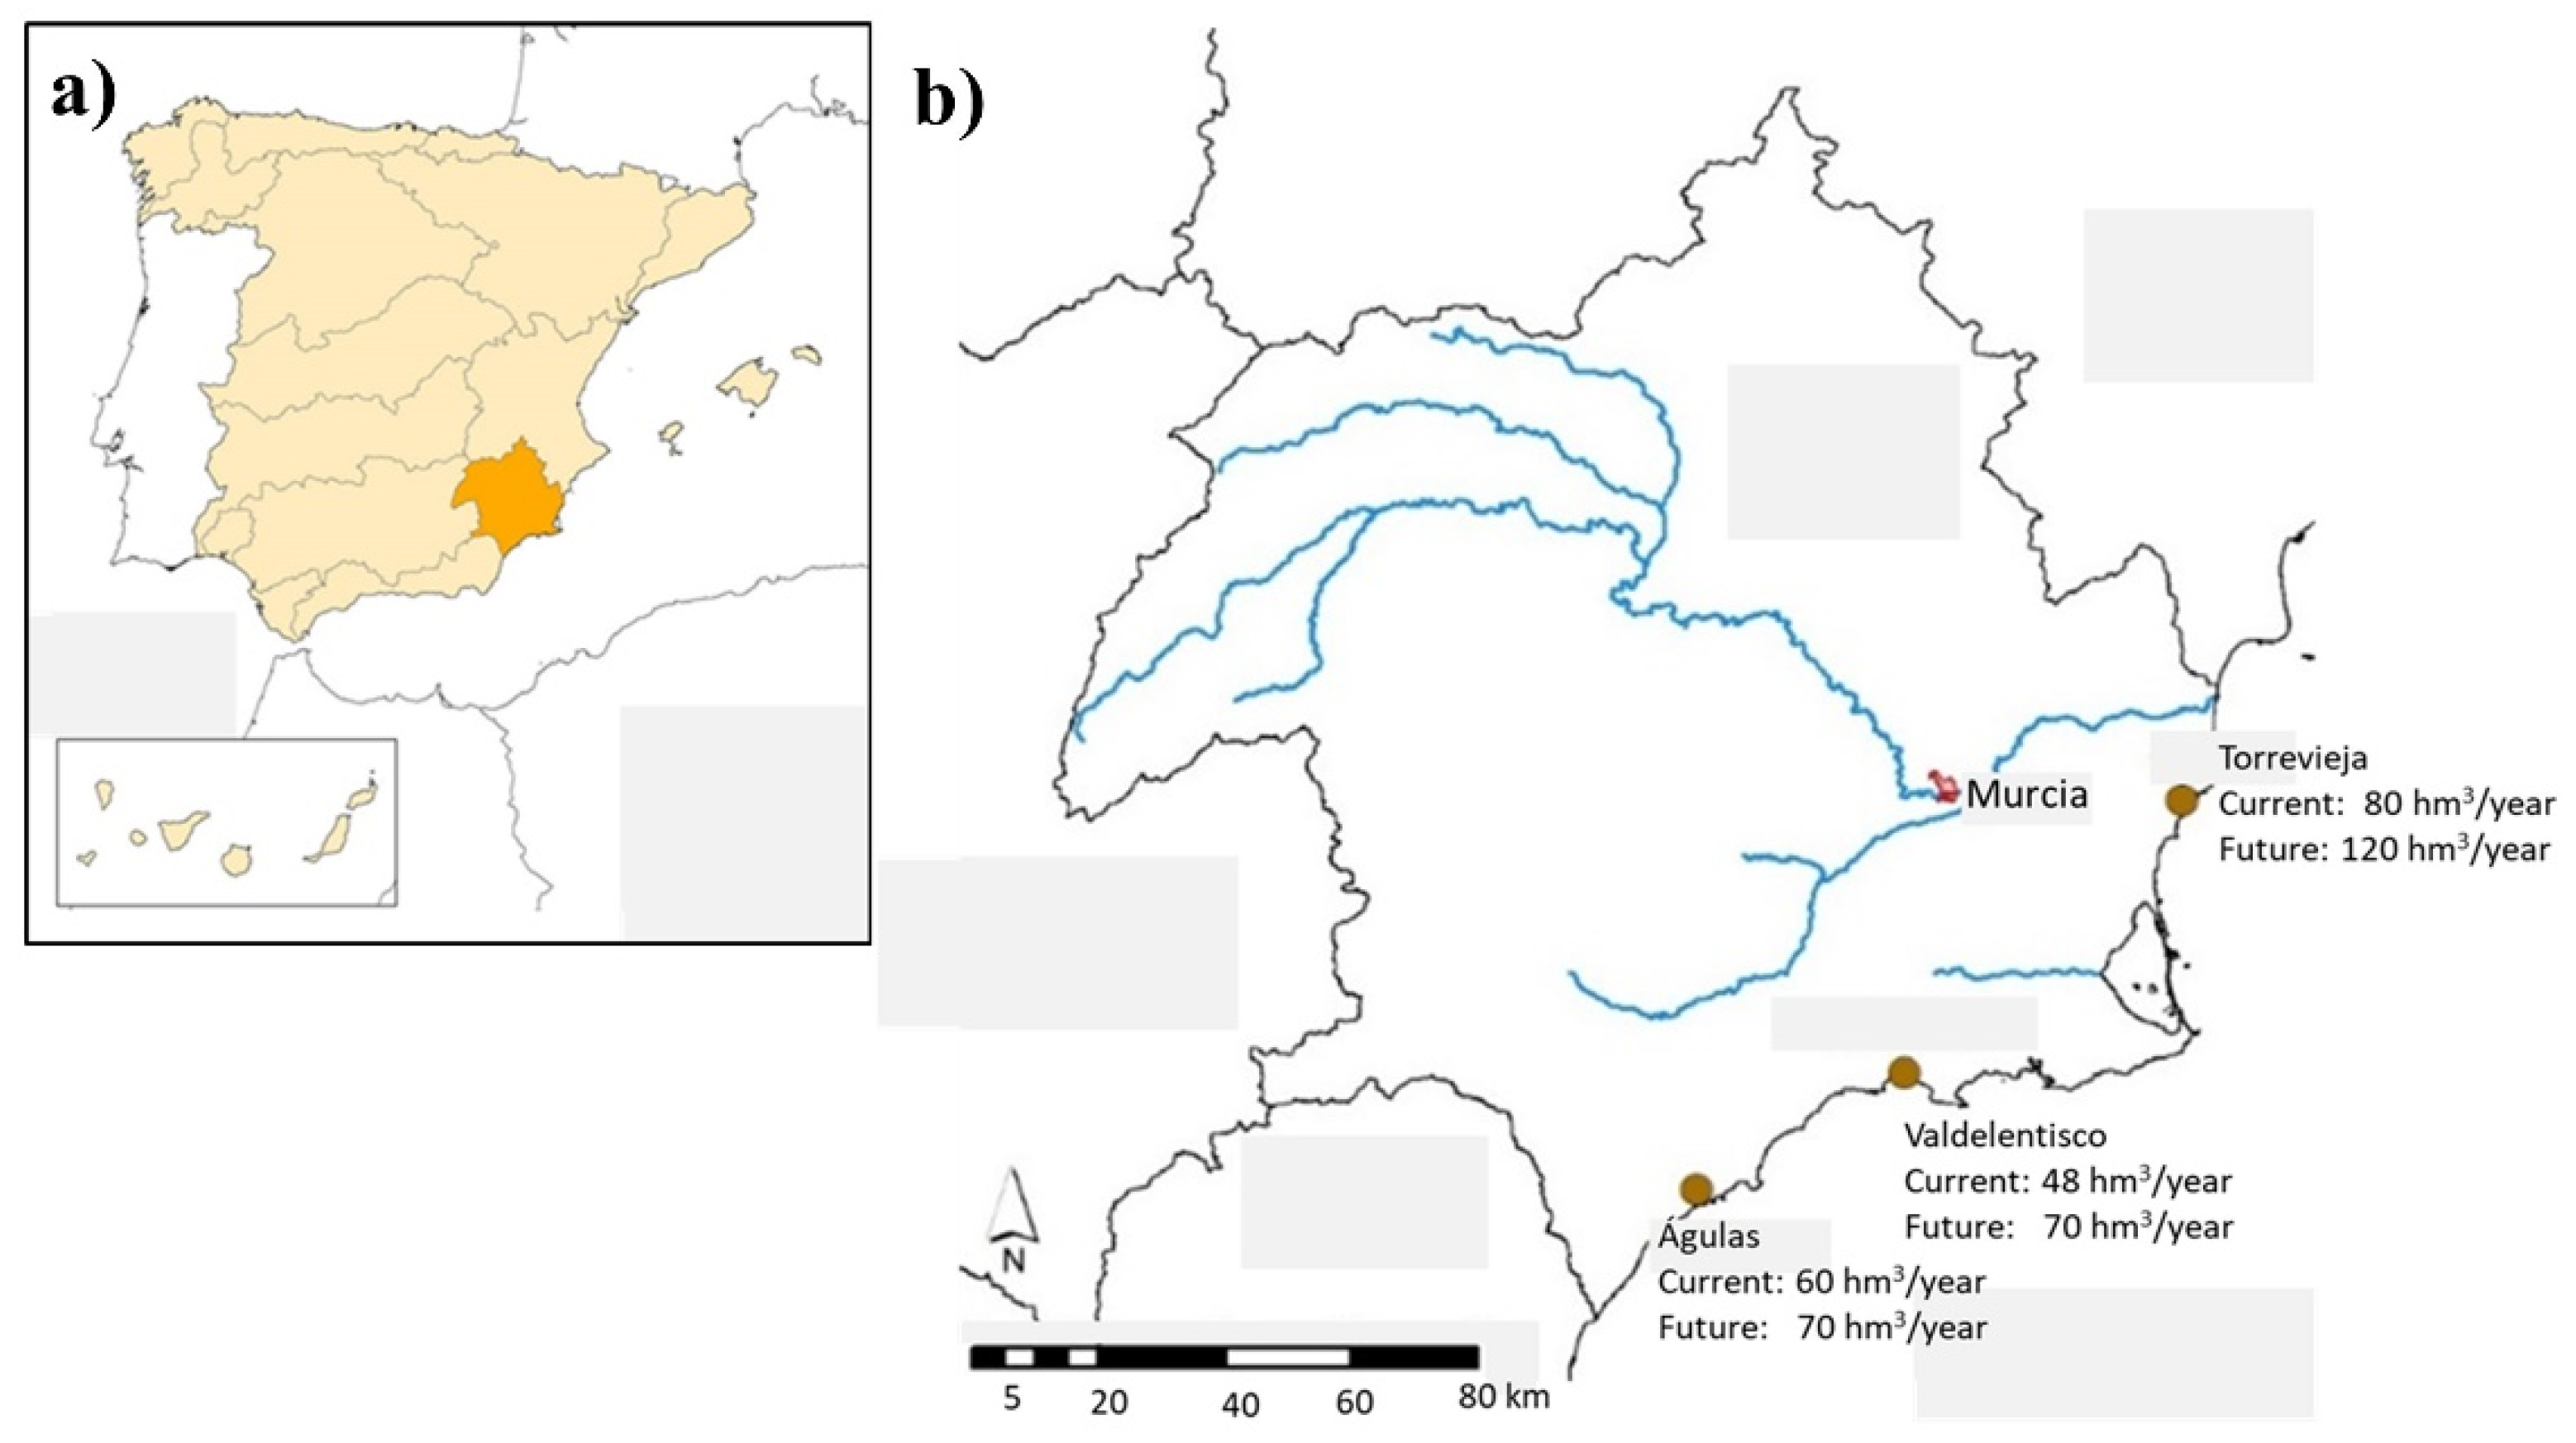
The Segura river basin district (SRBD) is located in the southeast of the Iberian Peninsula (Figure 3a). Its total area is 20,236 km2 and it includes the Segura river basin and other smaller basins that flow into the Mediterranean Sea between the Gola del Segura and the outflow of the Almanzora river.

Figure 3.
Segura RBD: (a) location in Spain of the RBD and (b) the three main seawater desalination plants.
Desalinated water in the Spanish southeast area is a key resource due, on the one hand, to the structural scarcity of resources in this area and, on the other, to the high guarantee offered by these resources, so much so that the volume generated in some desalination plants in this basin is close to the nominal facility capacity.
The SRBD suffers a structural water resources deficit, due the set of available resources in the river basin district that does not allow it to supply all the required demand-meeting guarantees. Thus, the current deficit is estimated at 310 hm3/year, which is partially supplied by the overexploitation of groundwater bodies, and the rest produces a deficit to irrigation demands, mainly those related to the Tajo–Segura transfer [44]. This situation may be aggravated by a foreseeable decrease in available water resources, both external resources from the Tajo–Segura transfer and its own resources due to aquifer overexploitation and the decrease in natural flows associated with climate change.
The SRBD currently has 13 seawater desalination facilities, 3 of which were constructed and are being exploited by the state company Acuamed. These three SWRO plants are Torrevieja, Valdelentisco, and Águilas (Figure 3b). With the aim of replacing non-renewable pumping from groundwater bodies and improving the water resources availability in irrigated areas that are supplied with resources transferred from the Tajo–Segura transfer, the SRBD has included in the measures program of its river basin management plan (RBMP) an important program to increase desalinated resources in these three plants. Thus, the Torrevieja plant is expected to increase its capacity from 80 to 120 hm3/year, that in Valdelentisco from 48 to 70 hm3/year, and the Águilas plant from 60 to 70 hm3/year. In addition, the Segura RBMP also includes the construction of photovoltaic plants, attached to the desalination facilities to reduce water prices, and a distribution network to supply water to all related users.
The average production costs (Table 2) for the current facilities’ capacity (188 hm3/year) are between 0.4283 EUR/m3 and 0.4856 EUR/m3, with a weighted value of 0.45 EUR/m3. The planned desalination plants expansion from 188 to 260 hm3/year allows for a reduction in specific costs in all plants, with a range that varies between 0.3850 EUR/m3 and 0.4670 EUR/m3, with a weighted value of 0.42 EUR/m3 [45].
Table 2.
Desalination plants in the SRBD.
The data corresponding to the situation of the expansion of the plants assume an energy cost of 45 EUR/MWh and are exempt from the recovery of the costs of the investment of the expansion thanks to the application of funds for the substitution of resources abstracted from water bodies in bad status.
The energy cost constitutes the main component of the total cost in all plants, since, considering the plants at full production, it is between 48% and 53% in the three plants studied in the current situation and between 54% and 59% in the case of the expanded plants. This is the reason that an energy cost reduction will mean an appreciable reduction in the final cost, making their use more attractive to potential users.
3.2. Methodology
The integration of the photovoltaic facility and the hydraulic plant combines energy generation, energy needs, and the economic optimization of the photovoltaic size facility (Figure 4). Four steps form the methodology proposed. Step one consists of obtaining solar irradiance (W/m2) and daily mean irradiation (KWh/m2-day). Step two is the solar facility design and energy generation in the facility. Step three combines energy generation with the energy needs of the desalination plant, obtaining energy destined for self-consumption, excess energy that can be sold to the grid (for sale), and energy required from the grid (for purchase). Using these three components, step 4 makes the economic optimization of the facility size, where the investment costs of the photovoltaic facility and the price of the energy are used.
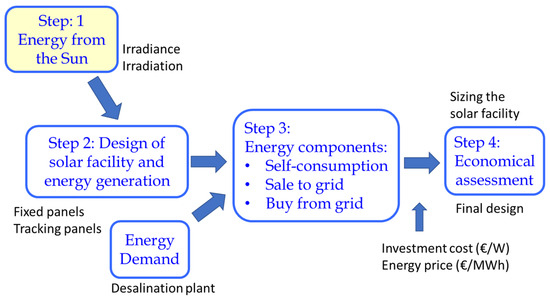
Figure 4.
Water facility and PV system integration.
Solar irradiance data under average cloud conditions and clear sky conditions are available from the European Commission’s PVGIS system (Photovoltaic Geographical Information System) [46]. From this system, irradiance data (W/m2) were obtained for each month and each hour at the selected location.
The photovoltaic facility is made up of the repetition of a basic unit of design, which is formed by one inverter and the solar module array that feed it. The solar module array is defined by the number of modules in series (Ns) in each string and the number of strings that are connected in parallel (Np). The solar module array produces a direct current, and the inverter transforms it into an alternative current. This basic unit is replicated as many times as the amount of energy to be generated.
The number of modules in series (Ns) and the number of strings in parallel (Np) are determined to optimize the inverter efficiency within its operating window and guarantee its safety. The number of modules in series (Ns) in each string is defined to increase the total direct current voltage in the string until the voltage is required by the inverter and also does not overpass the maximum voltage of the inverter. On the other hand, the number of lines in parallel (Np) increases the intensity of the direct current that reaches the inverter, and it is defined as not overpassing the inverter capacity. For this, extreme weather and solar radiation conditions are considered, given that, in cold conditions, the voltage in the solar modules increases, and this can cause the maximum voltage admissible by the inverter to be exceeded. Likewise, in clear day conditions, the irradiance is greater, and this produces a greater direct current that can exceed the maximum admissible direct current in the inverter.
Based on the facility design, number in series (Ns), and number in parallel (Np), the energy generation is determined for each basic unit, corresponding to one inverter, and it is replicated with as many inverters as desired to increase energy generation. Energy generation is obtained from the irradiance, applying the solar module efficiency, currently at around 22%, and the system overall efficiency, whose usual value is 0.75. The global system efficiency considers its global losses with an average value of 25%, which includes mismatch losses, ohmic losses, tracking losses of the maximum generation point, inverter efficiency, and losses due to dirt and dust.
The energy demand of the desalination plant is calculated by multiplying the freshwater amount by the specific energy consumption coefficient. In this phase, energy generation is combined with energy demand to determine the three components of energy, which are: energy generated and used in the desalination plant (for “self-consumption”), excess energy that can be fed into the grid (for “sale”), and the necessary energy that is purchased from electrical grid (for “purchase”).
In the general case, in continuously operating facilities, energy purchase occurs during hours without or with low PV generation, corresponding to the night or evening hours, when, in this latter case, the energy price is highest. During peak generation hours, in some facilities, the demand can be exceeded, resulting in excess energy that can be fed into the electrical grid. This excess energy can offset the need to purchase energy at night or during the hours of higher prices.
4. Results and Discussion
4.1. Solar Irradiance
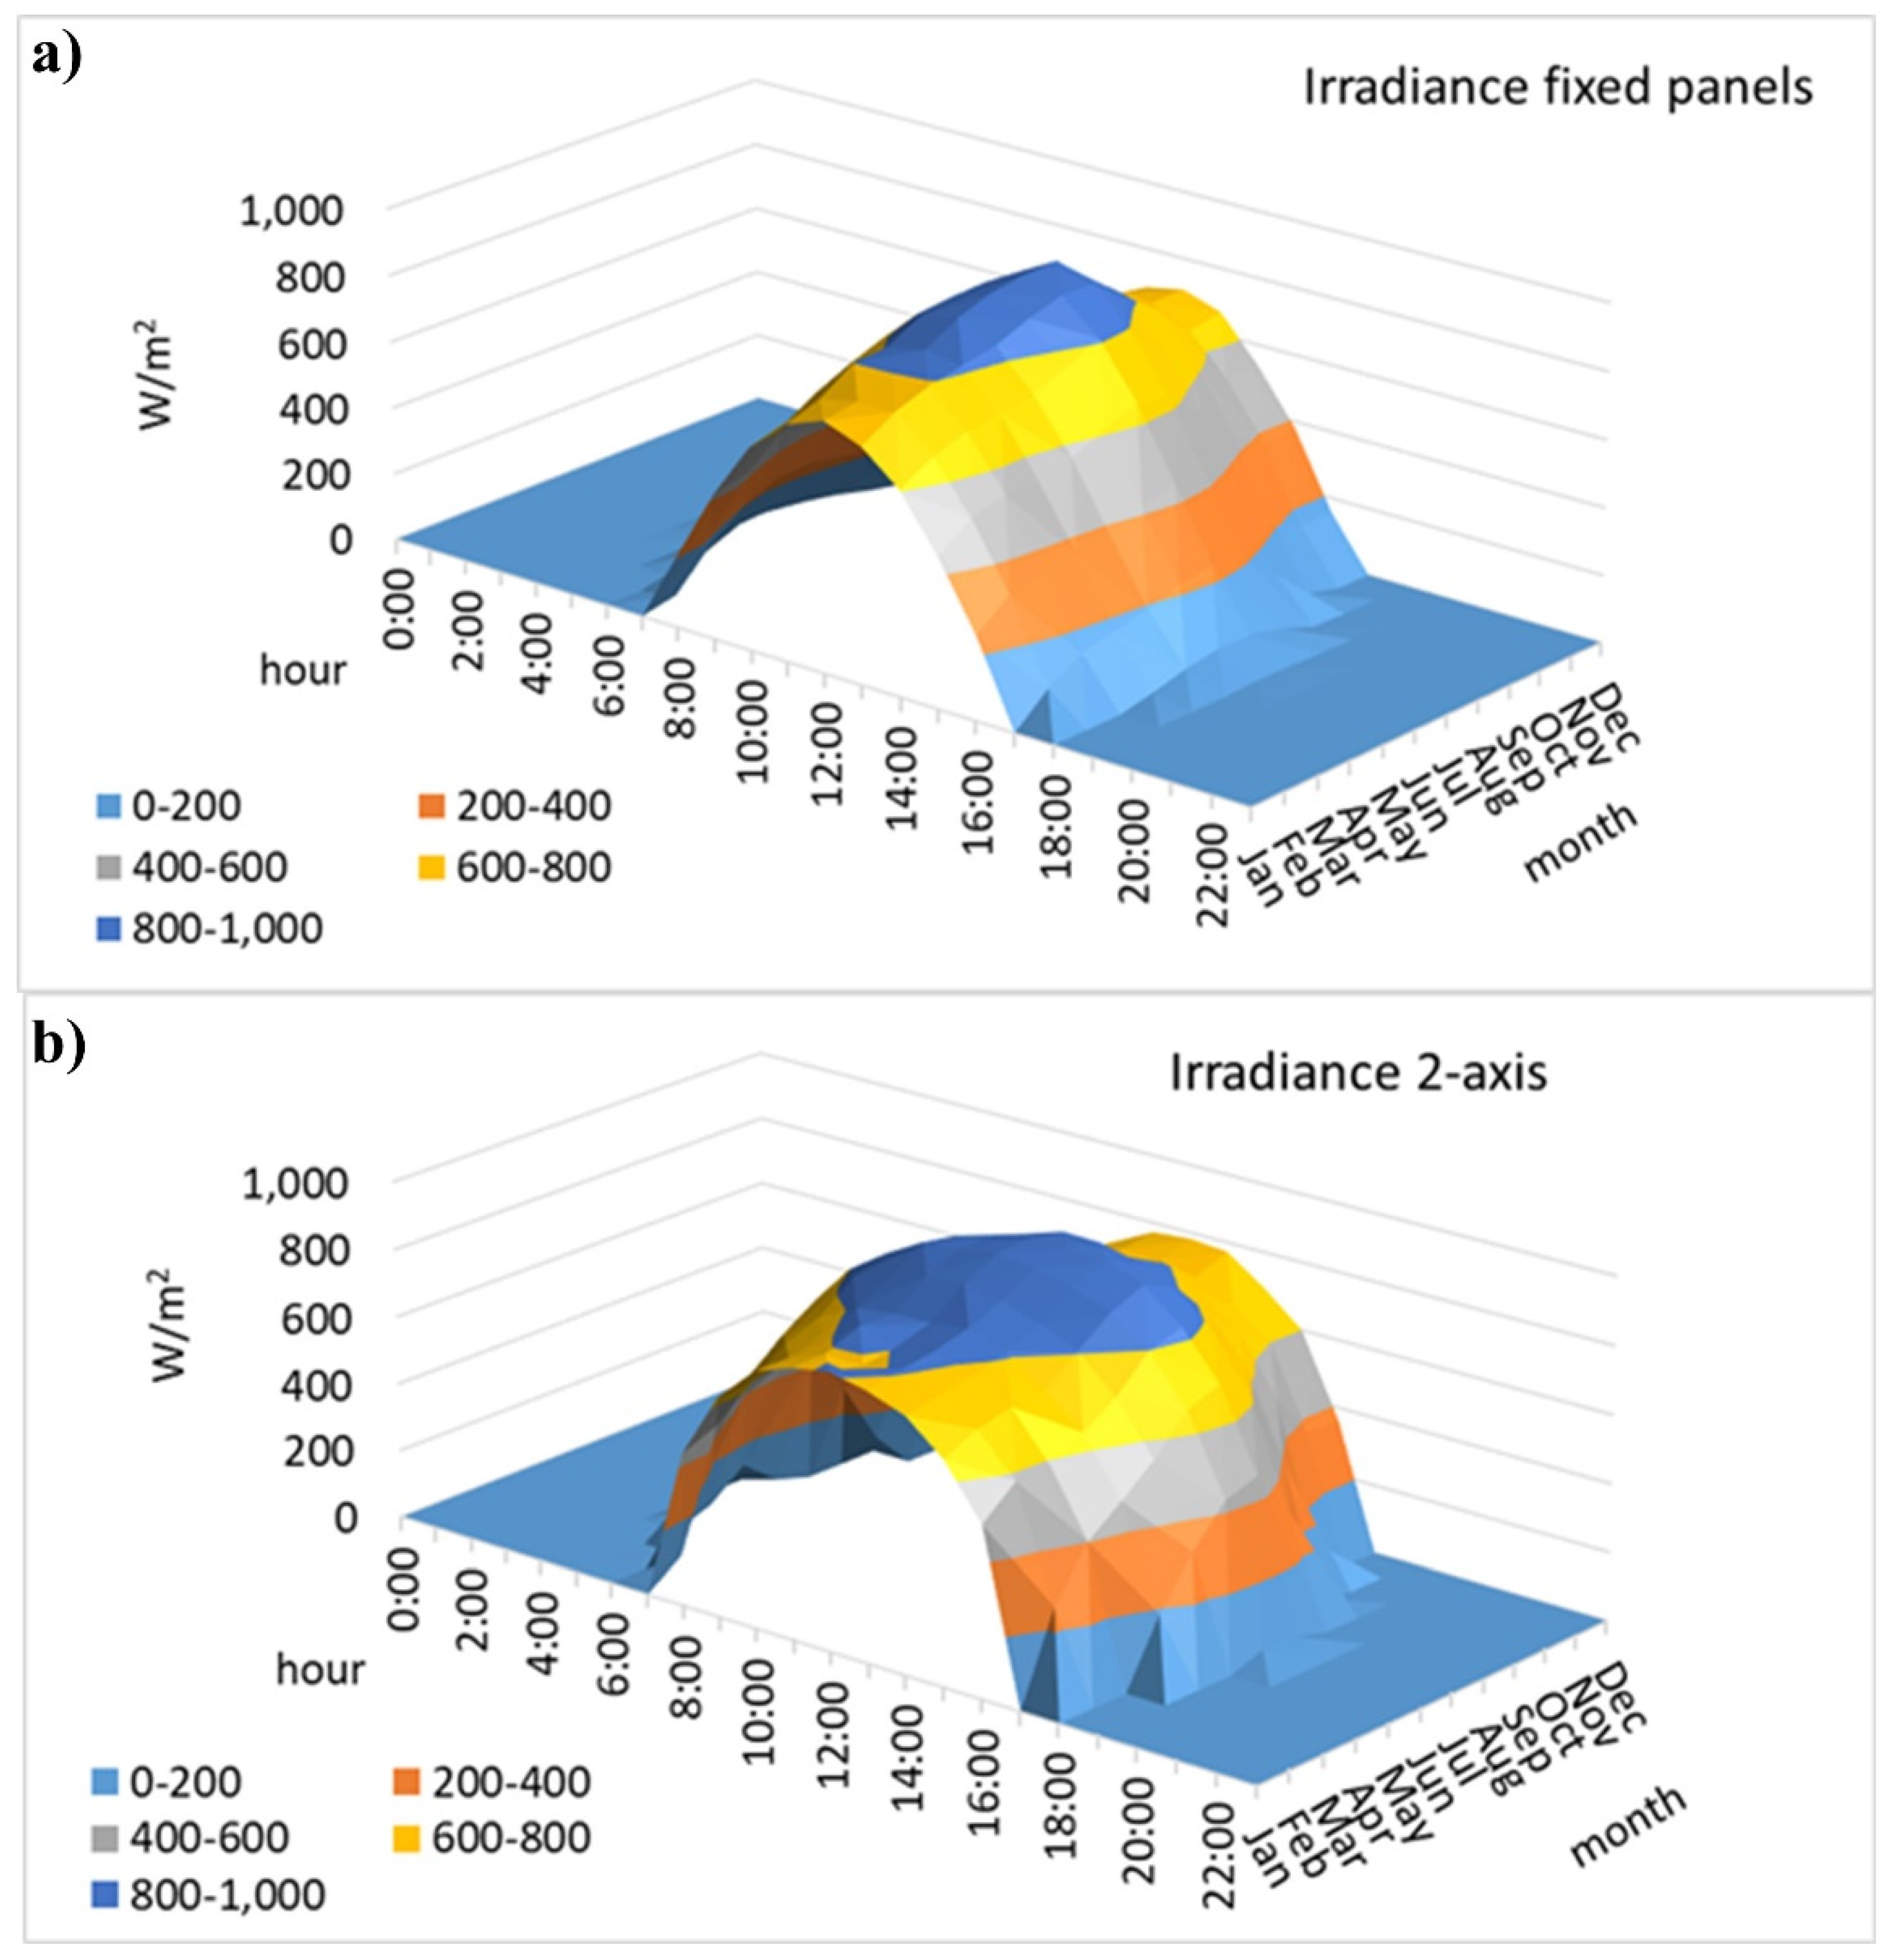
PVGIS provides solar irradiance for fixed panels with an optimal angle (Figure 5a) and for panels with two-axis tracking (Figure 5b) in the area close to the desalination plants. In fixed panels, the optimal angle for this location is 35°, and irradiance reaches a maximum value of 950 W/m2 at midday in July with average cloudy conditions. Irradiance under clear sky conditions, i.e., cloudless days, reaches 1,050 W/m2. The average daily energy, i.e., irradiation, with fixed panels is 5.8 kWh/m2-day, while the average energy received with two-axis tracking is 7.9 kWh/m2-day. In equivalent terms of sunshine hours per day, considering an irradiance of 1,000 W/m2, two-axis solar tracking represents an increase from 6 h to 8 h of sun per day, which increases the period in which the facilities can be self-supplied with solar energy.

Figure 5.
Irradiance (W/m2): (a) fixed panels with the optimal angle of 35° and (b) two-axis panels.
Solar tracking increases the amount of time in the day that the solar modules receive radiation more perpendicularly and, therefore, produce greater amounts of energy during more hours, supplying consumer facilities for longer. Currently, uniaxial/single-axis tracking is being implemented more and more, by increasing the energy received without a considerable increase in investment. In horizontal single-axis tracking systems, the PV panel tilt angle is adjusted to maximize the overall irradiance harvesting, which is dependent on the real-time monitoring data and serials of pre-set control rules [47]. These systems produce an increase of around 15~20% in PV electricity generation [48]. The effect of east–west horizontal single-axis tracking is found to be better than that in the north–south direction [49].
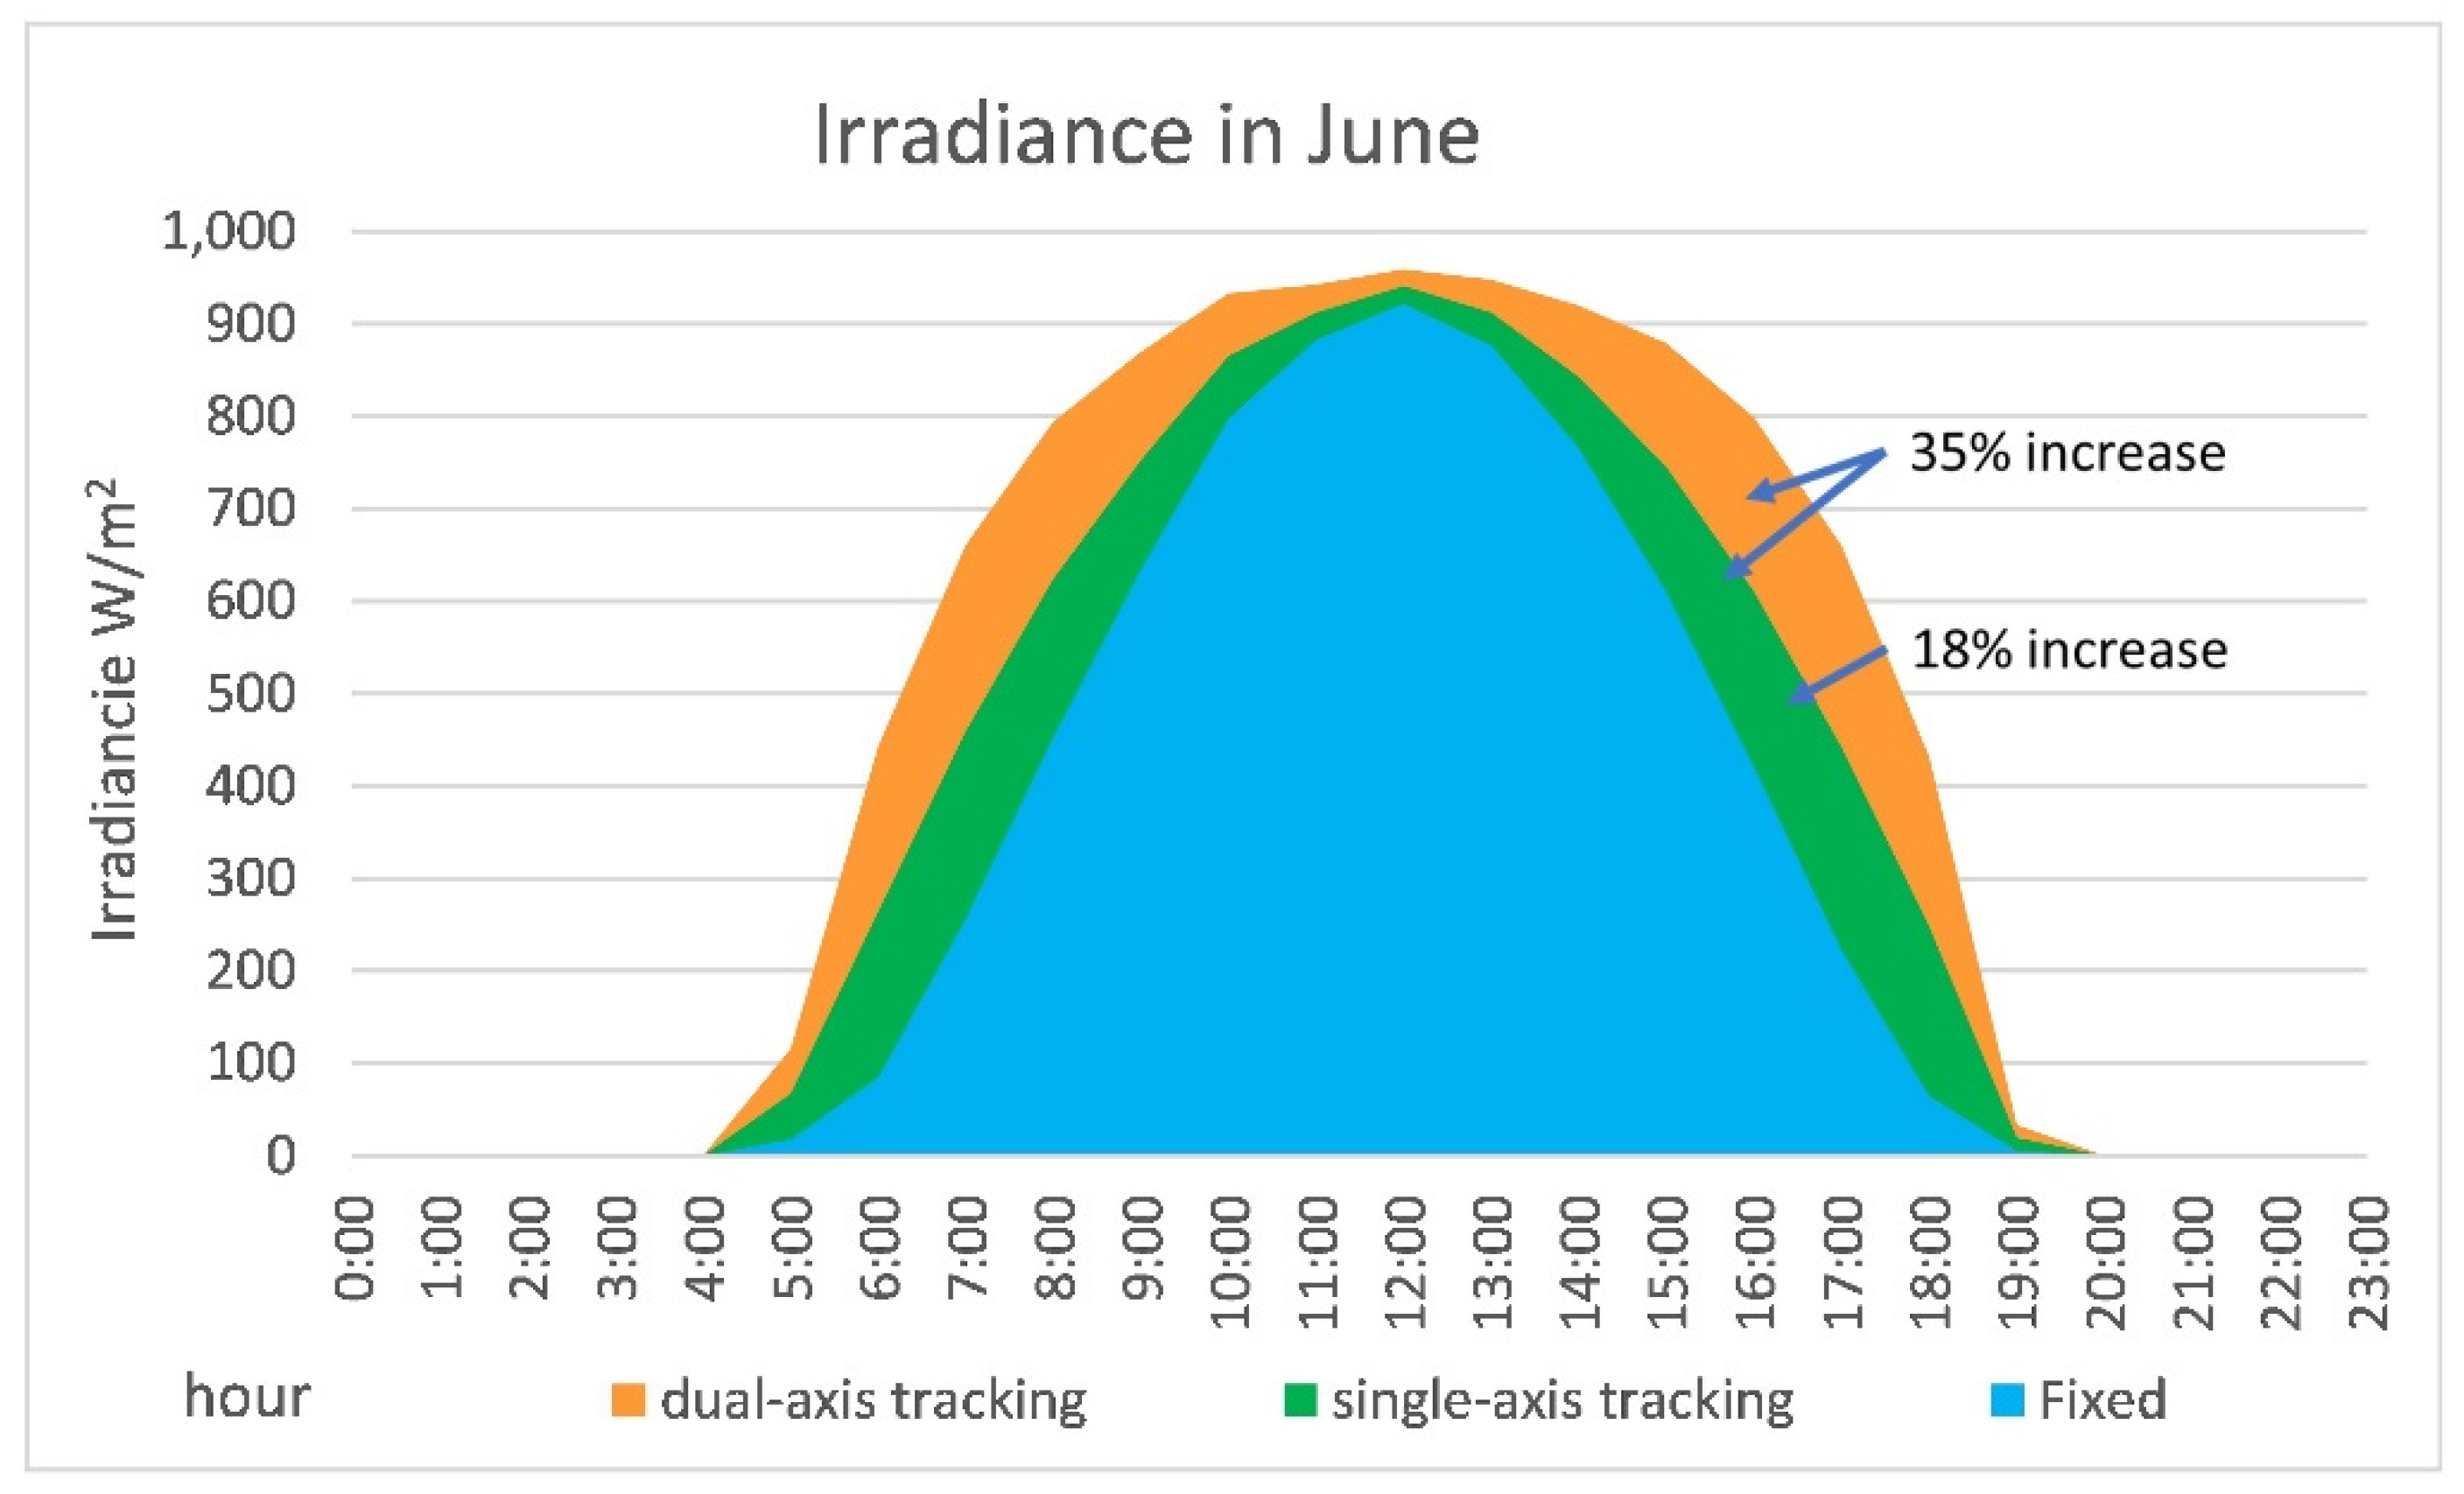
The energy received with horizontal single-axis tracking systems was estimated as an intermediate situation between the available solar radiation data for fixed panels with the optimal angle and panels with the dual-axis tracking system (Figure 6).

Figure 6.
Irradiance (W/m2): fixed panel with the optimal angle of 35°, horizontal single-axis tracking systems, and dual-axis tracking system for June.
The total daily energy, i.e., irradiation (kWh/m2-day), for panels with horizontal single-axis tracking is obtained as a daily sum of the irradiance (W/m2) and varies from 5 kWh/m2-day in December to 9 kWh/m2-day in July, with an average annual value of 6.9 kWh/m2-day. This average value is equivalent to 7 h per day at maximum power. A horizontal single-axis tracking system is equivalent to increasing the plant’s self-consumption capacity by one hour compared to having fixed panels, increasing from 6 h to 7 h equivalent per day.
4.2. PV System
The total specific energy consumption of plants varies between 3.67 kWh/m3 and 4.00 kWh/m3 [50], with a weighted consumption of 3.93 kWh/m3 (Table 3). Plants are considered to operate at maximum capacity; so, energy consumption has a constant distribution throughout the day and the year and produces an annual energy consumption of around 1000 GWh-year.
Table 3.
Future annual production (hm3/year), specific energy consumption (kWh/m3), and annual total energy consumption (GWh-year).
A photovoltaic facility is defined as the installation of photovoltaic bifacial modules mounted in horizontal single-axis tracking systems. The solar modules considered had a power of 670 W and an efficiency of 21%. The arrangement of bifacial solar modules, which receive direct and diffuse radiation on the front side and reflected and diffuse radiation on the back side, can increase energy generation by up to 25%, compared to the same monofacial modules. In any case, for latitudes above 40° and when the albedo is higher than 0.12 for latitudes below 40°, bifacial AMO (any module orientation) designs are, in general, more cost-effective than monofacial AMO systems [51]. Furthermore, facilities with bifacial modules with horizontal single-axis tracking can increase generation by 35% and reduce the LCOE (levelized cost of energy) in most of the world [52].
The distance between the solar module lines is determined to minimize the shading losses that one line produces to the next line and improve environmental integration in the landscape. Calculations can be carried out through simulation or through approximate formulations that determine this distance. The GCR (ground coverage ratio) is an indicator that determines the square meters of useful panels for each square meter of occupied land [53], and typical values of the CGR range from 0.3 to 0.6. Lower CGR values produce a greater separation between solar modules, reducing shading losses and increasing the environmental integration of the facility; on the contrary, land occupation is greater, and so is their cost.
A common value based on economic optimization and lower land occupation for latitudes in Spain is CGR = 0.5, which means that, for each square meter of useful panel, 2 square meters of occupied land are required (GCR = 0.5 and ROT = 1/GCR = 2). In this case, for a better environmental integration, the solar modules are arranged with a separation corresponding to GCR = 0.3, which means that 3 square meters of land are occupied for each square meter of useful panel. The increase in this distance allows the inclusion of plantations throughout the photovoltaic installation of native vegetation, increasing the availability of wildflowers in the environment, which represents a refuge for pollinators (bees, butterflies, etc.), or developing agrovoltaic power in the facility through, for example, the inclusion of beekeeping in some areas of the facilities. This element represents a long-term benefit for the environment and the local economy where photovoltaic facilities are implemented.
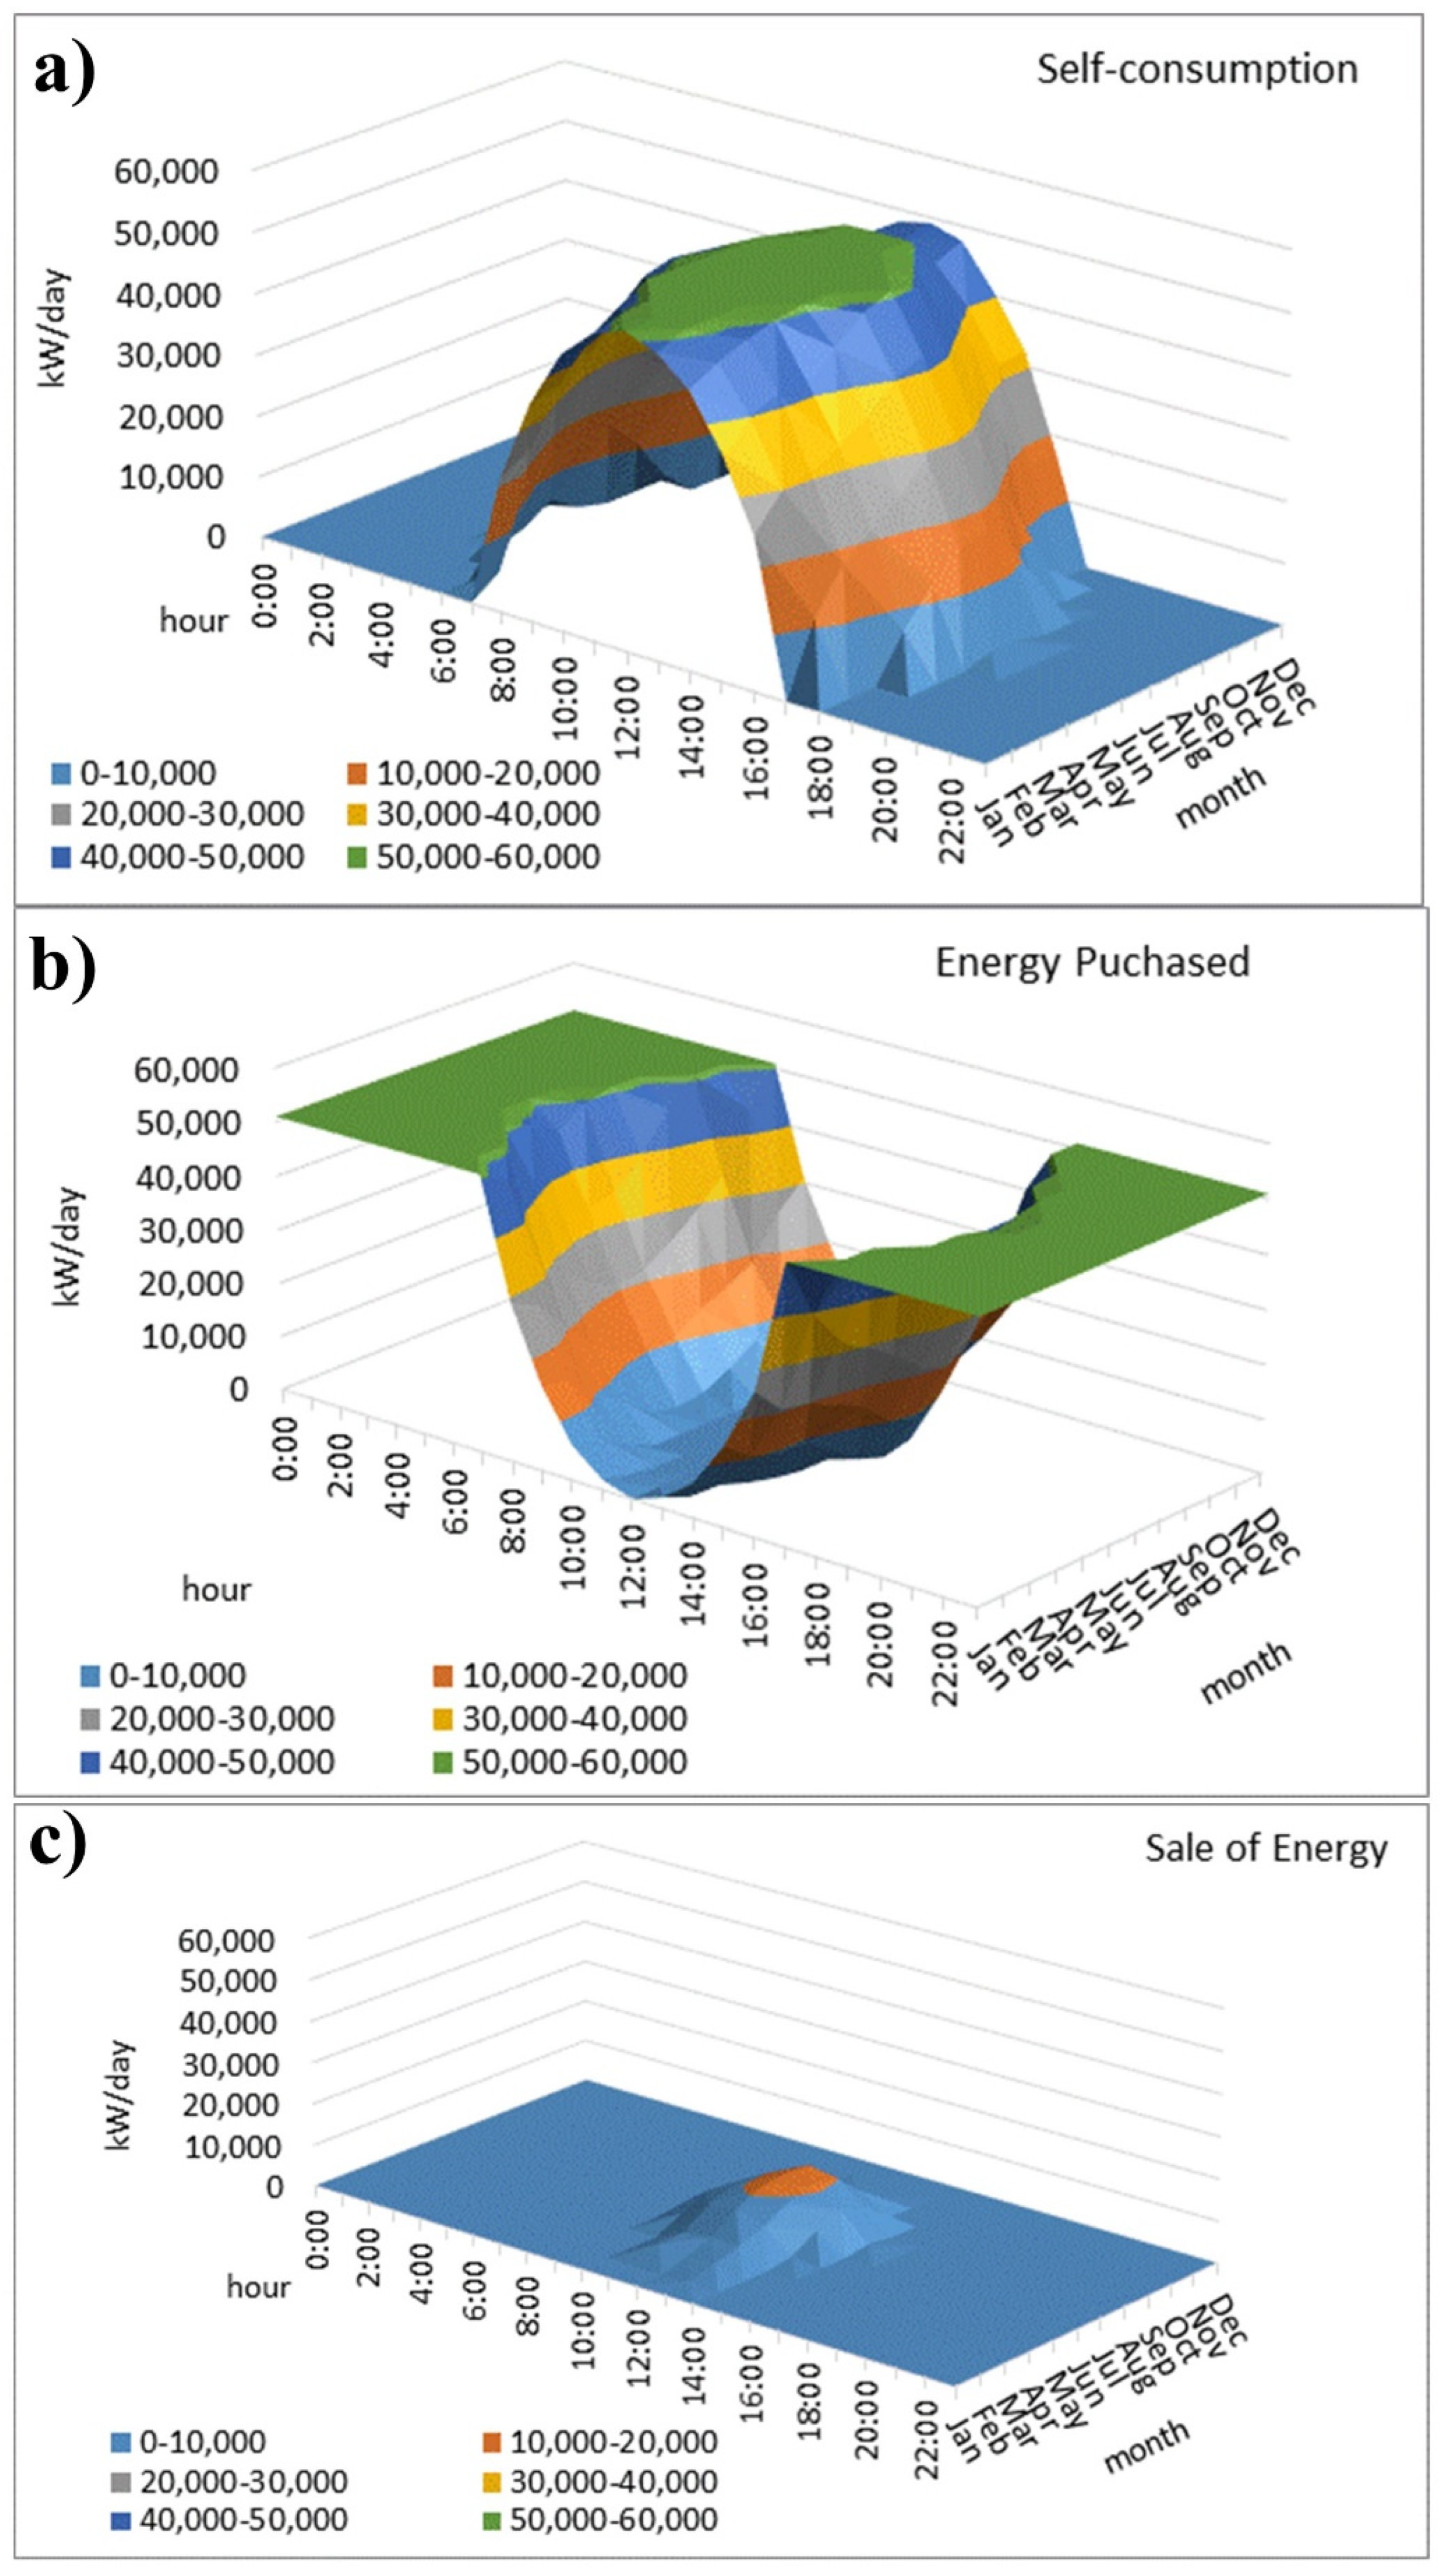
The economic optimization of the facility is carried out through multiple simulations for different facility sizes. It considers the investment cost of the solar facility and the savings in the energy cost generated for each size of the solar installation. Each simulation obtains energy generated, and the following three terms are determined: the self-consumption energy, the energy required from the grid (purchased energy), and the excess energy that could be fed to the electrical grid (Figure 7c).

Figure 7.
Simulation results: (a) self-consumption, (b) purchased energy, and (c) energy sold to the grid for the Torrevieja facility with 90 MW.
The energy generated and destined for the desalination plant, i.e., self-consumption, is generated in the central hours of the day, following the irradiance shape (Figure 7a) and with a plateau in the center corresponding to the point at which generation exceeds the energy needs. The energy purchased from the grid (Figure 7b) is the energy necessary to supply energy to the desalination plant completely and is obtained mainly during the hours with less solar radiation and at night. The energy that could potentially be fed to the grid is the excess generation above the maximum energy demand and is developed mainly in the central hours of the day in summer, when there is a greater solar irradiance.
These three energy terms are associated with different economic values. Self-consumption and energy purchases from the grid are considered equal to the electricity price. In this case, it is considered, a priori, that the facility cannot feed energy to the grid; so, this term becomes null in the economic analysis and does not produce any income.
It is considered that the photovoltaic facilities can supply approximately 25% of the total energy consumed by the desalination plants; so, these facilities will continue to be connected to the general electrical grid from where they will obtain the energy necessary to operate the rest of the hours.
Regarding the location of the photovoltaic facilities, it is not necessary to put them beside the desalination plant, where maybe there is no space available, land costs are high, or access to the electrical grid is complicated. Given the significant surface area they will occupy, the final location will be selected in the project, taking into account the results of the environmental evaluation process.
4.3. Economical Assessment
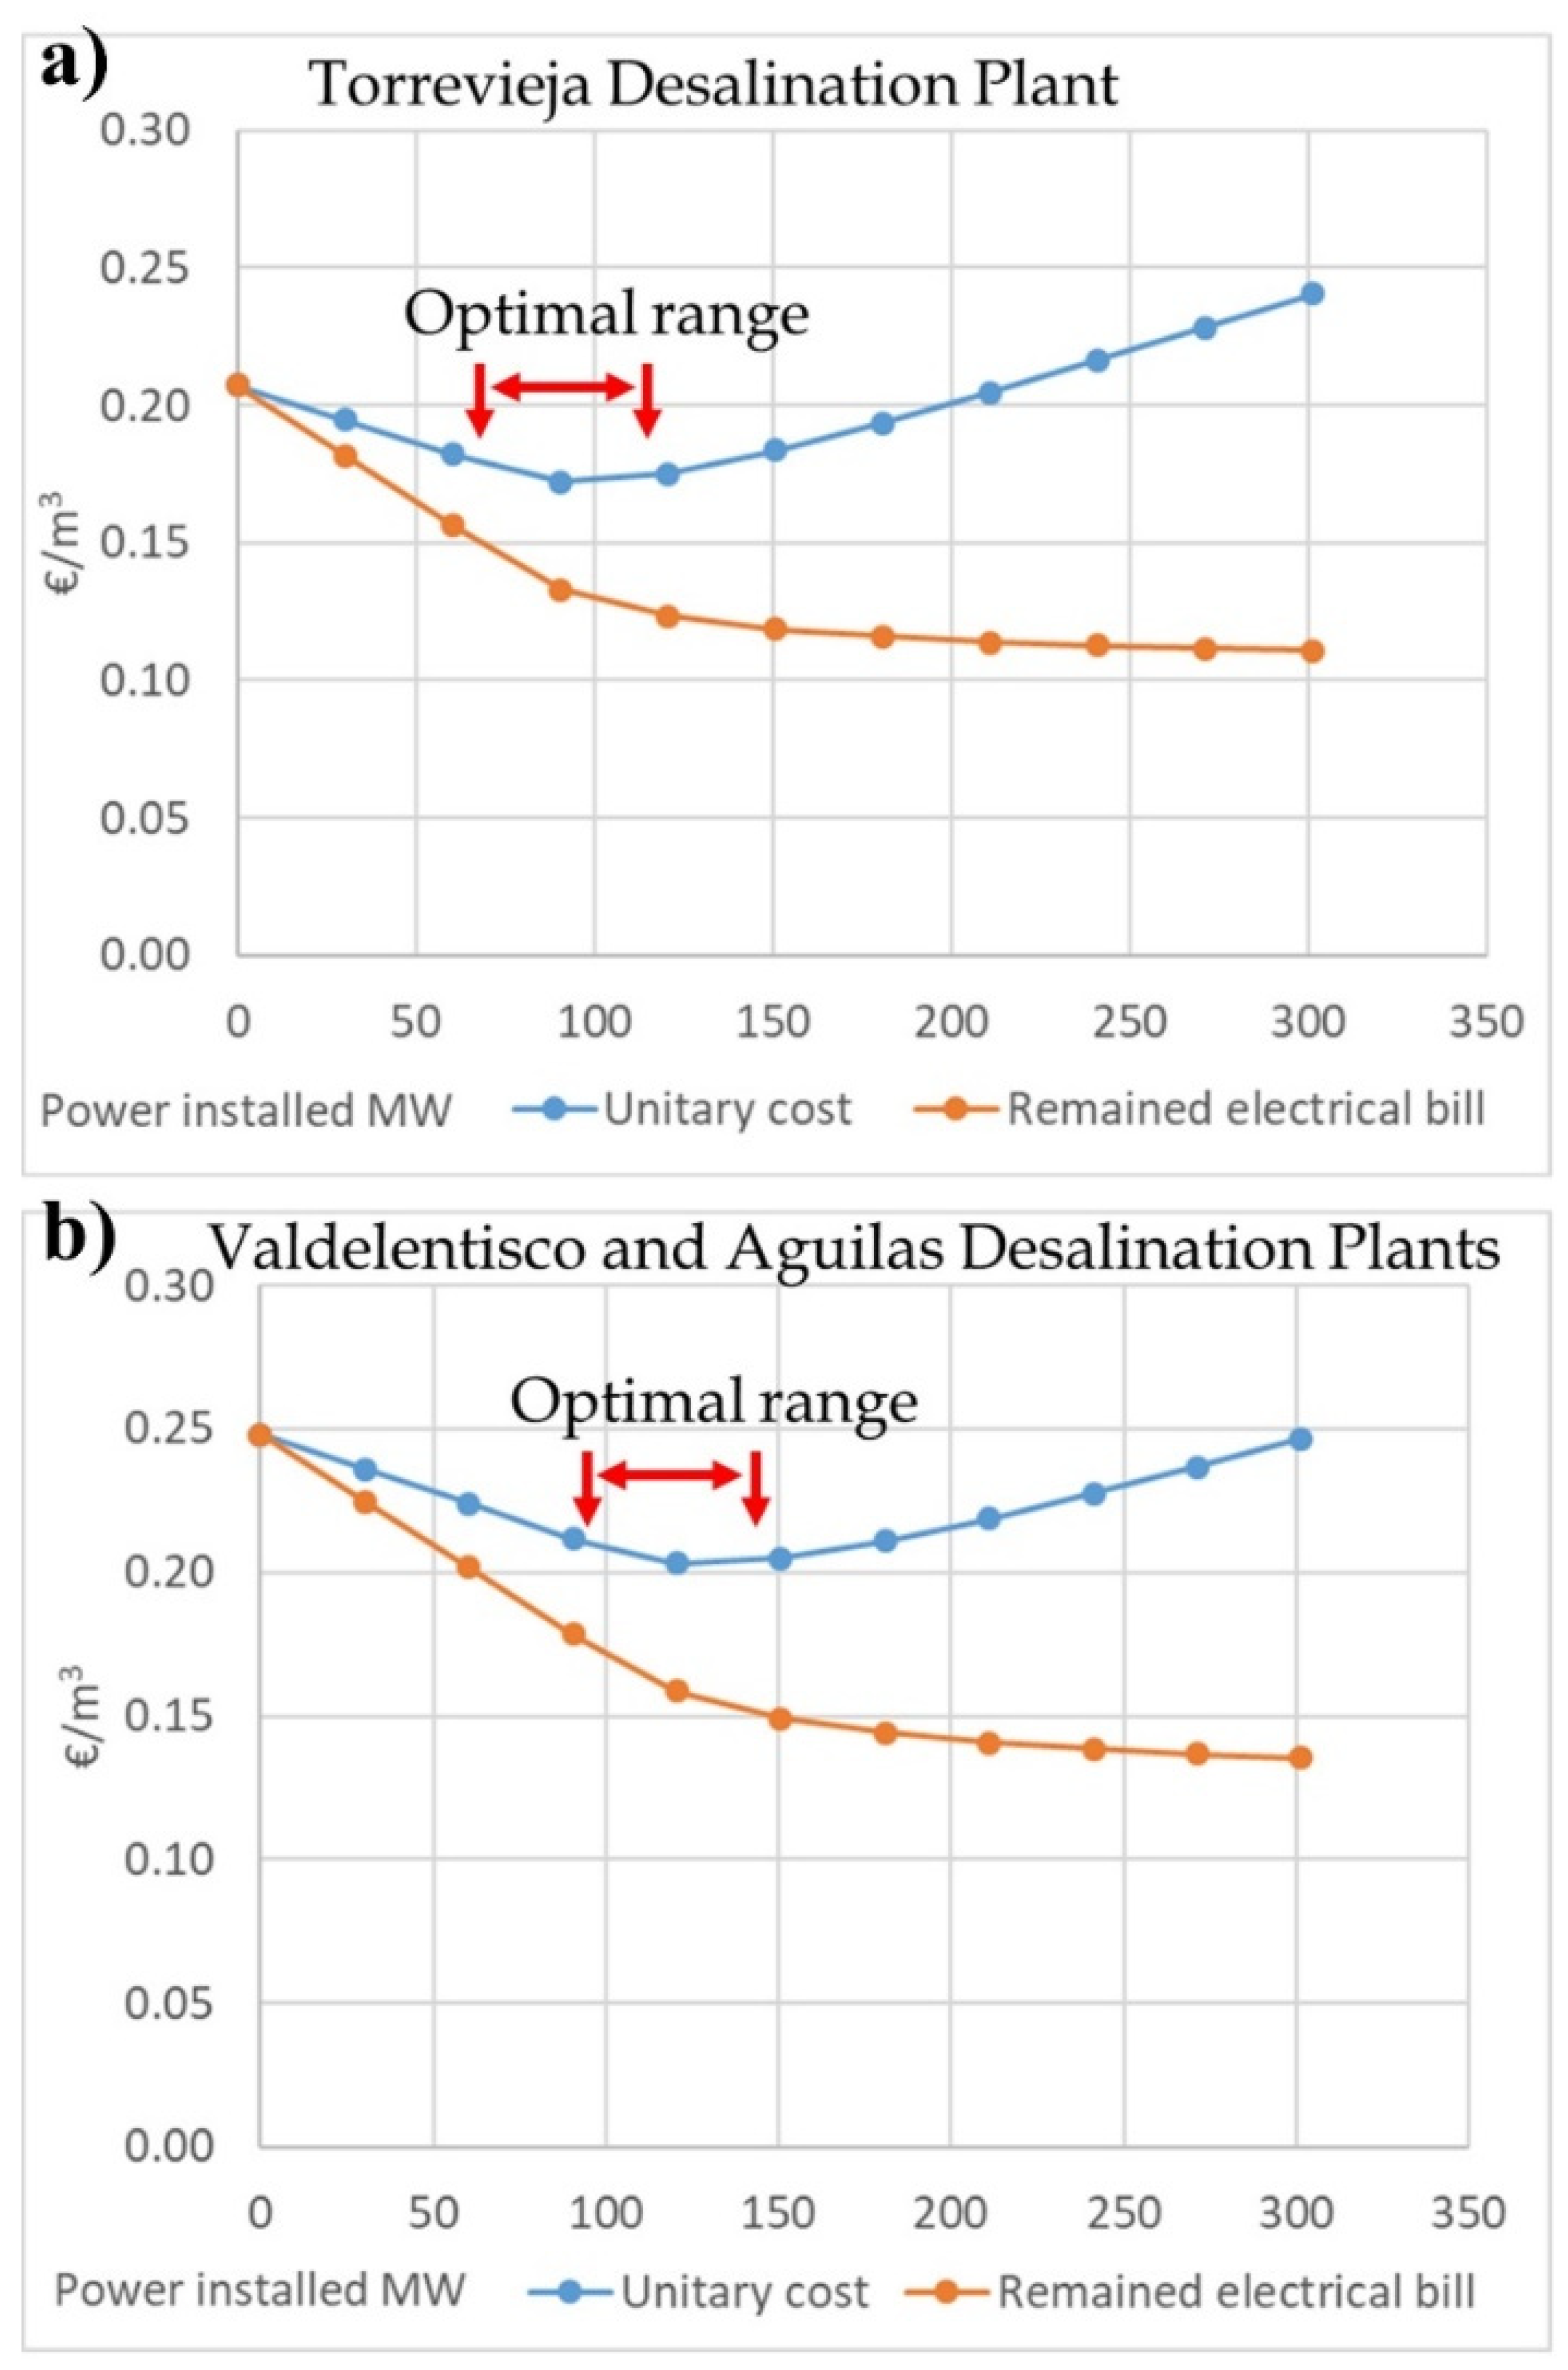
The economic optimization of the photovoltaic facility size defines the range of facility sizes where the energy cost to produce water is minimal. This is carried out through simulations for different sizes of photovoltaic facilities and its economic assessment in each case, obtaining, in each simulation, the energy cost of producing water and the electricity bill that remains (Figure 8). Economic assessment includes the investment in and the operation costs of the photovoltaic facility and the income produced by savings from energy self-consumption. Income related to excess energy that can be fed to the grid are nullified.
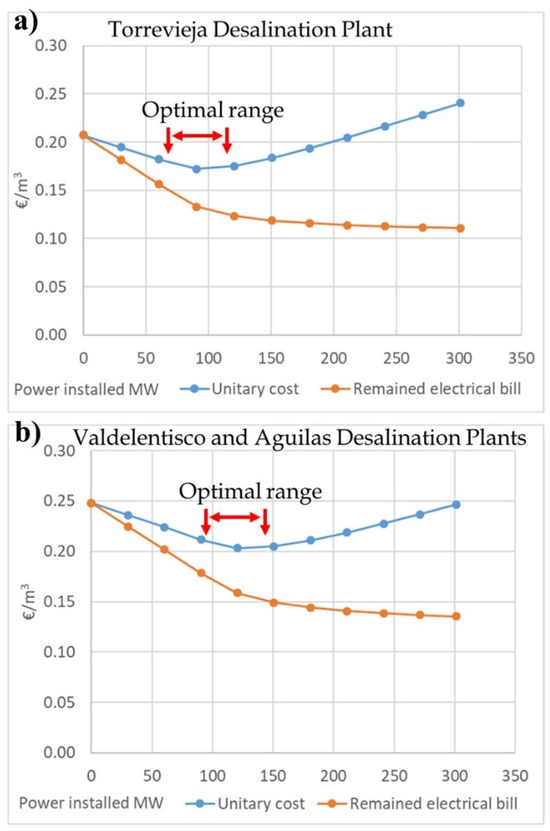
Figure 8.
Unitary cost of energy (blue line) and electrical bill that remains (orange line) related to PV power installed for (a) Torrevieja (120 hm3/year) and (b) both plants of Valdelendisco and Águilas (140 hm3/year).
The total cost of the photovoltaic facility is made up of two components: investment cost and annual operation and maintenance cost. The investment cost was calculated by applying an average unit cost of 1.15 EUR/W to the power installed (Table 4). This total investment cost includes the buying cost of the elements (solar module and inverter) and land condition and the assembly at 0.85 EUR/W. The rest of the total cost components are general business expenses (13%), industrial profit (6%), and the land cost (16%).
Table 4.
Different components of the investment cost for the photovoltaic facilities.
An investment cost of 0.85 EUR/W is considered conservative, much higher than the values used in other studies of 0.46 EUR/W [54], or at the upper end of the range collected in these studies, between 0.55 and 0.65 EUR/W. The increasingly growing market for the implementation of photovoltaic solar facilities has caused average costs to be lower in recent years, with some recent uncertainties due to the increasing price of raw materials; so, currently, these costs could be much lower.
The annual operation and maintenance cost of the photovoltaic facility is defined in a range between 0.5% and 2.0% of the investment cost; so, it depends on the facility size. Larger facilities have a greater scale economy, and therefore, the operation and maintenance cost ratio can also be lower. The operation and maintenance cost is defined, in this case, at 0.5% of the investment, based on the average costs of the previous installations studied for large facilities where a significant economy of scale occurs [7,10].
The economic results show how changes in the total energy cost of desalinated water generation (blue line) and its decomposition between the electricity bill that remains (orange line) and the amortization and operating expenses of the photovoltaic facility for different sizes. In the initial case, in which there is no photovoltaic facility (power installed = 0), the total energy cost is equal to the energy bill. On the other hand, as a larger photovoltaic facility is implemented, the distance between the remaining electrical bill (orange line) and the total cost (blue line) is greater since it corresponds to higher amortization and maintenance costs. The remaining component of the electric bill always decreases due to the fact that less and less energy is purchased from the grid.
In the first zone, larger facility sizes reduce both the total energy costs and the remaining electricity bill. In the second zone, the total energy cost stabilizes, and in the third zone, the total energy cost increases due to investment costs growing faster than the reduction in the electrical bill. In this way, the economic optimum area would be in the zone in which the total cost curve is more horizontal.
In the Torrevieja facility, with a production of 120 hm3/year, the optimal zone for photovoltaic facility size is between 60 and 120 MW and the land occupation required is between 100 ha and 200 ha. In this case, the total unit energy cost drops from 0.21 EUR/m3 to 0.17 EUR/m3, which represents a 17% reduction in the total energy cost. The electricity bill that remains is reduced from 0.21 EUR/m3 to 0.13 EUR/m3, which represents a 36% reduction in the electricity bill.
For both the Valdelentisco and Águilas desalination plants, the economic optimum zone is located for a facility size between 80 and 165 MW and its land occupation between 140 ha and 280 ha. In the economic optimum, the total energy cost is reduced from 0.25 EUR/m3 to 0.20 EUR/m3, which represents a reduction of 18%. Finally, the electricity bill is reduced to 0.16 EUR/m3, which represents a reduction of 36%.
Inside the defined range of the facility sizes, the results obtained are strongly conditioned by two main elements: the investment cost and the price of purchased energy. Lower investment costs make the installation more profitable, and the reduction in the electricity bill is greater. The investment cost considered (1.15 EUR/W) is higher than the costs used in other works, which could be in the range of 0.72–0.85 EUR/W; so, the use of lower costs will afford more favorable results. In the second case, the price of the purchased energy, the increase in the energy price increases the savings obtained with the photovoltaic facility. However, the opposite happens if energy prices fall.
There are other economic indicators, such as payback, i.e., the number of years in which the investment is recovered, which is between 15 and 16 years. The larger size of the facility leads to a lower profitability and, therefore, a higher payback, but also the electricity bill will lower in the operation phase of the facility.
4.4. End-User Agreements
With the aim of setting competitive prices for desalinated water under a scenario of inflationary tension and the sudden increase in energy prices caused by the crisis in Ukraine, different strategies were analyzed to reduce the water cost, considering different price forecasts of energy in the medium and long term.
Thus, the desalinated seawater cost was estimated under different hypotheses of capacity production, integration of photovoltaic solar energy, percentage of exemption in the cost recovery of new infrastructures, and the future price of energy.
The hypotheses considered are: the current and future capacity of the desalination plants; without solar photovoltaic energy support and with solar photovoltaic energy support, even with storage; with an exemption from the recovery of the investment costs of photovoltaic plants of 80%; and with different future energy costs of 45 or 80 MWh.
The different simulations showed a wide range of values for the total cost of water: 0.316–0.562 EUR/m3 for Torrevieja, 0.373–0.645 EUR/m3 for Águilas, and 0.326–0.593 EUR/m3 for Valdelentisco. The highest value corresponds to the current capacity of the facilities, without photovoltaic support and an energy price of 80 EUR/MWh. The minimum result corresponds with the expanded plants, with support for photovoltaic solar energy with accumulation, exemption from the investment costs recovery of 80%, and electricity price of 45 EUR/MWh.
Later, the energy accumulation was discarded due to the high investment cost. During the negotiations of the agreements with the end-users, the final cost of desalinated water (Table 5), which defines the tariff of water, was obtained considering the expanded desalination plants with photovoltaic support without accumulation, with an investment cost recovery exemption of 100%, and with an electricity price of 40 EUR/MWh, which, at the time the end-user agreements were put in place, was the price that seemed most predictable in the long run. This choice appears to be correct considering the evolution of the energy market since then, which was the rate that was assumed for irrigation users during the period.
Table 5.
Final water cost and savings according to the photovoltaic facilities.
With the incorporation of photovoltaic renewable energy plants, water costs range between 0.33 and 0.40 EUR/m3 for plants at a full load in contrast with the values between 0.39 and 0.47 EUR/m3 of the expanded plants without integrating photovoltaic solar energy. This reduction represents a saving of EUR 6–9 cents.
Regarding the water costs from the current plants, plant expansion and photovoltaic facilities produce savings between EUR 5 and 11 cents, which has made it possible to come to an agreement with agricultural users for the use of desalinated water that represents a 24% reduction in the cost of desalinated water for the Torrevieja plant.
Since 1 January 2023, irrigators who use water from the Águilas, Valdelentisco, and Torrevieja desalination plants already benefit from affordable rates (Table 5) thanks to the approval of the governmental order [55] that reflect these prices.
This temporary exception to the principle of cost recovery will include the period necessary to guarantee the efficient performance of seawater desalination facilities with solar energy support at sustainable and affordable costs for users with rights to use the desalinated waters and, in any case, with a maximum term of 10 years.
Improvements in the desalination technique aimed at a greater energy efficiency, as well as the increase in the efficiency of photovoltaic installations together with the participation of other sources of renewable energy and even accumulation, will allow the cost to be further reduced in the future, making it attractive to a greater number of users and even proposing operating schemes without the support of the general electrical grid. Voutchkov [56] described the main benefits and challenges of different energy-saving technologies, such as the integration of desalination and power plants, alternative configurations of reverse osmosis systems, or the use of high-productivity, low-energy membrane elements.
5. Conclusions
Desalination plays a key role in adapting the Mediterranean water resource system, under scarcity conditions, to climate change. The fragile balance between water resources, water demand, and environmental requirements in some territories of Spain, aggravated by climate change, can restrict development activities and intensify the existing water conflicts. The planned and sustainable management of all water resources, conventional and non-conventional, ensuring environmental protection, is a priority in water management in Spain.
Desalination in Spain began in 1964 in the Canary Islands and spread in the following years to the Balearic Islands and the peninsular Mediterranean coast. Although in the beginning the main use of desalinated water was for urban supply, in recent years, it has been proven that it can also be used to meet agricultural demands, as is the case in provinces in the southeast of Spain, such as Almería, Murcia, and Alicante. However, one of the difficulties in extending its use and meeting agricultural demands has been its high cost, especially due to the cost of energy.
The economic optimization of the photovoltaic facility size is carried out by seeking the greatest reduction in the unit energy cost of producing desalinated water (EUR/m3) and trying to reduce the remaining electricity bill for the end user as much as possible (EUR/m3). Combining photovoltaic solar energy with seawater desalination facilities reduces the cost of desalinated water by up to 24%, which makes the cost of water affordable for agricultural use in areas with productive agriculture, reaching less than 0.4 EUR/m3 in basins such as Segura, which has a great scarcity of resources and has a very productive agriculture.
In medium- and large-sized photovoltaic facilities, the implementation of single-axis tracking systems with bifacial modules increases solar generation by one hour, especially in the hours when energy costs are higher, which implies a significant advantage in reducing the cost of these water resources and the carbon footprint. Furthermore, the environmental integration strategies of photovoltaic facilities, through a greater distance between the solar module lines, GCR = 0.3, and a greater elevation of the solar modules, allow the development of agrovoltaic activities, the planting of wildflowers among the lines and the recovery of pollinators in the area, the inclusion of beekeeping in some points of the facility, or other agricultural activities, also being a local environmental added value and economic boost to the local economy where the facility is located.
The experience of integrating photovoltaic solar energy for self-consumption in desalination plants carried out in the Segura river basin district is a very important first step in bringing this technology closer to agriculture, due to the significant cost reduction.
Author Contributions
Conceptualization, M.Á.P.-M. and T.E.; methodology, M.Á.P.-M. and T.E.; software, M.Á.P.-M.; validation, M.Á.P.-M. and T.E.; formal analysis, M.À.M.-M. and M.Á.P.-M.; investigation, M.À.M.-M., M.Á.P.-M. and T.E.; resources, M.À.M.-M. and M.Á.P.-M.; writing—original draft, M.À.M.-M., M.Á.P.-M. and T.E.; writing—review and editing, M.Á.P.-M. and T.E.; visualization, M.À.M.-M. and M.Á.P.-M.; supervision, M.Á.P.-M. and T.E. All authors have read and agreed to the published version of the manuscript.
Funding
This research received no external funding.
Data Availability Statement
Data of numerical calculations are available upon request.
Acknowledgments
The authors would like to thank the General Directorate for Water of Ministry for Ecological Transition and Demographic Challenge, the Júcar River Basin Authority (JRBA), the Segura River Basin Authority (SRBA), and Acuamed S.A. for their collaboration in the compilation of this paper.
Conflicts of Interest
The authors declare no conflicts of interest.
References
- IPCC. Summary for Policymakers. In Climate Change 2023: Synthesis Report. Contribution of Working Groups I, II and III to the Sixth Assessment Report of the Intergovernmental Panel on Climate Change; Core Writing Team, Lee, H., Romero, J., Eds.; IPCC: Geneva, Switzerland, 2023; pp. 1–34. [Google Scholar] [CrossRef]
- World Bank. The Role of Desalination in an Increasingly Water-Scarce World; World Bank: Washington, DC, USA, 2019. [Google Scholar] [CrossRef]
- Shemer, H.; Semiat, R. Sustainable RO desalination—Energy demand and environmental impact. Desalination 2017, 424, 10–16. [Google Scholar] [CrossRef]
- Cabrera, E.; Estrela, T.; Lora, J. Pasado, presente y futuro de la desalación en España. Ingeniería Agua 2019, 23, 199–214. [Google Scholar] [CrossRef]
- AEO. Annual Energy Outlook 2023; AEO: Hong Kong, China, 2023. [Google Scholar]
- Aliyu, M.; Hassan, G.; Syed, S.A.; Siddiqui, M.U.; Alawami, A.T.; Elamin, I.M. A review of solar-powered water pumping systems. Renew. Sustain. Energy Rev. 2018, 87, 61–76. [Google Scholar] [CrossRef]
- IIAMA. Integración de Energía Solar Fotovoltaica en la Conducción Júcar-Vinalopó y en el Recurso de Desalación Estudio para la Junta Central de Usuarios del Vinalopó Alacantí y Consorcio de Agua de la Marina Baja. 2020. Available online: https://www.juntacentral.es/sites/default/files/2020-11/20201030_informe_upv_FV_TJV.pdf (accessed on 19 May 2024).
- Bellar, D.; Choukai, O.; Tahaikt, M.; El Midaoui, A.; Ezaier, Y.; Khan, M.; Gupta, M.; AlQahtani, S.; Yusuf, M. A case study on the environmental and economic impact of photovoltaic systems in wastewater treatment plants. Open Phys. 2023, 21, 20230158. [Google Scholar] [CrossRef]
- Strazzabosco, S.J.; Kenway, P.A.L. Solar PV adoption in wastewater treatment plants: A review of practice in California. J. Environ. Manag. 2019, 248, 109337. [Google Scholar] [CrossRef] [PubMed]
- IIAMA. Integración de Energía Solar Fotovoltaica en el Esquema de Reutilización de Agua de la EDAR de Alcácer. 2021. Available online: https://agroambient.gva.es/auto/agua/REMOD_COL_OESTE_NUEVA_EDAR_REUTILIZACION/MEMORIA_VIABILIDAD_REMODE_COL_OESTE_NUEVA_EDAR_Y_REUTILIZACION.pdf (accessed on 19 May 2024).
- Gómez-Martínez, G.; Estrela-Segrelles, C.E.; Castro-Quiles, B.; Pérez-Martín, M.Á. Hydraulic and Energy-Integrated Study of Reclaimed Wastewater in the Lower Mijares River Basin (Castelló)—Spain. In Water-Energy-Nexus in the Ecological Transition. Advances in Science, Technology & Innovation; Naddeo, V., Choo, K.H., Ksibi, M., Eds.; Springer: Cham, Switzerland, 2022. [Google Scholar] [CrossRef]
- Gorjian, S.; Barat, G.; Hossein, E.; Faezeh, K.; Saber, K. Chapter 8—Applications of solar PV systems in desalination technologies. In Photovoltaic Solar Energy Conversion; Shiva, G., Ashish, S., Eds.; Academic Press: Cambridge, MA, USA, 2020; pp. 237–274. ISBN 9780128196106. [Google Scholar] [CrossRef]
- Ghenai, C.; Adel, M.; Tareq, S.; Erola, C.P. Grid-tied and stand-alone hybrid solar power system for desalination plant. Desalination 2018, 435, 172–180. [Google Scholar] [CrossRef]
- Elfaqih, A.K.; Belhaj, S.O.; Sawed, A.M. Feasibility assessment of a BWRO desalination plant powered by renewable energy sources. J. Appl. Water Eng. Res. 2023, 11, 453–463. [Google Scholar] [CrossRef]
- Al-Karaghouli, A.; Renne, D.; Kazmerski, L.L. Technical and economic assessment of photovoltaic-driven desalination systems. Renew. Energy 2010, 35, 323–328. [Google Scholar] [CrossRef]
- Kumar, S.; Chidambaranathan Bibin, K.; Akash, K.; Aravindan, M.; Kishore, G.M. Solar powered water pumping systems for irrigation: A comprehensive review on developments and prospects towards a green energy approach. Mater. Today Proc. 2020, 33 Pt 1, 303–307. [Google Scholar] [CrossRef]
- Zacchei, E.; Colacicco, A. Direct Method to Design Solar Photovoltaics to Reduce Energy Consumption of Aeration Tanks in Wastewater Treatment Plants. Infrastructures 2022, 7, 79. [Google Scholar] [CrossRef]
- Al-Obaidi, M.A.; Zubo, R.H.A.; Rashid, F.L.; Dakkama, H.J.; Abd-Alhameed, R.; Mujtaba, I.M. Evaluation of Solar Energy Powered Seawater Desalination Processes: A Review. Energies 2022, 15, 6562. [Google Scholar] [CrossRef]
- Ayou, D.; Habibie, M.E.; Alberto, C. A feasibility study of a small-scale photovoltaic-powered reverse osmosis desalination plant for potable water and salt production in Madura Island: A techno-economic evaluation. Therm. Sci. Eng. Prog. 2022, 35, 101450. [Google Scholar] [CrossRef]
- Adamovic, M.; Bisselink, B.; De Felice, M.; De Roo, A.; Dorati, C.; Ganora, D.; Medarac, H.; Pistocchi, A.; Van De Bund, W.; Vanham, D. Water Energy Nexus in Europe; Magagna, D., Bidoglio, G., Hidalgo Gonzalez, I., Peteves, E., Eds.; EUR 29743 EN, JRC115853; Publications Office of the European Union: Luxembourg, 2019. [Google Scholar] [CrossRef]
- IDA. Desalination Yearbook 2016–2017; International Desalination Association: Topsfield, MA, USA, 2016. [Google Scholar]
- Kim, J.; Kiho, P.; Dae, R.Y.; Seungkwan, H. A comprehensive review of energy consumption of seawater reverse osmosis desalination plants. Appl. Energy 2019, 254, 113652. [Google Scholar] [CrossRef]
- Khan, M.A.M.; Rehman, S.; Al-Sulaiman, F.A. A hybrid renewable energy system as a potential energy source for water desalination using reverse osmosis: A review. Renew. Sustain. Energy Rev. 2018, 97, 456–477. [Google Scholar] [CrossRef]
- Vergara-Fernandez, L.; Aguayo, M.M.; Moran, L.; Obreque, C. A MILP-based operational decision-making methodology for demand-side management applied to desalinated water supply systems supported by a solar photovoltaic plant: A case study in agricultural industry. J. Clean. Prod. 2022, 334, 130123. [Google Scholar] [CrossRef]
- Voutchkov, N. Desalination—Water for the next generation. Filtr. Sep. 2005, 42, 14–25. [Google Scholar] [CrossRef]
- Gómez-Martínez, G.; Miguel, Á.P.M. Water Management Adaptation to Climate Change in Mediterranean Semiarid Regions by Desalination and Photovoltaic Solar Energy, Spain. Water 2023, 15, 3239. [Google Scholar] [CrossRef]
- Elsaie, Y.; Ismail, S.; Soussa, H.; Gado, M.; Balah, A. Water desalination in Egypt; literature review and assessment. Ain Shams Eng. J. 2023, 14, 101998. [Google Scholar] [CrossRef]
- Leon, F.; Ramos, A.; Perez-Baez, S.O. Optimization of Energy Efficiency, Operation Costs, Carbon Footprint and Ecological Footprint with Reverse Osmosis Membranes in Seawater Desalination Plants. Membranes 2021, 11, 781. [Google Scholar] [CrossRef] [PubMed]
- Hamawand, I. Energy Consumption in Water/Wastewater Treatment Industry—Optimisation Potentials. Energies 2023, 16, 2433. [Google Scholar] [CrossRef]
- Siatou, A.; Manali, A.; Gikas, P. Energy Consumption and Internal Distribution in Activated Sludge Wastewater Treatment Plants of Greece. Water 2020, 12, 1204. [Google Scholar] [CrossRef]
- Estrela-Segrelles, C.; Pérez-Martín, M.Á.; Wang, Q.J. Adapting Water Resources Management to Climate Change in Water-Stressed River Basins—Júcar River Basin Case. Water 2024, 16, 1004. [Google Scholar] [CrossRef]
- Burn, S.; Hoang, M.; Zarzo, D.; Olewniak, F.; Campos, E.; Bolto, B.; Barron, O. Desalination techniques—A review of the opportunities for desalination in agriculture. Desalination 2015, 364, 2–16. [Google Scholar] [CrossRef]
- Zarzo, D.; Campos, E.; Terrero, P. Spanish experience in desalination for agriculture. Desalination Water Treat. 2012, 51, 53–66. [Google Scholar] [CrossRef]
- CEDEX. Informe de Evaluación del Impacto del Cambio Climático en los Recursos Hídricos y Sequías en España (2015–2017); CEDEX: Madrid, Spain, 2017. [Google Scholar]
- Estrela, T.; Pérez-Martín, M.A.; Vargas, E. Impacts of Climate Change on Water Resources in Spain. Hydrol. Sci. J. 2012, 57, 1154–1167. [Google Scholar] [CrossRef]
- Torres, M. Evolución de los procesos de desalación en España. In Capítulo I del Libro la Desalación en España. Aguas de la Cuenca Mediterránea; Depósito Legal: M-27347-2008; FEDEA Fundación de Estudios de Economía Aplicada: Madrid, Spain, 2008; pp. 81–113. [Google Scholar]
- Cabrera, E.; Estrela, T.; Lora, J. Desalination in Spain. Past, present and future. Houille Blanche 2019, 105, 85–92. [Google Scholar] [CrossRef]
- MITERD. Informe de Seguimiento de los Planes Hidrológicos de Cuenca y de los Recursos Hídricos en España. Año 2021; Avance octubre 2022; Ministerio para la Transición Ecológica y el Reto Demográfico: Madrid, Spain, 2022. [Google Scholar]
- Zarzo-Martínez, D. La Desalación del Agua en España. In Estudios Sobre la Economía Española—2020/22; FEDA Asociación Española de Desalación y Reutilización (AEDyR): Madrid, Spain, 2020. [Google Scholar]
- Jia, X.; Klemeš, J.J.; Varbanov, P.S.; Alwi, S.R.W. Analyzing the Energy Consumption, GHG Emission, and Cost of Seawater Desalination in China. Energies 2019, 12, 463. [Google Scholar] [CrossRef]
- Zarzo-Martínez, D.; Prats, D. Desalination and energy consumption. What can we expect in the near future? Desalination 2018, 427, 1–9. [Google Scholar] [CrossRef]
- Lapuente, E. Full cost in desalination. A case study of the Segura River Basin. Desalination 2012, 300, 40–45. [Google Scholar] [CrossRef]
- Morote, Á.-F.; Rico, A.-M.; Moltó, E. Critical review of desalination in Spain: A resource for the future? Geogr. Res. 2017, 55, 412–423. [Google Scholar] [CrossRef]
- CHS. Plan Hidrológico de la Demarcación Hidrográfica del Segura: 2022–2027; Confederación Hidrográfica del Segura: Murcia, Spain, 2023. [Google Scholar]
- ACUAMED. Informe Sobre la Ampliación de las Desaladoras Explotadas por Acuamed; Sociedad Estatal Aguas de las Cuencas Mediterráneas (ACUAMED): Alicante, Spain, 2021. [Google Scholar]
- Huld, T.; Müller, R.; Gambardella, A. A new solar radiation database for estimating PV performance in Europe and Africa. Sol. Energy 2012, 86, 1803–1815. [Google Scholar] [CrossRef]
- Huang, B.; Huang, J.; Xing, K.; Liao, L.; Xie, P.; Xiao, M.; Zhao, W. Development of a Solar-Tracking System for Horizontal Single-Axis PV Arrays Using Spatial Projection Analysis. Energies 2023, 16, 4008. [Google Scholar] [CrossRef]
- Lazaroiu, G.C.; Longo, M.; Roscia, M.; Pagano, M. Comparative analysis of fixed and Sun tracking low power PV systems considering energy consumption. Energy Convers. Manag. 2015, 92, 143–148. [Google Scholar] [CrossRef]
- Nsengiyumva, W.; Chen, S.G.; Hu, L.H. Recent advancements and challenges in Solar Tracking Systems(STS):A review. Renew. Sustain. Energy Rev. 2018, 81, 250–279. [Google Scholar] [CrossRef]
- ACUAMED. Informe Sobre el Uso de Energía Fotovoltaica en las Desaladoras de Acuamed de la Cuenca Hidrográfica del Segura; Sociedad Estatal Aguas de las Cuencas Mediterráneas (ACUAMED): Alicante, Spain, 2021. [Google Scholar]
- Rodríguez-Gallegos, C.D.; Bieri, M.; Gandhi, O.; Singh, J.P.; Reindl, T.; Panda, S.K. Monofacial vs bifacial Si-based PV modules: Which one is more cost-effective? Sol. Energy 2018, 176, 412–438. [Google Scholar] [CrossRef]
- Rodríguez-Gallegos, C.D.; Liu, H.; Gandhi, O.; Singh, J.P.; Krishnamurthy, V.; Kumar, A.; Peters, I.M.; Reindl, T.; Li, L.; Wang, S.; et al. Global Techno-Economic Performance of Bifacial and Tracking Photovoltaic Systems. Joule 2020, 4, 1514–1541. [Google Scholar] [CrossRef]
- Dupraz, C. Assessment of the ground coverage ratio of agrivoltaic systems as a proxy for potential crop productivity. Agrofor. Syst. 2023, 1–18. [Google Scholar] [CrossRef]
- FDS. Estudio de Viabilidad para la Implementación de la Generación Solar Fotovoltaica en el Suministro Eléctrico a Plantas Desalinizadoras de Agua de Mar Situadas en la Demarcación Hidrográfica del Segura; Encargo de la Confederación Hidrográfica del Segura a la Fundación Desarrollo Sostenible; 2021. [Google Scholar]
- Gubernamental Order (2023) Orden TED/157/2023, de 21 de Febrero, por la Que se Establece la Excepción Temporal y Parcial al Principio de Recuperación de Costes del Artículo 111 bis del Texto Refundido de la Ley de Aguas, para el Aprovechamiento de Recursos Hídricos Procedentes de Desalinizadoras de Agua de mar en la Cuenca Hidrográfica del Segura, en la Provincia de Almería y en la Conducción Júcar-Vinalopó. Available online: https://www.boe.es/diario_boe/txt.php?id=BOE-A-2023-5003 (accessed on 19 May 2024).
- Voutchkov, N. Energy use for membrane seawater desalination. Current status and trends. J. Desalination 2018, 431, 2–14. [Google Scholar] [CrossRef]


Disclaimer/Publisher’s Note: The statements, opinions and data contained in all publications are solely those of the individual author(s) and contributor(s) and not of MDPI and/or the editor(s). MDPI and/or the editor(s) disclaim responsibility for any injury to people or property resulting from any ideas, methods, instructions or products referred to in the content. |
© 2024 by the authors. Licensee MDPI, Basel, Switzerland. This article is an open access article distributed under the terms and conditions of the Creative Commons Attribution (CC BY) license (https://creativecommons.org/licenses/by/4.0/).