
Effect of Chemical Corrosion on Rock Fracture Behavior in Coastal Deep Mines: Insights from Mechanical and Acoustic Characteristics

Abstract
:1. Introduction
2. Materials and Methods
2.1. Specimen Preparation
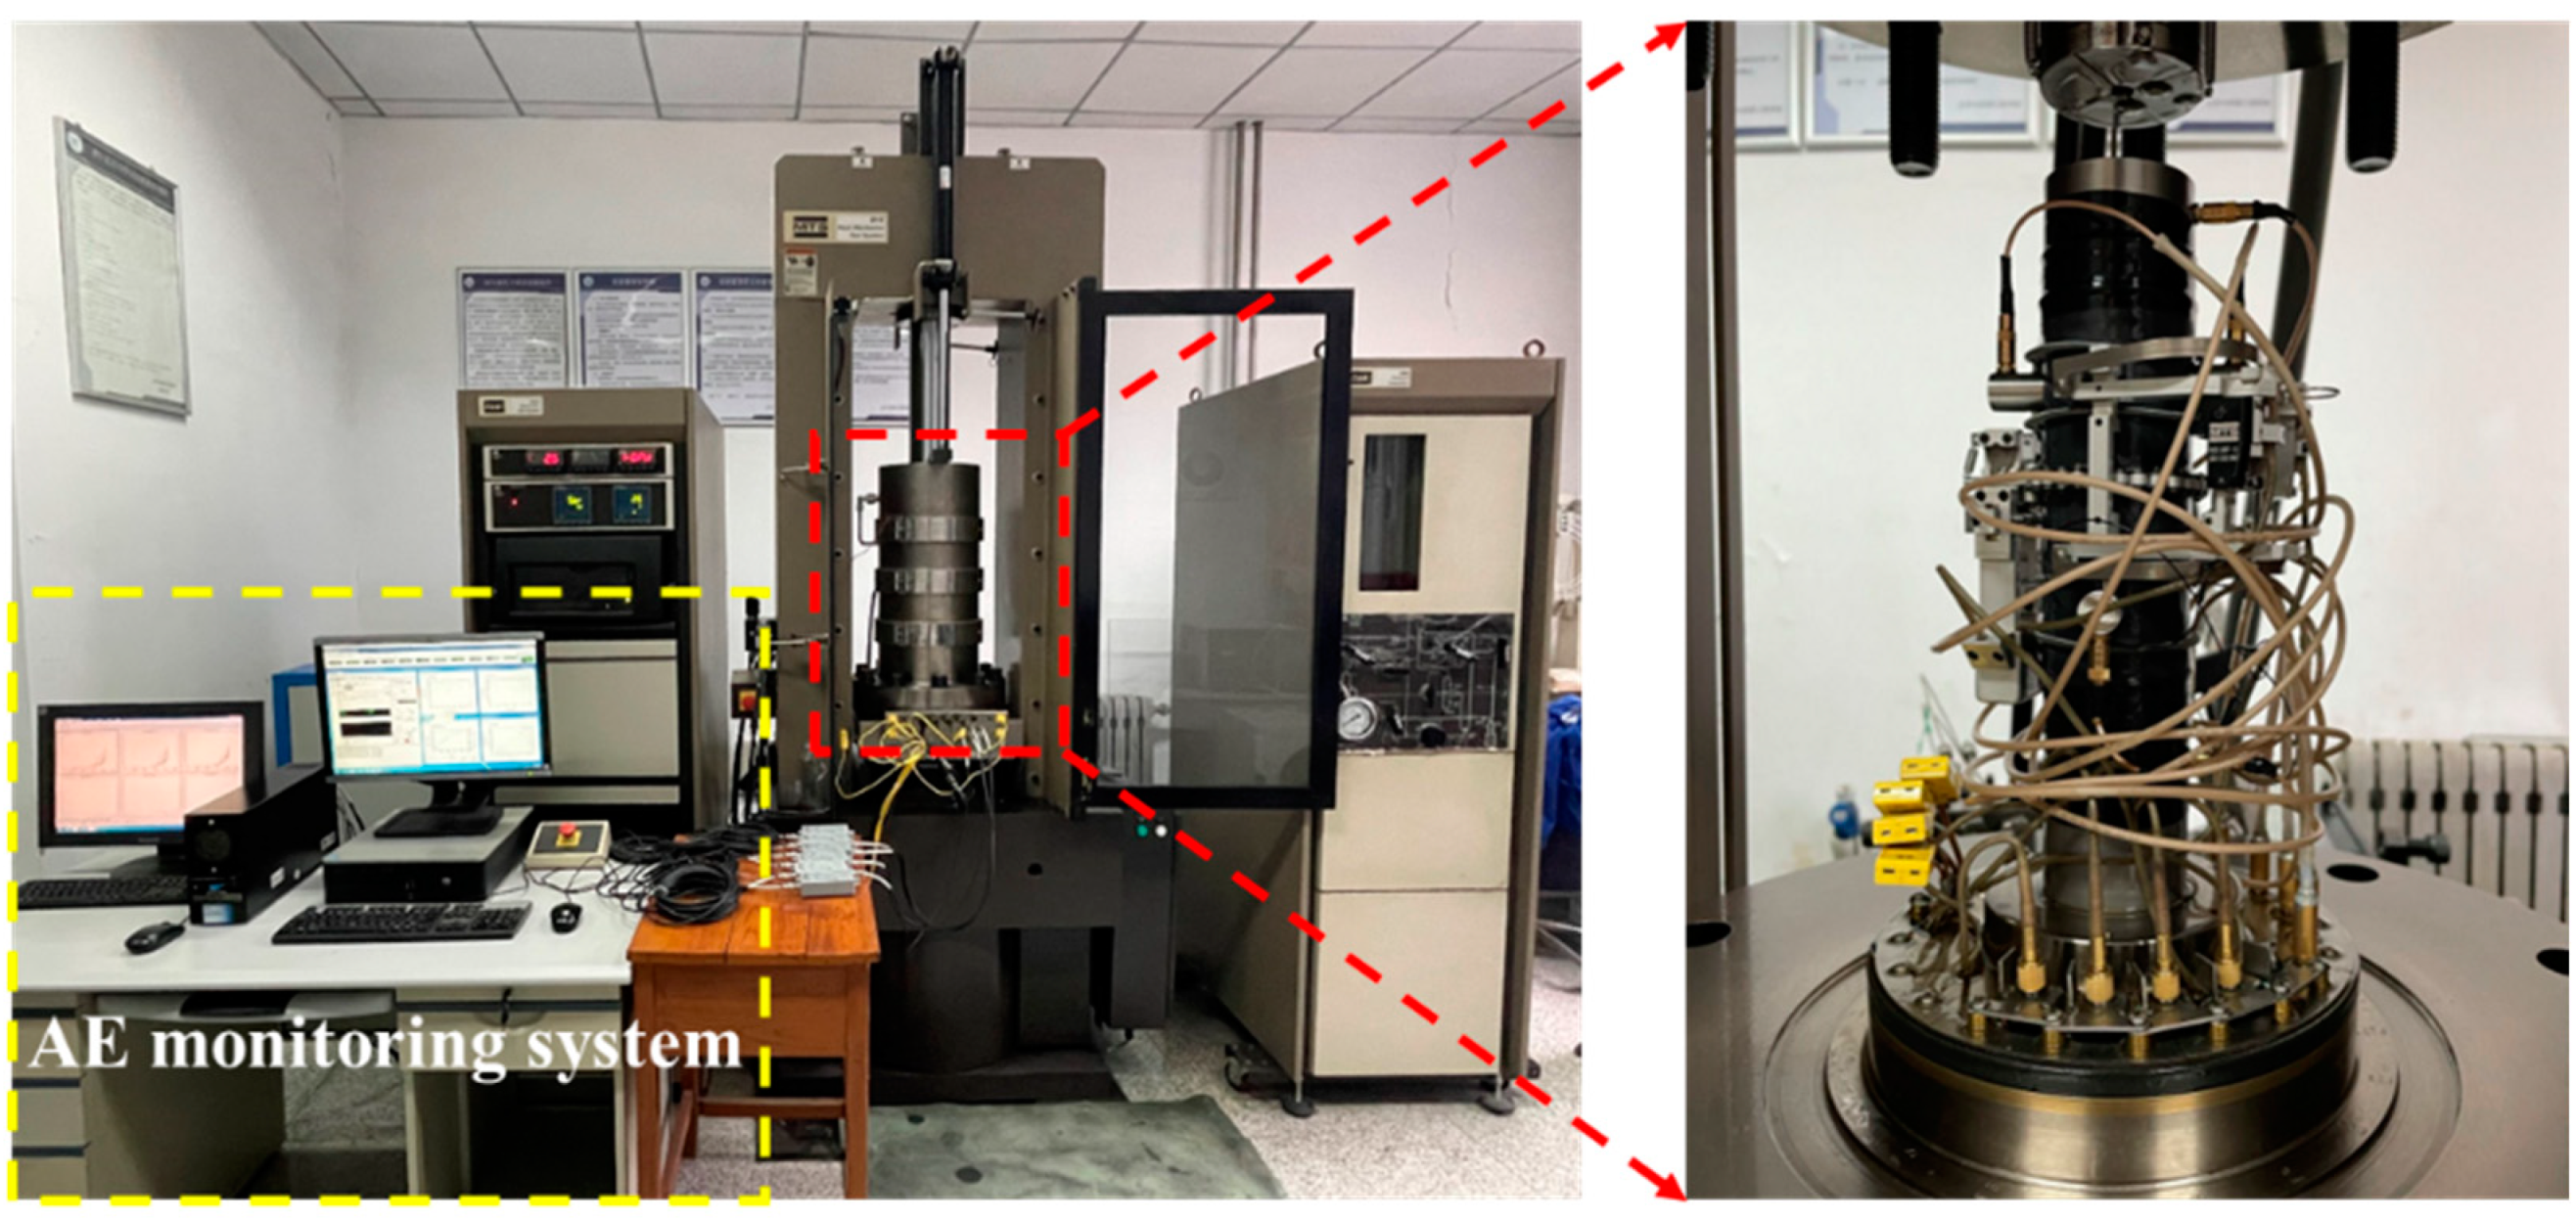
2.2. Test Methods
- (1)
- The specimen underwent preloading at a rate of 0.05 kN/s, with pre-pressure set at 0.5 MPa to ensure complete contact between the testing machine’s loading end and the specimen.
- (2)
- Following preloading, stress control was used to apply confining pressure at a loading rate of 0.1 MPa/s. Axial pressure was imposed at a loading rate of 0.25 MPa/s upon reaching the preset confining pressure.
- (3)
- Once the yield point was reached, the control mode transitioned from stress control to radial displacement control, with a control rate of 0.015 mm/min.
- (4)
- The loading process was halted upon specimen damage to ensure compliance with quasi-static loading conditions.
3. Mechanical Parameter Analysis
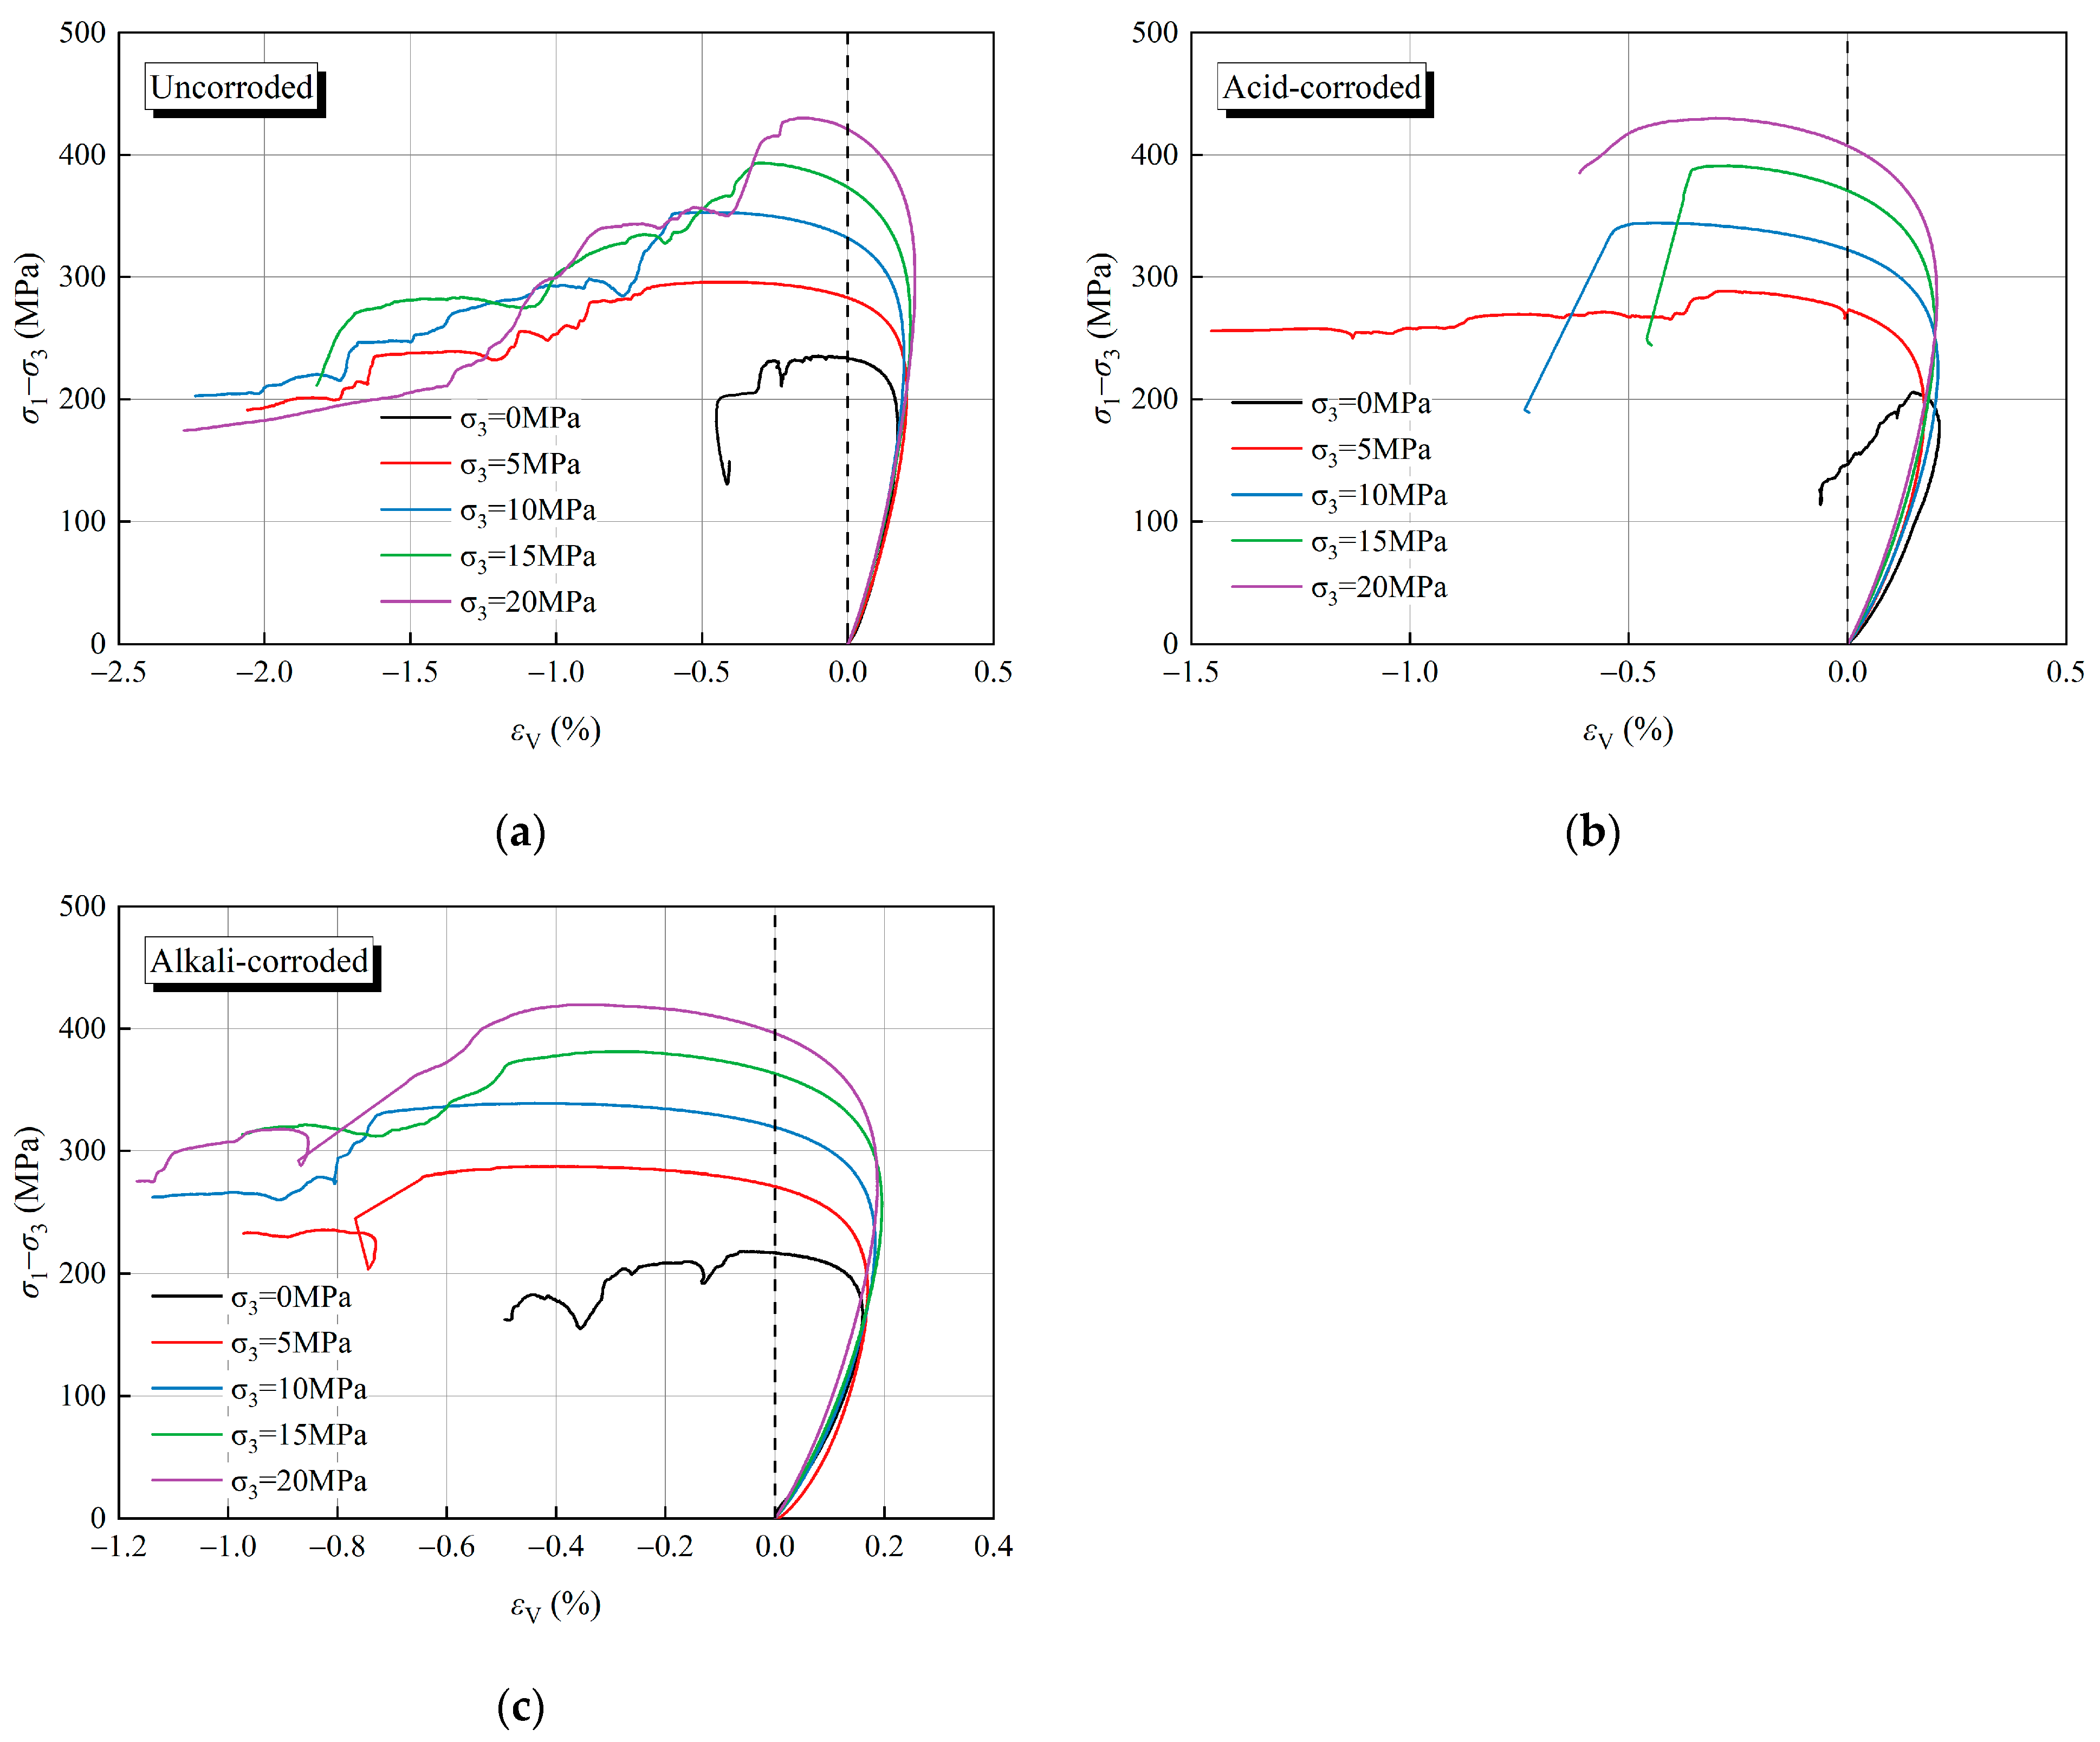
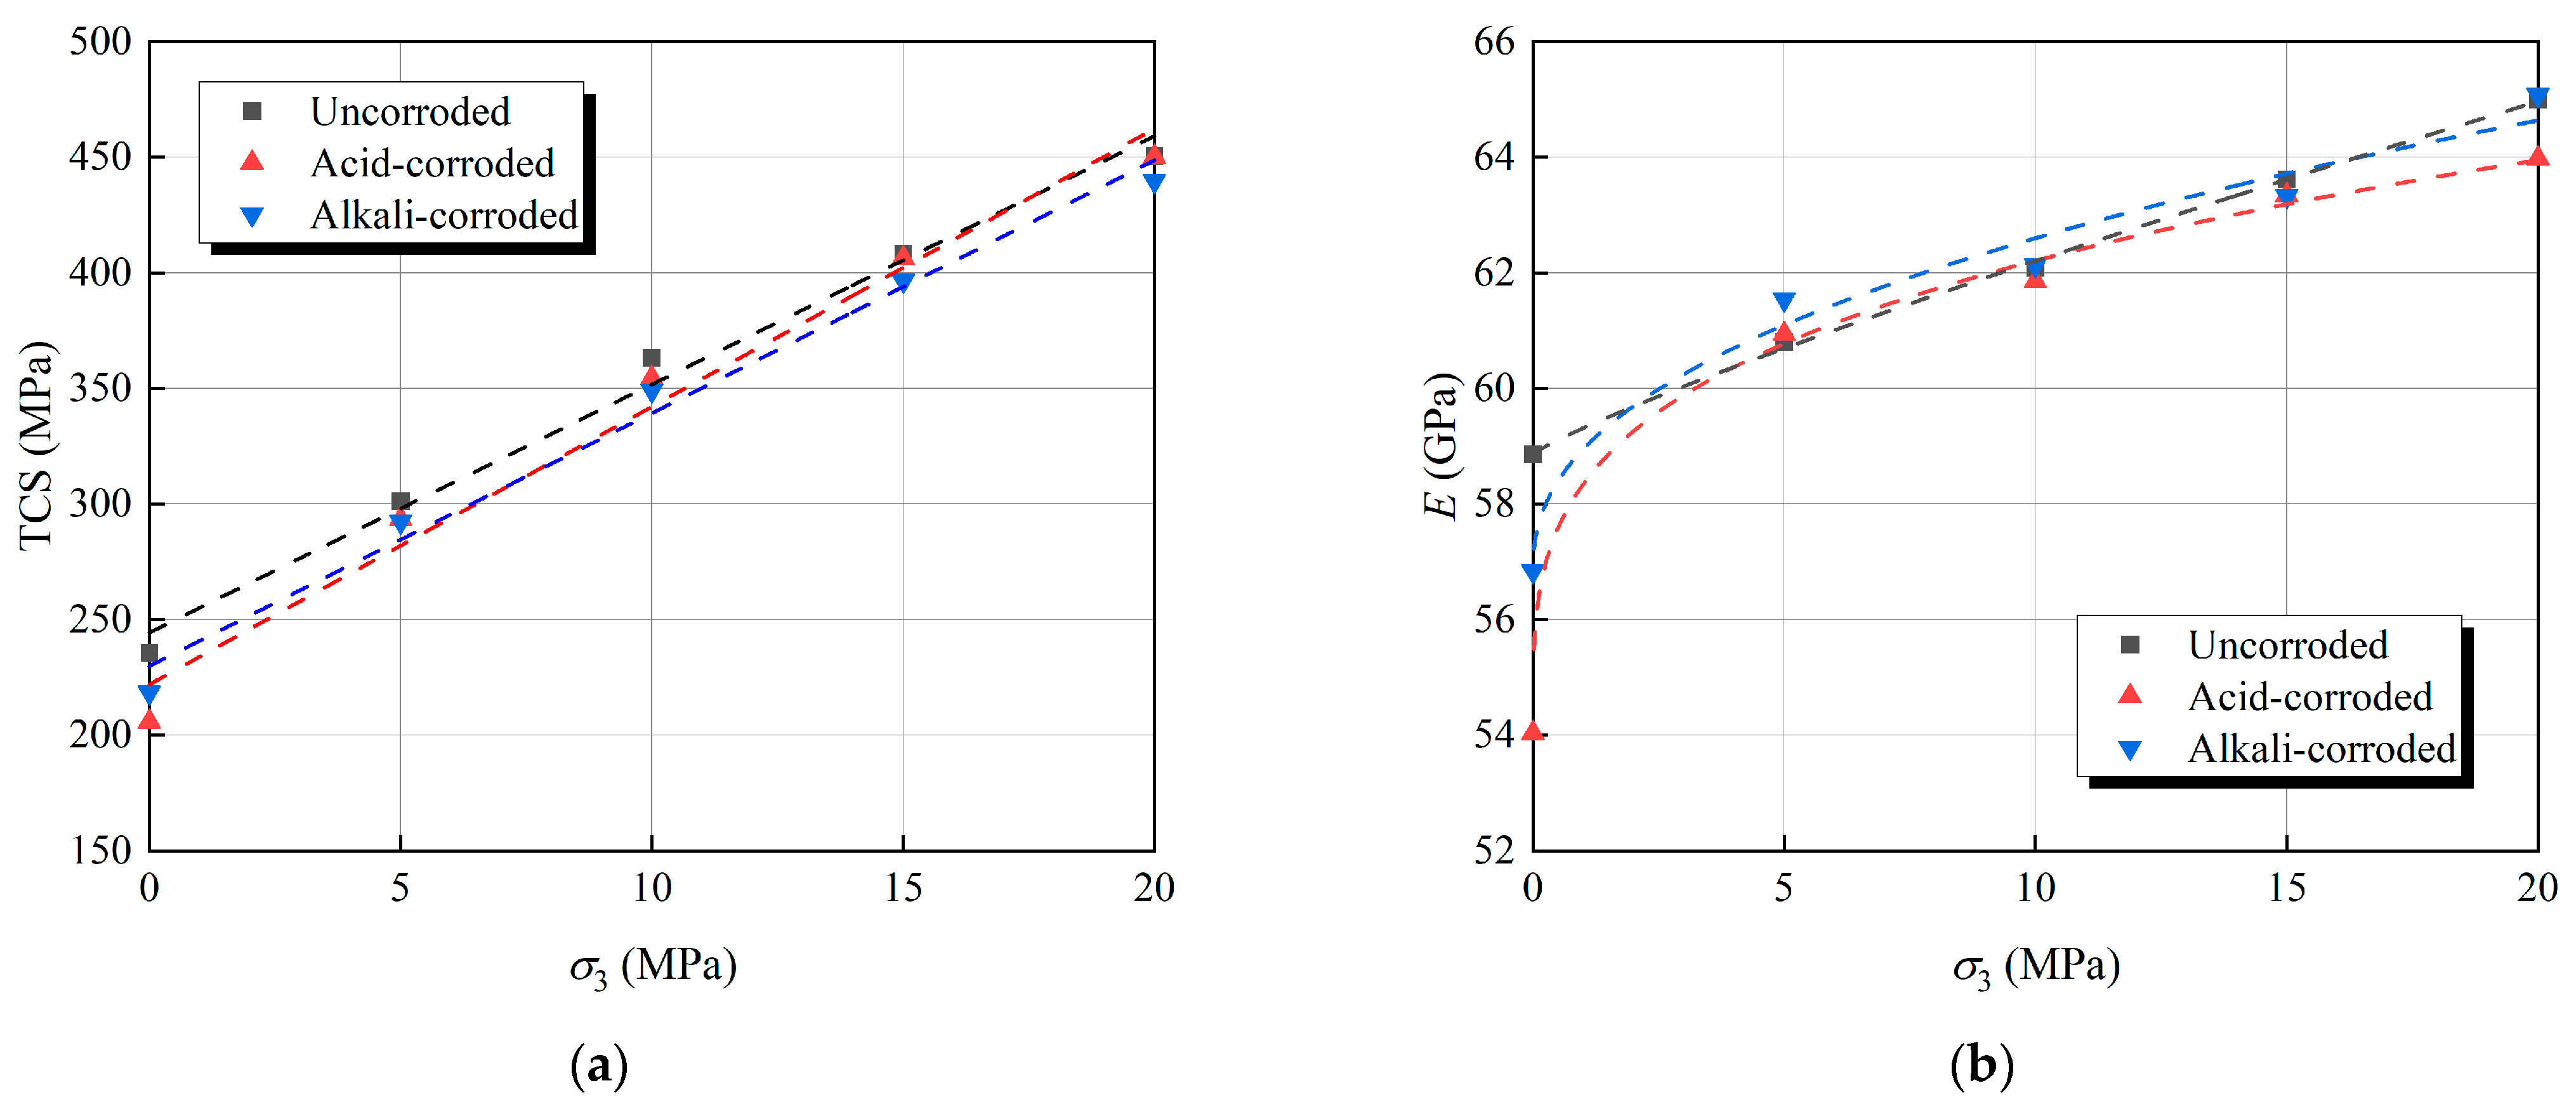
3.1. Triaxial Compressive Strength and Elastic Modulus
3.2. Cohesion and Internal Friction Angle
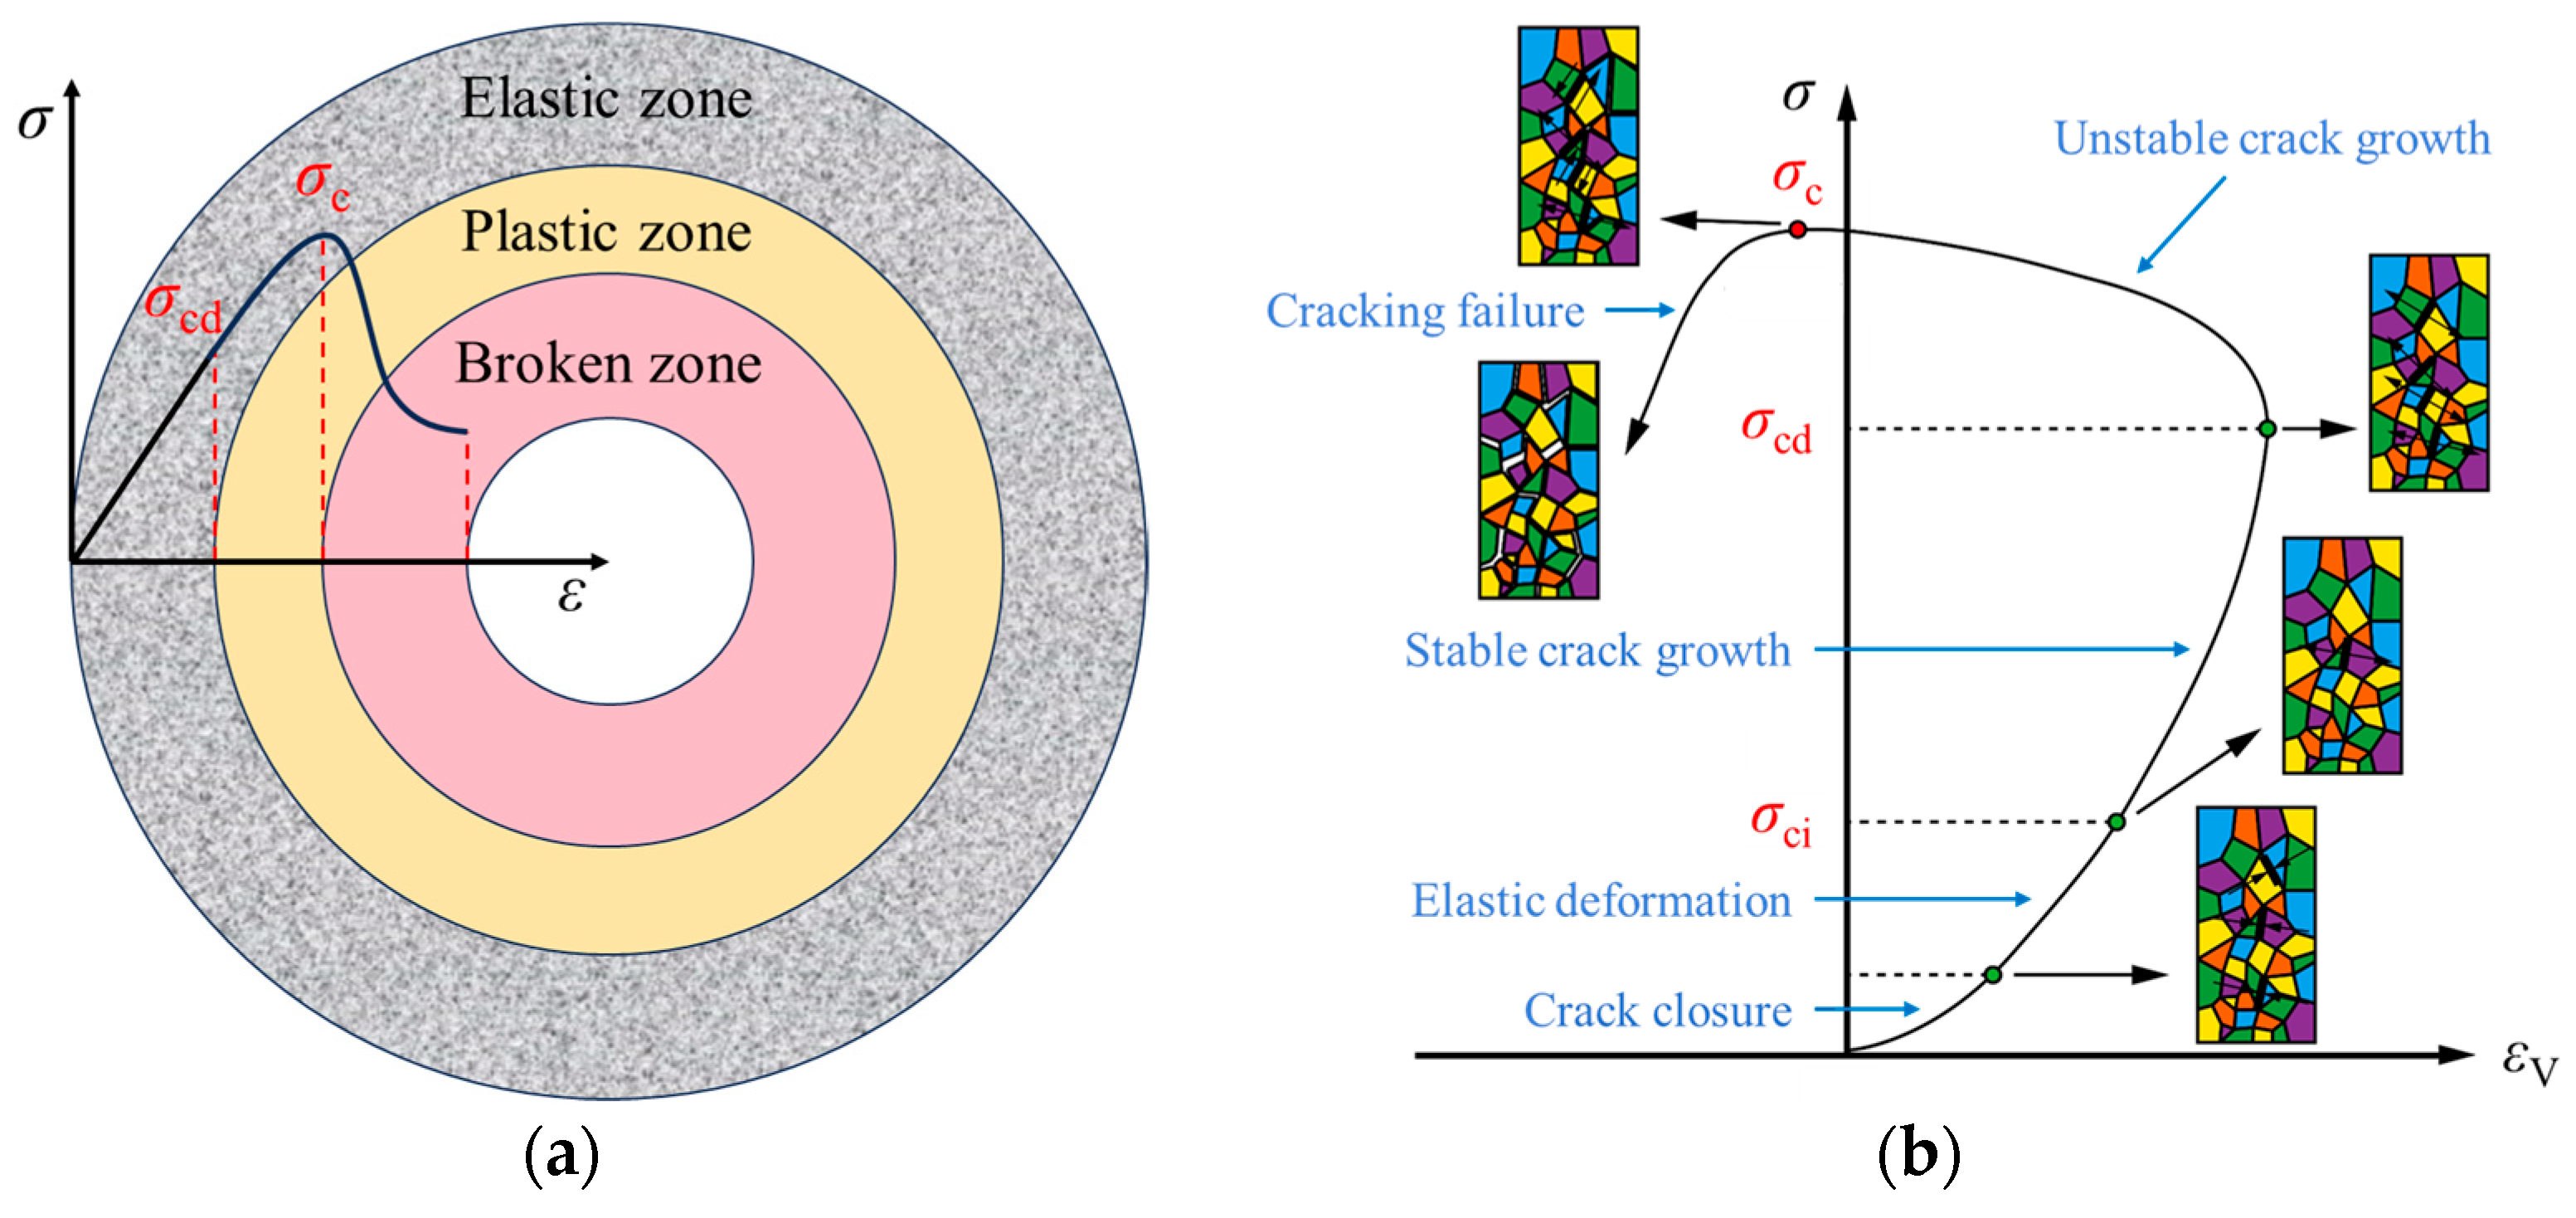
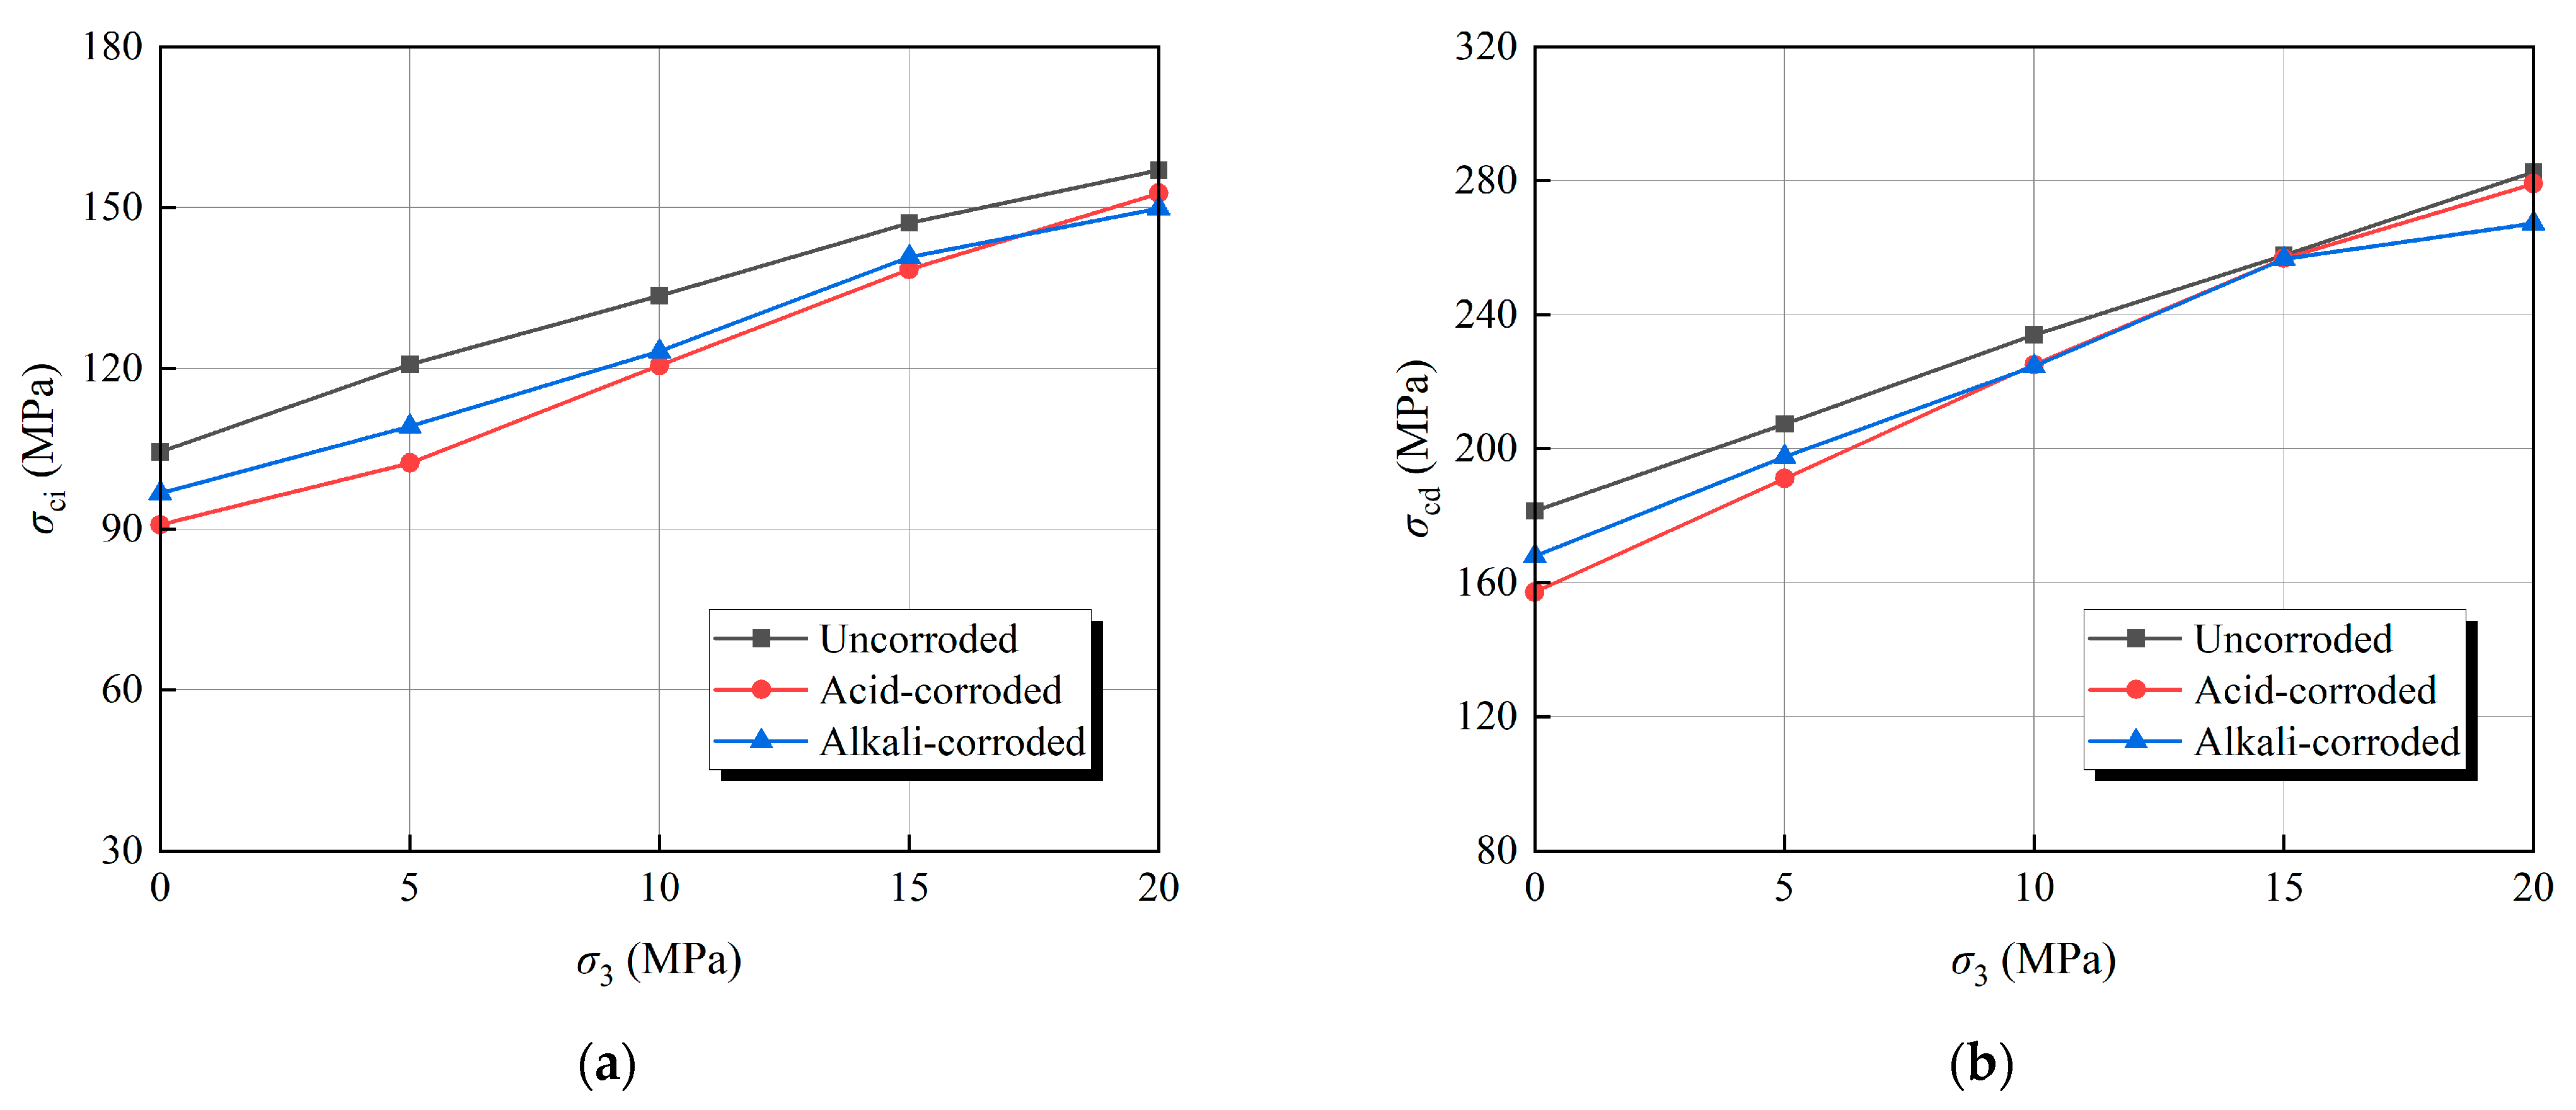
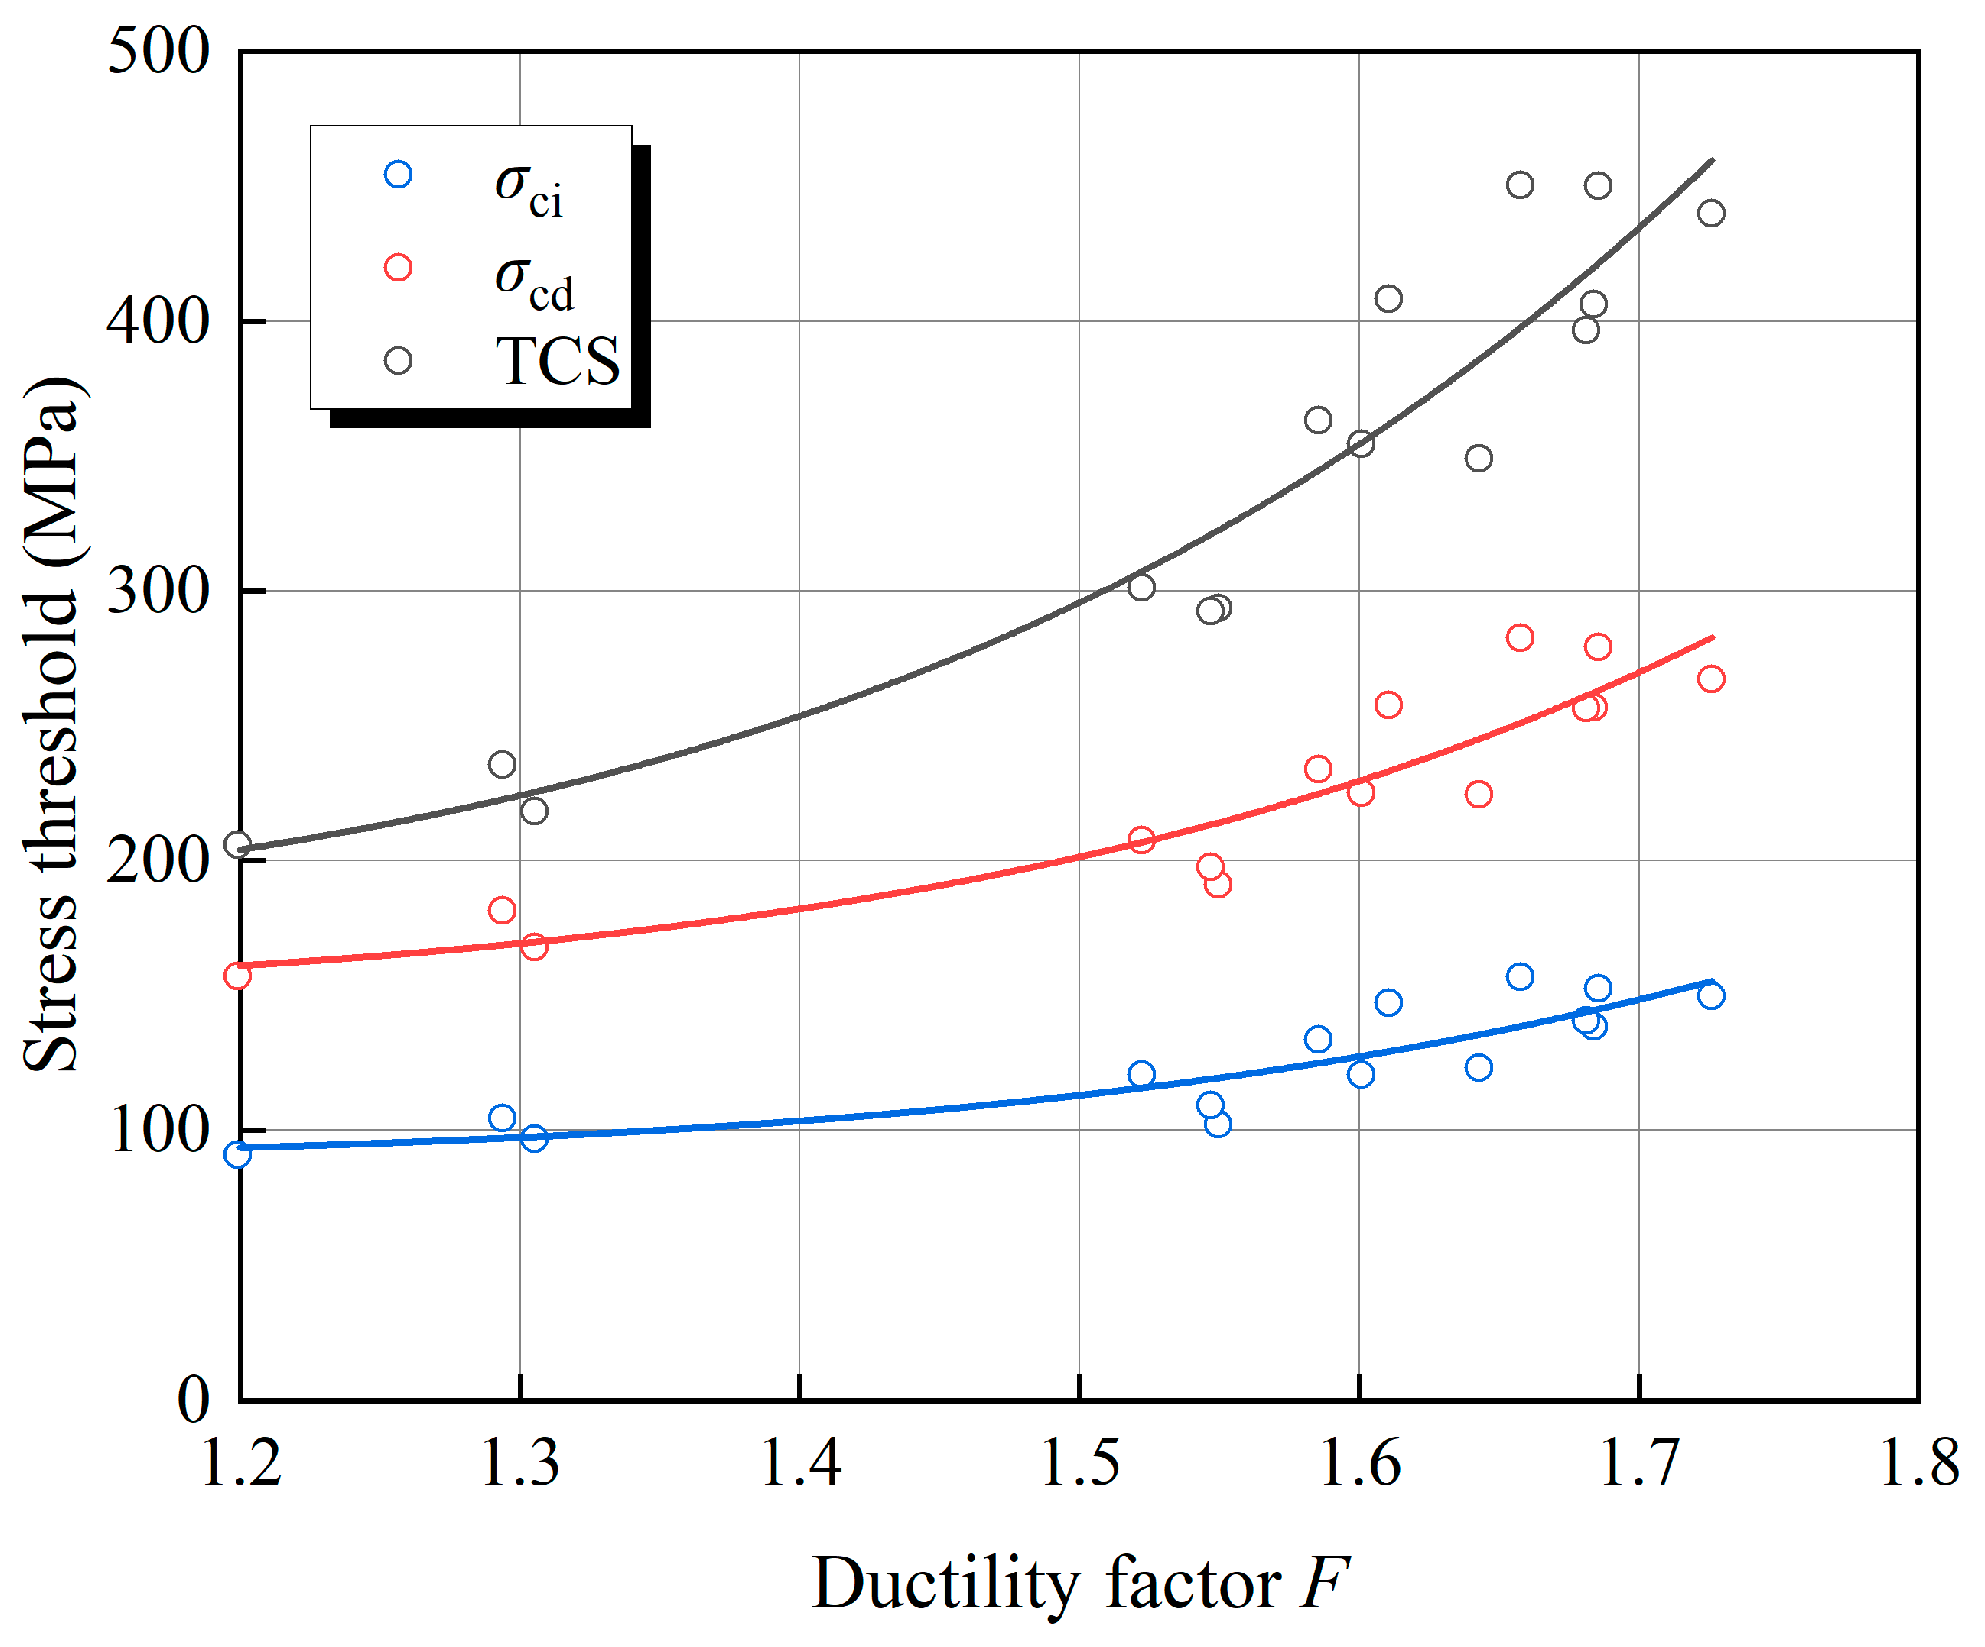
3.3. Stress Threshold for Cracking and Damage
3.4. Fracture Mode Analysis
4. Analysis of Acoustic Characteristics
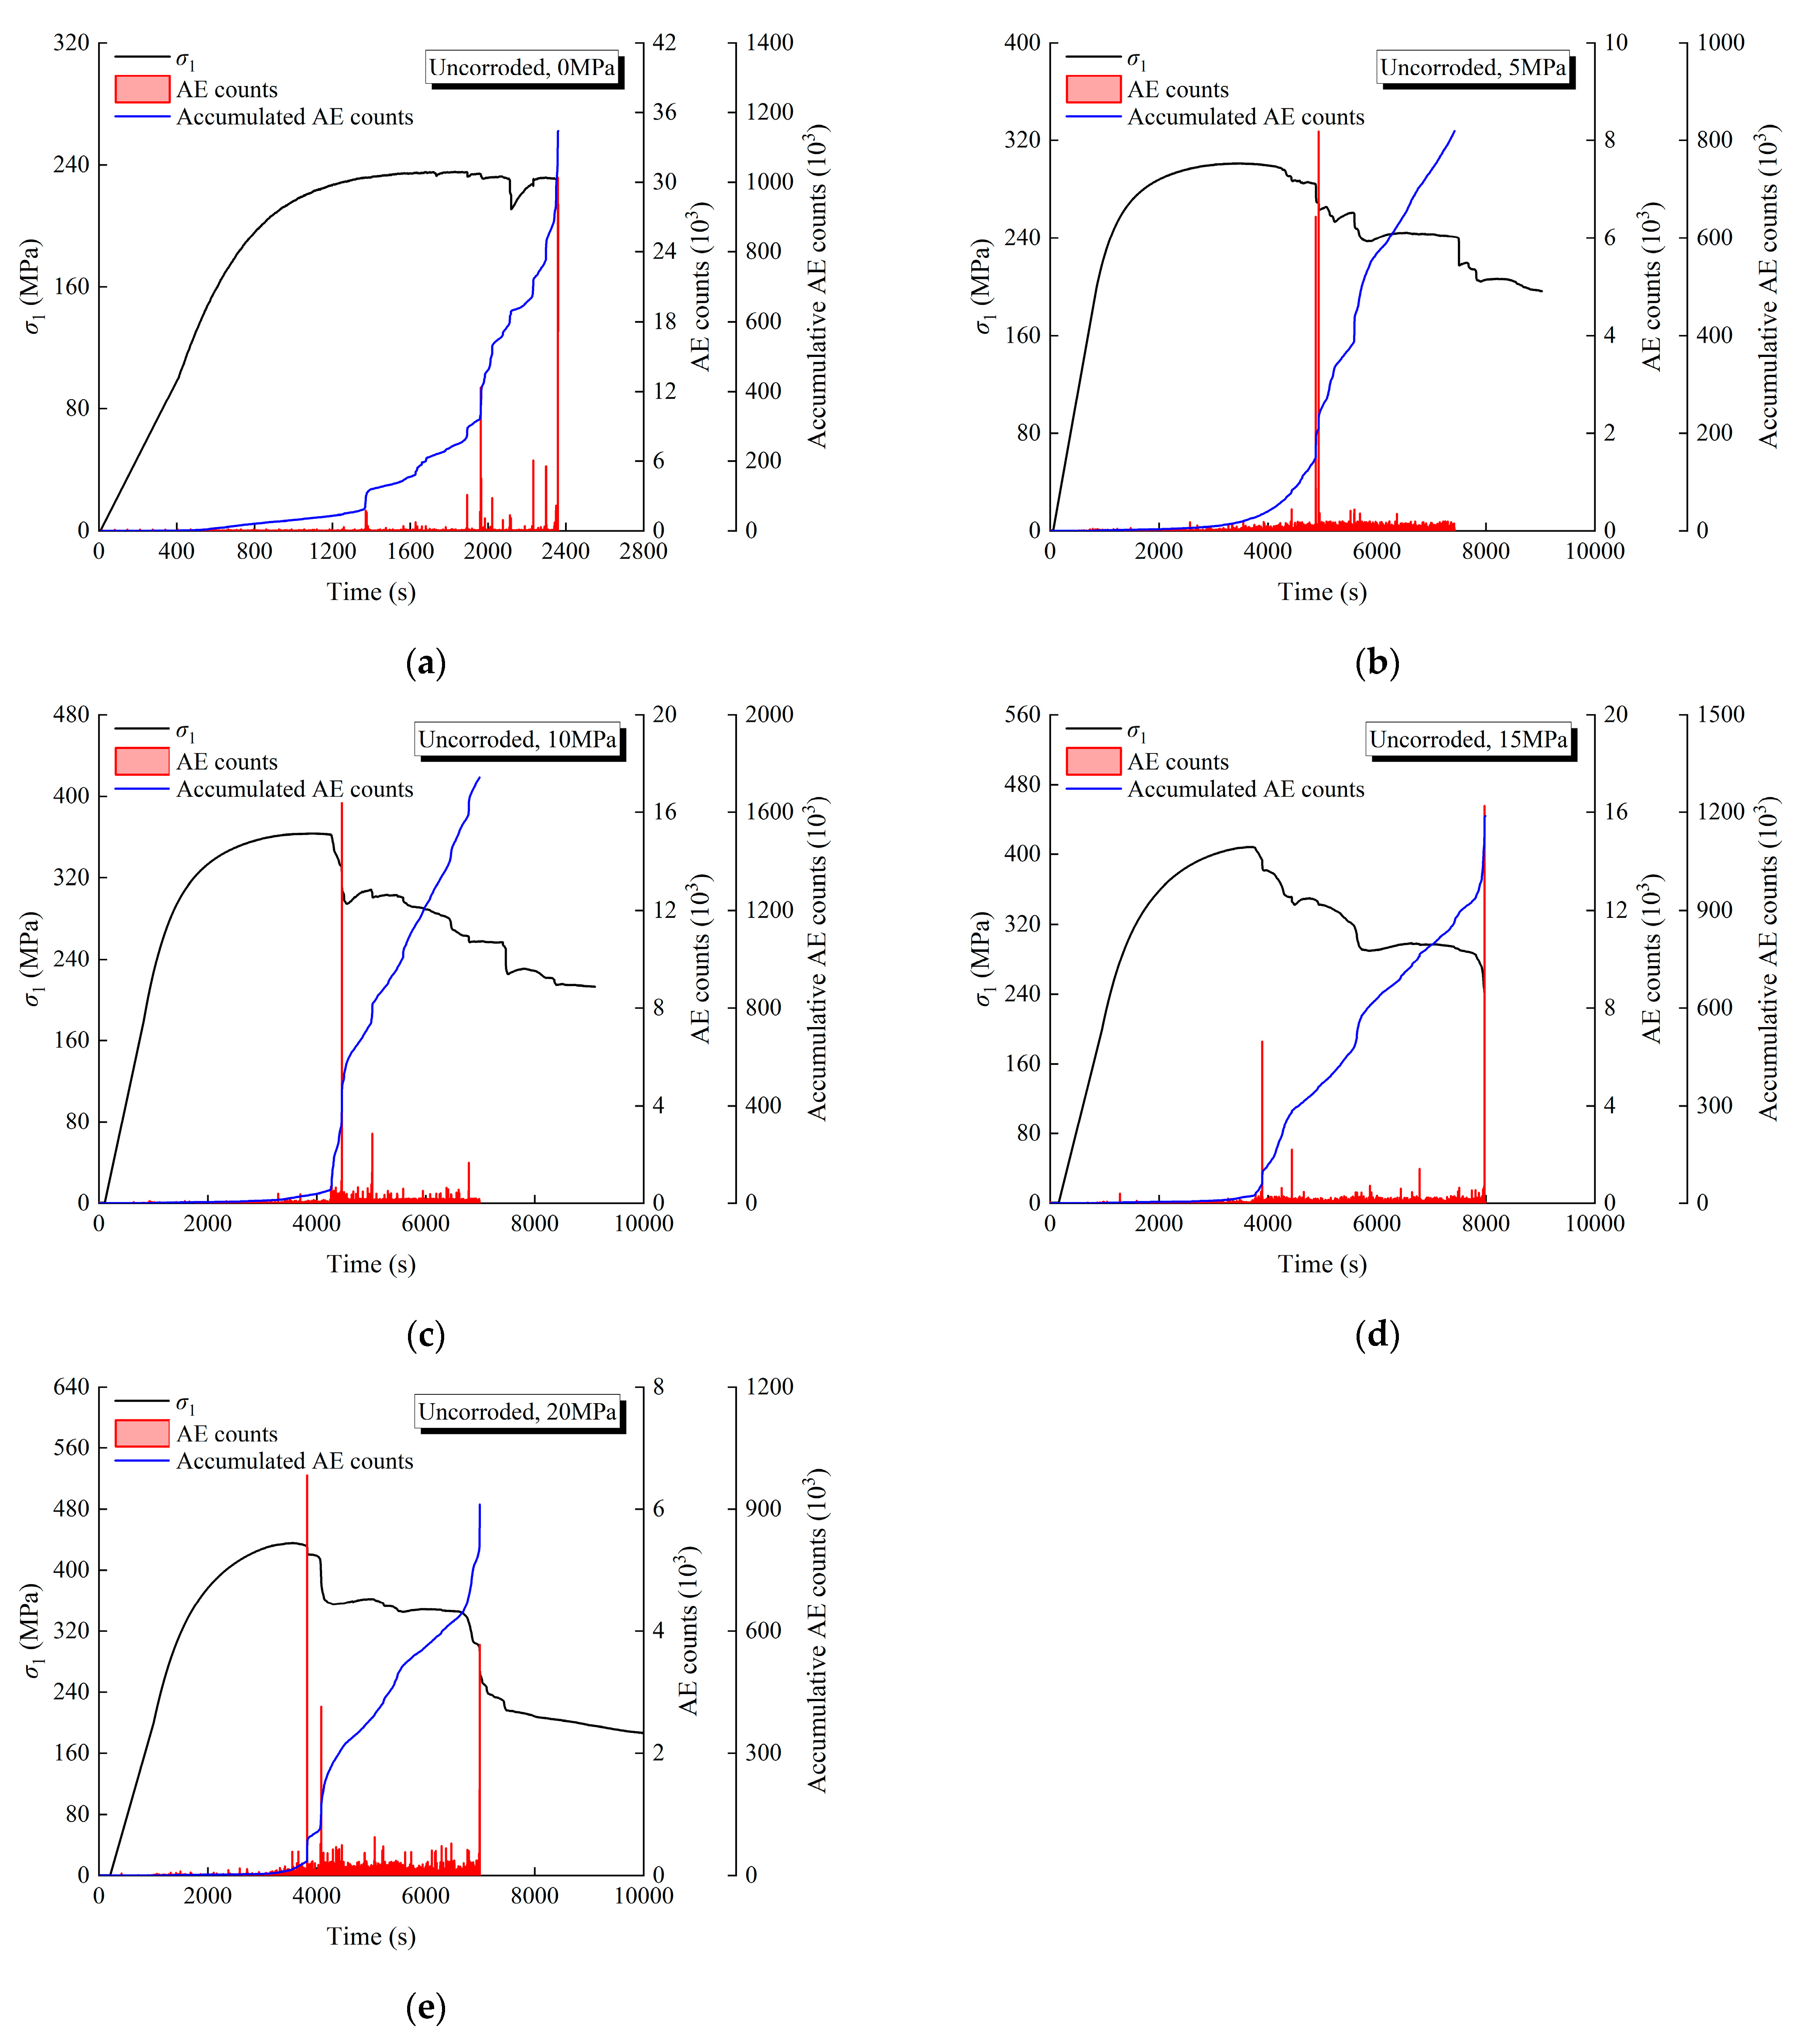
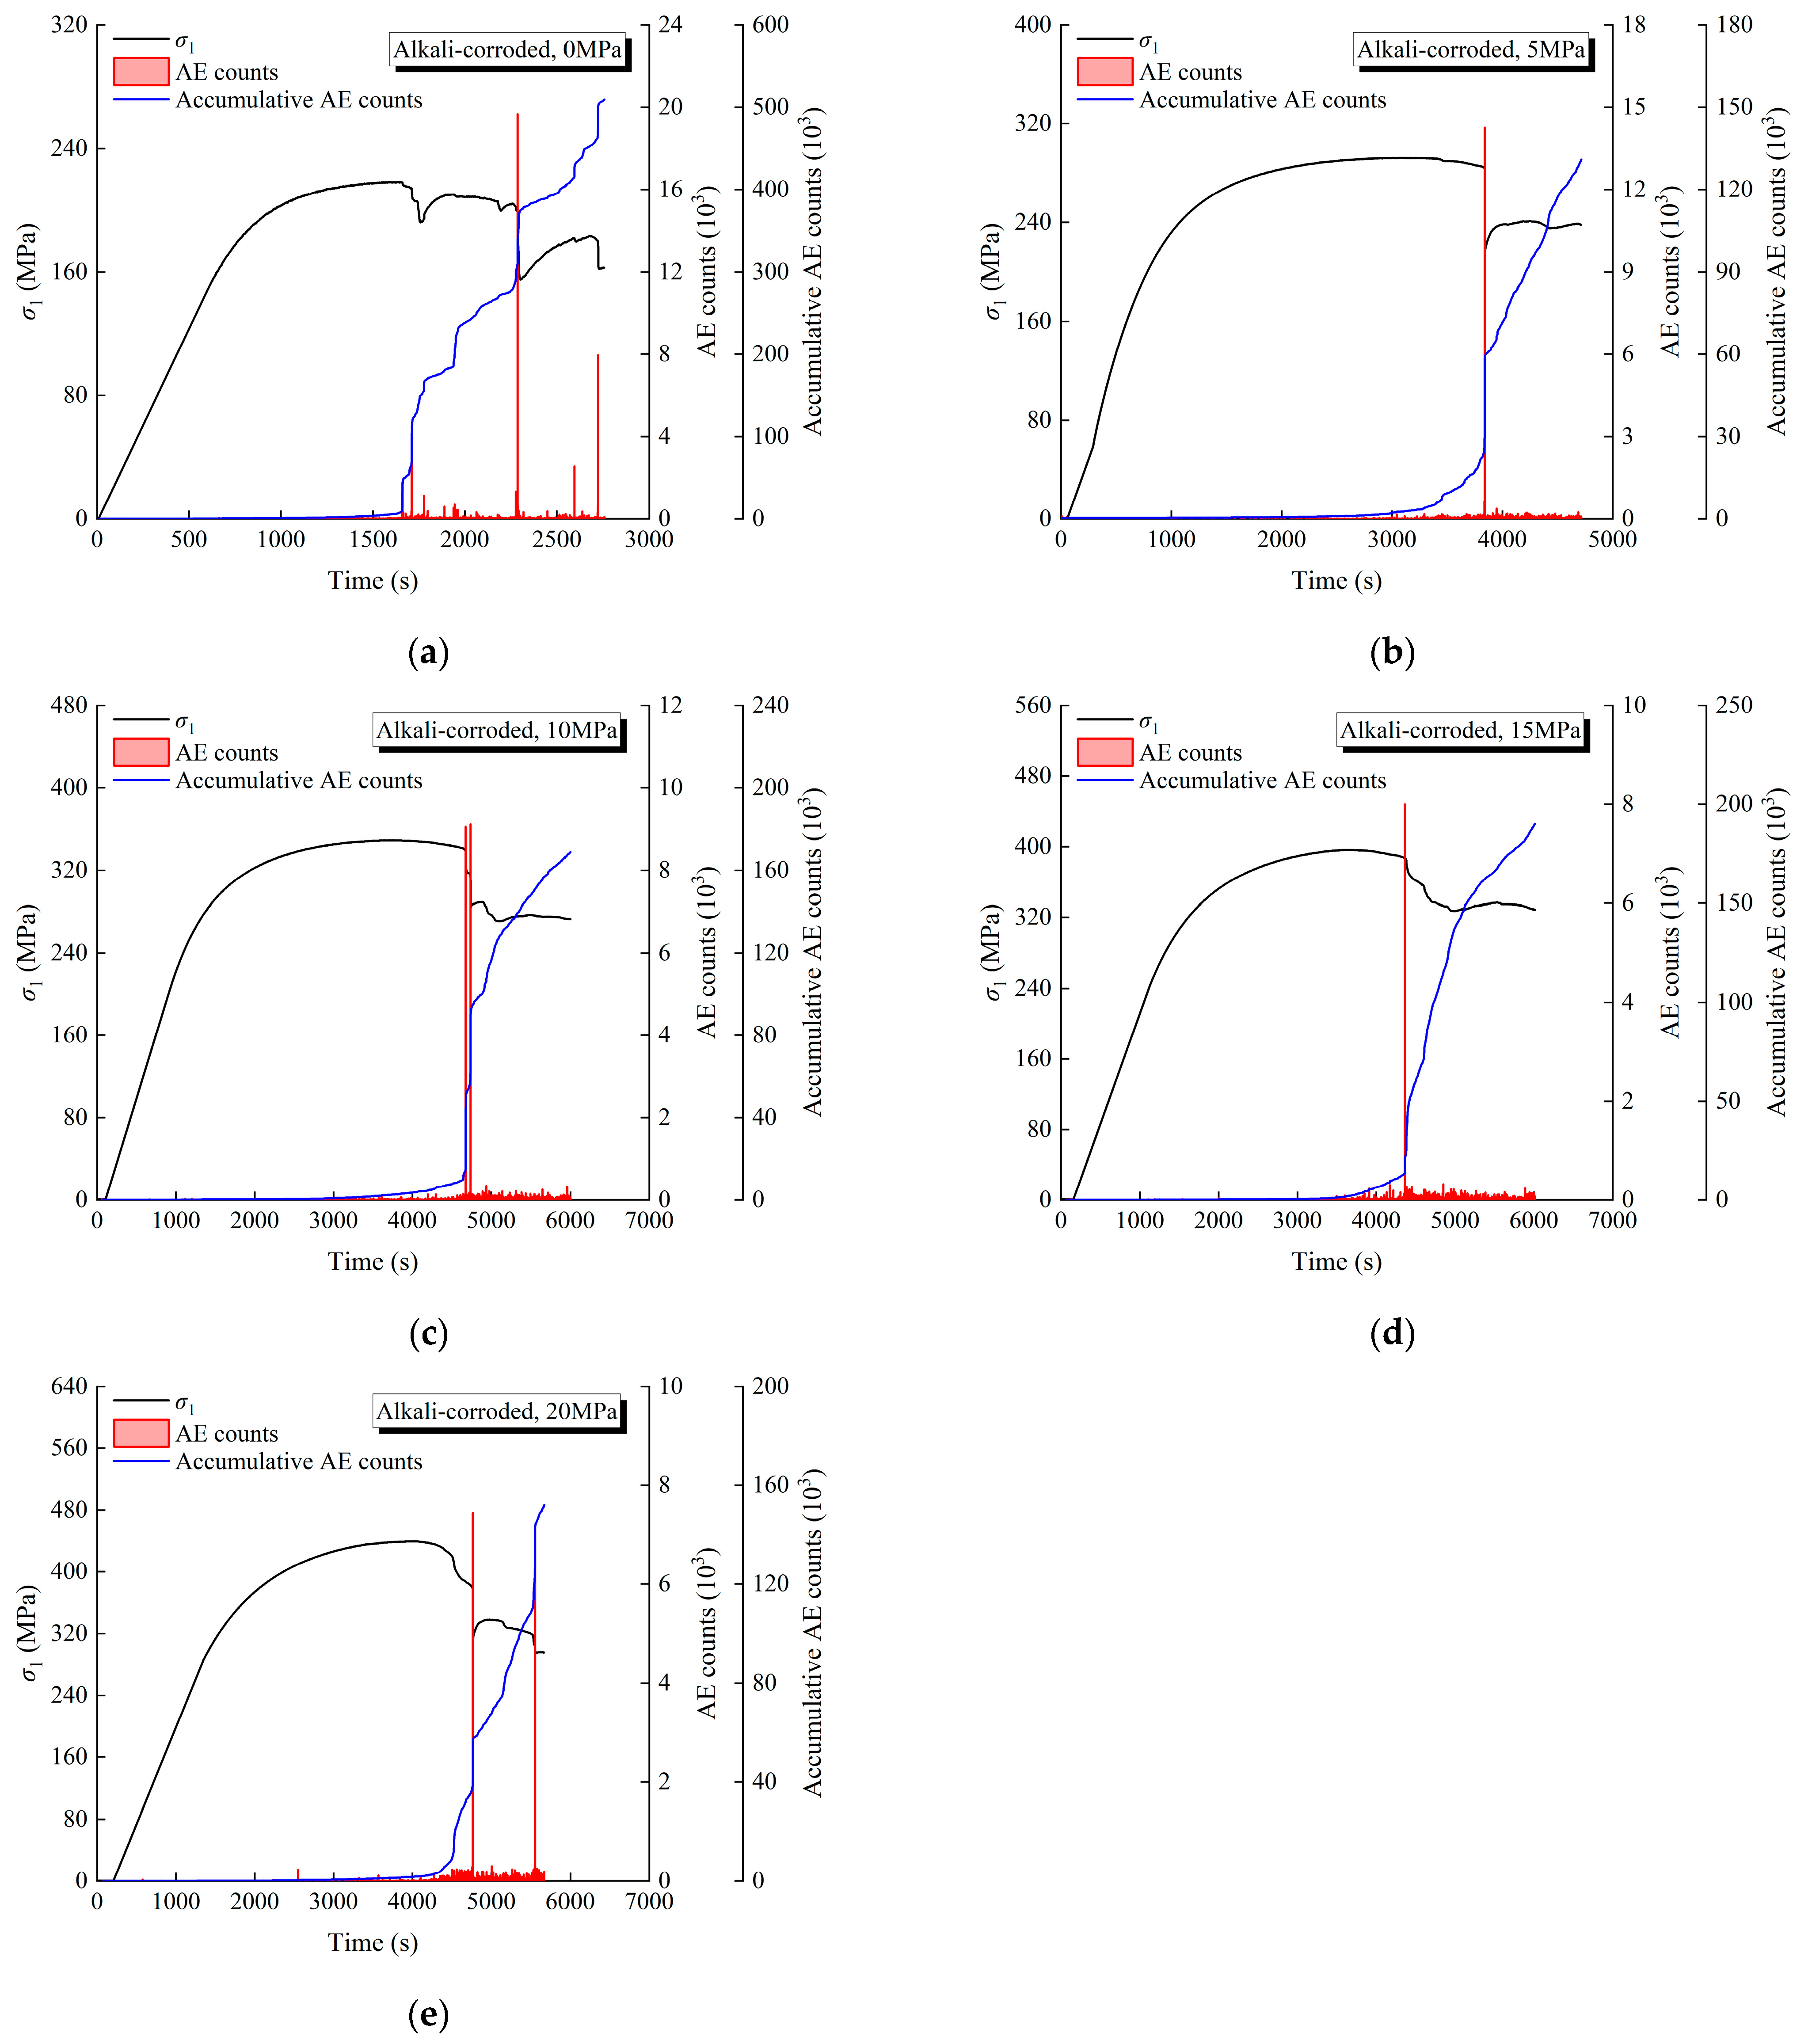
4.1. Time Domain Characteristics of AE Counts
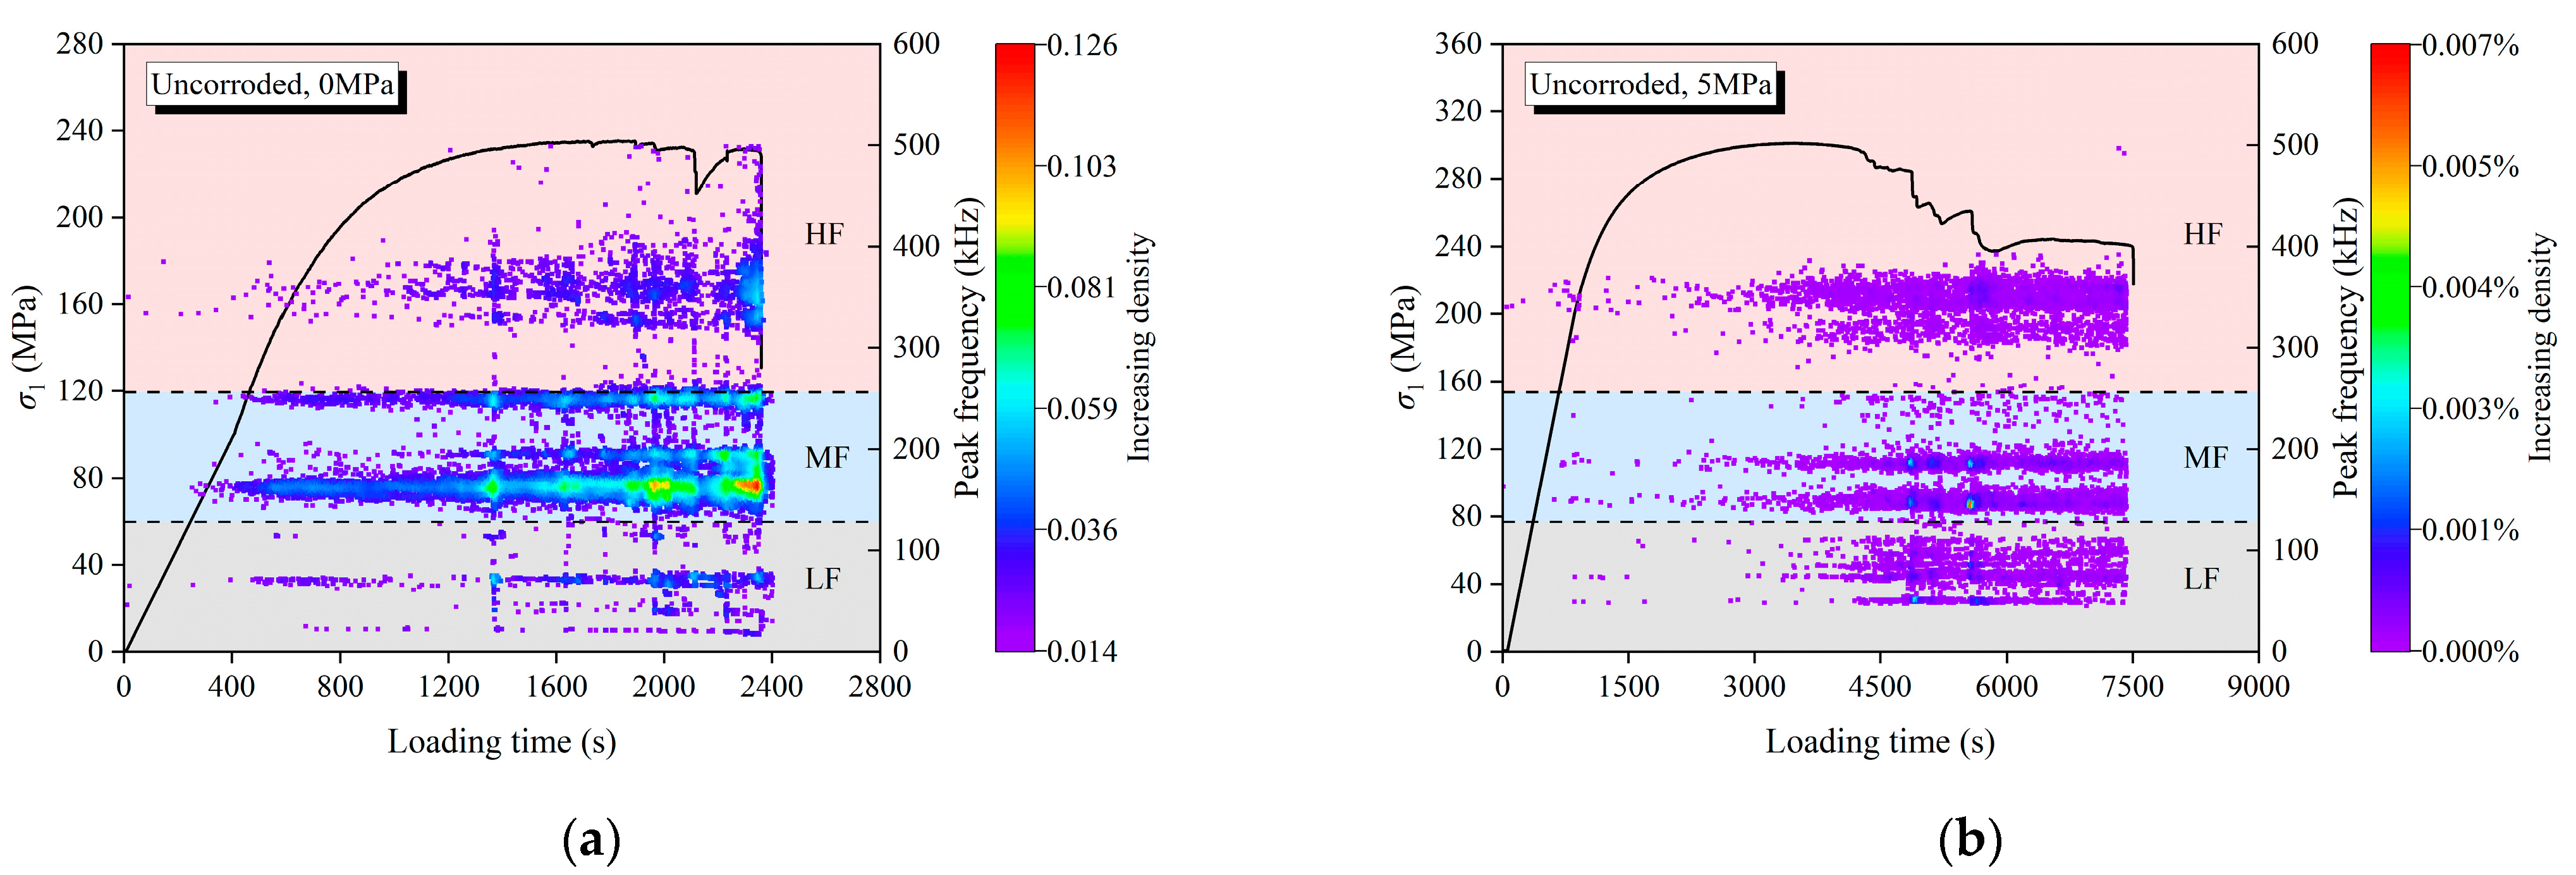
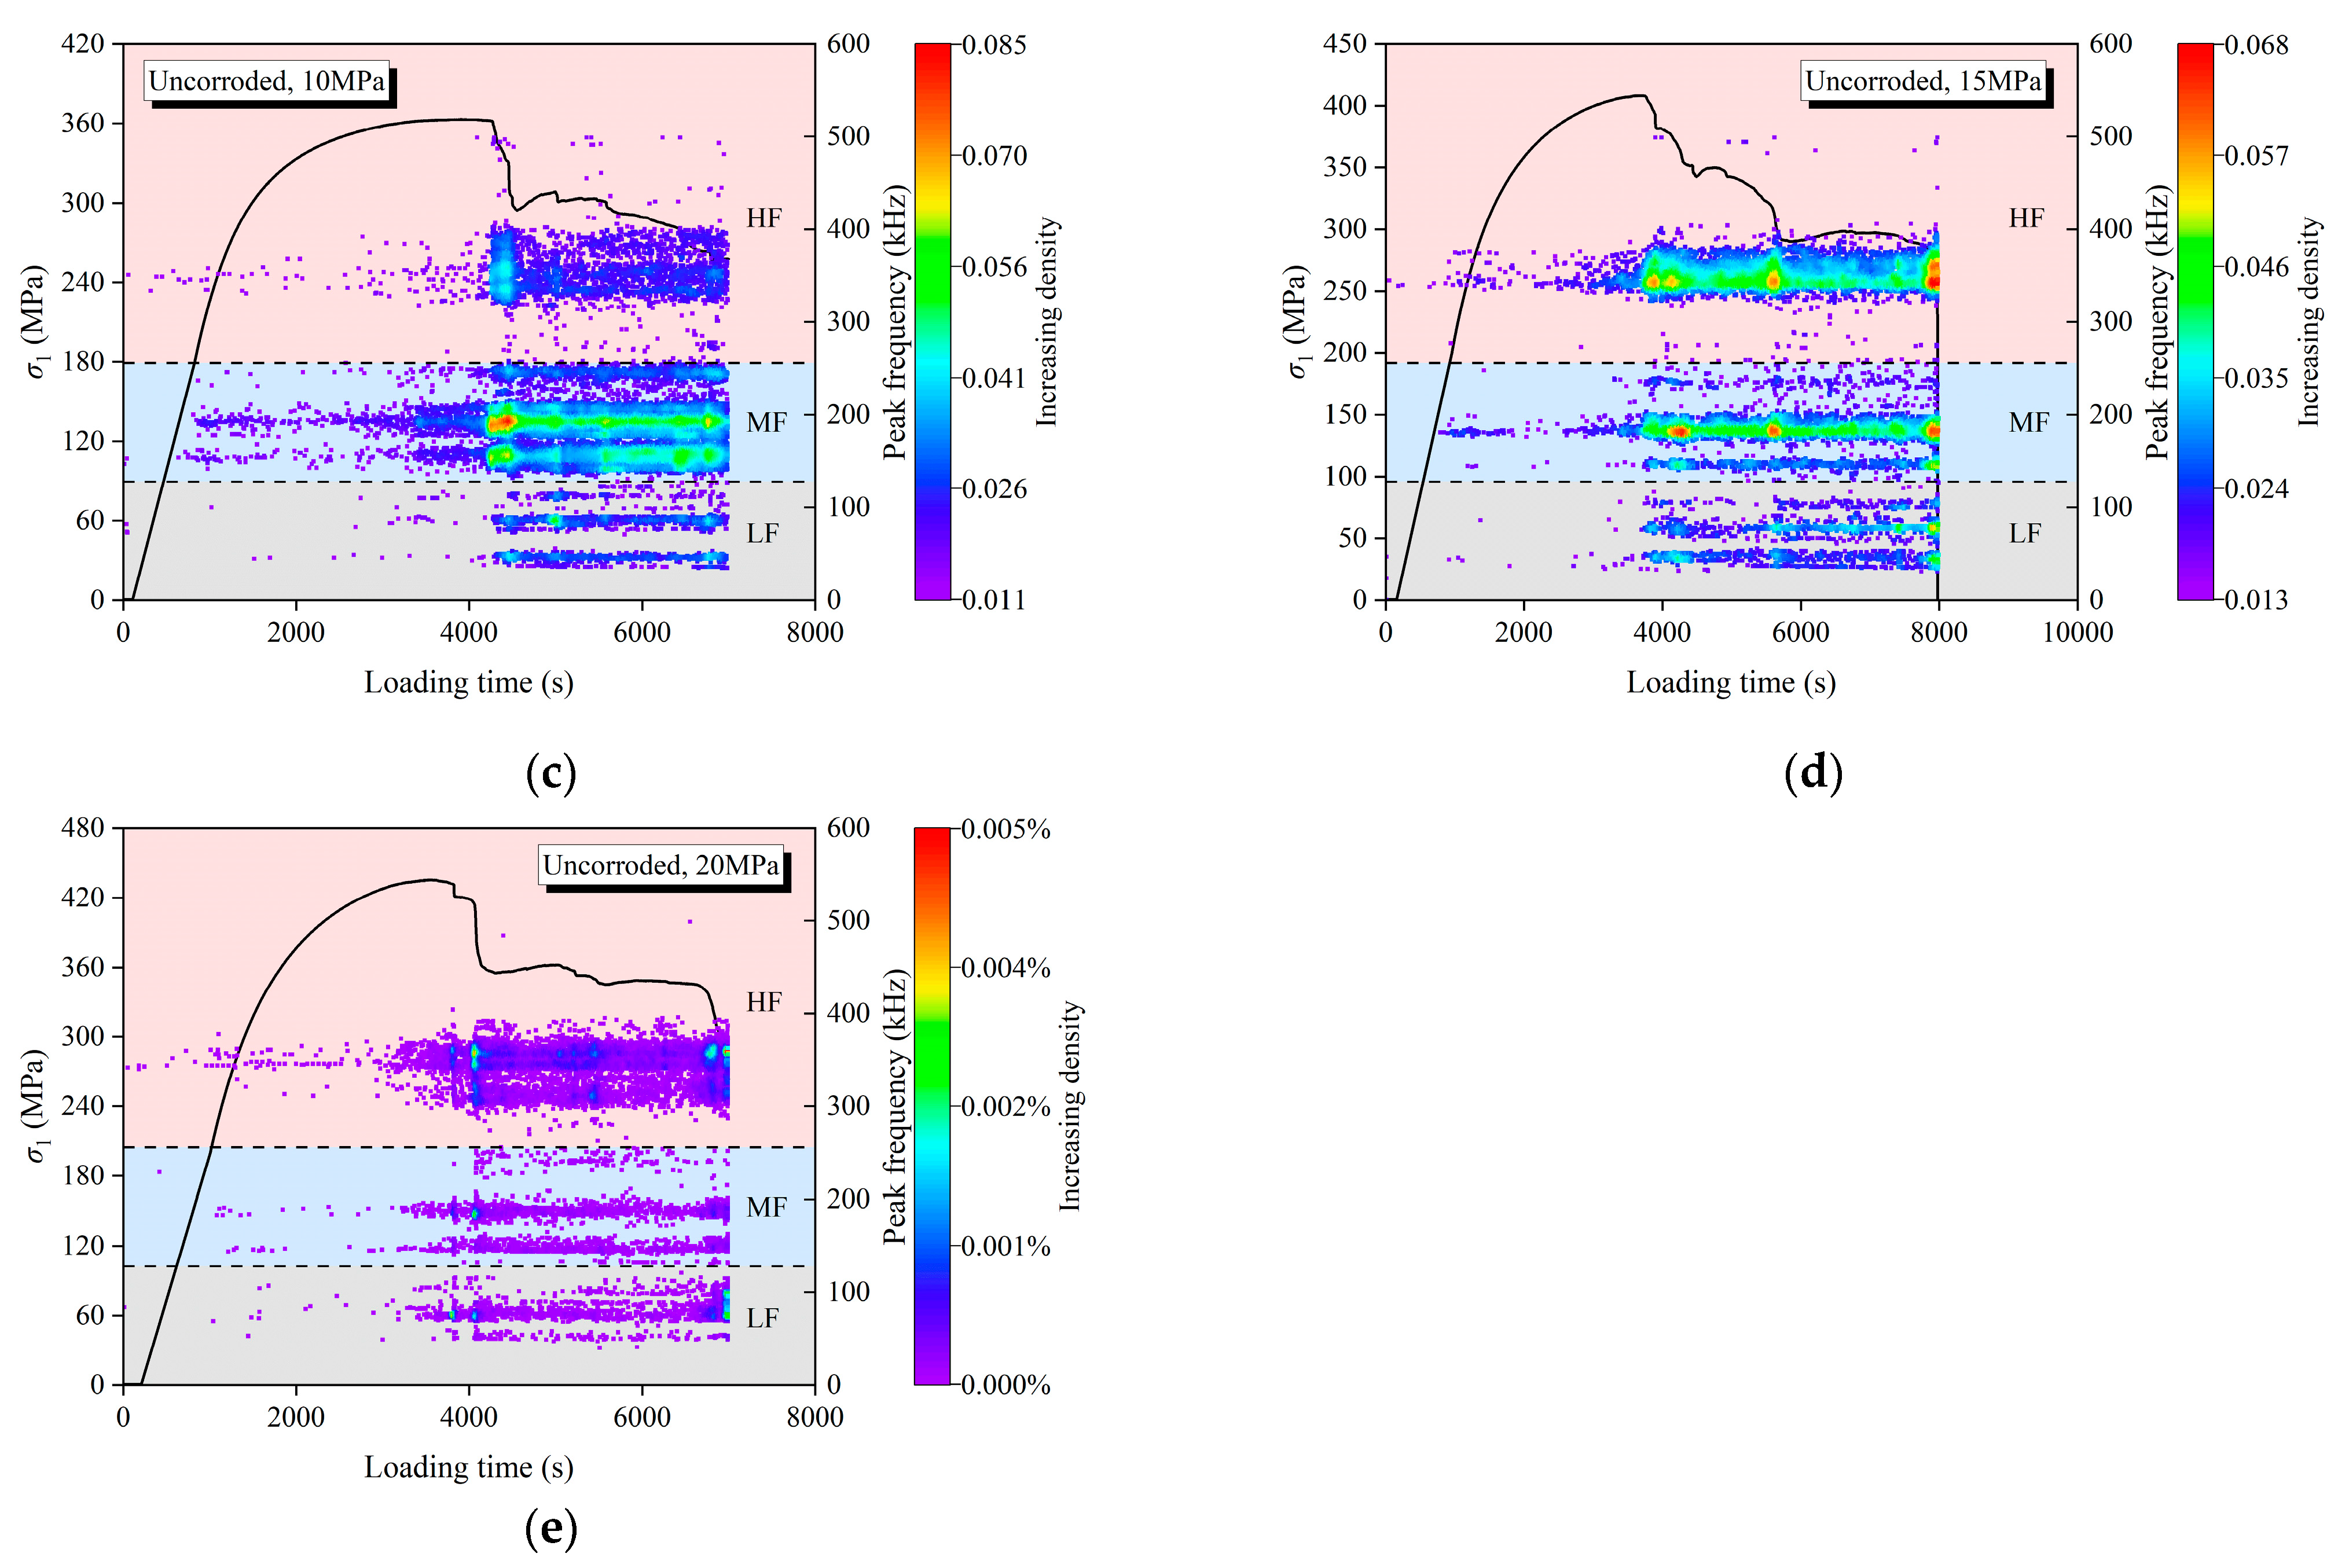
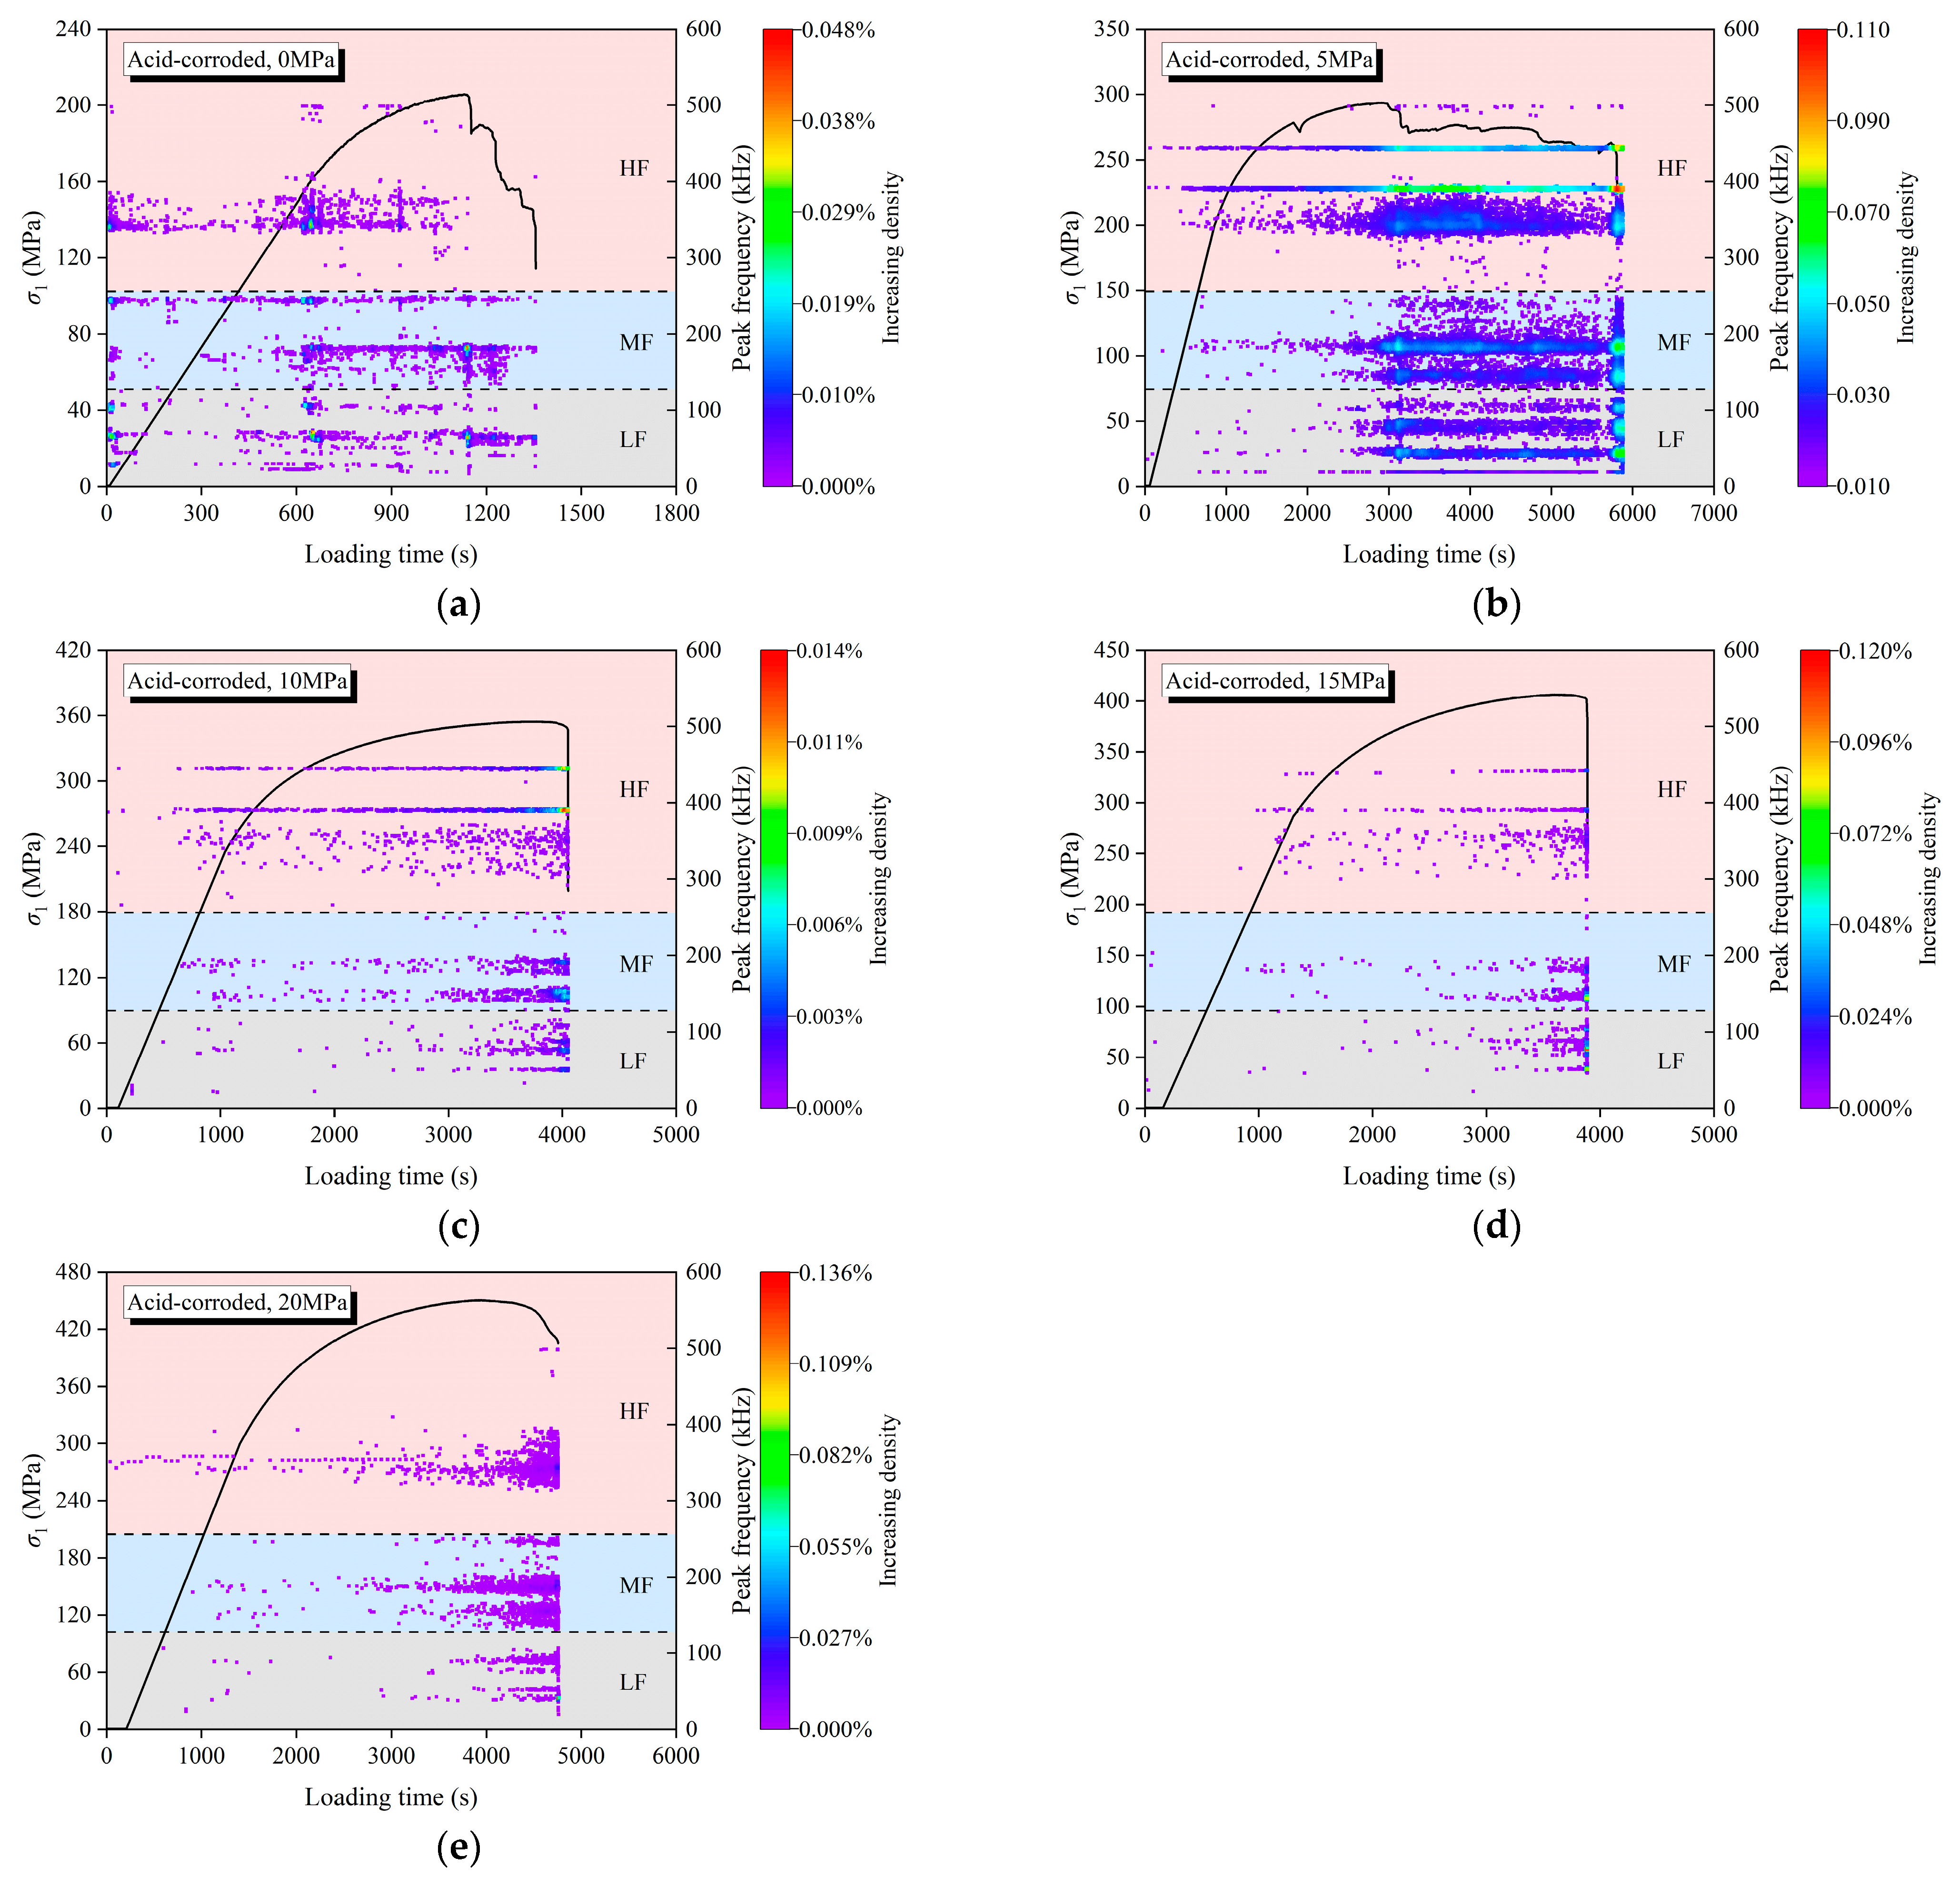
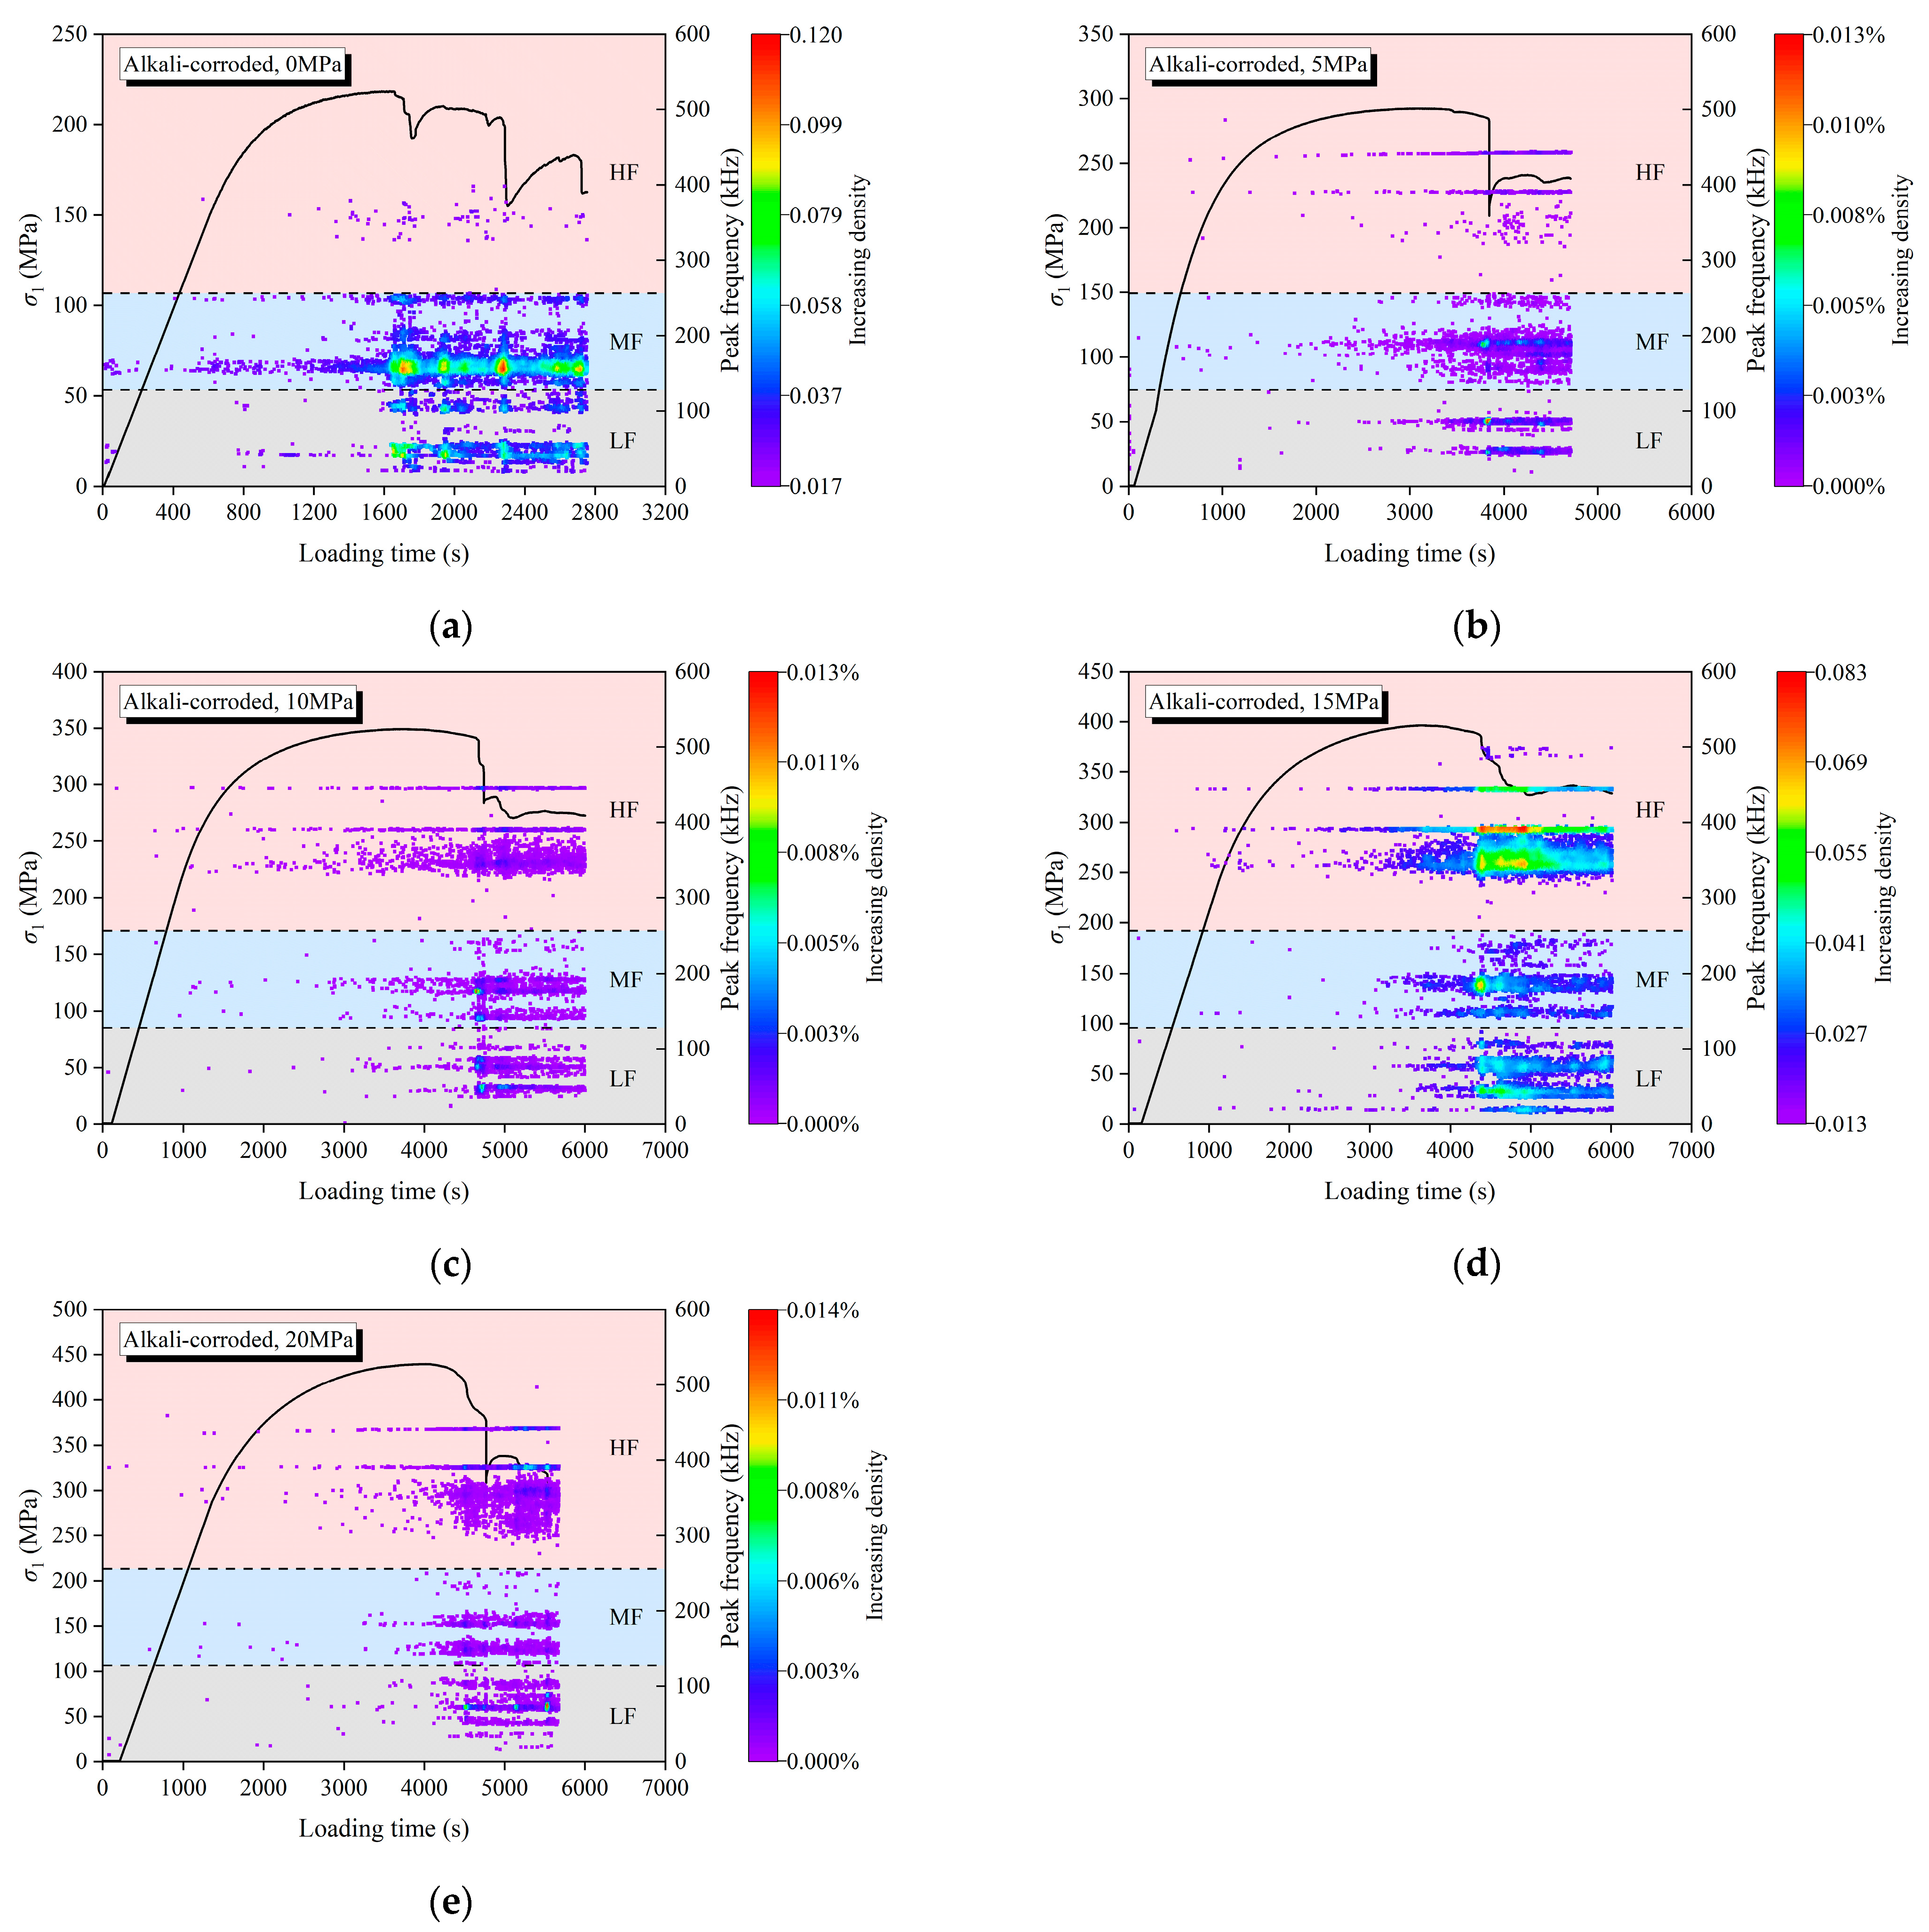
4.2. AE Frequency Domain Characteristics
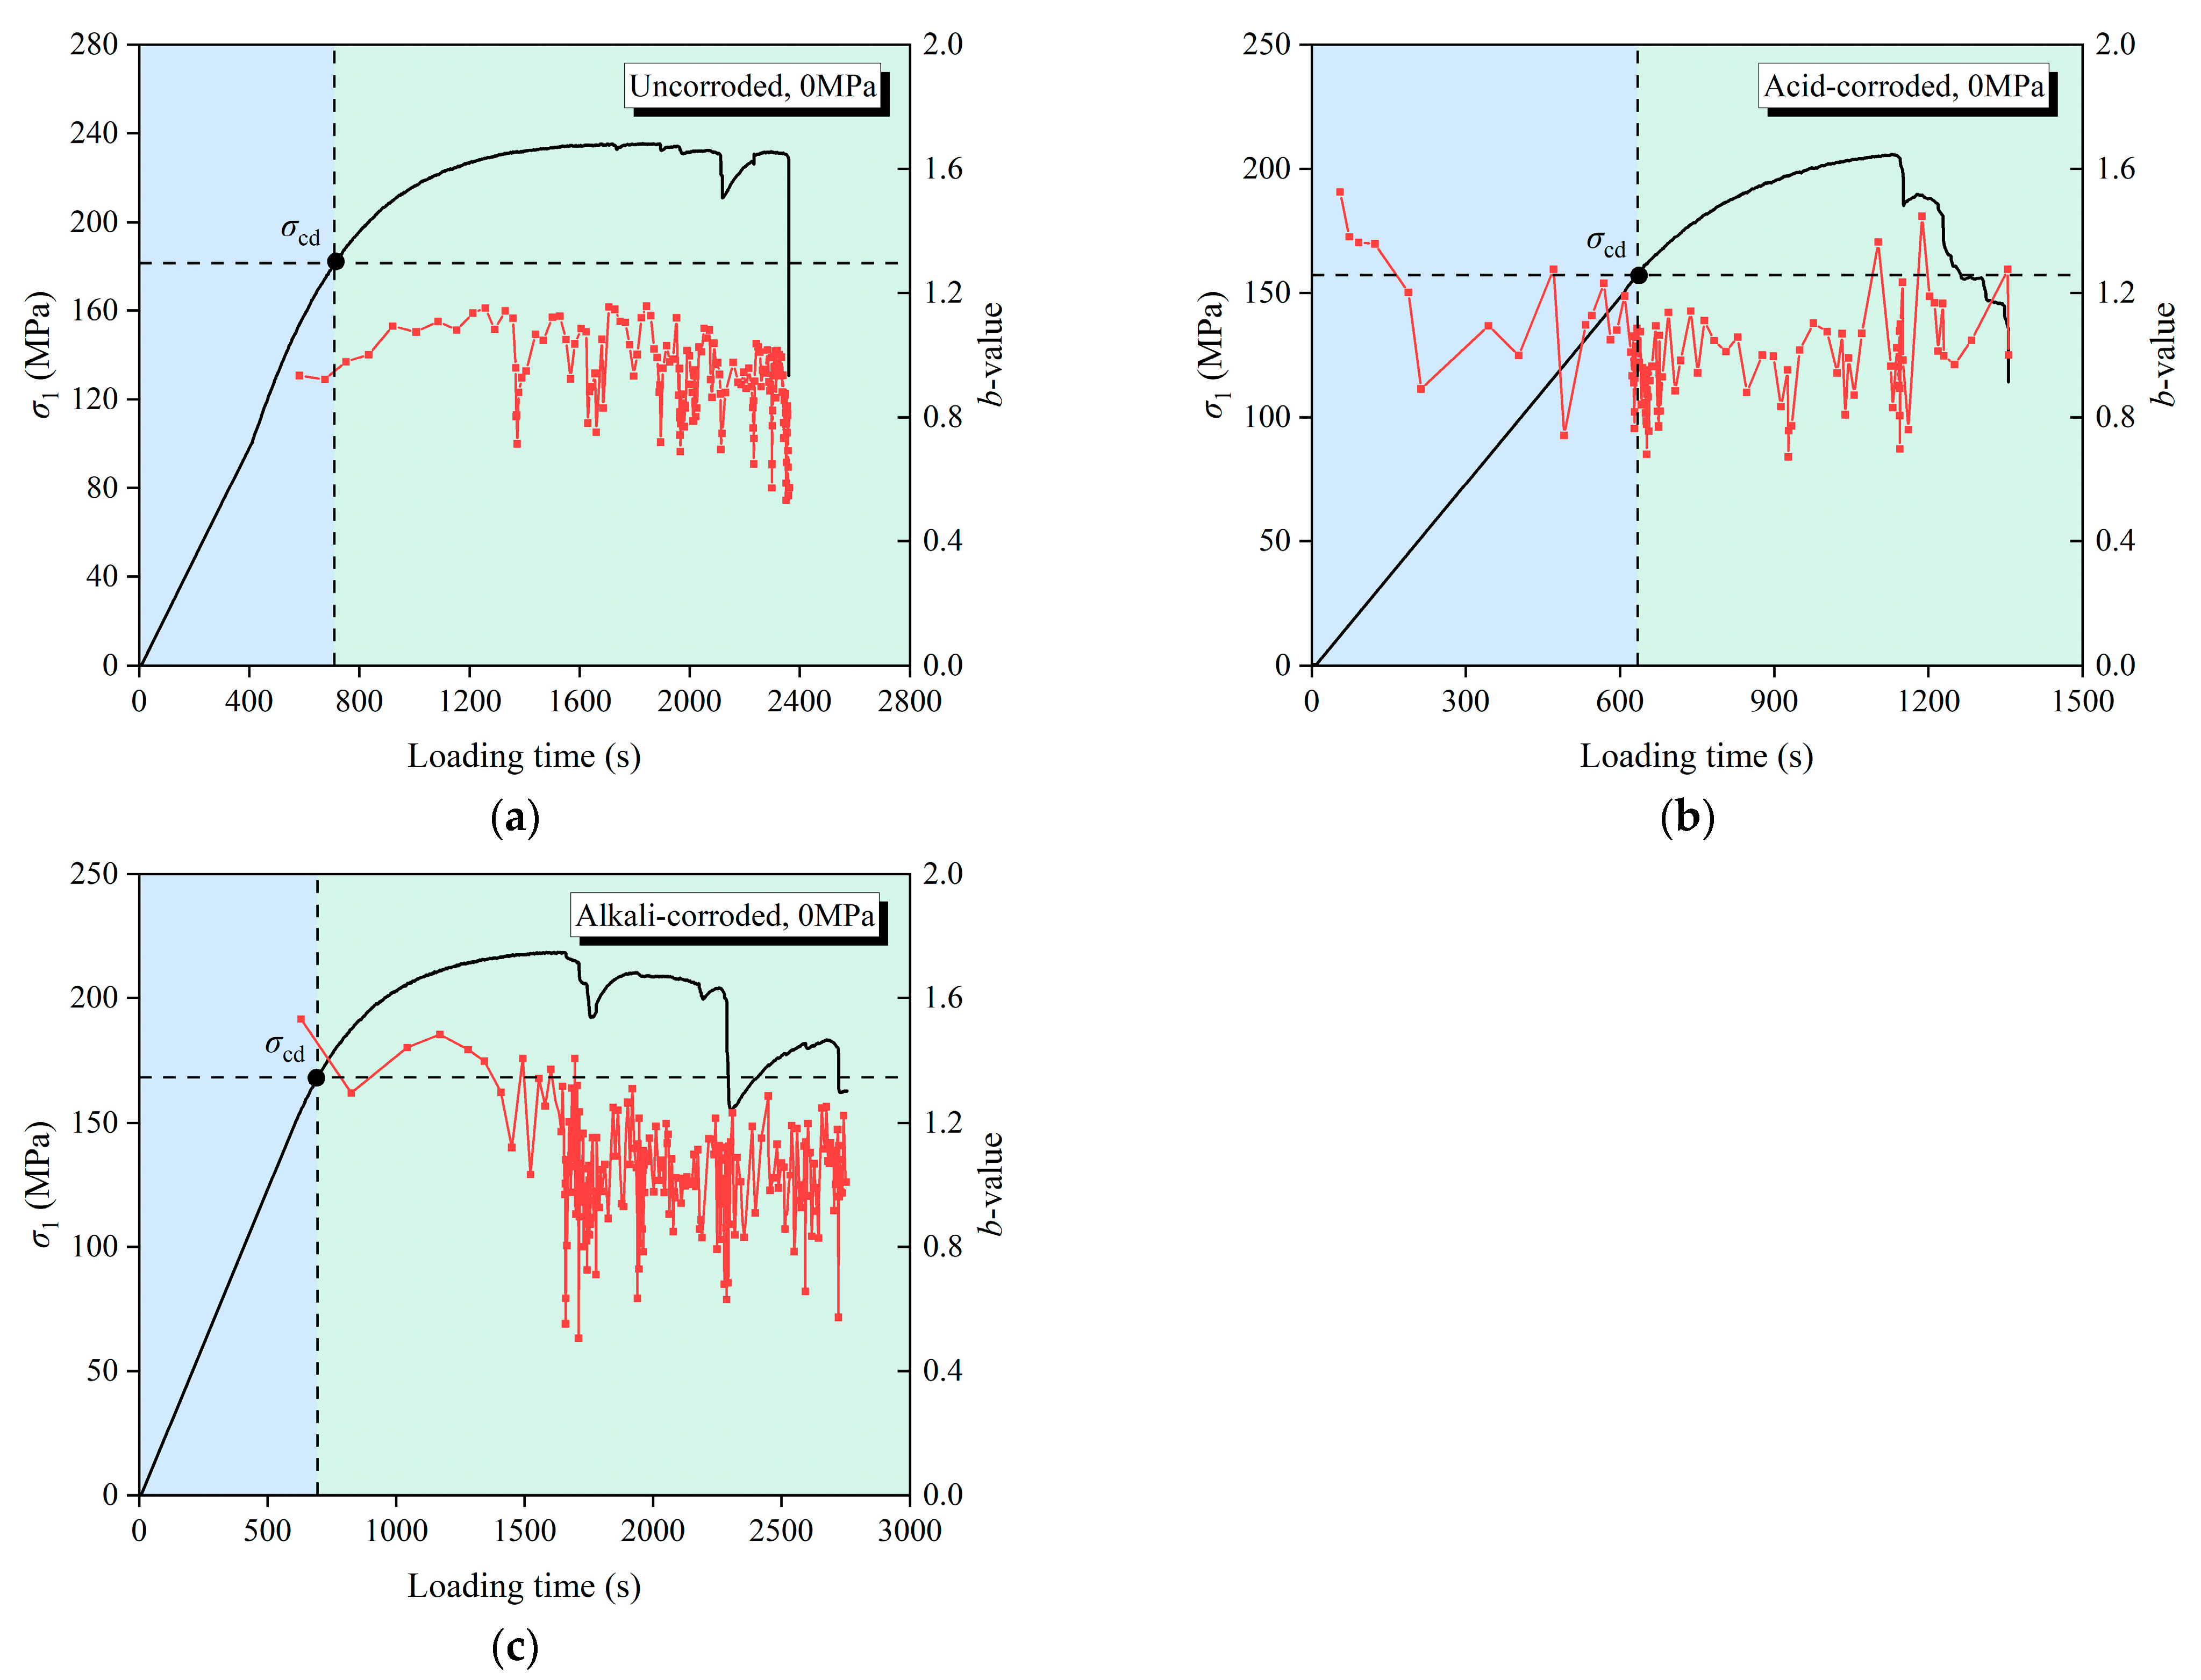
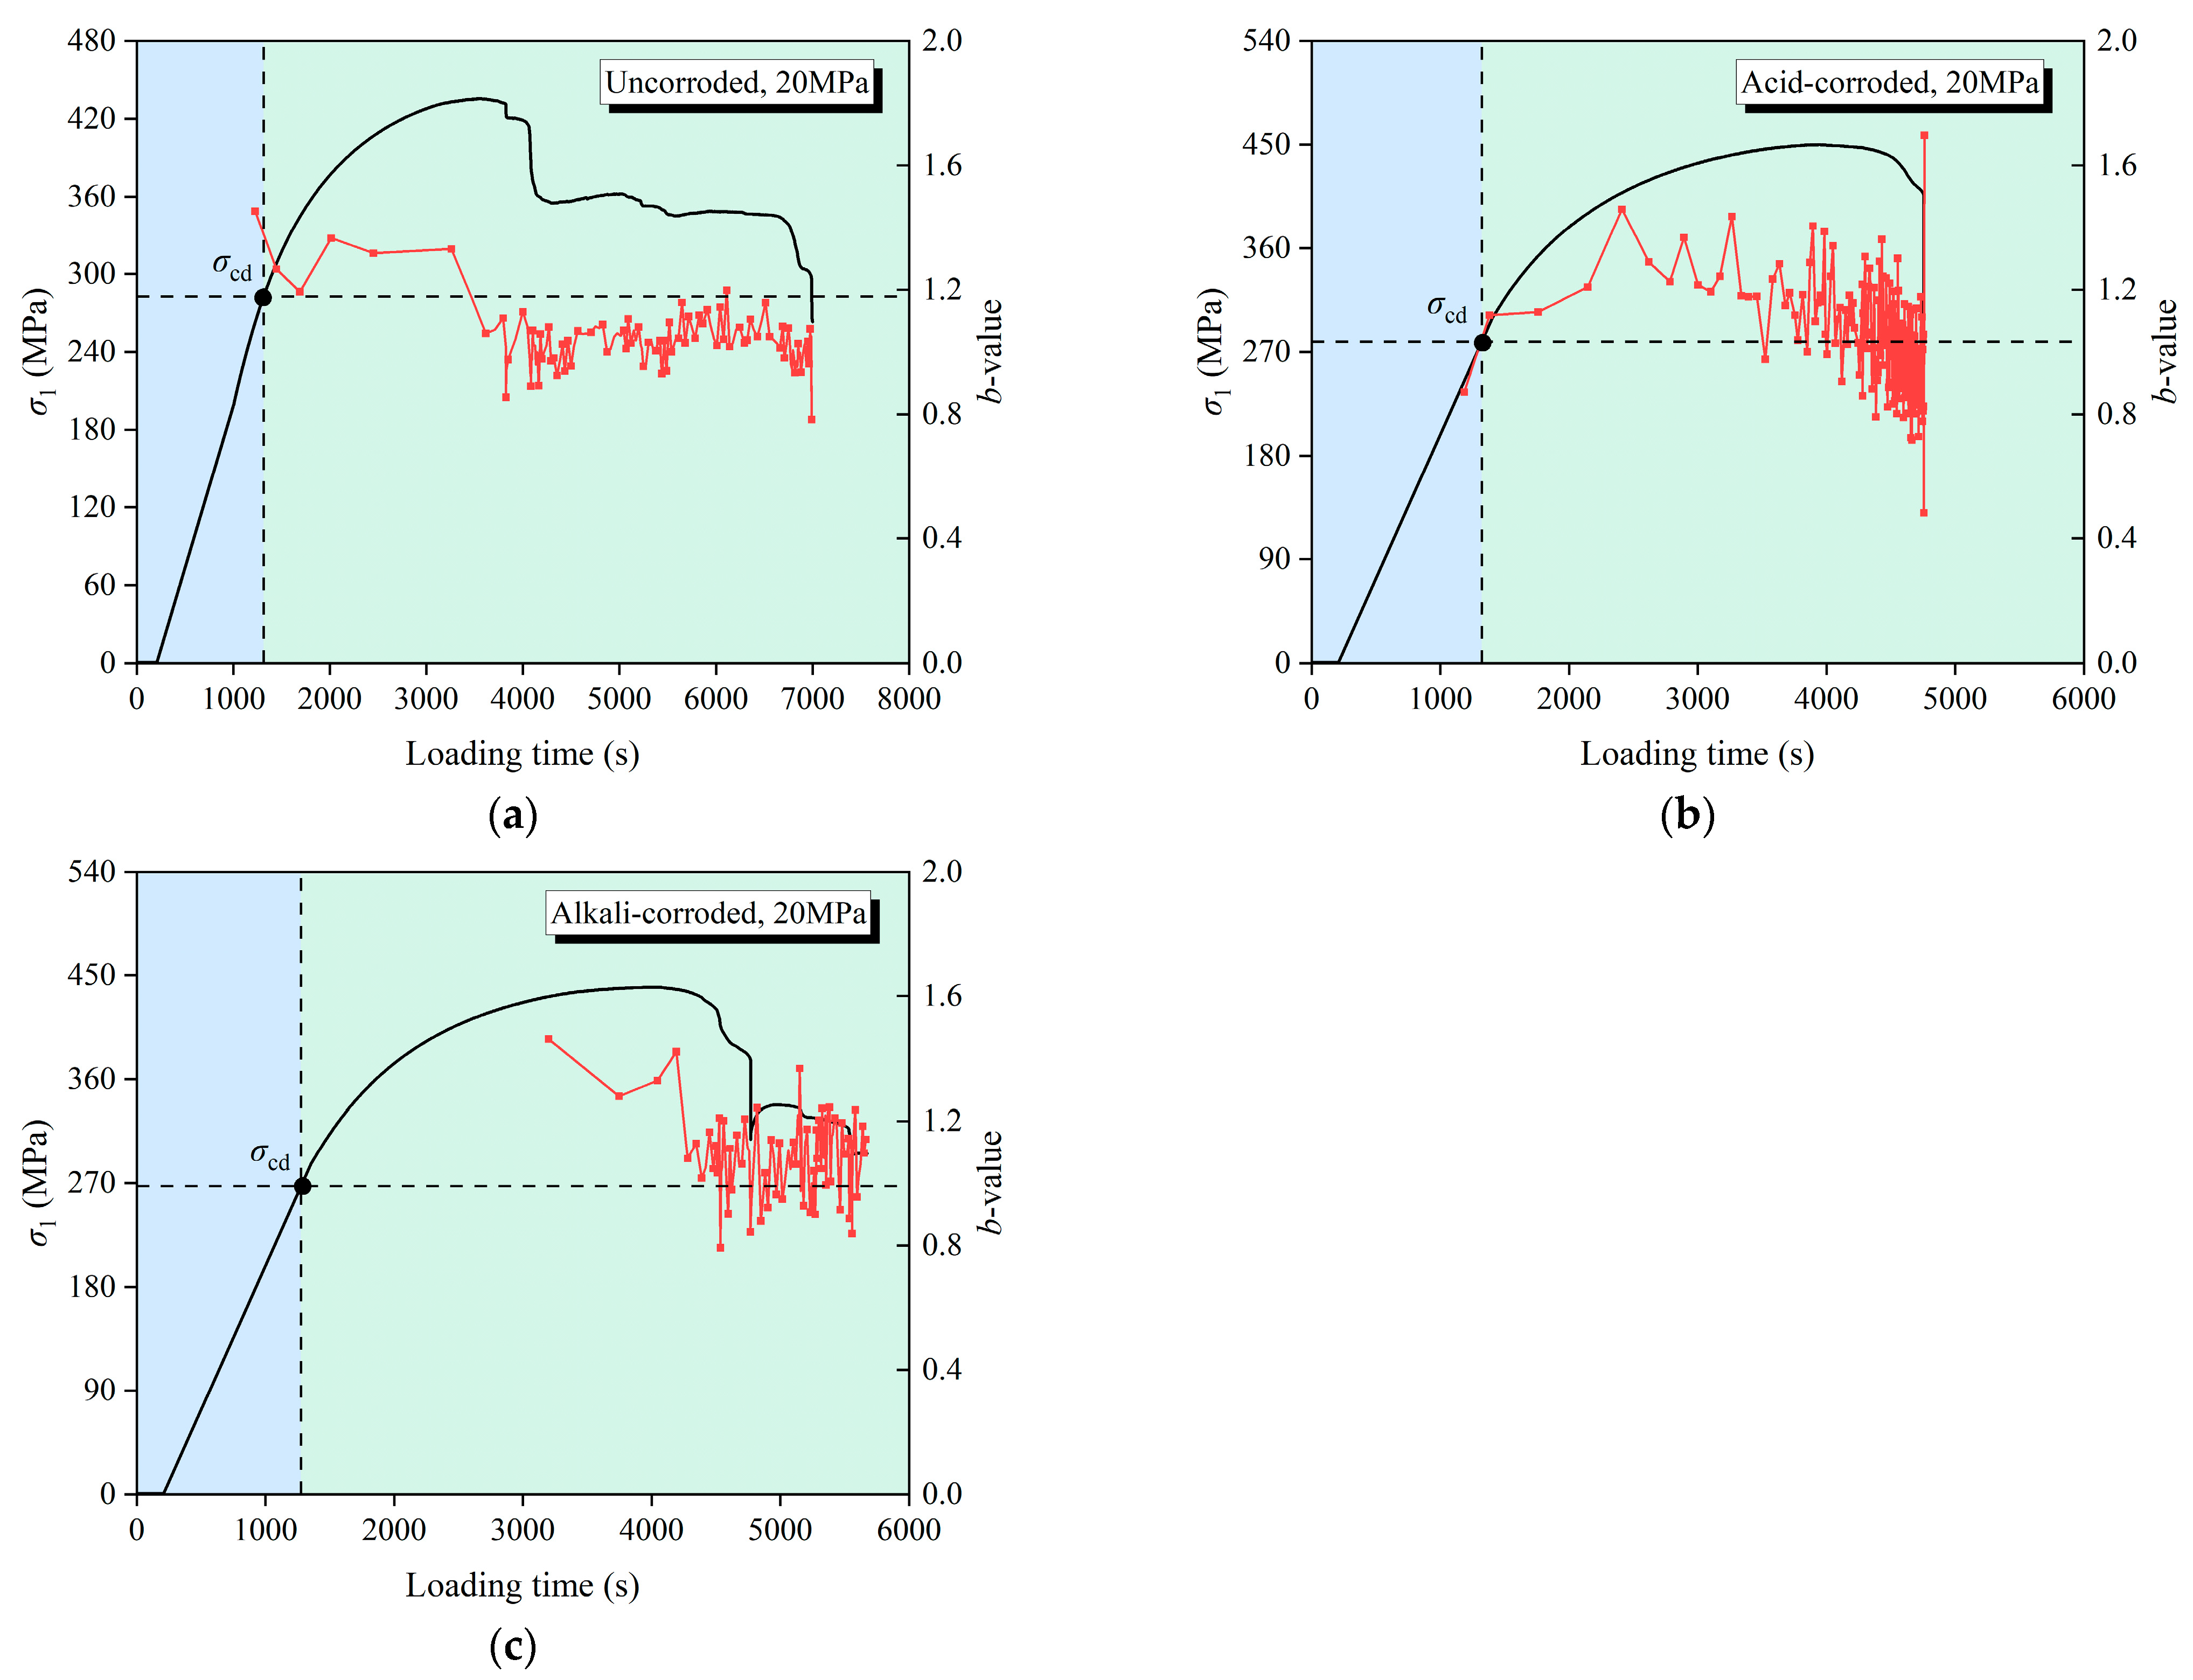
4.3. AE b-Value
5. Discussion
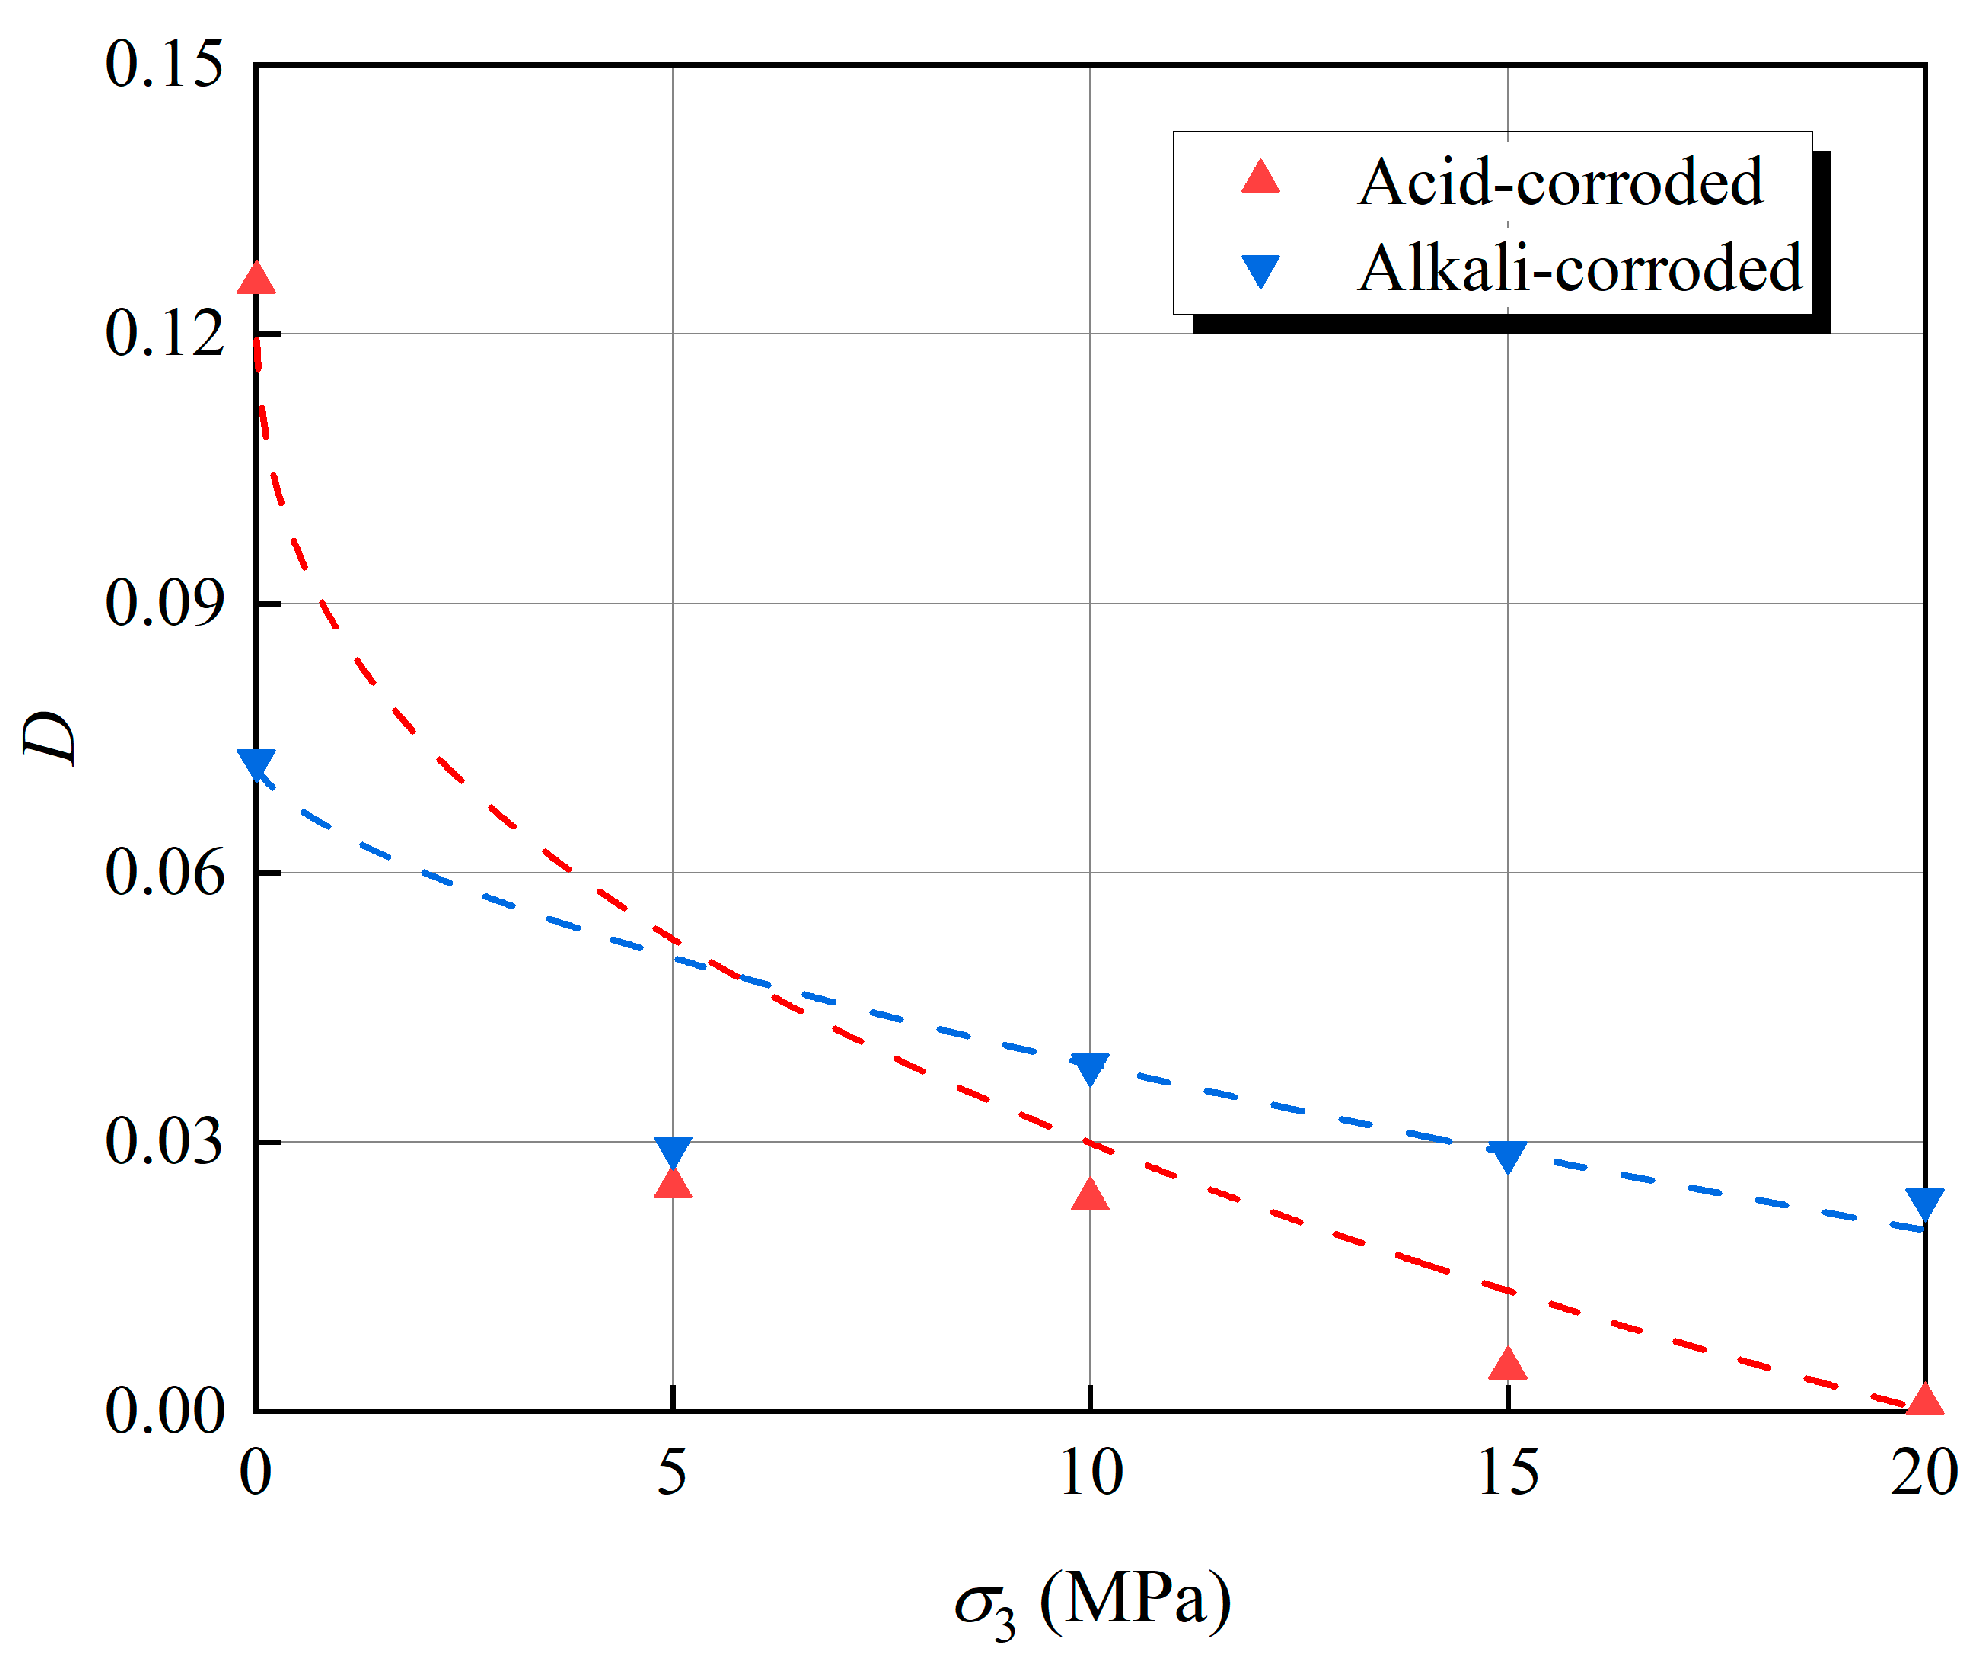
5.1. Effect of Confining Pressure on Chemical Damage
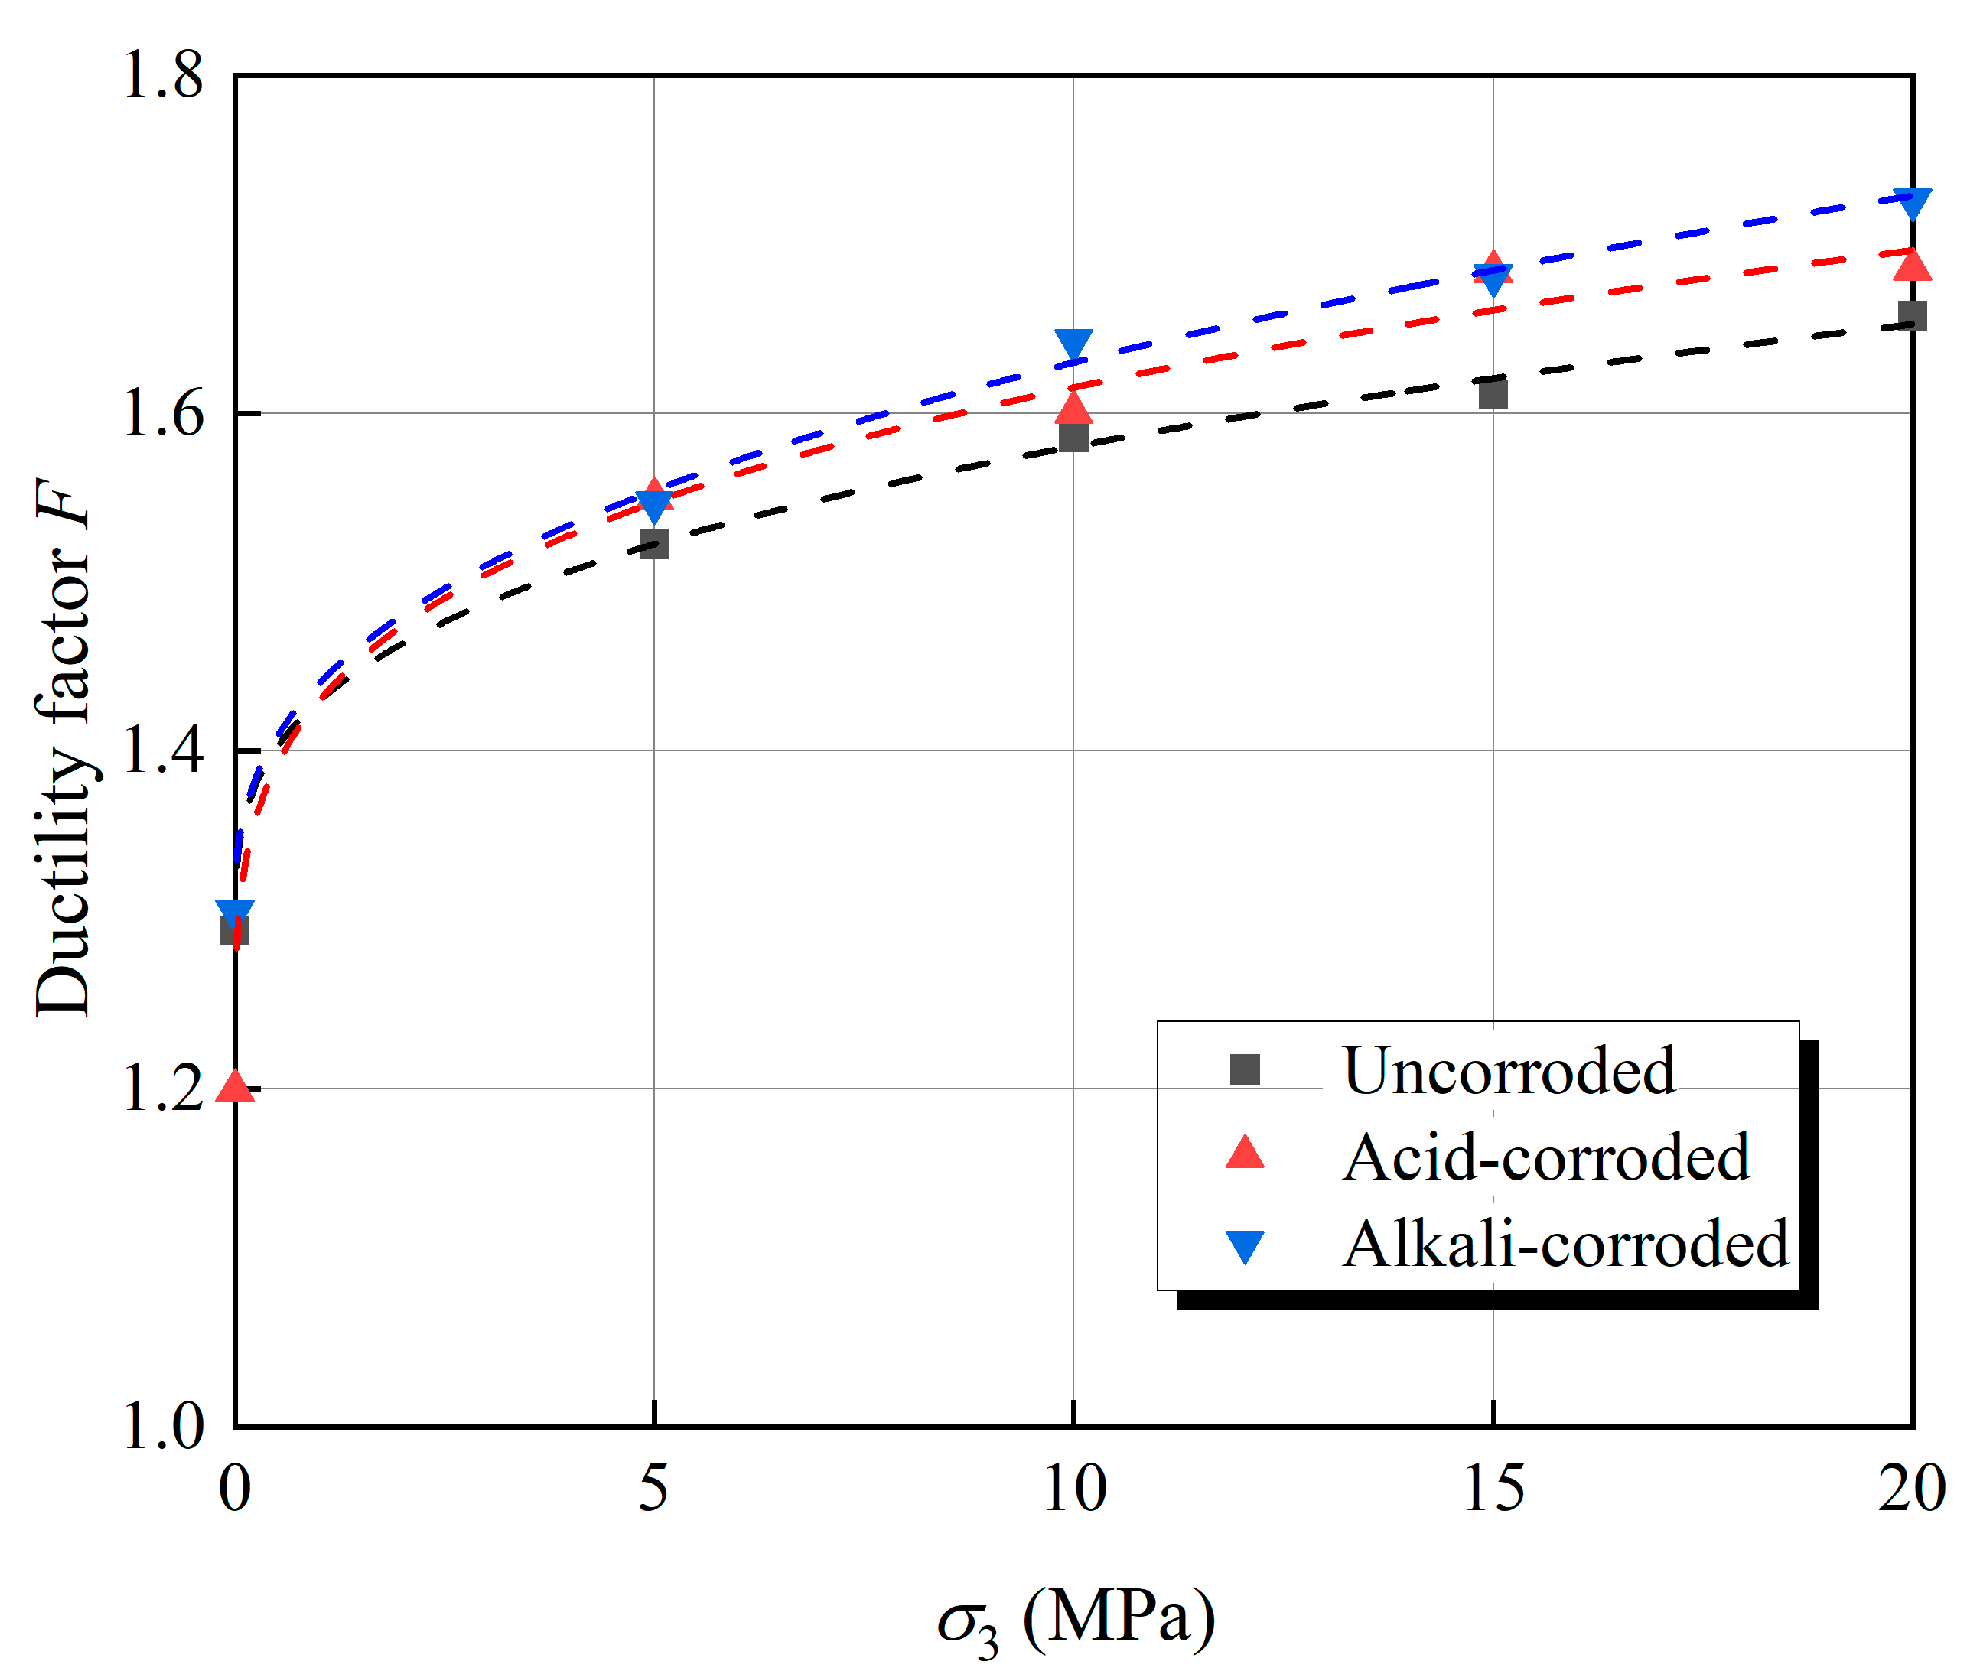
5.2. Effect of Confining Pressure on Brittle–Ductile Transition
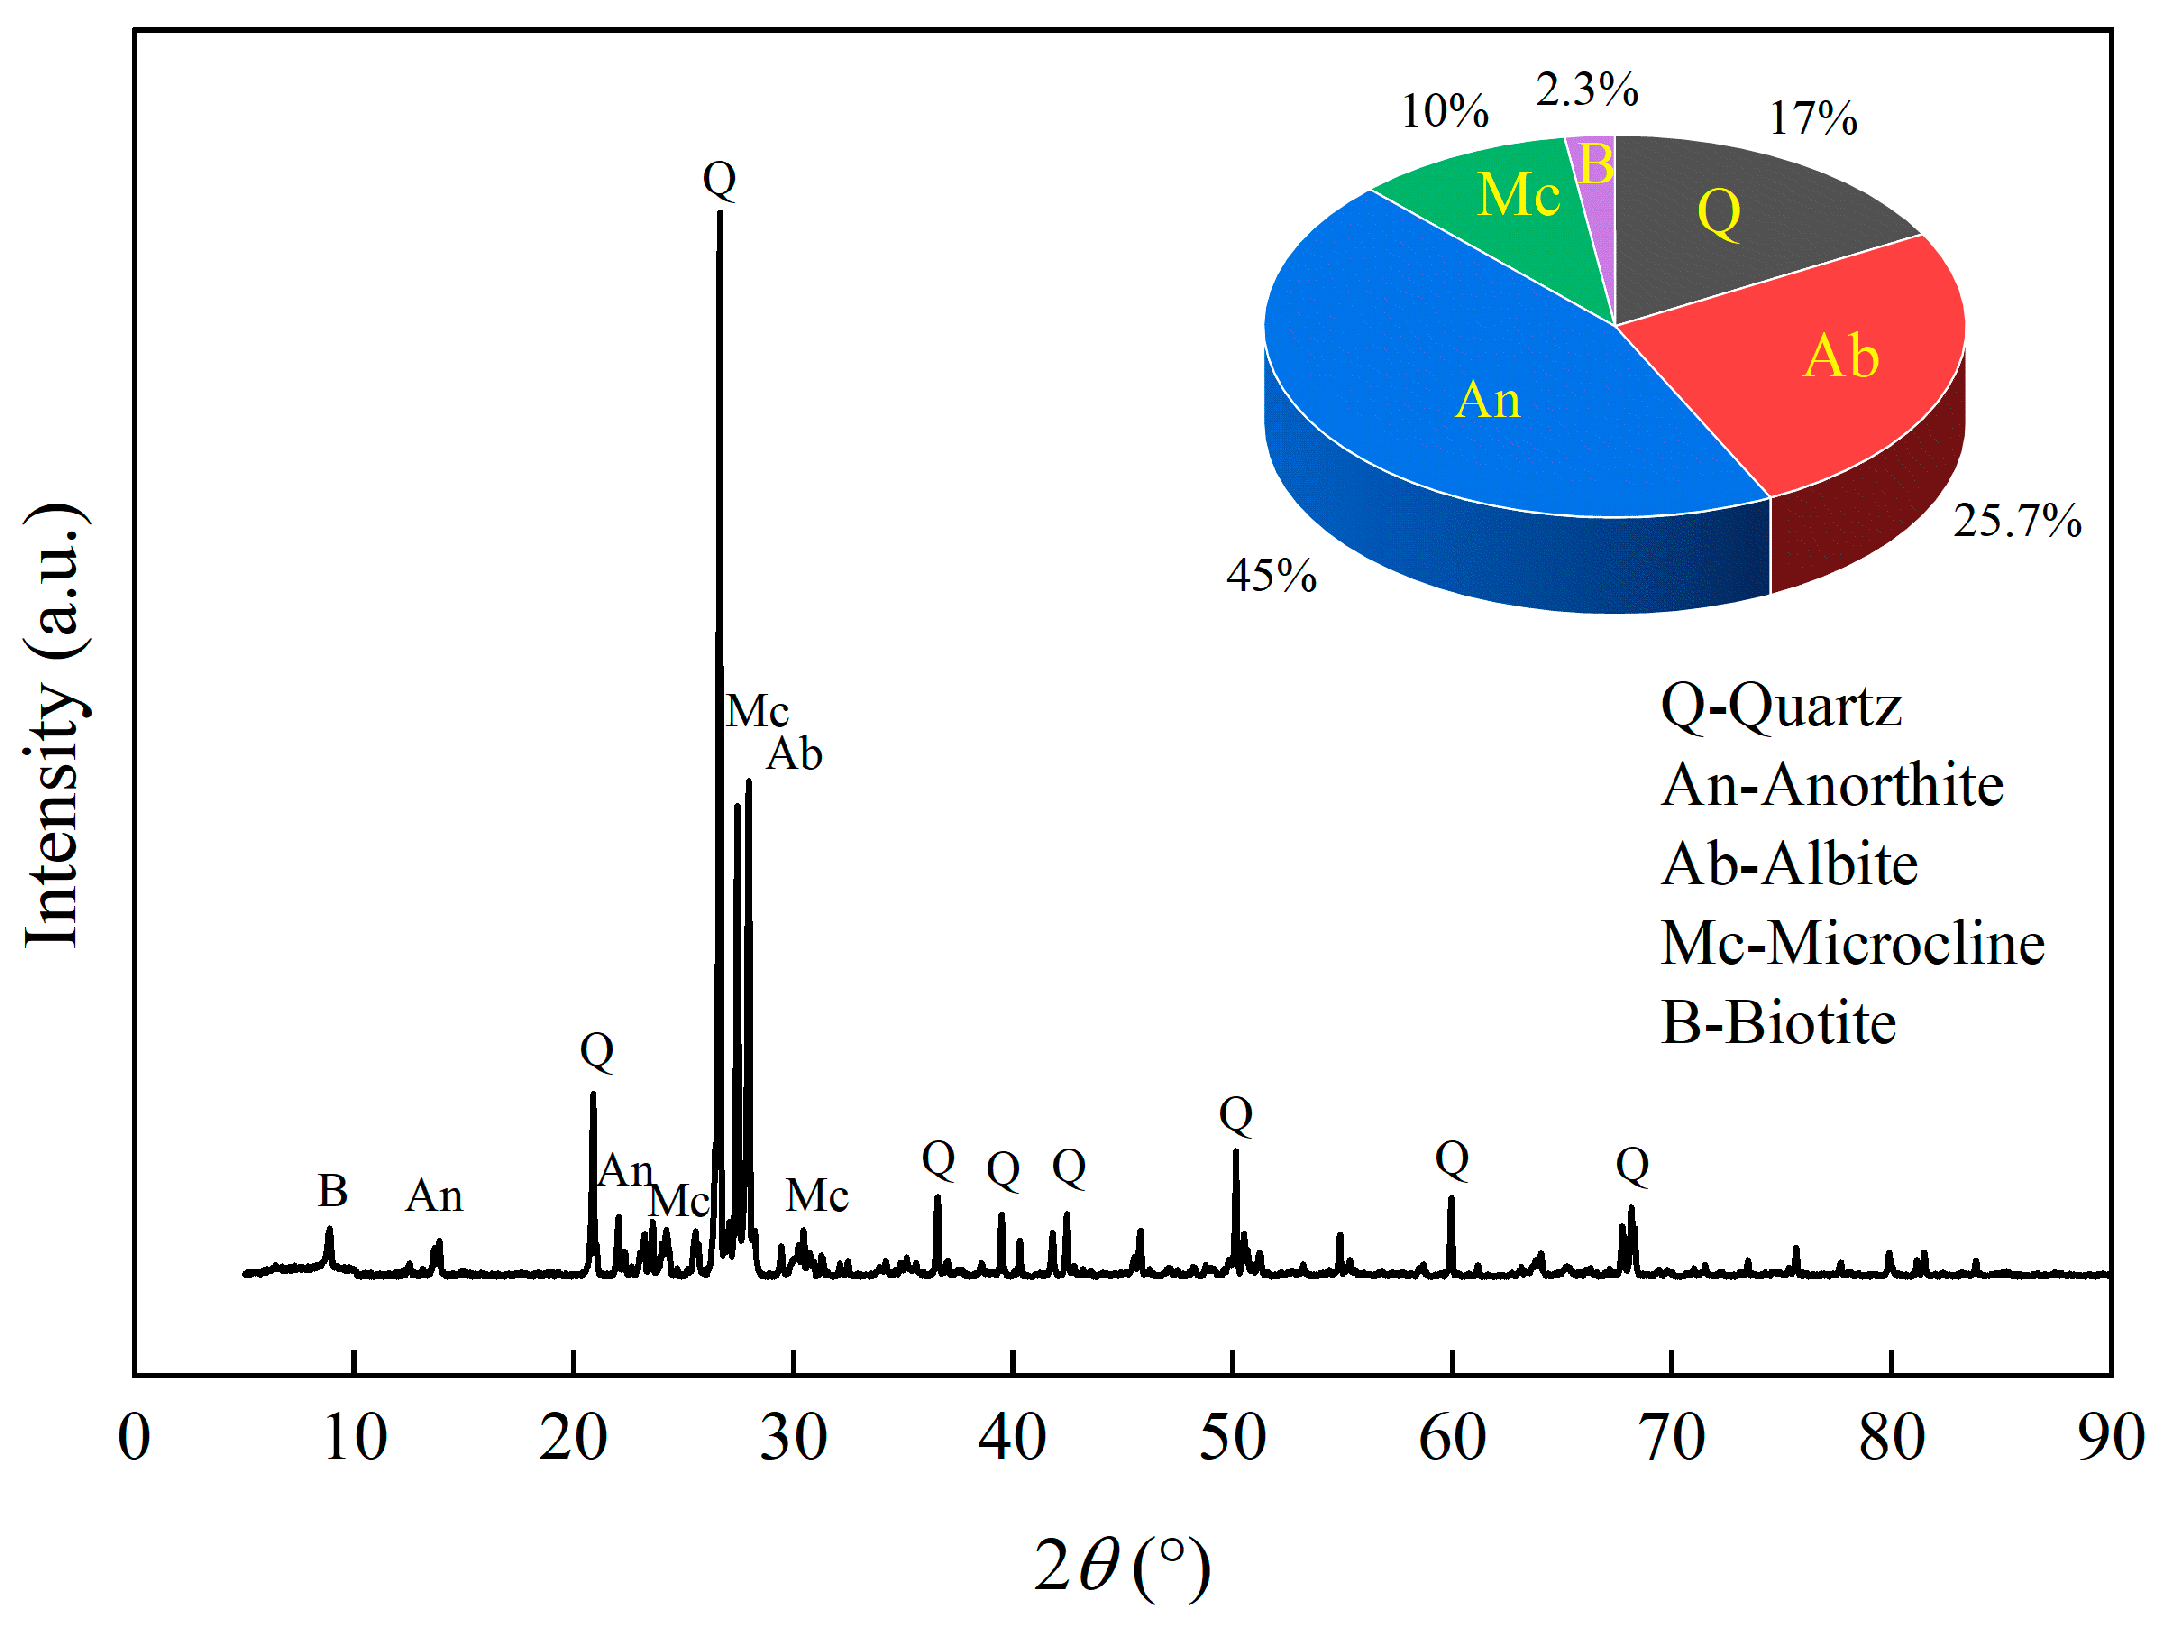
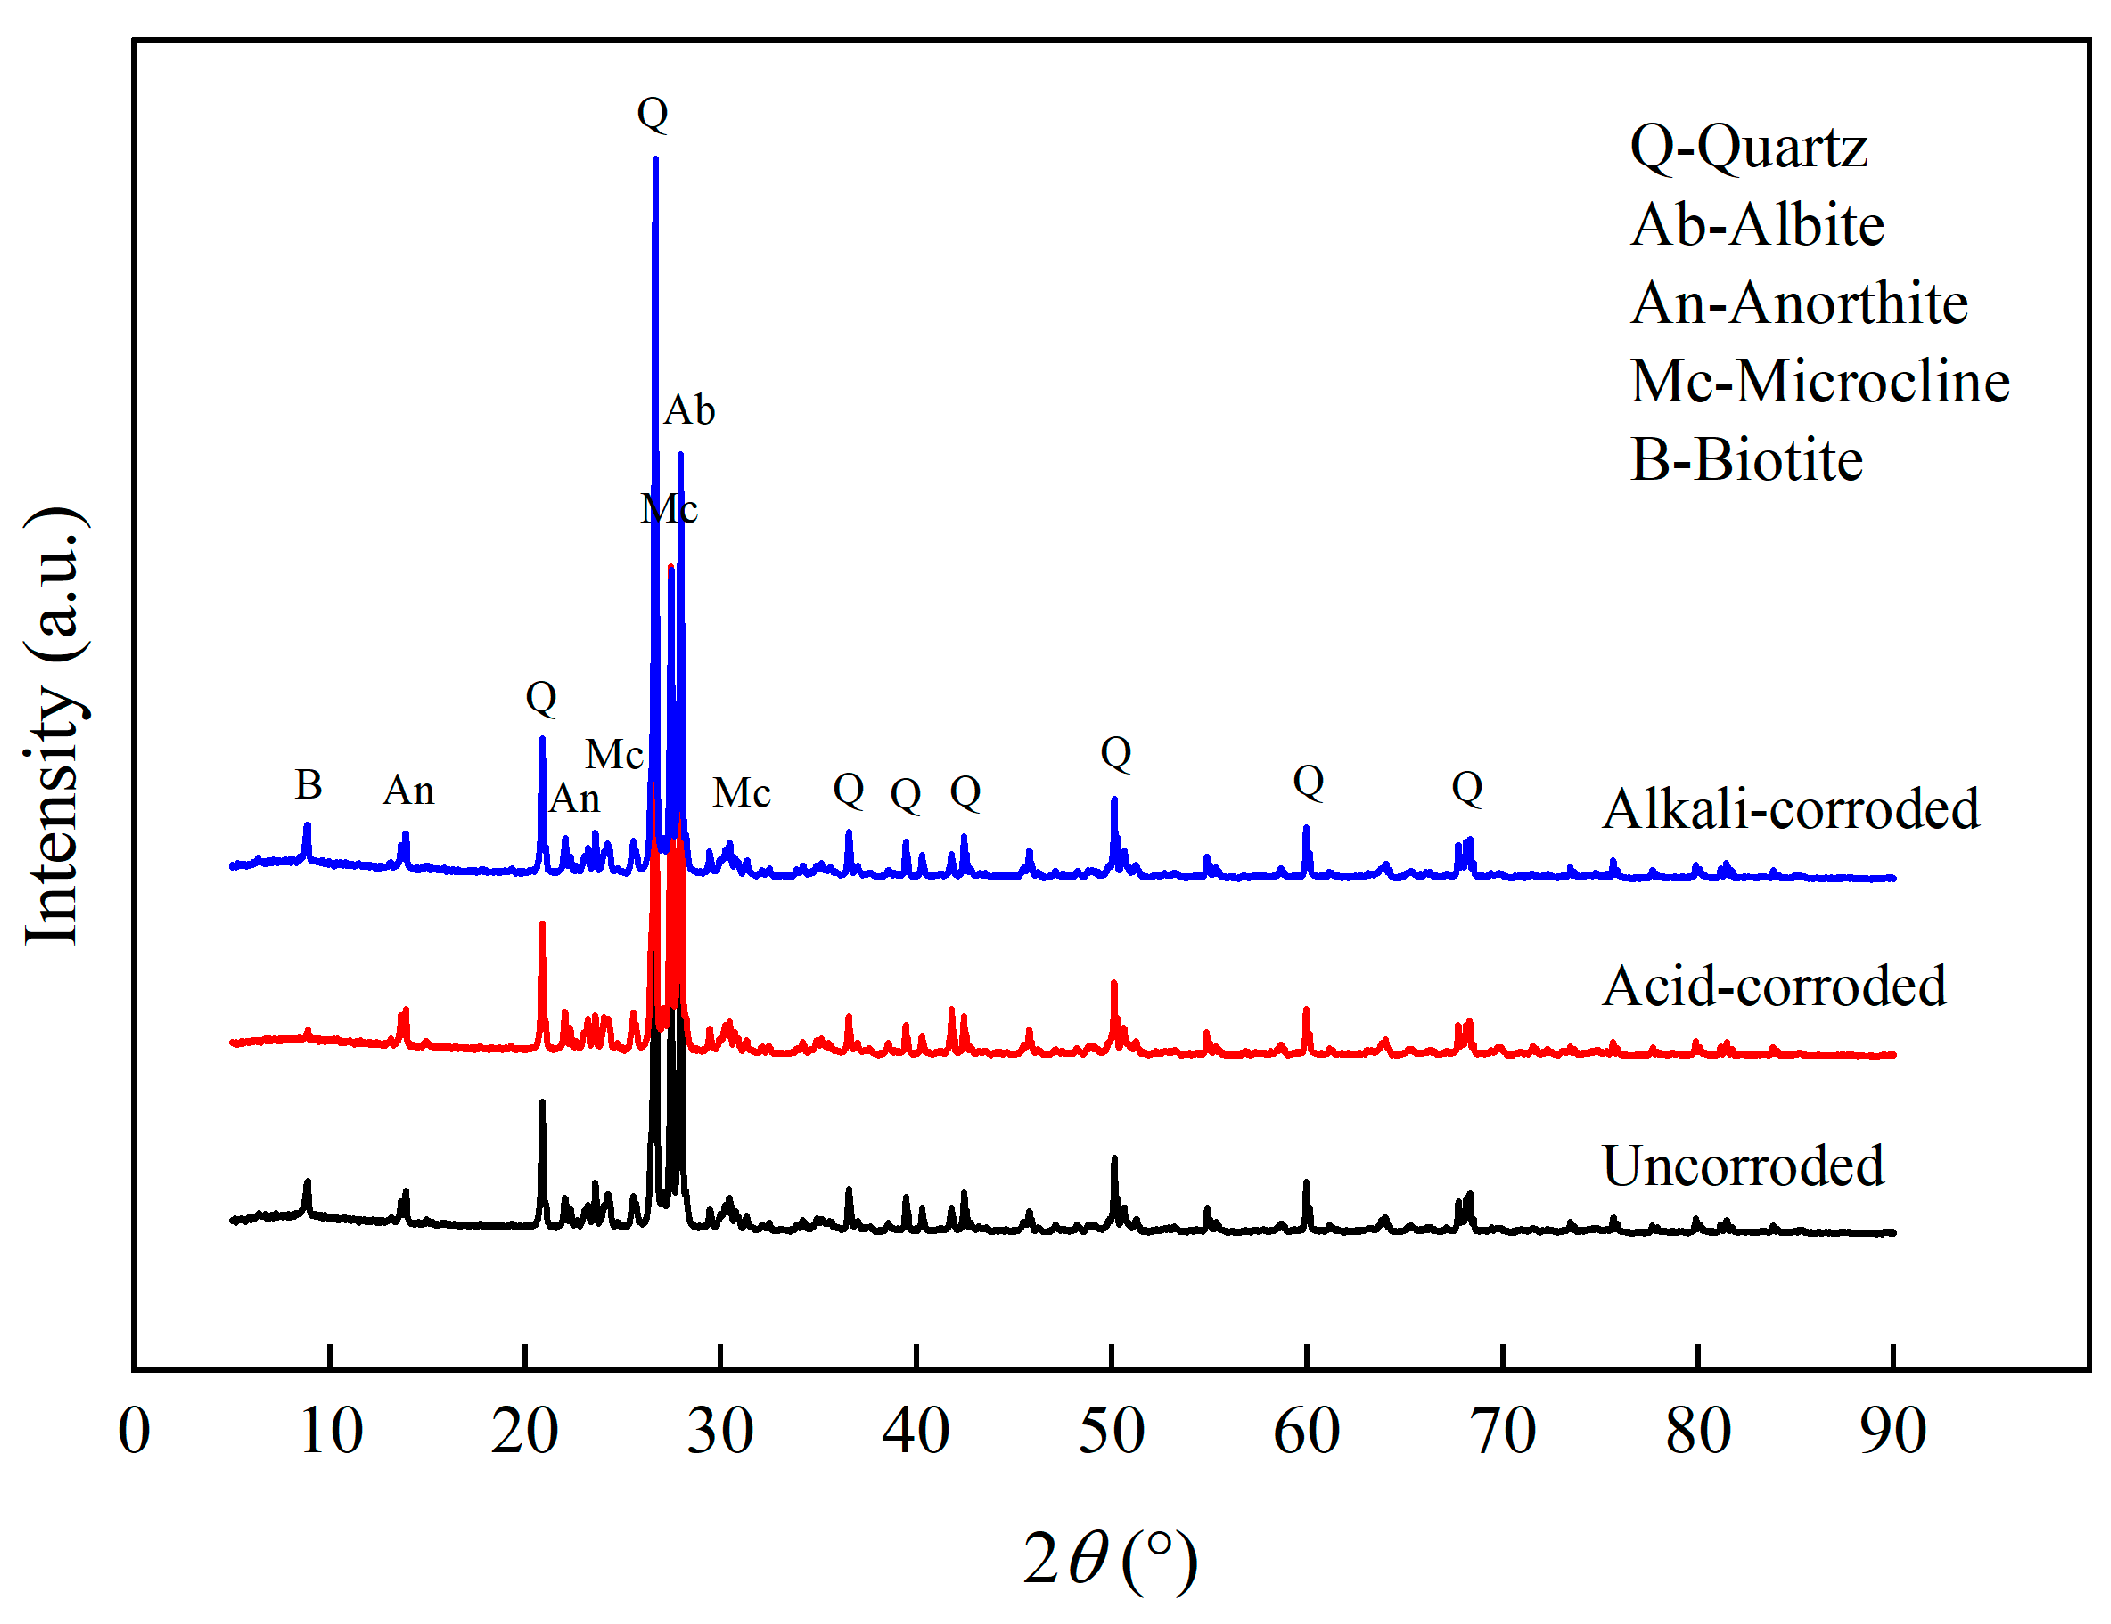
5.3. Mineralogical Analysis
6. Conclusions
- (1)
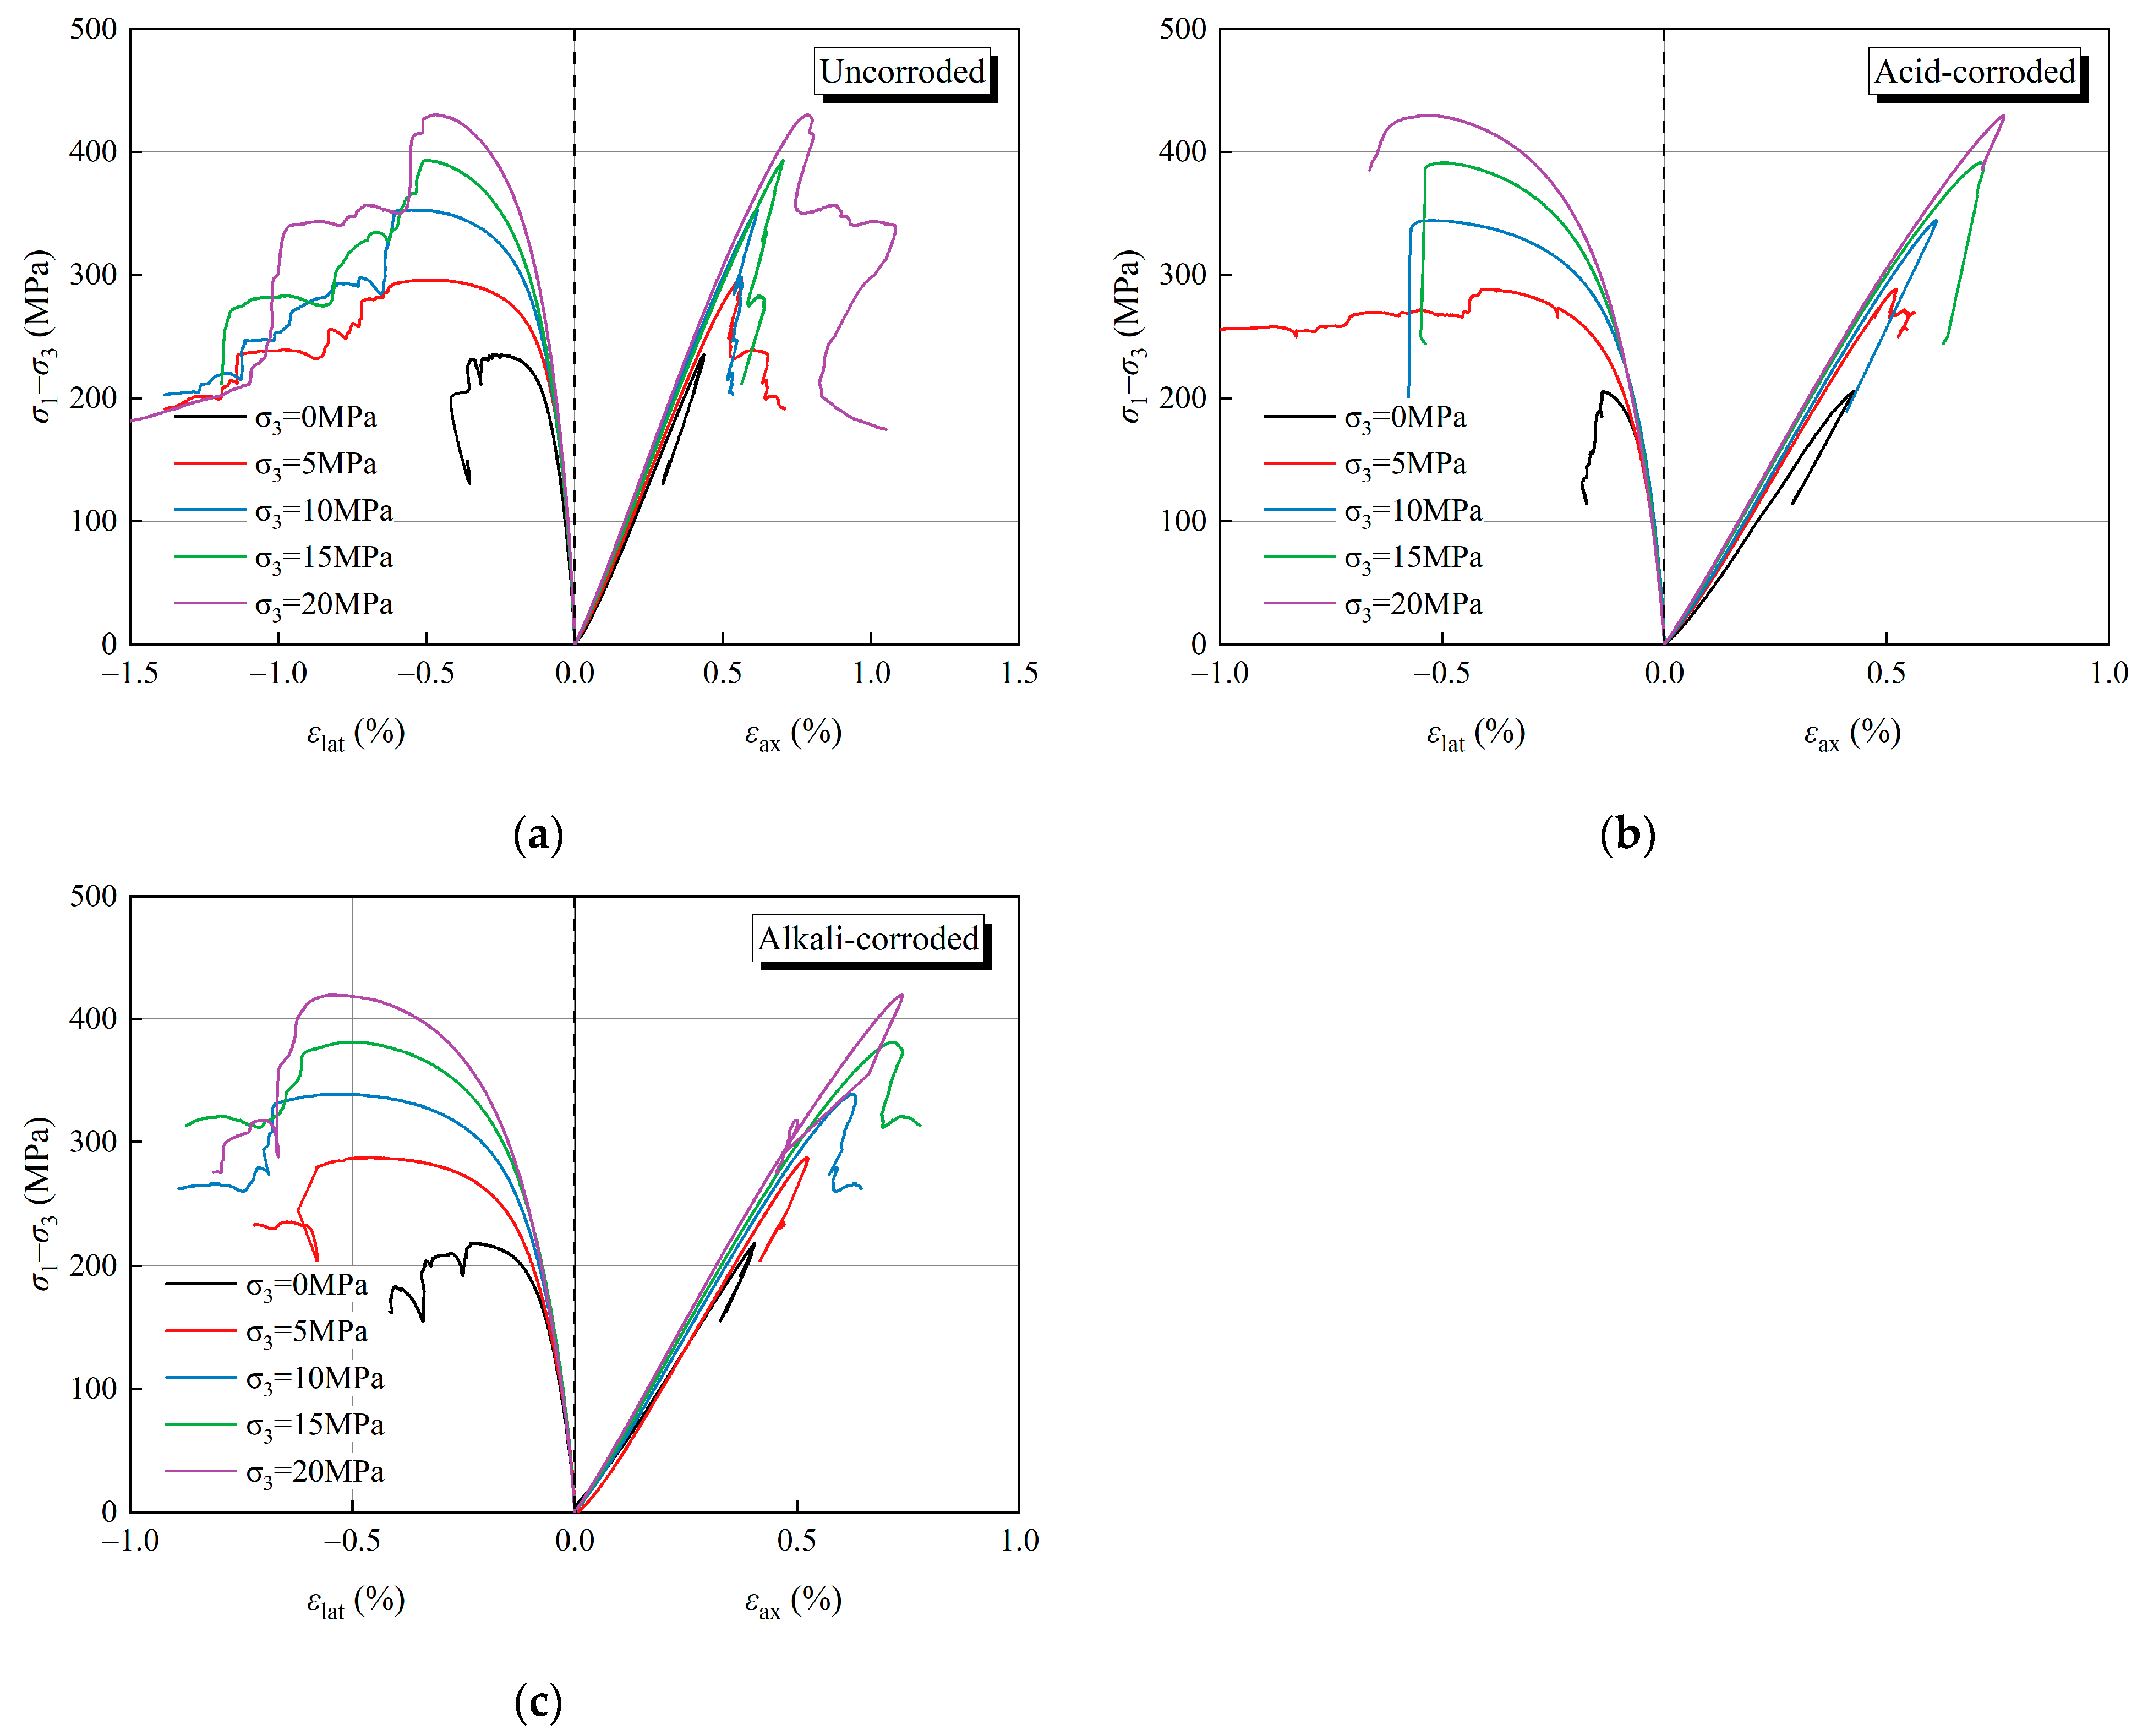
- Chemical corrosion significantly weakens the compressive strength of the granite specimens under unconfined conditions, although this weakening effect is mitigated under confining pressure. After reaching the TCS, the uncorroded and alkali-corroded specimens exhibit strain-softening behavior, while the acid-corroded specimens exhibit sudden brittle failure.
- (2)
- The elastic modulus of the corroded specimens undergoes a varying degree of degradation under unconfined compression, whereas this difference is reduced under confining pressure. Under the effect of chemical corrosion, the cohesion of the granite specimens decreases, the internal friction angle increases, and the cohesion exhibits a higher sensitivity.
- (3)
- Chemical corrosion degrades the cracking stress threshold to a greater extent and has a lesser effect on the damage stress threshold, making the granite specimens more prone to crack propagation; the confining pressure can mitigate this deterioration to some extent.
- (4)
- Compared to uncorroded and alkali-corroded specimens, acid-corroded specimens show fewer accumulative AE counts and frequency signals and lower peak frequency densities and are more susceptible to sudden brittle failure. The fluctuations in AE b-values under confining pressure are less pronounced than those under unconfined compression, and the rock fracture process is more concentrated.
- (5)
- Under unconfined compression, acid corrosion has a more significant degradation effect on the strength of the specimen than alkali corrosion, while the degradation of alkali corrosion becomes more prominent under confining pressure. The influence of confining pressure on the brittle–ductile transition has a characteristic of being strong first and then weak, and the ductility of alkali-corroded specimens is highest, followed by those of acid-corroded and uncorroded specimens.
Author Contributions
Funding
Institutional Review Board Statement
Informed Consent Statement
Data Availability Statement
Conflicts of Interest
Abbreviations
| AdB | amplitude of acoustic emission |
| average value of data | |
| b | b-value of acoustic emission |
| c | cohesion |
| CV | coefficient of variation |
| D | chemical damage variable |
| DCH | D for acid-corroded specimen |
| DCN | D for alkali-corroded specimen |
| e | natural constant |
| E | elastic modulus |
| EN | E of uncorroded specimen |
| ECH | E of acid-corroded specimen |
| ECN | E of alkali-corroded specimen |
| F | ductility factor |
| FN | F of uncorroded specimen |
| FCH | F of acid-corroded specimen |
| FCN | F of alkali-corroded specimen |
| M | magnitude |
| average magnitude | |
| Mmin | minimum magnitude |
| N | amount of data |
| S | standard deviation of data |
| TCS | triaxial compressive strength |
| TCSN | TCS of uncorroded specimen |
| TCSCH | TCS of acid-corroded specimen |
| TCSCN | TCS of alkali-corroded specimen |
| TCScor | TCS of corroded specimen under the same confining pressure |
| TCSuncor | TCS of uncorroded specimen under the same confining pressure |
| xi | i-th data |
| φ | internal friction angle |
| σ1 | axial stress |
| σ3 | lateral stress |
| σc | peak stress |
| σcd | crack damage stress |
| σci | crack initiation stress |
| εc | peak strain |
| εcd | yield strain |
| εV | volumetric strain |
| εax | axial strain |
| εlat | lateral strain |
References
- Yamazaki, T. Analysis of different models for improving the feasibility of deep-sea mining. In Perspectives on Deep-Sea Mining: Sustainability, Technology, Environmental Policy and Management; Springer: Cham, Switzerland, 2022; pp. 425–463. [Google Scholar]
- Sharma, R. Deep-sea mining: Economic, technical, technological, and environmental considerations for sustainable development. Mar. Technol. Soc. J. 2011, 45, 28–41. [Google Scholar] [CrossRef]
- Hein, J.R.; Mizell, K.; Koschinsky, A.; Conrad, T.A. Deep-ocean mineral deposits as a source of critical metals for high-and green-technology applications: Comparison with land-based resources. Ore Geol. Rev. 2013, 51, 1–14. [Google Scholar] [CrossRef]
- Kaikkonen, L.; Venesjärvi, R.; Nygård, H.; Kuikka, S. Assessing the impacts of seabed mineral extraction in the deep sea and coastal marine environments: Current methods and recommendations for environmental risk assessment. Mar. Pollut. Bull. 2018, 135, 1183–1197. [Google Scholar] [CrossRef] [PubMed]
- Levin, L.A.; Amon, D.J.; Lily, H. Challenges to the sustainability of deep-seabed mining. Nat. Sustain. 2020, 3, 784–794. [Google Scholar] [CrossRef]
- Kouame, K.J.A.; Jiang, F.; Zhu, S. Research on cause of dynamic disaster of deep mining control in China and its further prevention application in Ivory Coast. Geotech. Geol. Eng. 2017, 35, 1141–1149. [Google Scholar] [CrossRef]
- Zhou, Y.; Liu, J.; Huang, S.; Yang, H.; Ji, H. Performance change of shaft lining concrete under simulated coastal ultra-deep mine environments. Constr. Build. Mater. 2020, 230, 116909. [Google Scholar] [CrossRef]
- Yan, B.; Qi, Q.; Liu, J.; Cai, M.; Li, X.; Wang, P. Fracture propagation and permeability evolution mechanism of jointed rock mass in coastal mines. Rock Mech. Rock Eng. 2023, 56, 2763–2778. [Google Scholar] [CrossRef]
- Li, P.; Guo, Q.; Cai, M.; Miao, S. Present-day state of tectonic stress and tectonization in coastal gold mine area near Laizhou Gulf, North China. Trans. Nonferrous Met. Soc. China 2023, 33, 865–888. [Google Scholar] [CrossRef]
- Duan, X.; Ma, F.; Guo, J.; Zhao, H.; Gu, H.; Liu, S.; Sun, Q. Source identification and quantification of seepage water in a coastal mine, in China. Water 2019, 11, 1862. [Google Scholar] [CrossRef]
- Zhou, X.P.; Yu, T.Y. Experimental study on the dynamic failure behaviors of granite after chemical corrosion. Rock Mech. Rock Eng. 2023, 56, 7923–7937. [Google Scholar] [CrossRef]
- Zhang, F.; He, T.; Kang, J.; Hu, D. Experimental study on influence of chemical corrosion on mechanical property of fissured granite. Geofluids 2021, 2021, 1–14. [Google Scholar] [CrossRef]
- Riber, L.; Le Pera, E.; Morrone, C.; Ietto, F.; Conforti, M.; Dypvik, H. Pore system evolution in arenaceous regoliths-Case study from the Sila Massif (southern Italy). Mar. Pet. Geol. 2022, 143, 105781. [Google Scholar] [CrossRef]
- Ietto, F.; Perri, F.; Cella, F. Weathering characterization for landslides modeling in granitoid rock masses of the Capo Vaticano promontory (Calabria, Italy). Landslides 2018, 15, 43–62. [Google Scholar] [CrossRef]
- Perri, F.; Ietto, F.; Le Pera, E.; Apollaro, C. Weathering processes affecting granitoid profiles of Capo Vaticano (Calabria, southern Italy) based on petrographic, mineralogic and reaction path modelling approaches. Geol. J. 2016, 51, 368–386. [Google Scholar] [CrossRef]
- Liu, Z.; Dang, W.; He, X. Undersea safety mining of the large gold deposit in Xinli District of Sanshandao Gold Mine. Int. J. Miner. Metall. Mater. 2012, 19, 574–583. [Google Scholar] [CrossRef]
- Duan, X.; Ma, F.; Gu, H.; Guo, J.; Zhao, H.; Liu, G.; Liu, S. Identification of mine water sources based on the spatial and chemical characteristics of bedrock brines: A case study of the Xinli gold mine. Mine Water Environ. 2022, 41, 126–142. [Google Scholar] [CrossRef]
- Song, Y.; Guo, J.; Ma, F.; Liu, J.; Li, G. Interpreting mine water sources and determining mixing ratios based on the spatial and chemical characteristics of bedrock brines in a coastal mine. Water 2023, 15, 2105. [Google Scholar] [CrossRef]
- Hu, B.; Zhang, Z.; Li, J.; Xiao, H.; Cui, K. Statistical damage model of rock based on compaction stage and post-peak shape under chemical-freezing-thawing-loading. J. Mar. Sci. Eng. 2022, 10, 696. [Google Scholar] [CrossRef]
- Zhu, Z.; Cui, L.; Dong, Y.; Sheng, Q.; Tian, K.; Guo, Z. A novel deformation analytical solution and constitutive model for fractured rock masses. J. Mar. Sci. Eng. 2023, 11, 2351. [Google Scholar] [CrossRef]
- Zhou, T.; Chen, C.; Zhang, Y.; Yin, X.; Chen, J. Experimental study on the influence of seawater corrosion on the physical and mechanical properties and microstructural failure behavior of sandstone. J. Min. Sci. Technol. 2024, 9, 178–189. (In Chinese) [Google Scholar]
- Zhang, Y.; Qi, H.; Li, C.; Zhou, J. Enhancing safety, sustainability, and economics in mining through innovative pillar design: A state-of-the-art review. J. Saf. Sustain. 2024, 1, 53–73. [Google Scholar] [CrossRef]
- Liu, G.; Ma, F.; Zhao, H.; Li, G.; Cao, J.; Guo, J. Study on the fracture distribution law and the influence of discrete fractures on the stability of roadway surrounding rock in the Sanshandao coastal gold mine, China. Sustainability 2019, 11, 2758. [Google Scholar] [CrossRef]
- Gu, H.; Ma, F.; Guo, J.; Li, K.; Lu, R. Hydrochemistry, multidimensional statistics, and rock mechanics investigations for Sanshandao Gold Mine, China. Arab. J. Geosci. 2017, 10, 1–17. [Google Scholar] [CrossRef]
- Liu, C.; Peng, B.; Qin, J. Geological analysis and numerical modeling of mine discharges for the Sanshandao gold mine in Shandong, China: 1. Geological Analysis. Mine Water Environ. 2007, 26, 160–165. [Google Scholar] [CrossRef]
- Liu, C.; Peng, B.; Qin, J. Geological analysis and numerical modeling of mine discharges for the Sanshandao Gold Mine: 2. Simulation and prediction of mine discharges. Mine Water Environ. 2007, 26, 166–171. [Google Scholar] [CrossRef]
- Shang, D.; Zhao, Z.; Dou, Z.; Yang, Q. Shear behaviors of granite fractures immersed in chemical solutions. Eng. Geol. 2020, 279, 105869. [Google Scholar] [CrossRef]
- Liu, H.; Shi, Y.; Fang, Z.; Liu, J.; Zhang, L.; Tong, R. Seepage characteristics of thermally and chemically treated Mesozoic granite from geothermal region of Liaodong Peninsula. Environ. Earth Sci. 2021, 80, 599. [Google Scholar] [CrossRef]
- Li, Z.; Liu, R.; Li, S.; Jing, H.; Li, X.; Yu, L. Estimates of strength and cracking behaviors of pre-flawed granite specimens treated by chemical corrosion under triaxial compression tests. Front. Earth Sci. 2022, 16, 411–434. [Google Scholar] [CrossRef]
- Miao, S.; Cai, M.; Guo, Q.; Wang, P.; Liang, M. Damage effects and mechanisms in granite treated with acidic chemical solutions. Int. J. Rock Mech. Min. Sci. 2016, 88, 77–86. [Google Scholar] [CrossRef]
- Chen, W.; Wan, W.; Zhao, Y.; Wu, Q.; He, H.; Peng, W.; Wu, X.; Zhou, Y.; Wu, L.; Xie, S. Experimental study on damage properties of granites under flowing acid solution. Front. Earth Sci. 2022, 10, 927159. [Google Scholar] [CrossRef]
- Mei, C.; Fang, Z.; Wu, W. Slip transition of rock fractures due to chemical corrosion. Eng. Geol. 2022, 308, 106801. [Google Scholar] [CrossRef]
- Pan, J.; Zhang, Y.; Li, P.; Wu, X.; Xi, X. Mechanical properties and thermo-chemical damage constitutive model of granite subjected to thermal and chemical treatments under uniaxial compression. Constr. Build. Mater. 2023, 390, 131755. [Google Scholar] [CrossRef]
- Pan, J.; Feng, Z.; Zhang, Y.; Xi, X.; Miao, S.; Cai, M. Experimental study on evaluation of porosity, thermal conductivity, UCS, and elastic modulus of granite after thermal and chemical treatments by using P-wave velocity. Geoenergy Sci. Eng. 2023, 230, 212184. [Google Scholar] [CrossRef]
- Pan, J.; Xi, X.; Wu, X.; Guo, Q.; Ren, F.; Cai, M. Physical properties evolution and microscopic mechanisms of granite modified by thermal and chemical stimulation. Case Stud. Therm. Eng. 2023, 41, 102633. [Google Scholar] [CrossRef]
- Zareifard, M.R.; Fahimifar, A. Analytical solutions for the stresses and deformations of deep tunnels in an elastic-brittle-plastic rock mass considering the damaged zone. Tunn. Undergr. Space Technol. 2016, 58, 186–196. [Google Scholar] [CrossRef]
- Zuo, J.; Sun, Y.; Liu, H.; Yu, M.; Lei, B.; Song, H.; Wen, J. Multi-scale failure mechanics of rock in mining engineering. J. Min. Sci. Technol. 2021, 6, 509–523. (In Chinese) [Google Scholar]
- Cai, M.; Kaiser, P.K.; Tasaka, Y.; Maejima, T.; Morioka, H.; Minami, M. Generalized crack initiation and crack damage stress thresholds of brittle rock masses near underground excavations. Int. J. Rock Mech. Min. Sci. 2004, 41, 833–847. [Google Scholar] [CrossRef]
- Gao, Y.; Feng, X.T.; Zhang, X.; Zhou, Y.; Zhang, Y. Generalized crack damage stress thresholds of hard rocks under true triaxial compression. Acta Geotech. 2020, 15, 565–580. [Google Scholar] [CrossRef]
- Martin, C.D.; Chandler, N.A. The progressive fracture of Lac du Bonnet granite. Int. J. Rock Mech. Min. Sci. Geomech. Abstr. 1994, 31, 643–659. [Google Scholar] [CrossRef]
- Nicksiar, M.; Martin, C.D. Evaluation of methods for determining crack initiation in compression tests on low-porosity rocks. Rock Mech. Rock Eng. 2012, 45, 607–617. [Google Scholar] [CrossRef]
- Zhao, X.G.; Cai, M.; Wang, J.; Ma, L. Damage stress and acoustic emission characteristics of the Beishan granite. Int. J. Rock Mech. Min. Sci. 2013, 64, 258–269. [Google Scholar] [CrossRef]
- Xue, L.; Qin, S.; Sun, Q.; Wang, Y.; Lee, L.M.; Li, W. A study on crack damage stress thresholds of different rock types based on uniaxial compression tests. Rock Mech. Rock Eng. 2014, 47, 1183–1195. [Google Scholar] [CrossRef]
- Wang, H.; Cui, Z.; Xu, C.; Yong, R.; Zhao, F.; Chen, S. Study on the damage mechanism of sandstone under different water content states. Remote Sens. 2023, 15, 3127. [Google Scholar] [CrossRef]
- Zhao, T.; Zhang, P.; Xiao, Y.; Guo, W.; Zhang, Y.; Zhang, X. Master crack types and typical acoustic emission characteristics during rock failure. Int. J. Coal Sci. Technol. 2023, 10, 2. [Google Scholar] [CrossRef]
- Zhang, L.; Lai, X.; Pan, J.; Shan, P.; Zhang, Y.; Zhang, Y.; Xu, H.; Cai, M.; Xi, X. Experimental investigation on the mixture optimization and failure mechanism of cemented backfill with coal gangue and fly ash. Powder Technol. 2024, 440, 119751. [Google Scholar] [CrossRef]
- Li, X.; Lei, X.; Li, Q. Laboratory hydraulic fracturing in layered tight sandstones using acoustic emission monitoring. Geoenergy Sci. Eng. 2023, 223, 211510. [Google Scholar] [CrossRef]
- Liu, D.; Zhang, W.; Jian, Y.; Tang, Y.; Cao, K. Damage precursors of sulfate erosion concrete based on acoustic emission multifractal characteristics and b-value. Constr. Build. Mater. 2024, 419, 135380. [Google Scholar] [CrossRef]


| Type | σ3 (MPa) | TCS (MPa) | σcd (MPa) | σci (MPa) | E (GPa) | c (MPa) | φ (°) |
|---|---|---|---|---|---|---|---|
| Uncorroded | 0 | 235.48 | 181.43 | 104.41 | 58.86 | 37.27 | 56.06 |
| 5 | 301.19 | 207.40 | 120.73 | 60.80 | |||
| 10 | 363.10 | 233.95 | 133.55 | 63.62 | |||
| 15 | 408.29 | 257.71 | 147.14 | 62.08 | |||
| 20 | 450.44 | 282.64 | 156.96 | 64.99 | |||
| Acid-corroded | 0 | 205.85 | 157.18 | 90.82 | 54.03 | 32.00 | 57.82 |
| 5 | 293.62 | 191.08 | 102.33 | 60.94 | |||
| 10 | 354.48 | 225.13 | 120.52 | 61.86 | |||
| 15 | 406.28 | 256.86 | 138.44 | 63.34 | |||
| 20 | 450.02 | 279.09 | 152.66 | 63.98 | |||
| Alkali-corroded | 0 | 218.42 | 168.03 | 96.74 | 56.84 | 34.75 | 56.35 |
| 5 | 292.35 | 197.61 | 109.19 | 61.54 | |||
| 10 | 349.07 | 224.56 | 123.18 | 62.13 | |||
| 15 | 396.51 | 256.63 | 140.75 | 63.33 | |||
| 20 | 439.81 | 267.33 | 149.80 | 65.08 |
| Type | Confining Pressure σ3 (MPa) | ||||
|---|---|---|---|---|---|
| 0 | 5 | 10 | 15 | 20 | |
| Uncorroded | 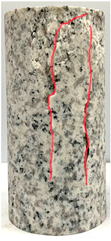 | 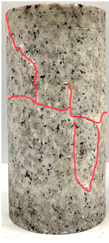 | 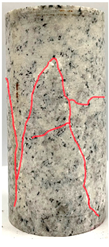 | 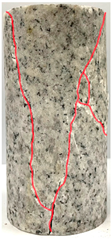 |  |
| Acid-corroded |  | 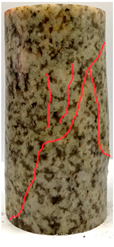 | 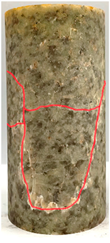 |  | 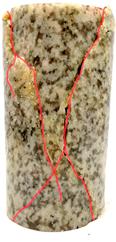 |
| Alkali-corroded |  | 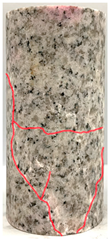 | 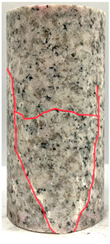 | 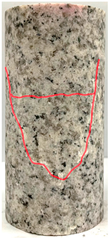 | 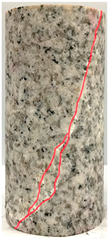 |
| Type | Reactant | Chemical Reaction Formula |
|---|---|---|
| Acid-corroded | Quartz | |
| Albite | ||
| Microcline | ||
| Anorthite | ||
| Biotite | ||
| Muscovite | ||
| Kaolinite | ||
| Alkali-corroded | Quartz | |
| Albite | ||
| Microcline | ||
| Anorthite | ||
| Biotite | ||
| Muscovite | ||
| Kaolinite |
Disclaimer/Publisher’s Note: The statements, opinions and data contained in all publications are solely those of the individual author(s) and contributor(s) and not of MDPI and/or the editor(s). MDPI and/or the editor(s) disclaim responsibility for any injury to people or property resulting from any ideas, methods, instructions or products referred to in the content. |
© 2024 by the authors. Licensee MDPI, Basel, Switzerland. This article is an open access article distributed under the terms and conditions of the Creative Commons Attribution (CC BY) license (https://creativecommons.org/licenses/by/4.0/).
Share and Cite
Pan, J.; Ma, Y.; Zhang, L.; Ning, Z.; Zhang, Y.; Xi, X. Effect of Chemical Corrosion on Rock Fracture Behavior in Coastal Deep Mines: Insights from Mechanical and Acoustic Characteristics. J. Mar. Sci. Eng. 2024, 12, 869. https://doi.org/10.3390/jmse12060869
Pan J, Ma Y, Zhang L, Ning Z, Zhang Y, Xi X. Effect of Chemical Corrosion on Rock Fracture Behavior in Coastal Deep Mines: Insights from Mechanical and Acoustic Characteristics. Journal of Marine Science and Engineering. 2024; 12(6):869. https://doi.org/10.3390/jmse12060869
Chicago/Turabian StylePan, Jiliang, Yichen Ma, Leiming Zhang, Zegong Ning, Ying Zhang, and Xun Xi. 2024. "Effect of Chemical Corrosion on Rock Fracture Behavior in Coastal Deep Mines: Insights from Mechanical and Acoustic Characteristics" Journal of Marine Science and Engineering 12, no. 6: 869. https://doi.org/10.3390/jmse12060869