Article

Study on Sensitivity Mechanism of Low-Permeability Sandstone Reservoir in Huilu Area of Pearl River Mouth Basin

1
China National Offshore Oil Corporation Limited-Shenzhen, Shenzhen 518067, China
2
Key Laboratory of Tectonics and Petroleum Resources (China University of Geosciences), Ministry of Education, Wuhan 430074, China
3
National Key Laboratory of Continental Shale Oil, Northeast Petroleum University, Daqing 163318, China
*
Authors to whom correspondence should be addressed.
J. Mar. Sci. Eng. 2024, 12(6), 888; https://doi.org/10.3390/jmse12060888
Submission received: 30 April 2024 / Revised: 21 May 2024 / Accepted: 24 May 2024 / Published: 27 May 2024
(This article belongs to the Special Issue Exploration and Development of Marine Energy)

Abstract

:
Reservoir sensitivity is a parameter that is used to evaluate the degree of change in reservoir permeability under the influence of external fluids. Accurate evaluation of reservoir sensitivity is conducive to the optimization of fluid parameters during exploration and development. Taking the Wenchang Formation and Enping Formation of the Paleogene in the Huilu area of the Pearl River Mouth Basin as the research object, reservoir sensitivity experiments were carried out. Combined with the corresponding experimental results obtained using methods such as thin section identification, scanning electron microscopy (SEM), X-ray diffraction (XRD), mercury intrusion porosimetry (MIP), and screening analysis, based on mineral sensitization and pore structure sensitization, qualitative and quantitative evaluations of reservoir sensitivity were carried out, and factors affecting sensitivity and sensitization mechanisms were analyzed. This work shows the following: (1) The sandstone reservoirs in the two areas have the same clay type, but the total clay content of the Wenchang Formation is greater than that of the Enping Formation. The porosity of the Wenchang Formation is less developed than the Enping Formation. (2) The Wenchang Formation has weak or moderately weak water sensitivity and moderately weak or moderately strong flow velocity sensitivity. The water sensitivity of the Enping Group samples is moderately weak or moderately strong, the flow rate sensitivity is moderately weak, the alkali sensitivity is weak, the acid sensitivity is moderately weak, and the salinity sensitivity is moderately weak or moderately strong. (3) The sensitivity of the Wenchang Formation is mainly affected by the content of clay minerals. The sensitivity of the Enping Formation is also affected by the clay content and type. Although the clay content is not high, the permeability is more susceptible to sensitivity due to the pore structure and debris particle distribution characteristics. These conclusions are beneficial for the selection of fluid parameters and efficient reservoir development.

1. Introduction

Economic development continues to have a strong energy demand, the degree of offshore oil and gas exploration continues to increase, and deep-water unconventional oil and gas reservoirs have become the focus of exploration [1,2,3]. The Pearl River Mouth Basin continues to make breakthroughs in oil and gas exploration of low-permeability sandstone reservoirs and shows huge potential for oil and gas resource development [3]. The Paleogene Wenchang Formation in the Lufeng Sag and the Paleogene Enping Formation in the Huizhou Sag in the northeastern part of the basin has been confirmed to be hydrocarbon-rich sags [4]. However, compared with onshore oil and gas, offshore oil and gas development operations have high costs, difficult construction, and high technical requirements [5]. There are two main reasons. First, deep water and deep sandstone reservoirs have low porosity and permeability, diverse mineral composition, high mud content, and complex pore structure [6]. Second, during the drilling, completion, and development processes, the incompatibility between the external fluid and the reservoir will lead to damage to the absolute permeability or effective permeability of the reservoir [7], causing deviations between actual production and expected production and irreparable economic losses [8]. Permeability damage during exploration and development is due to the sensitivity of the reservoir, including speed sensitivity, water sensitivity, acid sensitivity, alkali sensitivity, and salt sensitivity [9]. Since any reservoir development measures may induce reservoir sensitivity and pose irreversible potential threats to development results, an accurate evaluation of reservoir sensitivity and reservoir permeability is important for efficient reservoir exploration and development [10].
During the drilling process, the entry of drilling fluid is only the beginning of stimulating the sensitivity of the reservoir. The properties of the drilling fluid, such as salinity, injection rate, acidity, and alkalinity, may cause incompatibility with the fluids in the reservoir [7]. During the development process, the main production stimulation techniques for complex oil and gas reservoirs are acidification, water flooding, or fracturing [11]. The main components of the fracturing fluid system are hydrochloric acid, acetic acid, fluoroboric acid, and polyhydric acid [12]. These fracturing fluids or some water that does not match the salinity of the formation water will enter and react with the reservoir, causing permeability damage. In addition, after the fracturing operation is completed, the flow back of fracturing fluid may carry a large number of debris particles and even broken proppant particles, blocking the pore throats and inducing flow velocity sensitivity of the reservoir. A large number of scholars at home and abroad have researched the reservoir sensitivity caused by the above reasons. Microscopic methods, such as high-resolution scanning electron microscopy (SEM), nuclear magnetic resonance (NMR), and scanning electron microscopy (QEMSCAN), are used to visualize the reservoir pore structure and mineral distribution [13]; nitrogen adsorption, high-pressure mercury intrusion, and X-ray diffraction (XRD) are used to quantify the pore structure and mineral content [14]. Finally, combined with reservoir sensitivity experiments, the reservoir flow rate sensitivity [15] and water sensitivity [16,17], acid sensitivity and alkali sensitivity (Fang et al., 2016) [18], and salt sensitivity [19] are studied. These reasons are mainly attributed to the content, type, and occurrence of clay minerals in the reservoir [20,21]. However, some reservoirs have less clay content, and pore structure (size distribution, connectivity) and clastic particle distribution have an important impact on reservoir sensitivity [22]. At present, the research on reservoir sensitivity mainly focuses on tight sandstone and shale reservoirs [23,24]. There is a lack of research and understanding of the damage mechanism of deep water and low-permeability sandstone reservoirs.
This work takes the Wenchang Formation and Enping Formation in the Huilu area of the Pearl River Estuary Basin as the research objects. Based on the experimental results of sensitivity tests, thin slice identification, SEM, XRD, MIP and screening analysis, the reservoir sensitivity is qualitatively and quantitatively evaluated from the aspects of mineral sensitization and pore structure sensitization, and the influencing factors of sensitivity and the sensitization mechanism are deeply analyzed. The difference in reservoir sensitization mechanisms between the Wenchang Formation and Enping Formation is compared and analyzed. This work could provide a reference for the exploration and development of sandstone reservoirs and similar formations in the study area.

2. Geological Setting

The Pearl River Estuary Basin is a large-scale Cenozoic sedimentary basin on the northern continental shelf of the South China Sea and the land slope. The thickness of the sedimentary rock is greater than 10,000 m. It is the main oil and gas production area of the South China Sea. Lu Feng Sag and Huizhou Sag are located in the northeast of the Pearl River Estuary Basin (Figure 1); the Lufeng area is about 0.8 × 10⁴ km2, and the Huizhou area is about 1.0 × 10⁴ km2.
The main oil layer is the Paleogene Wenchang Formation and Enpan Formation. During the Wenchang Formation sedimentary period, the lake experienced three stages [26]: initial breaks, the peak stage of the fault depression, and the atrophy stage. During the initial breaks and atrophy, the large-scale braided river delta facies and the shore shallow lake facies were formed; during the peak stage of the fault depression, the thick semi-deep lacustrine mudstone and the small-scale braided river delta were mainly formed. The Wenchang period’s volcanic activity continues to be strong, with basic and medium-acid lava overflow or explosive eruption, which mostly forms a relatively thick gray stone [4]. In the Enping Formation of Huizhou, there was the development of a large fan delta, a braided river delta composite system, during the sedimentary period of the Huizhou area, with a fan-braid development relationship is “south fan and north braided, early fan and late braided” [27]. The volcanic activity of Enping has weakened and erupted with a medium-acid lava explosion, and the fine-grained gray content was formed as a whole. Among the three wells in the Lufeng Sag and Huizhou Sag, the research horizons of the LF15-5-A and LF13-9-A wells are the Wenchang Formation, and the research horizon of the HZ26-6-A well is the Enping Formation.

3. Experiments and Results

3.1. Samples

Experimental samples are taken from LF15-5-A, LF13-9-A in Lufeng sag, and HZ26-6-A in Huizhou sag. There are four groups of experimental samples (Group 2 in Lufeng Sag and Group 2 in Huizhou Sag). There are two samples in each group in Lufeng Sag, and the water sensitivity and velocity sensitivity were measured, respectively. Water sensitivity, velocity sensitivity, acid sensitivity, alkali sensitivity, and salinity sensitivity were measured in each group of five samples in Huizhou Sag. The conventional physical properties of the samples are shown in Table 1.
Sensitivity experiments are carried out according to Chinese oil industry standard SY/T 5358-2010 [19]. The samples from the two regions are classified according to the Chinese oil industry standard SY/T 6285-2011 [28]. The samples of the Wenchang Formation in the Lufeng area are divided into two types. The first type is ultra-low porosity and ultra-low permeability with a porosity of φ ˂ 15% and a permeability of K < 1 mD. The other type, with porosity 10% < φ < 15% and permeability K < 1 mD or 1 mD < K < 10 mD, is low porosity ultra-low permeability or low porosity ultra-low permeability. The samples of the Enping Formation in the Huizhou area are also divided into two types. The porosity of one type is 10% < φ < 15%, and the permeability of 50 mD < K < 500 mD is low porosity. The other is low porosity and low permeability, with porosity of 10% < φ < 15% and permeability of 10 mD < K < 50 mD.

3.2. Experimental Principle and Process

Velocity sensitivity, water sensitivity, salinity sensitivity, acid sensitivity, and alkali sensitivity are all experimented at a constant temperature of 25 °C, and the initial confining pressure is 2 MPa. During the experiment, the confining pressure is always greater than the fluid pressure by 2 MPa. Before the sensitivity experiments, the salinity of the formation water at the depth of the sample should first be measured. In general, the greater the sample depth, the higher the salinity of the formation water. For example, the buried depth of the two groups of samples in the Lufeng area ranges from 3700 m to 4000 m, and the formation water salinity is 40,000 mg/L. The two groups of samples in the Huizhou area are buried in the range of 3119~3135 m, and the formation water salinity is 35,278 mg/L.
(1) Velocity sensitivity
When the fluid in the reservoir flows at a constant speed or the flow velocity changes, the fluid carries some loose particles in the rock and makes the particles migrate in the pore throat; this is called velocity sensitivity. When the diameter of the throat is smaller than the diameter of the particles or the number of particles is large, the particles accumulate in the throat and block the throat, resulting in a process of rock permeability change. The higher the flow rate, or the sufficient looseness of the rock, the greater the sensitivity of the reservoir flow rate.
The specific steps of the experiment are as follows: ① saline with the same salinity as the formation is used, the flow rate is controlled as 0.25 mL/min, and the permeability Ki of the sample is measured; ② the permeability Kn at the flow rate of 0.5 mL/min, 0.75 mL/min, 1 mL/min, 1.5 mL/min, 2 mL/min, 3 mL/min, 4 mL/min, 5 mL/min, and 6 mL/min is repeatedly measured successively; ③ when the flow rate does not reach 6 mL/min during the experiment, but the sample pressure gradient is greater than 2 MPa/cm, the experiment is stopped. The velocity sensitivity index (Dv) is
D v = K n K i K n × 100
where Dv is the reservoir velocity sensitivity index, %; Ki is the permeability at the minimum flow rate in the experiment, mD; Kn is the permeability of rock samples at different flow rates in the experiment, mD.
(2) Water sensitivity
The expansion of clay minerals under low salinity conditions, or the obstruction of pores through particle migration under the action of fluid (particle migration water sensitivity), so that the seepage channel changes, thereby changing the permeability of the reservoir rock phenomenon, is called water sensitivity. Water swelling is the main cause of water sensitivity [19].
The specific experimental steps are as follows: ① The initial permeability Ki of the sample is measured by salt water (formation water) with the same salinity as the formation water, and recorded. ② Use brine with a salinity half that of formation water (sub-formation water) to displace the formation water in the sample. After displacing 10 times the pore volume of the sample, stop the displacement and keep the sub-formation water in contact with the sample for more than 12 h. ③ Use sub-formation water to displace and measure sample permeability. ④ Using distilled water with a salinity of 0, repeat the operation steps of formation water and record the permeability Kw measured by distilled water. Then, the water sensitivity damage rate of the measured sample is
D w = K i K w K i × 100
where Dw is water sensitivity damage, %; Kw is the corresponding rock sample permeability corresponding to distilled water in the hydraulic erosion experiment, mD; Ki is the initial permeability (the permeability of the corresponding rock samples of the fluid in the initial test of the fluid in the hydromine experiment), mD.
(3) Salinity sensitivity
The salinity sensitivity shows that when a series of saline with different salinity is injected into the reservoir, the change in fluid salinity causes the expansion or dispersion and migration of clay minerals, resulting in the change in reservoir rock permeability. The specific steps of the experiment are as follows: ① The initial permeability Ki of the sample is measured with brine (formation water) with the same salinity as the formation water and recorded. ② The formation water in the sample is dislodged by injecting distilled water with salinity 0. After the pore volume of the sample is dislodged 10 times, the displacement is stopped and the contact between the sub-formation water and the sample is kept for more than 12 h. Distilled water is used again for displacement, and permeability Ks is measured. ③ Inject 33,000 mg/L, 30,000 mg/L, 26,000 mg/L, and 17,500 mg/L of brine successively according to step ②, and measure the permeability Kn at various mineralization degrees. ④ Calculate the rate of change in permeability measured by brine with various salinity levels. When the rate of change is greater than 20%, the salinity corresponding to the previous point is the critical salinity. The mean permeability Ks2 before critical salinity is calculated. Then, the salinity sensitivity damage rate of the measured sample is
D s = K s 2 K s K s 2 × 100
where Ds is the reservoir salt sensitivity index, %; Ks2 is the average permeability before critical salinity, mD; Ks is the permeability of rock sample measured by distilled water, mD.
(4) Acid sensitivity
Acid sensitivity is the phenomenon in which acid reacts with reservoir minerals to precipitate or release particles, resulting in changes in reservoir rock permeability. The specific experimental steps are as follows: ① use KCl solution with the same salinity as formation water to measure the permeability Kf of the sample before acid treatment; ② configure 3% HF and 12% HCl solution, perform reverse injection into the sample, displace 10 times the volume of pore volume acid, and then suspend the injection so that the sample and acid fully react for 1 h; ③ after the acid reaction, KCl solution with the same salinity as the formation water is displaced forward, and the permeability Ka after acid treatment is measured. The reservoir acid sensitivity index (Ia) is
D a = K f K a K f × 100
where Da is the reservoir acid sensitivity index, %; Kf is the permeability of the core sample before acid injection, mD; Ka is the permeability measured after acid injection, mD.
(5) Alkaline sensitivity
Alkali sensitivity is the phenomenon in which alkaline liquid reacts with reservoir minerals to precipitate or cause clay dispersion and migration, resulting in changes in reservoir rock permeability. The specific experimental steps are as follows: ① the initial permeability Ki of the sample is measured by KCl solution with the same salinity as the formation water; ② KCl solutions with PH values of 7, 8.5, 10, 11.5, and 13 are injected for displacement, and displacement is stopped after displacement of 10 times the pore volume so that the lye and the sample are fully reacted for more than 12 h; ③ reinject the displacement lye corresponding to step ②, and measure the permeability Kn at different pH values. Reservoir alkali sensitivity index (Db) is
D b = max K n K i K n × 100
where Db is the reservoir alkali sensitivity index, %; Kn is the permeability corresponding to different PH values, mD; Ki is the permeability measured by lye at initial PH, mD.

3.3. Experimental Results

The sensitivity results are shown in Table 2. According to the sensitivity damage rate (D), the reservoir sensitivity intensity is divided into the following six levels: extremely strong (sensitivity damage rate D ≥ 90%), strong (sensitivity damage rate 70% < D ≤ 90%), moderately strong (sensitivity damage rate 50% < D ≤ 70%), moderately weak (sensitivity damage rate 30% < D ≤ 50%), weak (sensitivity damage rate 5% < D ≤ 30%), and none (sensitivity damage rate D ≤ 5%).

4. Results

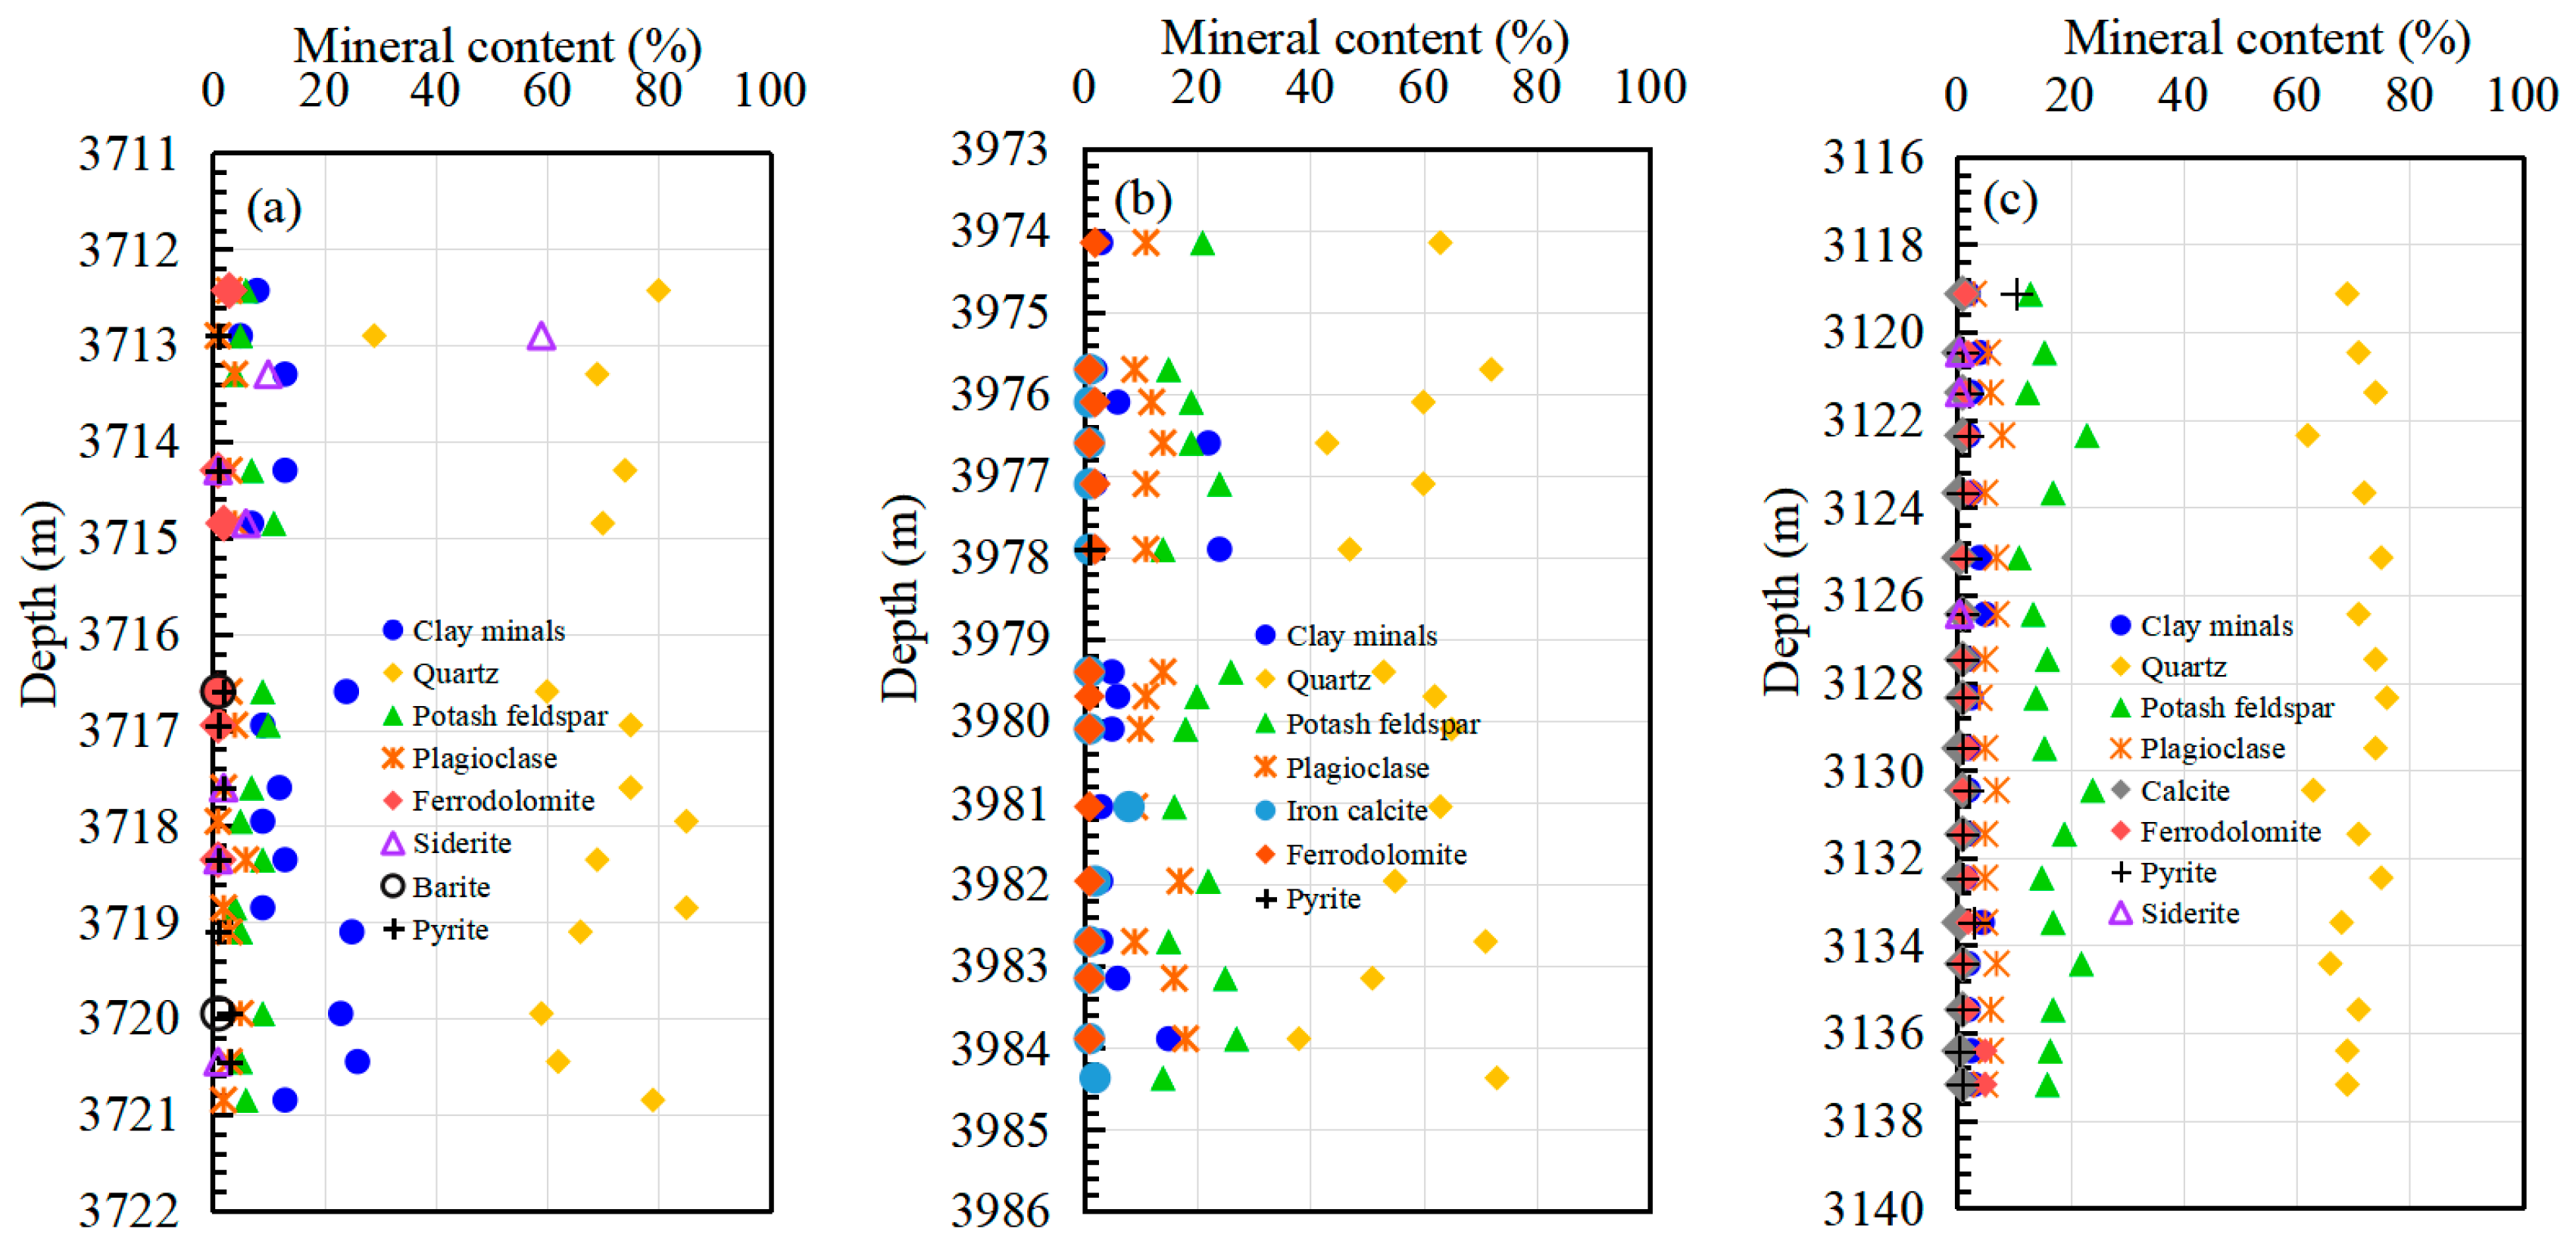
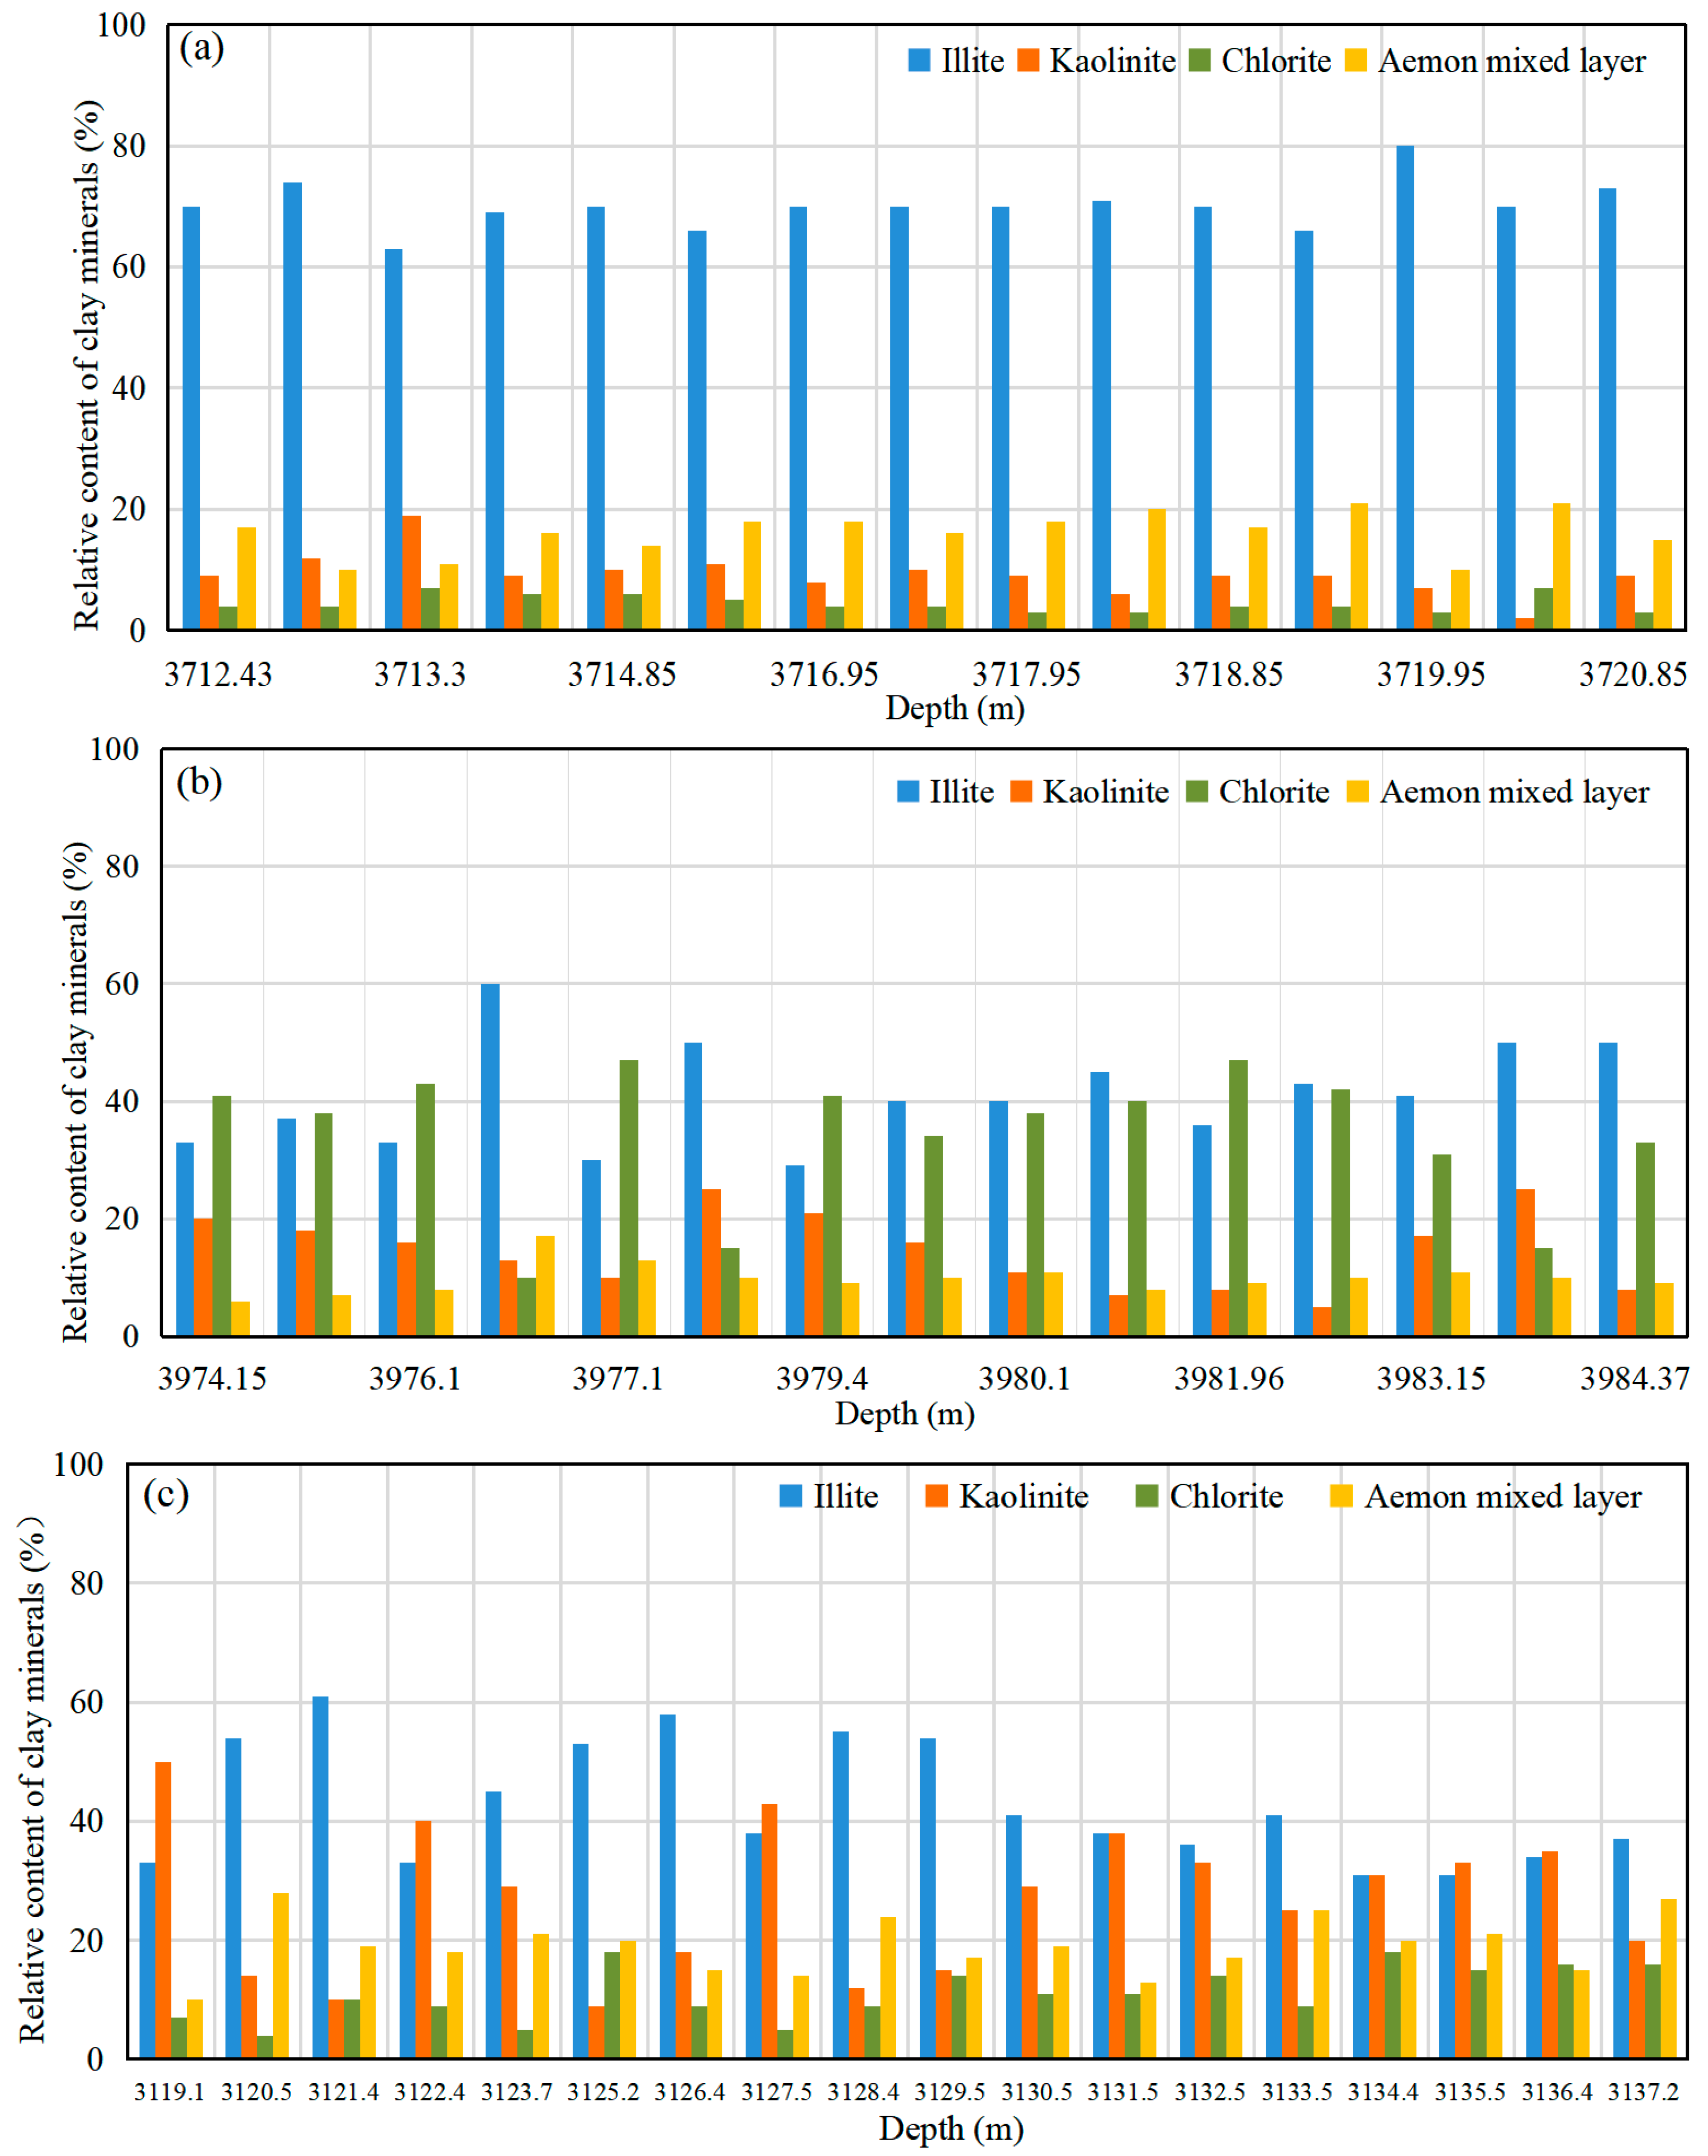
4.1. Mineral Sensitivity

As shown in Figure 2, sandstone samples in the Huizhou and Lufeng area contain a variety of minerals, mainly including quartz, feldspar (potassium feldspar, plagioclase), and clay minerals. The minerals related to reservoir sensitivity are mainly clayed, and the type, content, and occurrence of clay minerals determine the type and damage degree of reservoir sensitivity [21].
Type and content
It can be found in Figure 2 that the total amount of clay in well LF15-5-A, well LF13-9-A, and well HZ26-6-A is 5–26%, 2–24%, and 1.5–5%, respectively. As shown in Figure 3, samples at different depths in the Huilu area mainly contain clay minerals of the illite/montmorillonite mixed layer (I/S), illite (I), chlorite (Ch), and kaolinite (K) types. The relative content of illite in well LF15-5-A is the highest, which is 60–80%, followed by I/S mixed layer, kaolinite, and chlorite. LF13-9-A mainly contains illite and chlorite, and the relative content of these two minerals accounts for more than 70%, followed by kaolinite and I/S mixed layer. In well HZ26-6-A, the clay mineral content varies with the buried depth, but the content of illite and kaolinite is higher in most depth samples, followed by I/S mixed layer and chlorite.
Distribution pattern
Through the observation of SEM images of more than 30 sets of samples from wells LF15-5-A, LF13-9-A, and HZ26-6-A, it is found that the occurrence and distribution of kaolinite, illite, chlorite, and the I/S mixed layer in sandstone are regular, and the typical distribution characteristics are shown in Table 3. From the distribution of various minerals in Table 3, the following can be seen:
① The layered kaolinite is filled with intergranular pores. As a non-expansive mineral [29], kaolinite easily forms loose particle fragments under the shearing force of high-speed fluid and then migrates under the fluid and accumulates in the narrow throat, hindering the flow and recovery of oil. In an alkaline environment, kaolinite particles are more likely to fall off [19]. At the same time, it has a certain alkali sensitivity. The sensitization mechanism of kaolinite is that fluid flow causes the migration of loose particles. If the fluid is water, the reservoir containing kaolinite is also water-sensitive. Therefore, reservoirs containing kaolinite will have both flow velocity sensitivity and water sensitivity.
② Illite is distributed on the surface of quartz grains in filaments or strips. Illite is a typical water-sensitive mineral, and there will be two sensitization mechanisms when it meets water or other fluids in the reservoir. On the one hand, the cation in illite will chemically react with OH- in water [19]; on the other hand, illite will expand after encountering water, and when it is distributed in filaments, strips, or honeycombs, it can maximize contact with water due to its large specific surface area, resulting in greater expansion, reducing or blocking pore throats, forming the Jamin effect, and causing serious reservoir water-sensitive damage.
③ The chlorite in the sandstone is arranged in a needle-like arrangement and is associated with quartz. Chlorite is a non-expansive mineral with weak hydrophilicity (Xi et al., 2015) [30]. Some of its particles fall off after encountering water and block pore channels after migration, thus showing weak water sensitivity. Due to the iron content of chlorite, it reacts with alkaline fluid to form an iron hydroxide precipitate. In addition, chlorite can also react with acidic fluids, and although it will not directly precipitate, the products of the reaction will react with each other again, resulting in insoluble or insoluble secondary precipitation. Therefore, the reservoir containing chlorite mainly has acid sensitivity and alkali sensitivity.
④ The I/S mixed layer is a mixed layer mineral arranged in a honeycomb pattern and associated with illite. Both illite and montmorillonite are water-sensitive minerals. After encountering water, they can not only expand rapidly, and occupy the pore throat space, but also undergo a hydration reaction, showing a loose state or even breaking, resulting in particle migration and plugging of the pore throat, reducing reservoir permeability. The I/S mixed layer in the study area is mainly a honeycomb, and its large specific surface area will produce greater expansion when it meets water.

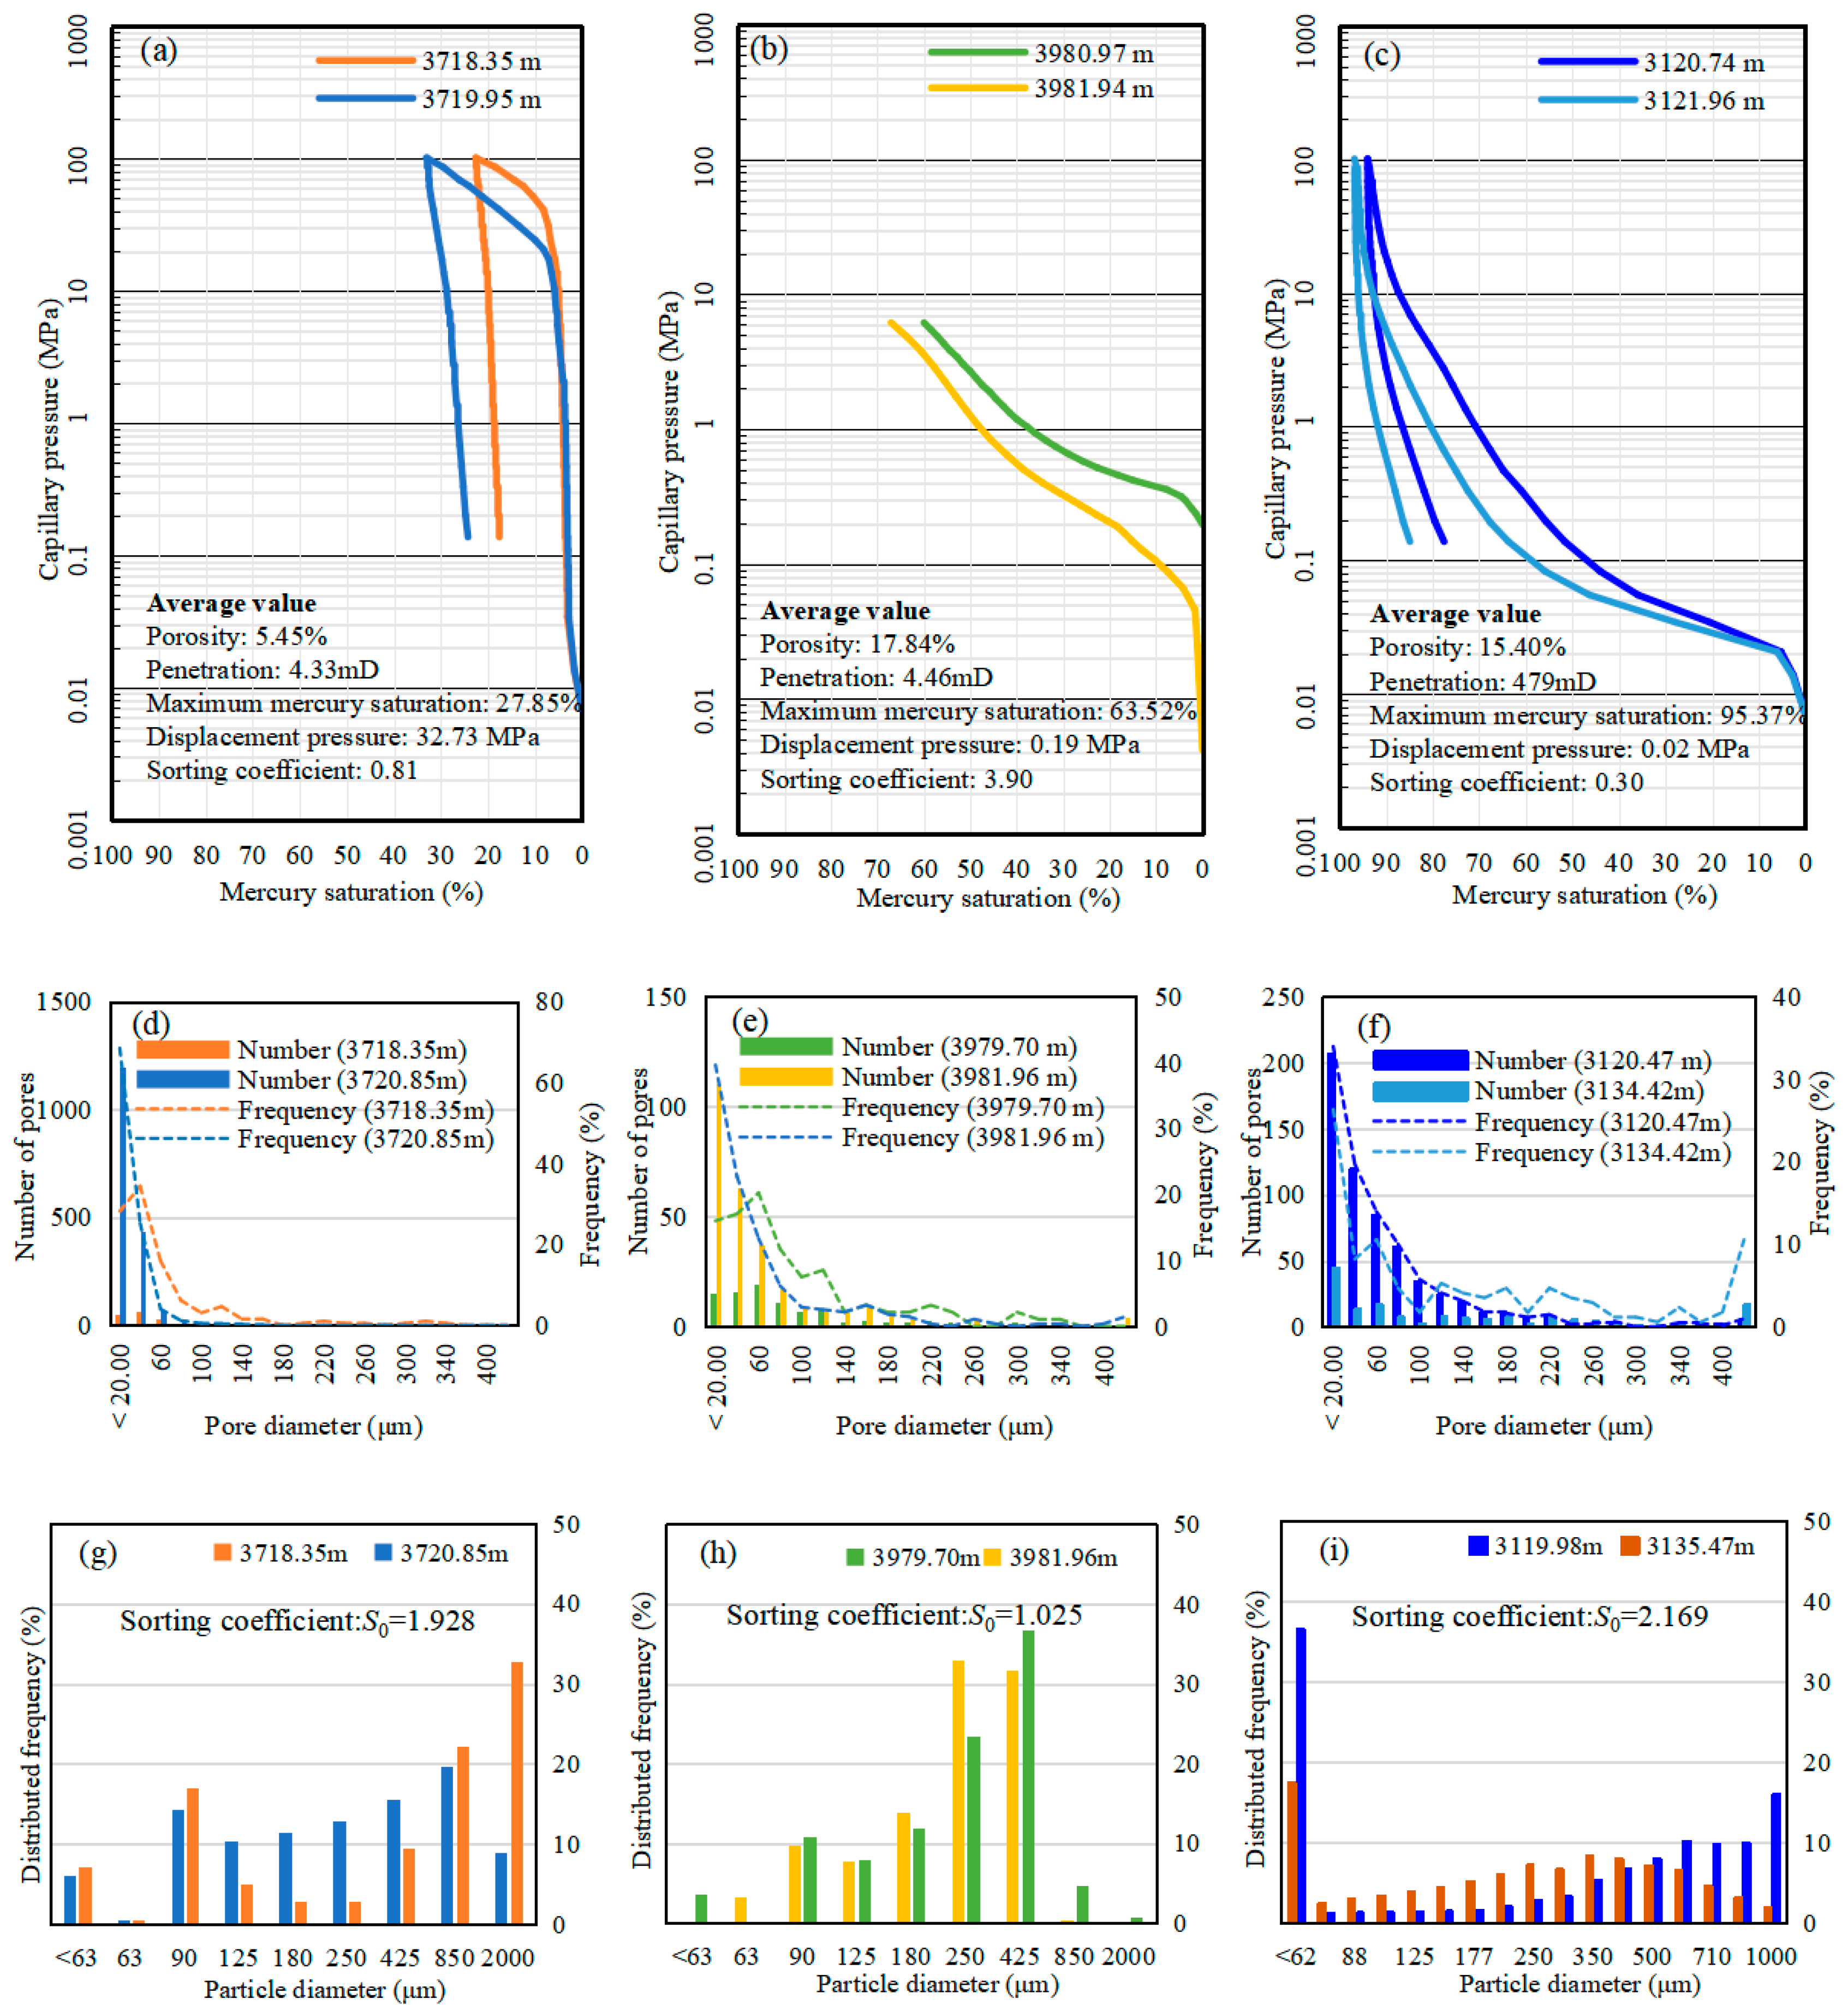
4.2. Pore Structure Sensitivity

(1) Pore type
Thin section observations of the cast in the study area show (Figure 4) that the pore types of well LF15-5-A are mainly intergranular dissolved pores (volume fraction < 0.5%) and intragranular dissolved pores (volume fraction = 0.5%). The pore types of well LF13-9-A are mainly intergranular dissolved pores (volume fraction = 1.5%) and intragranular dissolved pores (volume fraction = 1%). The face ratio of the two groups of Wenchang Formation samples in the Lufeng area is less than 2.5%, and the pore development is very poor. The pore types of well HZ26-6-A are mainly intergranular pores (volume fraction = 12%), intragranular pores (volume fraction = 0.5%), and mold holes (volume fraction = 0.5%). The average face rate of Enping Formation in the Huizhou area is 13%, and the pores are well developed.
(2) Pore structure characteristics
The pore structure characteristics of the reservoir can reflect the size, distribution, geometry, and connectivity of the pore and throat from the microscopic level.
Wenchang Formation, Lufeng area: the porosity of well LF15-5-A is between 4.7% and 6.2%, with a small average porosity of 5.45%. The permeability ranged from 0.62 to 8.04 mD, with an average of 4.33 mD. As shown in Figure 5a, the capillary pressure curve is skewed to the right without an intermediate flat section, the maximum displacement pressure is 41.30 MPa (average 32.73 MPa), the overall pore throat is dominated (average distortion coefficient −1), the sorting ability is relatively average (average separation coefficient 0.81), and the maximum mercury intake saturation is low (average 27.85%). The maximum mercury saturation is 33.10% when the pore throat radius is 0.012 μm. As shown in Figure 5d, pore diameters range from 0 to 60 μm, and pores smaller than 20 μm dominate. Figure 5g shows the diameter distribution of the detrital particles of the sample. The diameter of the particles varies widely, the sorting is poor, and it is easy for the fine particles to fall off and block the pores. The porosity of well LF13-9-A is between 17.38% and 18.3%, with an average porosity of 17.84%. Permeability ranged from 2.04 mD to 6.88 mD, with an average value of 4.46 mD. As shown in Figure 5b, the capillary pressure curve is skewed to the left with a gentle section in the middle and low displacement pressure (average 0.19 MPa), and the overall mesoporous throat (average distortion coefficient 0.37) is dominant, with a high maximum mercury inlet saturation (average 63.52%), and the highest mercury inlet saturation occurs when the pore throat radius is 161.62 μm; the highest is 67.05%. The reservoir is represented by the middle pore throat, the permeability of the reservoir is low, and the sensitivity of the reservoir changes greatly. As shown in Figure 5e, pore diameters range from 0 to 220 μm, and pores smaller than 0 to 60 μm dominate. Figure 5h shows the diameter distribution of the detritus particles of the sample. The diameter of the particles varies widely, and the particles are concentrated in 250 μm and 425 μm, with poor sorting performance. The fine particles fall off and easily block the pores with pore diameters less than 60 μm.
Enping Formation in the Huizhou area: The porosity of the reservoir is between 14.20% and 16.50%, and the average porosity is high (15.40%). Permeability ranged from 314 to 644 mD, with an average of 479 mD. As shown in Figure 5c, the capillary pressure curve is skewed to the left with a flat section in the middle, low displacement pressure (average 0.02 MPa), a large pore throat as a whole (average distortion coefficient 0.60), good sorting ability (average separation coefficient 3.45), and high maximum mercury intake saturation (average 95.37%). The maximum mercury saturation is 96.8% when the pore throat radius is 35.7 μm. The reservoir is represented by a large pore throat, high permeability, and a large variation in reservoir sensitivity. As shown in Figure 5f, pore diameters range from 0 to 400 μm, and pores smaller than 0 to 80 μm dominate. Figure 5i shows the diameter distribution of the detrital particles of the sample. The diameter of the particles varies widely, and the distribution frequency of the particles smaller than 62 μm is larger, while the distribution of other particles is more uniform. The presence of a large number of fine particles makes the overall state extremely unstable.

5. Discussion

From the analysis of Section 4.1 and Section 4.2, it can be seen that samples from the same well or even the same formation have certain similarities in terms of sensitized minerals (content, type, and distribution pattern of clay minerals) and sensitized pore structure. Therefore, the sensitization mechanism is analyzed according to the region and formation.

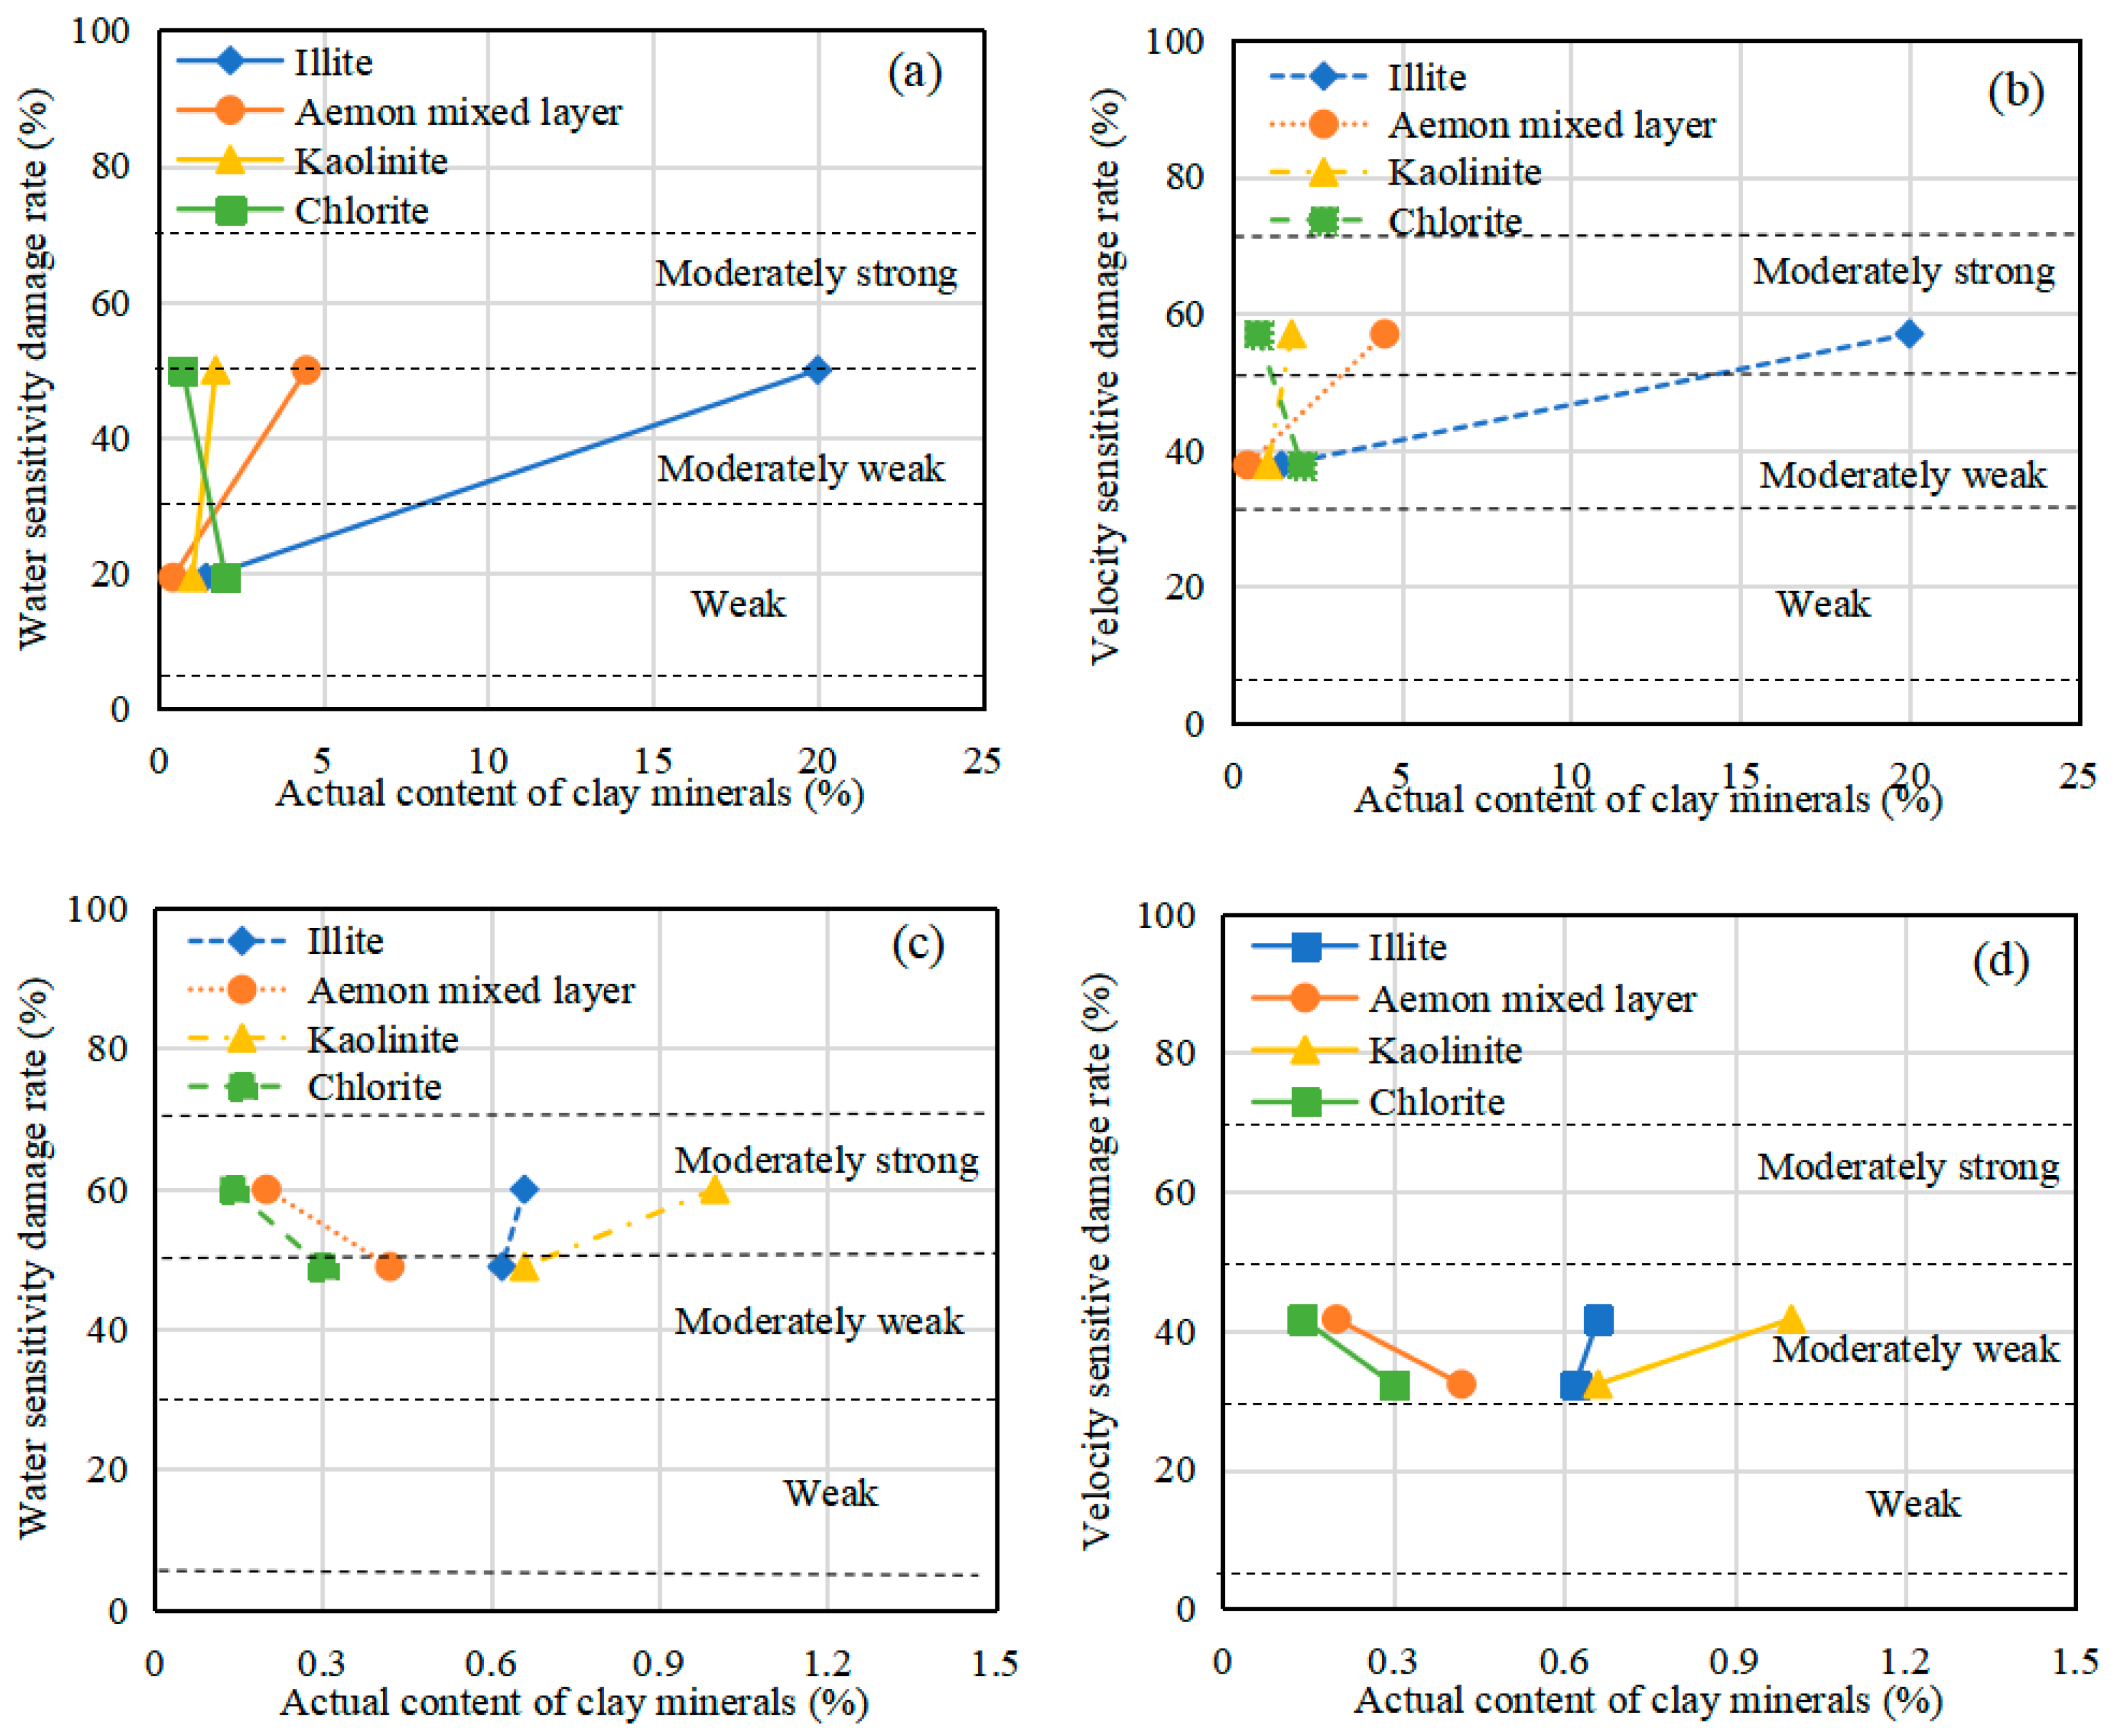
5.1. Water Sensitivity and Velocity Sensitivity

Table 4 shows the relationship between water sensitivity and velocity sensitivity damage rates and clay mineral content of samples from the Wenchang Formation in the Lufeng area and the Enping Formation in the Huizhou area. The actual clay mineral content of Wenchang Formation samples is higher, and the samples with high actual clay mineral content have stronger water sensitivity and velocity sensitivity. The total amount of clay minerals in the sample of Enping Formation is equal to 2%, and the actual content of each clay mineral is less than 1%. The corresponding relationship between water sensitivity and velocity sensitivity and the actual content of each clay is not obvious.
The influence of different clay minerals on water sensitivity and velocity sensitivity is different. The I/S mixed layer is a typical water-sensitive mineral, and the main sensitization mechanism is particle expansion after water encounter, which is stronger than particle migration [19]. The dilatability of illite and chlorite is weak [31], but the expansion rate of illite in contact with water is larger than that of chlorite. Illite is more hydrophilic, while kaolinite does not expand after contact with water, and the sensitization mechanism is mainly due to the particles falling off and plugging pores after contact with water [32]. Therefore, the water sensitivity of clay minerals is as follows: I/S > I > Ch > K. The water sensitivity caused by mineral and pore structure has a negative effect on permeability. However, for the low-salinity water flooding process, the stronger the moisture wettability of the clay, the more beneficial it is to oil and gas development [33]. For velocity sensitivity, kaolinite is the main clay mineral with outstanding contribution [34]. This is because kaolinite chips are mainly connected by molecular bonds, the molecular force is small, and the degree of mechanical resistance is low [35]. As a result, under the action of high-speed fluid, the mechanical force will crack it along the cleavage and turn it into finer particles. Under the action of high-speed fluid, it is easier to transfer and accumulate to the throat of the hole. The intercrystalline structure of illite is also relatively unstable [23], and its velocity sensitivity is second only to kaolinite. However, chlorite has a strong link with detritus particles and does not easily migrate [36], so it will not cause velocity sensitivity. Therefore, the velocity sensitivity relationship of clay minerals is as follows: K > I > I/S > Ch.
According to the relationship between water sensitivity and velocity sensitivity of different clay minerals, the main mechanism of reservoir sensitization can be further analyzed. Figure 6 shows the relationship between clay mineral content, water sensitivity, and velocity sensitivity. As can be seen from Figure 6a,b, the water sensitivity of the Wenchang Formation in the Lufeng area is weak or moderately weak, and the velocity sensitivity is moderately weak or medium strong. The content of the I/S mixed layer in clay minerals is positively correlated with water sensitivity. The I/S mixed layer increased from 0.5% to 4.5% and illite from 1.5% to 20%, resulting in an increase in water sensitivity from 19.4% to 49.9%.
The velocity sensitivity is mainly influenced by kaolinite and illite. Kaolinite increases from 1.1% to 1.8%, and illite increases from 1.5% to 20%, resulting in velocity sensitivity increases from 37.7% to 56.9%. Therefore, the sensitized minerals of Wenchang Formation samples in the Lufeng area are I/S mixed layer, illite, and kaolinite, respectively. In addition, the pores of Wenchang Formation samples in the Lufeng area are mainly intra- and intergranular dissolved pores, with poor pore development. The pore diameter of the samples is concentrated in the range of 0~60 μm, and the sorting ability of clastic particles is general. There is a concentrated distribution of clastic particles with a diameter greater than 90 μm, and few clastic particles with a diameter less than 63 μm are distributed. Therefore, clastic particle shedding is also one of the causes of velocity sensitivity, but the main sensitization mechanism of velocity sensitivity is mineral sensitization.
As shown in Figure 6c,d, the water sensitivity of the Enping Formation in the Huizhou area is moderately weak or moderately strong, and the velocity sensitivity is moderately weak. From the analysis of clay mineral content, the main sensitized minerals are I/S mixed layer and illite, but the content of these two minerals, only illite and water sensitivity is positively correlated. The content of kaolinite and illite is positively correlated with the velocity sensitivity. However, compared with the total clay content, the clay content of Enping Formation samples in the Huizhou area is very small, so the sensitizing mineral content is only one of the reasons affecting the sensitivity of this area. From the analysis of pore structure, the samples of the Enping Group are mainly composed of intergranular pores and intragranular dissolved pores, with a large face ratio and relatively developed pores. The pore diameter is mainly distributed in the range of 0~100 μm, but the sorting ability of detrital particles is poor, and the detrital particles with a diameter less than 62 μm account for a large proportion. It is easy to plug pores, which leads to a significant decrease in reservoir permeability. At the same time, water-sensitive minerals are more likely to plug pores after expansion. Therefore, pore structure and detrital particle distribution are the main causes of water sensitivity and flow velocity sensitivity of Enping Formation samples.
As shown in Figure 6c,d, the water sensitivity of the Enping Formation in the Huizhou area is moderately weak or moderately strong, and the velocity sensitivity is moderately weak. From the analysis of clay mineral content, the main sensitized minerals are I/S mixed layer and I, but only I and water sensitivity are positively correlated. The content of K and I is positively correlated with the velocity sensitivity. However, compared with the total clay content, the clay content of Enping Formation samples in the Huizhou area is very small, so the sensitizing mineral content is only one of the reasons affecting the sensitivity of this area. From the analysis of pore structure, the samples of the Enping Group are mainly composed of intergranular pores and intragranular dissolved pores, with a large face ratio and relatively developed pores. The pore diameter is mainly distributed in the range of 0~100 μm, but the sorting ability of detrital particles is poor, and the clastic particles with a diameter less than 62 μm account for a large proportion. It is easy to plug pores, which leads to a significant decrease in reservoir permeability. At the same time, water-sensitive minerals are more likely to plug pores after expansion. Therefore, pore structure and clastic particle distribution are the main causes of the water sensitivity and flow velocity sensitivity of Enping Formation samples.

5.2. Acid Sensitivity and Alkali Sensitivity

Table 5 shows the mineral content acid sensitivity and alkali sensitivity damage rates of the two groups of samples from the Enping Formation in the Huizhou area. The alkali sensitivity damage rates of the samples from Enping Formation are all less than 30%, and the sensitivity grade is weak. The damage rate of acid sensitivity was between 30% and 50%, and the sensitivity grades were moderately weak. The formation mechanism of alkali sensitivity is mainly due to the dissolution of quartz, feldspar, and clay minerals (mainly kaolinite) by lye [14]. In an alkaline environment, kaolinite particles are more likely to fall off [37]. This is because the dissolution in the alkaline environment will produce colloids or particles containing silicon and aluminum elements [38], which would precipitate in the pores and block the channels of fluid migration. The difference in alkali sensitivity mineral content between the two groups is small, resulting in a difference in alkali sensitivity of only 2.2%, which may be due to the difference in kaolinite content of 0.3% between the two samples. The main minerals that cause acid sensitivity are calcite, ankerite, pyrite, siderite, and chlorite [21]. Similar to the alkali sensitivity, in an acidic environment, iron-containing minerals as well as silicate and carbonate minerals will be dissolved, resulting in Fe (OH)3 and Mg (OH)2 precipitating to clog pores. At the same time, the chlorite contained in the sample is needle-like, attached to the surface of the particles, and has a large contact area with the acid, which makes it easier to react with the acid. The acid-sensitivity minerals in the two groups are not different, the samples containing more calcite and chlorite are more sensitive to acid, and the acid sensitivity damage rate of the two samples is about 10%.

5.3. Salinity Sensitivity

The sensitization mechanism of salinity sensitivity is similar to that of water sensitivity. As shown in Table 6, there is a small difference between the damage rate of water sensitivity and salt sensitivity. In clay minerals, the I/S mixed layer and I also play an important role in reservoir salt sensitivity. When these two clay minerals meet a salt solution in the reservoir, hydration and cation displacement reactions will occur, causing the clay minerals to expand, resulting in accumulation at the small pore throat and reducing the permeability of the reservoir [16]. However, the clay content of the two samples of the Enping Group is not high, and the influence on salinity sensitivity is limited. The pore structure and the distribution characteristics of clastic particles determine the difficulty of damage. This is because, in immersion in a salt solution, the clastic falls off more easily, the content of fine clastic is large, and the pores are blocked more easily, resulting in greater salinity sensitivity.

6. Conclusions

In this work, the Wenchang Formation and Enping Formation in the Huilu area of the Pearl River Estuary Basin are selected as the research objects. The sensitivity of the reservoir is quantitatively evaluated by using the results of sensitivity experiments, thin slice identification, scanning electron microscopy, X-ray diffraction, high-pressure mercury injection, and particle size analysis experiments, and the influencing factors and sensitization mechanism are deeply analyzed from the two aspects of mineral sensitization and pore structure sensitization. The results are as follows:
(1) In terms of mineral sensitivity (content, type, and distribution pattern) and pore structure sensitivity, samples from the same well location have certain similarities. The main clay minerals in the samples from the two regions are illite/montmorillonite mixed layer, illite, kaolinite, and chlorite. The illite/montmorillonite mixed layer and illite are the main sensitizing minerals that affect the water and salinity sensitivity of the reservoir. Kaolinite is the main sensitizing mineral affecting velocity sensitivity. The silica-containing and aluminum-containing minerals are alkali-sensitizing minerals. Calcite, ankerite, pyrite, siderite, and chlorite are acid-sensitizing minerals.
(2) The water sensitivity of the Wenchang Formation is weak to moderate, and the velocity sensitivity is moderately weak or moderately strong, its sensitivity is mainly affected by the clay mineral content. The water sensitivity of Enping Formation is moderately weak or moderately strong, the velocity sensitivity is moderately weak, the alkali sensitivity is moderately weak, the acid sensitivity is moderately weak, and the salinity sensitivity is moderately weak or moderately strong; its sensitivity is mainly affected by the pore structure.
(3) The water sensitization mechanism is that the I/S mixed layer and I are mostly flaky and filamentous, have a large contact area with water, easily expand, and easily block the pore throat. The velocity sensitization mechanism is the accumulation of laminar, worm-like, and accordion-like particles on the particle surface, and the particles can easily fall off, migrate, and clog the pore throat under the action of high-speed fluid. The alkali and acid sensitization mechanism dissolves minerals, causing them to precipitate and clog pores. The sensitization of pore structure is such that when the difference between pore diameter and sample clastic particle diameter is small, the permeability of the reservoir is more likely to be damaged.

Author Contributions

Conceptualization, S.Z.; Methodology, L.D. and S.Z.; Formal analysis, Q.Z. and Q.W.; Investigation, Y.M. and X.T.; Resources, Y.W.; Data curation, H.L. and J.N.; Writing—original draft, H.L.; Writing—review & editing, Q.C.; Visualization, L.D.; Supervision, M.S.; Funding acquisition, S.Z. All authors have read and agreed to the published version of the manuscript.

Funding

This study was funded by the National Natural Science Foundation of China (42102219), the Fundamental Research Funds for the Central Universities, China University of Geosciences (Wuhan) (No. 2021085 and No. 2023006).

Institutional Review Board Statement

Not applicable.

Informed Consent Statement

Not applicable.

Data Availability Statement

The data presented in this study are available on request from the corresponding author. The data are not publicly available due to the nature of this research.

Conflicts of Interest

Authors Hongbo Li, Lin Ding, Qibiao Zang, Qiongling Wu, Yongkun Ma and Yuchen Wang were employed by the company China National Offshore Oil Corporation Limited-Shenzhen. The remaining authors declare that the research was conducted in the absence of any commercial or financial relationships that could be construed as a potential conflict of interest.

References

  1. Xie, Y.H.; Yuan, Q.H. Practice and prospects of deep-water and deep-formation geophysica exploration. Geophys. Prospect. Pet. 2023, 62, 183–193. (In Chinese) [Google Scholar]
  2. Kokkinos, N.C.; Nkagbu, D.C.; Marmanis, D.I.; Dermentzis, K.I.; Maliaris, G. Evolution of Unconventional Hydrocarbons: Past, Present, Future and Environmental FootPrint. J. Eng. Sci. Technol. Rev. 2022, 15, 15–24. [Google Scholar] [CrossRef]
  3. Quan, Y.B.; Liu, J.Z.; Zhao, D.J.; Hao, F.; Wang, Z.F.; Tian, J.Q. The origin and distribution of crude oil in Zhu III sub-basin, Pearl River Mouth Basin, China. Mar. Pet. Geol. 2015, 66, 732–747. [Google Scholar] [CrossRef]
  4. Peng, J.W.; Pang, X.Q.; Shi, H.S.; Peng, H.J.; Xiao, S.; Yu, Q.H.; Wu, L.Y. Hydrocarbon generation and expulsion characteristics of Eocene source rocks in the Huilu area, northern Pearl River Mouth basin, South China Sea: Implications for tight oil potential. Mar. Pet. Geol. 2016, 72, 463–487. [Google Scholar] [CrossRef]
  5. Randolph, M.F.; Gaudin, C.; Gourvenec, S.M.; White, D.J.; Boylan, N.; Cassidy, M.J. Recent advances in offshore geotechnics for deep water oil and gas developments. Ocean Eng. 2011, 28, 818–834. [Google Scholar] [CrossRef]
  6. Zhang, J.Z.; Chen, S.J.; Xiao, Y.; Lu, J.G.; Yang, G.P.; Tang, H.P.; Liu, C.W. Characteristics of the Chang 8 tight sandstone reservoirs and their genesis in Huaqing area, Ordos Basin. Oil Gas Geol. 2013, 34, 679–684. (In Chinese) [Google Scholar]
  7. Moghanloo, R.G.; Dadmohammadi, Y.; Bin, Y.; Salahshoor, S. Applying fractional flow theory to evaluate CO2, storage capacity of an aquifer. J. Pet. Sci. Eng. 2015, 125, 154–161. [Google Scholar] [CrossRef]
  8. Cheng, Q.Y.; Zhou, S.D.; Li, B.B.; Pan, Z.J.; Liu, D.M.; Yan, D.T. Integrating embedment and creep behavior for multisize proppant in shale: Conceptual model and validation. SPE J. 2023, 28, 3389–3408. [Google Scholar] [CrossRef]
  9. Lv, W.F.; Leng, Z.P.; Liu, Q.J.; Jia, N.H.; Luo, M.L.; Li, T.; Jin, X.; Qin, J.H.; Jiang, Z.B. Reservoir Sensitivity Evaluation by Monitoring Displacement Experiment with X-ray CT Imaging. In Proceedings of the SPE/IATMI Asia Pacific Oil & Gas Conference and Exhibition, Nusa Dua, Indonesia, 20–22 October 2015. [Google Scholar]
  10. Cui, G.L.; Feng, X.T.; Pan, Z.J.; Chen, T.Y.; Liu, J.S.; Elsworth, D.; Tan, Y.L.; Wang, C.G. Impact of shale matrix mechanical interactions on gas transport during production. J. Pet. Sci. Eng. 2020, 184, 106524. [Google Scholar] [CrossRef]
  11. Lyu, Z.; Song, X.; Geng, L.; Li, G. Optimization of multilateral well configuration in fractured reservoirs. J. Pet. Sci. Eng. 2019, 172, 1153–1164. [Google Scholar] [CrossRef]
  12. Sun, L.; Zou, X.B.; Li, X.G.; Yang, M.; Du, K.; Cao, P.F. Feasibility study on acidification of volcanic rocks in Huizhou Sag, Pearl River Mouth Basin. Pet. Geol. Recovery Effic. 2022, 29, 145–154. (In Chinese) [Google Scholar]
  13. Ma, K.; Jiang, H.Q.; Li, J.J.; Zhao, L. Experimental study on the micro alkali sensitivity damage mechanism in low-permeability reservoirs using QEMSCAN. J. Nat. Gas Sci. Eng. 2016, 36, 1004–1017. [Google Scholar] [CrossRef]
  14. Chai, G.S.; Shi, Y.M.; Du, S.H.; Wei, Y.; Zhang, Z.Q.; Guo, C.A.; Sun, T. Sensitivity Evaluation and Influencing Factors Analysis of Tight Sandstone Reservoirs: A Case Study of the Chang-8 Reservoir in Yanchi Area of Ordos Basin. Acta Sci. Nat. Univ. Pekin. 2020, 56, 253–261. (In Chinese) [Google Scholar]
  15. Tao, S.; Tang, D.Z.; Xu, H.; Li, S.; Geng, Y.G.; Zhao, J.L.; Wu, S.; Meng, Q.; Kou, X.; Yang, S.Y.; et al. Fluid velocity sensitivity of coal reservoir and its effect on coalbed methane well productivity: A case of Baode Block, northeastern Ordos Basin, China. J. Pet. Sci. Eng. 2017, 152, 229–237. [Google Scholar] [CrossRef]
  16. Davarpanah, A.; Mirshekari, B. Sensitivity analysis of reservoir and rock properties during low salinity water injection. Energy Rep. 2020, 5, 1001–1009. [Google Scholar] [CrossRef]
  17. Khilar, K.C.; Fogler, H.S. The existence of a critical salt concentration for particle release. J. Colloid Interface Sci. 1984, 101, 214–224. [Google Scholar] [CrossRef]
  18. Fang, W.; Jiang, H.; Li, J.; Li, W.; Li, J.J.; Zhao, L.; Feng, X.N. A new experimental methodology to investigate formation damage in clay-bearing reservoirs. J. Pet. Sci. Eng. 2016, 143, 226–234. [Google Scholar] [CrossRef]
  19. Wang, B.Y.; Qin, Y.; Shen, J.; Wang, G.; Zhang, Q.S.; Liu, M. Experimental study on water sensitivity and salt sensitivity of lignite reservoir under different PH. J. Pet. Sci. Eng. 2019, 172, 1202–1214. [Google Scholar] [CrossRef]
  20. Fang, W.C.; Jiang, H.Q.; Li, J.; Li, W.; Li, P.; Gu, H.; Feng, X.N.; Zhao, L. Investigation of salt and alkali sensitivity damage mechanisms in clay-containing reservoirs using nuclear magnetic resonance. Part. Sci. Technol. 2017, 35, 533–540. [Google Scholar] [CrossRef]
  21. Wilson, M.J.; Wilson, L.; Patey, I. The influence of individual clay minerals on formation damage of reservoir sandstones: A critical review with some new insights. Clay Miner. 2014, 49, 147–164. [Google Scholar] [CrossRef]
  22. Wei, J.G.; Zhang, A.; Li, J.T.; Shang, D.M.; Zhou, X.F. Study on microscale pore structure and bedding fracture characteristics of shale oil reservoir. Energy 2023, 278, 127829. [Google Scholar] [CrossRef]
  23. Cui, C.; Zheng, R.C.; Jiang, Y.Q.; Jin, J.; Wen, H. Characteristics and sensitivity of the Middle Jurassic Toutunhe Formation inFudong slope, Junggar Basin. Oil Gas Geol. 2018, 39, 398–408. (In Chinese) [Google Scholar]
  24. Xue, D.; Zhang, S.A.; Wu, X.M.; Li, X.H.; Du, J.J.; Lu, C.G. Sensitivity experiment of shale gas reservoir of Chang 7 reservoir in Xiasiwan oilfield. Lithol. Reserv. 2019, 31, 135–144. (In Chinese) [Google Scholar]
  25. Jin, Z.H.; Yuan, G.H.; Zhang, X.T.; Cao, Y.C.; Ding, L.; Li, X.Y.; Fu, X.H. Differences of tuffaceous components dissolution and their impact on physical properties in sandstone reservoirs: A case study on Paleogene Wenchang Formation in Huizhou-Lufeng area, Zhu I Depression, Pearl River Mouth Basin, China. Pet. Explor. Dev. 2023, 50, 111–124. [Google Scholar] [CrossRef]
  26. Ge, J.W.; Zhu, X.M.; Zhang, X.T.; Lei, Y.C.; Niu, Z.C.; Li, M. Tectono-sedimentation model of the Eocene Wenchang formation in the Lufeng depression, Pearl River Mouth basin. J. China Univ. Min. Technol. 2018, 47, 308–322. (In Chinese) [Google Scholar]
  27. Peng, G.R.; Liu, P.; Song, P.L.; Gao, X.; Xiong, W.L.; Xiang, Q.W.; Han, B. Characteristics of the “fan-braid” complex and main controlling factors offavorable reservoir in the Enping Formation, Huizhou 26 Sag, Pearl RiverMouth Basin. Earth Sci. 2023, 1–18. (In Chinese). Available online: http://kns.cnki.net/kcms/detail/42.1874.P.20231127.1128.004.html (accessed on 29 April 2024).
  28. SY/T 6285-2011, Evaluating Methods of Oil and Gas Reservoirs. Available online: http://www.petrostd.com/km/front/standard/stdQuery/std.jsp?keyword=6285-2011 (accessed on 29 April 2024).
  29. Sanaei, A.; Shakiba, M.; Varavei, A.; Sepehrnoori, K. Mechanistic modeling of clay swelling in hydraulic-fractures network. SPE Res Eval. Eng. 2017, 21, 96–108. [Google Scholar] [CrossRef]
  30. Xi, K.; Cao, Y.; Jahren, J.; Zhu, R.K.; Bjorlykke, K.; Haile, B.G.; Zheng, L.J.; Hellevang, H. Diagenesis and reservoir quality of the Lower Cretaceous Quantou Formation tight sandstones in the southern Songliao Basin, China. Sediment. Geol. 2015, 330, 90–107. [Google Scholar] [CrossRef]
  31. Wang, Y.X.; Zhou, L.F.; Jiao, Z.S.; Shang, Q.; Huang, S. Sensitivity Evaluation of Tight Sandstone Reservoir in Yanchang Formation in shanbei Area. Ordos Basin. J. Jilin Univ. Earth Sci. Ed. 2018, 48, 981–990. (In Chinese) [Google Scholar]
  32. Mahdi, H.; Alireza, S.; Kamy, S. Hydraulic fracturing fluid effect on clay swelling in stimulated naturally fractured reservoirs. In Proceedings of the SPE/AAPG/SEG Unconventional Resources Technology Conference, Austin, TX, USA, 24–26 July 2017. [Google Scholar]
  33. Boyer, C.; Kieschnick, J.; Suarez-Rivera, R.; Lewis, R.E.; Waters, G. Producing gas from its source. Oilfield Rev. 2006, 18, 36–49. [Google Scholar]
  34. Puntervold, T.; Mamonov, A.; Aghaeifar, Z.; Frafjord, G.O.; Moldestad, G.M.; Strand, S.; Austad, T. Role of kaolinite clay minerals in enhanced oil recovery by low salinity water injection. Energy Fuels 2018, 32, 7374–7382. [Google Scholar] [CrossRef]
  35. Aksulu, H.; Hamso, D.; Strand, S.; Puntervold, T.; Austad, T. Evaluation of low-salinity enhanced oil recovery effects in sandstone: Effects of the temperature and pH gradient. Energy Fuels 2012, 26, 3497–3503. [Google Scholar] [CrossRef]
  36. Li, F.F.; Gao, W.L.; Yang, S.L.; Hua, X.W. Study on reservoir sensitivity for low permeability reservoirs in the Gao 52 block of Ansai oilfield. Spec. Oil Gas Reserv. 2012, 19, 126–129. (In Chinese) [Google Scholar]
  37. Wang, X.W. Study on Reservoir Sensitivity Evaluation and Key Control Factors of Tight Oil Reservoirs. Spec. Oil Gas Reserv. 2021, 28, 103–110. (In Chinese) [Google Scholar]
  38. Yadav, V.P.; Sharma, T.; Saxena, V.K. Dissolution kinetics of potassium from glauconitic sandstone in acid lixiviant. Int. J. Miner. Process. 2000, 60, 15–36. [Google Scholar] [CrossRef]
Figure 1. The division of the construction unit of the Pearl River Estuary Basin and the pillar diagram of the Huizhou area. Modified from Jin et al. (2023) [25].
Jmse 12 00888 g001
Figure 2. Mineral content in Lufeng Sag and Huizhou Sag. (a) The content of clay minerals in LF15-5-A ranges from 5 to 26%, and the content of clay minerals in samples 1-29B (3719.90 m) and 1-29D (3719.88 m) is 25% and 23%, respectively; (b) in LF13-9-A, the clay mineral content is distributed in the range of 2–24%, and the clay mineral content of samples 2-15A (3979.40 m) and 2-25A (3981.96 m) is 5% and 3%, respectively; (c) HZ26-6-A, the clay mineral content distribution is 1.5~5%, and the clay mineral content of samples 1-03F (3120 m) and 1-64F (3135 m) is 2%.
Jmse 12 00888 g002
Figure 3. Relative content of clay minerals in well areas of Lufeng Sag and Huizhou Sag. (a) LF15-5-A; (b) LF13-9-A; (c) HZ26-6-A.
Jmse 12 00888 g003
Figure 4. Identification results of cast thin sections in the Huilu area. A is the intergranular dissolved pores, B is the intragranular dissolved pores; C is the intergranular pores; D is the mold pores.
Jmse 12 00888 g004
Figure 5. Pore structure characteristics in Lufeng and Huizhou areas. (ac) show the mercury injection experiment results of wells LF15-5-A, LF13-9-A, and HZ26-6-A respectively; (df) show the results of wells LF15-5-2, LF13-9-A, and HZ26, respectively. The results of image analysis and detection of cast thin section pore characteristics in well -6-A; (gi) show the particle size screening results of well LF15-5-A, well LF13-9-A, and well HZ26-6-A, respectively.
Jmse 12 00888 g005
Figure 6. Relationship between actual clay mineral content and water sensitivity and speed sensitivity in Lufeng and Huizhou areas. (a) Clay mineral content and water-sensitive damage rate of the Wenchang Formation in the Lufeng area; (b) clay mineral content and flow-sensitive damage rate of the Wenchang Formation in the Lufeng area; (c) clay mineral content and water-sensitive damage rate of the Enping Formation in the Huizhou area; (d) clay mineral content and flow velocity sensitivity damage rate in the Enping Formation in Huizhou area.
Jmse 12 00888 g006
Table 1. Basic information of the experiment samples.
RegionFormationWellSampleLength
(cm)
Diameter
(cm)
Porosity
(%)
Permeability
(mD)
Depth
(m)
Lufeng SagWenchangLF15-5-A1-29B3.7322.5242.70.053719.90
1-29D3.1712.5262.40.403719.88
LF13-9-A2-15A3.0062.53612.10.683979.40
2-25A3.6652.51316.52.883981.96
Huizhou SagEnpingHZ26-6-A1-03F15.5232.52712.62003119.62
25.6242.53110.654.703119.62
35.2002.50013.02563120.00
45.3362.52713.22573119.68
55.1112.52711.780.603119.68
1-64F15.4812.53312.0483135.00
25.3942.53111.433.603134.80
35.8532.53413.01013134.90
45.3082.53415.02543135.00
55.3752.53412.51713134.97
Table 2. The results of sensitivity.
WellSamplesWater-Sensitive Damage Rate (%)Speed-Sensitive Damage Rate (%)Acid-Sensitive Damage Rate (%)Alkali-Sensitive Damage Rate (%)Salt Sensitivity Damage Rate (%)
LF15-5-A1-29B49.90
1-29D56.93
LF13-9-A2-15A19.36
2-25A37.73
HZ26-6-A1-03F59.8941.6533.8825.3056.32
1-64F48.8732.2743.5723.1047.27
Table 3. Main clay mineral characteristics and potential damage in Lufeng Sag and Huizhou Sag.
MineralSEM Map of the Distribution PatternDescriptionSensitive TypePotential Damage
KJmse 12 00888 i001
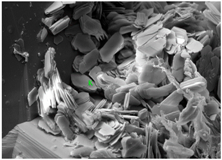
Laminated kaolinite, filled with intergranular poresVelocity sensitivity, alkali sensitivity, water sensitivity (weak)The migration of particles clogs the pore throat, and the particles are more likely to fall off in an alkaline environment
IJmse 12 00888 i002Filamentous illite is distributed on the surface of quartz grainsWater sensitivity (weak) and velocity sensitivityAfter absorbing water, the particles expand and block the pore throat
ChJmse 12 00888 i003
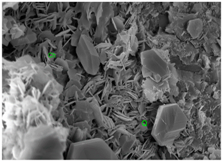
Coniferous chlorite is associated with authigenic quartzWater sensitivity (weak), acid sensitivityDissolve in acid fracturing fluid and form a gel
I/SJmse 12 00888 i004
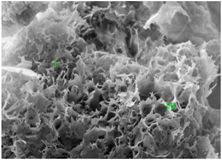
Montmorillonite and illite symbiotic development, forming a honeycomb-like mixed layerWater sensitivityAfter absorbing water, the particles expand and block the pore throat
Table 4. Clay mineral content and water sensitivity and velocity sensitivity damage rates of Wenchang Formation samples in the Lufeng area.
WellFormationSampleRelative Content (%)/Actual Content (%)Water Sensitivity Damage Rate
(%)
Velocity Sensitivity Damage Rate
(%)
I/SIKCh
LF15-5-AWenchang1-29B18/4.580/207/1.83/0.849.956.9
LF13-9-A2-25A9/0.529/1.521/1.141/2.119.437.7
HZ26-6-AEnping1-03F10/0.233/0.750/17/0.159.941.7
1-64F21/0.431/0.633/0.715/0.348.932.3
Table 5. Mineral content and acid and alkali sensitivity damage rate of samples from Enping Formation in the Huizhou area.
FormationSampleAlkali Sensitivity Mineral Content (%)Acid Sensitivity Mineral Content (%)Damage Rate (%)
QFPKCaAPySChAlkaliAcid
Wenchang1-03F7117.55.510.5210.50.125.333.9
1-64F711760.712100.323.143.6
Q—quartz, F—feldspar, P—plagioclase, Ca—calcite, A—ankerite, Py—pyrite, S—siderite.
Table 6. Comparison of water sensitivity and salt sensitivity damage rates of samples from Enping Group in the Huizhou area.
WellFormationSampleTotal Clay (%)Water Sensitivity Damage Rate (%)Salinity Sensitivity Damage Rate (%)
HZ26-6-AEnping1-03F259.956.3
1-64F248.947.3
Disclaimer/Publisher’s Note: The statements, opinions and data contained in all publications are solely those of the individual author(s) and contributor(s) and not of MDPI and/or the editor(s). MDPI and/or the editor(s) disclaim responsibility for any injury to people or property resulting from any ideas, methods, instructions or products referred to in the content.

