Article

High-Accuracy and Fast Calculation Framework for Berthing Collision Force of Docks Based on Surrogate Models

1
College of Harbor, Coastal and Offshore Engineering, Hohai University, Nanjing 210098, China
2
Key Laboratory of Coastal Disaster and Defence (Hohai University), Ministry of Education, Nanjing 210098, China
3
School of Mathematics, Hohai University, Nanjing 211100, China
*
Author to whom correspondence should be addressed.
J. Mar. Sci. Eng. 2024, 12(6), 898; https://doi.org/10.3390/jmse12060898
Submission received: 16 April 2024 / Revised: 23 May 2024 / Accepted: 24 May 2024 / Published: 28 May 2024
(This article belongs to the Section Coastal Engineering)

Abstract

:
The accurate prediction of the collision force magnitude resulting from ship berthing on docks is crucial for the rationality and safety of dock structural design. This paper presents a novel framework for the calculation of berthing collision force for ships (CBCF), which integrates field data, finite element models, and surrogate models. Based on field data and finite element analysis, the framework constructs and compares four surrogate models with low sample requirements, ultimately selecting the optimal surrogate model for predicting collision force. Furthermore, a sensitivity analysis of the parameters is conducted based on the selected model, followed by a comparison with the various methods used for collision force prediction. The results illustrate the effectiveness of the proposed framework in replacing finite element models for the rapid and accurate prediction of collision force. Comparison with existing methods also underscores the advantages of the proposed framework, including low sample requirements, high calculation accuracy, and exceptional efficiency. In summary, this study not only introduces a novel and precise surrogate model framework for the swift prediction of berthing collision force, but it also offers valuable insights into the prevention of ship collision with wharf accidents and facilitates the rational and safe design of wharf structures.

1. Introduction

Due to its cost-effectiveness and substantial carrying capacity, maritime shipping has emerged as the predominant method of global cargo transport, playing a pivotal role in international trade and the broader development of the global economy [1,2]. Yet, with the increasing volume of shipping traffic, a range of challenges has emerged. Established port facilities may fall short of accommodating the berthing needs of increasingly larger vessels, potentially raising the likelihood of accidents. Research [3] indicates that 43.6% of waterborne transportation accidents are attributed to vessel collisions. To mitigate such occurrences, existing standards such as the AASHTO [4], European norms [5], and the Chinese railway bridge and culvert specifications [6] offer formulas to compute the collision forces in ship–bridge collisions. An accurate calculation of the collision forces can inform the design of structures or the implementation of protective measures, thus ensuring safety. However, there is a lack of a direct and suitable method for calculating the collision forces when ships berth at docks.
In 1959, Minorsky [7] conducted a comprehensive examination of 26 nuclear-powered ship collision incidents, thus pioneering the field of ship collision research. Since then, the topic of collision force has been extensively explored through methods like empirical formula fitting, impact simulation experiments, and numerical simulations. For instance, Zhou et al. [8] analyzed ship–bridge collision forces as delineated in differing standards and devised a theoretical formula supported by finite element analysis, considering cumulative damage in their calculations. Song et al. [9] performed numerical simulations that resulted in 45 time-history curves of ship–bridge collision forces to assist in parameter identification within collision models and aid in the prediction of impact loads over time. Consolazio [10] proposed the recommended bow extrusion curve and revised the AASHTO formula based on an analysis of multiple high-resolution bow-crushing simulations. Sha et al. [11] evaluated the ship impact force and wharf response through indoor impact tests and numerical simulation analysis, proposing an empirical formula for calculating the peak impact force related to barge mass and speed according to numerical calculation results. It is evident that the current research primarily focuses on ship–bridge collision issues. However, there has been limited analysis, discussion, or study on the significance of port wharves in water transport networks. Port wharves play a crucial role in undertaking berthing tasks; yet, this aspect has not received adequate attention.
In contrast to bridges, wharves are commonly equipped with rubber fenders to mitigate the impact response of ships during berthing [12,13]. The current specifications do not provide a direct formula for calculating the collision force of vessels berthing at the wharf; instead, they derive the collision force manually by considering the berthing energy and combining it with the energy absorption curve of rubber fenders [14,15,16]. Considering that different types of fenders have varying characteristics in terms of energy absorption curves when installed at different wharves, the specification offers a more general calculation method to accommodate various specific situations. However, this method introduces a certain level of uncertainty in determining the berthing collision force, which may lead to an excessively conservative structural design for the wharf and subsequently escalate the construction costs. Therefore, accurately calculating the collision force of vessels berthing at the wharf holds significant practical value.
Among the various calculation methods available, high-resolution finite element models offer superior accuracy by considering material details, boundary conditions, and other relevant factors [17]. In comparison to the limited availability of on-site data, a validated finite element model can effectively complement deficiencies in data. However, despite their ability to compensate for data shortages, performing high-precision finite element analyses not only necessitates significant computational resources [18] but also demands operators with a certain level of expertise. This scenario poses significant challenges to advancing more in-depth analyses. Thus, finding a computation method that can rapidly and accurately predict berthing collision forces is of crucial importance. When confronted with this dilemma, the emerging technology of machine learning (ML) demonstrates its superiority.
Unlike the traditionally stringent finite element simulations, surrogate models based on machine learning can perform rapid calculations in place of finite element models while ensuring accuracy, thereby significantly improving computational efficiency [19]. Common types of surrogate models include artificial neural networks (ANN), polynomial chaos expansion (PCE), and response surface methodology (RSM). Surrogate models based on machine learning, with their excellent performance, have been widely applied in various fields. For example, Fan et al. [20] developed an artificial neural network-based method for calculating ship–bridge collision forces using numerical simulation data. Qin et al. [21] argued that the rise of machine learning has greatly promoted the development of the oceanography field and has used Physics-informed neural networks to address storm surge issues. Kameshwar [22] predicted the collision response of bridge piles based on the response surface methodology. In the field of engineering, using surrogate models to replace traditional finite element simulations for rapid analysis has become a new research trend. Considering the efficiency and reliability of surrogate models, applying them to calculate the collision force of ship berthing is a reasonable and feasible choice.
Addressing the existing research gaps in this particular domain, this paper proposes a novel framework for calculating the berthing collision force for ships (CBCF) by integrating finite element analysis and surrogate model technology with field data. The proposed framework can be widely applied to various wharves on-site, providing an exclusive and efficient calculation method for berthing collision force at each individual wharf. In Section 2, the CBCF framework is established in the order of “Construction–Optimization–Application”. In Section 3, the effectiveness of the proposed framework is demonstrated through its application to a wharf in the Jiangsu province, China, where it accurately predicts and analyzes berthing collision forces as verified by physical model tests. Finally, Section 4 summarizes the key findings obtained from this study.

2. Construction of the CBCF Framework Based on Surrogate Models

The present section presents the specific composition of the proposed framework for calculating ship berthing collision force based on surrogate models. It encompasses the construction, evaluation, and optimization of the collision surrogate model, as well as the utilization of the optimized model to predict berthing collision force.

2.1. Construction of Collision Surrogate Model

According to ship–bridge collision codes [4,5], the primary factors influencing collision forces are typically the ship tonnage and the berthing speed. However, this study expands upon these factors by also considering the berthing angle and the rubber fender as additional influential parameters. It is worth mentioning that the berthing angle here is the angle between the berthing speed in the direction of ship navigation and the perpendicular line of the dock. The energy absorption capacity of rubber fenders is primarily determined by the stress–strain relationship of the material [23,24]. Given that a ship may encounter multiple rubber fenders during berthing, it is assumed that each individual fender undergoes elastic deformation when compressed. Therefore, for simplicity in describing the energy absorption effect of rubber fenders in this study, we have selected the elastic modulus of rubber. In summary, this study utilizes ship tonnage t , berthing speed v , the rubber fender elastic modulus E , and the berthing angle θ as the input parameters for the collision surrogate model; the berthing collision force F serves as the output parameter; and a corresponding “Input–Output” dataset is constructed. The output parameter Y = F is also a random variable due to the inherent randomness of the input parameter vector t , v , E , θ , which follows a probability density function z ( t , v , E , θ ) . The sample set is designated as ( t , v , E , θ ) j , Y j , j = 1 , , N . Considering the randomness of berthing modes, and integrating the development of computational models in recent years with the cost of sample calculations, this paper establishes four low-cost operational collision surrogate models for predicting and analyzing the collision force during ship berthing.
1
Col-Kriging
Kriging was initially introduced by Ord [25] as an interpolation technique for stochastic spatial processes in the Statistical Encyclopedia. The collision Kriging (Col-Kriging) model developed in this study is designated as M K :
Y = M K ( t , v , E , θ ) = λ 0 + λ 1 t + λ 2 v + λ 3 E + λ 4 θ + λ 5 t 2 + λ 6 v 2 + λ 7 E 2 + λ 8 θ 2 + λ 9 t v + λ 10 t E + λ 11 t θ + λ 12 v E + λ 13 v θ + λ 14 E θ + σ 2 Z ( t , v , E , θ )
where λ i , i = 0 , , 14 are the coefficient of the trend term, and σ 2 and Z ( t , v , E , θ ) denote the variance and the zero mean, the unit variance, and the stationary Gaussian process, respectively.
2
Col-PCE
The polynomial chaos expansion (PCE) principle aims to construct a spectral representation using appropriate polynomial functions to effectively approximate the output of a computational model, such as a finite element model [26]. The collision PCE(Col-PCE) formula in this study is as follows:
Y = M P C E ( t , v , E , θ ) = α A 4 , q λ α ψ α ( t , v , E , θ )
where λ α is the undetermined coefficient to be expanded; ψ α is the polynomial orthogonal to the joint probability density function of the input parameter t , v , E , θ ; the index subscript α represents the basis function; and A 4 , q denotes the truncated set of quaternion polynomials with a q-norm multi-index, encompassing any combination of t , v , E , θ . This constraint effectively limits the size of the polynomial by restricting the number of nonzero coefficients it can have.
3
Col-PCK
The PCK method combines the merits of Kriging and polynomial chaotic expansion, enabling the capture of both global behavior and local changes in computational models. The surrogate model established by Zhao et al. [27] using PCK exhibits the high flexibility and the strong nonlinear modeling ability, making it an optimal choice. Specifically, PCK consists of a general-purpose Kriging model whose trend part is a sparse set of orthogonal polynomials:
Y = M P C K ( t , v , E , θ ) = α A 4 , q λ α ψ α ( t , v , E , θ ) + σ 2 Z ( t , v , E , θ )
where α A 4 , q λ α ψ α ( t , v , E , θ ) is the weighted sum of orthogonal polynomials describing the trend of the PCK model; A 4 , q corresponds to the same concept as in the PCE model; and σ 2 and Z ( t , v , E , θ ) share a similar interpretation as that of the Kriging model. Thus, PCK can be regarded as a specialized version of the general Kriging model, with distinct trend characteristics.
4
Col-SVR
Support vector machines (SVM) originated from Cortes’s research [28] and were initially employed for the binary classification and pattern recognition of test cases. This principle provides a significant generalization ability for support vector machine regression and effectively reduces the risk of overfitting. The formula of the Col-SVR model can be written as follows:
Y = M S V R ( t , v , E , θ ) = ω T Φ t , v , E , θ ; t j , v j , E j , θ j + b , j = 1 , N
where ω represents the weight coefficient vector, Φ t , v , E , θ ; t j , v j , E j , θ j = exp t , v , E , θ t j , v j , E j , θ j 2 2 2 is the distance Gaussian kernel function, and b is the estimated offset parameter.

2.2. Evaluation and Optimization of Surrogate Models

Existing research indicates that the accuracy of surrogate models varies in different application scenarios. The aforementioned surrogate model has achieved good results in various fields [29,30,31], but whether it can maintain the same accuracy when applied to the prediction of dock ship berthing collision forces still requires further verification. The “Input-Output” dataset is split into two parts: the training set is used to build different surrogate models, and the validation set is used to evaluate the training results. Then, the most suitable surrogate model is selected to replace the on-site dock or finite element analysis to predict the dock berthing collision force.
Based on the prediction results, surrogate models are evaluated to select the optimal one for predicting the berthing collision force, which will be used for the construction of the CBCF framework. Numerous accuracy evaluation indexes are available, and, based on the studies conducted by Shao [32] and Hu [33], validation error (val) and leave-one-out cross-validation (LOO) are selected as the evaluation metrics for their ability to effectively reflect the accuracy of surrogate models. The validation set, denoted as { X v a l , Y v a l = M ( X v a l ) } , is utilized to calculate the validation error E v a l according to the following formula:
E ν a l = K 1 K Σ i = 1 K M X ν a l ( i ) M X ν a l ( i ) 2 Σ i = 1 K M X ν a l ( i ) μ ^ Y ν a l 2
where μ ^ Y v a l = 1 K i = 1 P M ( X v a l ( i ) ) represents the mean value of the validation set, and K denotes the total number of samples in the validation set.
The leave-one-out (LOO) error exhibits a relatively higher robustness. It works on the principle of isolating a point from the complete experimental data and constructing a new surrogate model from the remaining points. This process is repeated for every point in the design of experiments to evaluate the accuracy and applicability of the constructed model. The formula for calculating the error of E L oo is as follows:
E L o o = Σ i = 1 K M ( X ( i ) ) M \ i ( X ( i ) ) 2 Σ i = 1 K M X ( i ) μ ^ Y 2
where M \ i ( ) is the surrogate model obtained after removing the ith sample point from the complete experimental data, and μ ^ Y is the mean value of the samples in the design of experiments.

2.3. CBCF Framework Process

By employing the surrogate model determined through evaluation in the preceding section, the computation of the berthing collision force for ships can be performed with an acceptable accuracy across various operational scenarios. The CBCF framework in this study is constructed following the “Construction-Optimization-Application” sequence, as illustrated in Figure 1. During the construction phase, a diverse “Input-Output” dataset composition is obtained primarily through two channels: field data and finite element analysis [34]. The optimization phase involves training and evaluating with training and validation sets to identify the optimal collision surrogate model, taking into account both computational cost and prediction accuracy. Finally, during the application phase, the most optimal surrogate model is employed to predict berthing collision forces under different operational conditions at specific wharves.

3. Framework Application

In this section, the proposed CBCF framework is implemented at a wharf located in the Jiangsu province, China, and its reliability is validated through physical model testing. The “Input-Output” dataset is obtained by combining finite element analysis with field data verification.

3.1. Project Introduction

The wharf segment measured 68 m in length and 36 m in width, featuring a total of 10 beams spaced at intervals of 7 m. It was divided into upper and lower parts, with the upper part consisting of cast-in-place slabs and prefabricated longitudinal and transverse beam structures made from C40 concrete material. The lower part comprised 94 PHC tubular piles with a diameter of 1 m, utilizing C80-grade concrete. Rubber fenders were positioned every 14 m along the front edge of the wharf. The main design vessel dimensions for the high-pile wharf berth are provided in Table 1.

3.2. The Establishment of the Finite Element Model

3.2.1. Material Parameter Setting

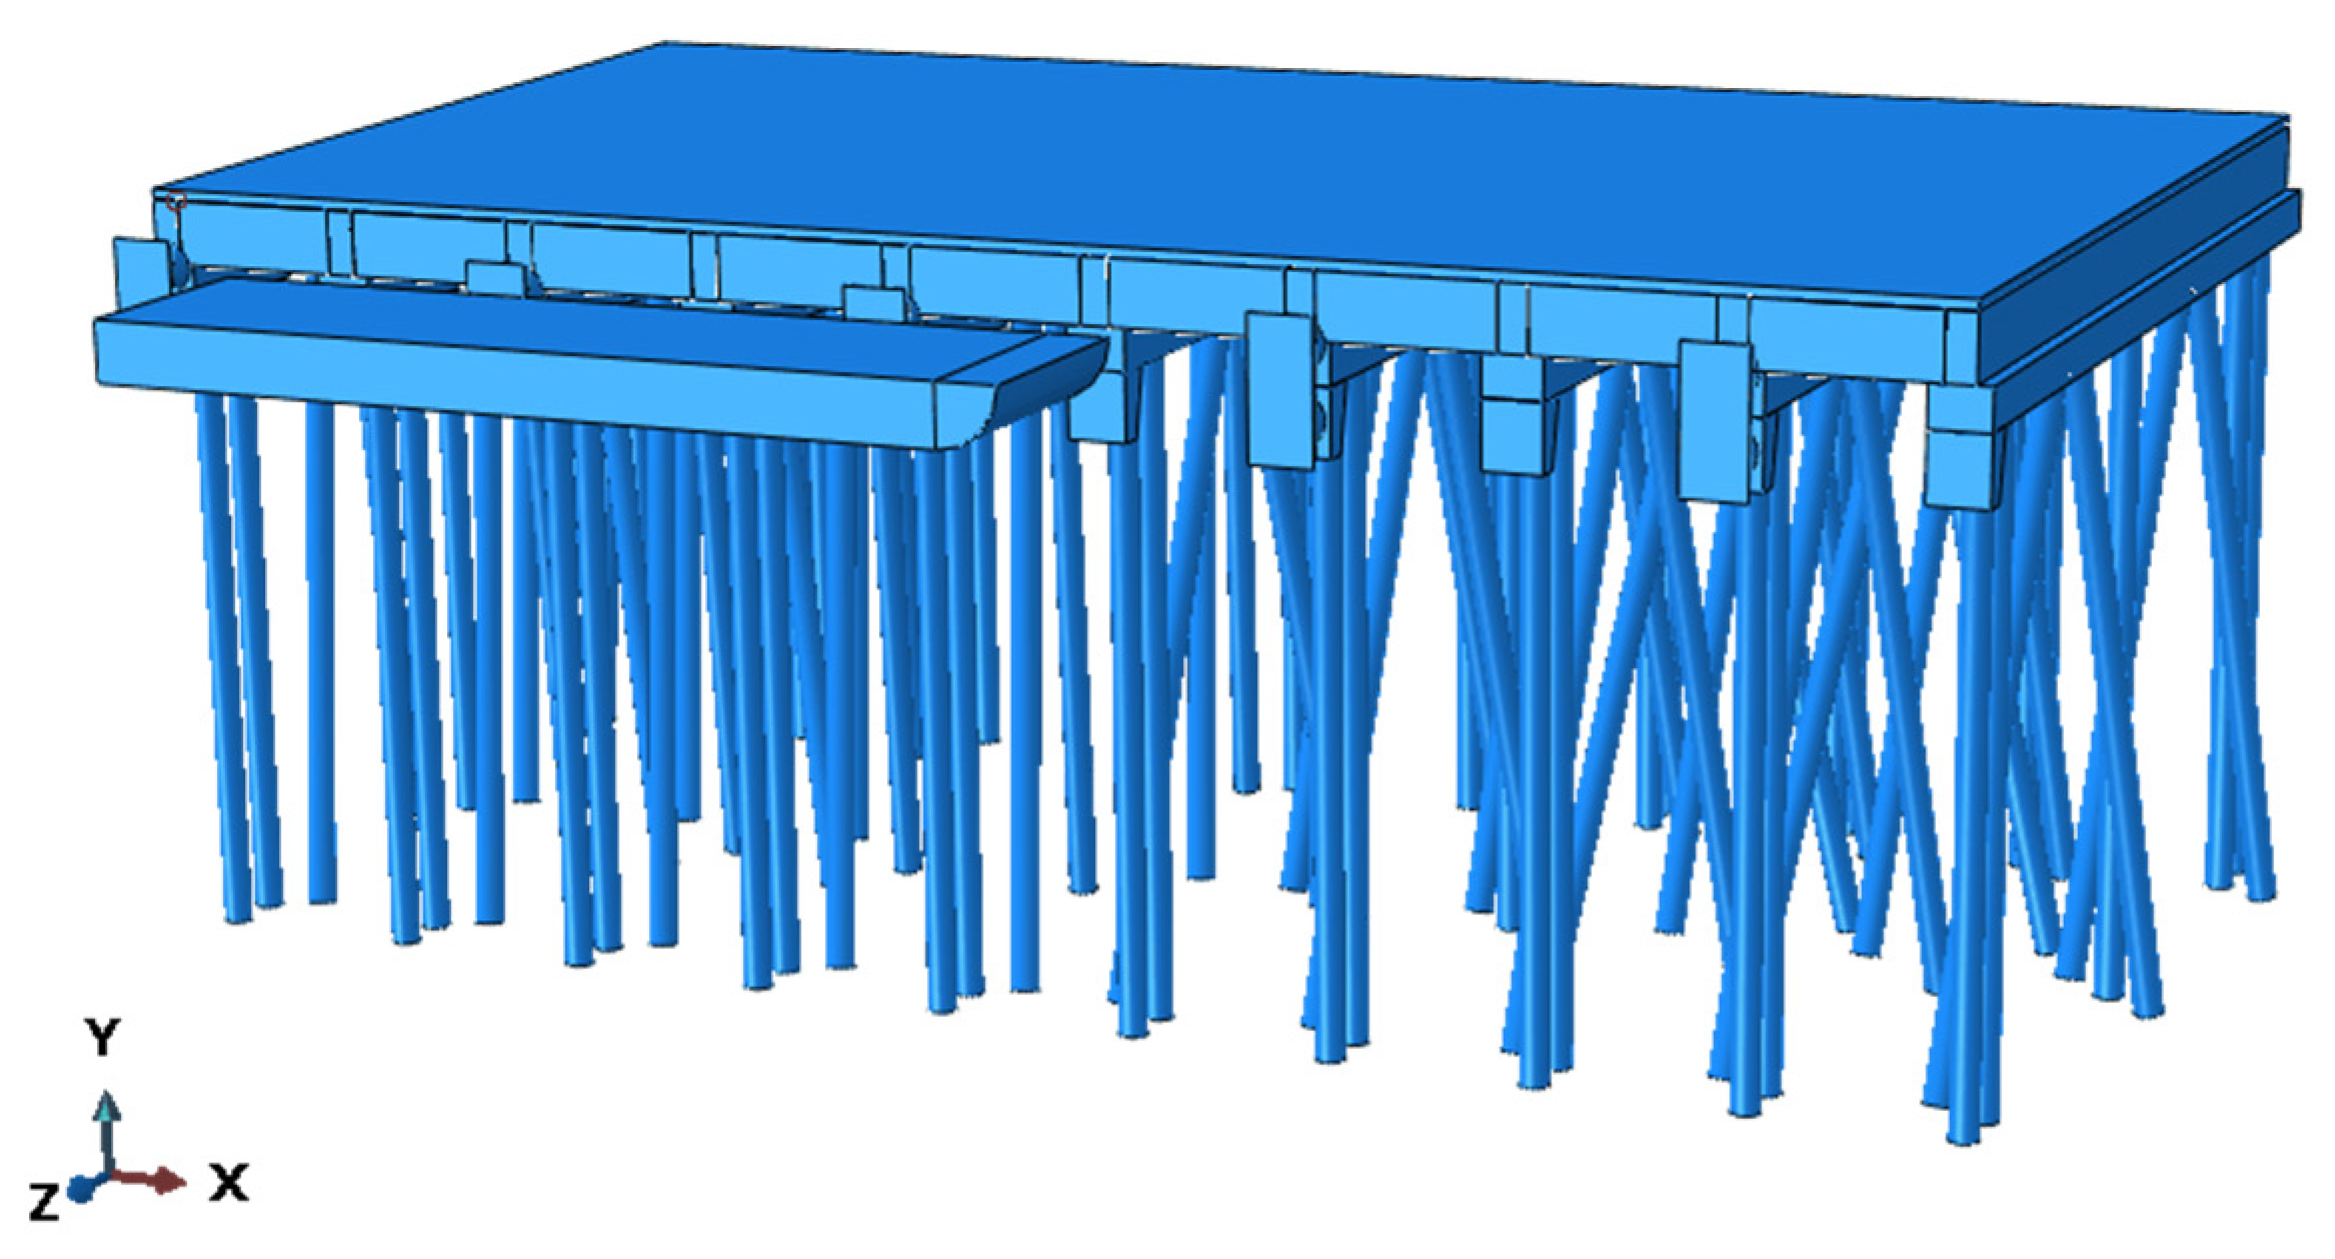
Based on the ABAQUS (2021) finite element software, the ship–rubber fender–wharf numerical model was constructed, as shown in Figure 2. Considering that the primary research focus was on the collision force during ship berthing, simplifications were made to the ship model: its geometric dimensions remained constant, while variations in material density and the speed parameters were employed to simulate the berthing process for ships of different tonnages at various normal berthing speeds and angles. The upper structure was represented by C3D8R elements corresponding to C40 concrete material, whereas S4R elements were utilized to model the piling foundation with respect to C80 concrete material.
Currently, several commonly used superelastic constitutive models for rubber fenders include the Mooney–Rivlin model, the Arriuda–Boyce model, the Ogden model, the Yeoh model, etc. [35]. Among these models, the strain energy function of the Arriuda–Boyce model is excessively complex, and its parameters are challenging to determine accurately; thus, it is unsuitable for finite element simulation. The determination of related parameters for the strain energy function in the Ogden model poses difficulties through experimental means. Additionally, the strain energy function of the Yeoh model exhibits significant errors at small deformations and fails to simulate small deformation compression effectively. In comparison with these models, the Mooney–Rivlin model offers a simpler strain energy function that allows the calculation of relevant parameters using the elastic modulus [36], making it widely employed in simulating rubber’s constitutive relationship. Therefore, this study utilized the Mooney–Rivlin model to simulate such a relationship, as it considered strain energy density as a polynomial function of strain invariant and represented an incompressible material with only one term for the strain invariant—referred to as Mooney–Rivlin material [37]. The constitutive relationship of the biparametric Mooney–Rivlin model, as provided in ABAQUS, is expressed as follows:
W = C 10 ( I 1 ¯ 3 ) + C 01 ( I 2 ¯ 3 ) + 1 D ( J 1 ) 2
where W represents the strain energy density, I 1 ¯ and I 2 ¯ denote the first and second strain invariants, respectively, C 10 and C 01 are the Rivlin coefficients, E = 7.5 C 10 = 30 C 01 , J stands for the volume compression ratio, and D represents the incompressibility coefficient of the volume.
If the material is completely incompressible (such as rubber, Poisson’s ratio 0.4997) [36], the strain energy density formula can be changed into the following:
W = C 10 ( I 1 ¯ 3 ) + C 01 ( I 2 ¯ 3 )
The material characteristics of each structural component in the finite element model utilized in this study are presented in Table 2.

3.2.2. Model Validity Verification

In order to validate the accuracy of the established finite element model in reflecting real-world conditions, this case employed three approaches to verify the efficacy of the model.

Berthing Collision Force Verification

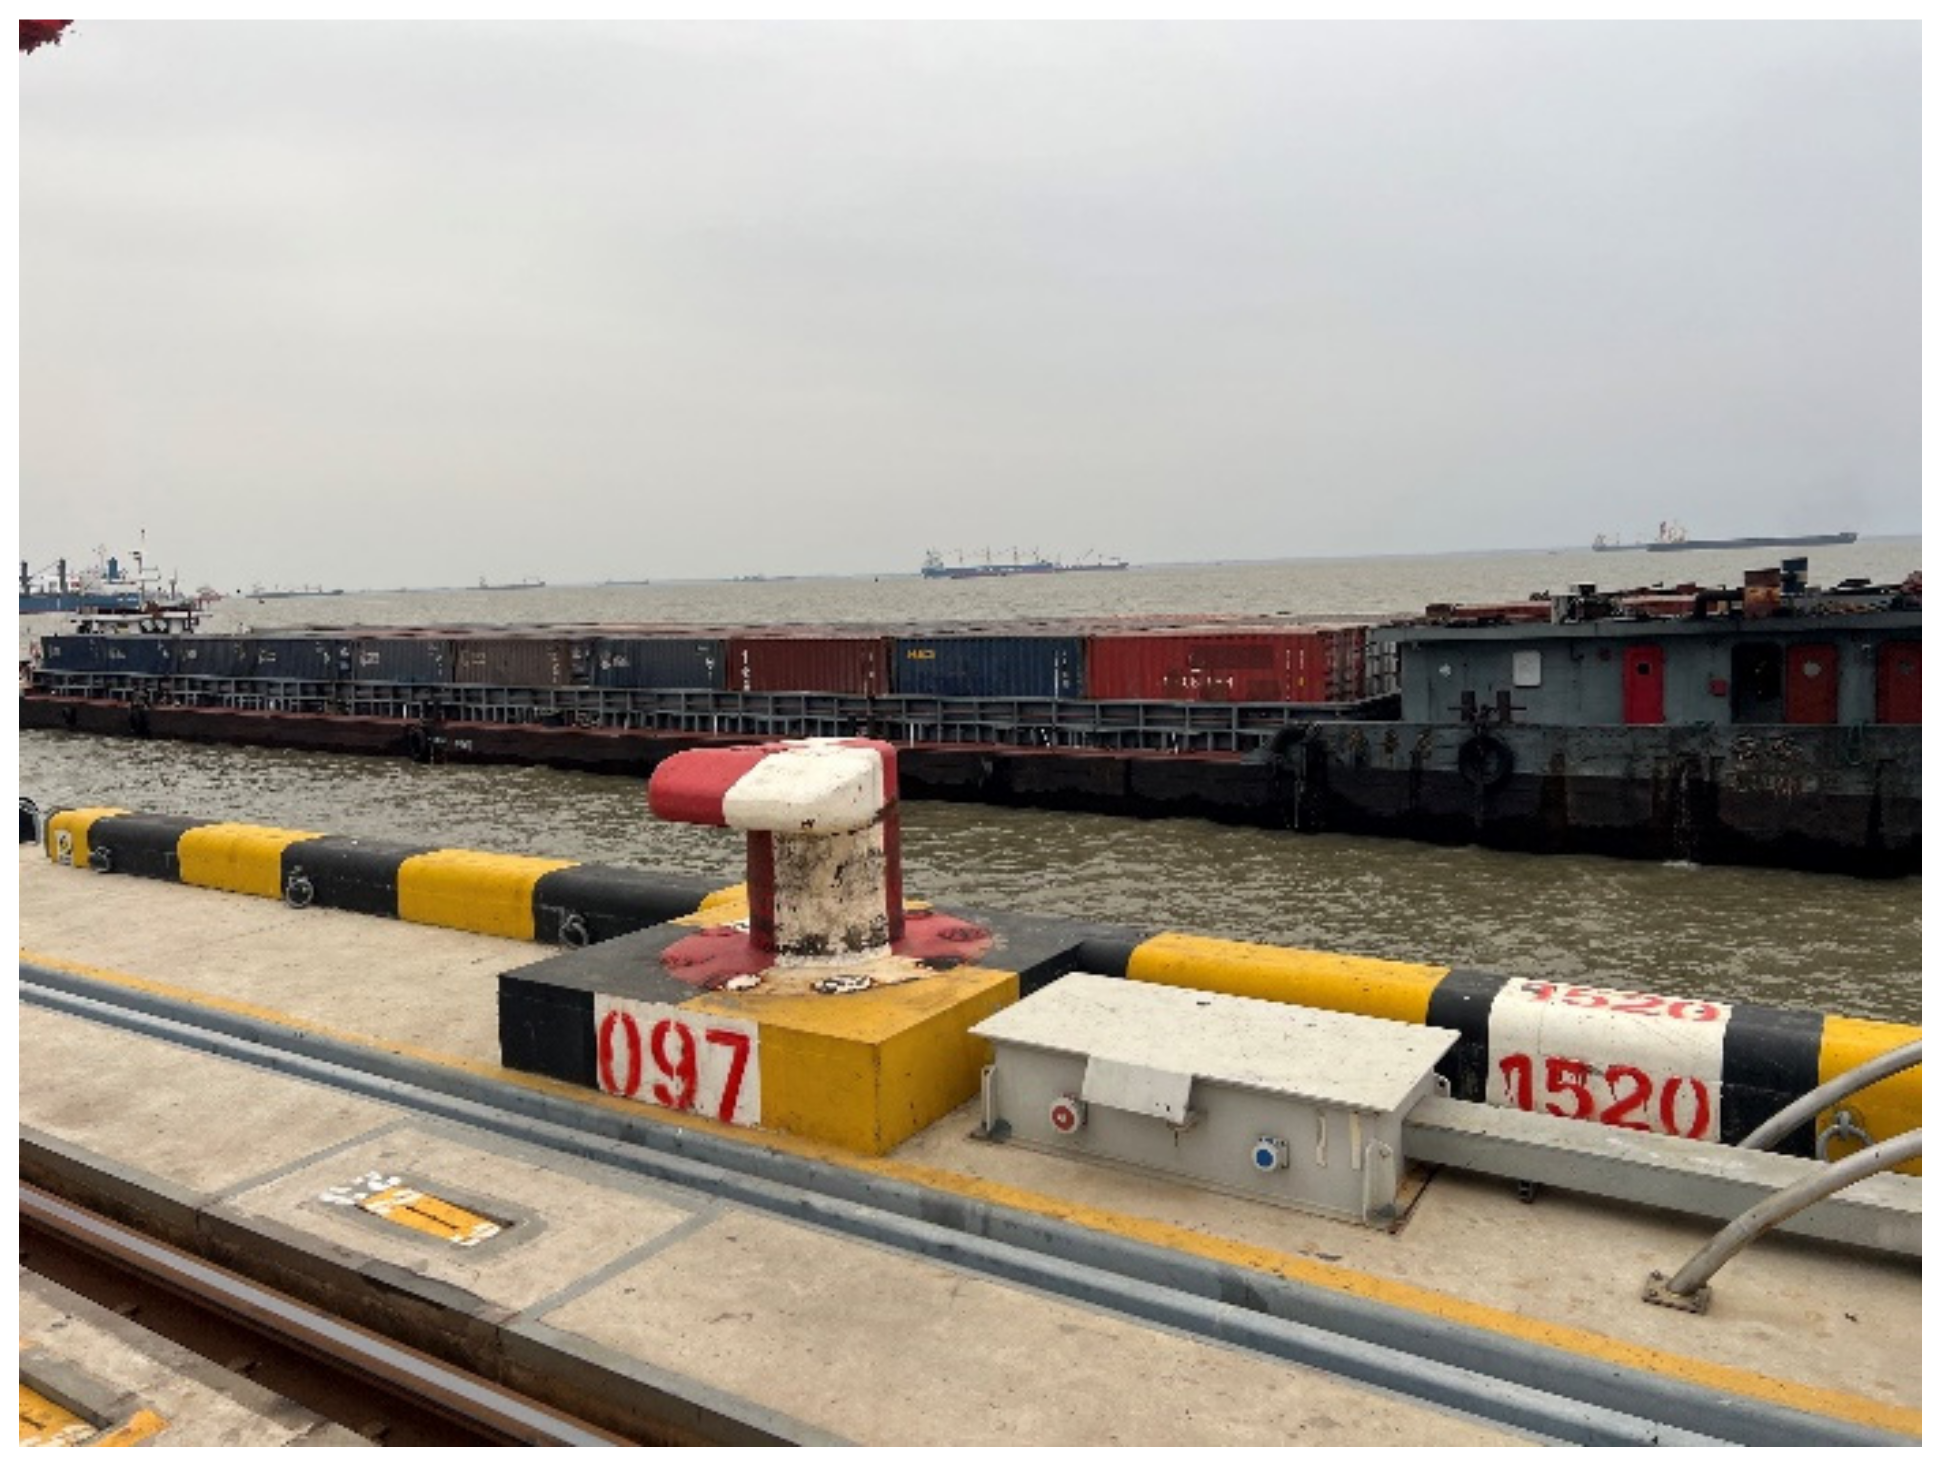
According to the whole-life-cycle monitoring project of the wharf conducted by the China Communications Construction Company, berthing collision force sensors were installed in the rubber fender of the wharf. Representative berthing record samples from the wharf operation logs were selected to verify the material parameters of the finite element model. Taking examples with a berthing tonnage of 2100 t and a berthing speed of 0.29 m/s, as well as a berthing tonnage of 14,500 t and a berthing speed of 0.14 m/s, these cases involved ships approaching in an approximately parallel direction to the surface of the wharf, as illustrated in Figure 3. The berthing collision forces measured by the on-site monitoring system were 1792 kN and 1961 kN, respectively. The simulations carried out in the ABAQUS software indicated that the time-history data of the collision forces shown in Figure 4 correspond to the actual scenario. The finite element model effectively replicated the fluctuation of collision force during the berthing process, consistent with the data obtained from on-site monitoring. At the time of berthing of 0.43 s and 0.7 s, the collision force reached peak values of 1768 kN and 2013 kN, respectively, with errors of only 1.34% and 2.7%, indicating that the berthing collision force of the finite element model is in accordance with the actual situation.

Berthing Collision Energy Verification

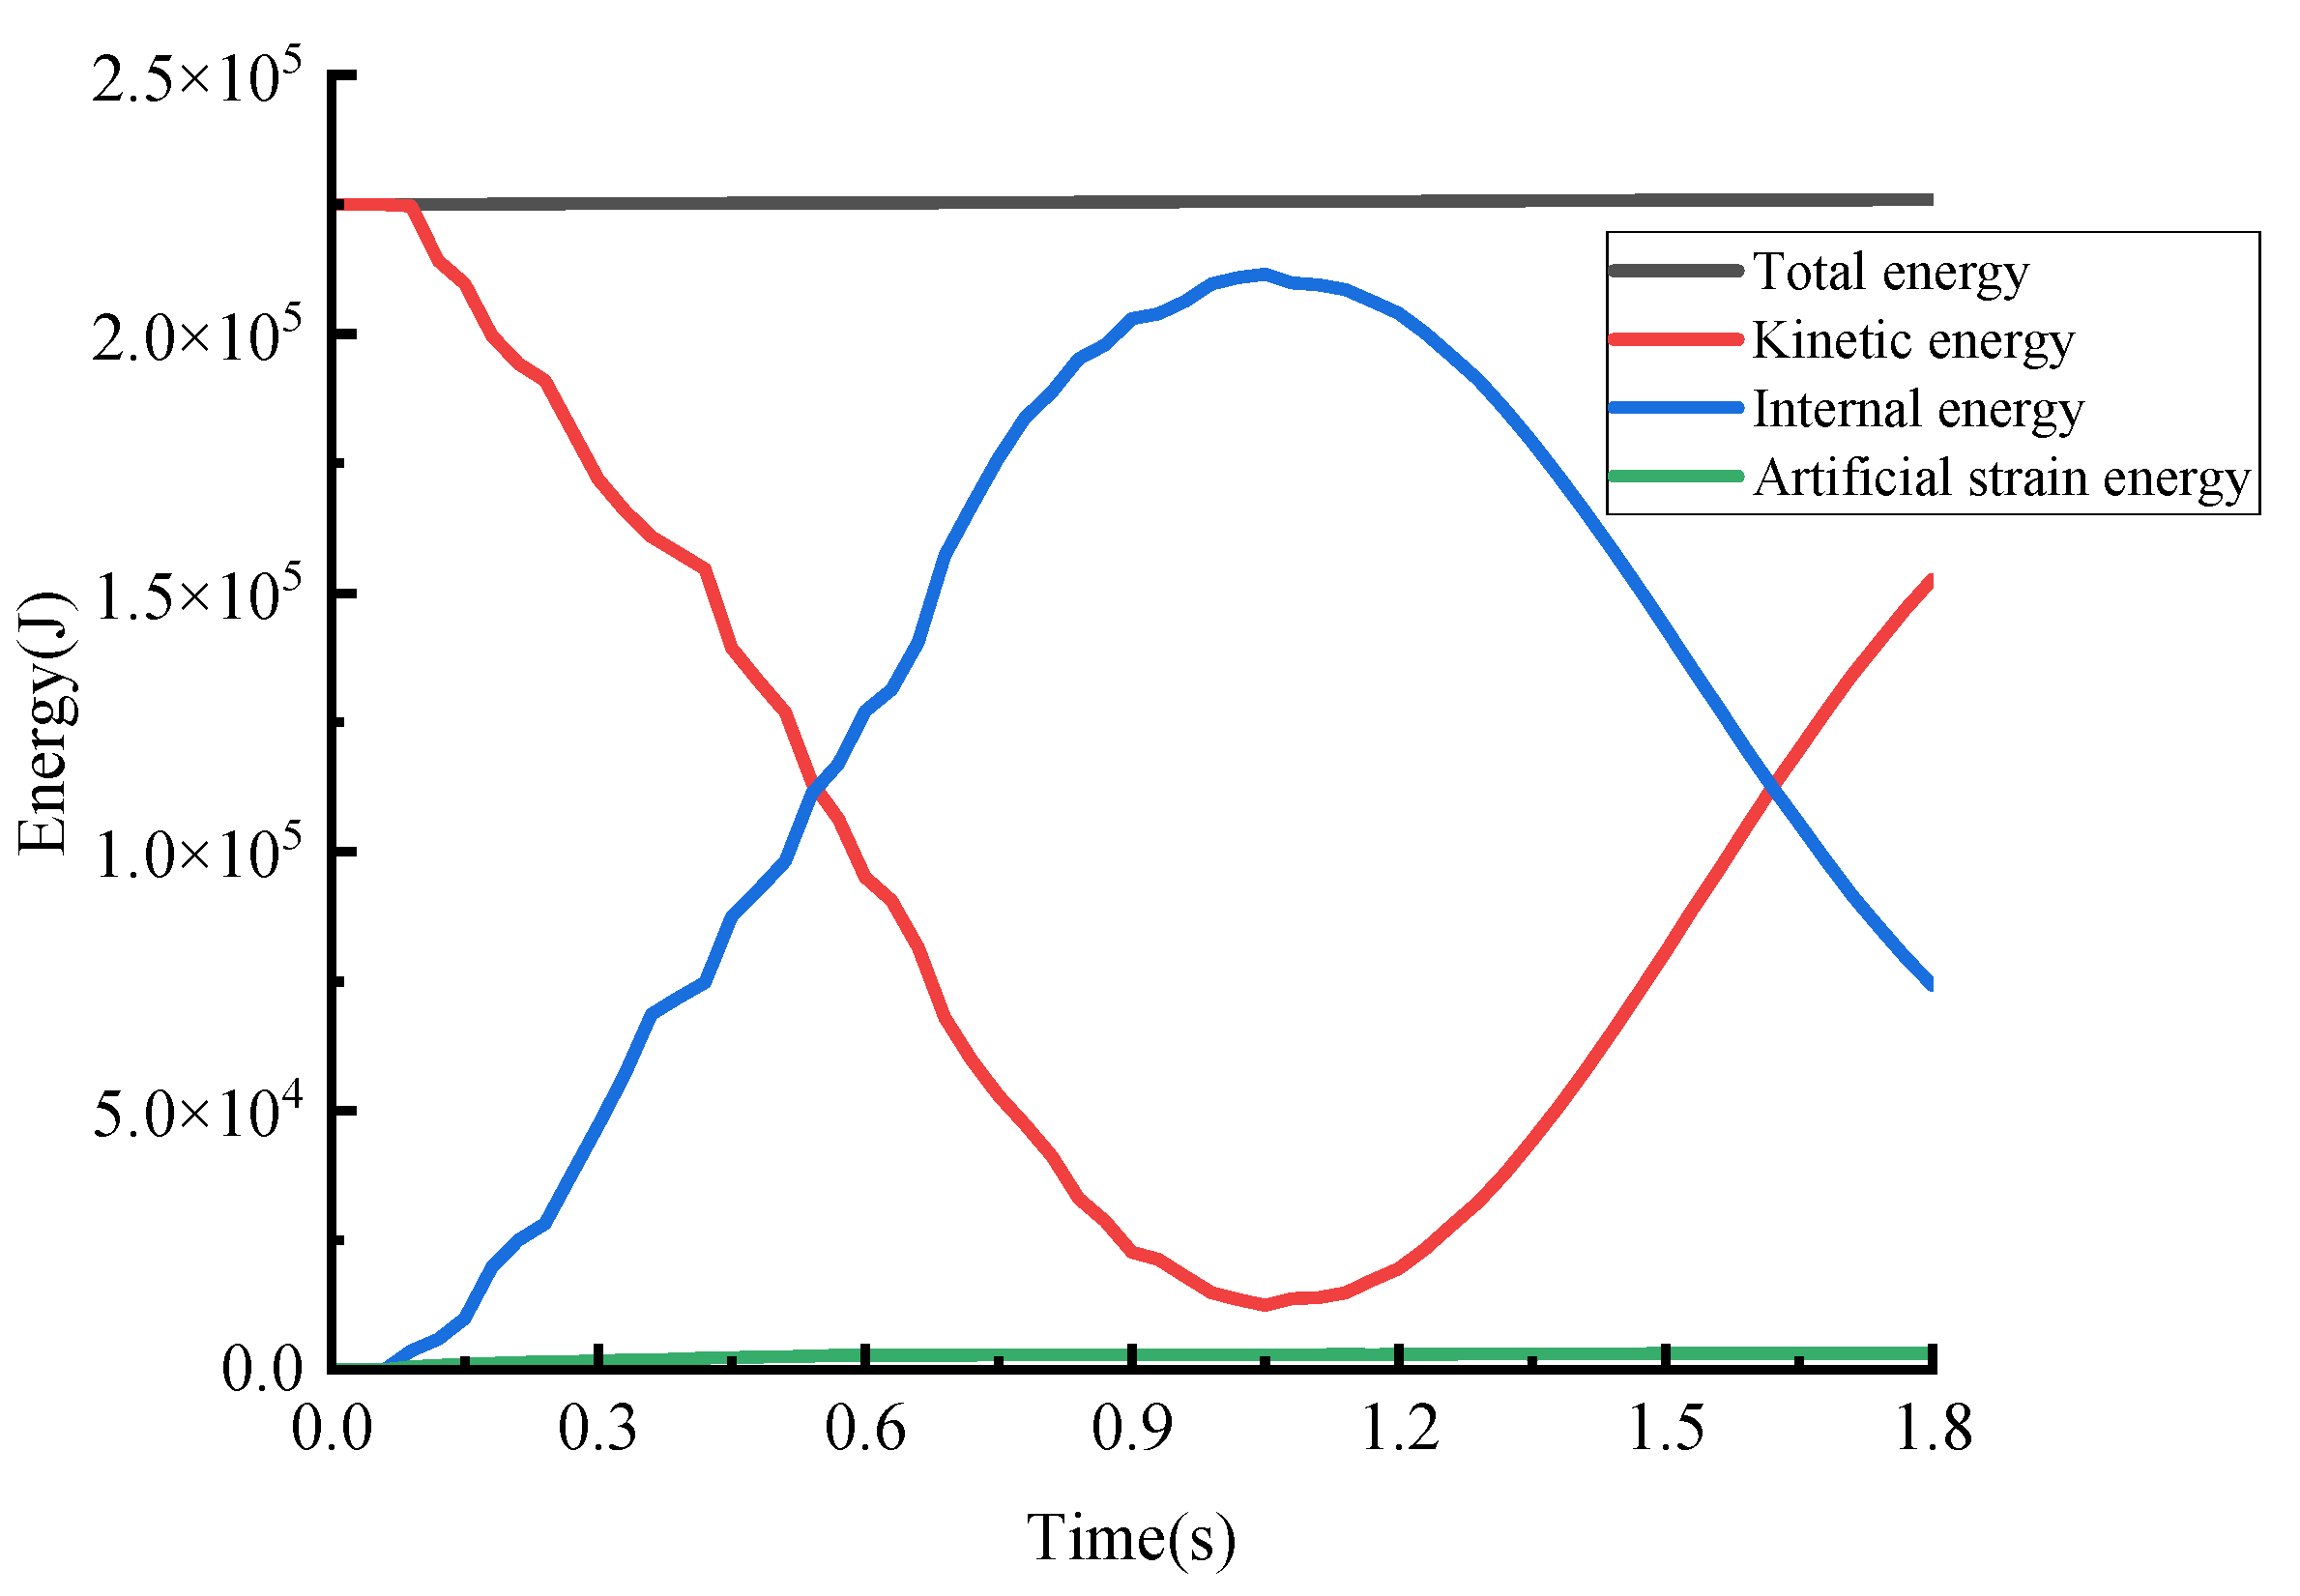
Energy analysis serves as a crucial approach to ensure the accuracy of calculations [38]. The berthing process of a ship can be regarded as an energy conversion process, where the initial kinetic energy of the ship is transformed into absorbed internal energy by both the rubber fender and the wharf structure, along with artificial strain energy. The energy change diagram of the berthing collision system obtained in the finite element analysis software ABAQUS is presented in Figure 5, depicting a 5000-ton ship berthing at a normal velocity of 0.3 m/s. In the initial stage of the collision, there is a rapid decrease in kinetic energy, followed by a gradual reduction in its rate of decline. Over time, the trend for the internal energy exhibits an opposite behavior to that of kinetic energy, with both reaching their peaks around 1.1 s. Additionally, due to the hourglass effect [39], artificial strain energy inevitably increases slightly over time, leading to a marginal rise in the total system energy. To ensure that the simulation results remain unaffected by the hourglass problem, it is generally necessary to control the proportion of artificial strain energy within 10% [38,40]. In this study’s berthing model, we successfully controlled the proportion of artificial strain energy within 5%, thus demonstrating the feasibility of our finite element simulation results.

Self-Vibration Frequency Verification

The natural frequency of a structure is an inherent characteristic that is intrinsically linked to the structure itself, and it serves as a crucial parameter for validating the accuracy of finite element models [41,42]. The finite element model was employed in this study to analyze the vibration mode and obtain information on the frequency of vibration modes. Regarding the vibration data monitored on-site, the NexT-ERA method was employed in this study for modal identification, which integrates the Eigen-system realization algorithm with the natural excitation technique [43]. The comparative results are compiled and presented in Table 3. The modal frequencies obtained from the modal analysis conducted in this article show a maximum error of only 1.79% when compared to the measured results obtained on-site, indicating that they fall within an acceptable margin of error.
Based on the analysis results from the aforementioned three aspects, it can be inferred that the finite element model constructed in this study accurately depicts the mechanical response characteristics of the pier at the berthing site and effectively simulates its mechanical behavior during berthing collisions. Consequently, this model provides a dependable computational platform for investigating ship berthing processes and ensures simulation reliability.

3.3. The Acquisition of the “Input-Output” Dataset

By utilizing the finite element model established in the preceding chapter, a series of ship berthing simulations were conducted to compensate for the absence of field data, thereby acquiring the “Input-Output” dataset essential for the surrogate model. Considering the diverse working conditions at the dock, this study defined a range of ship masses from 2000 to 20,000 tons. The berthing velocities varied between 0.1 and 0.8 m per second, while the angles of berthing ranged from 0 to 15 degrees. Simultaneously, the elastic modulus for the rubber fenders was maintained within a range of 3 to 8 MPa. These crucial input–output parameters are presented in Table 4. Employing a finite element model, this research conducted simulation analyses for a total of sixty berthing scenarios, encompassing various combinations of the four key input parameters mentioned above. These simulations covered an extensive array of random permutations of the input parameters and, thus, provided substantial data support for subsequent research endeavors.

3.4. Comparative Analysis of Surrogate Models

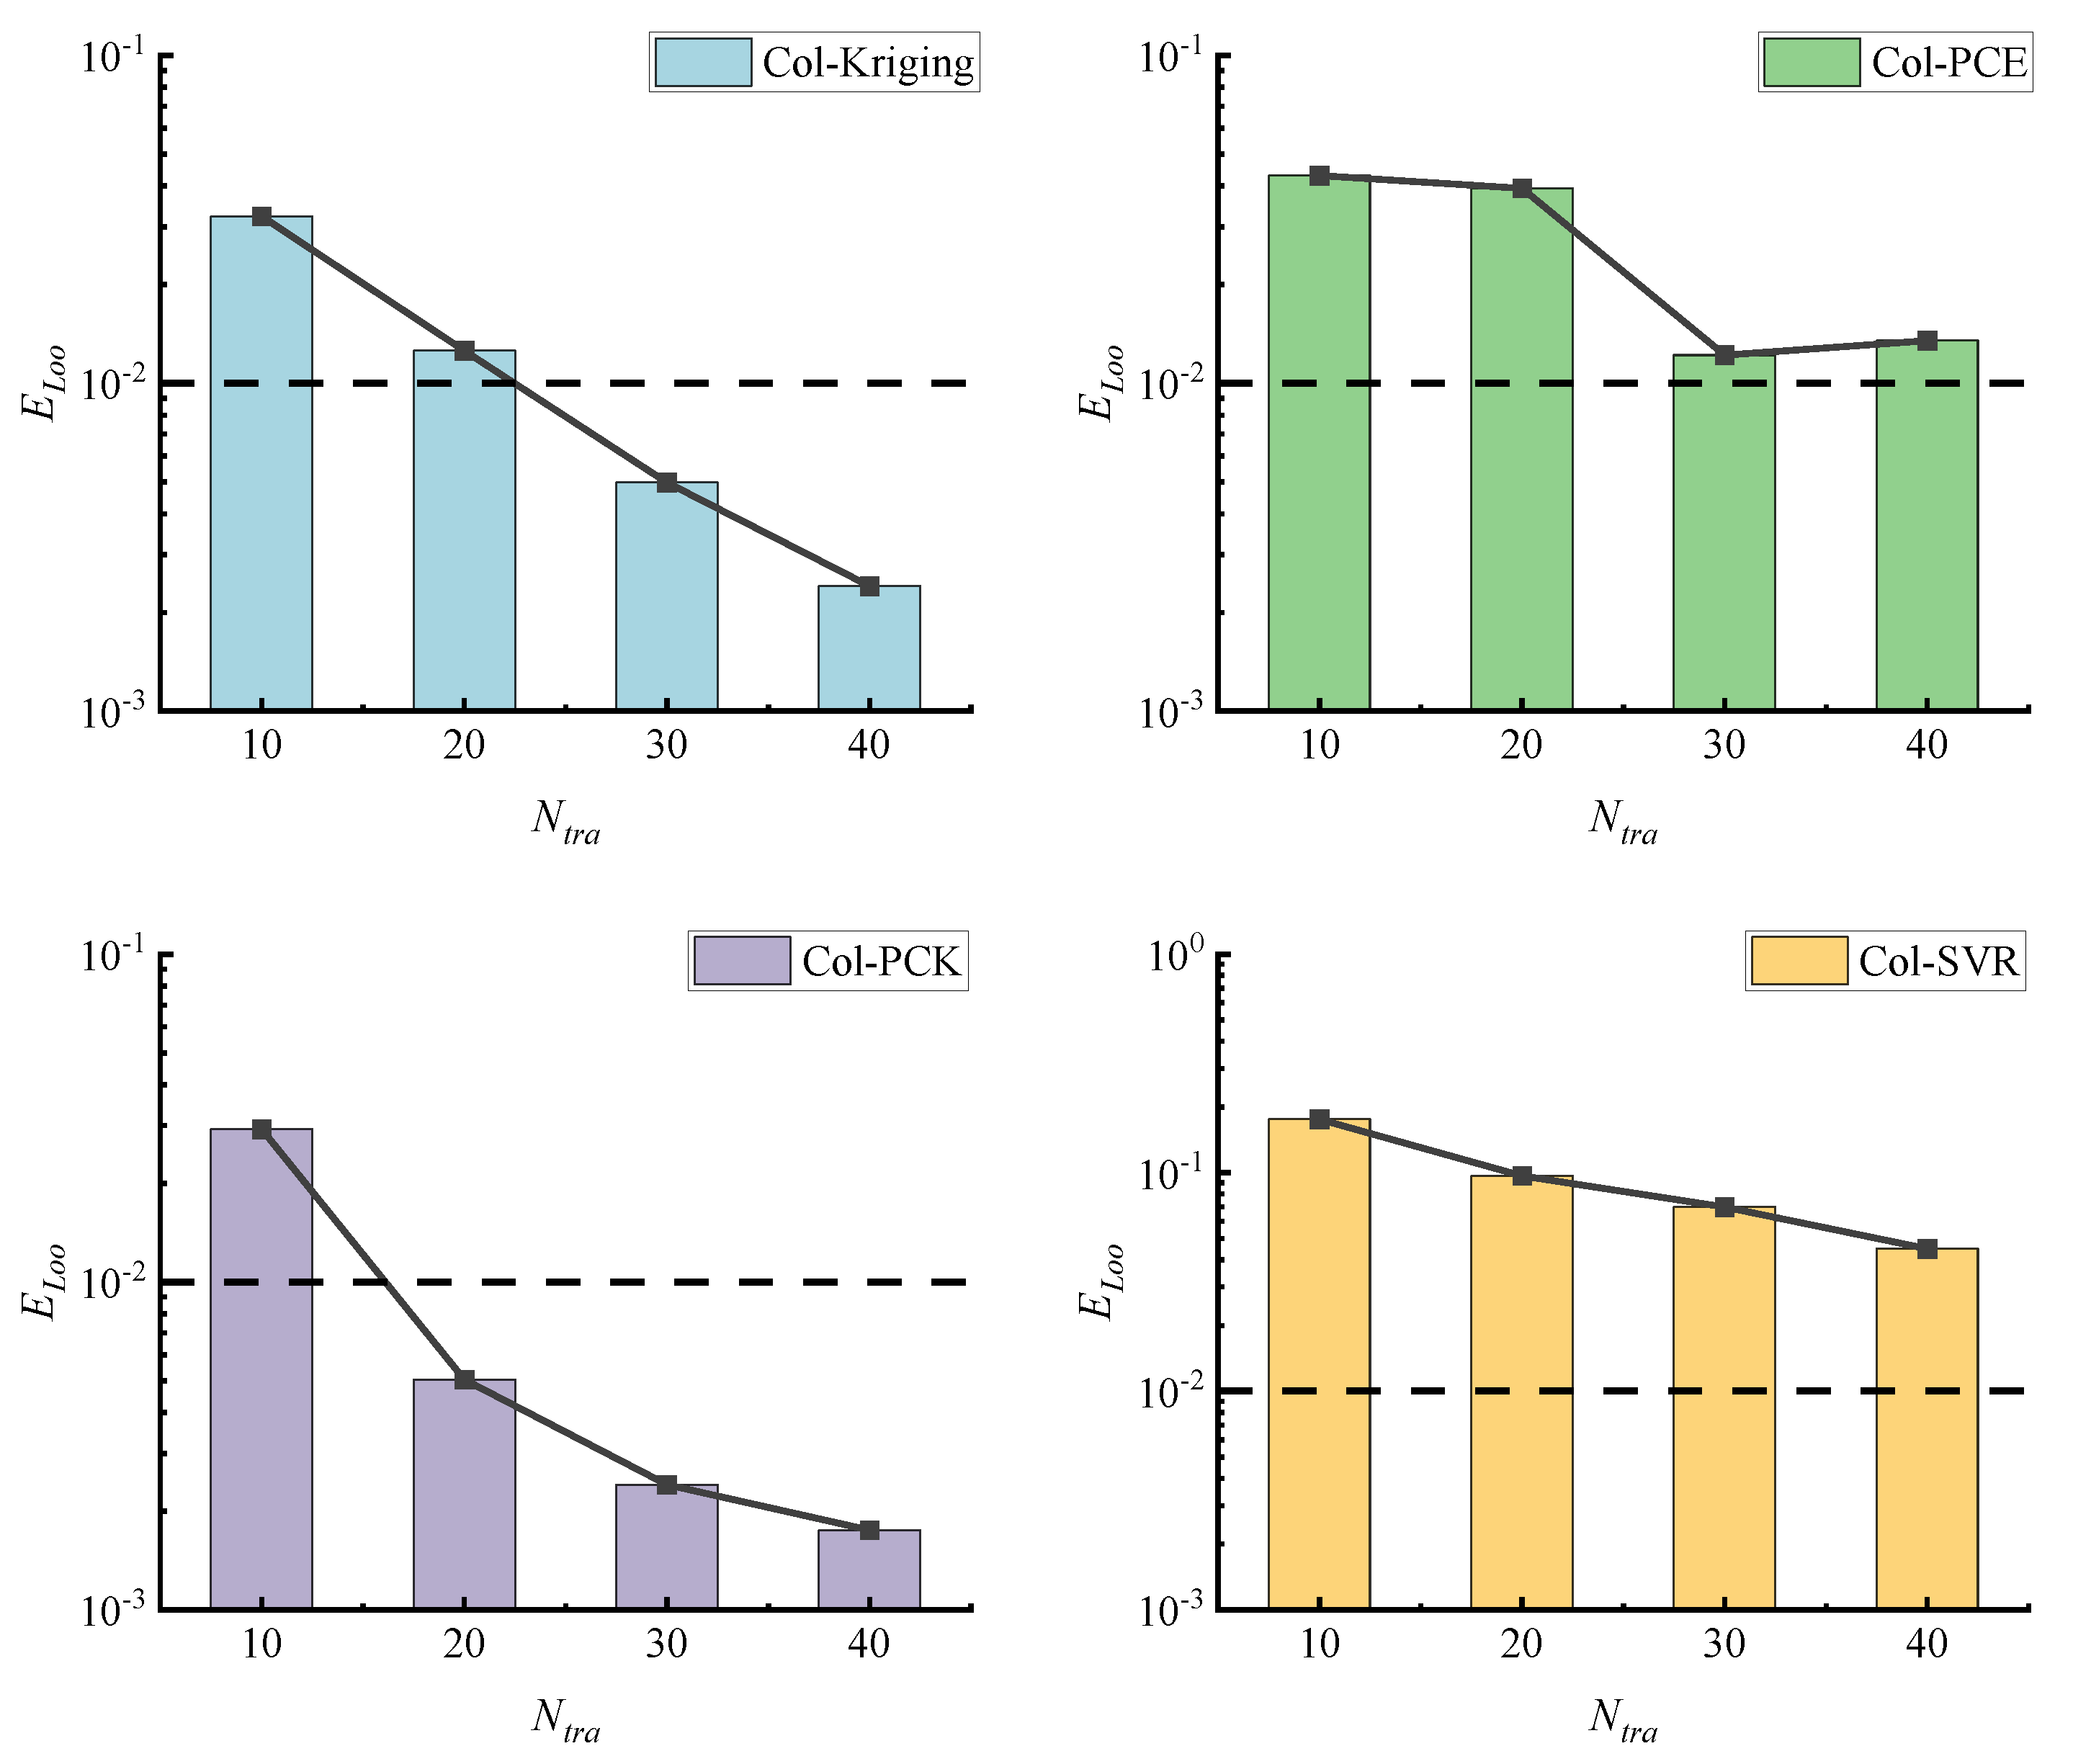
In principle, augmenting the surrogate model with additional random samples from the training set can enhance its accuracy. However, excessively increasing the number of sampled data points is not an optimal strategy in terms of computational cost-efficiency. The surrogate model can be considered sufficiently accurate to replace the original computational model when its error reaches 10−3 [44]. When constructing surrogate models, it is crucial to achieve an optimal balance between accuracy and computational cost. In this study, four surrogate models were constructed and trained using training sets of varying sizes N t r a (i.e., 10, 20, 30, 40), all under the same validation set N v a l = 20 . The accuracy discrepancies among the different surrogate models were discussed in order to explore the best-case scenario that minimized computational effort while maximizing precision. The detailed changes in the collision force output parameters E ν a l and E L o o changed in detail, as shown in Figure 6 and Figure 7, which indicated the following:
(1)
The four surrogate models for E v a l exhibited a significant reduction in error as N t r a increased. For N t r a 20 , both the Col-PCK and Col-SVR models demonstrated a substantial decrease in errors with increasing N t r a , while, for N t r a > 20 , the errors of these two models remained relatively stable. Similarly, Col-PCE followed a similar trend around N t r a = 30 . On the other hand, the error of Col-Kriging displayed considerable fluctuations.
(2)
In terms of the E L o o metric, as N t r a increased, all four surrogate models demonstrated a reduction in error, albeit at varying rates. Comparatively speaking, both the Col-Kriging and Col-PCK models manifested a more rapid decrease in the E L o o metric with increasing N t r a .
(3)
The Col-PCK model consistently exhibited a high prediction accuracy across different N t r a values. Even for N t r a 20 , the evaluation error remained within the range of 10−2 to 10−3. When N t r a = 20 , both the evaluation indexes of the Col-PCK model reached an acceptable level (at the 10−3 level). However, one of the evaluation indexes for Col-Kriging, Col-PCE, and Col-SVR failed to meet the standard, with an error exceeding 10−2.
Considering both computational cost and prediction accuracy, the Col-PCK model demonstrated optimal performance in predicting berthing collision forces within the current dataset. The Col-PCK model was preferentially selected under conditions of N t r a = 20 and N v a l = 20 to constitute the core of the CBCF (PCK-CBCF). The predictive performance of PCK-CBCF was compared with the actual results obtained from finite element analysis (FEM). As depicted in Figure 8, the alignment between the distribution of PCK-CBCF predictions and FEM outcomes along the line of symmetry further validated the exceptional precision exhibited by the Col-PCK model.
The selected optimal surrogate model now has the capability to effectively replace the finite element model for berthing collision force calculations. By inputting various parameter combinations, the rapid acquisition of collision force output results is facilitated. In comparison, performing finite element simulation under identical conditions on a computer equipped with an Intel Core i7-11800H CPU requires 35 min, whereas utilizing PCK-CBCF necessitates only a total of 2.8 s, including training time for the training set. Consequently, this approach achieves a significant reduction in computational resources and time costs.

3.5. Framework Verification through Physical Model Testing

The practical applicability of PCK-CBCF was validated through the utilization of physical model test data conducted in a large harbor tank. While suitable simplifications were made to replicate dock structures, such as the length of piles, the ability of the physical model to accurately reproduce the actual conditions of rubber fenders at key impact force collection areas ensured an ideal validation environment for the PCK-CBCF model specifically designed for this particular dock in the Jiangsu province. The specific model settings can be found in Zhai [45], and Figure 9 depicts the simulated berthing test site. A calibrated fender sensor was utilized to replicate the rubber fender with an elastic modulus of 3.5 MPa, and the vessel was docked in a parallel orientation, providing precise impact force data and corresponding comparative outcomes, as presented in Table 5.
The results demonstrated that the error between the collision force calculated by the PCK-CBCF model and the experimental data was below 6.9% across the various berthing conditions, thereby effectively validating the reliability and high accuracy of the proposed calculation method in practical applications.

3.6. Sensitivity Analysis

Global sensitivity analysis (GSA) is an exceptional scientific methodology that not only elucidates the potential impact of parameter variations on research outcomes but also enables researchers to gain a more precise understanding of model robustness and predictive capabilities. The Sobol method is widely favored within the research community due to its provision of high-precision information [46]. However, the calculation of the Sobol index often relies on Monte Carlo simulations with large amounts of data, which creates a bottleneck for finite element models with extensive calculations. Fortunately, leveraging the fast computation characteristics of surrogate models enables the efficient evaluation of the Sobol index without incurring significant computational costs [47]. In this study, its functionality is expressed as follows:
F = f ( X ) = f t , v , E , θ = f 0 + i = 1 4 f 1 t + 1 i < j 4 f i j t , v + + f 1 , 2 , 3 , 4 t , v , E , θ
The PCK-CBCF method proposed in this study offers a practical and efficient approach for conducting sensitivity analysis on the influential factors of berthing collision force, without imposing any additional burden. By employing PCK-CBCF, a comprehensive sensitivity analysis is conducted in this paper to investigate the four key variables that affect the berthing collision force: ship tonnage, berthing speed, berthing angle, and elastic modulus of the rubber fender. The results are presented in Figure 10.
The first-order Sobol index quantifies the direct impact of an individual input variable on the model output, disregarding its interactions with other input variables. In contrast, the full-order Sobol index considers all the potential interactions among the input variables, revealing their collective influence on the output results. From the analysis of the results, it is evident that the berthing speed exhibits the highest Sobol index, indicating its significant impact on the berthing collision force and emphasizing the importance of considering its interaction effects with other parameters. Conversely, other input variables such as the berthing angle have a minimal influence on the collision force. Furthermore, a disparity between the first-order and full-order Sobol indexes for ship tonnage suggests that interactions involving ship tonnage and other variables may exert some influence on the collision force.
Due to the significant influence of the speed at which a vessel docks on the force of collision, especially in the case of larger ships, it is essential to enforce strict regulations on their velocity during berthing in order to reduce the risk of causing damage to dock structures. Although the impact of the berthing angle is relatively minor, excessive berthing angles can result in significant ship rolling and compromise the stability of the berthing process. Therefore, it is imperative to minimize the berthing angle during operations to ensure a stable and secure ship berth.

3.7. Comparison with Existing Methodologies

In accordance with the computational methodology suggested in this research for estimating collision force during ship berthing using surrogate modeling, advanced machine learning methods like neural networks have been utilized to supplant conventional finite element analysis for the prediction of ship–bridge collision forces, enabling rapid and efficient calculations. For instance, Fan [20] demonstrated the applicability of RBFNN in ship–bridge collision force prediction by leveraging its nonlinear mapping capabilities and training/validation using finite element model data. Similarly, Xu [17] utilized a BPNN model along with FFT and IFFT methods to predict ship–bridge collision forces in both time and frequency domains. In this section, the performance of the proposed PCK-CBCF model will be compared with that of the existing RBFNN and BPNN models in terms of predicting the collision force between ships and wharves. To accomplish this, 220 datasets representing random working conditions have been generated by combining finite element analysis and the Monte Carlo sampling method. Model training and performance evaluation will now be conducted based on these datasets.
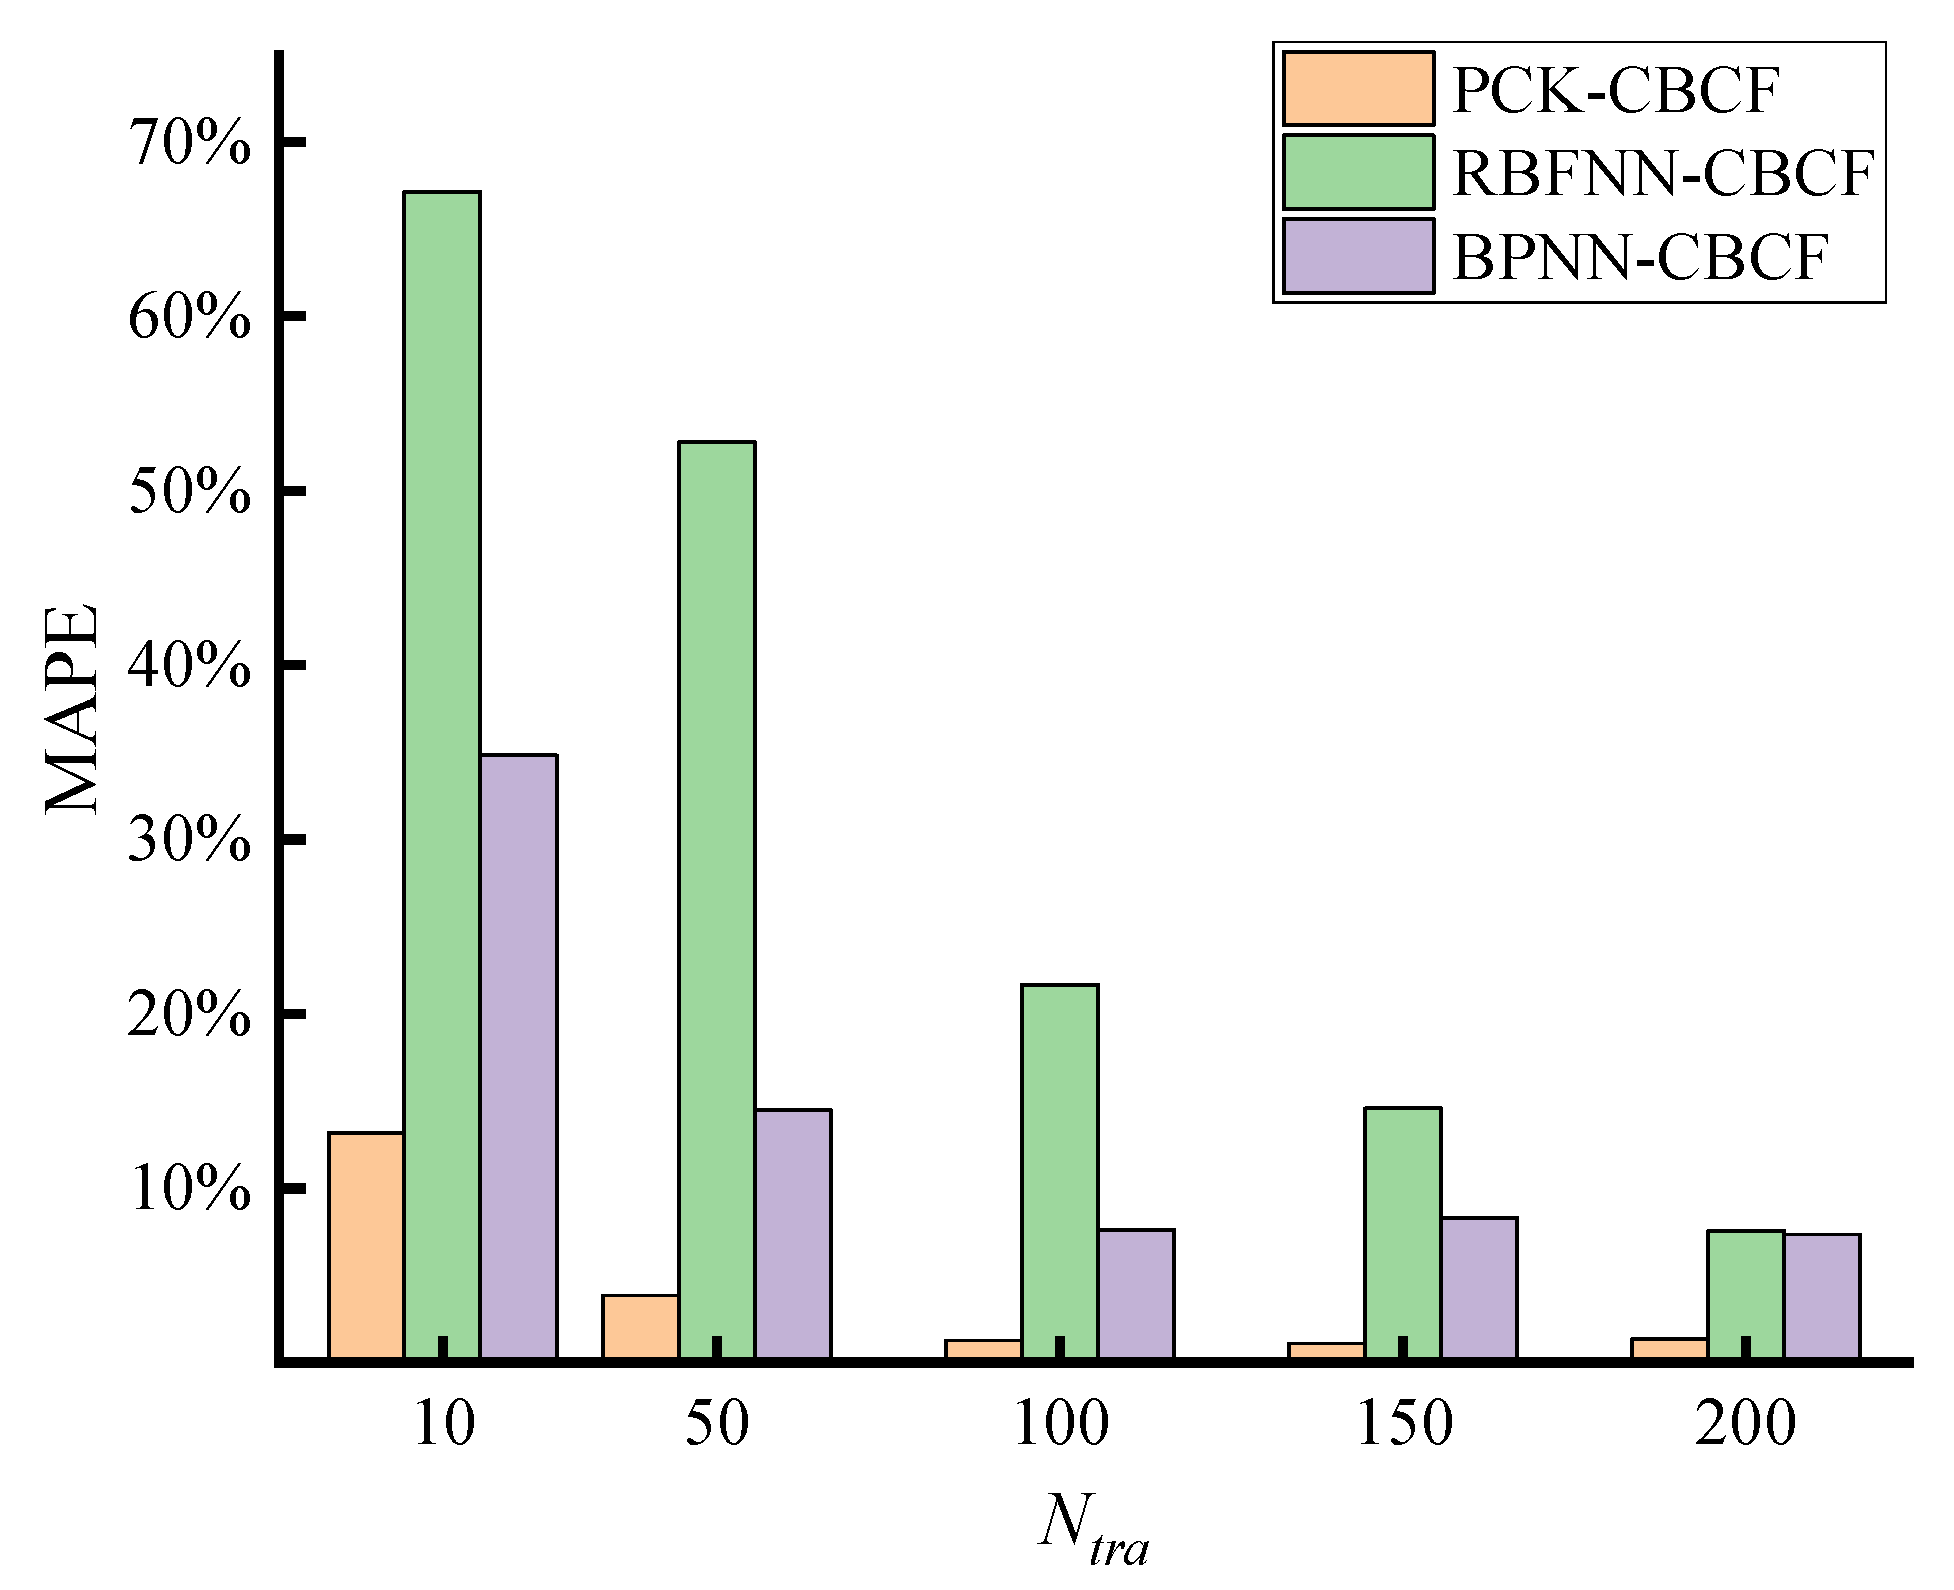
The accuracy of three models in predicting berthing collision force under different training sets ( N v a l = 20 ) is clearly demonstrated in Figure 11. The prediction accuracy of the model is quantified by the mean absolute percentage error (MAPE), which is calculated as follows:
MAPE = 100 M m = 1 M | y m y ˜ m | y m
where y m represents the FEM-calculated value, y ˜ m represents the model-predicted value, and M is the number of predicted working conditions.
The figure demonstrates that the prediction accuracy of the three models increases as the number of training sets N t r a increases. Notably, when the training samples are limited ( N t r a = 10 ), PCK-CBCF outperforms the other two models in terms of prediction accuracy. Conversely, the BPNN-CBCF and RBFNN-CBCF models require larger training sets ( N t r a = 100 and N t r a = 200 ) to achieve better prediction results. This comparison emphasizes the adaptability of the PCK-CBCF model to small-scale training sets, particularly when data constraints exist, as it maintains both efficiency and accuracy.
The three models have been selected to predict the collision force under specific berthing conditions, with N t r a = 200 and N v a l = 20 . The predicted results are presented in Table 6. The berthing conditions are arranged in the following order: ship tonnage, berthing speed, elastic modulus, and berthing angle ( t , v , E , θ ) . From the data in the table, it is evident that, when trained on the same dataset, the PCK-CBCF model proposed in this study not only exhibits a superior prediction accuracy but also demonstrates a higher computational efficiency for calculating impact forces under random conditions.

4. Conclusions

Considering the complications and low accuracy plaguing current approaches to collision force calculation during ship berthing in wharves, this study presents a novel calculation framework aimed at accurately and quickly predicting the collision force during ship berthing. Furthermore, it extensively examines the suitability, effectiveness, and sample prerequisites of various surrogate models in these analyses and identifies the most appropriate model for substituting conventional finite element techniques in expedited computations. The practicality of this framework is verified through physical model tests, while a sensitivity analysis is conducted to examine the various factors influencing the collision force. Comparison with two existing models further confirms the advantages of this approach. The following conclusions can be drawn:
  • The surrogate model based on the “Input-Output” dataset demonstrates effective substitution for the finite element model, enabling the rapid prediction of the berthing collision force. Notably, among these models, the Col-PCK model exhibits superior performance in predicting the berthing collision force.
  • The sensitivity analysis conducted using the CBCF framework proposed in this study reveals that berthing speed is the most influential factor, followed by ship tonnage. This suggests that a greater emphasis should be placed on controlling berthing speed during ship berthing processes.
  • The PCK-CBCF model demonstrates significant advantages over existing berthing collision force prediction methods in terms of reducing sample requirements, enhancing prediction accuracy, and improving computational efficiency when applied to a case study of a wharf in the Jiangsu province. This finding underscores the extensive potential of the proposed framework for future applications and its role in promoting safe wharf operations.
However, it is worth noting that current research primarily relies on validated finite element simulations rather than the direct utilization of field-measured data to enhance the frame structure. With the future acquisition and accumulation of field data on wharf impact, it is anticipated that further optimization in both the structure and performance of the CBCF frame will enable a better adaptation to collision force estimation and risk analysis for diverse wharves.

Author Contributions

Conceptualization, H.Z.; Methodology, H.Z.; Software, H.Z.; Formal analysis, J.Z.; Investigation, J.Z.; Resources, R.Z.; Writing—original draft, H.Z.; Writing—review & editing, R.Z. and Q.W.; Supervision, Q.W.; Funding acquisition, R.Z. and Q.W. All authors have read and agreed to the published version of the manuscript.

Funding

This research was funded by the National Key Research and Development Program of China: No:2022YFB3207400; National Natural Science Foundation of China: No. 51709093; the Research Funds for the Central Universities: TKS20220601, and Huaneng Group Technology Project: HNKJ23-H18.

Institutional Review Board Statement

Not applicable.

Informed Consent Statement

Not applicable.

Data Availability Statement

Data is contained within the article.

Conflicts of Interest

The authors declare no conflict of interest.

References

  1. Hu, Y.; Zhu, D. Empirical analysis of the worldwide maritime transportation network. Phys. A 2009, 388, 2061–2071. [Google Scholar] [CrossRef]
  2. Xing, H.; Stuart, C.; Spence, S.; Chen, H. Alternative fuel options for low carbon maritime transportation: Pathways to 2050. J. Clean. Prod. 2021, 297, 126651. [Google Scholar] [CrossRef]
  3. Darbra, R.-M.; Casal, J. Historical analysis of accidents in seaports. Saf. Sci. 2004, 42, 85–98. [Google Scholar] [CrossRef]
  4. AASHTO. Guide Specifications and Commentary for Vessel Collision Design of Highway Bridges; American Association of State Highway and Transportation Official: Washington, DC, USA, 2007. [Google Scholar]
  5. Vrouwenvelder, A.M. Design for Ship Impact According to Eurocode 1, Part 2.7; Routledge: London, UK, 2017; pp. 123–133. [Google Scholar]
  6. TB 10002.1-2005; Code for Design on Railway Bridge and Culvert. China Railway Administration: Beijing, China, 2017.
  7. Minorsky, V. An analysis of ship collision with reference to protection of nuclear power ships. J. Ship Res. 1959, 3, 208–214. [Google Scholar]
  8. Zhou, X.; Gao, Y.; Huang, F.; Zhang, G. A study on the collision force of reinforced concrete piers under cumulative ship collision. Adv. Mech. Eng. 2019, 11, 1687814019835071. [Google Scholar] [CrossRef]
  9. Song, Y.; Wang, J. Development of the impact force time-history for determining the responses of bridges subjected to ship collisions. Ocean Eng. 2019, 187, 106182. [Google Scholar] [CrossRef]
  10. Consolazio, G.R.; Davidson, M.T.; Cowan, D.R. Barge Bow Force–Deformation Relationships for Barge–Bridge Collision Analysis. Transp. Res. Rec. J. Transp. Res. Board 2009, 2131, 3–14. [Google Scholar] [CrossRef]
  11. Sha, Y.; Hao, H. Laboratory tests and numerical simulations of barge impact on circular reinforced concrete piers. Eng. Struct. 2013, 46, 593–605. [Google Scholar] [CrossRef]
  12. Shen, M.-Y.; Wu, C.-C.; Chiou, Y.-C. Enhance energy absorption of hollow-cylinder rubber fender using V-notch ring grooves. Ocean Eng. 2022, 255, 111442. [Google Scholar] [CrossRef]
  13. Treleborg Marine Systems. “Fender Application Design Manual.” Catalogue Ref. No. MN-ADM-V2.1-EN. 2016. Available online: http://pdf.nauticexpo.com/pdf/trelleborg-marine-systems/fender-application-design-manual/22887-97443.html (accessed on 24 October 2018).
  14. JTS 144-1-2010; Load Code for Harbour Engineering. Ministry of Transport of China: Beijing, China, 2010.
  15. Carbonari, S.; Antolloni, G.; Gara, F.; Lorenzoni, C.; Mancinelli, A. A performance-based approach for the design of coupled dolphin-fender berthing structures. Mar. Struct. 2019, 64, 78–91. [Google Scholar] [CrossRef]
  16. PIANC. Guidelines for the Design Ofender Systems; PIANC: Brussels, Belgium, 2002. [Google Scholar]
  17. Xu, G.; Cao, Z.; Wang, J.; Xue, S.; Tang, M. A novel machine learning-based framework for predicting impact force in ship-bridge pier collisions. Ocean Eng. 2023, 285, 115347. [Google Scholar] [CrossRef]
  18. Liu, B.; Guedes Soares, C. Recent developments in ship collision analysis and challenges to an accidental limit state design method. Ocean Eng. 2023, 270, 113636. [Google Scholar] [CrossRef]
  19. Henneron, T.; Pierquin, A.; Clenet, S. Surrogate Model Based on the POD Combined with the RBF Interpolation of Nonlinear Magnetostatic FE Model. IEEE Trans. Magn. 2020, 56, 7501504. [Google Scholar] [CrossRef]
  20. Fan, W.; Yuan, W.-c.; Fan, Q.-w. Calculation method of ship collision force on bridge using artificial neural network. J. Zhejiang Univ.-Sci. A 2008, 9, 614–623. [Google Scholar] [CrossRef]
  21. Qin, Y.; Su, C.; Chu, D.; Zhang, J.; Song, J. A Review of Application of Machine Learning in Storm Surge Problems. J. Mar. Sci. Eng. 2023, 11, 1729. [Google Scholar] [CrossRef]
  22. Kameshwar, S.; Padgett, J.E. Response and fragility assessment of bridge columns subjected to barge-bridge collision and scour. Eng. Struct. 2018, 168, 308–319. [Google Scholar] [CrossRef]
  23. Shen, M.Y.; Chiou, Y.C.; Tan, C.M.; Wu, C.C.; Chen, W.J. Effect of Wall Thickness on Stress-Strain Response and Buckling Behavior of Hollow-Cylinder Rubber Fenders. Materials 2020, 13, 1170. [Google Scholar] [CrossRef] [PubMed]
  24. Wu, C.C.; Chiou, Y.C. Stress-Strain Response of Cylindrical Rubber Fender under Monotonic and Cyclic Compression. Materials 2019, 12, 282. [Google Scholar] [CrossRef] [PubMed]
  25. Order, J.K. Kriging, Entry, in Encyclopedia of Statistical Sciences; Kotz, S., Johnson, N., Eds.; Wiley: New York, NY, USA, 1983; Volume 4, pp. 411–413. [Google Scholar]
  26. Zhou, Y.; Lu, Z.; Yun, W. Active sparse polynomial chaos expansion for system reliability analysis. Reliab. Eng. Syst. Saf. 2020, 202, 107025. [Google Scholar] [CrossRef]
  27. Zhao, H.; Gao, Z.; Xu, F.; Xia, L. Adaptive multi-fidelity sparse polynomial chaos-Kriging metamodeling for global approximation of aerodynamic data. Struct. Multidiscip. Optim. 2021, 64, 829–858. [Google Scholar] [CrossRef]
  28. Cortes, C.; Vapnik, V. Support-vector networks. Mach. Learn. 1995, 20, 273–297. [Google Scholar] [CrossRef]
  29. Bai, Y.; Peng, Z.; Wang, Z. A finite element model updating method based on the trust region and adaptive surrogate model. J. Sound Vib. 2023, 555, 117701. [Google Scholar] [CrossRef]
  30. Luo, J.; Ma, X.; Ji, Y.; Li, X.; Song, Z.; Lu, W. Review of machine learning-based surrogate models of groundwater contaminant modeling. Environ. Res. 2023, 238, 117268. [Google Scholar] [CrossRef]
  31. Yang, S.; Meng, D.; Wang, H.; Yang, C. A novel learning function for adaptive surrogate-model-based reliability evaluation. Philos. Trans. R. Soc. A 2024, 382, 20220395. [Google Scholar] [CrossRef] [PubMed]
  32. Shao, Z.; Er, M.J. Efficient Leave-One-Out Cross-Validation-based Regularized Extreme Learning Machine. Neurocomputing 2016, 194, 260–270. [Google Scholar] [CrossRef]
  33. Hu, J.; Zhang, L.; Lin, Q.; Cheng, M.; Zhou, Q.; Liu, H. A conservative multi-fidelity surrogate model-based robust optimization method for simulation-based optimization. Struct. Multidiscip. Optim. 2021, 64, 2525–2551. [Google Scholar] [CrossRef]
  34. Tahkola, M.; Keranen, J.; Sedov, D.; Far, M.F.; Kortelainen, J. Surrogate Modeling of Electrical Machine Torque Using Artificial Neural Networks. IEEE Access 2020, 8, 220027–220045. [Google Scholar] [CrossRef]
  35. Kim, B.; Lee, S.B.; Lee, J.; Cho, S.; Park, H.; Yeom, S.; Park, S.H. A comparison among Neo-Hookean model, Mooney-Rivlin model, and Ogden model for chloroprene rubber. Int. J. Precis. Eng. Manuf. 2012, 13, 759–764. [Google Scholar] [CrossRef]
  36. Peng, X.; Han, L.; Li, L. A consistently compressibleMooney-Rivlinmodel for the vulcanized rubber based on the Penn’s experimental data. Polym. Eng. Sci. 2021, 61, 2287–2294. [Google Scholar] [CrossRef]
  37. Yu, Y.S.; Zhao, Y.P. Deformation of PDMS membrane and microcantilever by a water droplet: Comparison between Mooney-Rivlin and linear elastic constitutive models. J. Colloid Interf. Sci. 2009, 332, 467–476. [Google Scholar] [CrossRef]
  38. Burkhart, T.A.; Andrews, D.M.; Dunning, C.E. Finite element modeling mesh quality, energy balance and validation methods: A review with recommendations associated with the modeling of bone tissue. J. Biomech. 2013, 46, 1477–1488. [Google Scholar] [CrossRef] [PubMed]
  39. Cangiani, A.; Manzini, G.; Russo, A.; Sukumar, N. Hourglass stabilization and the virtual element method. Int. J. Numer. Methods Eng. 2015, 102, 404–436. [Google Scholar] [CrossRef]
  40. Cheng, Z.Q.; Thacker, J.G.; Pilkey, W.D.; Hollowell, W.T.; Reagan, S.W.; Sieveka, E.M. Experiences in reverse-engineering of a finite element automobile crash model. Finite Elem. Anal. Des. 2001, 37, 843–860. [Google Scholar] [CrossRef]
  41. Li, W.; Liu, T.; Wang, J.; Zou, D.; Gao, S. Finite-Element Analysis of an Electromechanical Impedance–Based Corrosion Sensor with Experimental Verification. J. Aerosp. Eng. 2019, 32, 04019012. [Google Scholar] [CrossRef]
  42. Scigliano, R.; Scionti, M.; Lardeur, P. Verification, validation and variability for the vibration study of a car windscreen modeled by finite elements. Finite Elem. Anal. Des. 2011, 47, 17–29. [Google Scholar] [CrossRef]
  43. Chang, M.; Pakzad, S.N. Modified natural excitation technique for stochastic modal identification. J. Struct. Eng. 2013, 139, 1753–1762. [Google Scholar] [CrossRef]
  44. Li, Y.; Hariri-Ardebili, M.A.; Deng, T.; Wei, Q.; Cao, M. A surrogate-assisted stochastic optimization inversion algorithm: Parameter identification of dams. Adv. Eng. Inform. 2023, 55, 101853. [Google Scholar] [CrossRef]
  45. Zhai, Q.; Yan, S.; Wang, H.; Zhang, Y. Experimental study on ship’s mooring force of arched longitudinal beam wharf. In Proceedings of the 2021 7th International Conference on Hydraulic and Civil Engineering & Smart Water Conservancy and Intelligent Disaster Reduction Forum (ICHCE & SWIDR), Nanjing, China, 6–8 November 2021; pp. 1379–1386. [Google Scholar]
  46. Ballester-Ripoll, R.; Paredes, E.G.; Pajarola, R. Sobol tensor trains for global sensitivity analysis. Reliab. Eng. Syst. Saf. 2019, 183, 311–322. [Google Scholar] [CrossRef]
  47. Sudret, B. Global sensitivity analysis using polynomial chaos expansions. Reliab. Eng. Syst. Saf. 2008, 93, 964–979. [Google Scholar] [CrossRef]
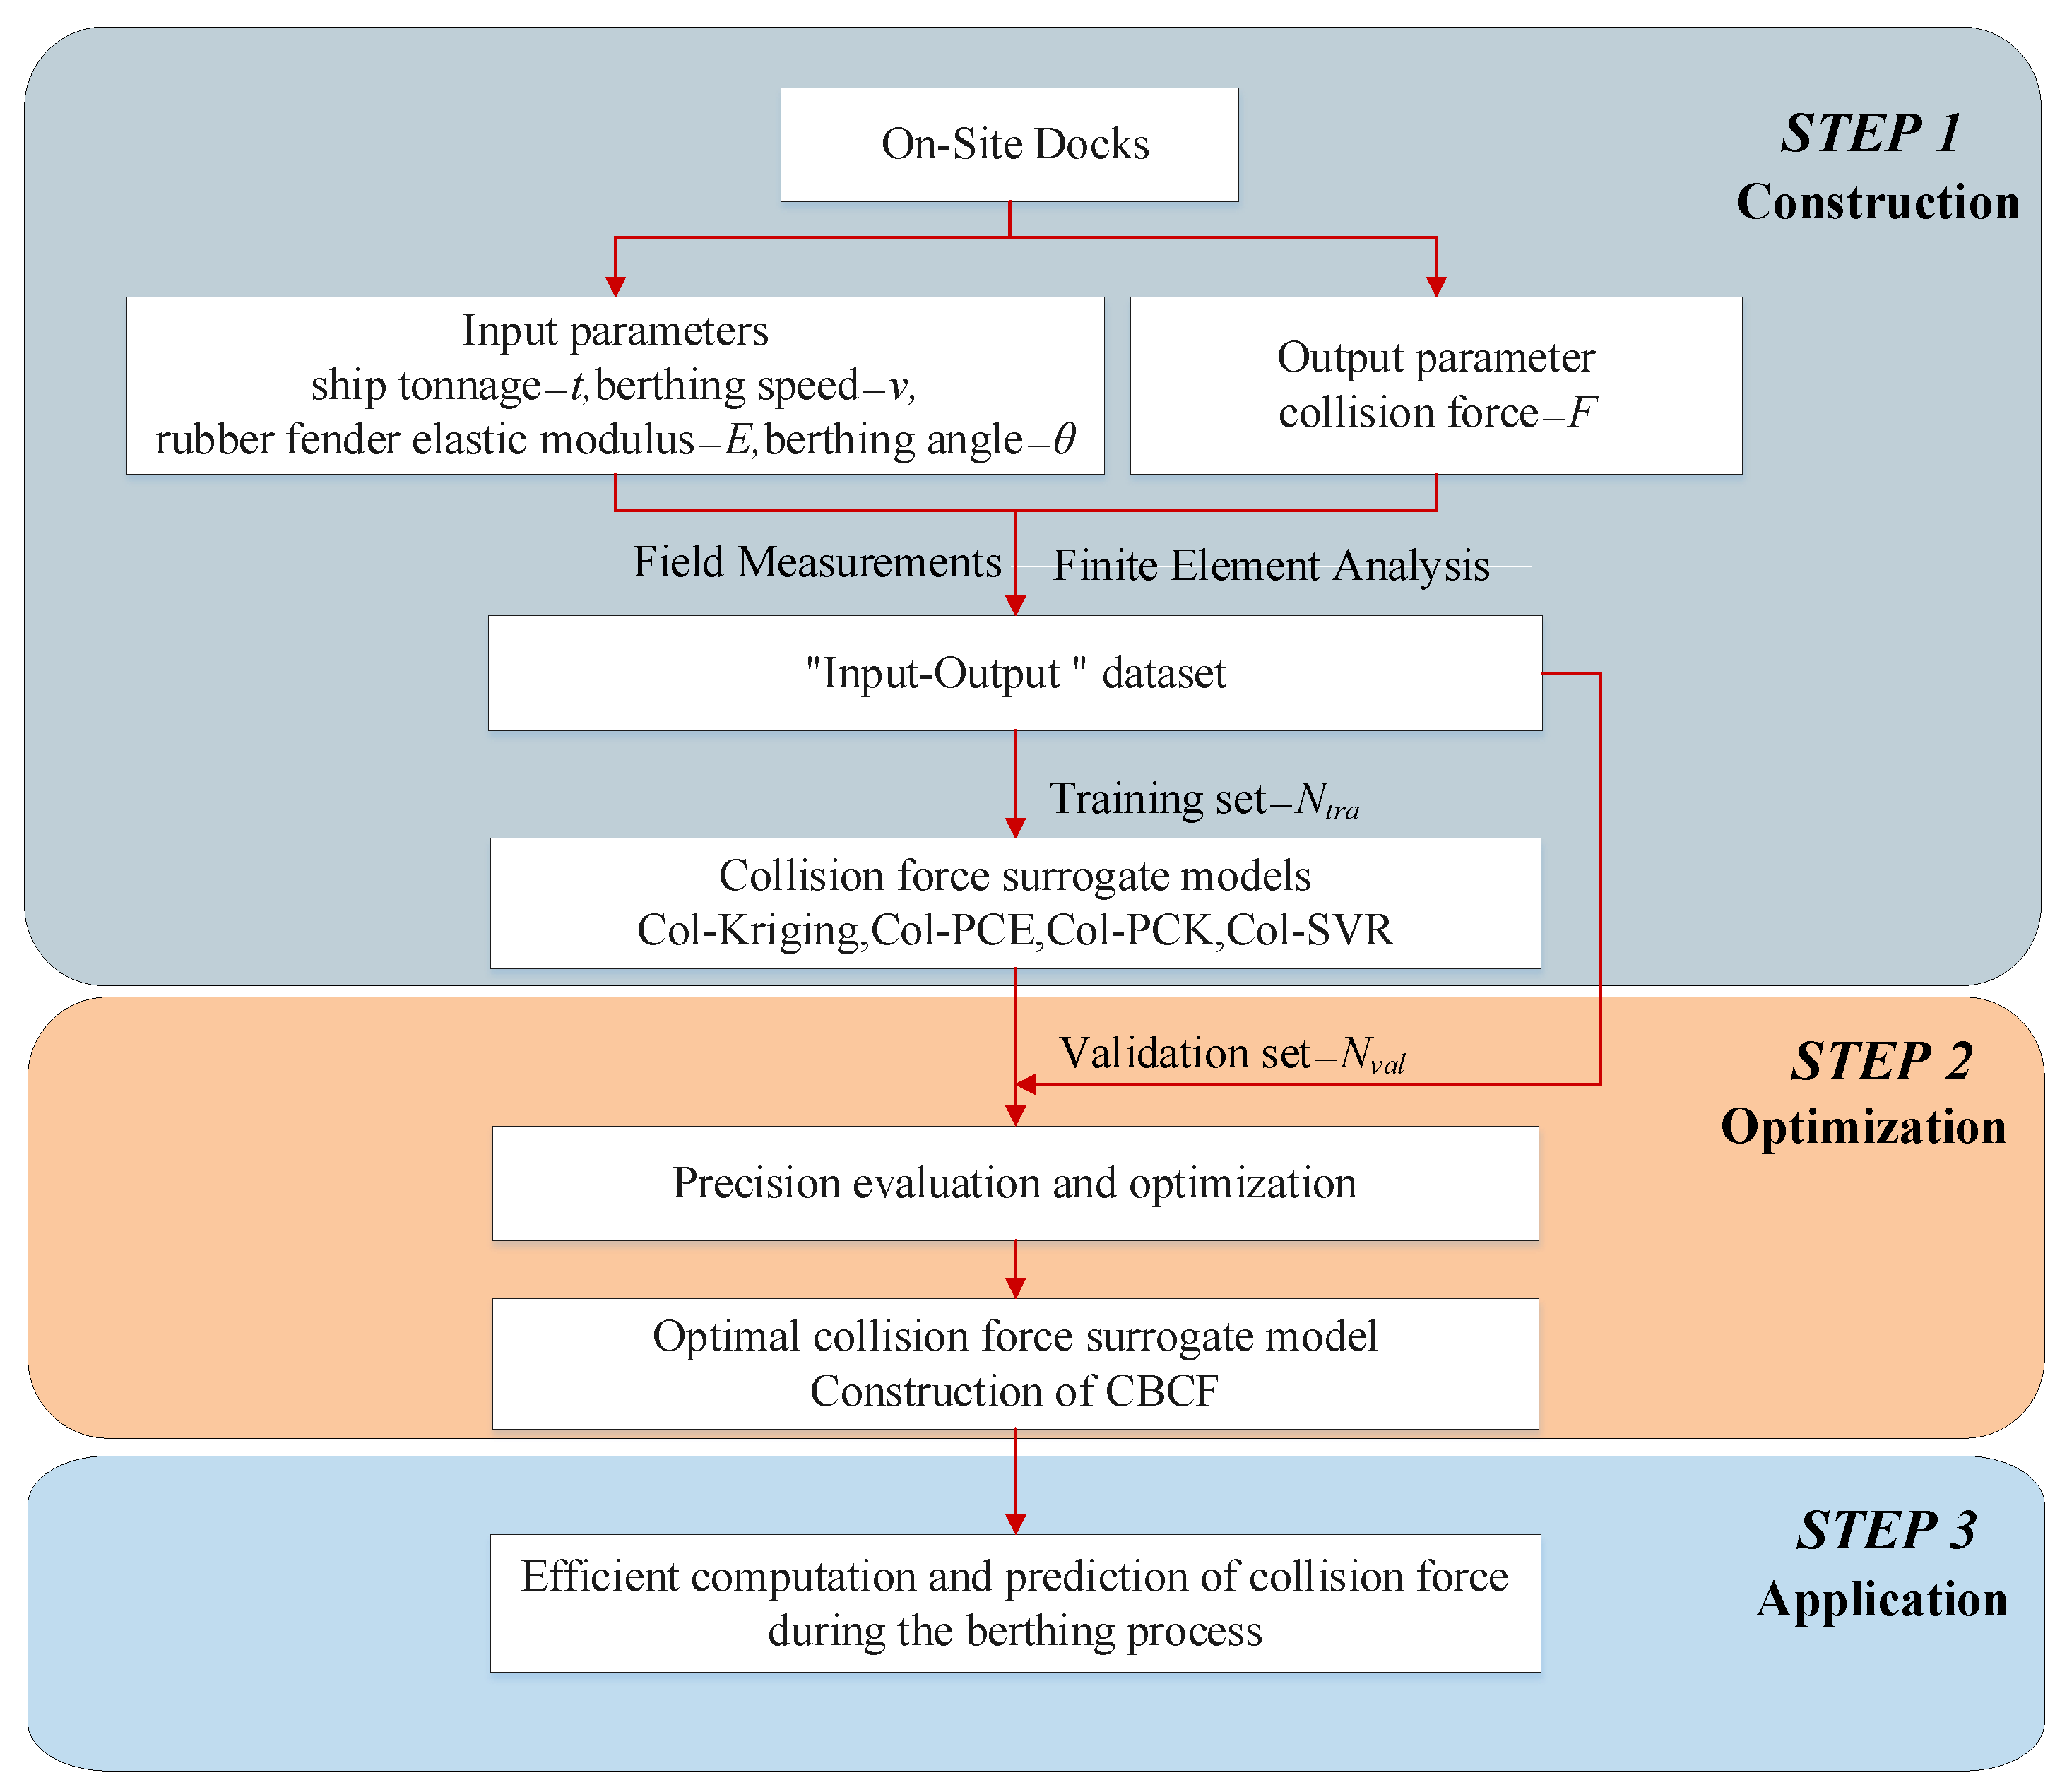
Figure 1. Flowchart of the CBCF framework.
Jmse 12 00898 g001
Figure 2. Finite element model for berthing analysis.
Jmse 12 00898 g002
Figure 3. Picture of the berthing scene.
Jmse 12 00898 g003
Figure 4. Comparison between FEM and measured collision force.
Jmse 12 00898 g004
Figure 5. Energy change in the berthing collision system.
Jmse 12 00898 g005
Figure 6. Different models’ E v a l variations.
Jmse 12 00898 g006
Figure 7. Different models’ E L o o variations.
Jmse 12 00898 g007
Figure 8. Comparison of PCK-CBCF prediction and FEM.
Jmse 12 00898 g008
Figure 9. Pictures of the berthing test site.
Jmse 12 00898 g009
Figure 10. Sobol index for each variable.
Jmse 12 00898 g010
Figure 11. Comparison of models’ accuracy across diverse training datasets.
Jmse 12 00898 g011
Table 1. Design ship type main dimension parameter table.
Ship Tonnage
(ton)
Overall Length × Beam × Draft
(m)
Container Capacity (TEU)
250078.2 × 15.6 × 3.5180
500098 × 18.0 × 6.5350
8000121 × 19.2 × 7.0351~710
12,000151 × 23.6 × 9.3711~1040
20,000183 × 27.6 × 10.51041~1900
Table 2. Material characteristics of the primary structures in finite element models.
PartMaterialCharacteristicParameters
Upper structuresC40Density (kg/m3)2300
Elastic modulus (MPa)3.25 × 10⁴
Poisson’s ratio0.2
PHC tubular pilesC80Density (kg/m3)2500
Elastic modulus (MPa)3.8 × 10⁴
Poisson’s ratio0.2
Ship modelSteelDensity (kg/m3)7800
Elastic modulus (MPa)2.06 × 10⁵
Poisson’s ratio0.3
FenderRubberDensity (kg/m3)1800
Poisson’s ratio0.4997
Elastic modulus (MPa)4
C 10 533,333
C 01 133,333
Table 3. Comparison of natural vibration frequencies of the wharf.
OrderFEM/HzMeasurement/HzError/%
10.6750.6810.87
21.4511.4281.67
31.7011.6711.78
Table 4. Key parameters of the finite element.
CategoryParametersSymbolNumberRangeUnits
Input parametersShip tonnage t X 1 (2000, 20,000) t
Berthing speed v X 2 (0.1, 0.8) m / s
Elastic modulus of rubber fender E X 3 (3, 8) MPa
Berthing angle θ X 4 (0, 15)°
Output parametersBerthing collision force F Y 1 - kN
Table 5. Comparison between physical model and PCK-CBCF.
Ship Tonnage
(t)
Berthing Speed (m/s)Peak Collision Force (kN)PCK-CBCF
(kN)
Error (%)
Fully loaded60000.1664.726331.7
60000.21185.0812676.9
Unloaded26000.1389.144105.4
26000.2795.658203.1
Table 6. Comparison of FEM calculation results and model prediction results.
Berthing ConditionFEMPCK-CBCFRBFNN-CBCFBPNN-CBCF
(2500, 0.3, 3.0, 0)1265129513581351
(5500, 0.25, 3.5, 5)1998203321352071
(9800, 0.2, 4.0, 0)2456251126112697
(11,000, 0.18, 4.2, 8)2341235521202514
(13,400, 0.12, 4.5, 10)1723175816011864
MAPE-1.81%7.41%7.17%
Time (ms)-128045704110
Disclaimer/Publisher’s Note: The statements, opinions and data contained in all publications are solely those of the individual author(s) and contributor(s) and not of MDPI and/or the editor(s). MDPI and/or the editor(s) disclaim responsibility for any injury to people or property resulting from any ideas, methods, instructions or products referred to in the content.