
High-Accuracy and Fast Calculation Framework for Berthing Collision Force of Docks Based on Surrogate Models
Abstract
:1. Introduction
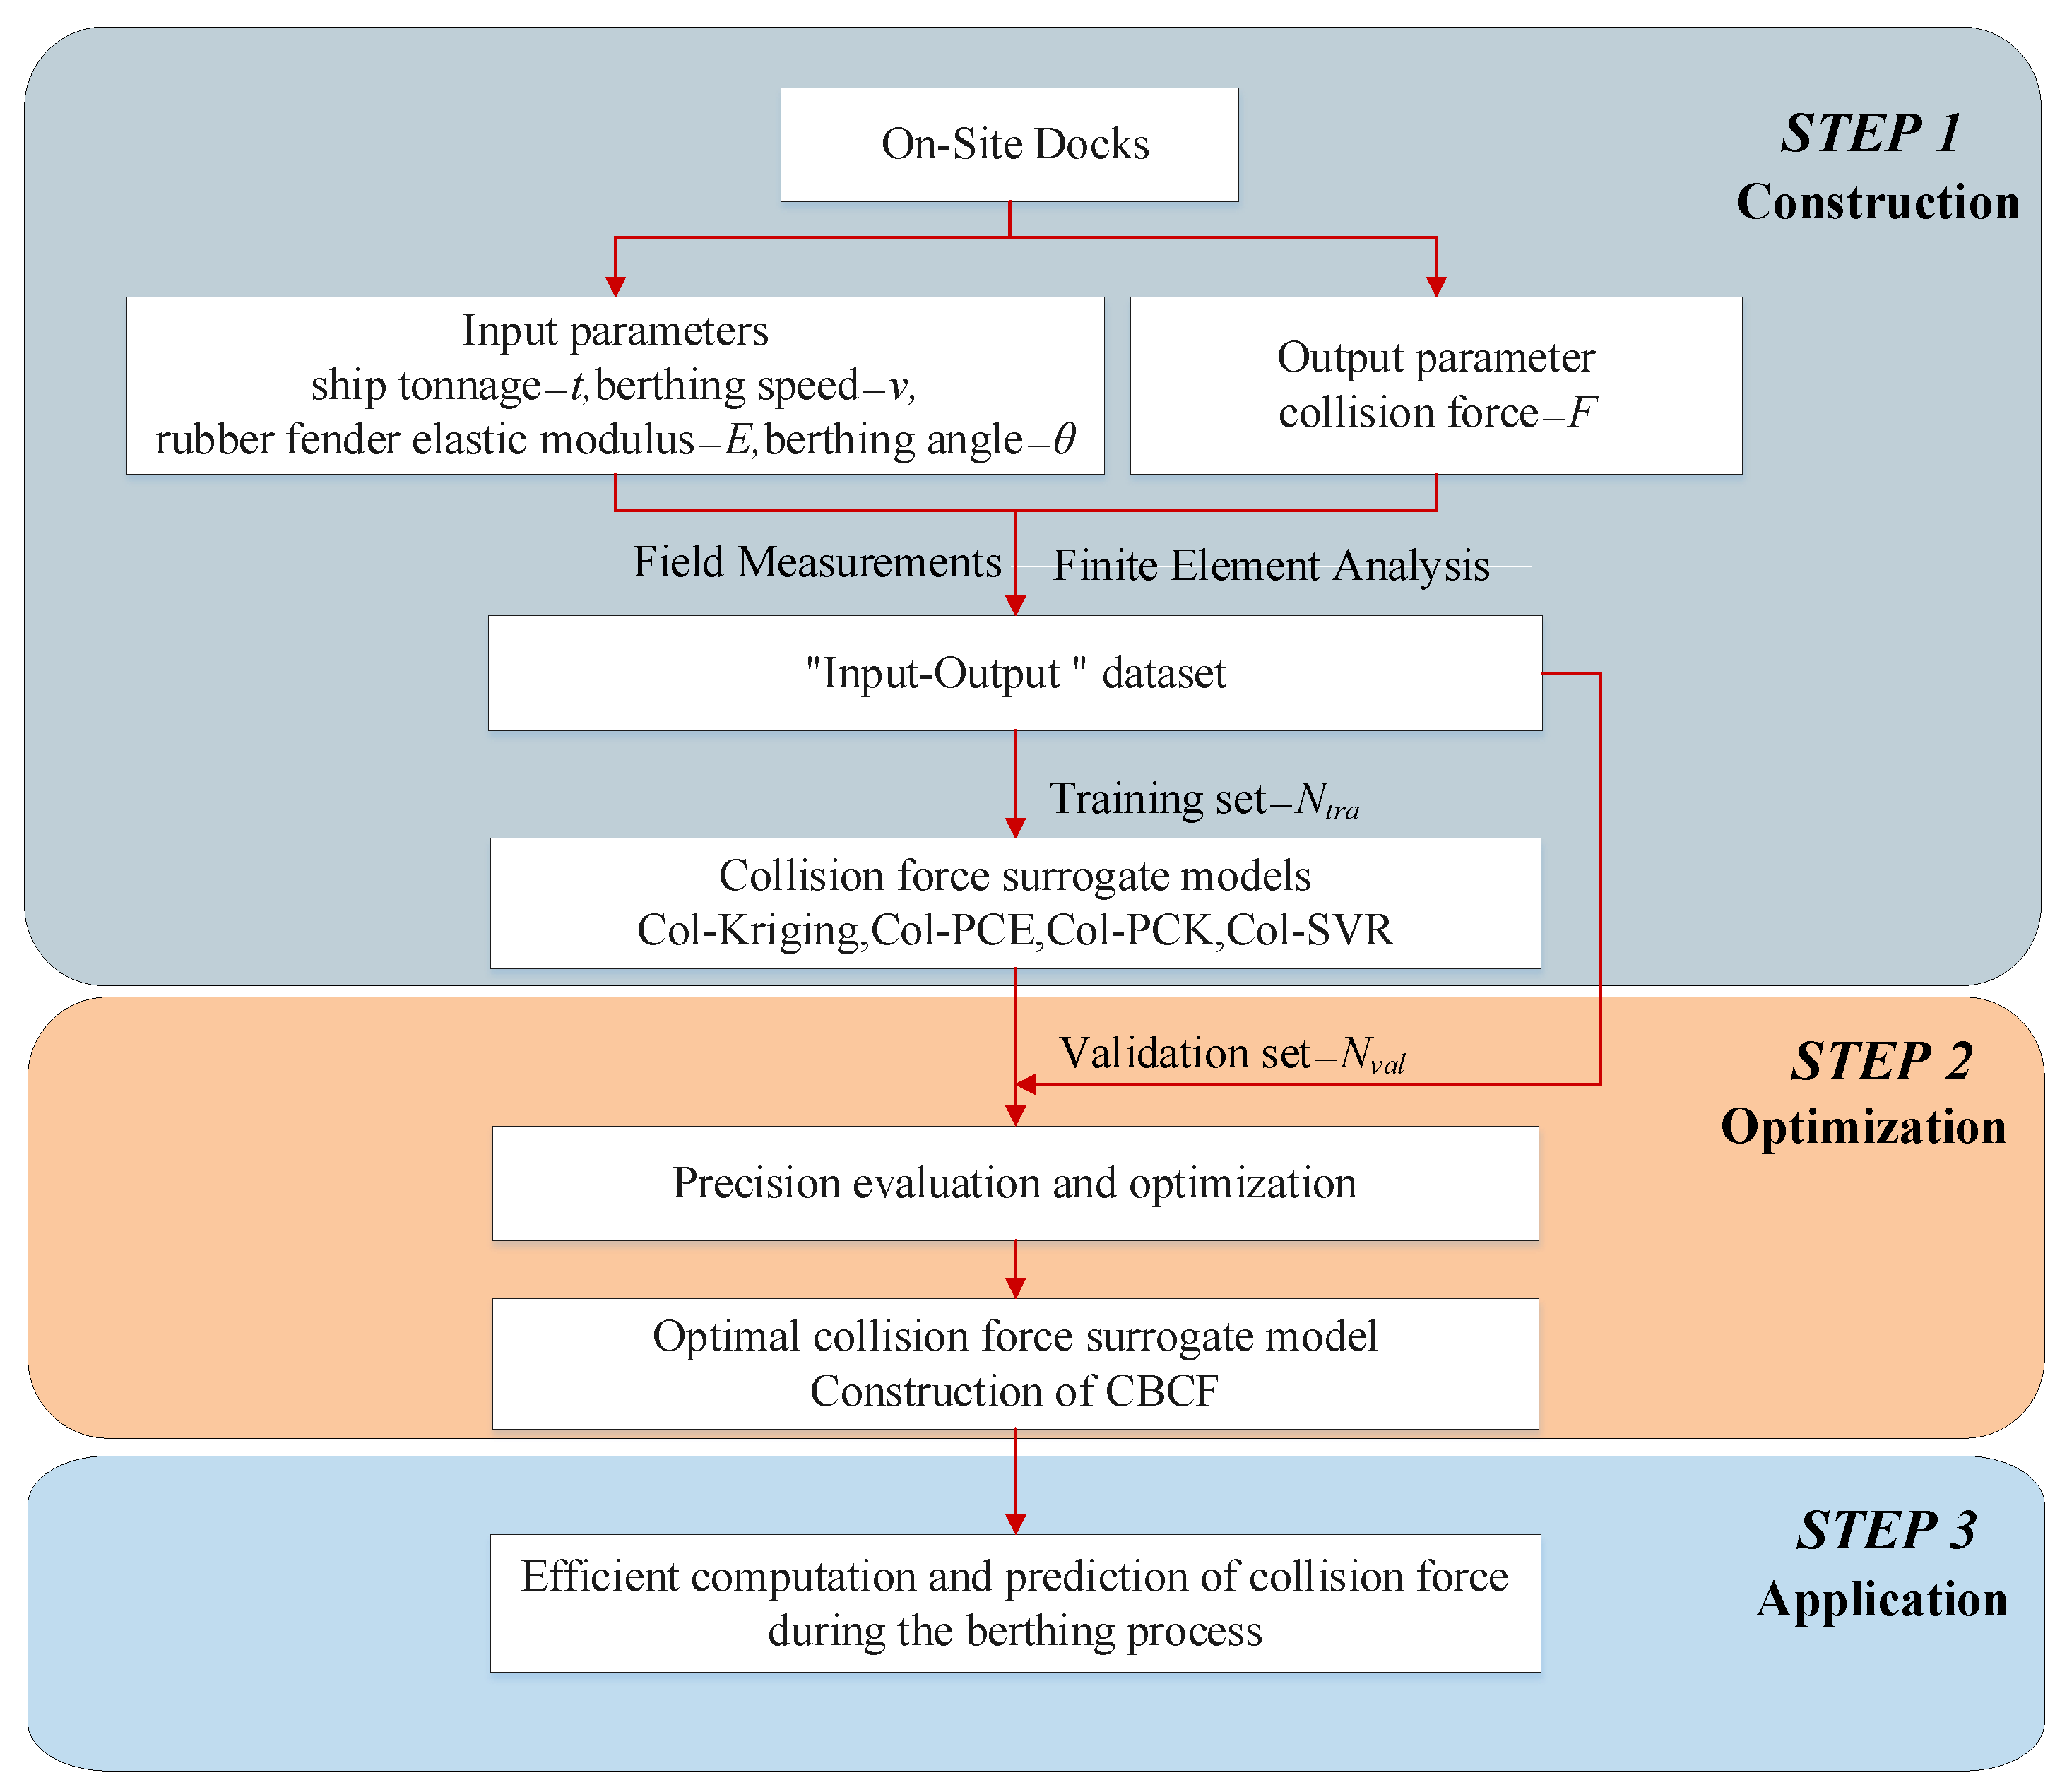
2. Construction of the CBCF Framework Based on Surrogate Models
2.1. Construction of Collision Surrogate Model
- 1
- Col-Kriging
- 2
- Col-PCE
- 3
- Col-PCK
- 4
- Col-SVR
2.2. Evaluation and Optimization of Surrogate Models
2.3. CBCF Framework Process
3. Framework Application
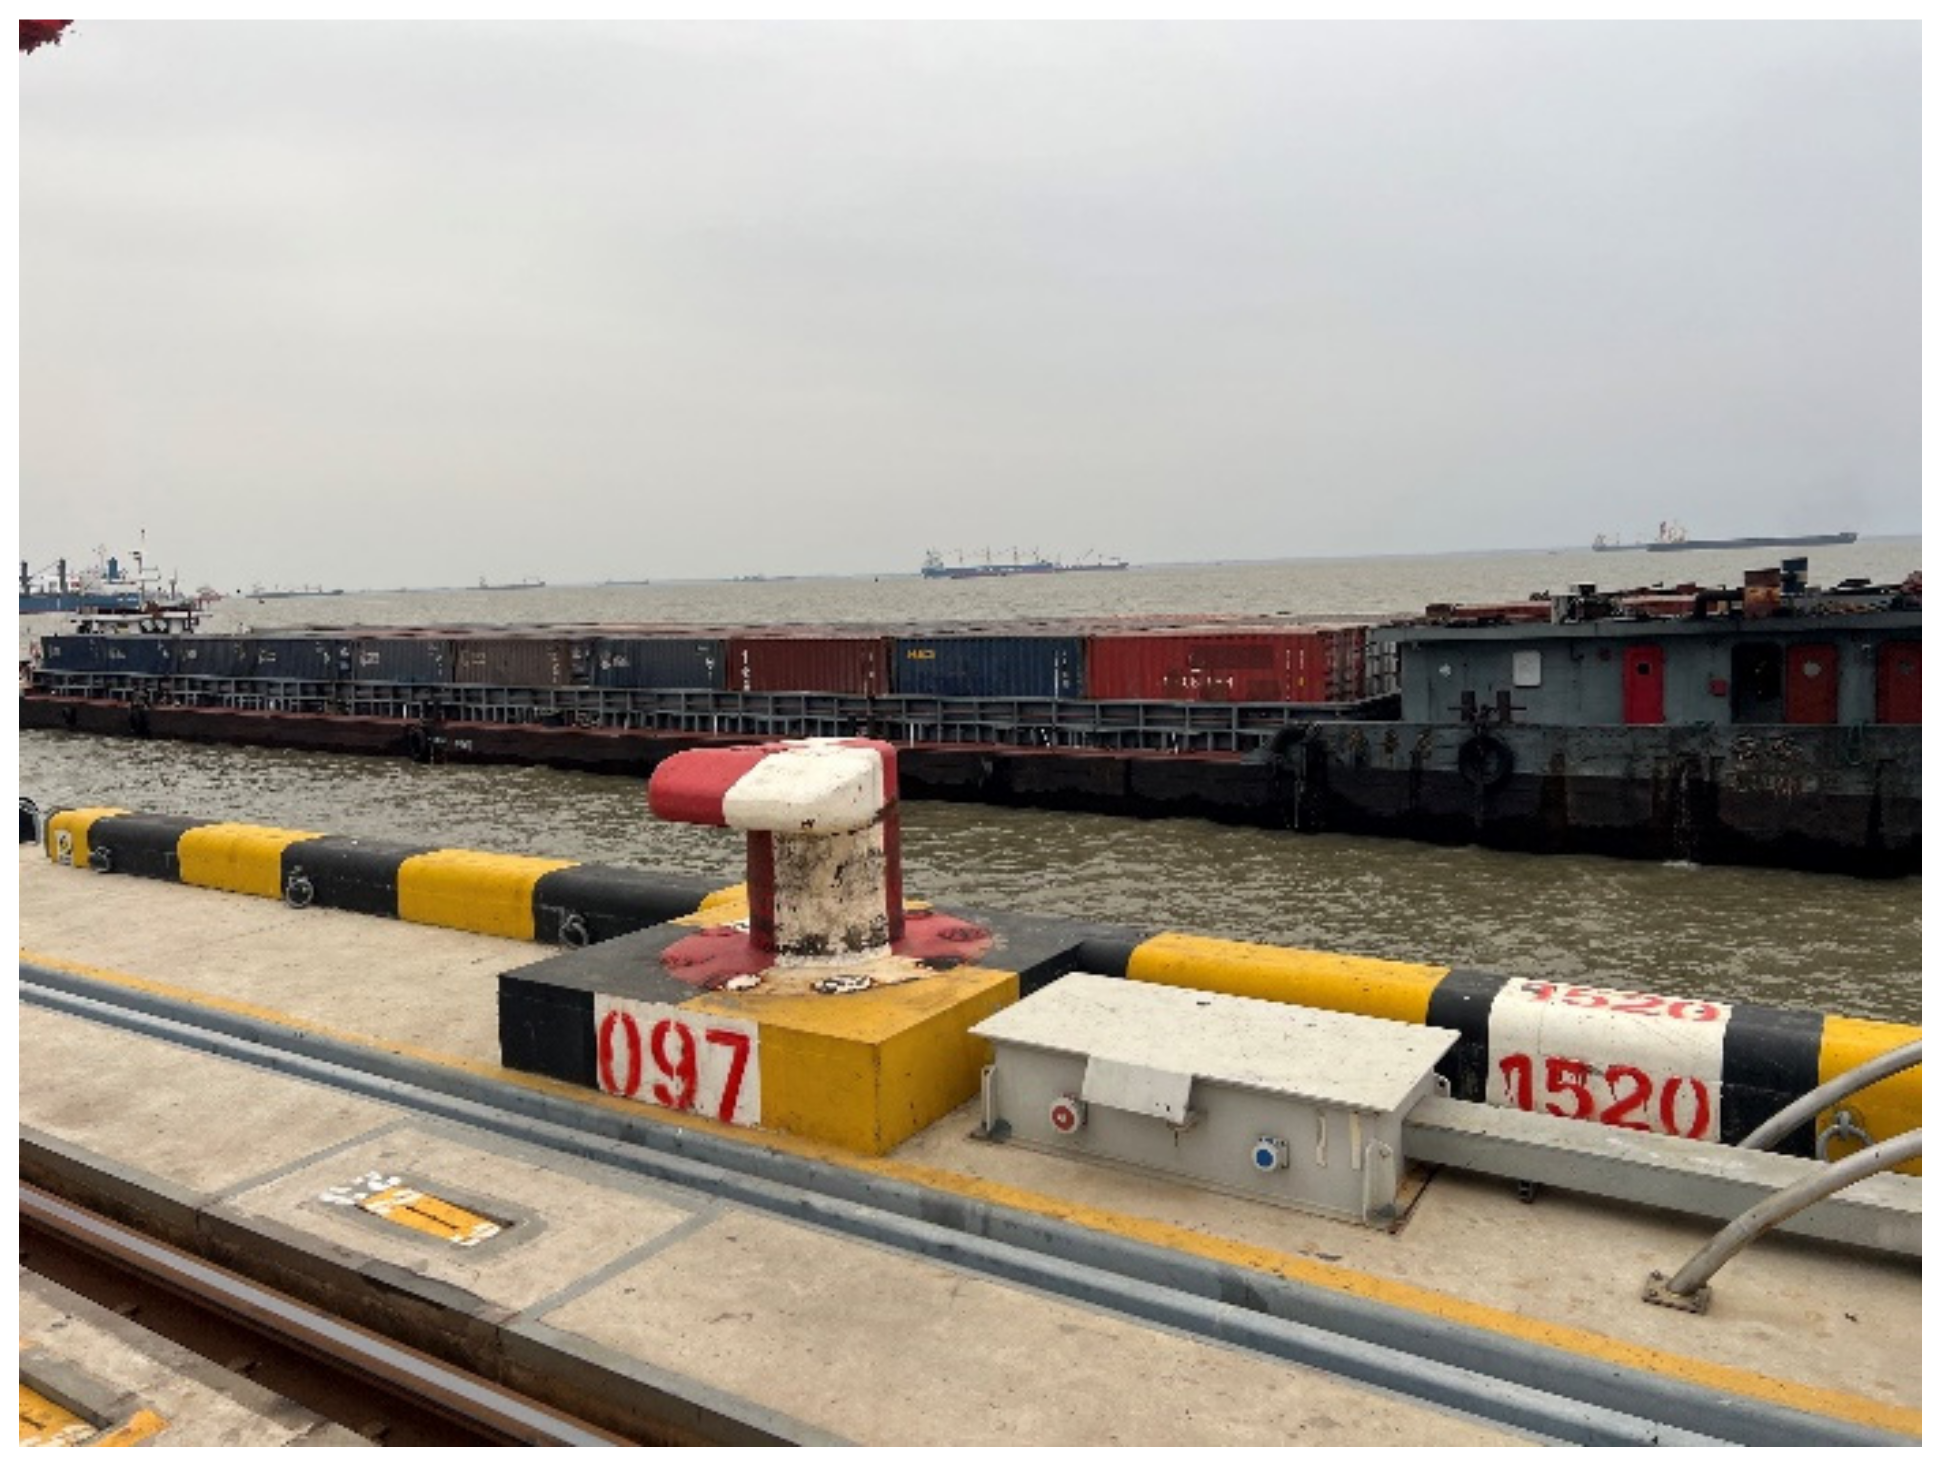
3.1. Project Introduction
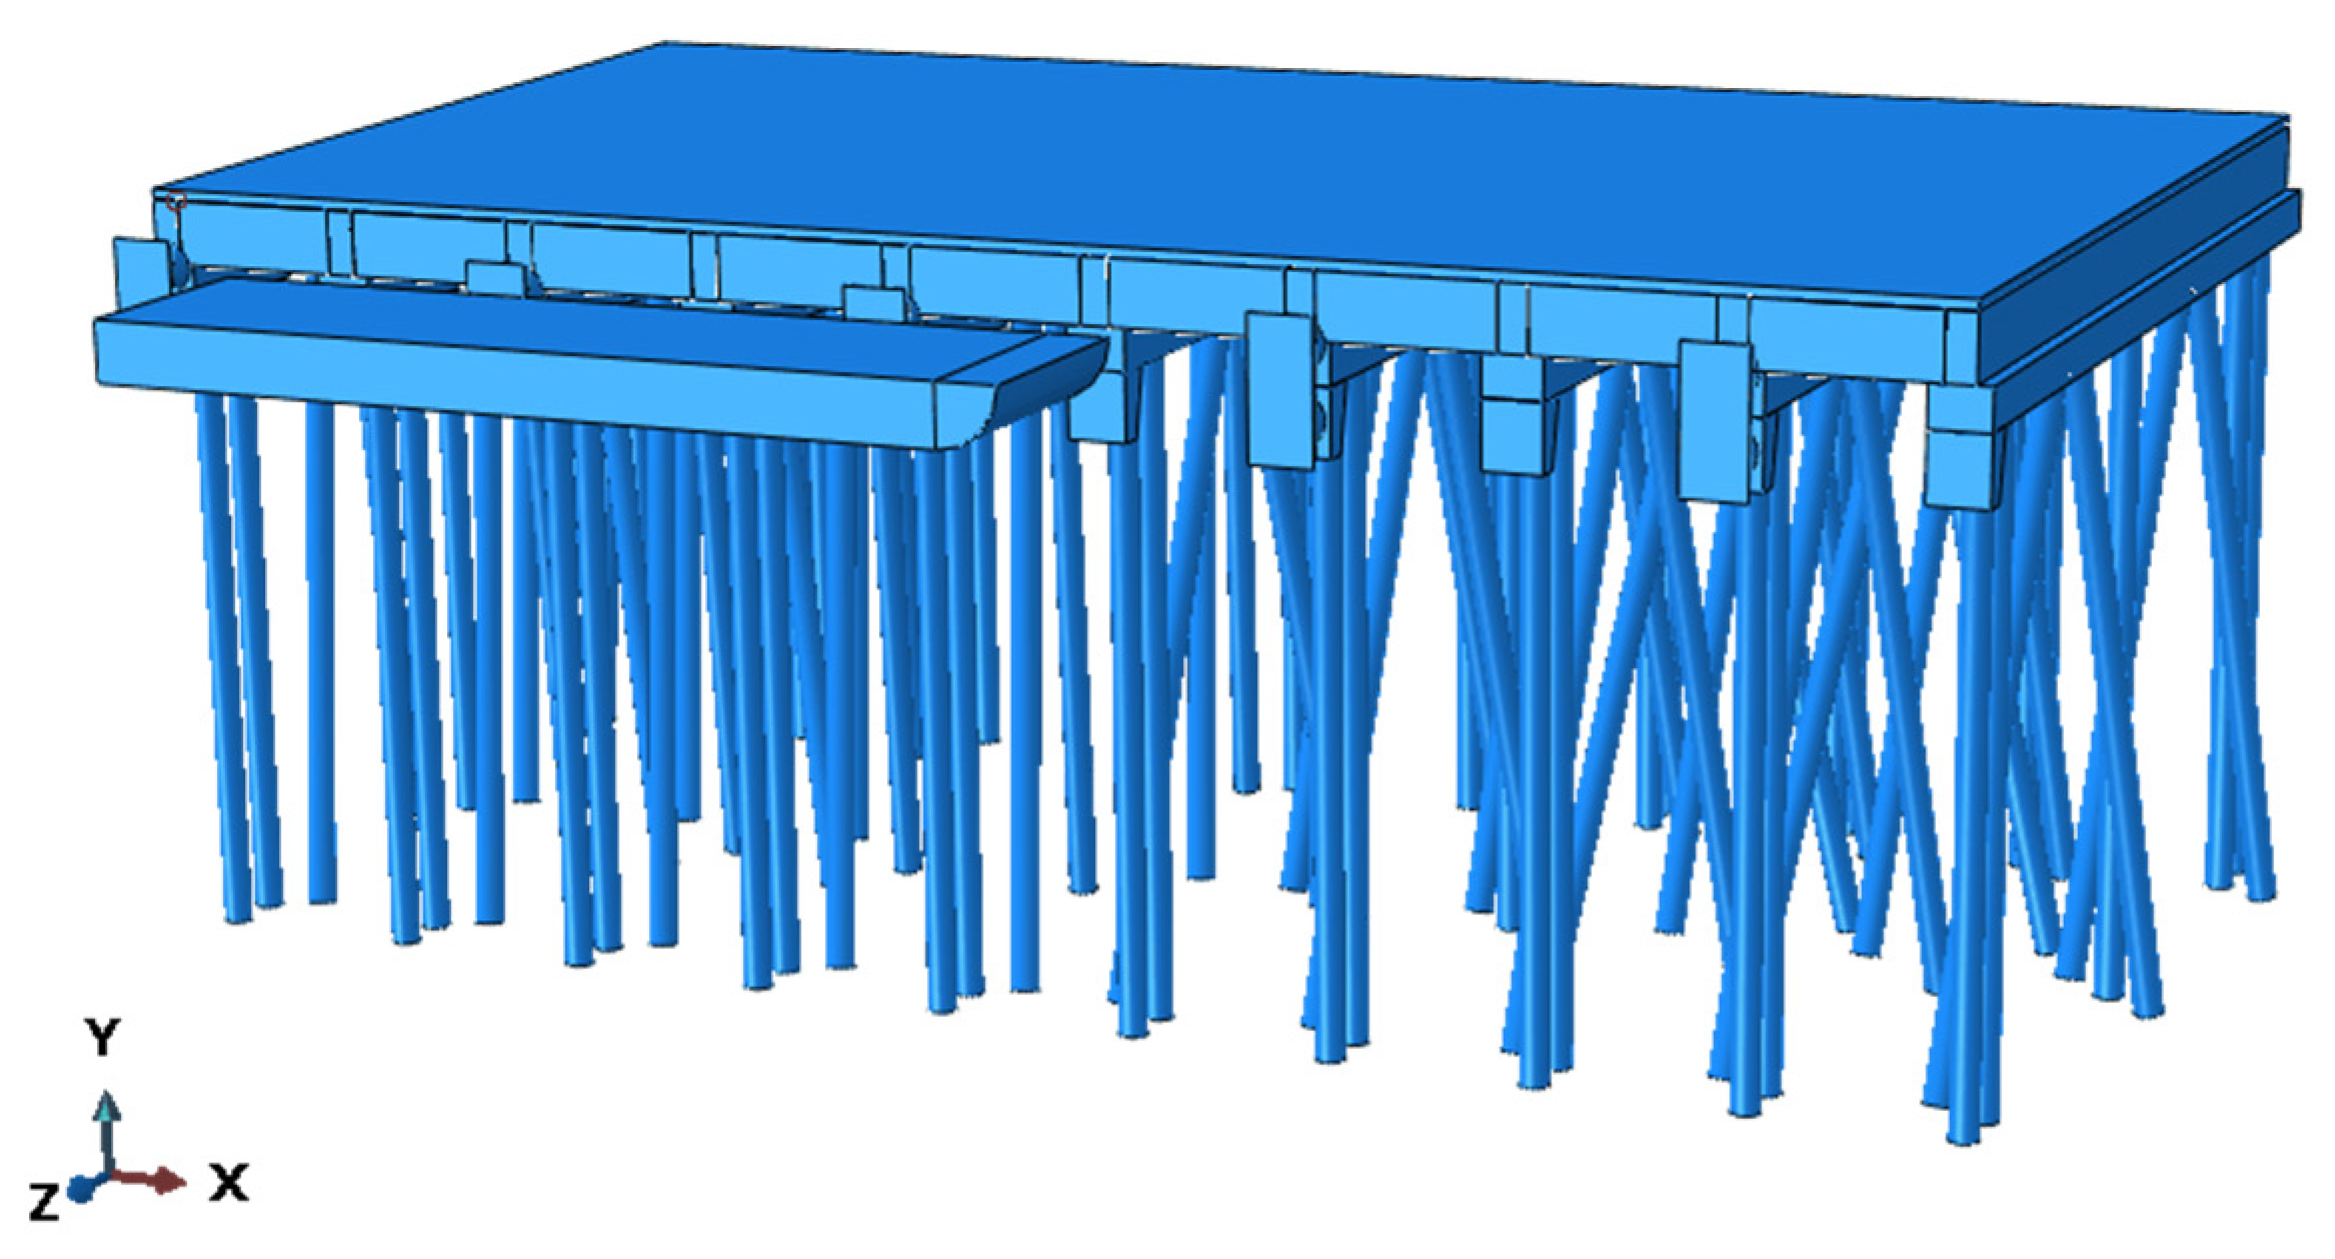
3.2. The Establishment of the Finite Element Model
3.2.1. Material Parameter Setting
3.2.2. Model Validity Verification
Berthing Collision Force Verification
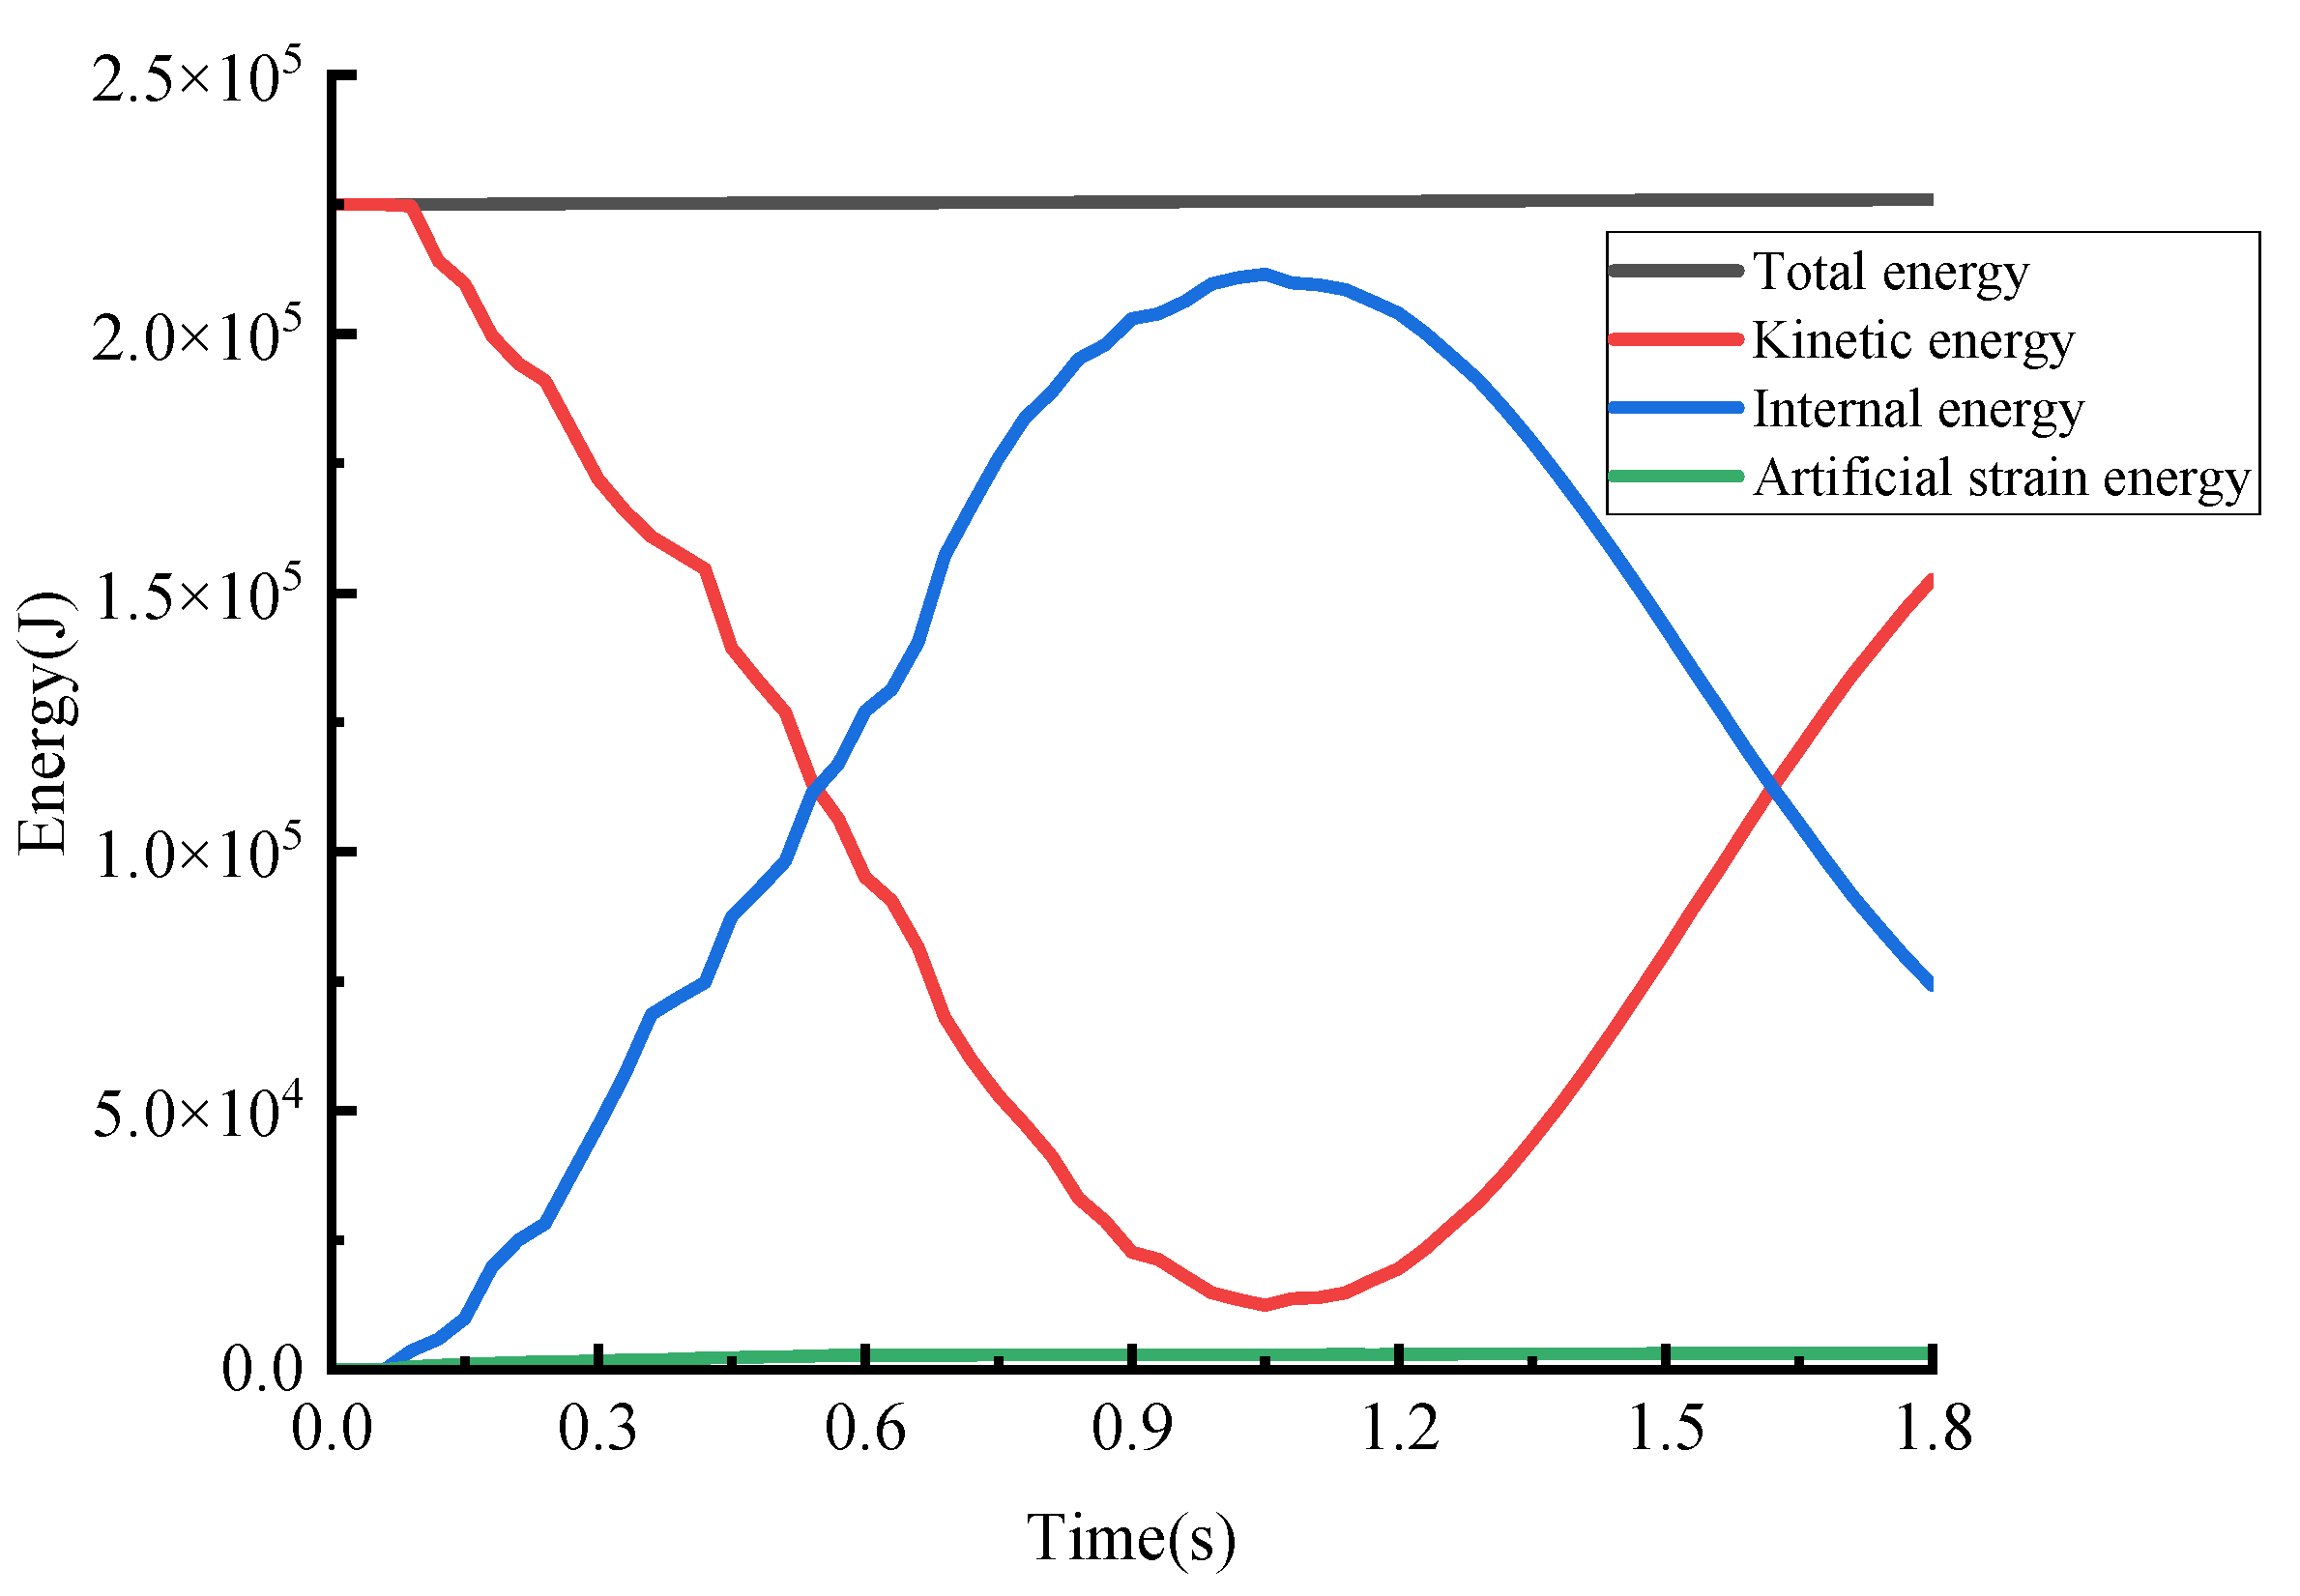
Berthing Collision Energy Verification
Self-Vibration Frequency Verification
3.3. The Acquisition of the “Input-Output” Dataset
3.4. Comparative Analysis of Surrogate Models
- (1)
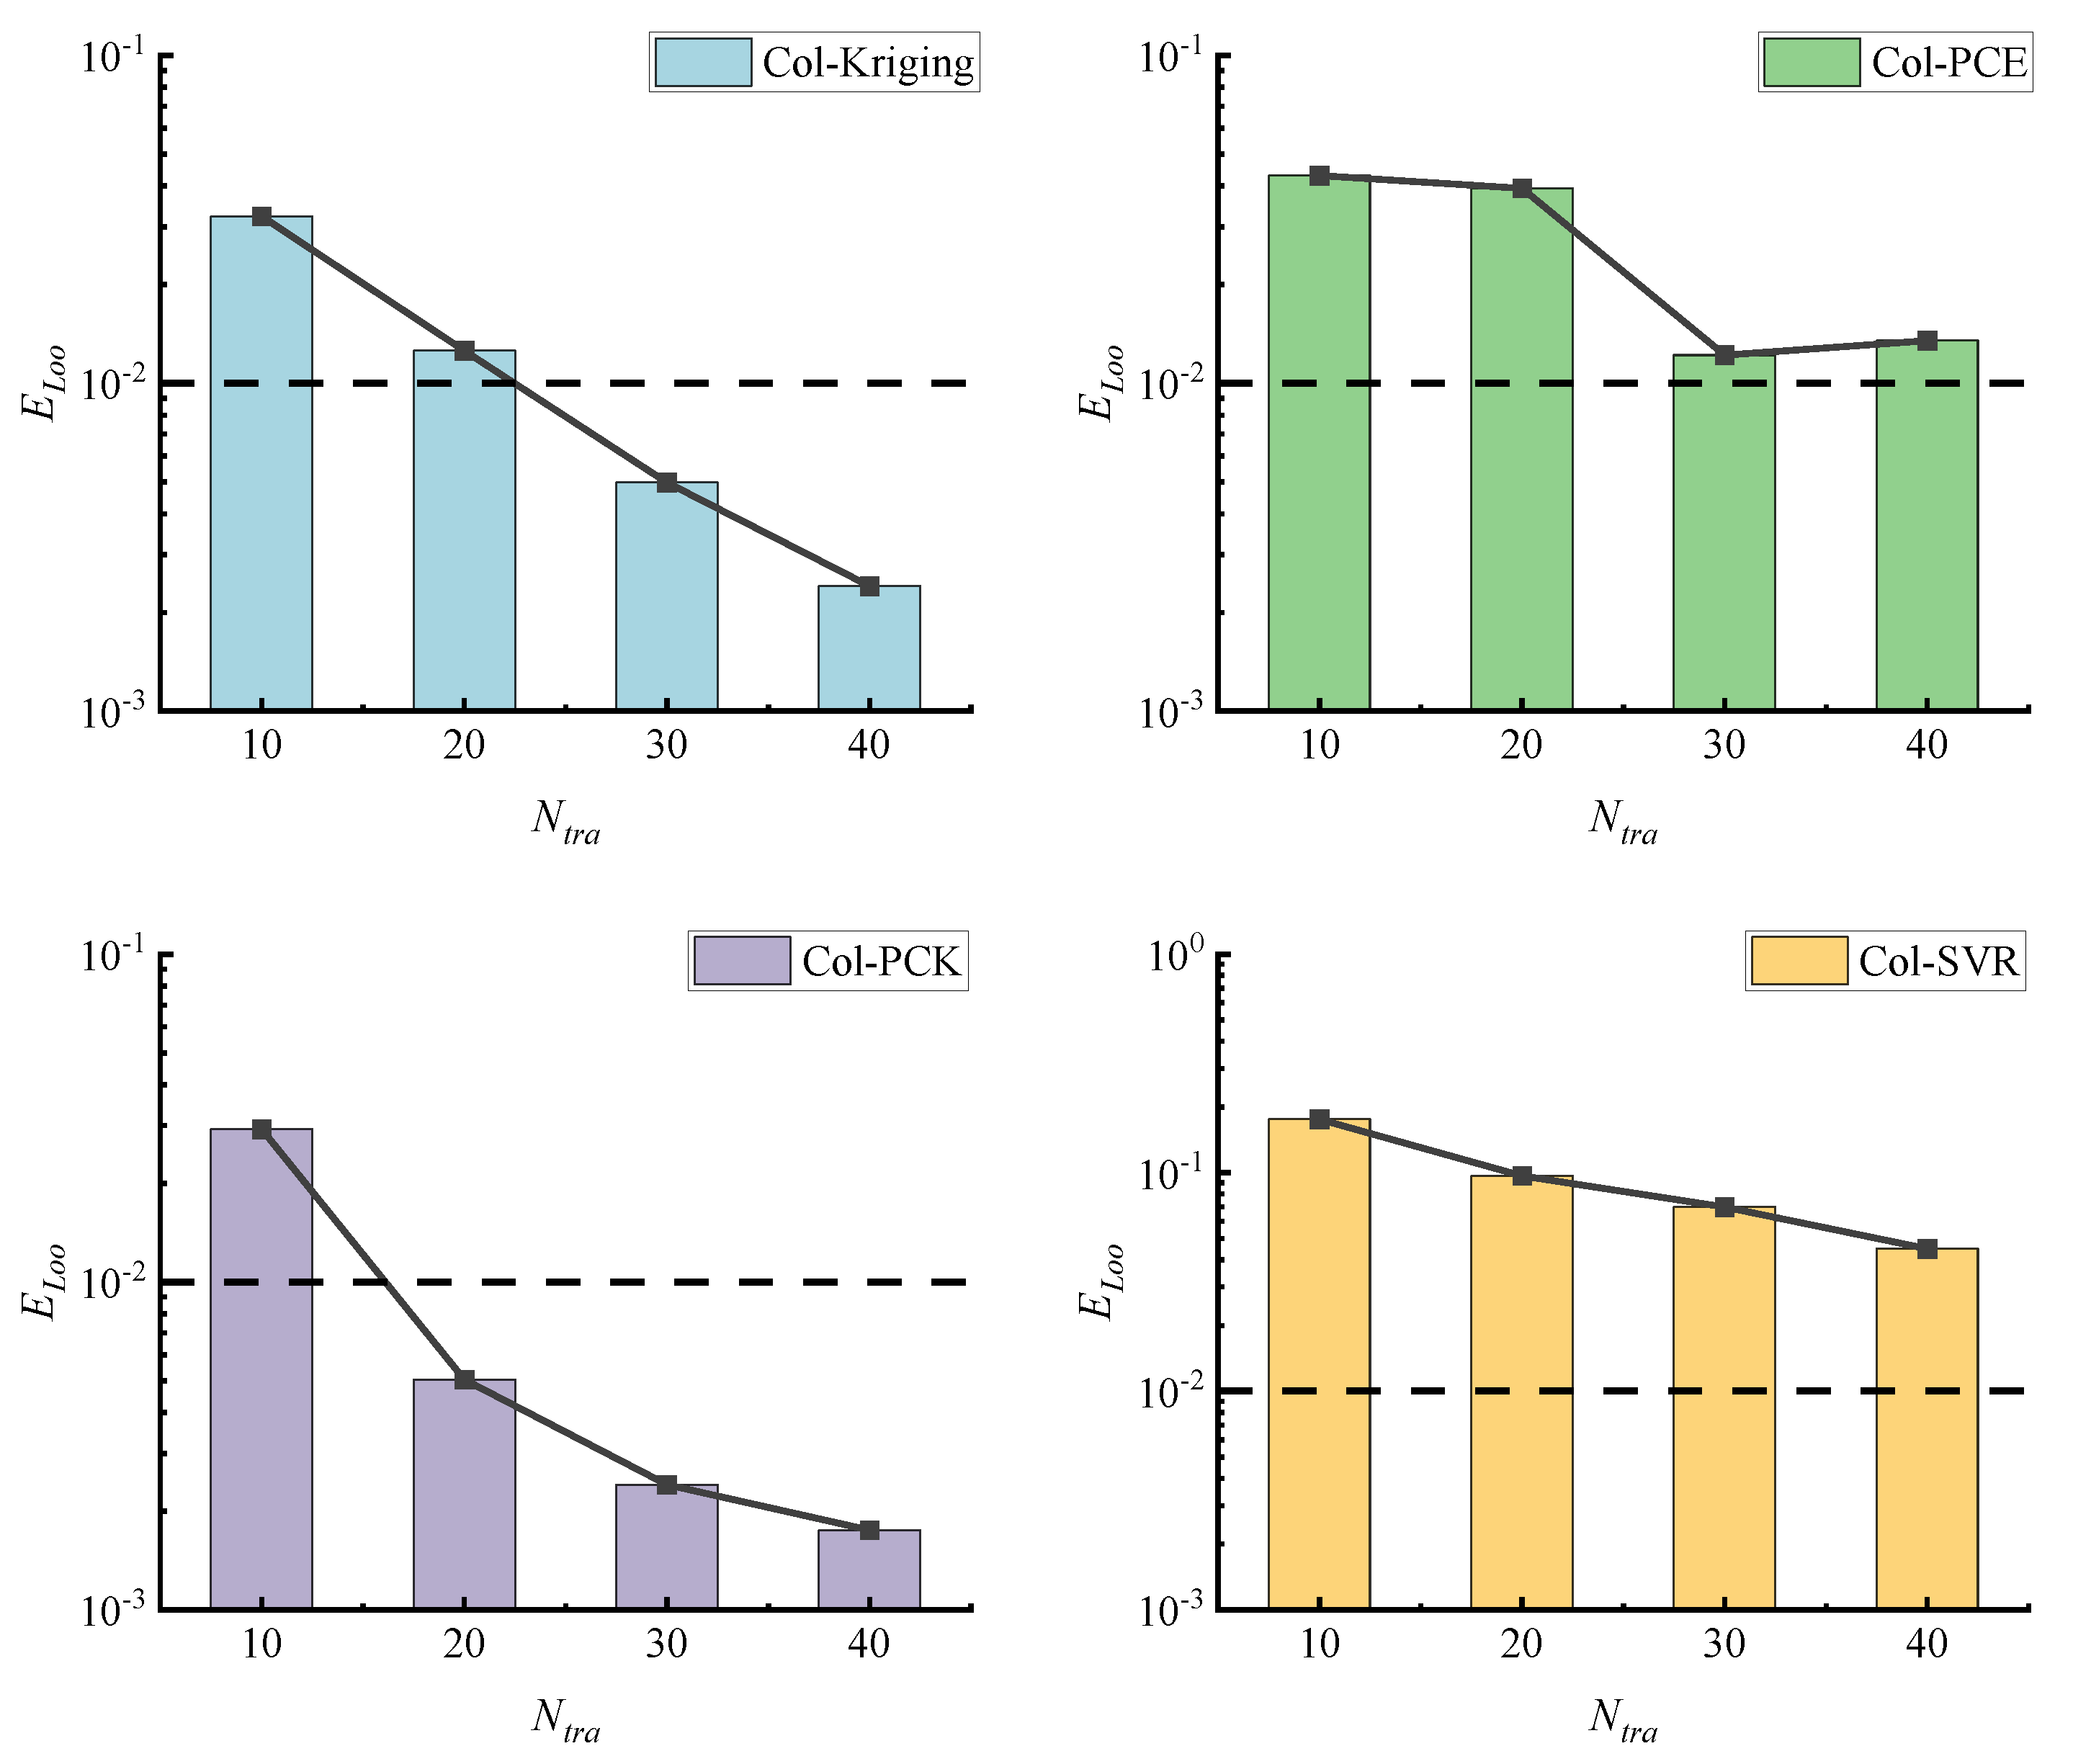
- The four surrogate models for exhibited a significant reduction in error as increased. For , both the Col-PCK and Col-SVR models demonstrated a substantial decrease in errors with increasing , while, for , the errors of these two models remained relatively stable. Similarly, Col-PCE followed a similar trend around . On the other hand, the error of Col-Kriging displayed considerable fluctuations.
- (2)
- In terms of the metric, as increased, all four surrogate models demonstrated a reduction in error, albeit at varying rates. Comparatively speaking, both the Col-Kriging and Col-PCK models manifested a more rapid decrease in the metric with increasing .
- (3)
- The Col-PCK model consistently exhibited a high prediction accuracy across different values. Even for , the evaluation error remained within the range of 10−2 to 10−3. When , both the evaluation indexes of the Col-PCK model reached an acceptable level (at the 10−3 level). However, one of the evaluation indexes for Col-Kriging, Col-PCE, and Col-SVR failed to meet the standard, with an error exceeding 10−2.
3.5. Framework Verification through Physical Model Testing
3.6. Sensitivity Analysis
3.7. Comparison with Existing Methodologies
4. Conclusions
- The surrogate model based on the “Input-Output” dataset demonstrates effective substitution for the finite element model, enabling the rapid prediction of the berthing collision force. Notably, among these models, the Col-PCK model exhibits superior performance in predicting the berthing collision force.
- The sensitivity analysis conducted using the CBCF framework proposed in this study reveals that berthing speed is the most influential factor, followed by ship tonnage. This suggests that a greater emphasis should be placed on controlling berthing speed during ship berthing processes.
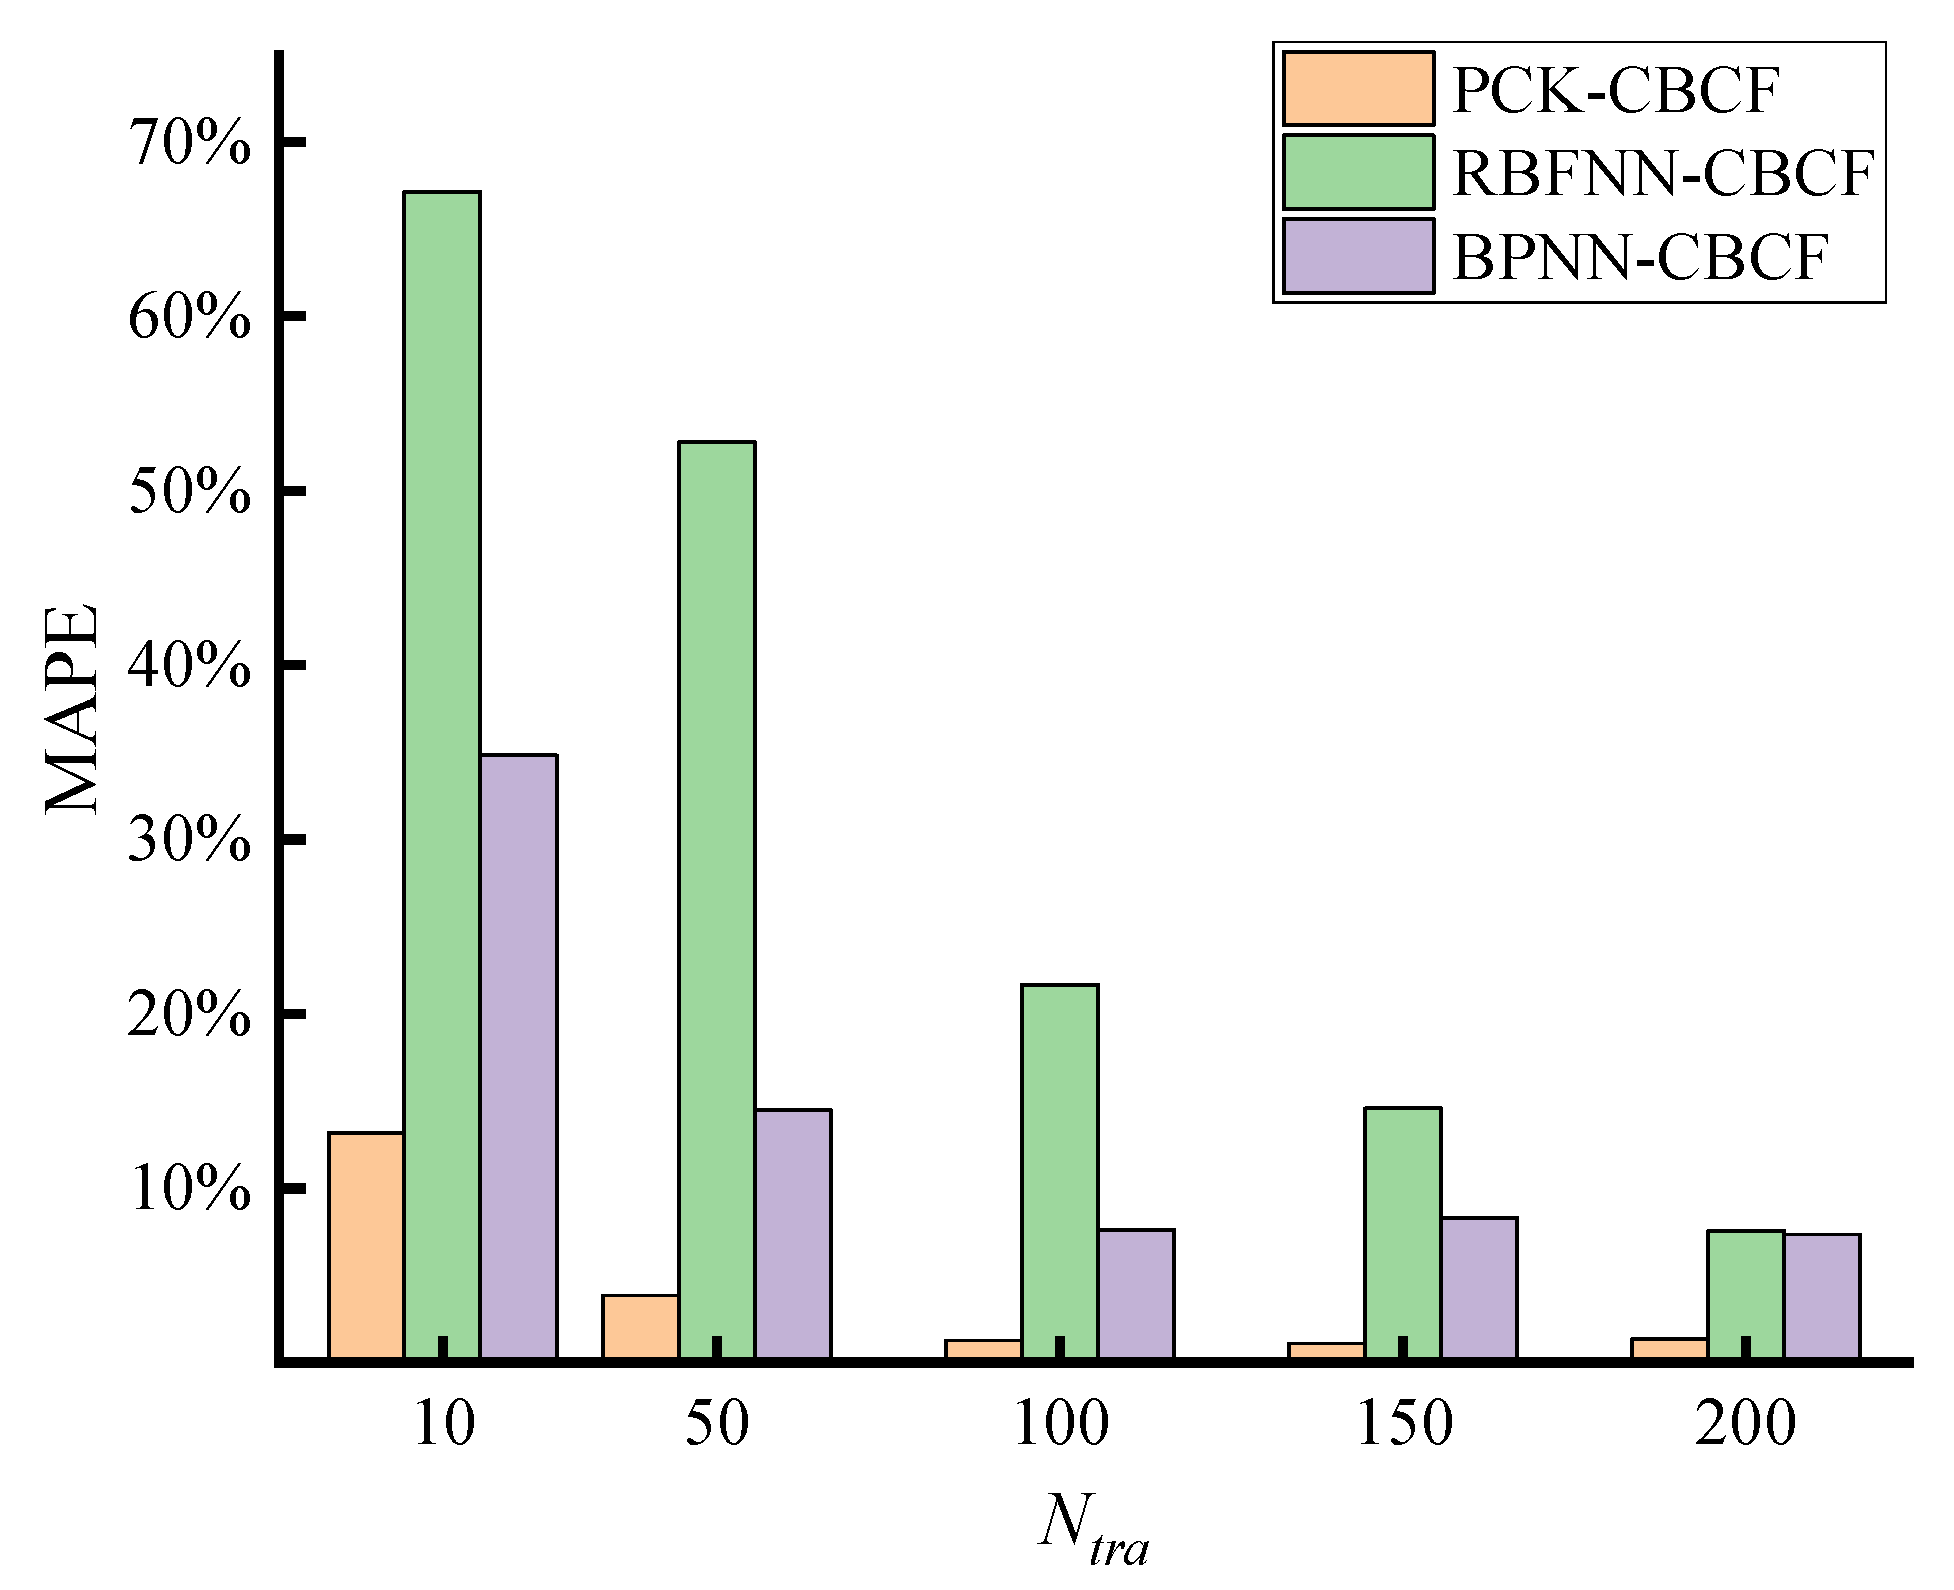
- The PCK-CBCF model demonstrates significant advantages over existing berthing collision force prediction methods in terms of reducing sample requirements, enhancing prediction accuracy, and improving computational efficiency when applied to a case study of a wharf in the Jiangsu province. This finding underscores the extensive potential of the proposed framework for future applications and its role in promoting safe wharf operations.
Author Contributions
Funding
Institutional Review Board Statement
Informed Consent Statement
Data Availability Statement
Conflicts of Interest
References
- Hu, Y.; Zhu, D. Empirical analysis of the worldwide maritime transportation network. Phys. A 2009, 388, 2061–2071. [Google Scholar] [CrossRef]
- Xing, H.; Stuart, C.; Spence, S.; Chen, H. Alternative fuel options for low carbon maritime transportation: Pathways to 2050. J. Clean. Prod. 2021, 297, 126651. [Google Scholar] [CrossRef]
- Darbra, R.-M.; Casal, J. Historical analysis of accidents in seaports. Saf. Sci. 2004, 42, 85–98. [Google Scholar] [CrossRef]
- AASHTO. Guide Specifications and Commentary for Vessel Collision Design of Highway Bridges; American Association of State Highway and Transportation Official: Washington, DC, USA, 2007. [Google Scholar]
- Vrouwenvelder, A.M. Design for Ship Impact According to Eurocode 1, Part 2.7; Routledge: London, UK, 2017; pp. 123–133. [Google Scholar]
- TB 10002.1-2005; Code for Design on Railway Bridge and Culvert. China Railway Administration: Beijing, China, 2017.
- Minorsky, V. An analysis of ship collision with reference to protection of nuclear power ships. J. Ship Res. 1959, 3, 208–214. [Google Scholar]
- Zhou, X.; Gao, Y.; Huang, F.; Zhang, G. A study on the collision force of reinforced concrete piers under cumulative ship collision. Adv. Mech. Eng. 2019, 11, 1687814019835071. [Google Scholar] [CrossRef]
- Song, Y.; Wang, J. Development of the impact force time-history for determining the responses of bridges subjected to ship collisions. Ocean Eng. 2019, 187, 106182. [Google Scholar] [CrossRef]
- Consolazio, G.R.; Davidson, M.T.; Cowan, D.R. Barge Bow Force–Deformation Relationships for Barge–Bridge Collision Analysis. Transp. Res. Rec. J. Transp. Res. Board 2009, 2131, 3–14. [Google Scholar] [CrossRef]
- Sha, Y.; Hao, H. Laboratory tests and numerical simulations of barge impact on circular reinforced concrete piers. Eng. Struct. 2013, 46, 593–605. [Google Scholar] [CrossRef]
- Shen, M.-Y.; Wu, C.-C.; Chiou, Y.-C. Enhance energy absorption of hollow-cylinder rubber fender using V-notch ring grooves. Ocean Eng. 2022, 255, 111442. [Google Scholar] [CrossRef]
- Treleborg Marine Systems. “Fender Application Design Manual.” Catalogue Ref. No. MN-ADM-V2.1-EN. 2016. Available online: http://pdf.nauticexpo.com/pdf/trelleborg-marine-systems/fender-application-design-manual/22887-97443.html (accessed on 24 October 2018).
- JTS 144-1-2010; Load Code for Harbour Engineering. Ministry of Transport of China: Beijing, China, 2010.
- Carbonari, S.; Antolloni, G.; Gara, F.; Lorenzoni, C.; Mancinelli, A. A performance-based approach for the design of coupled dolphin-fender berthing structures. Mar. Struct. 2019, 64, 78–91. [Google Scholar] [CrossRef]
- PIANC. Guidelines for the Design Ofender Systems; PIANC: Brussels, Belgium, 2002. [Google Scholar]
- Xu, G.; Cao, Z.; Wang, J.; Xue, S.; Tang, M. A novel machine learning-based framework for predicting impact force in ship-bridge pier collisions. Ocean Eng. 2023, 285, 115347. [Google Scholar] [CrossRef]
- Liu, B.; Guedes Soares, C. Recent developments in ship collision analysis and challenges to an accidental limit state design method. Ocean Eng. 2023, 270, 113636. [Google Scholar] [CrossRef]
- Henneron, T.; Pierquin, A.; Clenet, S. Surrogate Model Based on the POD Combined with the RBF Interpolation of Nonlinear Magnetostatic FE Model. IEEE Trans. Magn. 2020, 56, 7501504. [Google Scholar] [CrossRef]
- Fan, W.; Yuan, W.-c.; Fan, Q.-w. Calculation method of ship collision force on bridge using artificial neural network. J. Zhejiang Univ.-Sci. A 2008, 9, 614–623. [Google Scholar] [CrossRef]
- Qin, Y.; Su, C.; Chu, D.; Zhang, J.; Song, J. A Review of Application of Machine Learning in Storm Surge Problems. J. Mar. Sci. Eng. 2023, 11, 1729. [Google Scholar] [CrossRef]
- Kameshwar, S.; Padgett, J.E. Response and fragility assessment of bridge columns subjected to barge-bridge collision and scour. Eng. Struct. 2018, 168, 308–319. [Google Scholar] [CrossRef]
- Shen, M.Y.; Chiou, Y.C.; Tan, C.M.; Wu, C.C.; Chen, W.J. Effect of Wall Thickness on Stress-Strain Response and Buckling Behavior of Hollow-Cylinder Rubber Fenders. Materials 2020, 13, 1170. [Google Scholar] [CrossRef] [PubMed]
- Wu, C.C.; Chiou, Y.C. Stress-Strain Response of Cylindrical Rubber Fender under Monotonic and Cyclic Compression. Materials 2019, 12, 282. [Google Scholar] [CrossRef] [PubMed]
- Order, J.K. Kriging, Entry, in Encyclopedia of Statistical Sciences; Kotz, S., Johnson, N., Eds.; Wiley: New York, NY, USA, 1983; Volume 4, pp. 411–413. [Google Scholar]
- Zhou, Y.; Lu, Z.; Yun, W. Active sparse polynomial chaos expansion for system reliability analysis. Reliab. Eng. Syst. Saf. 2020, 202, 107025. [Google Scholar] [CrossRef]
- Zhao, H.; Gao, Z.; Xu, F.; Xia, L. Adaptive multi-fidelity sparse polynomial chaos-Kriging metamodeling for global approximation of aerodynamic data. Struct. Multidiscip. Optim. 2021, 64, 829–858. [Google Scholar] [CrossRef]
- Cortes, C.; Vapnik, V. Support-vector networks. Mach. Learn. 1995, 20, 273–297. [Google Scholar] [CrossRef]
- Bai, Y.; Peng, Z.; Wang, Z. A finite element model updating method based on the trust region and adaptive surrogate model. J. Sound Vib. 2023, 555, 117701. [Google Scholar] [CrossRef]
- Luo, J.; Ma, X.; Ji, Y.; Li, X.; Song, Z.; Lu, W. Review of machine learning-based surrogate models of groundwater contaminant modeling. Environ. Res. 2023, 238, 117268. [Google Scholar] [CrossRef]
- Yang, S.; Meng, D.; Wang, H.; Yang, C. A novel learning function for adaptive surrogate-model-based reliability evaluation. Philos. Trans. R. Soc. A 2024, 382, 20220395. [Google Scholar] [CrossRef] [PubMed]
- Shao, Z.; Er, M.J. Efficient Leave-One-Out Cross-Validation-based Regularized Extreme Learning Machine. Neurocomputing 2016, 194, 260–270. [Google Scholar] [CrossRef]
- Hu, J.; Zhang, L.; Lin, Q.; Cheng, M.; Zhou, Q.; Liu, H. A conservative multi-fidelity surrogate model-based robust optimization method for simulation-based optimization. Struct. Multidiscip. Optim. 2021, 64, 2525–2551. [Google Scholar] [CrossRef]
- Tahkola, M.; Keranen, J.; Sedov, D.; Far, M.F.; Kortelainen, J. Surrogate Modeling of Electrical Machine Torque Using Artificial Neural Networks. IEEE Access 2020, 8, 220027–220045. [Google Scholar] [CrossRef]
- Kim, B.; Lee, S.B.; Lee, J.; Cho, S.; Park, H.; Yeom, S.; Park, S.H. A comparison among Neo-Hookean model, Mooney-Rivlin model, and Ogden model for chloroprene rubber. Int. J. Precis. Eng. Manuf. 2012, 13, 759–764. [Google Scholar] [CrossRef]
- Peng, X.; Han, L.; Li, L. A consistently compressibleMooney-Rivlinmodel for the vulcanized rubber based on the Penn’s experimental data. Polym. Eng. Sci. 2021, 61, 2287–2294. [Google Scholar] [CrossRef]
- Yu, Y.S.; Zhao, Y.P. Deformation of PDMS membrane and microcantilever by a water droplet: Comparison between Mooney-Rivlin and linear elastic constitutive models. J. Colloid Interf. Sci. 2009, 332, 467–476. [Google Scholar] [CrossRef]
- Burkhart, T.A.; Andrews, D.M.; Dunning, C.E. Finite element modeling mesh quality, energy balance and validation methods: A review with recommendations associated with the modeling of bone tissue. J. Biomech. 2013, 46, 1477–1488. [Google Scholar] [CrossRef] [PubMed]
- Cangiani, A.; Manzini, G.; Russo, A.; Sukumar, N. Hourglass stabilization and the virtual element method. Int. J. Numer. Methods Eng. 2015, 102, 404–436. [Google Scholar] [CrossRef]
- Cheng, Z.Q.; Thacker, J.G.; Pilkey, W.D.; Hollowell, W.T.; Reagan, S.W.; Sieveka, E.M. Experiences in reverse-engineering of a finite element automobile crash model. Finite Elem. Anal. Des. 2001, 37, 843–860. [Google Scholar] [CrossRef]
- Li, W.; Liu, T.; Wang, J.; Zou, D.; Gao, S. Finite-Element Analysis of an Electromechanical Impedance–Based Corrosion Sensor with Experimental Verification. J. Aerosp. Eng. 2019, 32, 04019012. [Google Scholar] [CrossRef]
- Scigliano, R.; Scionti, M.; Lardeur, P. Verification, validation and variability for the vibration study of a car windscreen modeled by finite elements. Finite Elem. Anal. Des. 2011, 47, 17–29. [Google Scholar] [CrossRef]
- Chang, M.; Pakzad, S.N. Modified natural excitation technique for stochastic modal identification. J. Struct. Eng. 2013, 139, 1753–1762. [Google Scholar] [CrossRef]
- Li, Y.; Hariri-Ardebili, M.A.; Deng, T.; Wei, Q.; Cao, M. A surrogate-assisted stochastic optimization inversion algorithm: Parameter identification of dams. Adv. Eng. Inform. 2023, 55, 101853. [Google Scholar] [CrossRef]
- Zhai, Q.; Yan, S.; Wang, H.; Zhang, Y. Experimental study on ship’s mooring force of arched longitudinal beam wharf. In Proceedings of the 2021 7th International Conference on Hydraulic and Civil Engineering & Smart Water Conservancy and Intelligent Disaster Reduction Forum (ICHCE & SWIDR), Nanjing, China, 6–8 November 2021; pp. 1379–1386. [Google Scholar]
- Ballester-Ripoll, R.; Paredes, E.G.; Pajarola, R. Sobol tensor trains for global sensitivity analysis. Reliab. Eng. Syst. Saf. 2019, 183, 311–322. [Google Scholar] [CrossRef]
- Sudret, B. Global sensitivity analysis using polynomial chaos expansions. Reliab. Eng. Syst. Saf. 2008, 93, 964–979. [Google Scholar] [CrossRef]


| Ship Tonnage (ton) | Overall Length × Beam × Draft (m) | Container Capacity (TEU) |
|---|---|---|
| 2500 | 78.2 × 15.6 × 3.5 | 180 |
| 5000 | 98 × 18.0 × 6.5 | 350 |
| 8000 | 121 × 19.2 × 7.0 | 351~710 |
| 12,000 | 151 × 23.6 × 9.3 | 711~1040 |
| 20,000 | 183 × 27.6 × 10.5 | 1041~1900 |
| Part | Material | Characteristic | Parameters |
|---|---|---|---|
| Upper structures | C40 | Density (kg/m3) | 2300 |
| Elastic modulus (MPa) | 3.25 × 10⁴ | ||
| Poisson’s ratio | 0.2 | ||
| PHC tubular piles | C80 | Density (kg/m3) | 2500 |
| Elastic modulus (MPa) | 3.8 × 10⁴ | ||
| Poisson’s ratio | 0.2 | ||
| Ship model | Steel | Density (kg/m3) | 7800 |
| Elastic modulus (MPa) | 2.06 × 10⁵ | ||
| Poisson’s ratio | 0.3 | ||
| Fender | Rubber | Density (kg/m3) | 1800 |
| Poisson’s ratio | 0.4997 | ||
| Elastic modulus (MPa) | 4 | ||
| 533,333 | |||
| 133,333 |
| Order | FEM/Hz | Measurement/Hz | Error/% |
|---|---|---|---|
| 1 | 0.675 | 0.681 | 0.87 |
| 2 | 1.451 | 1.428 | 1.67 |
| 3 | 1.701 | 1.671 | 1.78 |
| Category | Parameters | Symbol | Number | Range | Units |
|---|---|---|---|---|---|
| Input parameters | Ship tonnage | (2000, 20,000) | |||
| Berthing speed | (0.1, 0.8) | ||||
| Elastic modulus of rubber fender | (3, 8) | ||||
| Berthing angle | (0, 15) | ° | |||
| Output parameters | Berthing collision force | - |
| Ship Tonnage (t) | Berthing Speed (m/s) | Peak Collision Force (kN) | PCK-CBCF (kN) | Error (%) | |
|---|---|---|---|---|---|
| Fully loaded | 6000 | 0.1 | 664.72 | 633 | 1.7 |
| 6000 | 0.2 | 1185.08 | 1267 | 6.9 | |
| Unloaded | 2600 | 0.1 | 389.14 | 410 | 5.4 |
| 2600 | 0.2 | 795.65 | 820 | 3.1 | |
| Berthing Condition | FEM | PCK-CBCF | RBFNN-CBCF | BPNN-CBCF |
|---|---|---|---|---|
| (2500, 0.3, 3.0, 0) | 1265 | 1295 | 1358 | 1351 |
| (5500, 0.25, 3.5, 5) | 1998 | 2033 | 2135 | 2071 |
| (9800, 0.2, 4.0, 0) | 2456 | 2511 | 2611 | 2697 |
| (11,000, 0.18, 4.2, 8) | 2341 | 2355 | 2120 | 2514 |
| (13,400, 0.12, 4.5, 10) | 1723 | 1758 | 1601 | 1864 |
| MAPE | - | 1.81% | 7.41% | 7.17% |
| Time (ms) | - | 1280 | 4570 | 4110 |
Disclaimer/Publisher’s Note: The statements, opinions and data contained in all publications are solely those of the individual author(s) and contributor(s) and not of MDPI and/or the editor(s). MDPI and/or the editor(s) disclaim responsibility for any injury to people or property resulting from any ideas, methods, instructions or products referred to in the content. |
© 2024 by the authors. Licensee MDPI, Basel, Switzerland. This article is an open access article distributed under the terms and conditions of the Creative Commons Attribution (CC BY) license (https://creativecommons.org/licenses/by/4.0/).
Share and Cite
Zeng, H.; Zhu, R.; Wang, Q.; Zou, J. High-Accuracy and Fast Calculation Framework for Berthing Collision Force of Docks Based on Surrogate Models. J. Mar. Sci. Eng. 2024, 12, 898. https://doi.org/10.3390/jmse12060898
Zeng H, Zhu R, Wang Q, Zou J. High-Accuracy and Fast Calculation Framework for Berthing Collision Force of Docks Based on Surrogate Models. Journal of Marine Science and Engineering. 2024; 12(6):898. https://doi.org/10.3390/jmse12060898
Chicago/Turabian StyleZeng, Haikun, Ruihu Zhu, Qiming Wang, and Junjie Zou. 2024. "High-Accuracy and Fast Calculation Framework for Berthing Collision Force of Docks Based on Surrogate Models" Journal of Marine Science and Engineering 12, no. 6: 898. https://doi.org/10.3390/jmse12060898