Article

Acid-Extracted Hydrocarbon Anomalies and Significance in the Chaoshan Depression of the Northern South China Sea

1
Guangzhou Marine Geological Survey, Guangzhou 510301, China
2
Key Laboratory of Ocean and Marginal Sea Geology, South China Sea Institute of Oceanology, Chinese Academy of Sciences, Guangzhou 510301, China
*
Authors to whom correspondence should be addressed.
J. Mar. Sci. Eng. 2024, 12(6), 909; https://doi.org/10.3390/jmse12060909
Submission received: 6 May 2024 / Revised: 24 May 2024 / Accepted: 27 May 2024 / Published: 29 May 2024
(This article belongs to the Special Issue Advances in Marine Gas Hydrate Exploration and Discovery)

Abstract

:
To predict the favorable zones and the types of reservoirs, acid extraction has been used in the Chaoshan depression to detect trace amounts of light hydrocarbons, heavy hydrocarbons, and the δ 13C (‰) of methane. As a result, two integration anomalous zones for exploration activity were blocked out in the northeastern and southwestern parts of the Chaoshan Depression, respectively. By analyzing the differentiation law and structural characteristics of hydrocarbon gases, as well as the stable carbon isotope ratio of methane, the underlying reservoirs were predicted to be gas reservoirs, and the seismically interpreted Dongsha-A (DS-A) structure was predicted to be a gas-rich structure. By correlating the seismic profile and geochemical anomalies, it was determined that fault planes and micro-fractures are the main controlling factors for the occurrence of the seabed’s geochemical anomalies. A composite formation mechanism of “lower generation, upper accumulation and micro fractures leaking” is proposed for the control of the underlying petroleum reservoirs, as well as for the micro-fracture control of permeability and surface adsorption control. Acid-extracted hydrocarbon anomalies have favorable indicating significance for exploration activity.

1. Introduction

The Chaoshan Depression is a Mesozoic residual depocenter in the northeast of the South China Sea. The deposit has favorable exploration activity potential but complex oil and gas accumulation. Accurate identification of favorable exploration areas and reservoirs is the key to successful exploration. Drilling data in the South China Sea reveal a marine Mesozoic development [1], making it an ideal area for studying fossils in the South China Sea. The tectonic framework of the South China Sea exerts strong control over the expansion and evolution of the Cenozoic South China Sea, and also determines the generation, migration, accumulation, and preservation processes of oil and gas. Understanding the geological structure of fossils in the South China Sea is of great significance for a comprehensive understanding of the Southeast Asian marginal seas, especially regarding the Mesozoic and Neozoic tectonic evolution of the South China Sea. The Chaoshan Depression is a Mesozoic and Cenozoic superimposed depression in the northern South China Sea (Figure 1), characterized by polyphase basin formation and structural transformation. It developed thick marine Mesozoic strata and has strong potential for exploration activity [2,3,4]; however, oil and gas have not yet been discovered in this region through drilling. The physical properties of the South China Sea’s Mesozoic reservoir are complex and the predrilling predictions do not match the results of LF35-1-1 [5,6,7,8,9]. In recent years, extensive investigations and studies have been conducted in this area, and a lot of trapped structures rich in organic matter have been discovered [10,11,12,13]. To ensure further successful exploration, the effective identification and prediction of favorable exploration areas and petroleum reservoirs is key.
Micro-leakage in oil and gas reservoirs are a common natural phenomenon and form geochemical anomalies on the land surface or the seafloor. Geochemical anomalies in seafloor samples can be used to quickly delineate favorable exploration zones in underexplored basins.
Surface geochemistry (SG) is a rapid method for predicting favorable zones of exploration activity and the types of petroleum reservoirs. Driven by the pressure of oil and gas, petroleum migrates upward along complex micro-fractures, fault planes, and other migration channels in the form of micro-bubbles or continuous gas phases. These hydrocarbons are adsorbed by clay minerals and encapsulated by secondary carbonates. As a result, the adsorbed hydrocarbon anomalies corresponding to the underlying reservoir accumulate in the seafloor sediments above the reservoirs. By detecting such anomalies, potential reservoirs can be predicted. Based on the direct correlation between latent petroleum reservoirs and the hydrocarbon concentrations of the gas adsorbed in sea bed sediments, the hydrocarbons’ internal composition can be used to reliably forecast the properties of the migrated hydrocarbons and forecast the development characteristics of the underlying petroleum reservoir and distinguish its overall properties [14,15,16,17,18,19,20,21,22,23,24,25,26,27,28].
Marine SG mainly employs the analysis of gaseous alkanes (C1–C5) present in seabed sediments to predict the characteristics of the underlying petroleum reservoir [29]. These bound gases are believed to be attached to organic and/or mineral surfaces, which are entrapped in water structures or authigenic carbonate inclusions. Horvitz (1981, 1985) pioneered the concept of bound sediment gas analysis with his method of acid-extraction adsorbed gas analysis [30,31]. Migrated thermogenic hydrocarbon gases readily bind to near-surface fine-grained sediments (e.g., clays) due to the highly adsorptive nature of these sediments towards hydrocarbons. He also believed there was a preferential adsorption of the migrating thermogenic hydrocarbons relative to the in situ-derived microbial gases. Whiticar (2002) describes how structured water creates a relatively impermeable membrane of organized water molecules that entrap the migrated thermogenic gases, and the in situ-generated interstitial microbial gases will have little or no exchange with the entrapped/sorbed phase [32]. He describes a contiguous coating or network of structured water whereby thermogenic hydrocarbons will migrate vertically within the sedimentary column in a contiguous structured water network, a process known as “handshake migration” [29].
However, gaseous alkanes can also be affected by factors such as disturbances to seabed microorganisms and the interference of biogenic methane, which increases the difficulty of predicting the location of underlying petroleum reservoirs and exploration risks. Therefore, analyzing and identifying whether hydrocarbon anomalies in seafloor sediments originate from the hydrocarbons of the underlying petroleum reservoir is an important factor in predicting the success or failure of oil and gas traps, keeping in mind that the near-surface petroleum seepage signature can be generated from microbial as well as thermogenic sources. This study qualitatively and quantitatively analyzes the acid-extracted hydrocarbon anomalies in the Chaoshan Depression in the northeast of the South China Sea. Using anomalies in the abundance, structure, and distribution characteristics of light and heavy hydrocarbons, this study predicts the attributes of the Mesozoic Petroleum system. The findings delineate the northeastern and southwestern parts of the Chaoshan Depression as comprehensive anomalous zones for oil and gas exploration, and these are also the most favorable prospective oil and gas areas. The DS-A structure is determined as being a predominantly gas-bearing reservoir.

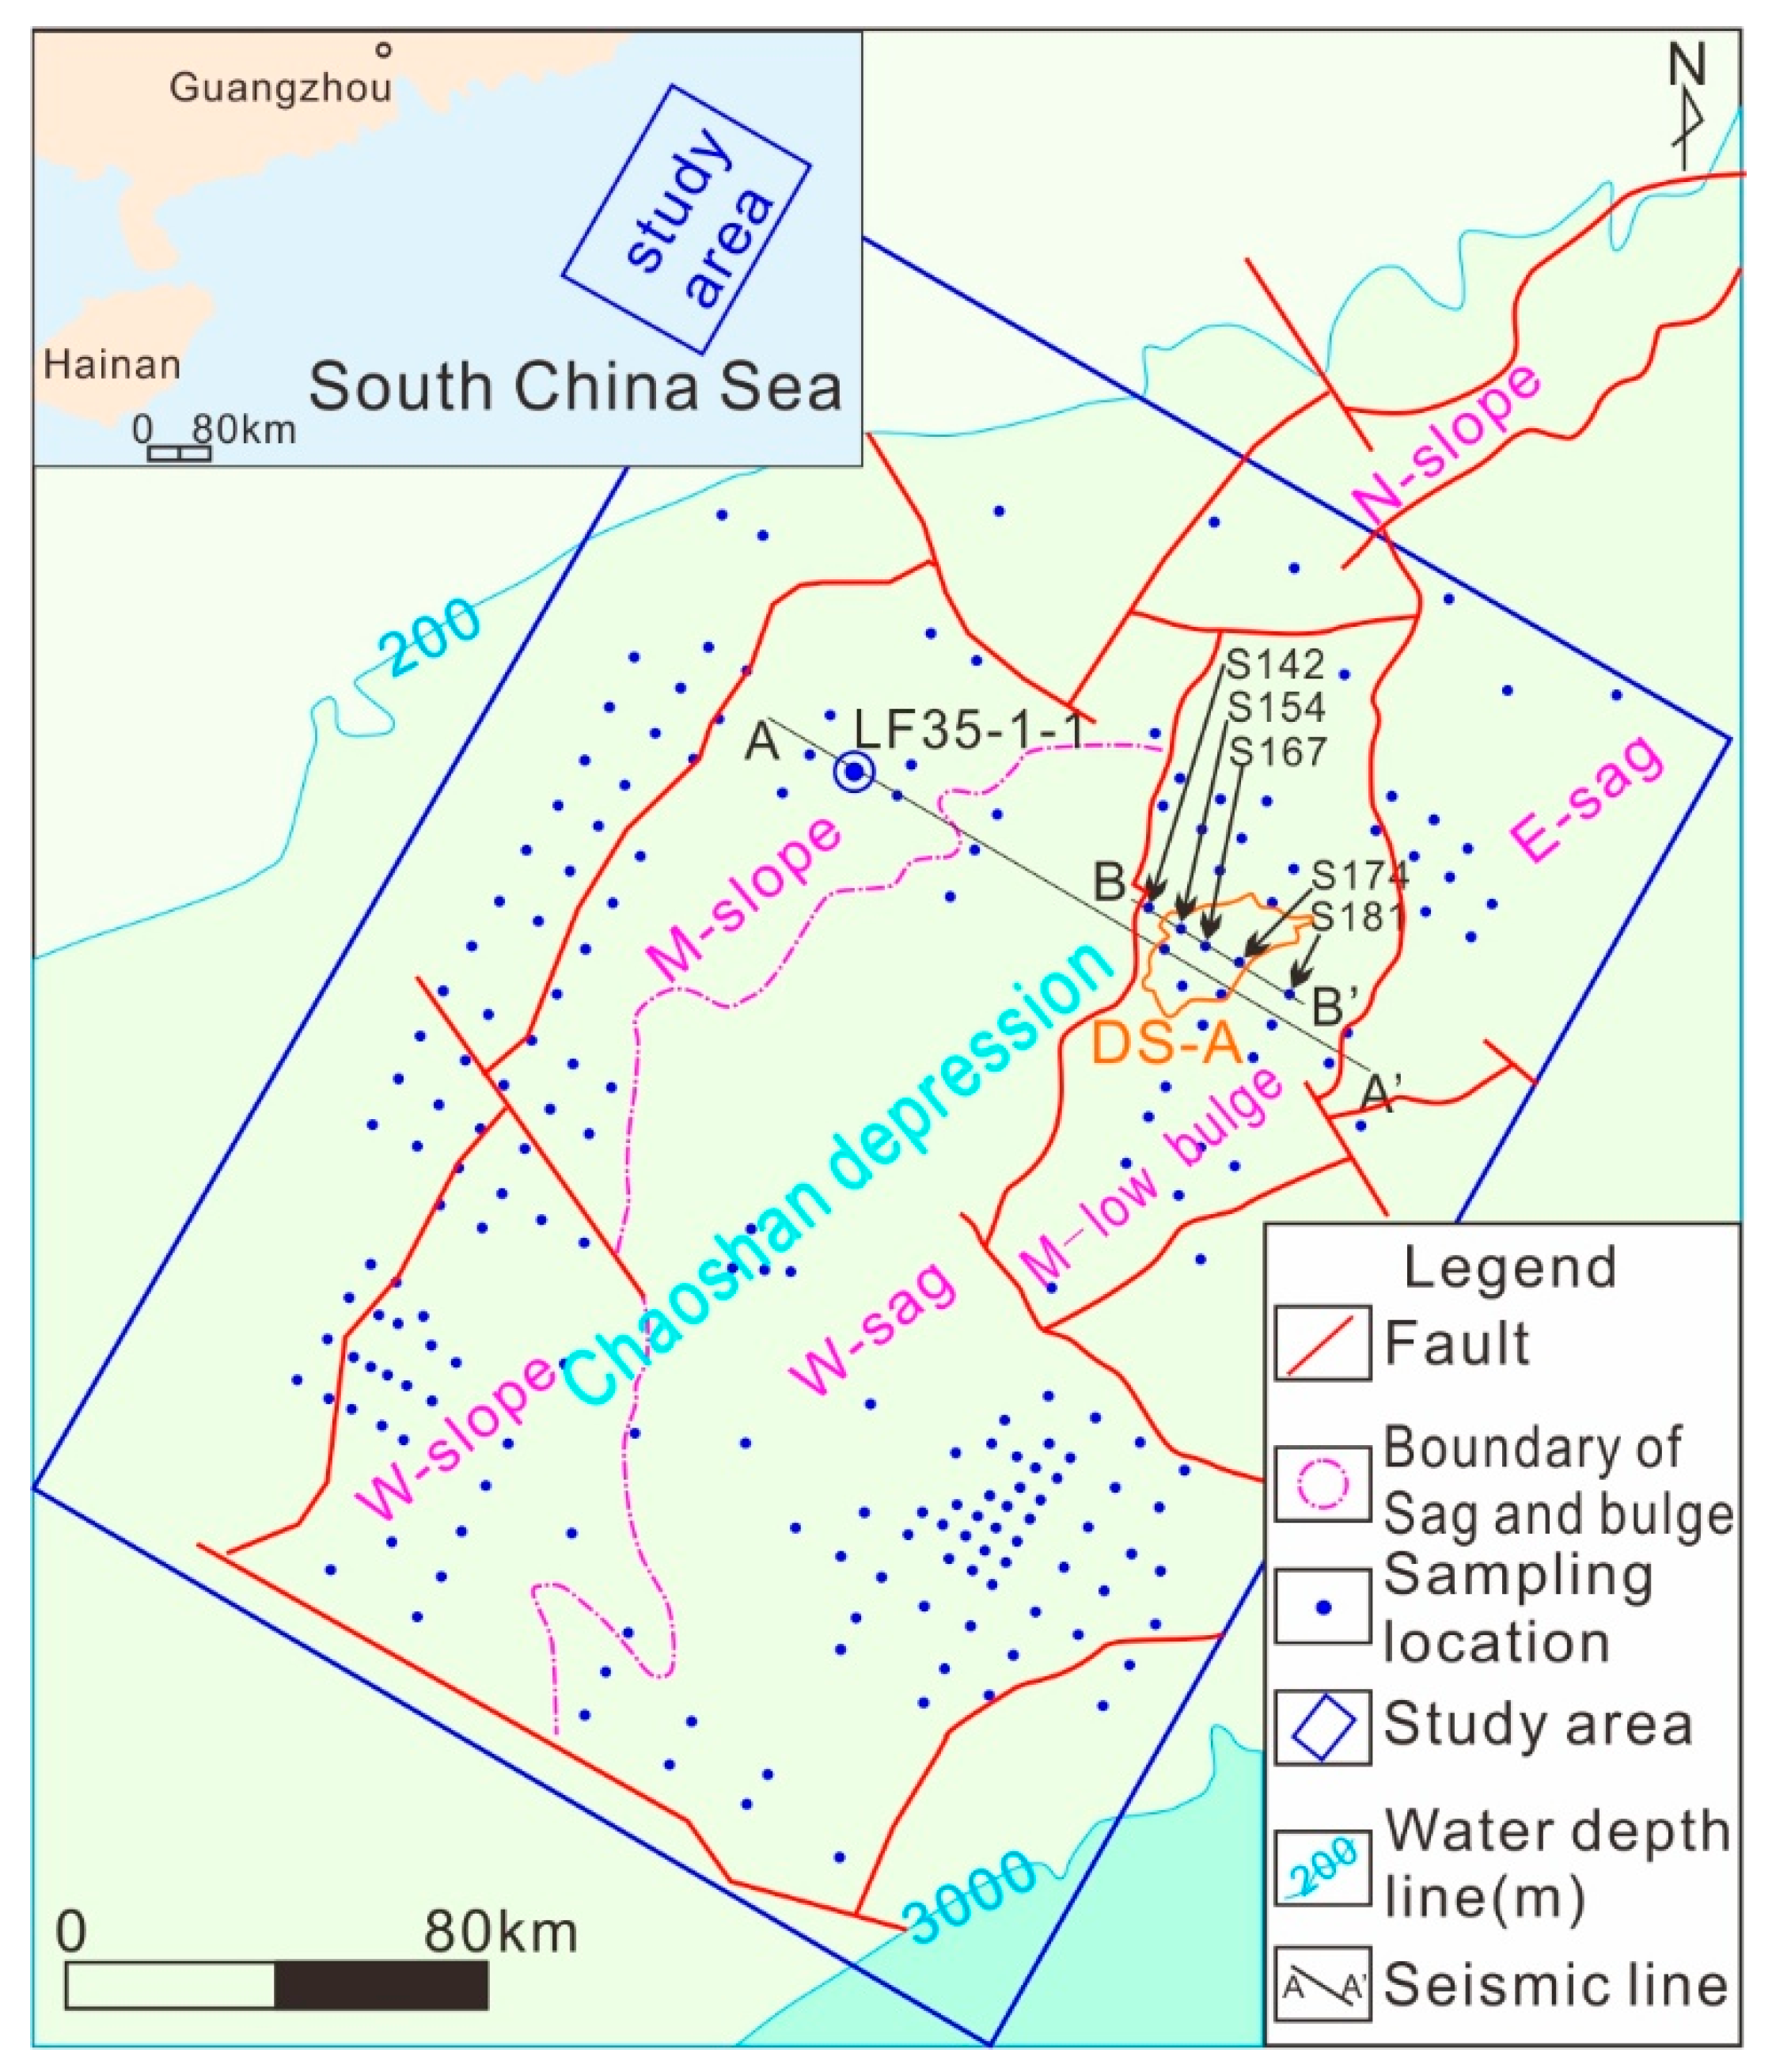
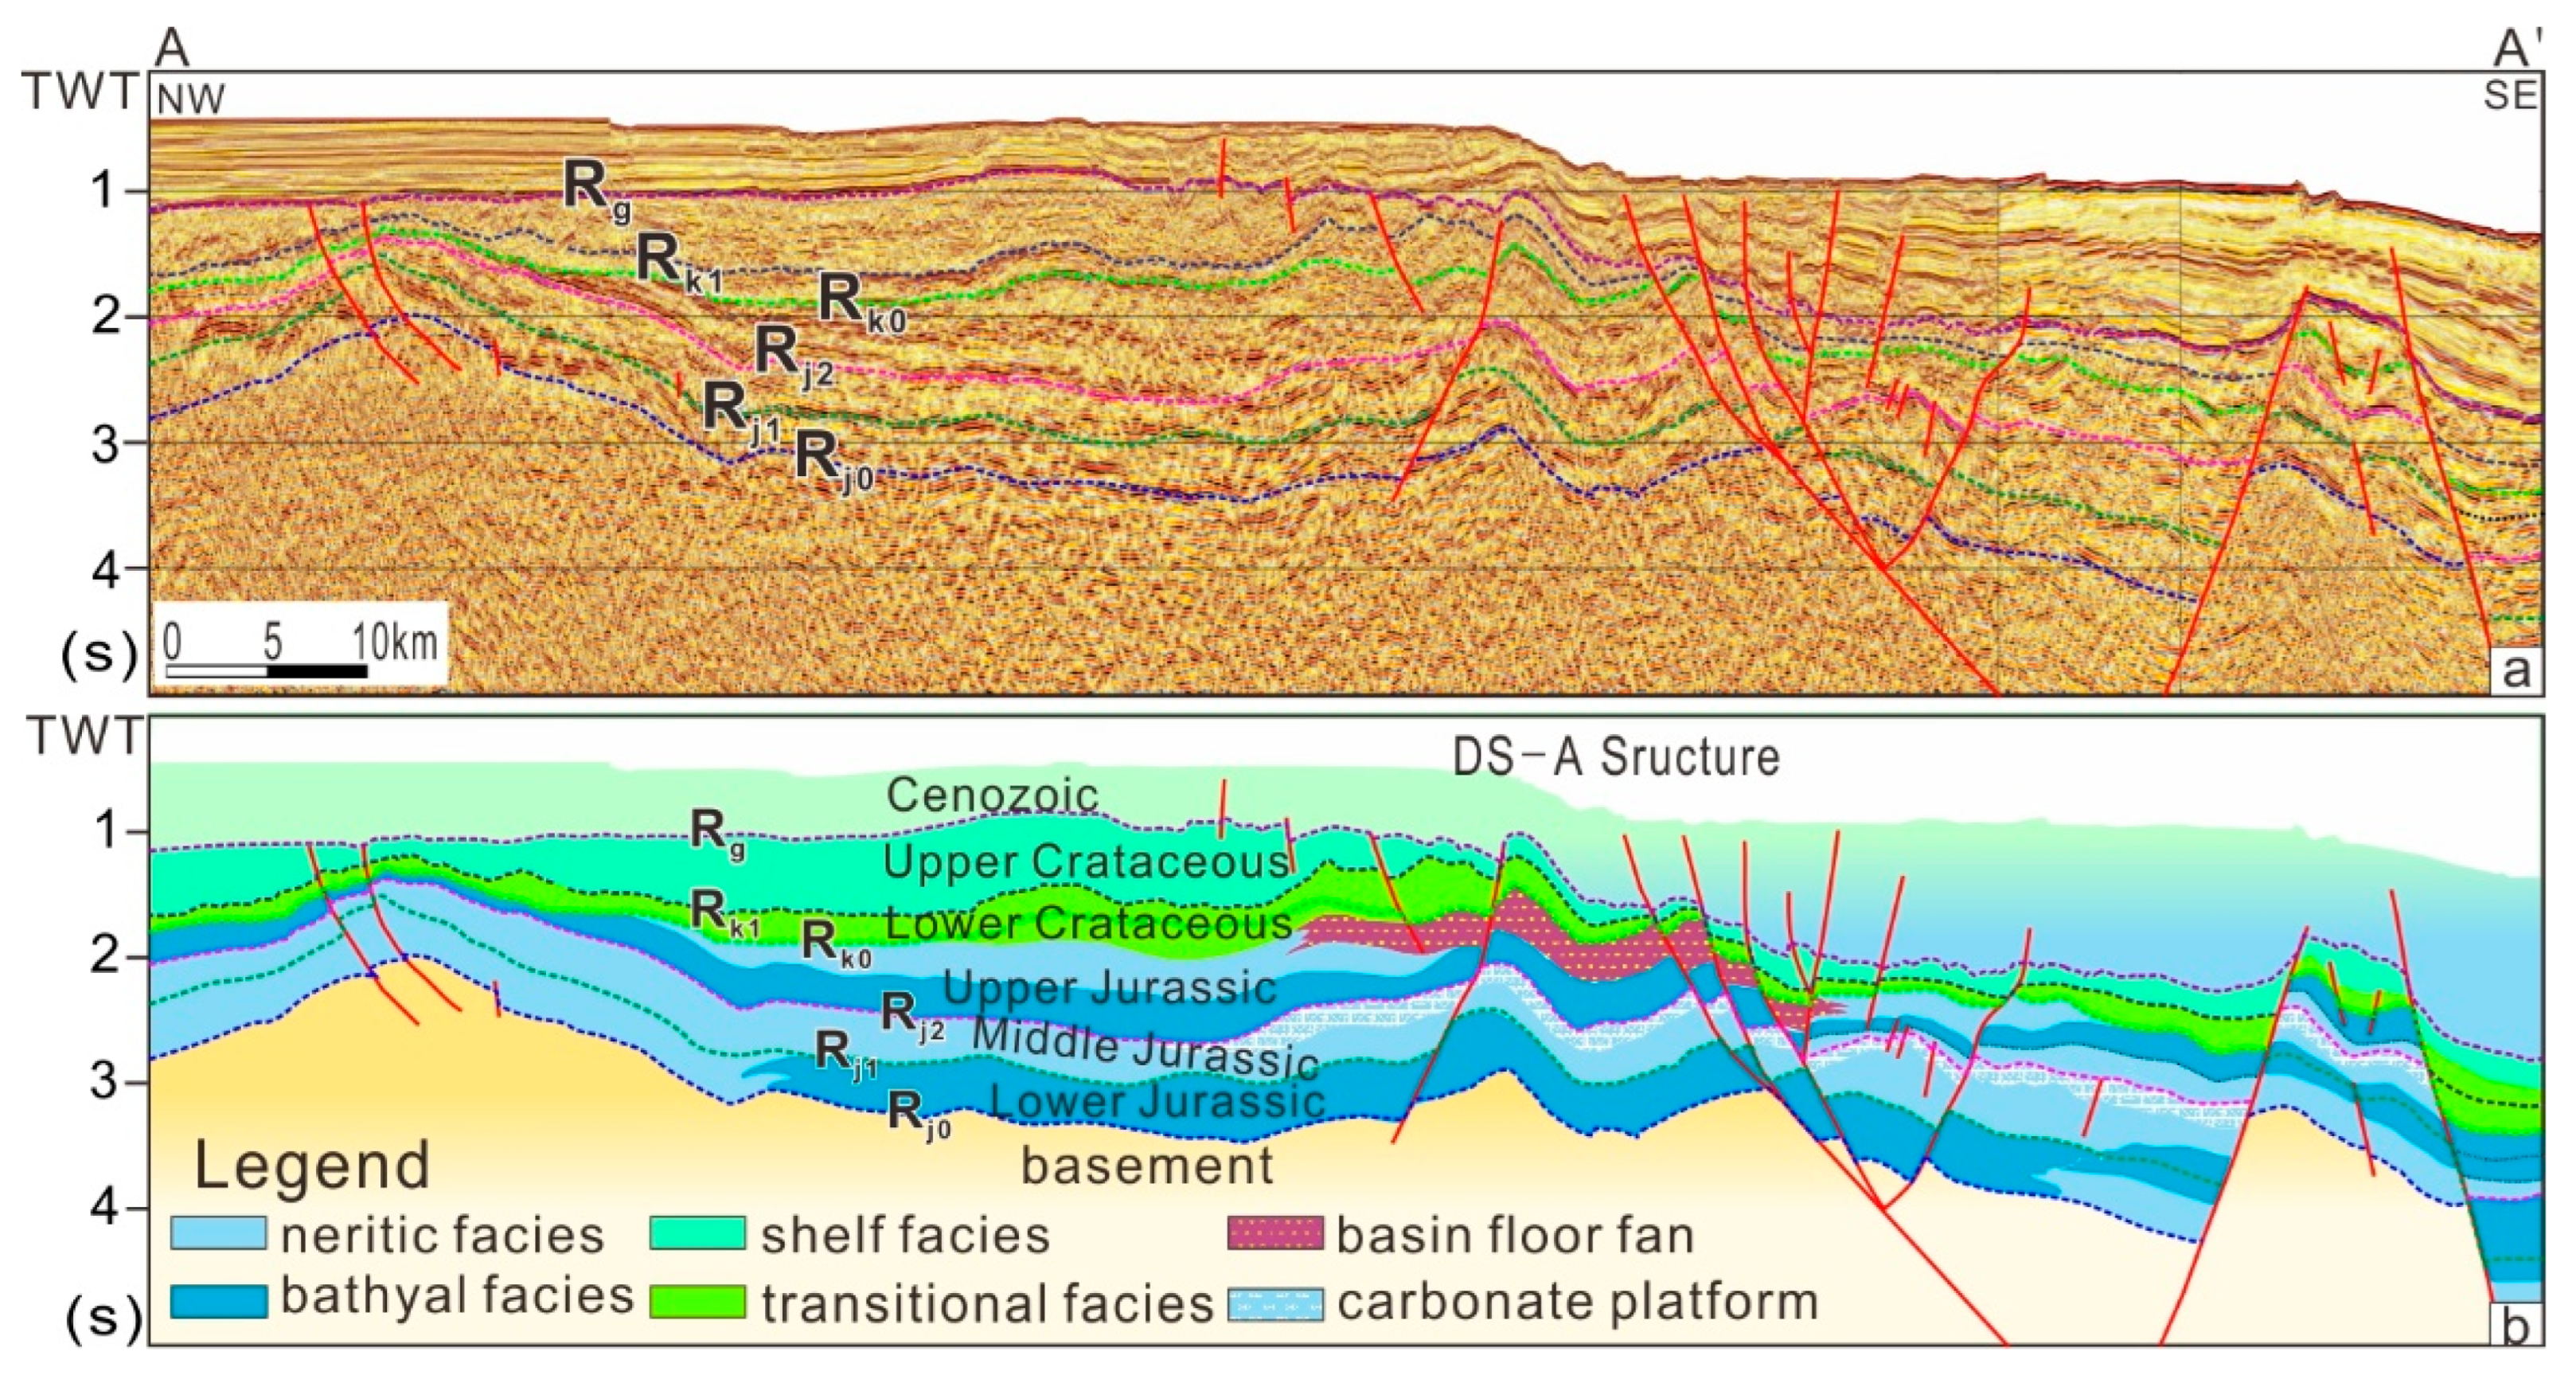
2. Geological Setting

The Dongsha Sea is an area in the northeast of the South China Sea comprising of thick Mesozoic strata, and the Chaoshan Depression is the largest residual depression in the area (Figure 1). The depression has undergone six stages of tectonic evolution in the Mesozoic and Cenozoic eras: (1) In the late Triassic rifting period, semi enclosed bay began to develop in the Mesozoic basin in the northeast of South China Sea; (2) During the Jurassic depression period, the largest scale transgression occurred, and the basin expanded to its maximum extent; (3) In the Late Jurassic tectonic uplift period, compaction fold and structural unconformity occurred under compression; (4) In the Early Cretaceous re-subsidence period, volcanic debris, lava flows, and continental margin debris began to rapidly fill and deposit in the basin; (5) In the Late Cretaceous tectonic inversion period, under the influence of four episodes of the Yanshan movement, the Chaoshan Depression was uplifted and denuded again, forming the second regional unconformity; and (6) In the Neogene regional thermal subsidence period, the central basin of the South China Sea reached its peak of expansion during the Miocene, and the Cenozoic basins in the northern continental margin of the South China Sea successively entered a stage of post-rift depression evolution; large-scale transgression also occurred, mainly accepting coastal and shallow marine deposits [33,34,35,36,37,38]. The DS-A structure is located in the M-low bulge and is a fault anticline structure (Figure 1), controlled by NE-, NNE-, and NW-trending faults.
The 1005–1369 m interval of LF35-1-1 is a Cretaceous sandstone mudstone interval and the 1369–1698 m interval contains Cretaceous tuff. The 1698–2412 m interval is Jurassic sandstone and mudstone, in which the 1698–1940 m interval is grayish-black laminated mudstone and argillaceous siltstone mixed with siliceous rock, containing a small amount of micrite limestone and pyroclastic materials. The 1940–2412 m interval is grayish-black laminated mudstone and argillaceous siltstone mixed with sandstone and limestone. The mudstone is rich in organic debris. Radiolarian fossils were found in the 1716 m to 1839 m interval, indicating a deep-water environment, dating back to the late Jurassic. Fossils of benthic foraminifera were found in the 2049–2112 m interval, indicating a shallow tropical marine environment. Spore and pollen fossils can be found in the 2187 m to 2268 m interval, mainly consisting of a combination of Carassous pollen and Alsophila spinulosa spores. This set of spore and pollen fossils appeared in the Middle and Upper Jurassic period of southern China, indicating a coastal swamp environment [1]. A granite granodiorite intrusion with a small amount of diorite appears in the well interval below 2412 m, and its invasion period is mainly in the Late Cretaceous.
Well LF35-1-1 reveals two source rock strata in the 1940–2022 m interval and the 2100–2412 m interval, wherein the 1940–2022 m rock is poor-to-medium source, and the 2100–2400 m rock is medium-to-good source. The organic matter of these two source rocks is mainly of type III and a small amount of type II2, which are stable in a considerable range. The minimum thickness of a single layer of source rock is 6 m, the maximum thickness is >40 m, and the average thickness is about 20 m. The average thickness of the single layer of the lower source rock is greater than the upper layer. The results of well seismic tracking and further research and comparisons of regional geology show that there are two sets of source rock developed in the Chaoshan Depression, including the upper Triassic–lower Jurassic shallow sea bathyal mudstone and lower Jurassic shallow sea shelf facies mudstone. According to the drilling strata of well LF35-1-1 and seismic data, there are two sets of reservoirs developed in the DS-A structure in the Upper and Middle Jurassic series, respectively. Among them, the top of the Middle Jurassic series is a set of stable shallow sea shelf facies reef limestone with thickness, while the Upper Jurassic is a set of basin floor fan sandstones (Figure 2).

3. Sampling and Methods

The samples used are sourced from the petroleum surveys of 200 stations collected by the Guangzhou Marine Geological Survey in the Dongsha Sea Area in recent years (Figure 1). Sampling grid points with a size of 8 km × 16 km are mainly distributed in the Chaoshan Depression. Samples at some grid points could not be collected due to the presence of submarine cables. Moreover, due to the large number of submarine optical cables in this area, sampling is limited by cable protection requirements, making it impossible to conduct encrypted investigations and detailed target investigations. The samples were collected using an open barrel gravity corer, with a length of 1.3 m. Sediment samples were taken at a depth of 85 cm–100 cm from the top of the columnar sample, acid extraction was performed on the hydrocarbon content, and δ13C (‰) testing and analysis was performed as well.
Acid-extraction hydrocarbon testing was performed as follows: under vacuum conditions and constant temperature, the hydrocarbons (mainly adsorbed hydrocarbons) present in the carbonate mineral lattice and its cement in the sample were separated by means of pressure reduction, heating, and chemical treatment (acid addition). The content of acid-extracted hydrocarbons was detected using a gas chromatography instrument.
Before formally measuring the test material, the standard gas was measured 3–5 times. Only when the relative error of the standard gas measurement was ≤3% could the test material be measured. During the measurement process, it was necessary to regularly check the controlled status of the instrument with standard gas.
The procedure for GC testing is as follows: First, 500 μL ± 0.5 μL of gas was accurately extracted using a 1 mL syringe. The gas was quickly injected into the gas chromatograph. The measuring instrument was then started, chromatograph charts were drawn, and the data were collected. After the chromatographic peak was reached and the recombination components were “driven” at high temperature according to the set temperature program, qualitative and quantitative analysis was conducted.
Result Calculation: Response factor calculation: F i = C si · V s / A s i
Fi—Response factor of component i, μL/(mV•s);
Csi—concentration of standard gas component i, φ (i)/10−2;
Vs—Standard gas injection volume, μL;
Asi—Peak area of component i in standard gas, mV•s.
Calculation of component content in the sample: X i = F i · V t · A i m · V j
Xi—The content of acid-hydrolyzed hydrocarbon component i in the sample (if the integer number is less than 3, retain 1 decimal place; if the integer number is ≥3, do not retain decimals), μL/kg;
Vt—degassing volume, mL;
Ai—peak area of acid-hydrolyzed hydrocarbon component i in the test sample, mV•s;
Vj—Injection volume of test sample, mL; and
M—Weighing mass of the sample, kg.
The analysis and data-processing methods include probability distribution statistics, data structure analysis (where the mean represents the average level of the data, the standard deviation represents the size of data dispersion, and the coefficient of variation represents the size of data relative fluctuations), and background value and anomaly determination (via the mean method and Kriging method). The results of comprehensive analysis of the acid-extracted hydrocarbon and methane carbon isotope test data are then used to determine the underlying oil and gas attributes [39,40,41,42,43].

4. Results

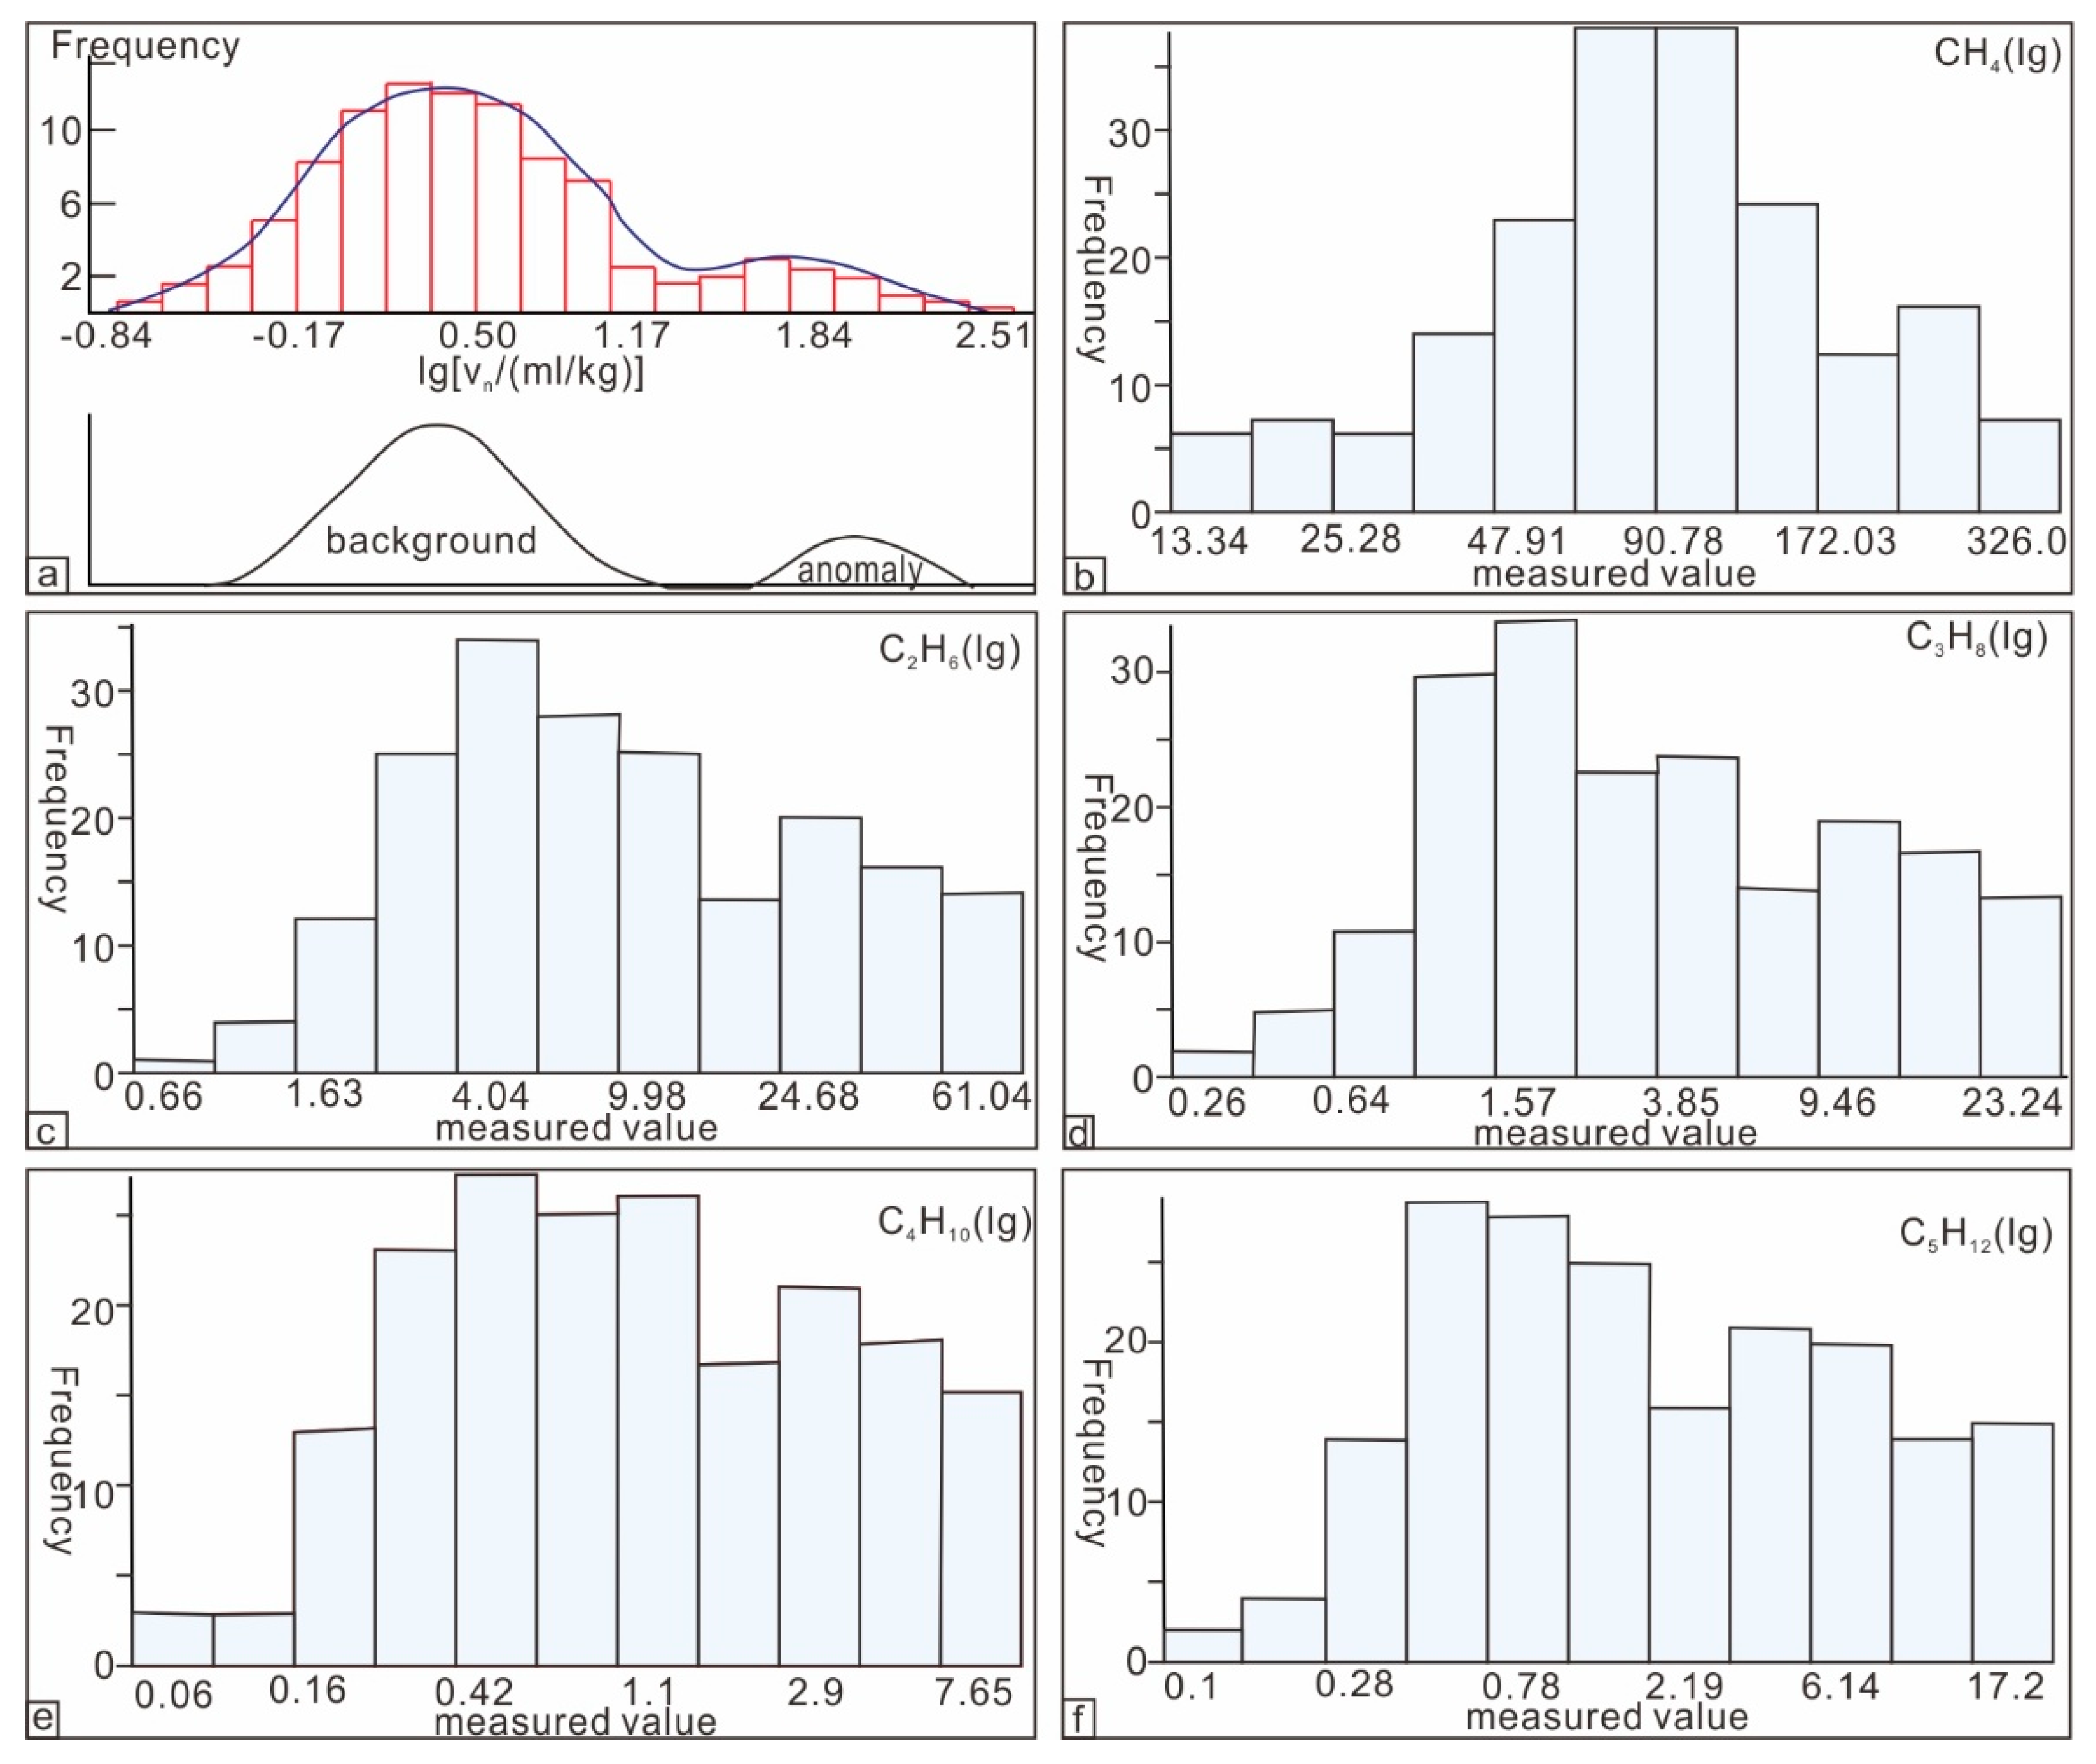
4.1. Acid-Extracted Hydrocarbon Composition

Acid-extracted C1–C5 hydrocarbons were detected in the samples, with methane (CH4), ethane (C2H6), and propane (C3H8) being the main components. The content of butane- and pentane-series hydrocarbons was extremely low, especially for pentane, with only a few samples being detected. The acid-extracted hydrocarbon index of the samples at each station had the characteristic of CH4 > C2H6 > C3H8. The variation in methane content in the acid-extracted hydrocarbons ranged from 13.34~1799.31 μL/kg, with an average value of 138.25 μL/kg and a median value of 94.01 μL/kg. The variation in ethane content in the acid-extracted hydrocarbons ranged from 0.66~195.26 μL/kg, with an average value of 21.61 μL/kg and a median value of 9.54 μL/kg, which was significantly lower than the content of methane. The variation in propane content in the acid-extracted hydrocarbons ranged from 0.26~80.60 μL/kg, with an average value of 8.17 μL/kg and a median value of 3.57 μL/kg. Detailed data are presented in Table 1.

4.2. Acid-Extracted Hydrocarbon Distribution

The high values of methane in the acid-extracted hydrocarbons are mainly distributed in the northern part of the study area; other high values are distributed in the central–southern part of the study area. The high values of heavy hydrocarbons in the acid-extracted hydrocarbons are also mainly distributed in the northern part of the study area, and secondary high values are mainly distributed in the central–southern part of the study area. The anomalies in the acid-extracted methane and heavy hydrocarbons have high positive correlation (Figure 3 and Figure 4).

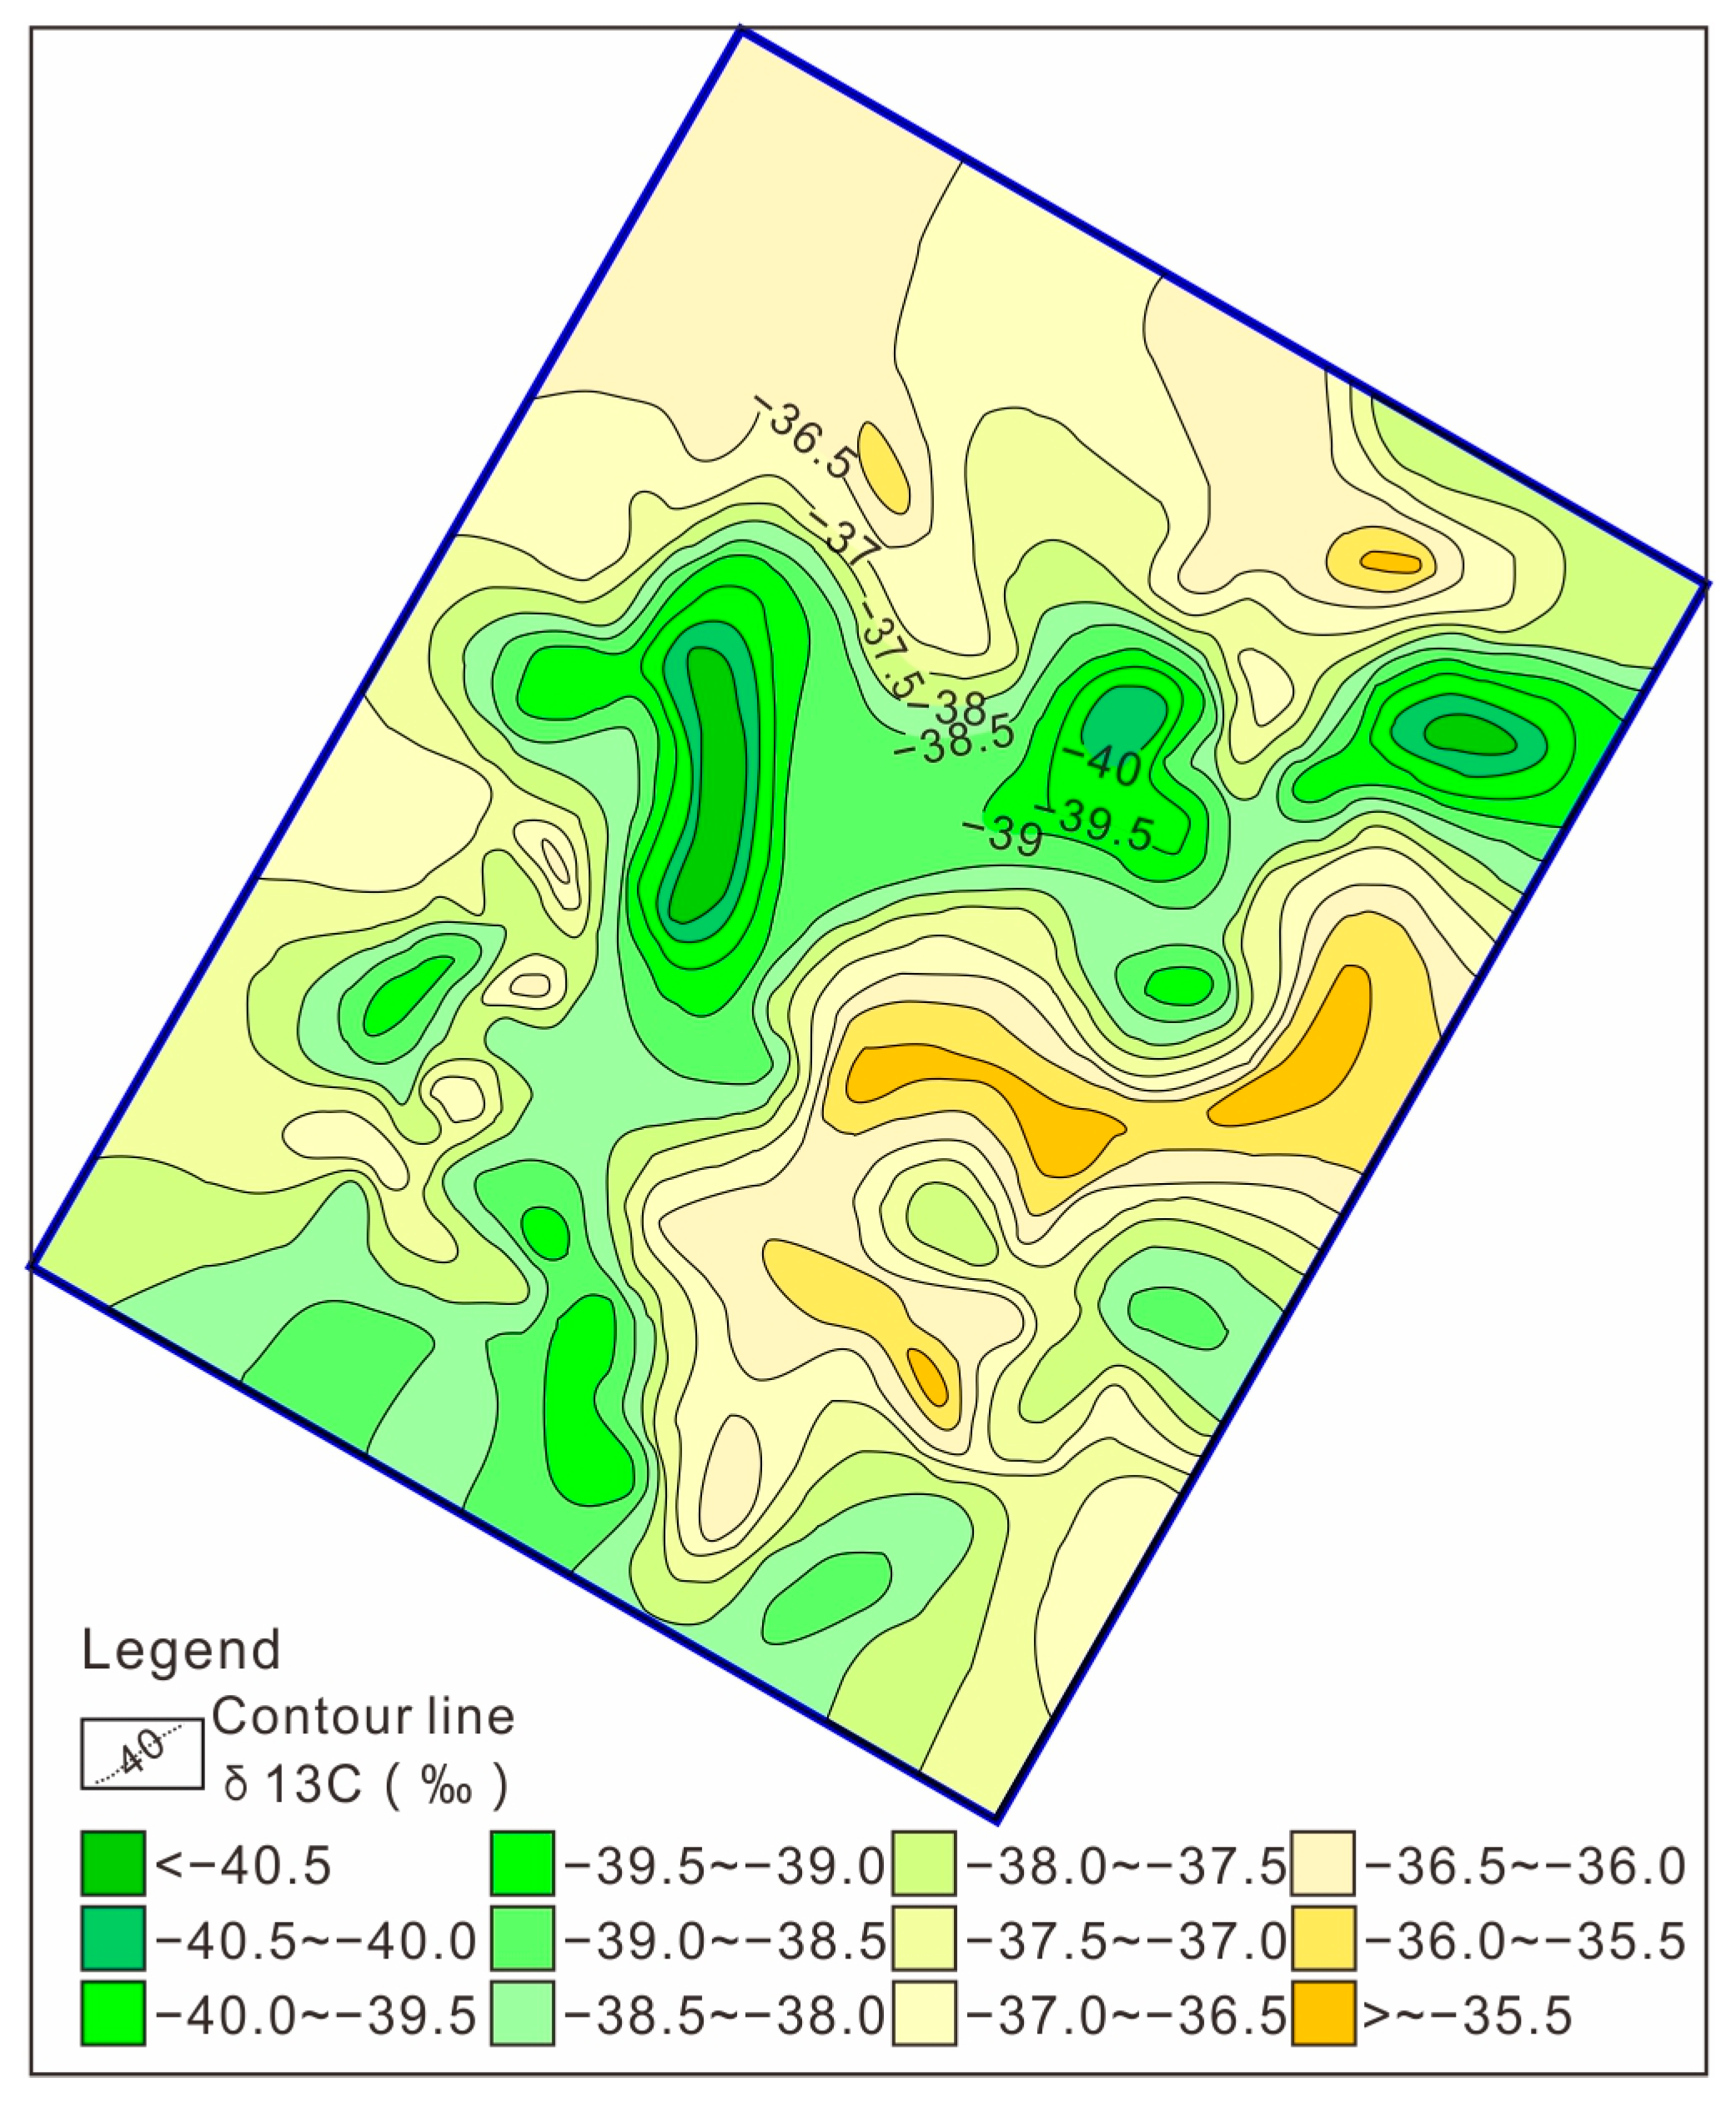
4.3. δ 13C (‰) of Acid-Extracted Hydrocarbon Methane

The variation in δ13C (‰) content in the acid-extracted hydrocarbons ranged from −34‰~−48‰, with a maximum value of −34.45‰, a minimum value of −47.11‰, a median value of −37.5‰, and a standard deviation of 2.48. The distribution is characterized by a high north–south distribution and low middle distribution (Figure 5).

5. Discussion

5.1. Variations in Acid-Extracted Hydrocarbon Abundance

From the perspective of data statistics, the mean reflects the average level of the data, the standard deviation (SD) reflects the size of the data dispersion, and the coefficient of variation (CV) reflects the size of the relative fluctuations in the data. From a geological perspective, the coefficient of variation and intensity (K) reflects the impact of later geological processes. The coefficient of variation is calculated as the standard deviation/mean and the intensity coefficient as the mean/median. The coefficients of variation of the indicators of geochemical exploration in the Chaoshan Depression are all greater than 1, and the intensity factors of later superimposed actions are all greater than 2, indicating that the geochemical exploration indicators in the region are greatly affected by later geological processes. More details are presented in Table 1.
The acid-extracted hydrocarbons of the Chaoshan Depression belong to the medium-abundance geochemical background and are characterized by heterogeneous fields and homogeneous fields [44,45]. Altered carbonates belong to a medium abundance geochemical background and possess homogeneous field characteristics. The interference of seabed microbial disturbances and biogenic methane on indicators of oil and gas geochemical exploration is relatively small [45], and all geochemical exploration indicators are affected by later oil and gas interactions.

5.2. Acid-Extracted Hydrocarbon Structural Indicators

Under normal circumstances, the sample data of a single parent obey a normal distribution; however, when multiple parent characteristics are present, the data structure characteristics, for the most part, do not obey a normal distribution. The ideal separation mode between the background and an anomaly is shown in Figure 6a, which features a trailing phenomenon.
Figure 6b–f show the results of the iteration analysis of the main indicators of oil and gas geochemical exploration in the Dongsha area. The iteration results of each indicator have similar non-normal distribution characteristics, and all indicators have tailing phenomenon or multiple parent backgrounds, suggesting the effect of late superposition. Moreover, the intensity factors of the later superimposed actions are all greater than 1, indicating that all the indicators are affected by the geological factors of the later stage (oil–gas, sediment sources, environment, etc.).

5.3. The Fabric Characteristics of Hydrocarbons

The composition of adsorbed gas near the surface has a favorable tracing effect for distinguishing oil and gas properties and indicating the presence of gas reservoirs. The ratio of gas components in the hydrocarbons, such as C1/∑C, C1/C2, C3/C1, reflect this differentiation effect. The range of variation in the composition and characteristics of the hydrocarbon series indicators in the sediments above petroleum reservoirs are shown in Table 2.
The C1/∑C × 100 ratio ranges from 51.55 to 97.06, with an average of 78.43; C1/C2 ranges from 2.66 to 52.71, with a mean of 10.58; and (C3/C1) × 1000 ranges from 5.65 to 163.88, with an average of 55.36. Based on the characteristics of the hydrocarbon ratio, the petroleum reservoirs in the Chaoshan Depression are determined to be mainly composed of gas (Figure 7, Figure 8 and Figure 9).

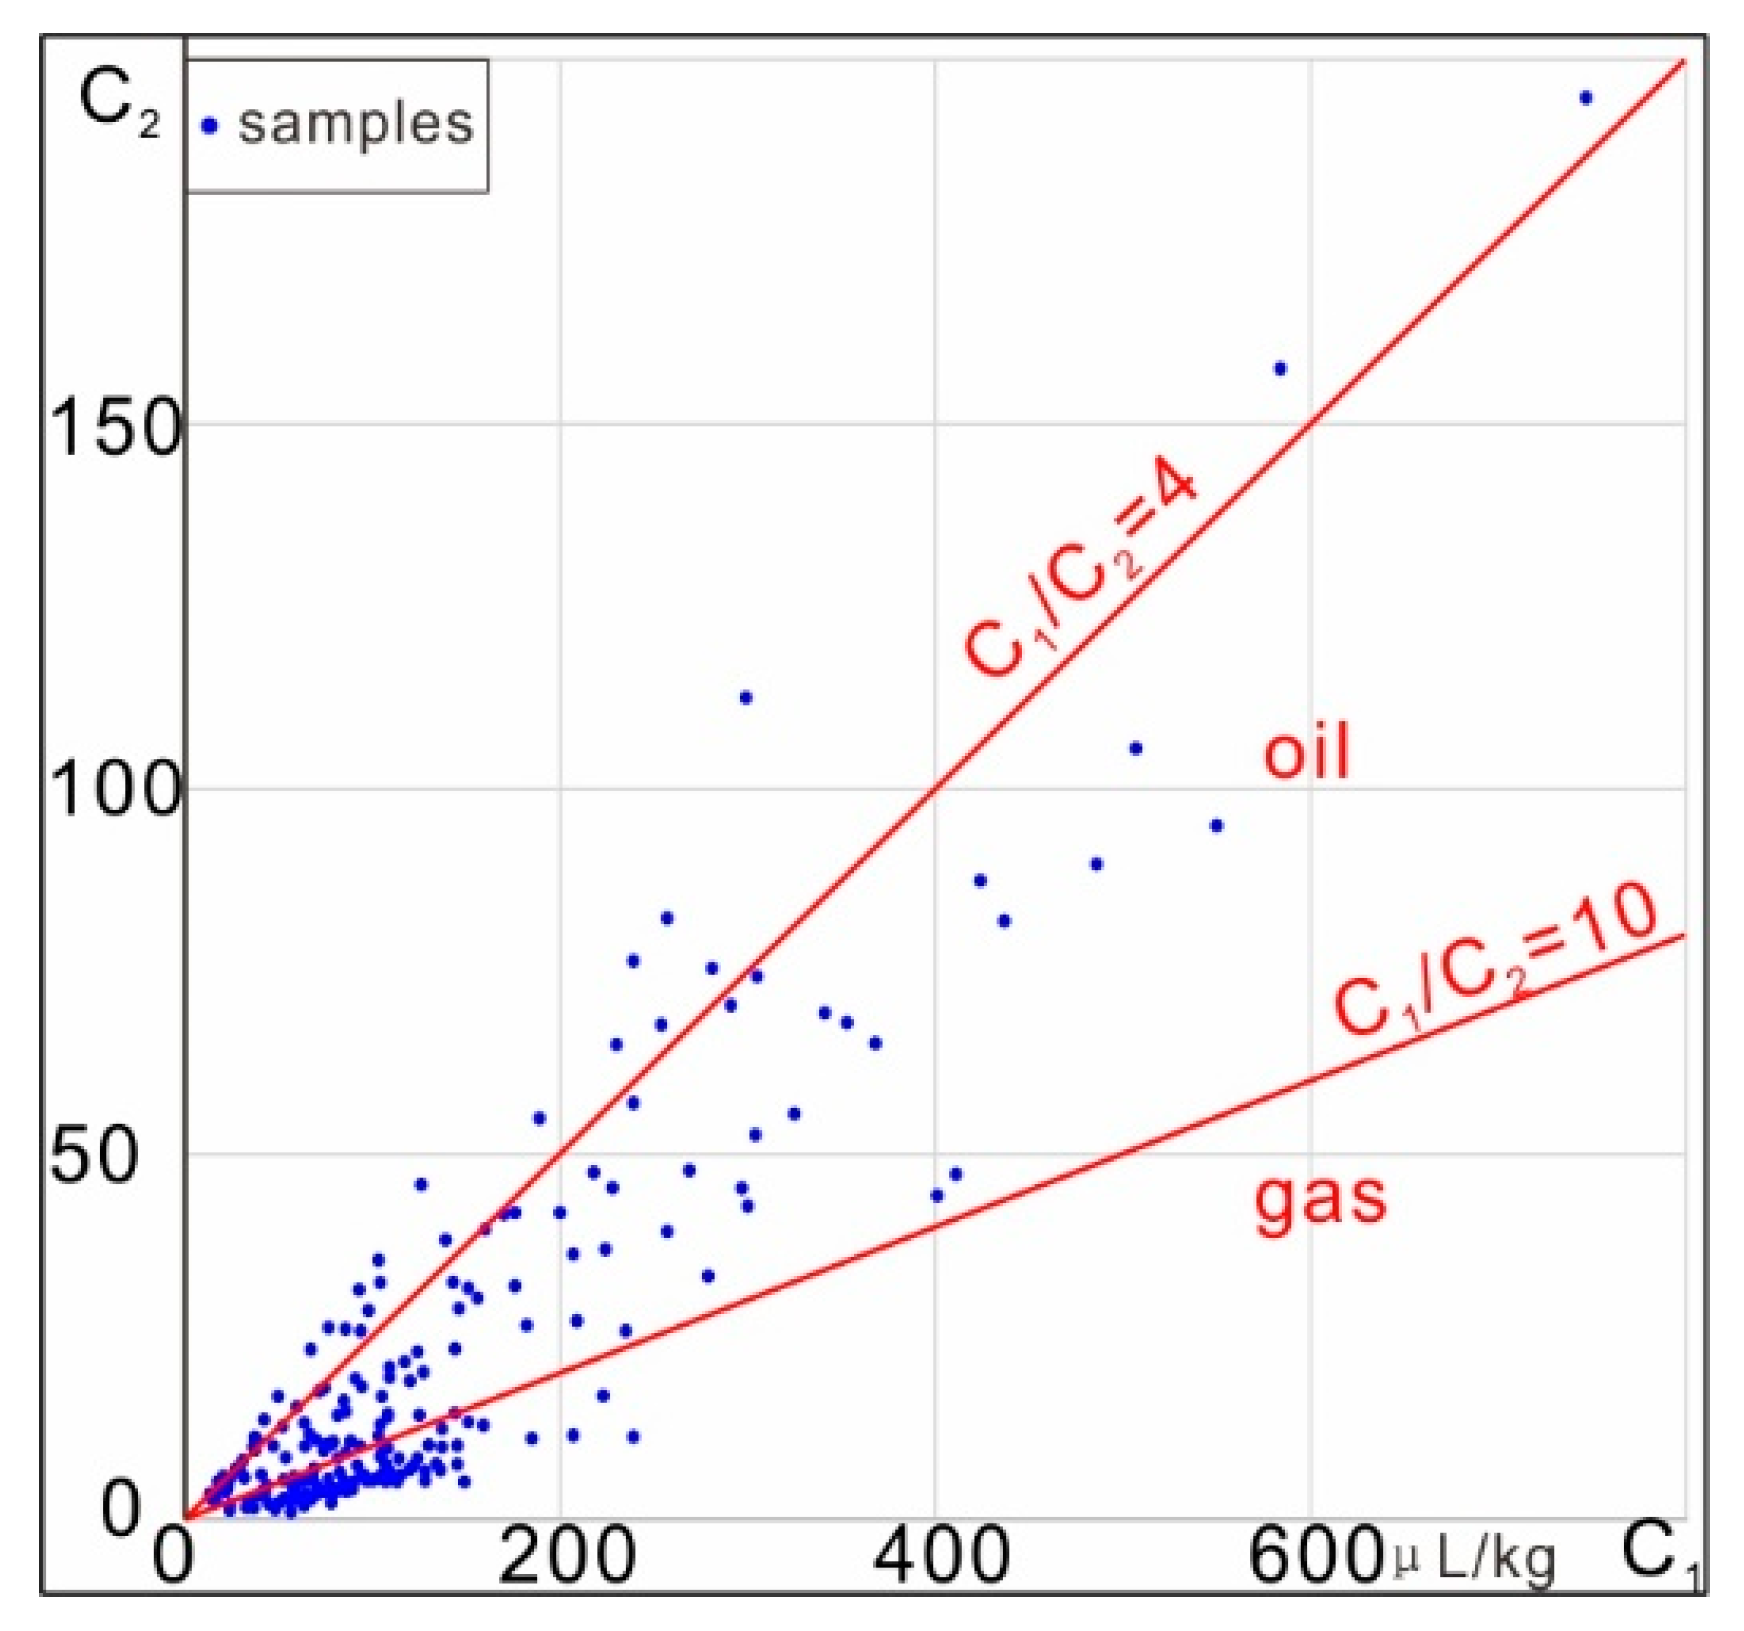
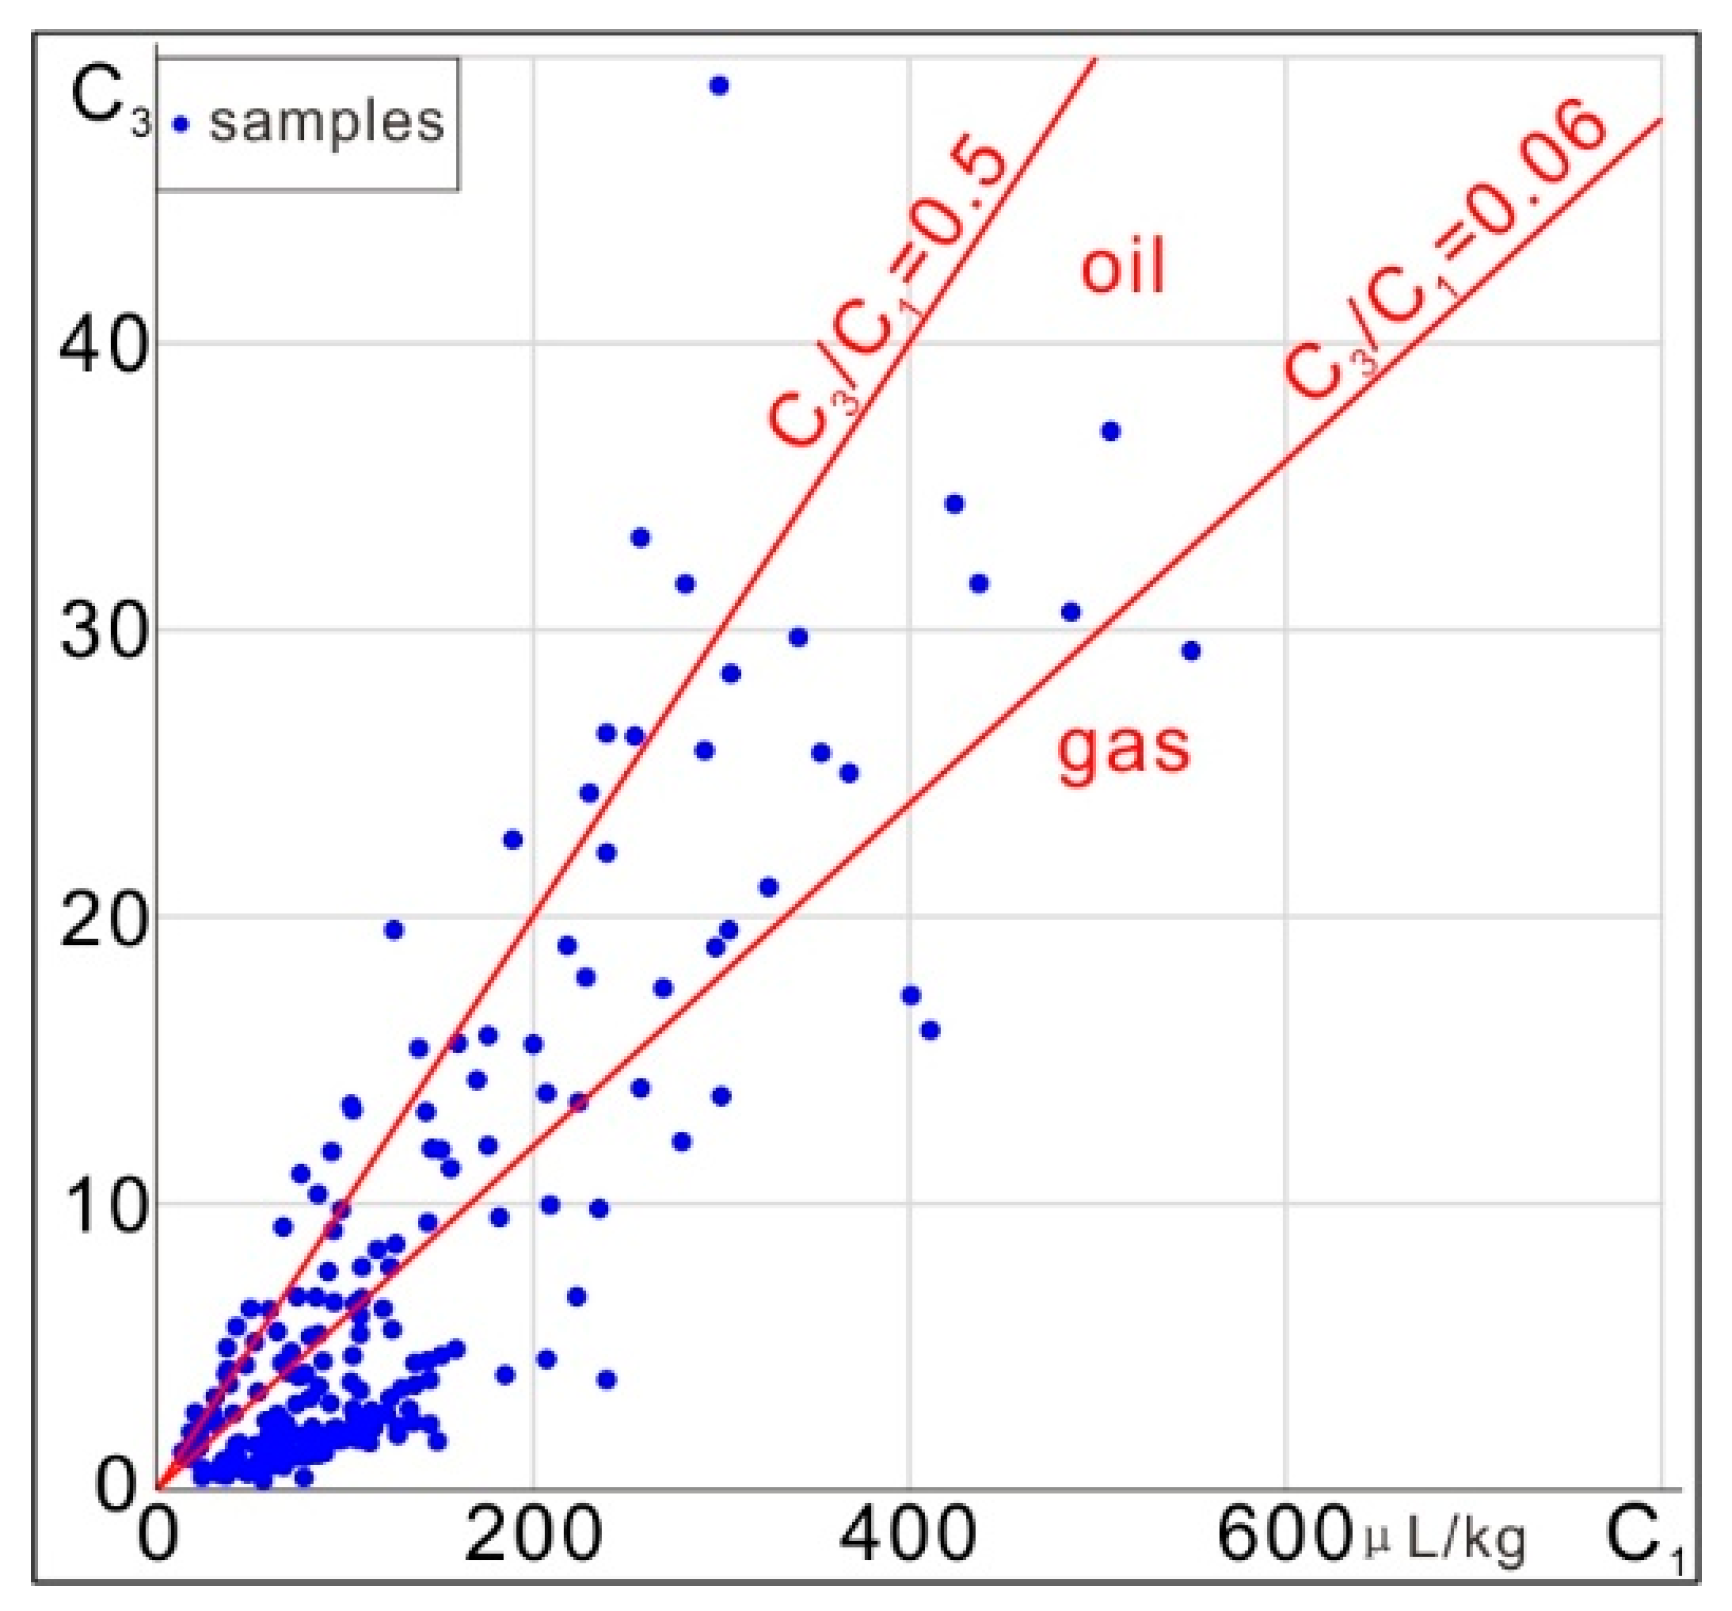
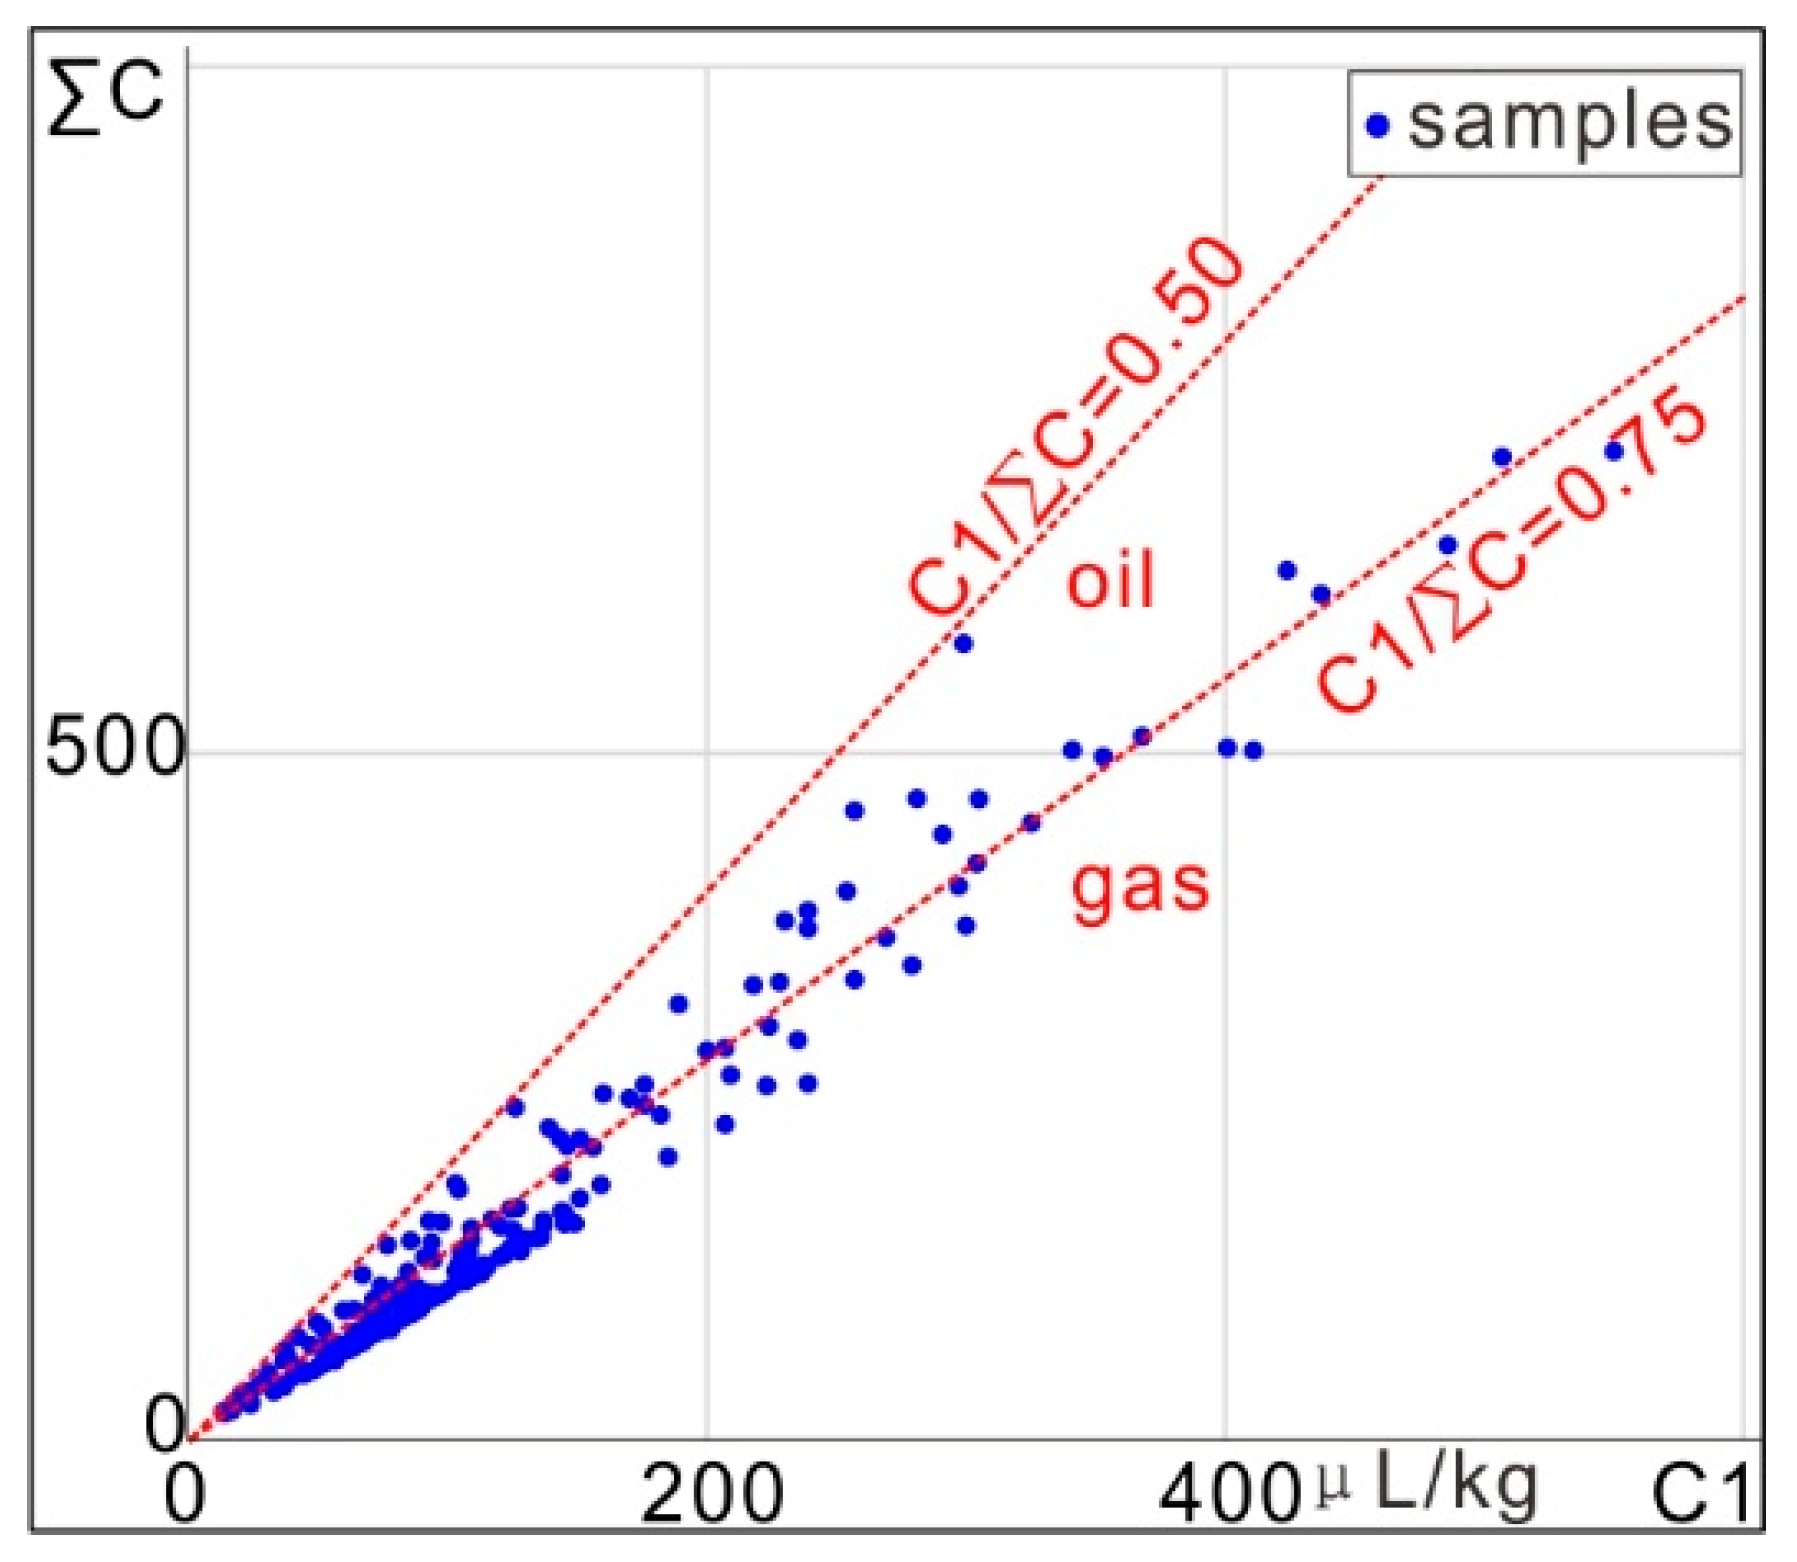
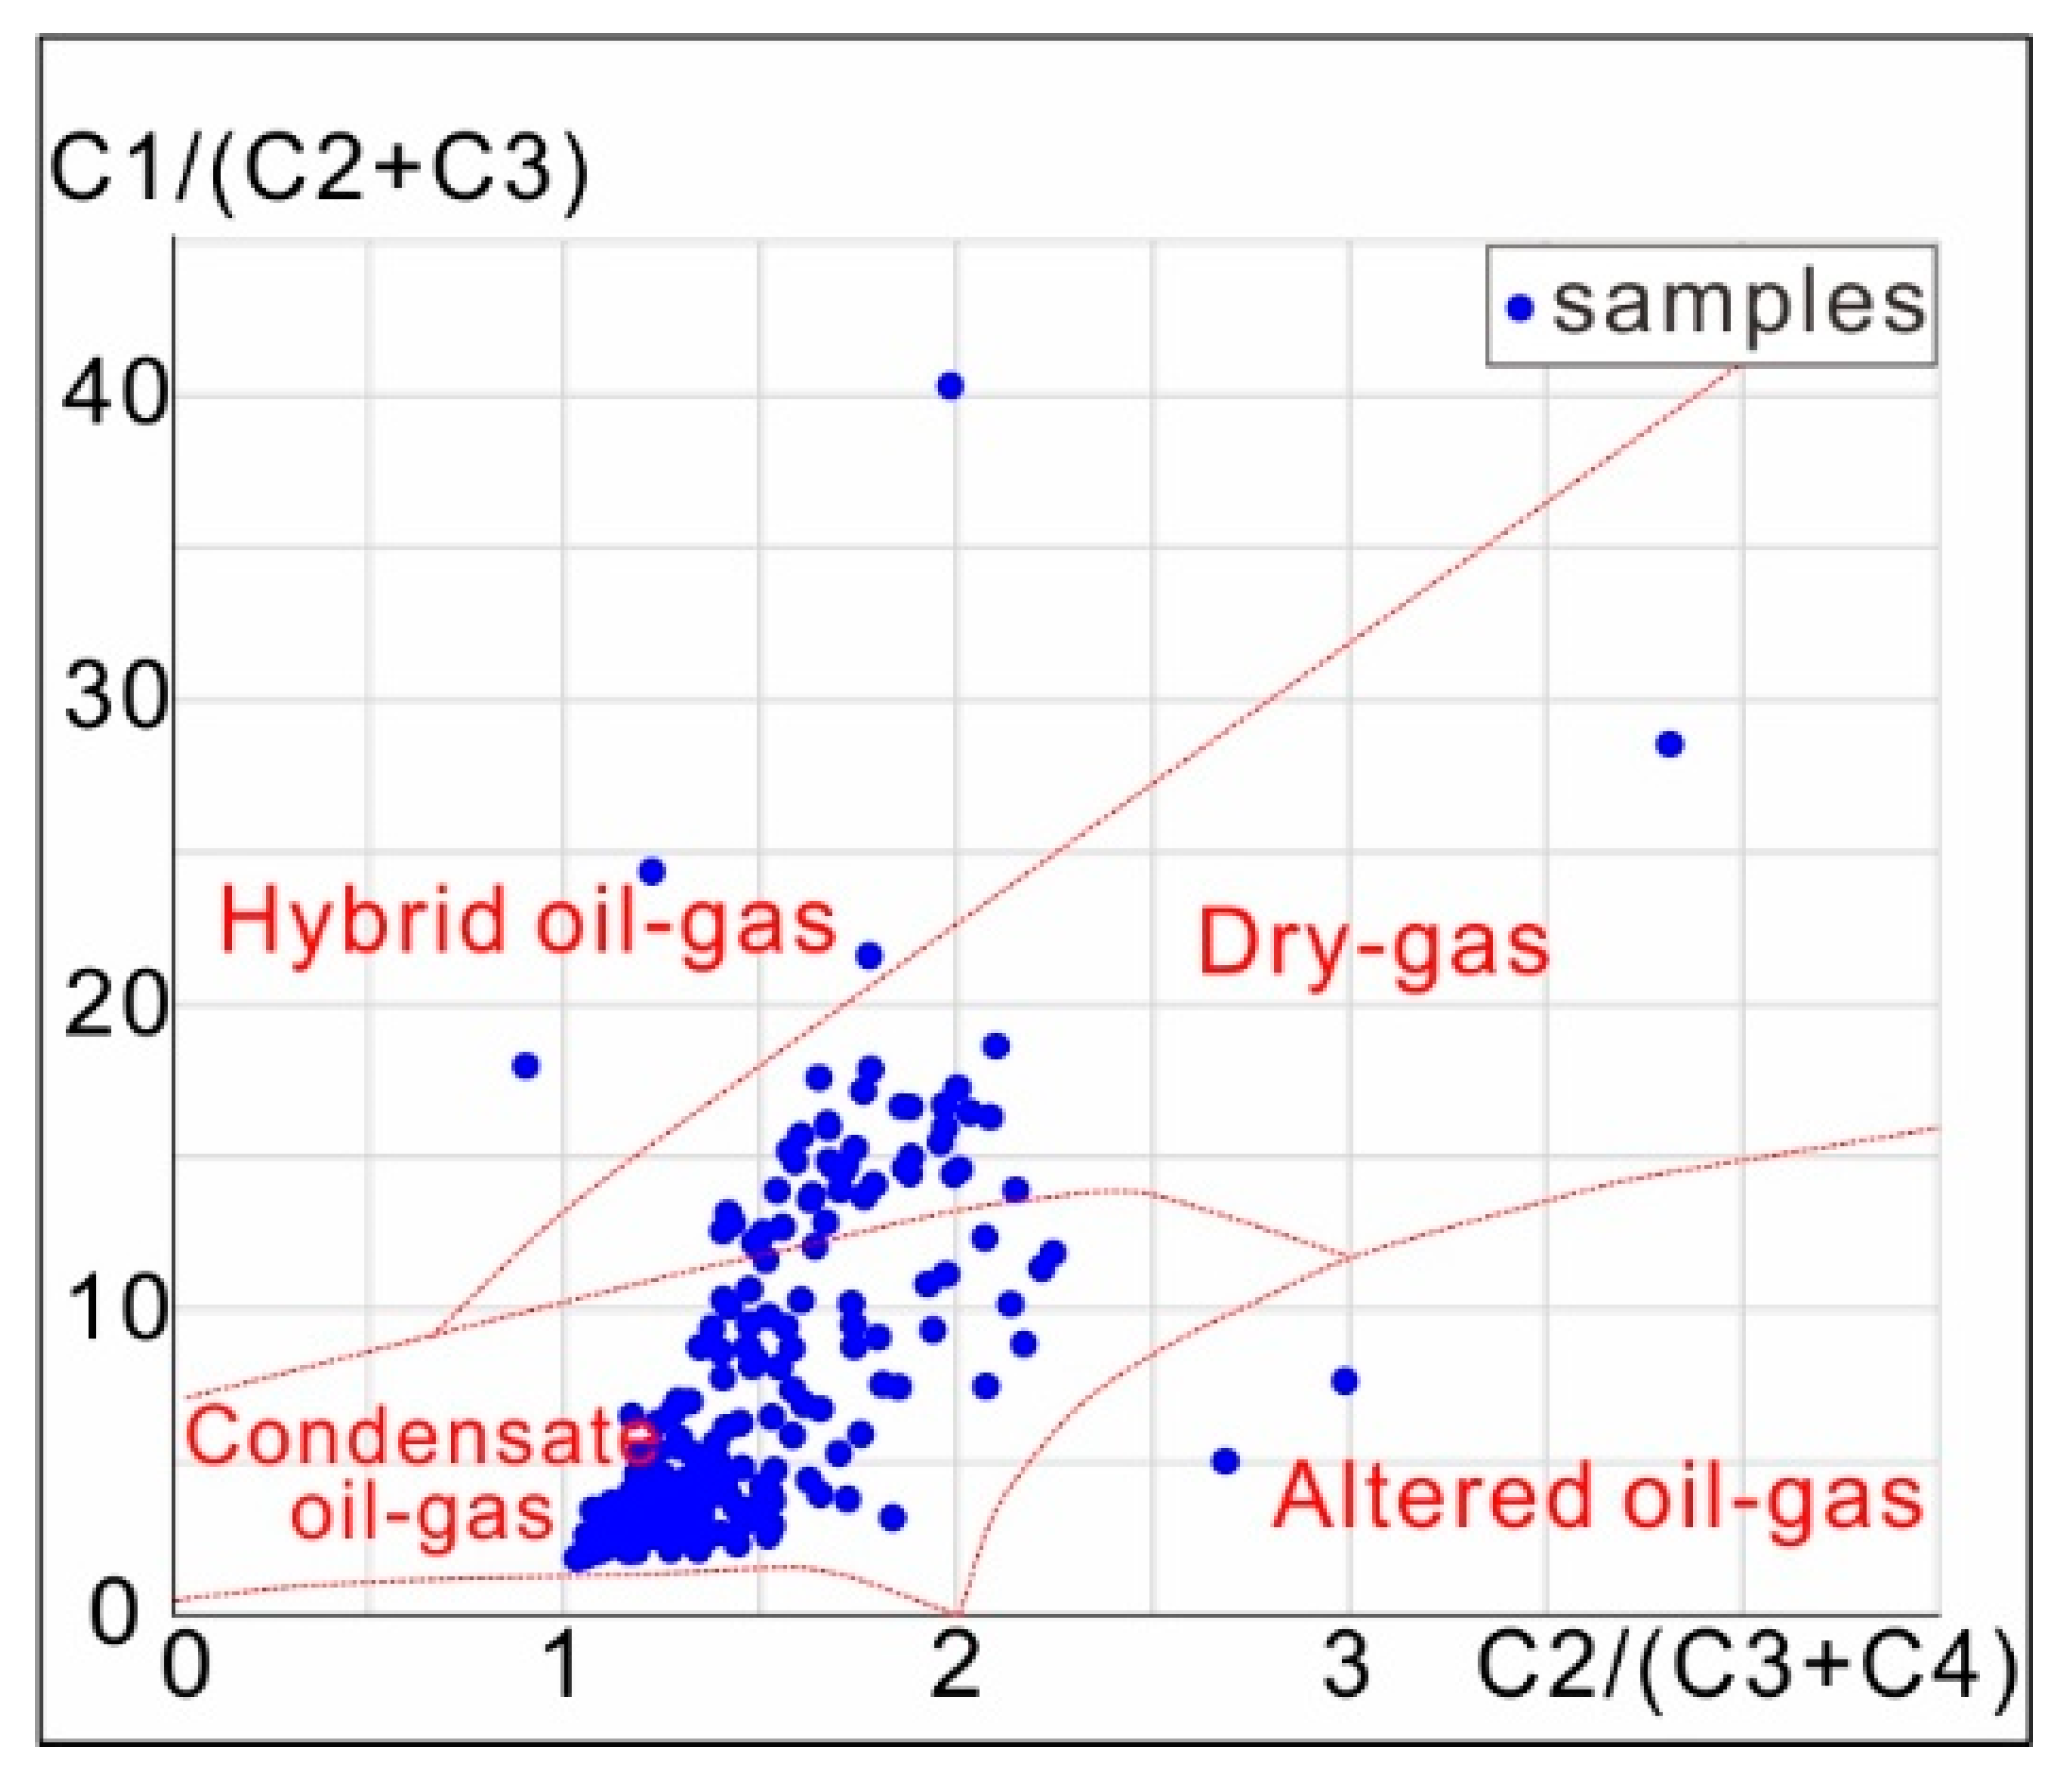
5.4. Differentiation Characteristics of Hydrocarbon

Due to the differences in the chemical and physical properties of oil and natural gas, the differentiation of hydrocarbons occurs during the micro-leakage of gas into seafloor sediments, changing the proportion and dynamic balance of the original hydrocarbons and forming significant differences between oil, gas, and non-oil-and-gas zones in seafloor sediments. As shown in the differentiation diagram of heavy and light hydrocarbons (Figure 10), 198 sites out of 200 have C2 + C5/C1 ratios greater than 5%, thus belonging to wet gas.
The C1–C4 ratio represents the content of methane to butane (nC4 + iC4) in the acid-extracted hydrocarbons adsorbed from the underlying oil- and gas-bearing structures that leak into the seafloor sediments. The C1/(C2 + C3) ratio represents the degree of evolution (or maturity) of the hydrocarbon-generating organic matter. As the maturity increases, this value increases exponentially, indicating a gradual transition from source rock to crude oil, to condensate oil and gas, and to dry gas in the underlying strata. The C2/(C3 + C4) ratio reflects the interrelationships between heavy components in the acid-extracted light hydrocarbons, and to some extent, it can also reflect the degree of evolution of the hydrocarbon-generating parent materials. The ratio of C1/(C2 + C3) to C2/(C3 + C4) can be used to identify the types of oil and gas reservoir from which of the acid-extracted adsorbed hydrocarbons originate.

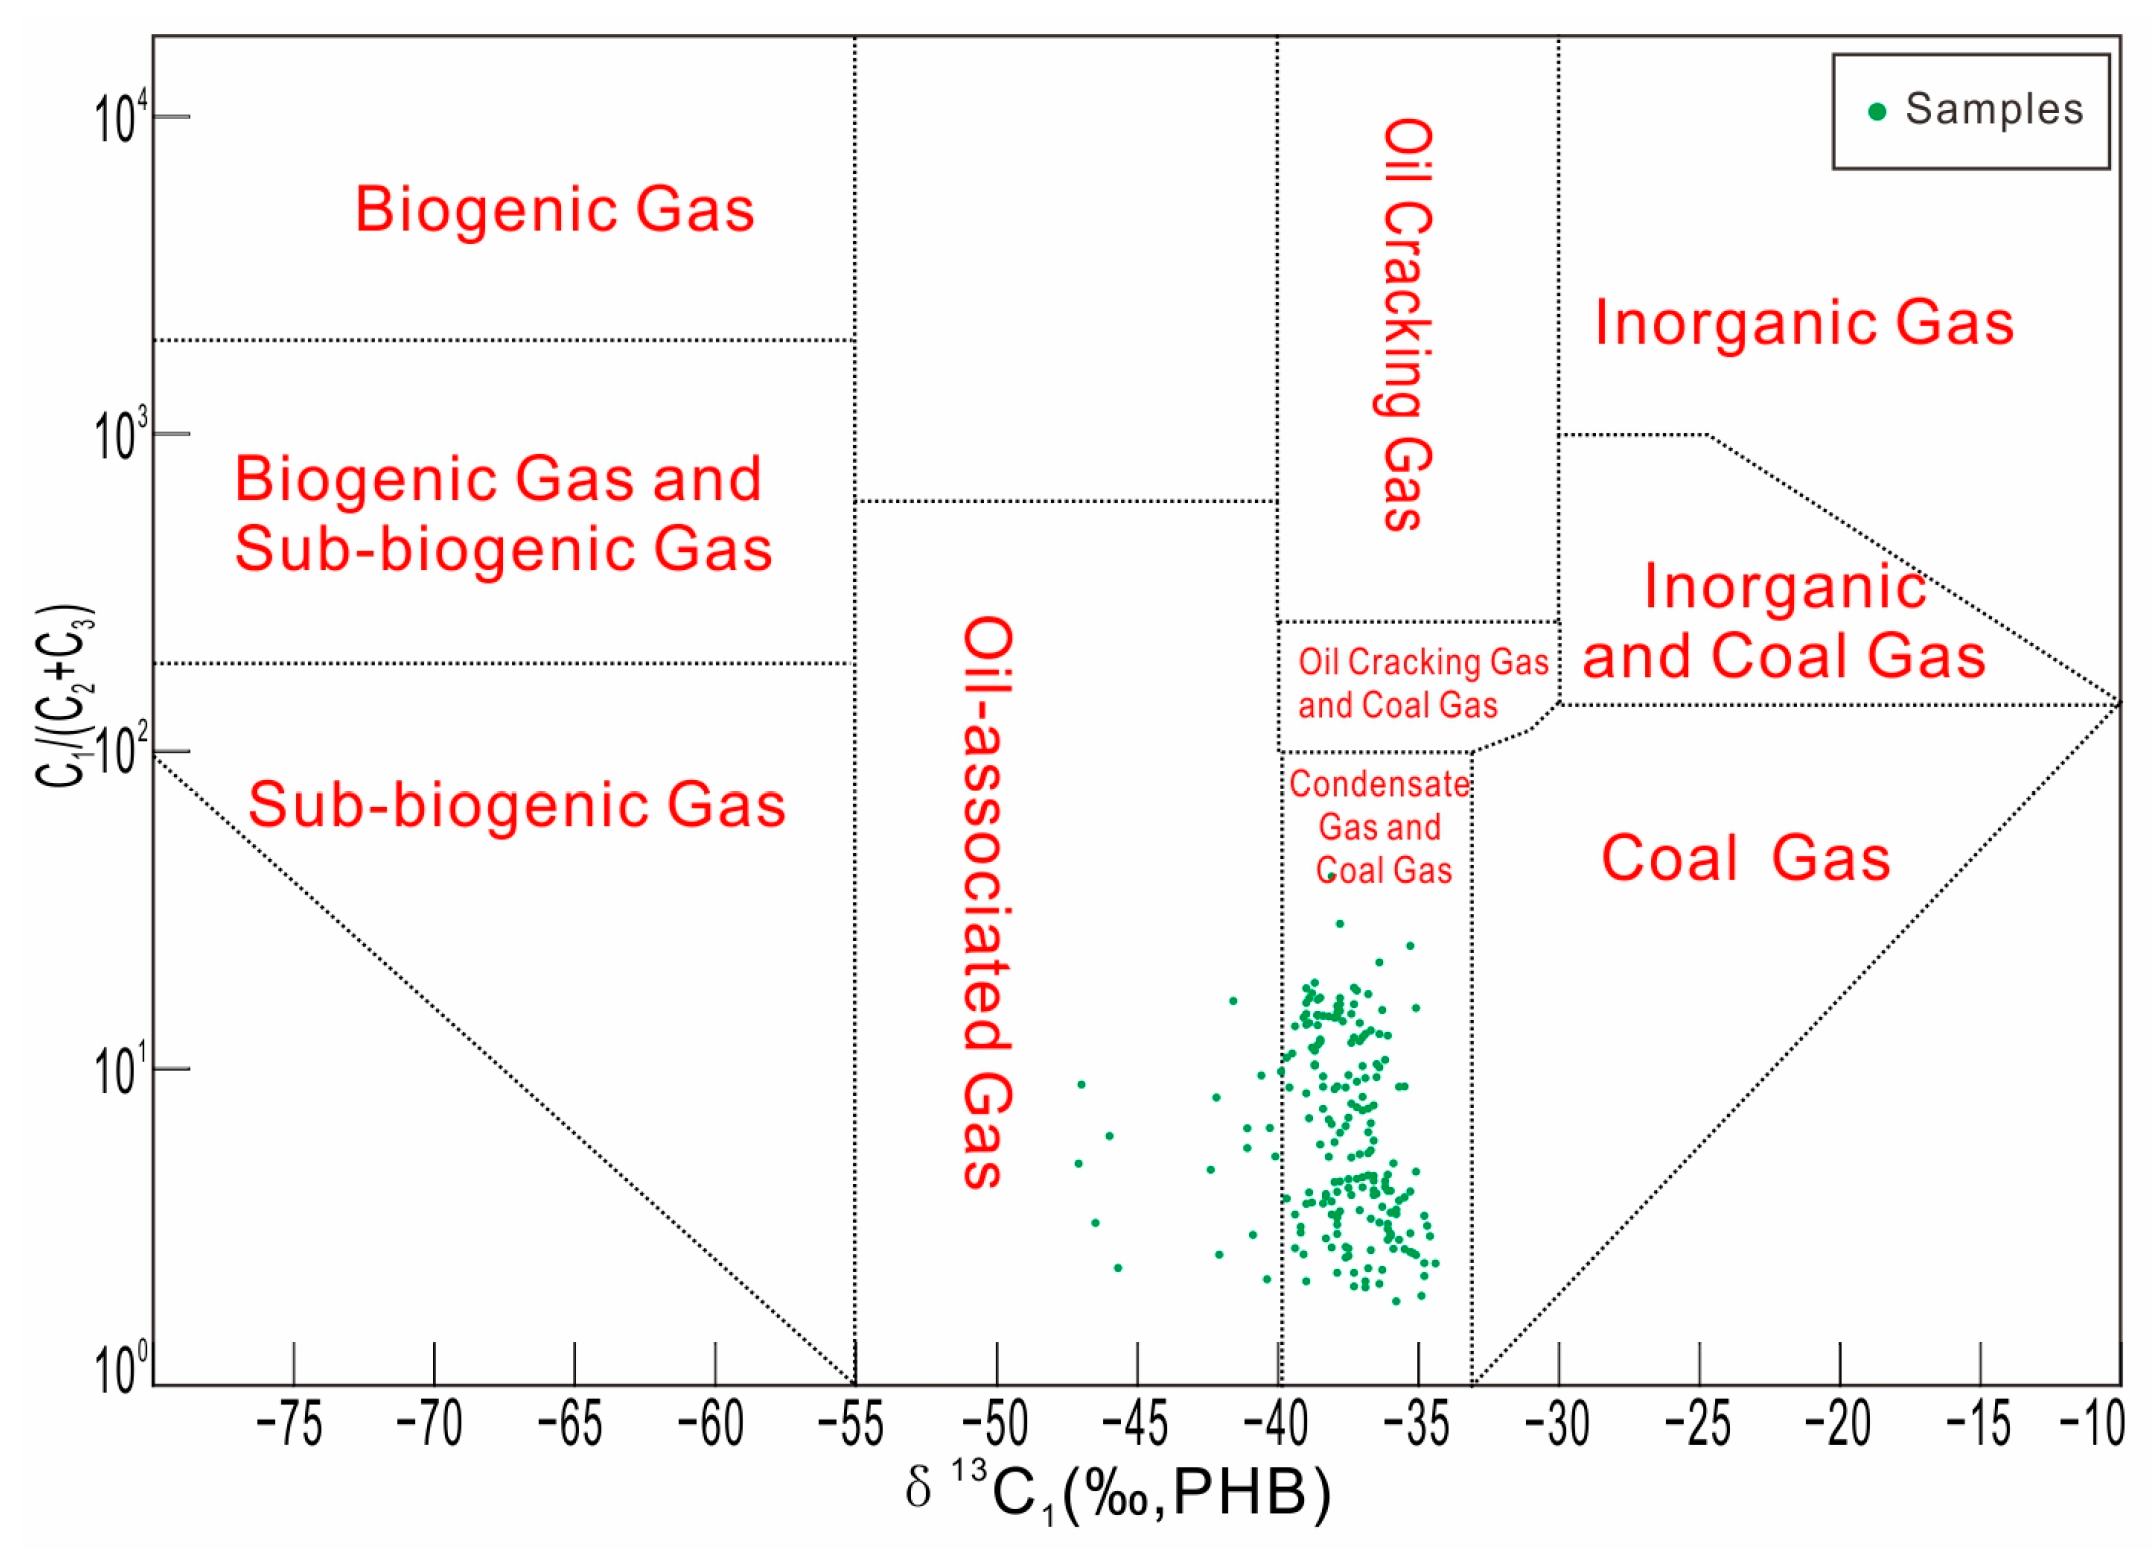
5.5. Carbon Isotope of Methane (δ13C) Features

The stable carbon isotope of methane in the acid-extracted hydrocarbons is an important indicator for distinguishing oil and gas properties. The average δ13C value of biogenic gas is less than −54‰, the average δ13C value of oil field gas ranges from −54‰ to −40‰, and the average δ13C value of mature gas or coal-type gas is greater than −40‰ (Figure 11) [32]. The stable carbon isotope values of acid-extracted hydrocarbon methane in the Chaoshan Depression range from −34‰ to −48‰, with a maximum value of −34.45‰, a minimum value of −47.11‰, a median value of −37.50‰, and a standard deviation of 2.48. Its oil and gas characteristics are of an organic origin and are in the over-mature stage (Figure 11).
The planar anomalies of carbon isotopes in methane are high in the south and the north of the region, and low in the middle area (Figure 12).

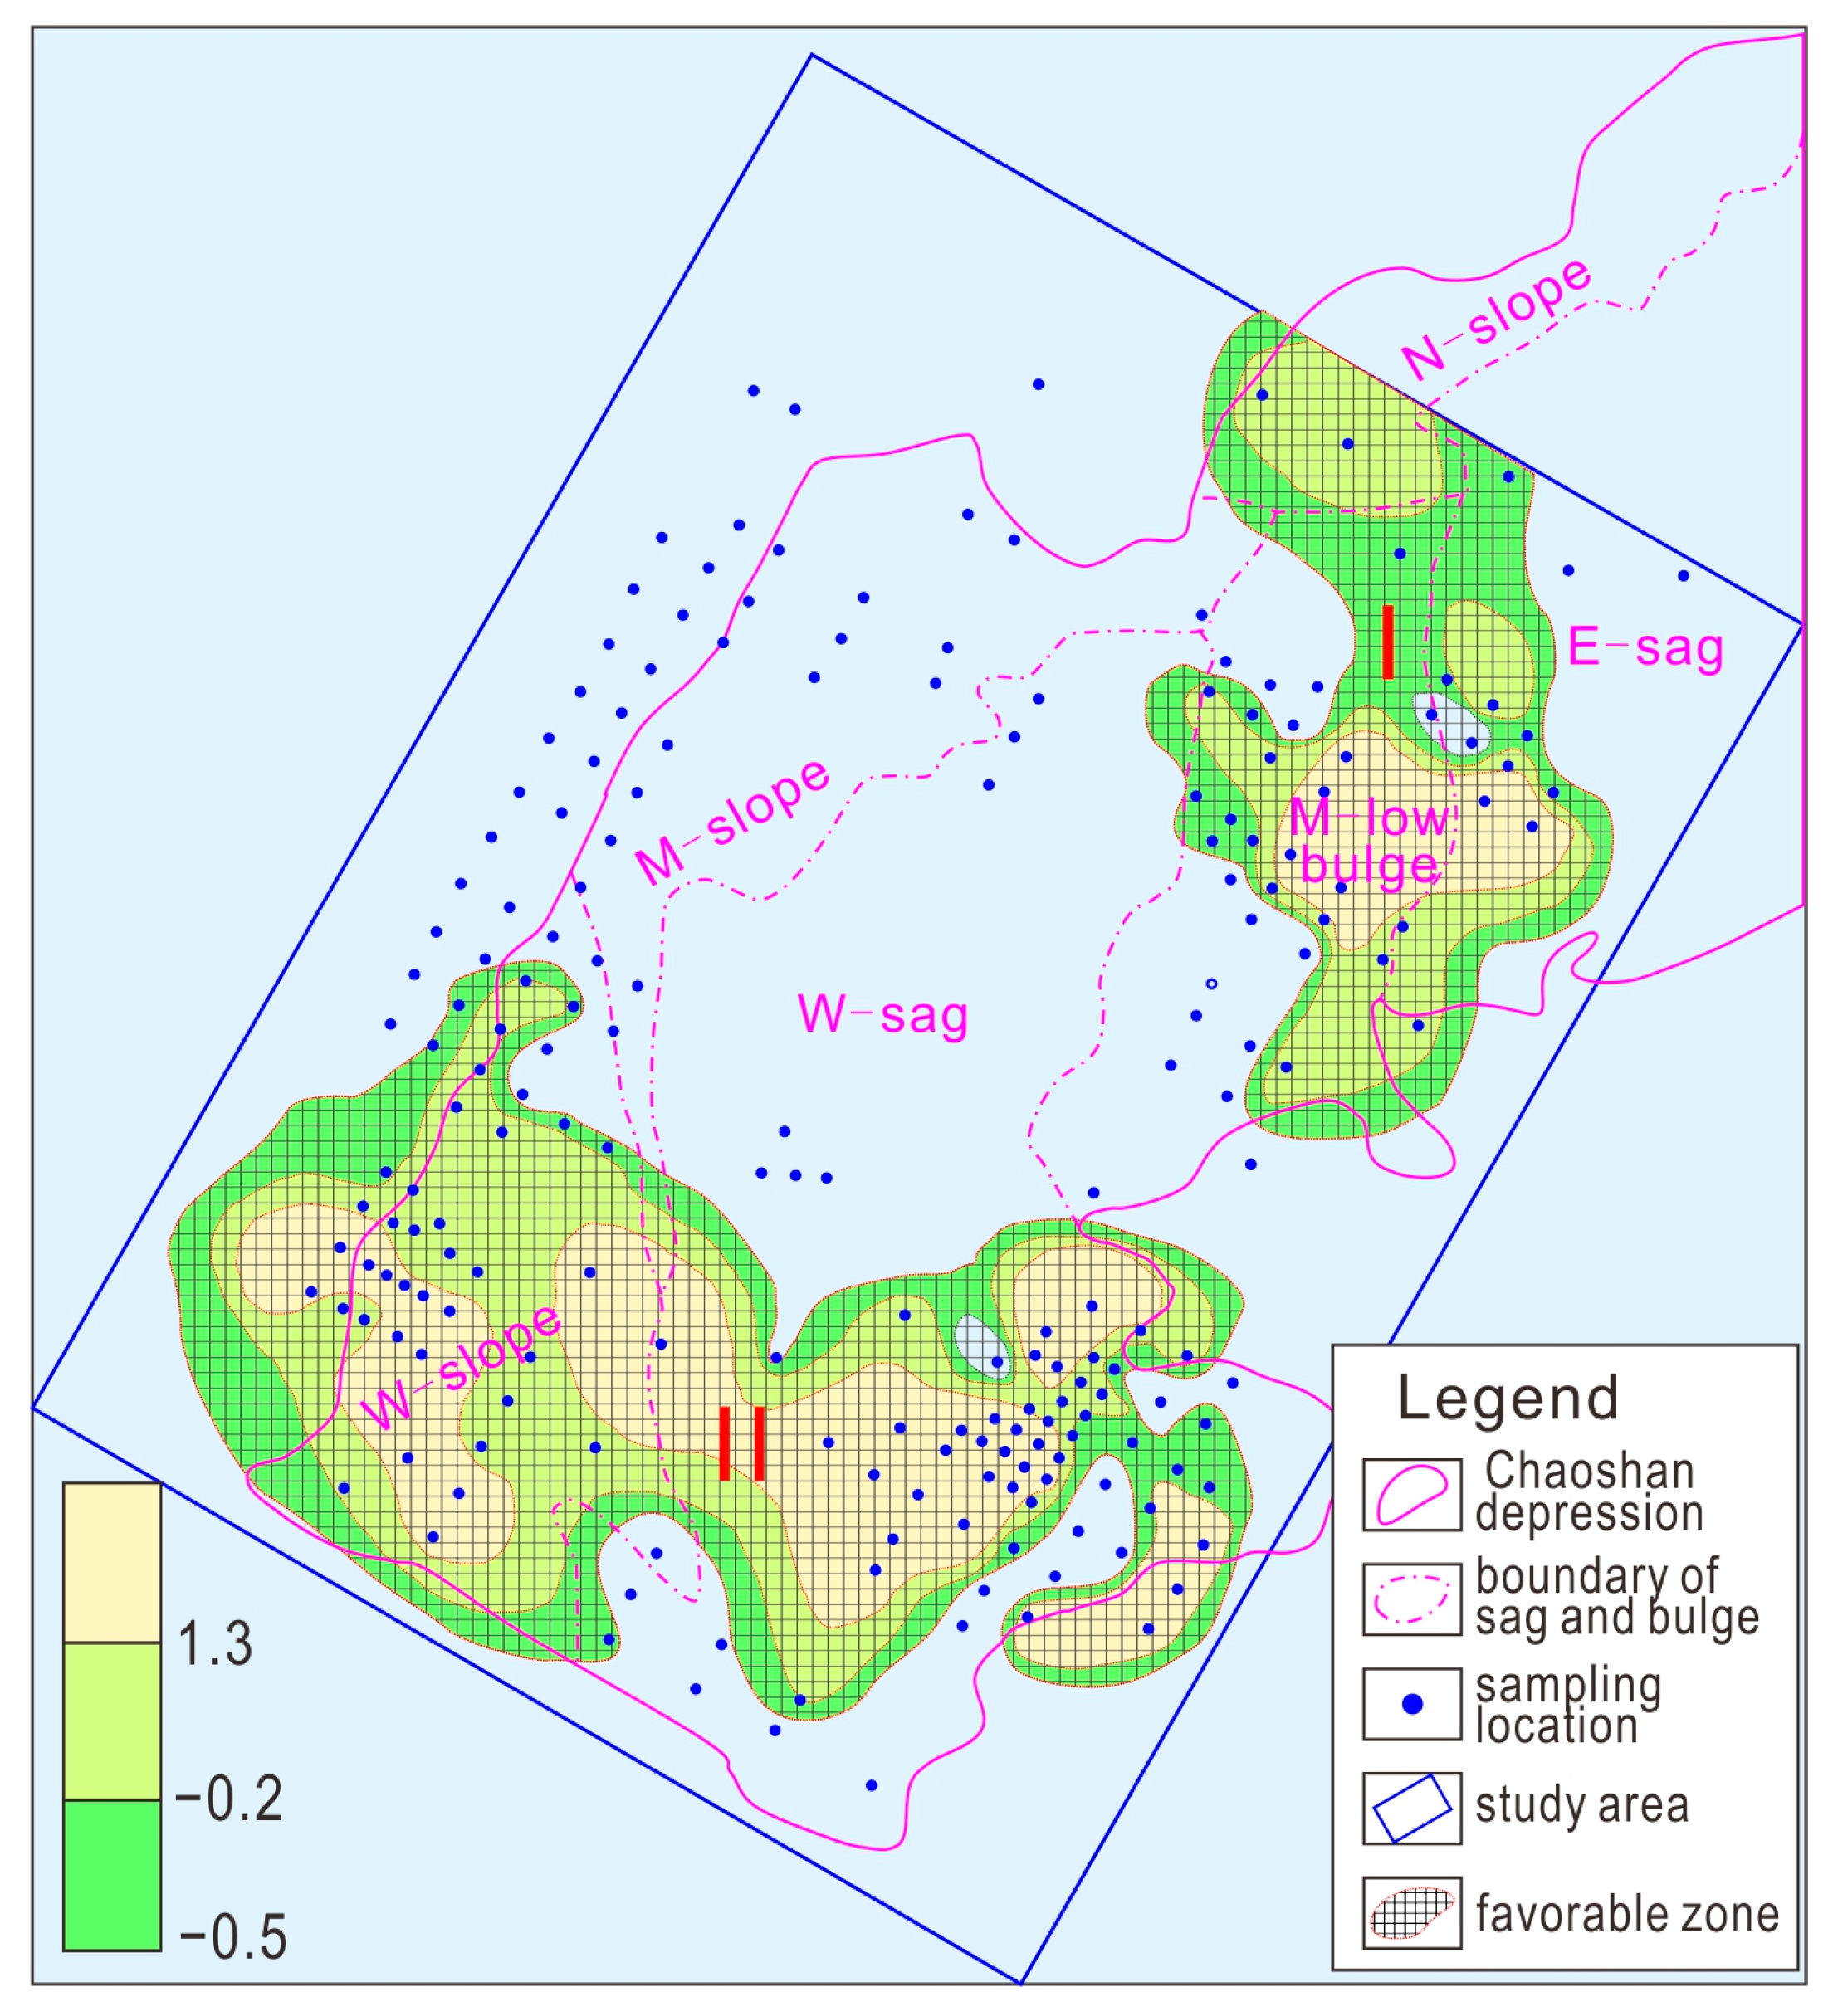
5.6. Evaluation of Favorable Oil and Gas Areas

Through acid-extracted hydrocarbons anomaly analysis of the composition, abundance, structure, planar distribution, and planar distribution of methane stable isotope values of acid-extracted hydrocarbons in the Chaoshan Depression, it is believed that anomalous zones are distributed in the central and southwestern parts of the depression. After normalizing the oil and gas exploration indicators, the moving average method and Kriging method were used to delineate the northeast (I) and southwest (II) parts of the Chaoshan Depression as the most favorable prospective oil and gas areas (Figure 12).
From the seismic profile crossing the northern abnormal area, it can be observed that the methane present in the acid-extracted hydrocarbons is abnormally developed in the seafloor sediments above the reservoir. However, this anomaly gradually decreases as it approaches the edge of the reservoir, tending towards the background value. There is a favorable correspondence between the oil reservoir and the anomaly (Figure 13), and the micro-leakage of oil and gas from the underlying reservoir has been determined as the main reason for the formation of these geochemical anomalies. The formation mechanism of geochemical anomalies in the Chaoshan Depression is as follows: gas from the underlying reservoir is driven upwards by pressure and leaks into the seabed through fault planes and micro-fractures. The underlying petroleum reservoir is controlled by the source, the micro-fractures control the permeability, and the surface sediments adsorb and trap the leaked hydrocarbons, forming a “lower generation, upper accumulation and micro fractures leaking “model. This model would benefit from understanding the mechanism of hydrate accumulation in the Dongsha area also.

6. Conclusions

  • The oil and gas reservoir in the Chaoshan Depression is mainly composed of condensate gas (oil). The reservoir is of an organic thermal origin. The source rock is dominated by marine sedimentation, with highly mature organic matter.
  • The favorable oil and gas prospects in the Chaoshan Depression are divided into two regions, respectively favorable zone I and favorable zone II, mainly located at the intersection of the central low bulge, the western depression, and the western slope of the depression; the DS-A structure indicates an oil and gas reservoir dominated by gas.
  • The “lower generation, upper accumulation and micro fractures leaking” model is the mechanism explaining the formation of oil and gas anomalies in the Chaoshan Depression, in which hydrocarbons are controlled by the underlying petroleum reservoir, leak through micro-fractures, and adsorb on the seabed’s surface.

Author Contributions

Data processing: J.Z.; writing—original draft preparation: G.Z., Z.Z., K.Z., G.T. and J.Z.; data analysis: J.Y., C.S. and C.F. All authors have read and agreed to the published version of the manuscript.

Funding

This research was funded by the National Natural Science Foundation of China (No. 42076218, U1901217, and 91855101).

Institutional Review Board Statement

Not applicable.

Informed Consent Statement

Not applicable.

Data Availability Statement

Data are available on request from the author.

Acknowledgments

We are grateful for the efforts of all who participated in data acquisition and processing. We thank the reviewers for helpful suggestions that improved the clarity of this paper.

Conflicts of Interest

The authors declare no conflicts of interest.

References

  1. Shao, L.; You, H.; Hao, H.; Wu, G.; Qiao, P.; Lei, Y. Petrology and depositional environments of Mesozoic strata in the Northeastern South China Sea. Geol. Rev. 2007, 53, 164–169. Available online: https://en.cnki.com.cn/Article_en/CJFDTOTAL-DZLP200702004.htm (accessed on 5 March 2022).
  2. Hao, H.; Shi, H.; Zhang, X.; Wang, T.; Tang, S. Mesozoic sediments and their petroleum geology conditions in Chaoshan sag: A discussion based on drilling results from the exploratory well LF35-1-1. China Offshore Oil Gas 2009, 21, 151–156. Available online: https://en.cnki.com.cn/Article_en/CJFDTOTAL-ZHSD200903001.htm (accessed on 5 May 2020).
  3. Zhang, L.; Geng, A.; Wang, L.; Liao, Y.; Xu, G.; Wei, Z. Assessment of Mesozoic source rocks at the Margin of South China Continent. Mar. Geol. Quat. Geol. 2012, 32, 99–108. [Google Scholar] [CrossRef]
  4. Yang, S.; Tong, Z.; He, Q.; Hao, J. Mesozoic hydrocarbon generation history and igneous intrusion impacts in Chaoshan depression. South China Sea: A case of LF35-1-1 well. China Offshore Oil Gas 2008, 20, 152–156, (In Chinese with English abstract). [Google Scholar]
  5. Hu, T.; Wu, G.; Xu, Z.; Pang, X.; Liu, Y.; Yu, S. Potential resources of conventional, tight, and shale oil and gas from Paleogene Wenchang Formation source rocks in the Huizhou Depression. Adv. Geo-Energy Res. 2022, 6, 402–414. [Google Scholar] [CrossRef]
  6. Guo, H.; Wang, Z.; Wang, B.; Zhang, Y.; Meng, H.; Sui, H. Molecular dynamics simulations of oil recovery from dolomite slit nanopores enhanced by CO2 and N2 injection. Adv. Geo-Energy Res. 2022, 6, 306–313. [Google Scholar] [CrossRef]
  7. Yang, Z.; Zou, C.; Gu, Z.; Yang, F.; Li, J.; Wang, X. Geological characteristics and main challenges of onshore deep oil and gas development in China. Adv. Geo-Energy Res. 2022, 6, 264–266. [Google Scholar] [CrossRef]
  8. Hao, H.; Wang, R.; Zhang, X.; Xie, H.; Chen, Z. Mesozoic marine sediment identification and distribution in the eastern Pearl River Mouth Basin. China Offshore Oil Gas 2004, 16, 84–88. [Google Scholar]
  9. Duan, J.; Mi, H. Seismic facies and sedimentary facies study of Mesozoic in Chaoshan sag. Resour. Ind. 2012, 14, 100–105, (In Chinese with English abstract). [Google Scholar]
  10. Yan, P.; Wang, Y.; Jin, Y.; Zhao, M.; Zhong, G. Deep-water coral of multiple benthal strategies discovered from mounds in the Dongsha Waters in the South China Sea. Earth Sci. Front. 2021, 29, 202–210. [Google Scholar] [CrossRef]
  11. Zhang, Q.; Zhang, H.; Zhang, X. The upper Cretaceous prototype basin of the Chaoshan depression in the northern South China Sea and its tectonic setting. Chin. J. Geophys. 2018, 61, 4308–4321. [Google Scholar] [CrossRef]
  12. Wang, P.; Xia, K.; Huang, C. The Mesozoic Marine sediment distribution and Geology-Geophysics characteristic at the North-Eastern of South China Continent. J. Trop. Oceanogr. 2000, 19, 28–35. [Google Scholar]
  13. Wu, N.; Zhang, G.; Liang, J.; Su, Z.; Wu, D.; Lu, H. Progress of gas hydrates research in northern South China Sea. Adv. New Renew. Energy 2013, 1, 80–94. [Google Scholar]
  14. Brown, A. Evaluation of possible gas micro seepage mechanisms. AAPG Bull. 2000, 84, 1775–1789. [Google Scholar] [CrossRef]
  15. Ramkumar, M.; Nagarajan, R.; Santosh, M. Advances in sediment geochemistry and chemostratigraphy for reservoir characterization. Energy Geosci. 2021, 2, 308–326. [Google Scholar] [CrossRef]
  16. Decker, J.; Teas, P.; Orange, D.; Bernard, B.B. Sea bottom characteristics and geochemistry of oil and gas seeps in the Gulf of Mexico. Interpretation 2022, 10, SB49–SB62. [Google Scholar] [CrossRef]
  17. Zavatsky, M.D.; Veduta, O.V.; Naumenko, V.O. Prospecting terrain for surface geochemical exploration of oil and gas in West Siberia. Geol. Ecol. Landsc. 2022. [Google Scholar] [CrossRef]
  18. Rice, G.K. Vertical migration in theory and in practice. Interpretation 2021, 10, SB17–SB26. [Google Scholar] [CrossRef]
  19. Jatiault, R.; Loncke, L.; Dhont, D.; Imbert, P.; Dubucq, D. Geophysical characterization of active thermogenic oil seeps in the salt province of the lower Congo basin. Part II: A regional validation. Mar. Pet. Geol. 2019, 103, 773–791. [Google Scholar] [CrossRef]
  20. Hosseinpour, M. Relationship between hydrocarbon micro-seepages and structures by detection of altered minerals using ASTER remote sensing data in the West of Coastal Fars, Zagros, Iran. Arab. J. Geosci. 2020, 13, 511. [Google Scholar] [CrossRef]
  21. Cameron, N.; White, K. Surface geochemical exploration continues to progress global Deepwater Frontiers. In Proceedings of the IBC “Worldwide Deepwater Technologies” Forum, London, UK, 11–12 April 2000; pp. 11–12. Available online: https://www.tdi-bi.com/wp-content/uploads/2017/01/SGE-Progresses-DW-Frontiers.pdf (accessed on 23 May 2024).
  22. Belt, J.Q., Jr.; Rice, G.K. Application of statistical quality control measures for near—Surface geochemical petroleum exploration. Comput. Geosci. 2002, 28, 243–260. [Google Scholar] [CrossRef]
  23. Kumar, B.; Patil, D.J.; Kalpana, G.; Vishnu Vardhan, C. Geochemical prospecting of hydrocarbons in Frontier basins of India. In Proceedings of the American Associa-tion of Petroleum Geologists Annual Convention, AAPG, Dallas, TX, USA, 18–21 April 2004; pp. 18–21. Available online: https://www.semanticscholar.org/paper/Geochemical-Prospecting-of-Hydrocarbons-in-Frontier-Kumar-Kalpana/884ab57ad958193c280683b2d9485f5e4747cd9d (accessed on 23 May 2024).
  24. Abrams, M.A. Significance of hydrocarbon seepage relative to petroleum generation and entrapment. Mar. Pet. Geol. 2005, 22, 457–477. [Google Scholar] [CrossRef]
  25. Hovland, M.; Jensen, S.; Fichler, C. Methane and minor oil macro-seep systems—Their complexity and environmental significance. Mar. Geol. 2012, 332–334, 163–173. [Google Scholar] [CrossRef]
  26. Al-Areeq, N.M.; Maky, A. Organic geochemical characteristics of crude oils and oil-source rock correlation in the Sunah oilfield, Masila Region, Eastern Yemen. Mar. Pet. Geol. 2015, 63, 17–27. [Google Scholar] [CrossRef]
  27. Bougi, M.S.M.; Baklouti, S.; Rasheed, M.A.; Pls, R.; Hasan, S.Z.; Ksibi, M.; Gharbi, J. Integrated geo-microbial and trace metal anomalies for recognition of hydrocarbon microseepage in petroliferous regions: Case of El Hajeb oilfield in the South East of Tunisia. Pet. Sci. Technol. 2018, 36, 2029–2036. [Google Scholar] [CrossRef]
  28. Anderson, J.; Romanak, K.; Alfi, M.; Hovorka, S. Light hydrocarbon and noble gas migration as an analogue for potential CO2 leakage: Numerical simulations and field data from three hydrocarbon systems. Greenh. Gases Sci. Technol. 2019, 9, 226–244. [Google Scholar] [CrossRef]
  29. Abrams, M.A. Evaluation of near-surface gases in marine sediments to assess subsurface petroleum gas generation and entrapment. Geoscience 2017, 7, 35. [Google Scholar] [CrossRef]
  30. Horvitz, L. Hydrocarbon prospecting after forty years. In Unconventional Exploration for Petroleum and Natural Gas II; Gottlieb, B.M., Ed.; Southern Methodist University Press: Dallas, TX, USA, 1981; pp. 83–95. [Google Scholar]
  31. Horvitz, L. Geochemical exploration for petroleum. Science 1985, 229, 812–827. [Google Scholar] [CrossRef]
  32. Whiticar, M.J. Characterization and Application of Sorbed Gas by Microdesorption CF-IRMS. In Proceedings of the Near-Surface Hydrocarbon Migration: Mechanisms and Seepage Rates, American Association Petroleum Geology Hedberg Conference, Vancouver, BC, Canada, 7–10 April 2002. [Google Scholar]
  33. Su, P.; Liang, J.; Zhang, W.; Liu, F.; Wang, F.; Li, T. Natural gas hydrate accumulation system in the Shenhu sea area of the northern South China Sea. Nat. Gas Ind. 2020, 40, 77–88. [Google Scholar] [CrossRef]
  34. Zhang, J.; Sun, Z.; Zhang, S. Analysis of Mesozoic tectonic deformation in the Chaoshan Depression of Pearl River Mouth Basin. J. Trop. Oceanogr. 2014, 33, 41–49. Available online: http://www.jto.ac.cn/EN/lexeme/showArticleByLexeme.do?articleID=578 (accessed on 5 March 2021).
  35. Ye, Q.; Mei, L.; Shi, H. The Late Cretaceous tectonic evolution of the South China Sea area: An overview, and new perspectives from 3D seismic reflection data. Earth-Sci. Rev. 2018, 187, 186–204. [Google Scholar] [CrossRef]
  36. Hao, H.; Zhao, J.; Liu, H. Prediction of oil and gas reservoir traps by aromatic hydrocarbons from seabed sediments in Chaoshan depression, South China Sea. Acta Pet. Sin. 2018, 39, 528–540. [Google Scholar] [CrossRef]
  37. Zhou, D.; Wang, W.; Wang, J. Mesozoic subduction-accretion zone in northeastern South China Sea inferred from geophysical interpretations. Sciences China Earth, zone in northeastern South China Sea inferred. Sci. China Earth 2006, 49, 471–482. [Google Scholar] [CrossRef]
  38. Yan, Y.; Liao, J.; Yu, J.; Chang, L.; Guangjian, Z.; Yanlin, W. Velocity Structure Revealing a Likely Mud Volcano off the Dongsha Island, the Northern South China Sea. Energies 2022, 15, 195. [Google Scholar] [CrossRef]
  39. Blumenberg, M.; Lutz, R.; Schlömer, S.; Krüger, M.; Scheeder, G.; Berglar, K.; Heyde, I.; Weniger, P. Hydrocarbons from near-surface sediments of the Barents Sea north of Svalbard—Indication of subsurface hydrocarbon generation? Mar. Pet. Geol. Bull. 2016, 76, 432–444. [Google Scholar] [CrossRef]
  40. Abrams, M.A. Geophysical and geochemical evidence for subsurface hydrocarbon leakage in the Bering Sea, Alaska. Mar. Pet. Geol. Bull. 1992, 9, 208–221. [Google Scholar] [CrossRef]
  41. Abrams, M.A. Distribution of subsurface hydrocarbon seepage in near-surface marine sediments. In Hydrocarbon Migration and Its Near Surface Effects; American Association Petroleum Geology Memoir No. 66; Schumacher, D., Abrams, M.A., Eds.; American Association of Petroleum Geologists: Tulsa, OK, USA, 1996; Chapter 1; pp. 1–14. [Google Scholar]
  42. Abrams, M.A. Marine seepage variability and its impact on evaluating the surface migrated hydrocarbon seep signal. Mar. Pet. Geol. 2020, 121, 104600. [Google Scholar] [CrossRef]
  43. Klusman, R.W.; Saeed, M.A. A comparison of light hydrocarbon micoseepage mechanisms. In Hydrocarbon Migration and Its Near Surface Effects; Schumacher, D., Arams, M.A., Eds.; American Association of Petroleum Geologist Memoil: Tulsa, OK, USA, 1996; Volume 66, pp. 157–168. [Google Scholar]
  44. Dai, J.; Fei, X.; Qi, H. China Gas-Geology; Petroleum Industry Press: Tulsa, OK, USA, 1992. [Google Scholar]
  45. Zhao, J.; Liang, Q.; Zhang, L.; Zhong, G. Oil and gas reservoir attribute discrimination based on surface sediment acid-extraction hydrocarbon in the western depression of Taiwan Strait Basin. Geophys. Geochem. Explor. 2018, 42, 436–441. [Google Scholar] [CrossRef]
Figure 1. Location map of the study area and structural zoning map.
Jmse 12 00909 g001
Figure 2. Seismic interpretation profile (See Figure 1 for location). ((a). preliminary interpretation of seismic profile; (b). geological interpretation section).
Jmse 12 00909 g002
Figure 3. Isogram of acid-extracted methane.
Jmse 12 00909 g003
Figure 4. Isogram of acid-extracted heavy hydrocarbons.
Jmse 12 00909 g004
Figure 5. Isogram of δ 13C (‰).
Jmse 12 00909 g005
Figure 6. Background and anomaly separation mode diagram, and characteristic diagrams of the acid-extraction hydrocarbon indicators’ stacking analysis. ((a). Background and anomaly separation mode diagram; (b). characteristic diagram of methane; (c). characteristic diagram of ethane; (d). characteristic diagram of propane; (e). characteristic diagram of butane; (f). characteristic diagram of pentane).
Jmse 12 00909 g006
Figure 7. Cross plot of C1 vs. C2.
Jmse 12 00909 g007
Figure 8. Cross plot of C1 vs. C3.
Jmse 12 00909 g008
Figure 9. Cross plot of C1 vs. ∑C.
Jmse 12 00909 g009
Figure 10. Cross plot of C1/(C2 + C3) vs. C2/(C3 + C4).
Jmse 12 00909 g010
Figure 11. Cross plot of δ13C1 vs. C1/(C2 + C3).
Jmse 12 00909 g011
Figure 12. Favorable prospective oil and gas areas of the Chaoshan Depression.
Jmse 12 00909 g012
Figure 13. The model of downward migration and upward accumulation: (a) shows SG anomaly profile across DS-A structure, (b) shows the seismic profile across the DS-A structure, (c) is the formation model of SG anomaly.
Jmse 12 00909 g013
Table 1. The abundance anomaly of acid-extracted hydrocarbons.
Minimum
(μL/kg)
Maximum
(μL/kg)
Median
(μL/kg)
Mean
(μL/kg)
SDCVK
SC113.341799.3194.01138.25163.231.181.47
SC20.66195.269.5421.6129.991.392.27
SC30.2680.643.578.1711.791.442.29
SiC40.1067.372.145.979.611.612.80
SnC40.0632.531.252.894.371.512.32
SiC50.0287.152.477.3812.291.662.99
SnC50.019.740.220.530.991.872.47
SC2g1.23465.1819.7446.5668.471.472.36
Table 2. The range of gas composition changes in the overlying sediments of petroleum reservoirs.
TypeRatio of Hydrocarbon
C1/∑C × 100C1/C2(C3/C1) × 1000
Oil75~5010~460~500
Gas>75>10<60
Disclaimer/Publisher’s Note: The statements, opinions and data contained in all publications are solely those of the individual author(s) and contributor(s) and not of MDPI and/or the editor(s). MDPI and/or the editor(s) disclaim responsibility for any injury to people or property resulting from any ideas, methods, instructions or products referred to in the content.

