Abstract
Coastal lagoons are highly productive transitional water bodies threatened by human factors and vulnerable to global climate change effects. Monitoring biophysical parameters in these ecosystems is crucial for their preservation. In this work, we used Sentinel-2 and Landsat imagery combined with in situ data to (1) develop preliminary algorithms for retrieving the Chl-a concentration and water surface temperature of six lagoons located in the Ebro Delta (NE Mediterranean Sea, Spain), and to (2) compute maps and trend lines for analysing their spatiotemporal evolution from 2015 to 2022. Our findings showed that the algorithms’ accuracy ranged from 72% to 78% and had limited potential under high Chl-a concentration regimes. Even so, they revealed the lagoons’ trophic status, usual fluctuations, and deviations of both parameters attributed to seasonal (i.e., light and temperature) and short-term physical (i.e., winds) forcing, as well as valuable spatial patterns potentially useful for conservation efforts and land use planning. Future work will focus on the acquisition of a larger in situ data sample under a range of environmental conditions to improve the algorithms’ robustness, which in turn will allow the investigation of natural and human factors controlling the dynamics of the two investigated parameters.
1. Introduction
Coastal lagoons are transitional shallow water bodies, usually sheltered by sandy barriers, that provide high ecological and socio-economic benefits to society [1]. Their value, recognised and protected by the Habitats Directive and the Natura 2000 network [2], is well reflected by the wide spectrum of ecosystem services they provide: supporting (e.g., habitat, nutrient cycling), regulating (e.g., water regulation, carbon sequestration), provisioning (e.g., aquaculture and fishing, materials), and cultural (e.g., aesthetic and education) [3,4,5]. These environments sustain a mosaic of heterogeneous habitats (e.g., saltmarshes, seagrass meadows) with a rich specific biodiversity [5], and they are home to many species of plants, animals, and other macro and microscopic organisms [6]. Among them, phytoplankton play an essential role as they are the primary producers that sustain the whole aquatic food chain. Primary production in coastal lagoons, often assessed using Chlorophyll-a (hereafter referred as Chl-a) concentration as a proxy, is influenced by a wide range of factors acting at various spatiotemporal scales [7]. It may naturally exhibit instantaneous, seasonal, and even interannual changes due to freshwater/nutrient inputs, as well as different hydrodynamic (e.g., tides), geomorphological (e.g., levels of water exchange with the ocean), and meteorological (e.g., wind and precipitation) conditions [8,9]. Ecosystem productivity and bloom dynamics are also shaped by water temperature fluctuations attributed to atmospheric heat fluxes, water exchanges linked to tides and storms, and estuarine hydraulics, as well as freshwater hydrology [10]. As can be seen, coastal lagoons are intricate ecosystems where primary production and water temperature interact dynamically. In addition, these complex variable interactions are further influenced by human pressures (e.g., changes in land use and nutrient and organic matter pollution, as well as undesired effluents from agriculture, industry, and aquaculture) and global climate change effects (e.g., sea-level rise, storminess, high water and air temperatures, extreme events) [11,12,13,14]. The previous are threatening the water quality and the trophic status of these rich and valuable ecosystems, which indeed require frequent, long-term, and large-scale monitoring to ensure their preservation. In fact, all European Union member states are obliged to do so, as dictated by the Water Framework Directive (2000/60/EC) (WFD).
Remote-sensing techniques such as satellites and/or unpiloted aerial vehicles equipped with multispectral, hyperspectral, and/or thermal sensors (among others) have become allied tools for the environmental management of different coastal ecosystems, as they effectively allow the extraction of different biophysical parameters from water bodies (Chl-a concentration, surface temperature, and turbidity of dissolved organic matter, among others) [15]. Despite the fact that remote-sensing techniques still require in situ field measurements, laboratory procedures, and band spectral analyses, as well as the development of algorithms, they have progressively overcome the limitations inherent in the spatiotemporal coverage and radiometric resolution of data acquisition [16]. The previous have significantly reduced the costs as well as simplified the logistics associated with traditional labour-intensive and time-consuming field campaigns and laboratory analyses. So much so that their use has progressively increased in the last decades, yielding very promising results that prove their suitability for a wide range of environmental applications [17]. The previous include water quality monitoring in continental lakes and reservoirs [18,19,20,21], as well as coastal waters [22,23], evaluating the suitability of coastal areas for fisheries and aquaculture [24,25], characterisation and mapping of a variety of coastal habitats and their changes [26,27,28,29,30], or even the surveillance of harmful coastal algal blooms [31,32]. Furthermore, these techniques have also allowed assessing the impact of extreme storm events on water quality and flooding [14,33], measuring human impact on water transparency [34], or assessing the impact of meteorological freshwater episodes and winds on water temperature and Chl-a concentration in coastal lagoons [9], among many others.
In this work, we used Sentinel-2 and Landsat satellite imagery combined with in situ field measurements during a 7-year period (from 2015 to 2022) to develop preliminary algorithms for the retrieval of Chl-a concentration and water surface temperature data, respectively, from two relatively large bays and four coastal lagoons of different size and geomorphological characteristics located at the Ebro Delta (NW Mediterranean Sea, Spain). Once the algorithms were calibrated and validated, seasonal maps and trend lines for each parameter in every year were computed, allowing the investigation of the trophic status of these lagoons, the seasonal and spatial patterns of surface temperature and Chl-a concentration, and their possible relations.
2. Materials and Methods
2.1. The Ebro Delta
Situated in the Western Mediterranean within Catalonia, Spain, the Ebro Delta is one of the largest deltas in the north-western region of the Mediterranean Sea (320 km2), and is recognised as Spain’s second-most vital wetland, following the Doñana wetland on the Atlantic coast of Andalusia [12]. Its environmental significance is underscored by a wide array of habitats including marshes, coastal lagoons, beaches, and dunes, among others, of high ecological value (Figure 1). The diversity of ecosystems supports an abundant and varied biological community and rich biodiversity which are protected under the Natura 2000 network of the European Union. Moreover, the Ebro Delta is recognised as a natural park and a biosphere reserve by UNESCO. On the other hand, the delta benefits from the river’s fresh water and nutrients, allowing the development of agricultural activity. Notably, agriculture plays a pivotal role in the Ebro Delta’s economy, with 210 km2 of the deltaic plain allocated for cultivating rice [35]. Tourism, fishing, and oyster and mussel aquaculture are also activities that provide considerable economic benefits for the region [36].
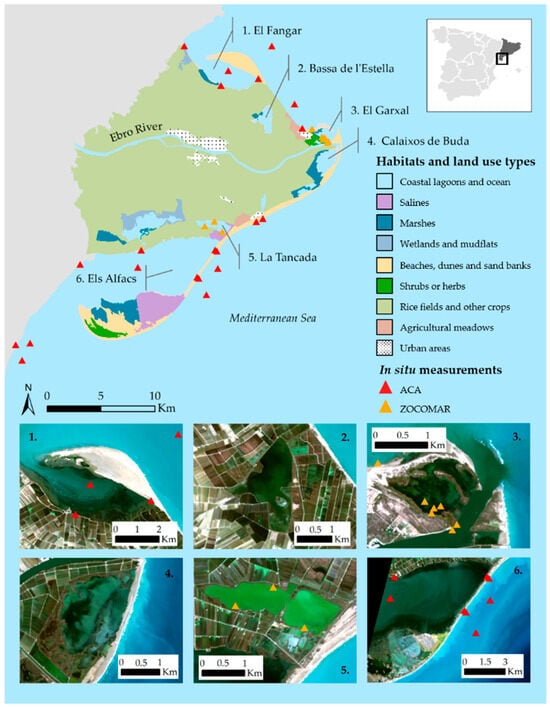
Figure 1.
Location of the Ebro Delta habitats, land use types (CORINE 2018), and the two bays (1 and 6) and four coastal lagoons (2, 3, 4 and 5) of interest (Background image: Sentinel S2A-L1C image in November 2022). The in situ measurement points from the ACA (Catalan Water Agency) and ZOCOMAR research group are highlighted with red and orange triangles, respectively.
This delta features a gradual decline in elevation from approximately 5 m near the river to sea level along the coast, with half of its area sitting at or below 0.5 m above the mean sea level [35]. The Ebro Delta extends 25 km from the mainland and forms two embayments, El Fangar and Els Alfacs (Figure 1). The former has an extension of 12 km2, a mean depth of 2 m, and a 1 km wide mouth, while the second has an extension of 50 km2, a mean depth of 4 m, and its mouth is 3 km wide [25]. Other coastal lagoons can be found in the delta, such as the El Garxal and La Tancada lagoons. The extent and depth of these lagoons are smaller than the El Fangar and Els Alfacs bays and display variable geomorphological and hydrological characteristics as well as anthropogenic pressures (Figure 1).
The Delta is a micro-tidal system with an astronomical tidal range of approximately 20–30 cm, though meteorological tides can exceed 1 m [37]. Eastern winds play an important role in generating the most energetic and strong waves that approach the system, especially during spring [38]. However, the most energetic winds blow from the north and north-west during the autumn and winter, and coincide with calm wave activity [39]. The climate of the Ebro Delta is Mediterranean, as it is characterised by high temperatures (minimum and maximum temperatures of 0 °C and 35 °C, respectively) and low precipitation (mean annual rainfall of 530 L/m2) [12].
2.2. Satellite Images
Sentinel-2A/B MSI Level-1 (L1C, top of the atmosphere) images were downloaded from the Copernicus Data Space Ecosystem Browser (https://dataspace.copernicus.eu/browser, accessed on 15 March 2023), while Landsat L8/9 images were downloaded from the Earth Explorer website (https://earthexplorer.usgs.gov/, accessed on 15 March 2023). The twin Sentinel-2 satellites combine high spatial resolution of 10 m or 20 m and frequent revisits (10 days at the equator with one satellite and 5 days with both). Landsat satellites provide a moderate spatial resolution of 100 m and, in terms of revisiting times, Landsat 9 intentionally shifts its orbit by eight days relative to Landsat 8, which expands the frequency of observations, enabling more frequent monitoring.
The Sentinel images were atmospherically corrected using the ACOLITE processor (20170718.0 version) to Level 2. All the previous images were downloaded, ensuring no cloud cover, sun glint, or shadows over the coastal lagoons of interest.
2.3. Collection of In Situ Data
In situ measurements of Chl-a concentration and surface water temperature coincident with the correspondent Sentinel 2 and Landsat satellite imagery (with a maximum temporal window of +/−3 and +/−4 and days, respectively [40]) were downloaded from an already available public dataset (ACA dataset; https://aplicacions.aca.gencat.cat/, accessed on 10 March 2023) (2013–2021), as well as from several field surveys performed by members of our research team ZOCOMAR (2021–2022). In the ACA, the measurements were obtained at a 1 m depth (red triangles in Figure 1). ZOCOMAR sampled water at 0.5 m (Mediterranean Sea and Ebro River locations; orange triangles in Figure 1) and 0.3–0.5 m depths (El Garxal y La Tancada coastal lagoons; orange triangles in Figure 1) and brought it to the laboratory to determine Chl-a concentration. Water temperature was measured in situ with a multiparameter meter (HI98194 Hanna Instruments) and water samples were filtered using Whatman GF/F fiberglass filters, then filters were frozen at −80 °C until their analysis. The determination of Chl-a concentration was performed using ultra-high performance liquid chromatography (UHPLC Shimadzu), following the methodology described in [41].
2.4. Algorithm Development
The pixels corresponding to in situ sampling locations of chlorophyll-a concentration and surface temperature were extracted from the 9 bands of the S2-L2 images (444, 497, 560, 664, 704, 740, 782, 835, and 865) and the band-10 of Landsat 8/9 images, respectively, using SNAP software (version 9.0.0). On the other hand, in order to determine an algorithm relating Chl-a concentration data to the reflective spectra extracted from each S2-L2 image band, several spectral indices were computed exploring specific chlorophyll-a absorption peaks, with some of them already explored by different authors in the literature (see Table 1). The different indices tested were used to calibrate and validate different models (e.g., linear, exponential) relating estimated and measured Chl-a concentration. Likewise, the temperature pixels extracted were used to calibrate and validate a model able to relate estimated and measured temperature. Lastly, the performance of all the algorithms tested was evaluated using the R2 and RMSE statistics [19,25].

Table 1.
Combinations of spectral bands tested to estimate chlorophyll-a concentration.
2.5. Computing Maps of Chlorophyll-a Concentration and Water Surface Temperature
The best-fitting algorithms obtained for the estimation of Chl-a concentration and surface water temperature were applied to a representative single image for each season of the year (when available) using the Raster Calculator Tool within ArcMap. For the purpose of facilitating meaningful seasonal comparisons, the images were selected on similar dates in each season for every year analysed, whenever possible. Lastly, the pixels corresponding to land areas and human infrastructures (e.g., aquaculture structures), as well as those pixels displaying unrealistic Chl-a concentration and/or temperature values due to sun glint effects or bottom effects, were masked out.
2.6. Analyses of Chlorophyll-a Concentration and Surface Water Temperature
The six lagoons of interest were digitised from the previously selected Chl-a maps and used to calculate time series for the mean and standard deviation of Chl-a concentration. The previous allowed the analysis of seasonal changes in Chl-a concentration in each lagoon, as well as their trophic status from 2015 to 2022.
It was not possible to obtain time series with similar data periodicity for the water surface temperature due to insufficient available Landsat images and a total lack of them from 2019 to 2021. Instead, we computed a temporal dataset for each lagoon by modelling trend lines from the extracted measurements from all the available Landsat images from 2013 to 2022 and using the Curve Fitting App within MATLAB (R2015a version).
3. Results
3.1. Algorithm Performance
Only the algorithms that performed well (R2 of 0.70 or higher) using more than 30 sample points (N > 30) were considered for the extraction of Chl-a concentration (Table 2). It must be noted that Algorithm A1 (Table 2, Figure 2a) was selected to extract Chl-a data from the bays of El Fangar and Els Alfacs (Figure 1), while Algorithm A2 (Table 2, Figure 2b) was used for the rest of the coastal lagoons analysed (Bassa de l’Estella, El Garxal, Calaixos de Buda, and La Tancada; Figure 1). The previous is justified considering that band 782 (used in the index of Algorithm A2; Table 2) gives information about suspended particles’ reflectance in areas close to the surface [19], which coincides with the water depth in which ZOCOMAR sampled water in the El Garxal and La Tancada lagoons (approximately 0.3–0.5 m; Figure 1). The previous Chl-a Algorithms A1 and A2 were fitted to exponential models that were calibrated and validated, giving an R2 of 0.73 and 0.82, as well as an RMSE of 0.14 and 0.28 mg/m3, respectively (Figure 2a,b; Table 2). Likewise, the algorithm to extract surface water temperature fitted to a linear model that was calibrated and validated gave an R2 and RMSE of 0.73 °C and 4.46 °C, respectively (Figure 2c).
Table 2.
Selection of the Chl-a algorithms with the best performance (R = Reflectance; λi = Spectral band; N = Total number of points; C = Number of points for calibration; V = Number of points for validation).
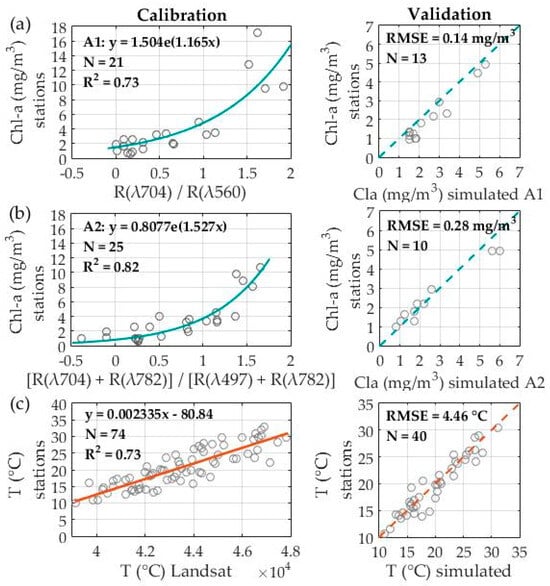
Figure 2.
Performance of the algorithms to extract: (a) Chl-a concentration from El Fangar and Els Alfacs bays (Algorithm A1), (b) Chl-a concentration from Bassa de L’Estella, El Garxal, Calaixos de Buda, and La Tancada coastal lagoons (Algorithm A2), and (c) water surface temperature in all the lagoons (Note: the displayed lines correspond to the 1:1 lines, which help to visually understand the differences between the measured and modelled data. The regression lines were also calculated and displayed R2 values of 0.95, 0.96, and 0.90, for the A1, A2, and temperature algorithms, respectively).
3.2. Evolution of Chl-a Concentration in the Coastal Lagoons
Noticeable differences in Chl-a concentration were observed in the bays of El Fangar and Els Alfacs with respect to the other coastal lagoons analysed. The former two displayed the lowest Chl-a concentrations, with mean values ranging from 1.2 mg/m3 to 2.25 mg/m3, while in the El Garxal, La Tancada, Bassa de L’Estella, and Calaixos de Buda coastal lagoons, the mean Chl-a concentration values ranged from 2 mg/m3 to 7 mg/m3 (Figure 3). During the analysed period, the El Fangar and Els Alfacs bays displayed similar Chl-a concentrations, with maximum differences registered of 0.4 mg/m3 in the spring of 2018 (Figure 3a). In the other coastal lagoons, these differences were more noticeable (nearly 5 mg/m3 in the autumn of 2020), with El Garxal and Bassa de L’Estella displaying in general the highest mean concentrations, followed by La Tancada and Calaixos de Buda (Figure 3b).
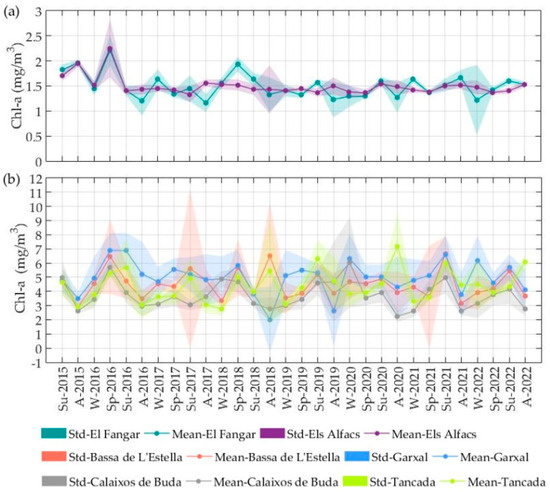
Figure 3.
Mean Chl-a concentration and standard deviation for the two bays (a) and the four coastal lagoons (b) during the period of study (Note: W = Winter, Sp = Spring, Su = Summer, and A = Autumn).
The two studied bays exhibited little seasonal fluctuation, especially Els Alfacs bay (Figure 3a). In El Fangar bay, fluctuations were subtle and characterised by Chl-a concentration peaks occurring in spring and summer (with some exceptions observed in autumn and winter) and low concentrations normally registered during autumn and winter (Figure 3a). Seasonal changes were more pronounced in the other coastal lagoons analysed. Likewise, Chl-a concentrations were higher during spring and summer and lower during autumn and winter. Nevertheless, again there were exceptions; for instance, in the lagoons of El Garxal and Calaixos de Buda, Chl-a concentrations reached a peak in the winter of 2020 (Figure 3b).
Furthermore, the Chl-a seasonal patterns and variability described above the computed maps (Figures S1–S6) allowed the analysis of the spatial distribution of Chl-a in each lagoon during the analysed period. For instance, the 2021 map computed (Figure 4) showed that both bays displayed little spatial variation compared to the Bassa de L’Estella, El Garxal, and Calaixos de Buda coastal lagoons during all seasons. The previous lagoons showed a pronounced gradient of Chl-a concentration from the east-to-west direction rather than the north-to-south direction. In Bassa de L’Estella and Calaixos de Buda, the highest concentration values were found at the western and southern margins. In El Garxal, the lowest concentrations were generally displayed in the lagoon’s entrance close to the river in all seasons, which increased towards the western margin. La Tancada displayed less pronounced spatial variability than the others (Figure 4).
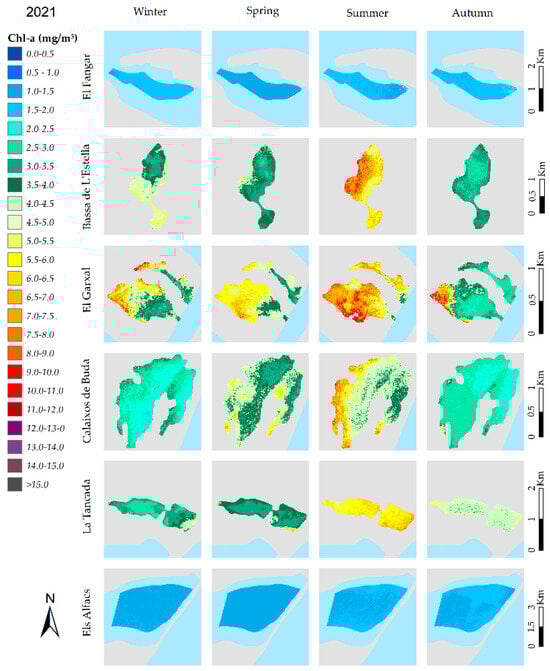
Figure 4.
Maps displaying Chl-a concentration patterns for the bays and coastal lagoons analysed in 2021.
3.3. Evolution of Water Surface Temperature in the Coastal Lagoons
The extracted data from the available Landsat imagery were successfully fitted to sinusoidal curves for each lagoon using the Curve Fitting App within MATLAB (R2015a version), which displayed R2 values above 0.85 in all cases and an RMSE ranging from 1.55 °C to 1.9 °C (Figure 5). According to these modelled trend lines, and as was to be foreseen, all the lagoons and bays displayed warmer temperatures during summer and colder temperatures during winter. The modelled winter temperatures ranged from 8.75 °C (La Tancada) to 9.15 °C (Els Alfacs), whereas the summer temperatures ranged from 21.72 °C (El Fangar) to 22.72 °C (El Garxal) (Figure 5). Interestingly, the modelled trend lines showed a slightly warmer surface water temperature in all the lagoons and bays analysed in the summer of 2022 with respect to the previous years. Similarly, a subtle decrease in water temperature was observed in the winter of 2022 in the coastal lagoons of Bassa de L’Estella, El Garxal, Calaixos de Buda, and La Tancada (Figure 5).
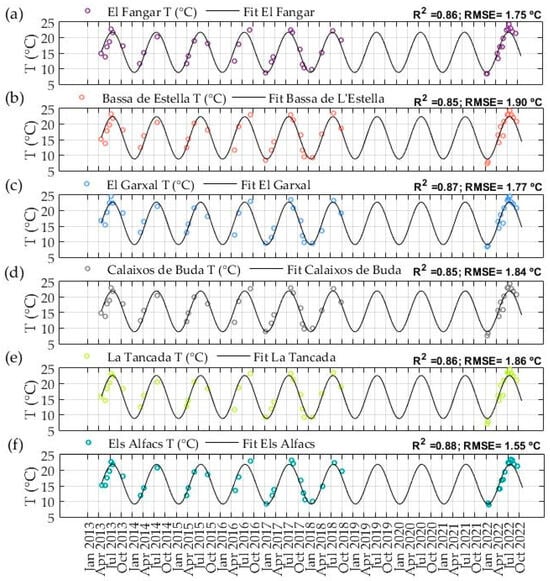
Figure 5.
Modelled water surface temperature trend lines from 2013 to 2022 in (a) El Fangar, (b) Bassa de L’Estella, (c) El Garxal, (d) Calaixos de Buda, (e) La Tancada, and (f) Els Alfacs.
Examples of the spatial patterns of surface temperature variations displayed in the 2018 and 2022 maps computed (Figure 6 and Figure 7, respectively) showed in general and for every season that lower temperatures were found at the El Fangar and Els Alfacs bays and higher ones at the Bassa de L’Estella, El Garxal, Calaixos de Buda, and La Tancada coastal lagoons. In addition, the previously mentioned higher temperatures in the summer and lower in the winter of 2022 with respect to 2018 were also observed. As the maps showed, temperatures in the 2022 summer were approximately 2 °C warmer in all the lagoons than in 2018, with the higher temperature values observed in El Garxal, followed by La Tancada, Bassa de L’Estella, and Calaixos de Buda (Figure 6 and Figure 7). The most significant decrease in winter temperatures (approximately 2 °C) in 2022 with respect to 2018 was observed at Bassa de L’Estella, El Garxal, Calaixos de Buda, and La Tancada (Figure 6 and Figure 7).
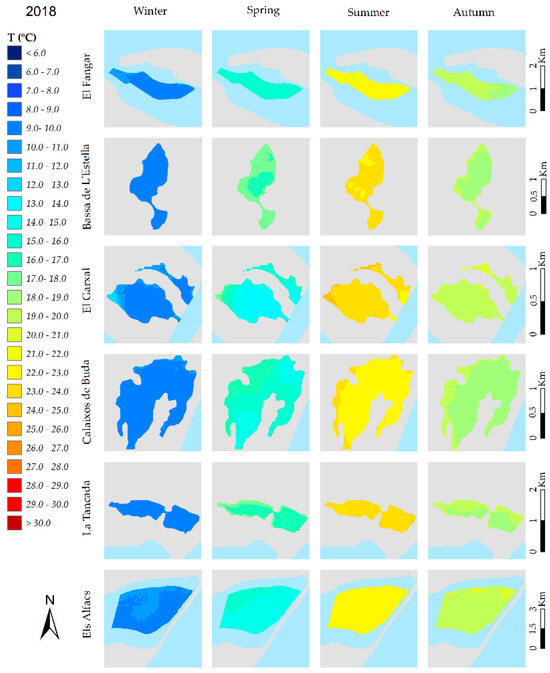
Figure 6.
Maps displaying water surface temperature patterns for the bays and coastal lagoons analysed in 2018.
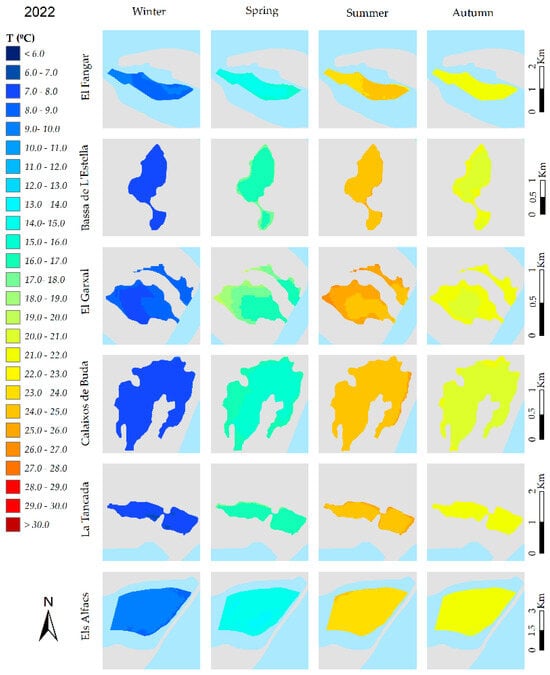
Figure 7.
Maps displaying water surface temperature patterns for the bays and coastal lagoons analysed in 2022.
In general, the water surface temperature in the El Fangar and Els Alfacs bays and La Tancada lagoon exhibited uniformity compared to the Bassa de L’Estella, El Garxal, and Calaixos de Buda lagoons. In the latter, spatial variations in the surface water temperature were more pronounced. As was the case with the Chl-a concentration, there were noticeable temperature gradients from the east-to-west direction in El Garxal and Calaixos de Buda, characterised by higher temperatures in their western and southern margins. El Garxal’s entrance near the river often exhibited the lowest temperatures, which gradually increased (up to 3 °C or 4 °C) towards its western margin.
4. Discussion
4.1. The Preliminary Algorithms Effectively Identified Variations in Chl-a Concentration and Surface Temperature within the Ebro Delta’s Coastal Lagoons and Bays
It must be noted that the magnitude of the Chl-a concentration (or surface temperature) estimates were not directly comparable with those obtained in other works. On the one hand, the findings were based on a specific date deemed representative of each season; on the other hand, they consisted of mean concentration values, derived by considering all pixels within the extent of each lagoon (for Chl-a) or individual points extracted from each lagoon (for water temperature). The previous type of analyses may or may not align with the spatiotemporal analyses performed in other works. However, the Chl-a concentration values retrieved in both bays using the computed algorithms (fluctuations from 0.5 mg/m3 to 2.5 mg/m3 for El Fangar and from 0.9 mg/m3 to 2.8 mg/m3 for Els Alfacs; Figure 3) were somewhat similar to those of previous studies, demonstrating their potential effectiveness. For instance, [42] estimated an annual average Chl-a concentration in El Fangar bay of 2.47 mg/m3 from 1968 to 1971. Estimates from 1982 to 1986 showed that the annual average Chl-a concentration was 3.4 mg/m3 and 3.2 mg/m3 for the El Fangar and Els Alfacs bays, respectively, and that maximum Chl-a values ranged from 1 mg/m3 to 3.7 mg/m3 in all months except June, July, September, and October [43], which are results similar to those of the current study (Figure 3). Additional similarities were found in the work of [7]. These authors measured the median Chl-a concentrations of 2.7 mg/m3 and 3 mg/m3 for the El Fangar and Els Alfacs bays from 1990 to 1995 and of 2.7 mg/m3 and 3.8 mg/m3 from 2000 to 2004. Chl-a concentrations were also measured in November 2012, April 2013, and August 2013 by [36], who found mean Chl-a concentration values in El Fangar and El Alfacs of 4 and 3 mg/m3, respectively. The work of [24] further supports our results, given that from April 2016 to August 2017 they estimated mean Chl-a concentrations that ranged from 1.5 mg/m3 to 2.7 mg/m3 for El Fangar and from 2.2 mg/m3 to 3.2 mg/m3 for Els Alfacs. Higher differences could be observed, for instance, with respect to the work of [25], who measured annual average Chl-a concentrations of 4 mg/m3 and 5.2 mg/m3 for El Fangar and Els Alfacs, respectively. There were few studies analysing Chl-a in the coastal lagoons studied. The author of [36] obtained mean Chl-a values (between 2012 and 2013) of 7 mg/m3 and 5 mg/m3 for El Garxal and La Tancada lagoons, respectively. Our results showed seasonal fluctuations from the minimum and maximum mean Chl-a concentrations of 1.7 mg/m3 and 7.7 mg/m3 for El Garxal and of 2.7 mg/m3 and 7 mg/m3 for La Tancada (Figure 3), which are in the same order of magnitude, or slightly higher. On the other hand, according to the fluctuations of the Chl-a mean values obtained for each lagoon, and considering the OECD thresholds defined for the classification of the trophic status of water, the El Fangar and Els Alfacs bays would correspond to oligotrophic waters, while Bassa de L’Estella, El Garxal, Calaixos de Buda, and La Tancada would correspond to mesotrophic waters, according to the Organization for Economic Co-operation and Development (OECD).
The magnitude of the surface temperature data retrieved from 2013 to 2022 was also in agreement with previous measurements in the lagoons of the Ebro Delta, further supporting the effectiveness of the algorithm developed. For instance, El Fangar displayed minimum and maximum temperatures of 8.8 °C and 24.2 °C during the analysed period (Figure 5), which was congruent with the magnitude of the measurements performed from 1968 to 1971 by [42]. These authors measured surface temperature variations spanning from 10 °C to 26 °C. In La Tancada, the range of temperature variations obtained in this work (from 7 °C to 24.5 °C; Figure 5) was similar to that observed by [44], which measured minimum and maximum values of 3.8 °C and 25.4 °C, respectively. In Calaixos de Buda, the same authors measured minimum and maximum temperatures of 6.5 °C and 27.3 °C, while ours were similar and ranged from a minimum value of 7.6 °C and maximum of 24.4°C (Figure 5). Another example that supports our results is the work of [45]. This work showed surface temperatures in Els Alfacs that ranged from approximately 10 °C to 27°C [45] from 1990 to 2004, whereas ours ranged from 9 °C to 22 °C, approximately.
The seasonal patterns of Chl-a concentration were also replicated well by the algorithms developed. In fact, our work showed identical seasonal patterns as those described in [24] for 2017 (higher concentrations in the Els Alfacs than El Fangar bay during winter and early spring, similar values from spring to autumn, and a Chl-a concentration drop in El Fangar in autumn; Figure 3). In general, spring and summer tend to be periods of maximum Chl-a concentration in all the lagoons due to increased light availability and warmer temperatures (as observed also in Figure 5), which are conditions that promote photosynthetic activity [46]. However, the timing of Chl-a concentration peaks may vary depending on many stressors, such as the specific coastal lagoon characteristics or the environmental conditions [9,47]. For that reason, our results sometimes showed Chl-a concentration peaks in autumn (Alfacs in 2015 and 2017, Bassa de L’Estella in 2018, and La Tancada in 2018, 2020, and 2022; see Figure 3) and/or winter (El Fangar in 2017 and 2021, El Garxal in 2019, 2020, and 2022, and Calaixos de Buda in 2018 and 2020; see Figure 3). Deviations from the expected seasonal pattern of Chl-a concentration in the coastal lagoons of the Ebro Delta are not unusual and have been often reported in other works [7,9,24,25,44].
4.2. Factors Influencing the Variability of Chl-a Concentration and Temperature in the Ebro Delta’s Coastal Lagoons
Spatiotemporal heterogeneity is a remarkable feature of coastal lagoons [48], and, indeed, this phenomenon has been noted in the coastal lagoons examined in our study. Temporal variations can be described as responses to the seasonal cycle and freshwater inflow from the Ebro River (from April to December), overlaid with significant spatial variations. The latter depend on the occurrence of aperiodic physical factors (primarily winds) and the dimensional characteristics of the bays [43]. Understanding the complex interplay of the factors controlling the variability of the environmental parameters investigated in this work is essential for the effective management and conservation of these coastal lagoons and others. For instance, comprehending the factors causing the fluctuation of these parameters is highly relevant to detecting blooms potentially toxic to humans as well as mussel farms present in the area, and to evaluating possible health effects [21].
A profound understanding of these coastal lagoons’ natural dynamics and the impact of various stressors are paramount for the effective management and conservation of these ecosystems. Despite the fact that analysing the complex interplay of the factors controlling the variability of the environmental parameters investigated is out of the scope of this work, the observed variability in Chl-a concentration and temperature between the lagoons analysed is likely explained by some of the following key drivers of spatiotemporal variability: temporal fluctuations and spatial distribution of hydrological inputs in the lagoons of interest (e.g., stream inflows, extreme events), nutrient loading (e.g., from river basins or rice fields), salinity gradient fluctuations (which in turn influence nutrient availability and biological productivity), lagoon eco-geomorphological characteristics (e.g., depth, extent, sediment composition), biological processes (e.g., seasonal blooms), and anthropogenic influences such as land use changes (e.g., nutrient runoff from agriculture, industrial pollutant discharges) and climate change (e.g., sea-level rise, temperature fluctuations, altered rainfall patterns) [7,8,9,10,11,13,14].
4.3. Methodological Considerations
The computed preliminary algorithms were able to extract Chl-a concentration and water surface temperature data from the coastal lagoons analysed, detect seasonal and spatial variability in both parameters during the last decade, and define the preliminary trophic status of these lagoons. However, the complete assessment of the trophic status of these lagoons requires the evaluation of the nutrient load impact from the surrounding anthropogenic activities. On the other hand, the algorithms developed to extract Chl-a concentration in this work have limited potential, as the models underestimated Chl-a concentration values under high concentration regimes (see Figure 5a,b). Similar limitations were reported by [25]. This could be attributed to the absence of high Chl-a concentration peaks or to insufficient data measured under such regimes, as in this case. Additional factors that could explain this underestimation are related to the satellite sensor spatial resolution (100 m2 against a few cm2 at the water sampling locations) as well as the temporal window considered, which spanned up to 4 days from the in situ measurement to the actual S2 satellite flyover over the area of interest. However, this time window was also used in other works [40] and reducing it would have resulted in an even smaller dataset [49]. The chosen time window may have masked short-term processes that could lead to rapid transitions in Chl-a concentration, probably due to non-linear effects not considered in the models (e.g., wind events, nutrient discharges, extreme events). Underestimation of key environmental parameters such as Chl-a concentration could lead to incomplete understanding of natural processes, and crucial patterns, interactions, or feedback could remain unnoticed. This issue could be minimised with more frequent satellite revisit times and improved spatial resolutions, or even the use of alternative remote-sensing methods such as drones. The latter, equipped with multispectral or hyperspectral sensors, offer significantly finer spatiotemporal coverage compared to current satellite sensors and have already been used with success [50,51].
Despite these limitations, it is worth noting that this work shed light into the dynamics of Chl-a concentration and surface temperature in the coastal lagoons of Bassa de L’Estella, El Garxal, Calaixos de Buda, and La Tancada, which were not previously investigated at this level of spatial and temporal detail. This article introduced for the first time a fresh insight of the ecological status of some of the Ebro Delta’s coastal lagoons and some of their scales and patterns of variability, opening up a new line of research. Our future goal is to improve the robustness of the algorithms developed. To achieve this, we plan to collect substantial seasonal in situ data from all the lagoons of interest within the Ebro Delta during satellite flyovers, and under a variety of environmental conditions (e.g., wind speeds and directions), including the use of drones. This not only will improve the robustness of the algorithms to extract valuable and accurate environmental data, but it will also help identify the natural and human factors controlling variability shifts within these lagoons. Comprehending the processes governing the short- and medium-term dynamics of the investigated environmental parameters (and others) becomes crucial to inform and guide managers in decision-making processes regarding the long-term maintenance and restoration of the ecological health of these ecosystems when needed. Additionally, it would also help them to anticipate and adapt to the effects of upcoming global changes (e.g., sea-level rise, higher water temperatures, extreme events), utilise the variety of coastal lagoon resources sustainably (e.g., fisheries, aquaculture, recreation), and enhance these coastal lagoons’ resilience to natural and anthropogenic disturbances (e.g., pollution, extreme events), as well as to promote effective policies and planning ensuring the balance between human activities (e.g., agriculture, tourism) and ecological needs.
5. Conclusions
In this work, we developed several preliminary algorithms able to retrieve Chl-a concentration and water surface temperature data from Sentinel-2 and Landsat imagery, respectively, with an accuracy that ranged from 72% to 83%. Despite the Chl-a algorithms underestimating Chl-a under high concentration regimes, the data obtained provided valuable information about the seasonal and spatial variability of both environmental parameters in two bays and four coastal lagoons located at the Ebro Delta (NW Mediterranean Sea, Spain), during a 7-year period (from 2015 to 2022). In the four coastal lagoons analysed (Bassa de L’Estella, El Garxal, Calaixos de Buda, and La Tancada), information about such detailed spatiotemporal analysis was provided for the first time (to the authors’ knowledge). Our findings, which were congruent with observations reported in other works, showed the expected seasonal fluctuations and deviations inherent in these systems, and spatial patterns, despite needing additional investigation, provided very useful information for the management and conservation of these ecosystems.
Future work will focus on increasing the algorithms’ robustness, performing exhaustive field campaigns, and even drone surveys during satellite revisit times. Undoubtedly, this will help unravel the intricacies of the investigated parameter’s variability in these coastal lagoons while empowering managers and politicians to make informed decisions, safeguard these ecosystems, and build their resilience for the future.
Supplementary Materials
The following supporting information can be downloaded at https://www.mdpi.com/article/10.3390/jmse12060941/s1, Figure S1: Map displaying Chl-a concentration patterns for the bays and coastal lagoons analysed in 2016; Figure S2: Map displaying Chl-a concentration patterns for the bays and coastal lagoons analysed in 2017; Figure S3: Map displaying Chl-a concentration patterns for the bays and coastal lagoons analysed in 2018; Figure S4: Map displaying Chl-a concentration patterns for the bays and coastal lagoons analysed in 2019; Figure S5: Map displaying Chl-a concentration patterns for the bays and coastal lagoons analysed in 2020; Figure S6: Map displaying Chl-a concentration patterns for the bays and coastal lagoons analysed in 2022.
Author Contributions
Conceptualisation, L.T., J.A.D.-G., N.N. and I.R.-S.; methodology, L.T., J.A.D.-G. and N.N.; software, L.T.; validation, L.T.; formal analysis, L.T.; investigation, L.T. and N.N.; resources, J.A.D.-G., N.N. and I.R.-S.; data curation, L.T. and N.N.; writing—original draft preparation, L.T.; writing—review and editing, L.T., J.A.D.-G., N.N. and I.R.-S.; visualisation, L.T.; supervision, J.A.D.-G., N.N. and I.R.-S.; project administration, N.N. and I.R.-S.; funding acquisition, N.N. and I.R.-S. All authors have read and agreed to the published version of the manuscript.
Funding
This research was funded by Universidad Rey Juan Carlos within the framework of the projects ‘Estudio integral del sistema barrera arenosa-laguna costera desarrollado en la desembocadura del Ebro como ecosistema centinela para observaciones costeras del cambio global (ICOLADE)’ and ‘Análisis biogeomorfológico del sistema barrera-laguna costera del delta del Ebro. Estudio de su función como ecosistema centinela del cambio global (LAGUNERO)’. Lara Talavera holds a postdoctoral grant modality ‘María Zambrano’ for the Requalification of Spanish University System 2023–2024, funded by the European Union–NextGenerationEU.
Institutional Review Board Statement
Not applicable.
Informed Consent Statement
Not applicable.
Data Availability Statement
Data can be available on reasonable request from the corresponding authors.
Acknowledgments
We acknowledge the use of the data provided by the ACA and the imagery from the Copernicus Sentinel-2 and Landsat missions, provided by the European Space Agency (ESA) and the U.S. Geological Survey, respectively. Nuria Navarro and Inmaculada Rodríguez-Santalla would like to express their gratitude to Jose Antonio Mas, Maria Teresa Nuñez, Angela Raquel Fraguas, Manuel Abad, and Sietske Batenburg for their technical support during the fieldwork. They also acknowledge the Ebro Delta Natural Park for granting access and thank the Canal Vell Biological Station for the use of its facilities.
Conflicts of Interest
The authors declare no conflicts of interest.
References
- The Millennium Ecosystem Assessment. Ecosystems and Human Well-Being: Wetlands and Water; World Resources Institute: Washington, DC, USA, 2005; ISBN 1569735972. [Google Scholar]
- Loureiro, S.; Newton, A.; Icely, J. Boundary conditions for the European Water Framework Directive in the Ria Formosa lagoon, Portugal (physico-chemical and phytoplankton quality elements). Estuar. Coast. Shelf Sci. 2006, 67, 382–398. [Google Scholar] [CrossRef]
- Santos, R.; Silva, J.; Alexandre, A.; Navarro, N.; Barrón, C.; Duarte, C.M. Ecosystem metabolism and carbon fluxes of a tidally-dominated coastal lagoon. Estuaries 2004, 27, 977–985. [Google Scholar] [CrossRef]
- Newton, A.; Brito, A.C.; Icely, J.D.; Derolez, V.; Clara, I.; Angus, S.; Schernewski, G.; Inácio, M.; Lillebø, A.I.; Sousa, A.I. Assessing, quantifying and valuing the ecosystem services of coastal lagoons. J. Nat. Conserv. 2018, 44, 50–65. [Google Scholar] [CrossRef]
- Rodrigues-Filho, J.L.; Macêdo, R.L.; Sarmento, H.; Pimenta, V.R.A.; Alonso, C.; Teixeira, C.R.; Pagliosa, P.R.; Netto, S.A.; Santos, N.C.L.; Daura-Jorge, F.G. From ecological functions to ecosystem services: Linking coastal lagoons biodiversity with human well-being. Hydrobiologia 2023, 850, 2611–2653. [Google Scholar] [CrossRef]
- Garrido, J.; Pérez-Bilbao, A.; João Benetti, C. Biodiversity and conservation of coastal lagoons. In Ecosystems Biodiversity; IntechOpen: London, UK, 2011. [Google Scholar]
- Llebot, C.; Solé, J.; Delgado, M.; Fernández-Tejedor, M.; Camp, J.; Estrada, M. Hydrographical forcing and phytoplankton variability in two semi-enclosed estuarine bays. J. Mar. Syst. 2011, 86, 69–86. [Google Scholar] [CrossRef]
- Brito, A.C.; Newton, A.; Tett, P.; Fernandes, T.F. How will shallow coastal lagoons respond to climate change? A modelling investigation. Estuar. Coast. Shelf Sci. 2012, 112, 98–104. [Google Scholar] [CrossRef]
- F-Pedrera Balsells, M.; Grifoll, M.; Fernandez-Tejedor, M.; Espino, M. Short-Term Response of Chlorophyll a Concentration Due to Intense Wind and Freshwater Peak Episodes in Estuaries: The Case of Fangar Bay (Ebro Delta). Water 2021, 13, 701. [Google Scholar] [CrossRef]
- Kurylyk, B.L.; Smith, K.A. Stuck in the middle: Thermal regimes of coastal lagoons and estuaries in a warming world. Environ. Res. Lett. 2023, 18, 61003. [Google Scholar] [CrossRef]
- Newton, A.; Icely, J.; Cristina, S.; Brito, A.; Cardoso, A.C.; Colijn, F.; Dalla Riva, S.; Gertz, F.; Hansen, J.W.; Holmer, M. An overview of ecological status, vulnerability and future perspectives of European large shallow, semi-enclosed coastal systems, lagoons and transitional waters. Estuar. Coast. Shelf Sci. 2014, 140, 95–122. [Google Scholar] [CrossRef]
- Rodríguez-Santalla, I.; Navarro, N. Main threats in Mediterranean coastal wetlands. The Ebro Delta case. J. Mar. Sci. Eng. 2021, 9, 1190. [Google Scholar] [CrossRef]
- Zou, X.-Y.; Peng, X.-Y.; Zhao, X.-X.; Chang, C.-P. The impact of extreme weather events on water quality: International evidence. Nat. Hazards 2023, 115, 1–21. [Google Scholar] [CrossRef]
- Caballero, I.; Roca, M.; Dunbar, M.B.; Navarro, G. Water Quality and Flooding Impact of the Record-Breaking Storm Gloria in the Ebro Delta (Western Mediterranean). Remote Sens. 2023, 16, 41. [Google Scholar] [CrossRef]
- Jiang, D.; Hao, M.; Fu, J. Monitoring the coastal environment using remote sensing and GIS techniques. Appl. Stud. Coast. Mar. Environ. 2016, 2, 23–35. [Google Scholar]
- Klemas, V. Remote sensing techniques for studying coastal ecosystems: An overview. J. Coast. Res. 2011, 27, 2–17. [Google Scholar]
- El Mahrad, B.; Newton, A.; Icely, J.D.; Kacimi, I.; Abalansa, S.; Snoussi, M. Contribution of remote sensing technologies to a holistic coastal and marine environmental management framework: A review. Remote Sens. 2020, 12, 2313. [Google Scholar] [CrossRef]
- Guanter, L.; Ruiz-Verdú, A.; Odermatt, D.; Giardino, C.; Simis, S.; Estellés, V.; Heege, T.; Domínguez-Gómez, J.A.; Moreno, J. Atmospheric correction of ENVISAT/MERIS data over inland waters: Validation for European lakes. Remote Sens. Environ. 2010, 114, 467–480. [Google Scholar] [CrossRef]
- Gómez, J.A.D.; Alonso, C.A.; García, A.A. Remote sensing as a tool for monitoring water quality parameters for Mediterranean Lakes of European Union water framework directive (WFD) and as a system of surveillance of cyanobacterial harmful algae blooms (SCyanoHABs). Environ. Monit. Assess. 2011, 181, 317–334. [Google Scholar] [CrossRef]
- Delegido, J.; Tenjo, C.; Ruiz-Verdú, A.; Peña, R.; Moreno, J. Modelo empírico para la determinación de clorofila-a en aguas continentales a partir de los futuros Sentinel-2 y 3. Validación con imágenes HICO. Rev. Teledetec. 2014, 41, 37–47. [Google Scholar] [CrossRef][Green Version]
- Laneve, G.; Téllez, A.; Kallikkattil Kuruvila, A.; Bruno, M.; Messineo, V. Eutrophication and HAB Occurrence Control in Lakes of Different Origins: A Multi-Source Remote Sensing Detection Strategy. Remote Sens. 2024, 16, 1792. [Google Scholar] [CrossRef]
- Erena, S.H.; Worku, H. Urban flood vulnerability assessments: The case of Dire Dawa city, Ethiopia. Nat. Hazards 2019, 97, 495–516. [Google Scholar] [CrossRef]
- Galešić Divić, M.; Kvesić Ivanković, M.; Divić, V.; Kišević, M.; Panić, M.; Lugonja, P.; Crnojević, V.; Andričević, R. Estimation of Water Quality Parameters in Oligotrophic Coastal Waters Using Uncrewed-Aerial-Vehicle-Obtained Hyperspectral Data. J. Mar. Sci. Eng. 2023, 11, 2026. [Google Scholar] [CrossRef]
- Soriano-González, J.; Angelats, E.; Fernández-Tejedor, M.; Diogene, J.; Alcaraz, C. First results of phytoplankton spatial dynamics in two NW-Mediterranean bays from chlorophyll-a estimates using Sentinel 2: Potential implications for aquaculture. Remote Sens. 2019, 11, 1756. [Google Scholar] [CrossRef]
- Fernández-Tejedor, M.; Velasco, J.E.; Angelats, E. Accurate estimation of Chlorophyll-a concentration in the coastal areas of the Ebro Delta (NW Mediterranean) using Sentinel-2 and its application in the selection of areas for mussel aquaculture. Remote Sens. 2022, 14, 5235. [Google Scholar] [CrossRef]
- Ahmed, M.H.; El Leithy, B.M.; Thompson, J.R.; Flower, R.J.; Ramdani, M.; Ayache, F.; Hassan, S.M. Application of remote sensing to site characterisation and environmental change analysis of North African coastal lagoons. Hydrobiologia 2009, 622, 147–171. [Google Scholar] [CrossRef]
- Zoffoli, M.L.; Gernez, P.; Rosa, P.; Le Bris, A.; Brando, V.E.; Barillé, A.-L.; Harin, N.; Peters, S.; Poser, K.; Spaias, L. Sentinel-2 remote sensing of Zostera noltei-dominated intertidal seagrass meadows. Remote Sens. Environ. 2020, 251, 112020. [Google Scholar] [CrossRef]
- Jaud, M.; Delacourt, C.; Le Dantec, N.; Ammann, J.; Grandjean, P.; Allemand, P.; Cocquempot, L. Potential of imaging UAVs for coastal monitoring. In Remote Detection and Maritime Pollution: Chemical Spill Studies; Wiley: Hoboken, NJ, USA, 2021; pp. 133–142. [Google Scholar] [CrossRef]
- Diruit, W.; Le Bris, A.; Bajjouk, T.; Richier, S.; Helias, M.; Burel, T.; Lennon, M.; Guyot, A.; Ar Gall, E. Seaweed habitats on the shore: Characterization through hyperspectral UAV imagery and field sampling. Remote Sens. 2022, 14, 3124. [Google Scholar] [CrossRef]
- Timmer, B.; Reshitnyk, L.Y.; Hessing-Lewis, M.; Juanes, F.; Costa, M. Comparing the use of red-edge and near-infrared wavelength ranges for detecting submerged kelp canopy. Remote Sens. 2022, 14, 2241. [Google Scholar] [CrossRef]
- Mishra, S.; Stumpf, R.P.; Meredith, A. Evaluation of RapidEye data for mapping algal blooms in inland waters. Int. J. Remote Sens. 2019, 40, 2811–2829. [Google Scholar] [CrossRef]
- Caballero, I.; Fernández, R.; Escalante, O.M.; Mamán, L.; Navarro, G. New capabilities of Sentinel-2A/B satellites combined with in situ data for monitoring small harmful algal blooms in complex coastal waters. Sci. Rep. 2020, 10, 8743. [Google Scholar] [CrossRef]
- Soriano Gonzalez, J.; Fernández Tejedor, M.; Alcaraz, C. Combined flooding and water quality monitoring during short extreme events using Sentinel 2: The case study of Gloria storm in Ebro delta. ISPRS Ann. Photogramm. Remote Sens. Spat. Inf. Sci. 2022, 3, 361–368. [Google Scholar]
- Braga, F.; Scarpa, G.M.; Brando, V.E.; Manfè, G.; Zaggia, L. COVID-19 lockdown measures reveal human impact on water transparency in the Venice Lagoon. Sci. Total Environ. 2020, 736, 139612. [Google Scholar] [CrossRef]
- Genua-Olmedo, A.; Alcaraz, C.; Caiola, N.; Ibáñez, C. Sea level rise impacts on rice production: The Ebro Delta as an example. Sci. Total Environ. 2016, 571, 1200–1210. [Google Scholar] [CrossRef]
- Benito, X.; Trobajo, R.; Ibáñez, C. Benthic diatoms in a Mediterranean delta: Ecological indicators and a conductivity transfer function for paleoenvironmental studies. J. Paleolimnol. 2015, 54, 171–188. [Google Scholar] [CrossRef]
- Franquet Bernis, J.M.; Albacar Damian, M.A.; Tallada de Esteve, F. Problemática del Río Ebro en Su Tramo Final. Informe Acerca de los Efectos Sobre el Área Jurisdiccional de la Comunidad de Regantes–Sindicato Agrícola del Ebro; UNED-Tortosa: Tarragona, Spain, 2017. [Google Scholar]
- Cateura, J.; Sánchez-Arcilla, A.; Bolaños, R. Clima de viento en el delta del Ebro. Relación con el estado del mar. In El clima entre el mar y la montaña; García Codron, J.C., Diego Liaño, C., de Arróyabe Hernáez, P.F., Garmendia Pedraja, C., Rasilla Álvarez, D., Eds.; Asociación Española de Climatología: Santander, Spain, 2004; pp. 463–472. [Google Scholar]
- Aranda García, M.; Gracia Prieto, F.J.; Rodríguez-Santalla, I. Historical morphological changes (1956–2017) and future trends at the mouth of the Ebro River delta (NE Spain). Cuad. Investig. Geogr. 2022, 293–307. [Google Scholar] [CrossRef]
- Warren, M.A.; Simis, S.G.H.; Martinez-Vicente, V.; Poser, K.; Bresciani, M.; Alikas, K.; Spyrakos, E.; Giardino, C.; Ansper, A. Assessment of atmospheric correction algorithms for the Sentinel-2A MultiSpectral Imager over coastal and inland waters. Remote Sens. Environ. 2019, 225, 267–289. [Google Scholar] [CrossRef]
- García-Plazaola, J.I.; Becerril, J.M. Seasonal changes in photosynthetic pigments and antioxidants in beech (Fagus sylvatica) in a Mediterranean climate: Implications for tree decline diagnosis. Funct. Plant Biol. 2001, 28, 225–232. [Google Scholar] [CrossRef]
- López, J.; Arté, P. Hidrografía y fitoplancton del puerto del Fangar (delta del Ebro). Investig. Pesq. 1973, 37, 17–56. [Google Scholar]
- Delgado, M. Fitoplancton de las Bahías del Delta del Ebro. Investig. Pesq. 1987, 51, 517–548. [Google Scholar]
- Comín, F.A. Características físicas y químicas y fitoplancton de las lagunas costeras, Encañizada, Tancada y Buda (Delta del Ebro). Oecol. Aquat. 1984, 7, 79–162. [Google Scholar]
- Solé, J.; Turiel, A.; Estrada, M.; Llebot, C.; Blasco, D.; Camp, J.; Delgado, M.; Fernandez-Tejedor, M.; Diogene, J. Climatic forcing on hydrography of a Mediterranean bay (Alfacs Bay). Cont. Shelf Res. 2009, 29, 1786–1800. [Google Scholar] [CrossRef]
- Prado, P.; Caiola, N.; Ibáñez, C. Water management alters phytoplankton and zooplankton communities in Ebro delta coastal lagoons. Limnetica 2017, 36, 113–126. [Google Scholar]
- Cañedo-Argüelles, M.; Rieradevall, M.; Farrés-Corell, R.; Newton, A. Annual characterisation of four Mediterranean coastal lagoons subjected to intense human activity. Estuar. Coast. Shelf Sci. 2012, 114, 59–69. [Google Scholar] [CrossRef]
- Postma, H. Chemistry of coastal lagoons. In Lagunas Costeras, Simposio, Mem. Simp. Inter. Lagunas Costeras, UNAM/UNESCO; Pascal and Francis, Centre National de la Recherche Scientifique (Francia); Institut de l’Information Scientifique et Technique: Paris, France, 1969; pp. 421–430. [Google Scholar]
- Bramich, J.; Bolch, C.J.S.; Fischer, A. Improved red-edge chlorophyll-a detection for Sentinel 2. Ecol. Indic. 2021, 120, 106876. [Google Scholar] [CrossRef]
- Shang, S.; Lee, Z.; Lin, G.; Hu, C.; Shi, L.; Zhang, Y.; Li, X.; Wu, J.; Yan, J. Sensing an intense phytoplankton bloom in the western Taiwan Strait from radiometric measurements on a UAV. Remote Sens. Environ. 2017, 198, 85–94. [Google Scholar] [CrossRef]
- Román, A.; Heredia, S.; Windle, A.E.; Tovar-Sánchez, A.; Navarro, G. Enhancing Georeferencing and Mosaicking Techniques over Water Surfaces with High-Resolution Unmanned Aerial Vehicle (UAV) Imagery. Remote Sens. 2024, 16, 290. [Google Scholar] [CrossRef]


Disclaimer/Publisher’s Note: The statements, opinions and data contained in all publications are solely those of the individual author(s) and contributor(s) and not of MDPI and/or the editor(s). MDPI and/or the editor(s) disclaim responsibility for any injury to people or property resulting from any ideas, methods, instructions or products referred to in the content. |
© 2024 by the authors. Licensee MDPI, Basel, Switzerland. This article is an open access article distributed under the terms and conditions of the Creative Commons Attribution (CC BY) license (https://creativecommons.org/licenses/by/4.0/).