The Influence of Beachrock Outcrop on Spatial Variability in Beach Morphology


Abstract
1. Introduction
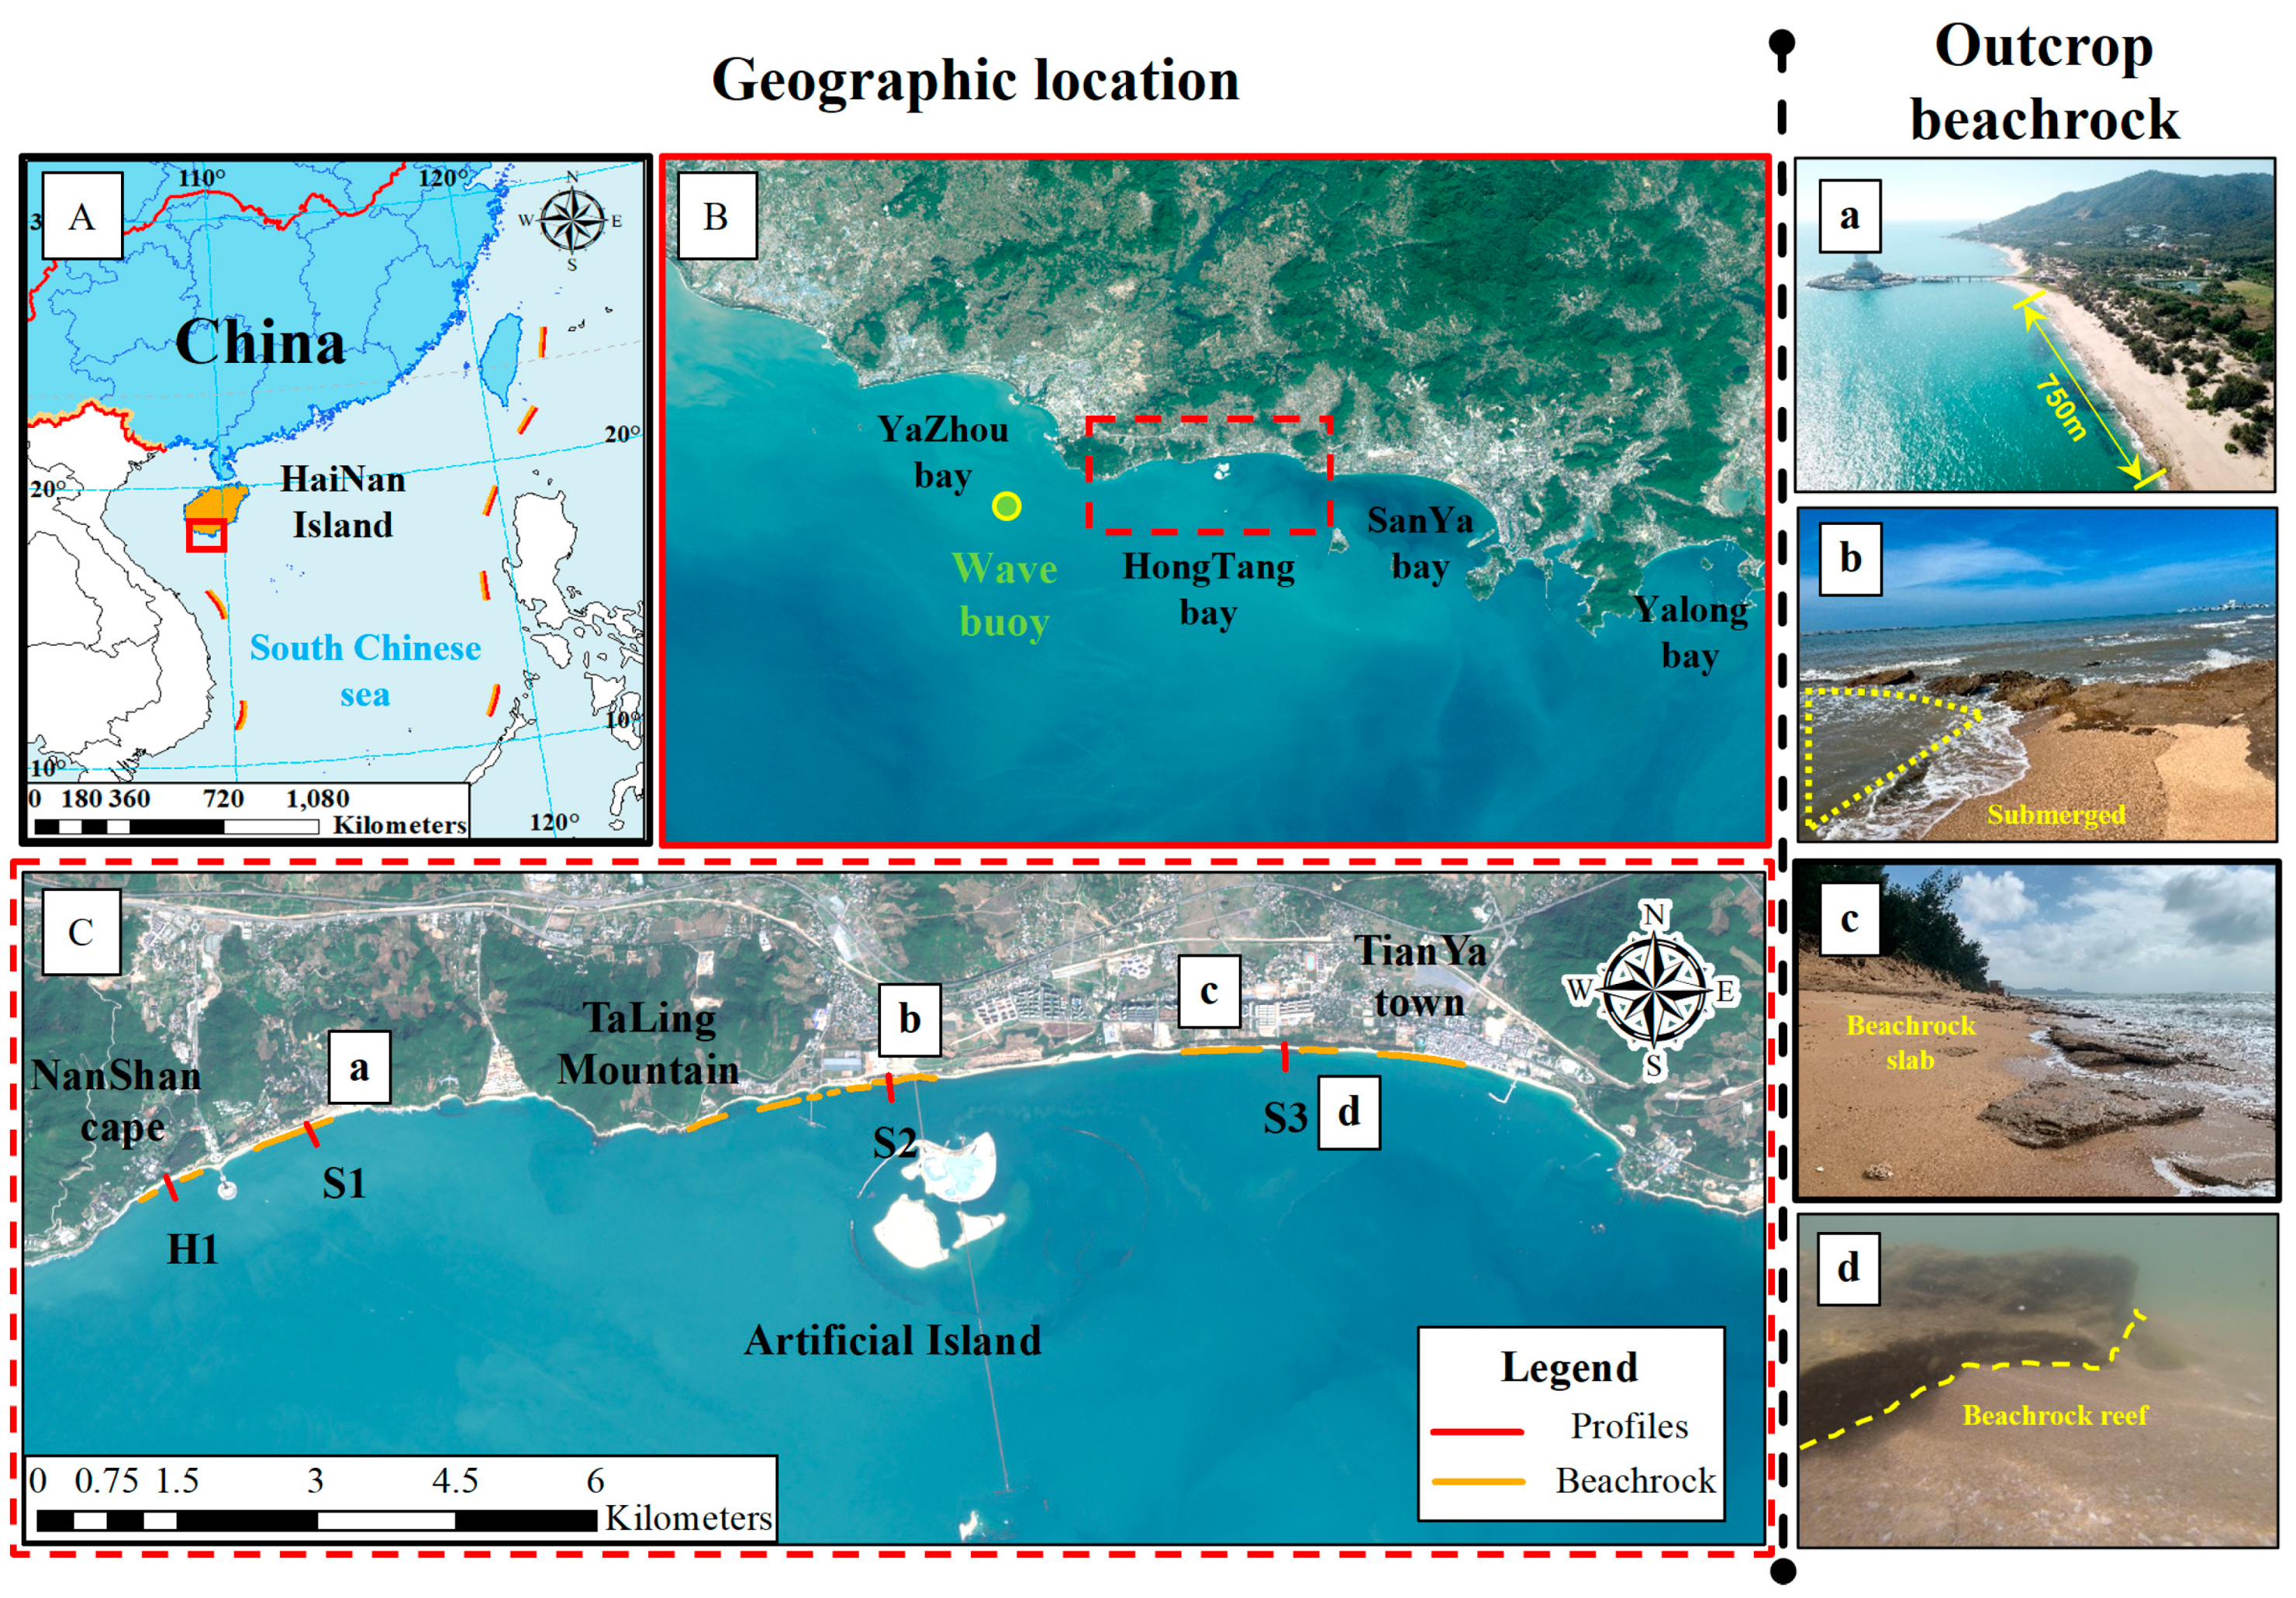
2. Study Area
2.1. Geography
2.2. Hydrodynamic Characteristics
2.3. Recent Morphodynamics of HongTang Bay
3. Materials and Methods
3.1. Field Survey
3.2. Profile Analysis
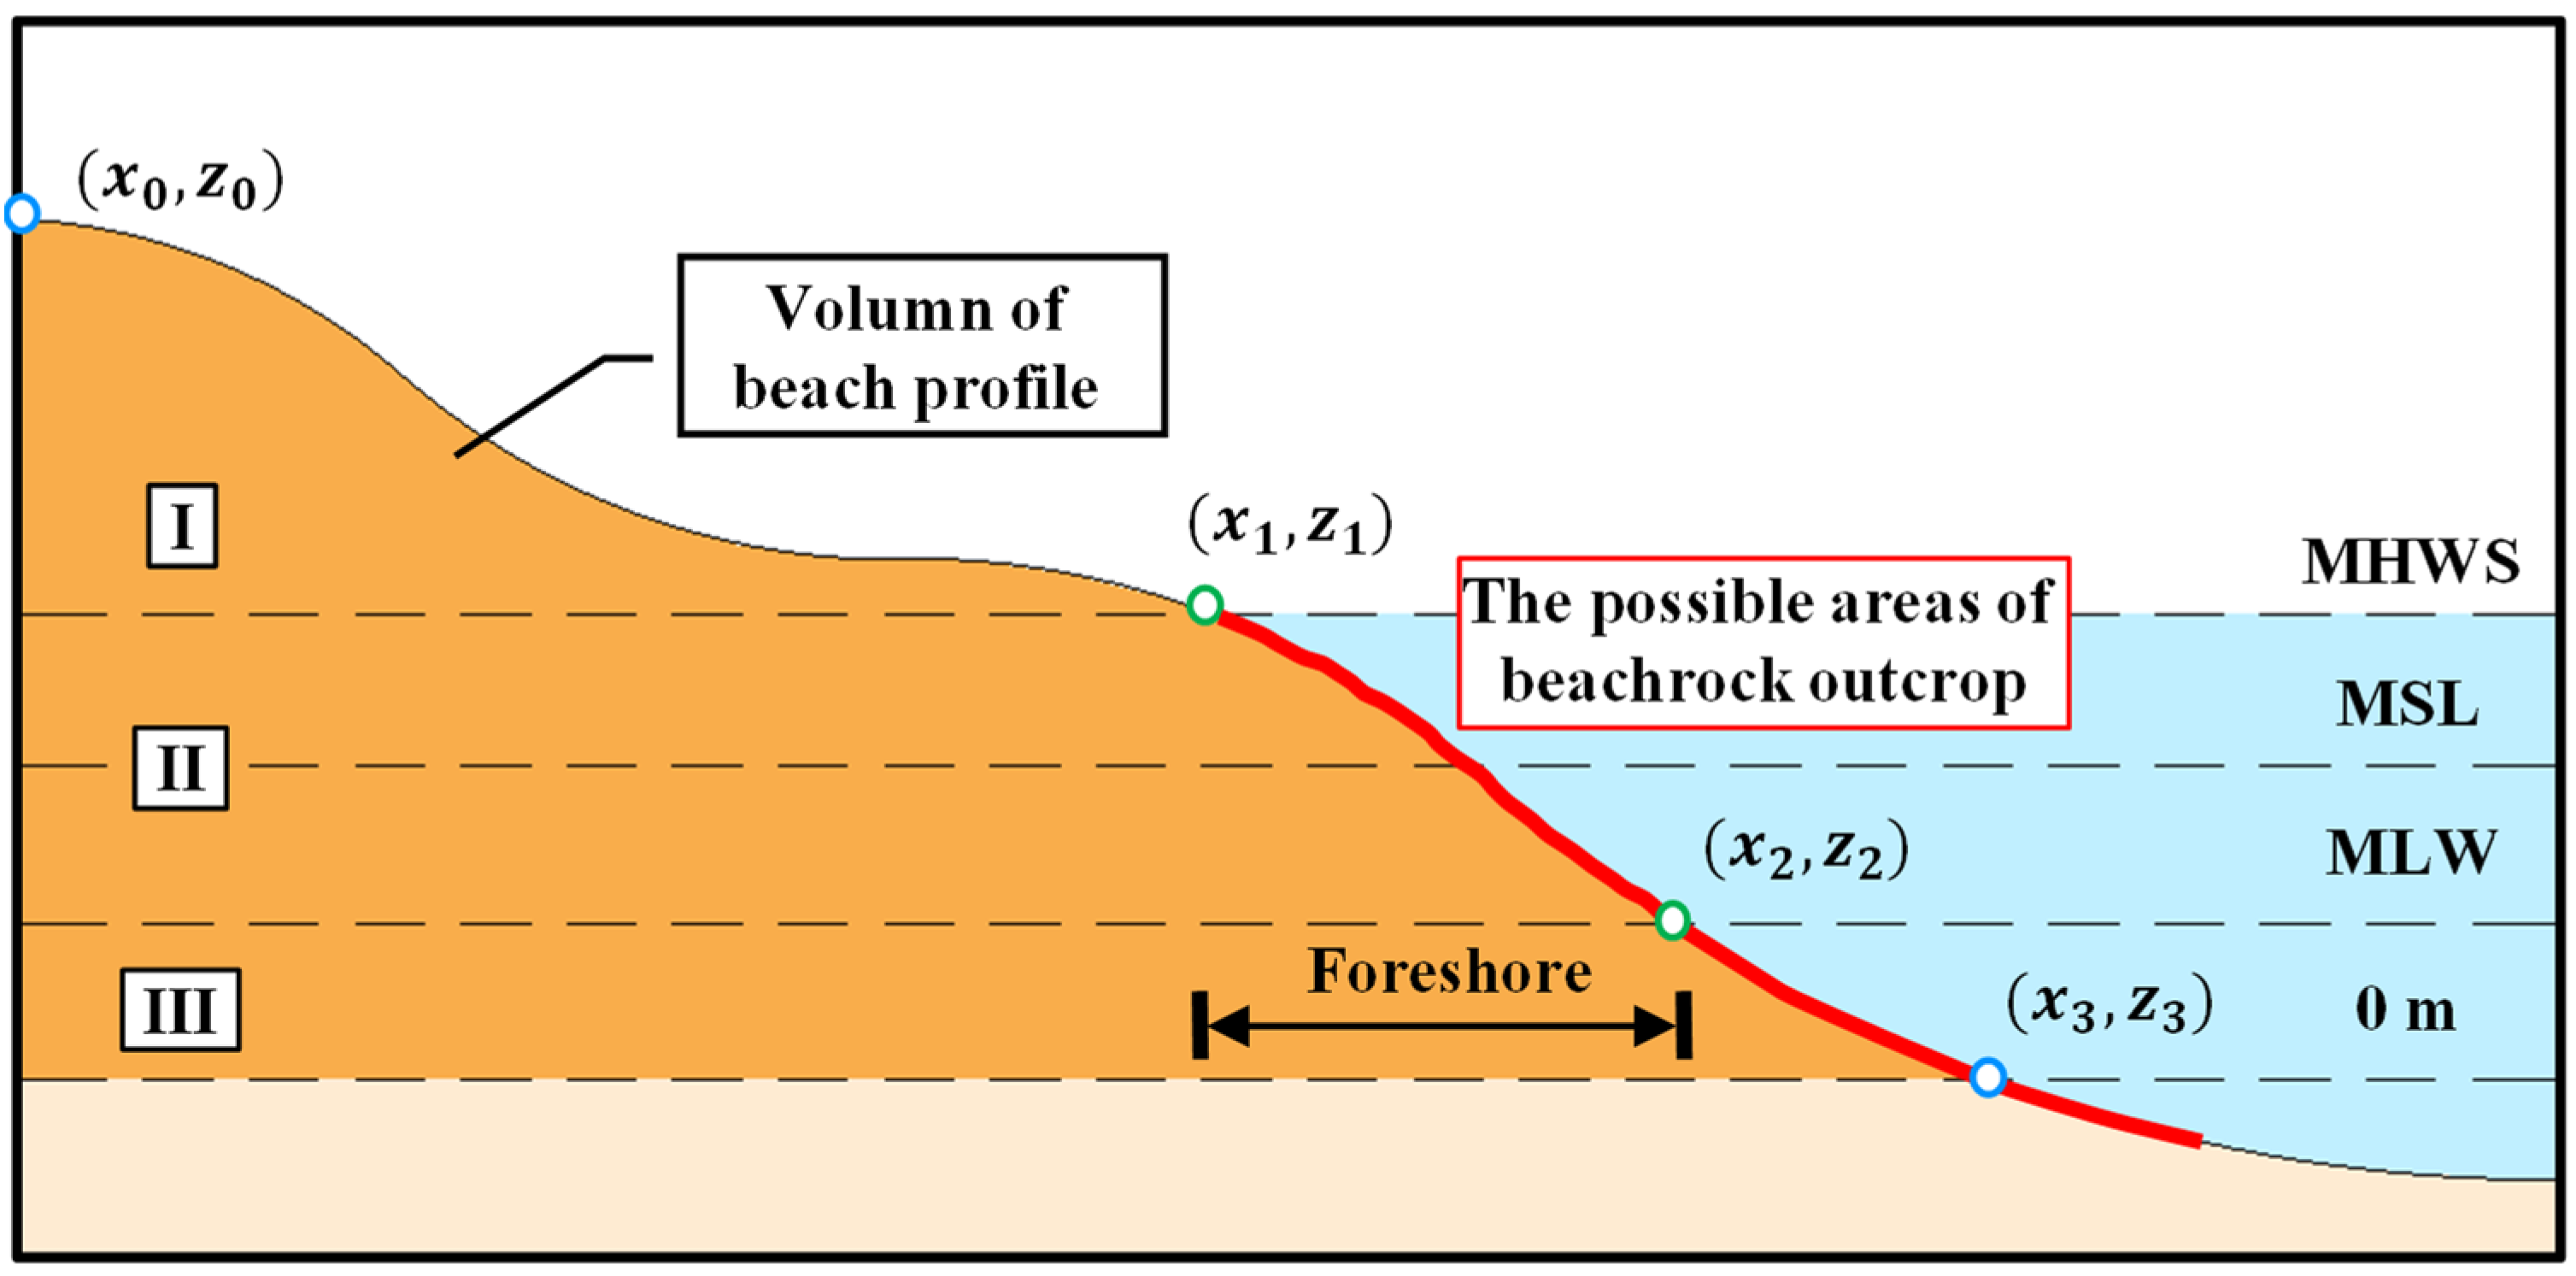
3.2.1. The Parameterization of Profile Features
3.2.2. EOF (Empirical Orthogonal Function)
4. Results
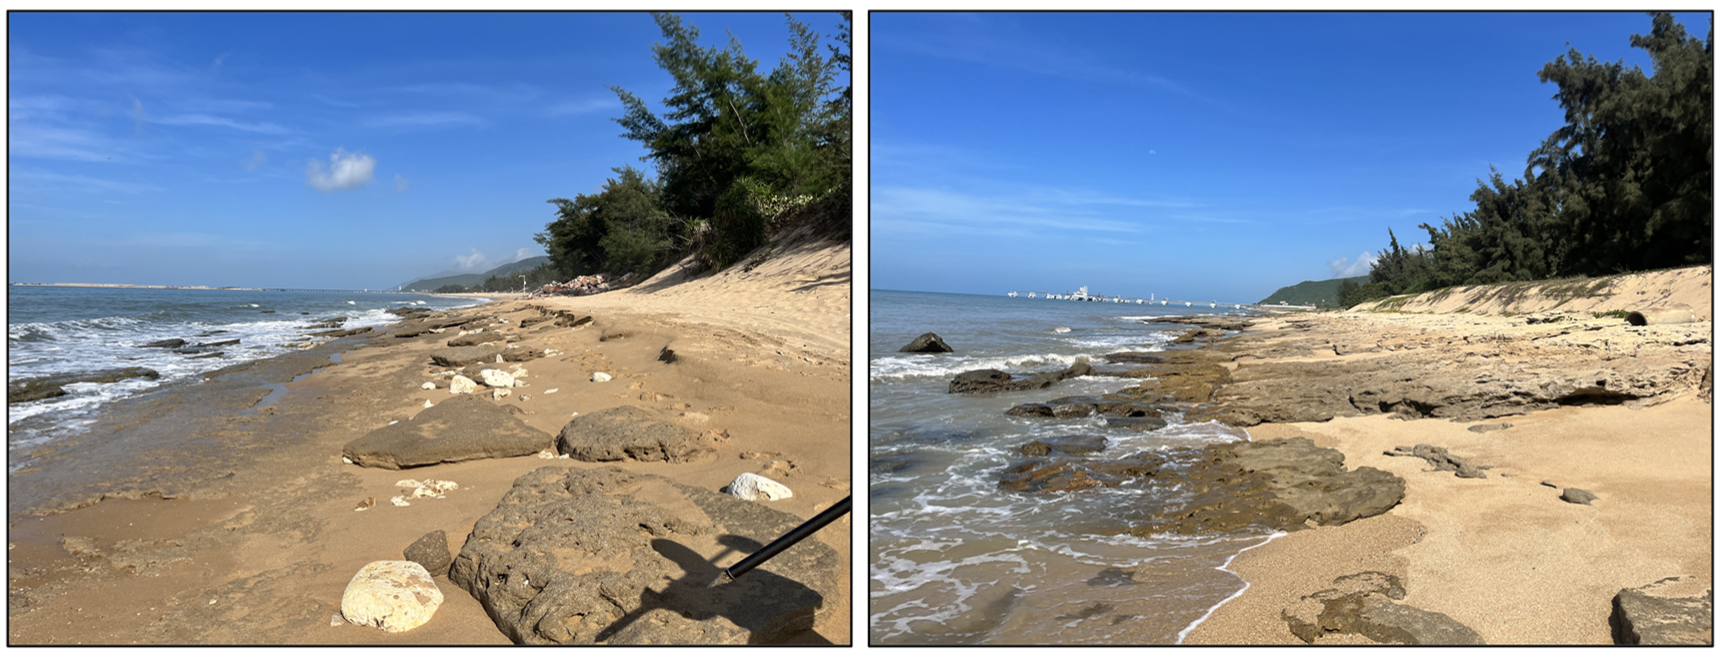
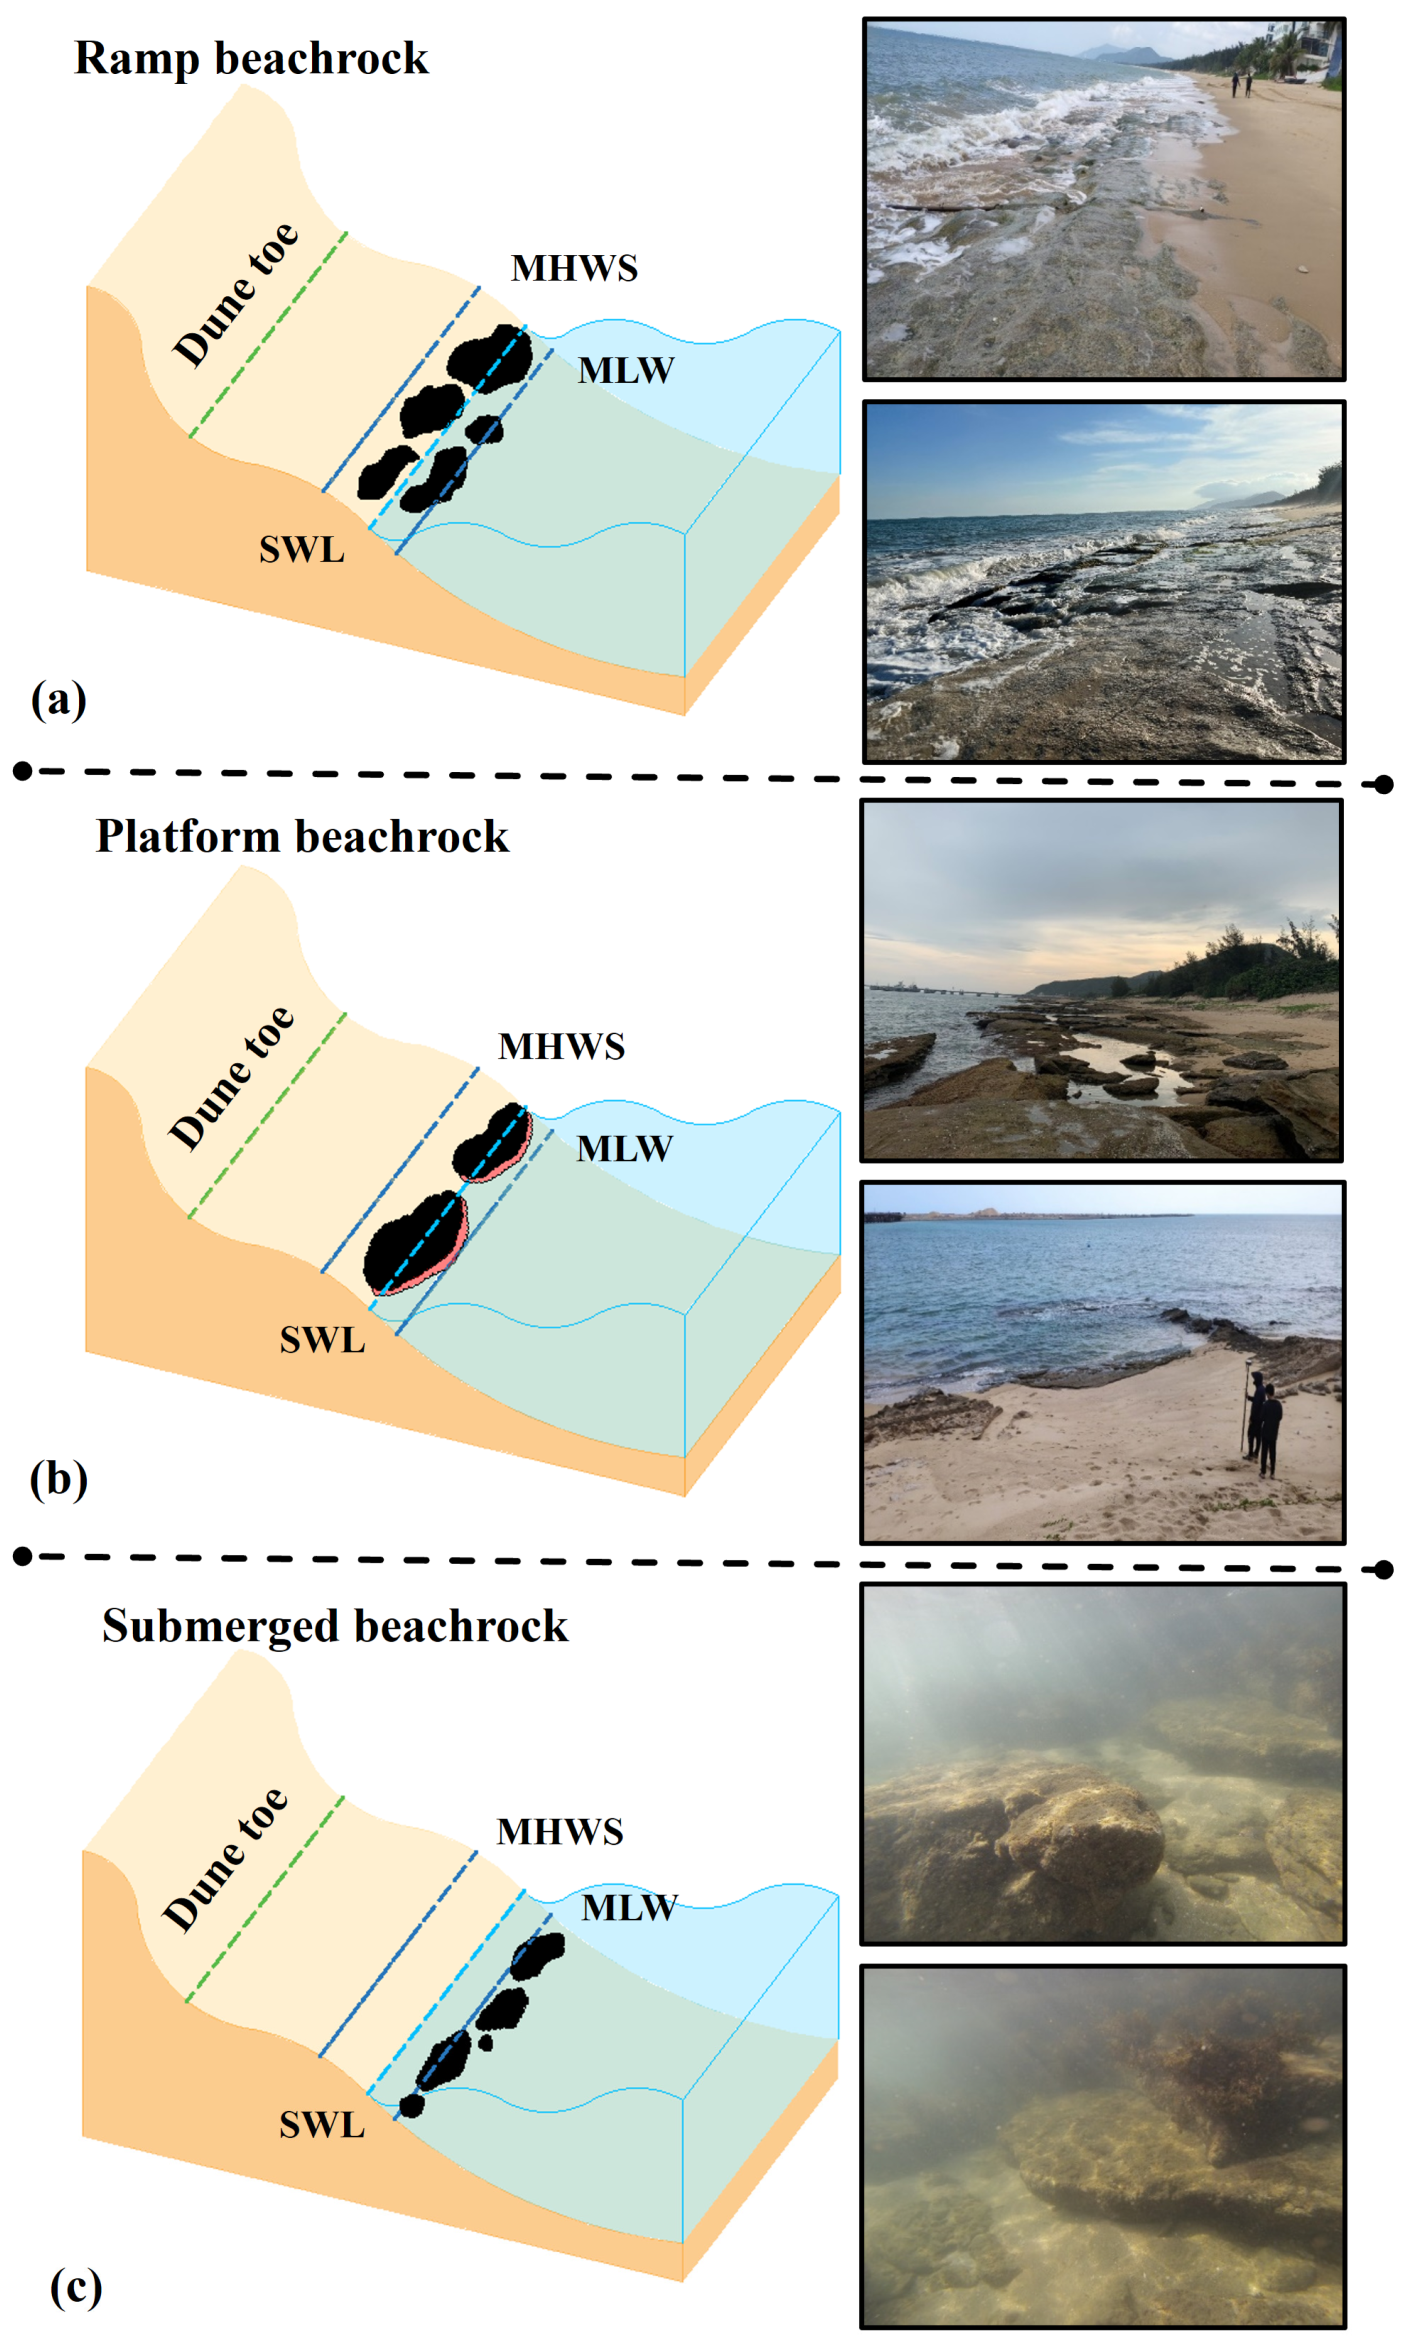
4.1. Morphological Characteristics of Exposed Beachrocks
4.2. Profile Evolution Characteristics under the Influence of Beachrocks
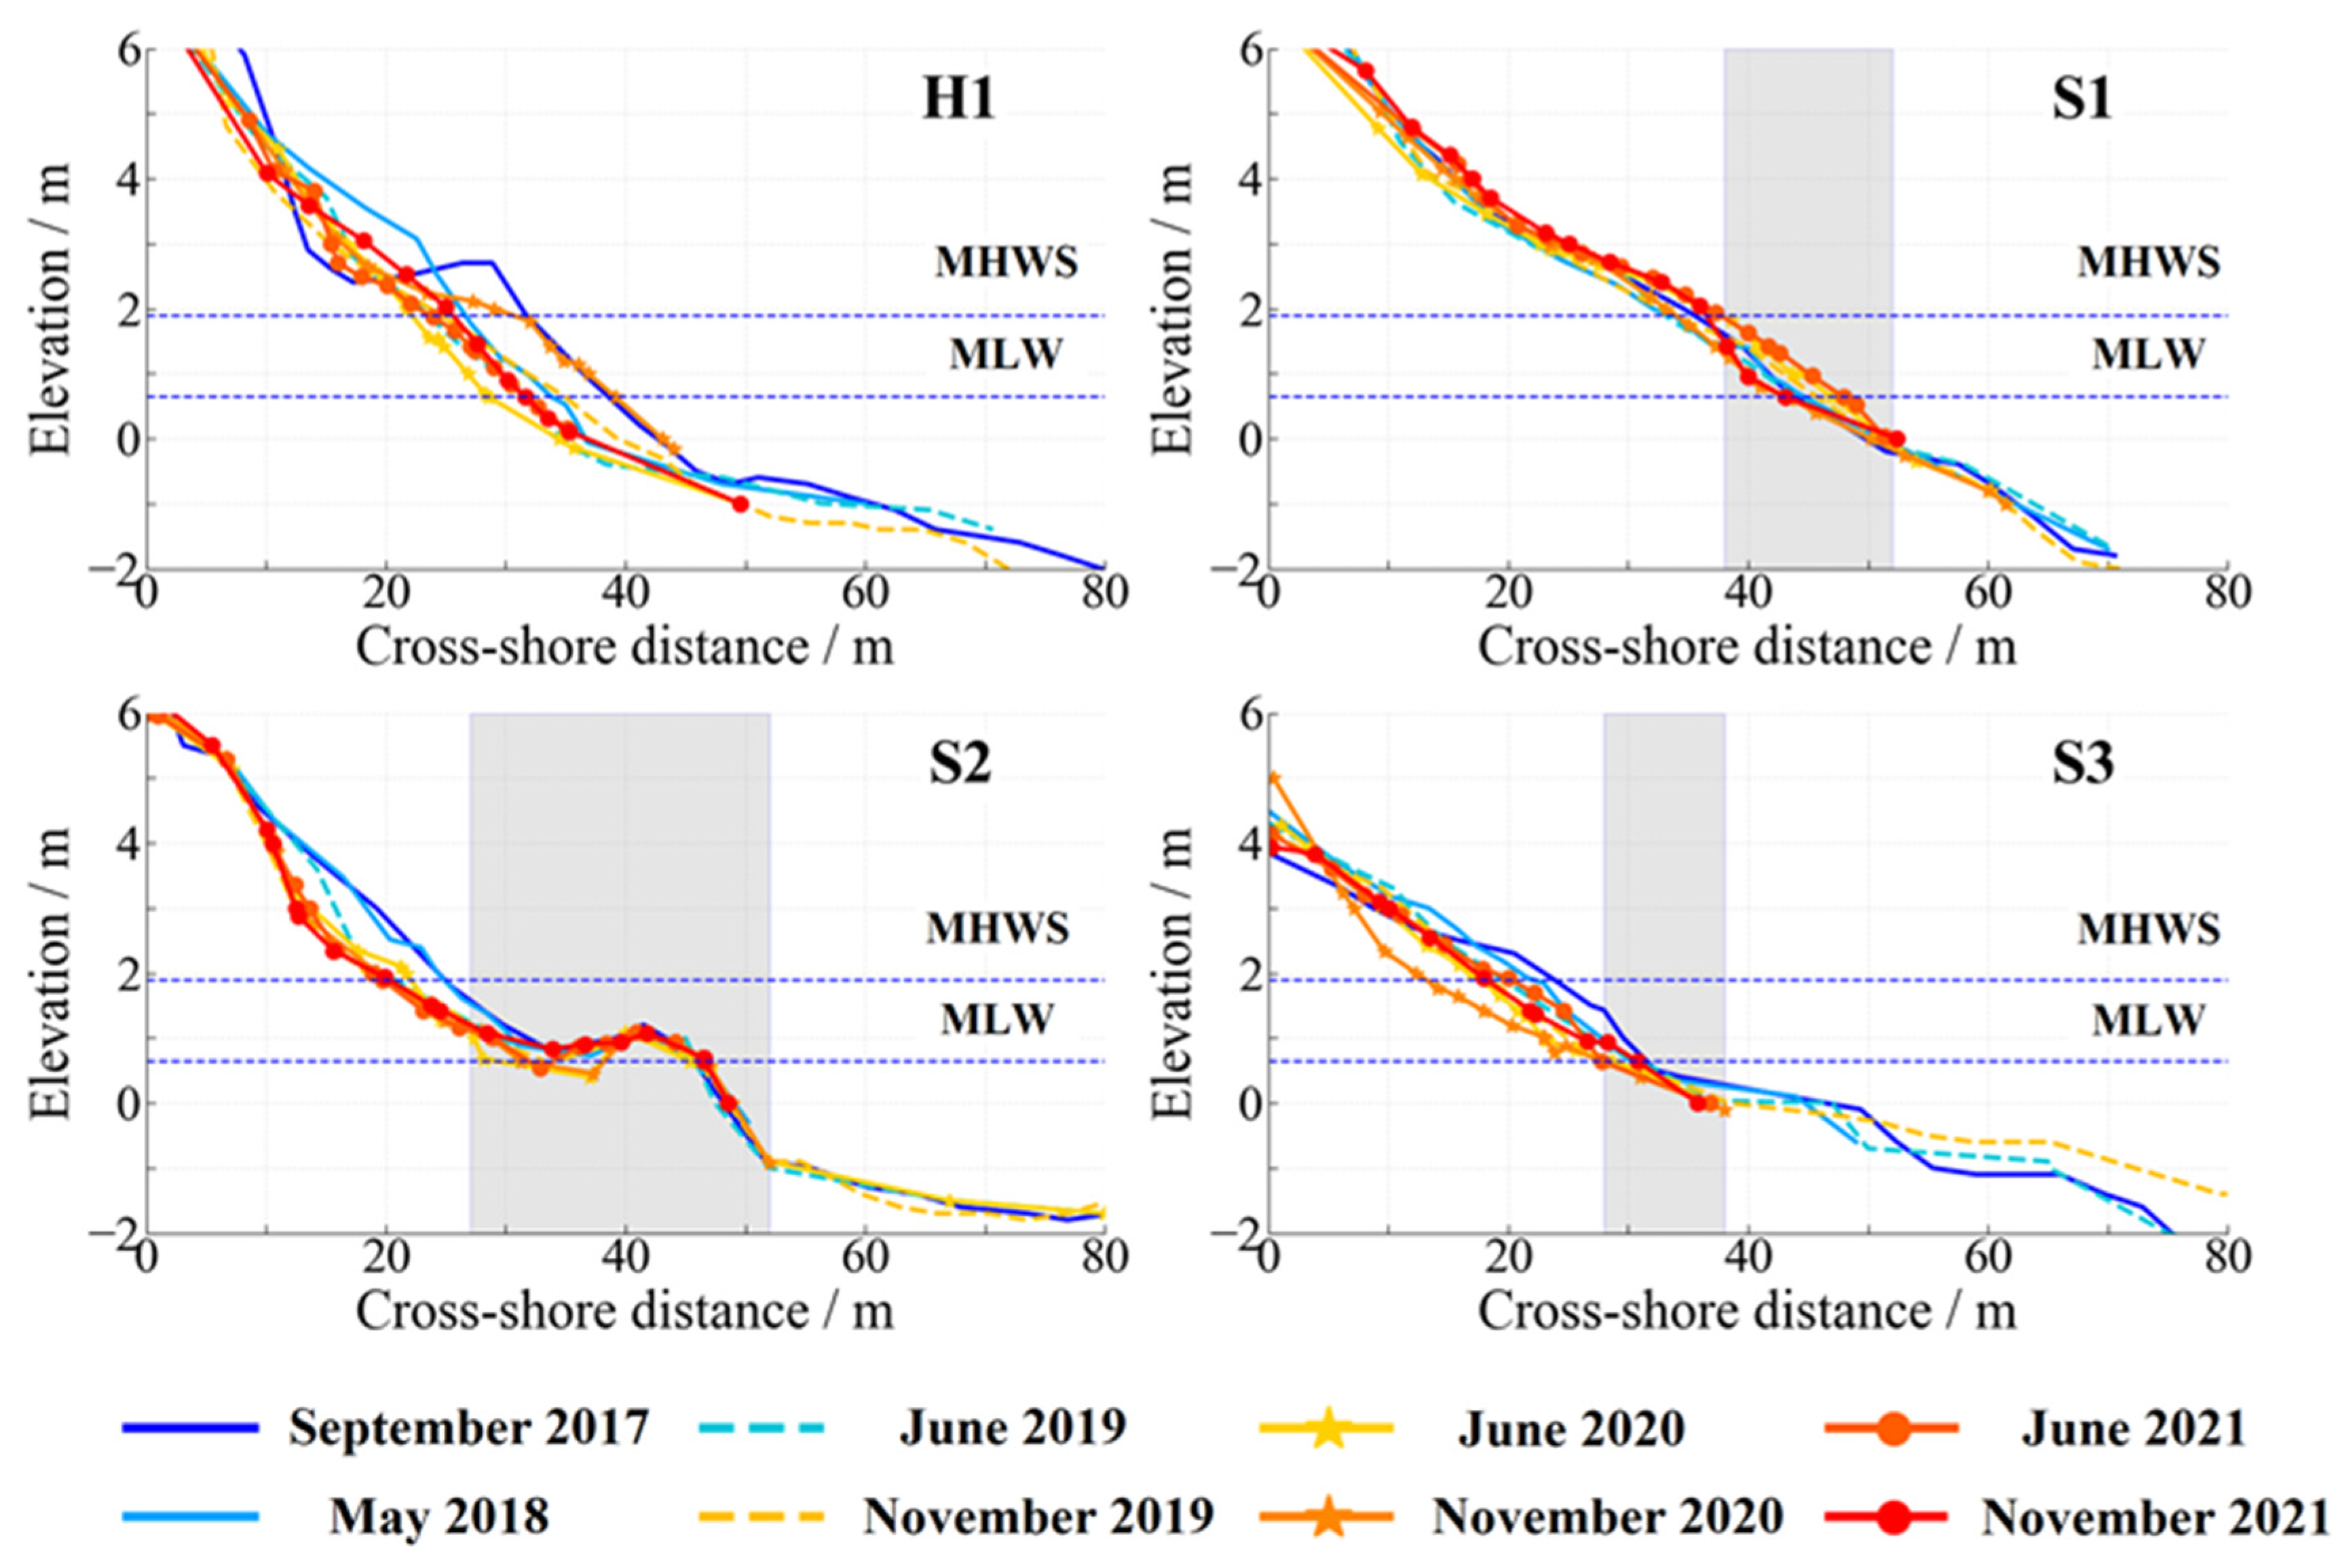
4.2.1. Morphological Evolution Characteristics of Beach Profiles
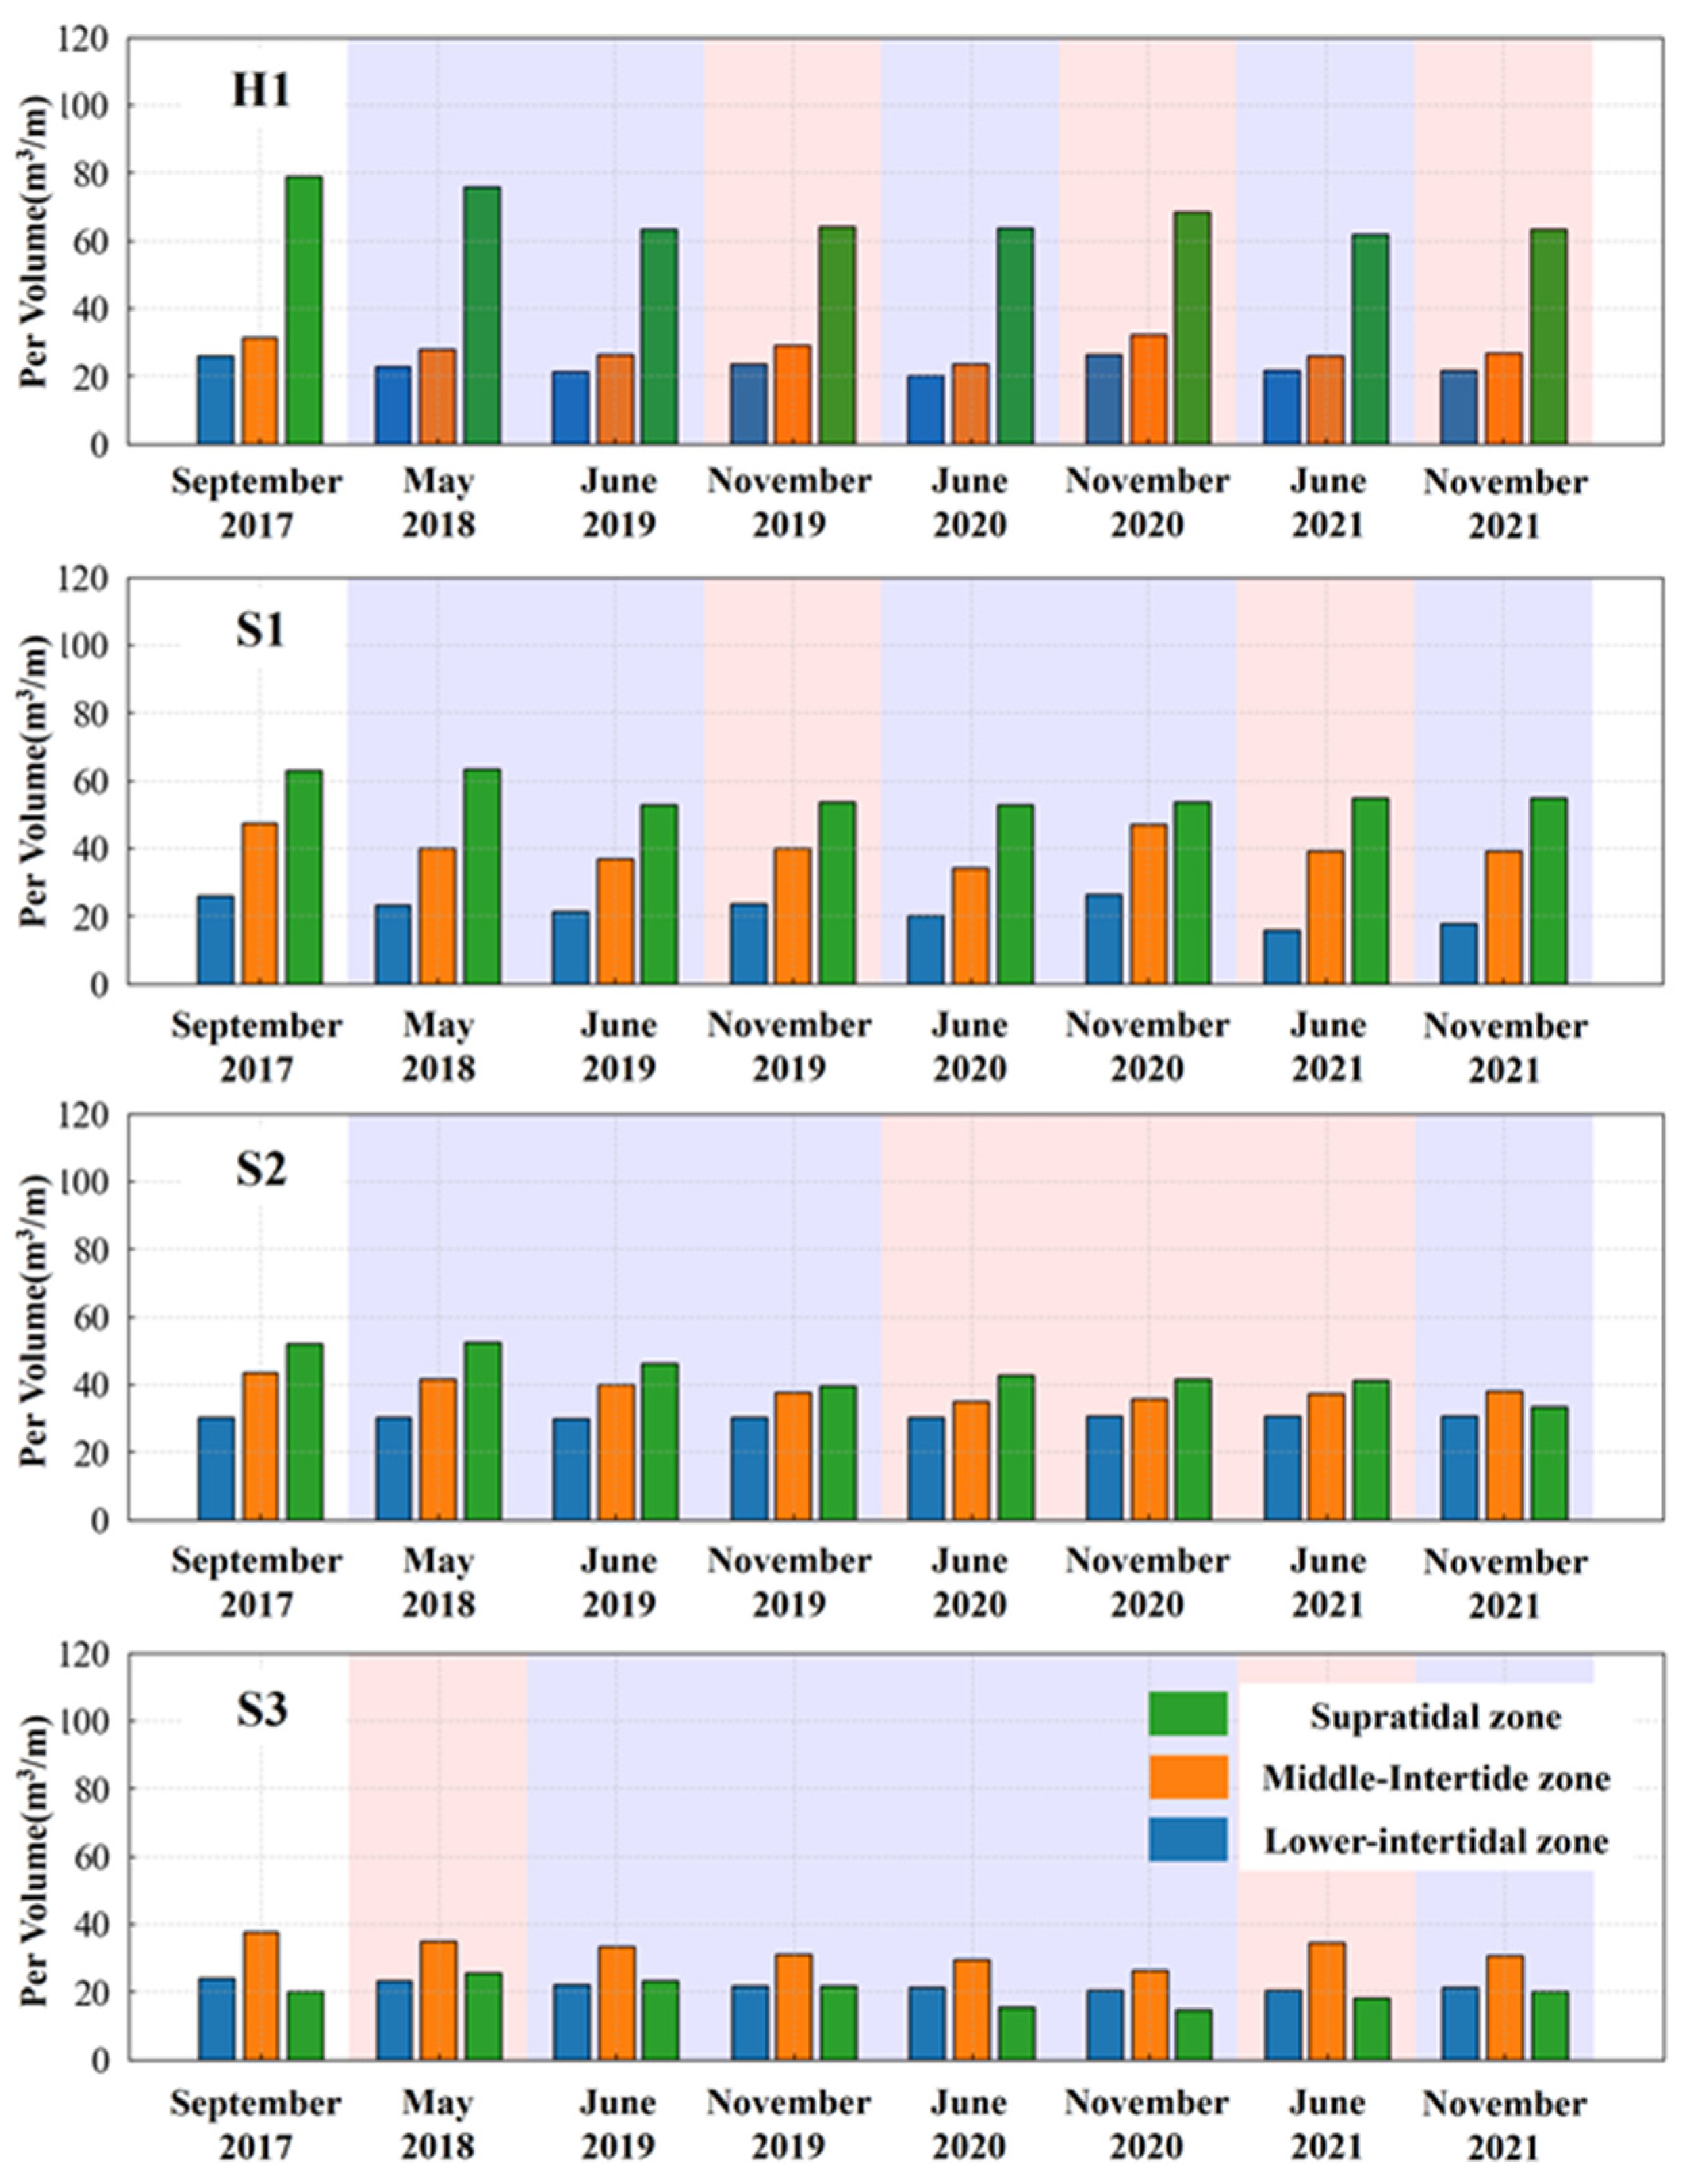
4.2.2. Variation in Beach Single-Width Volume
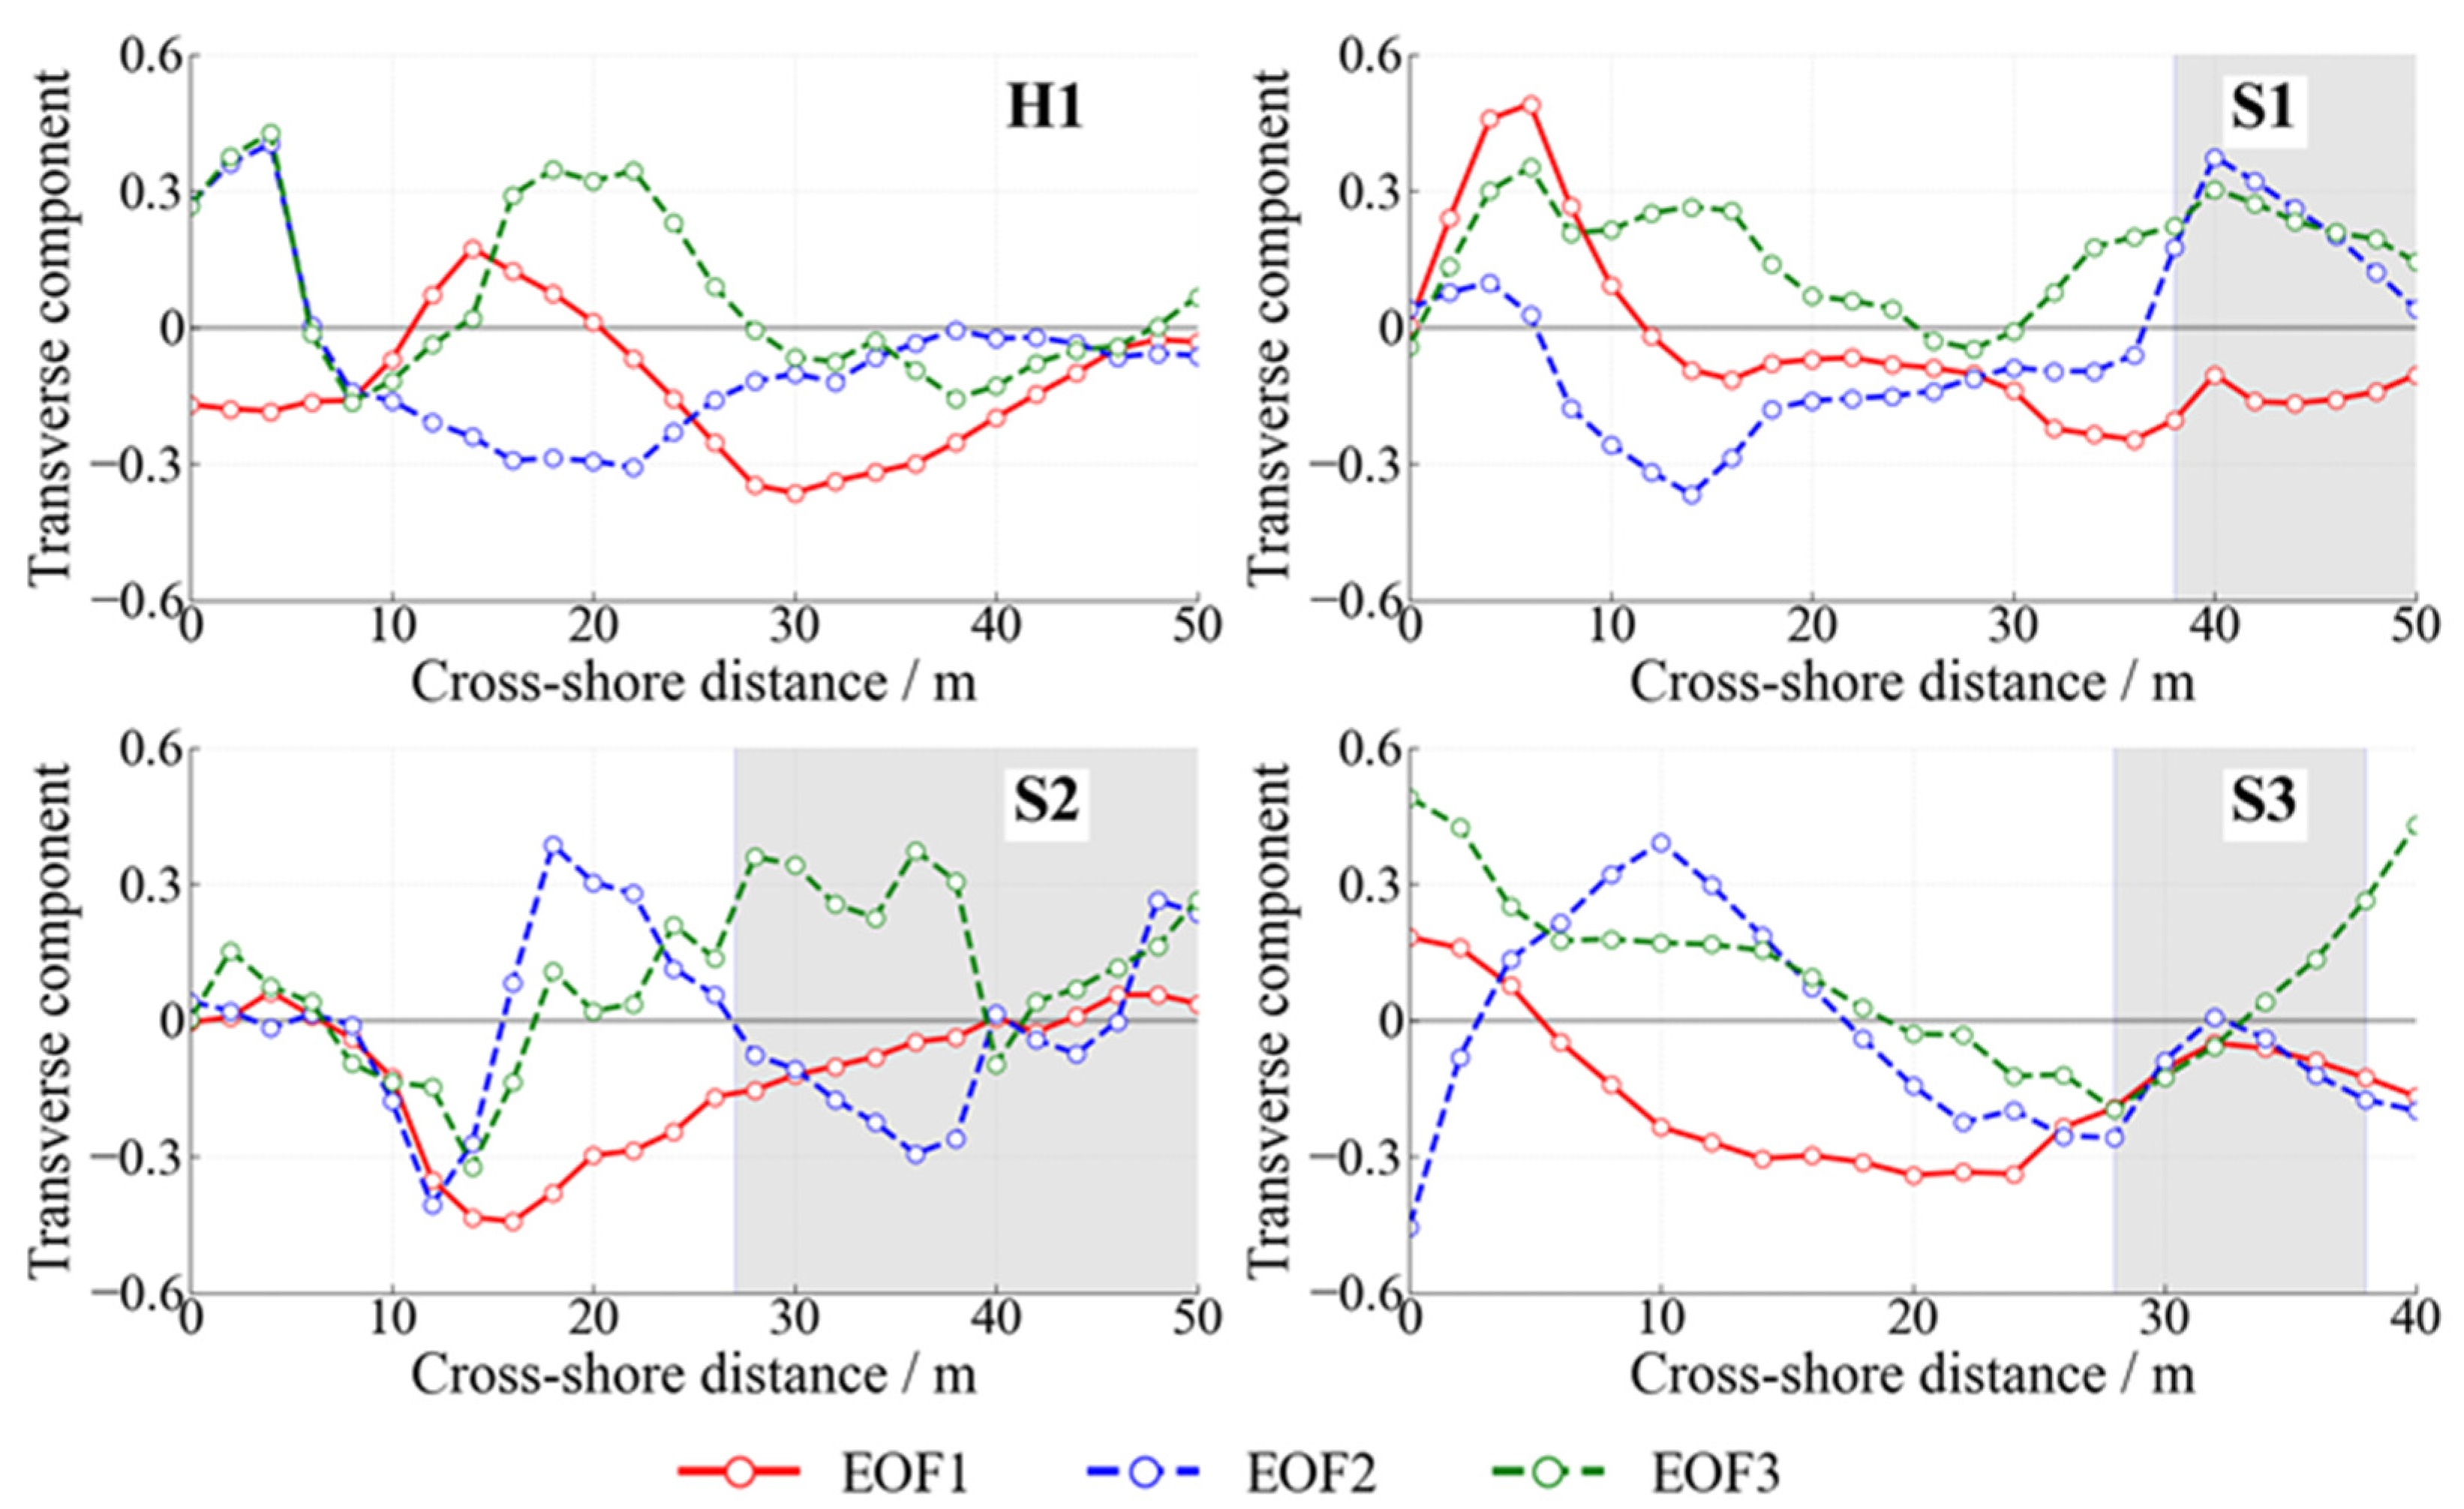
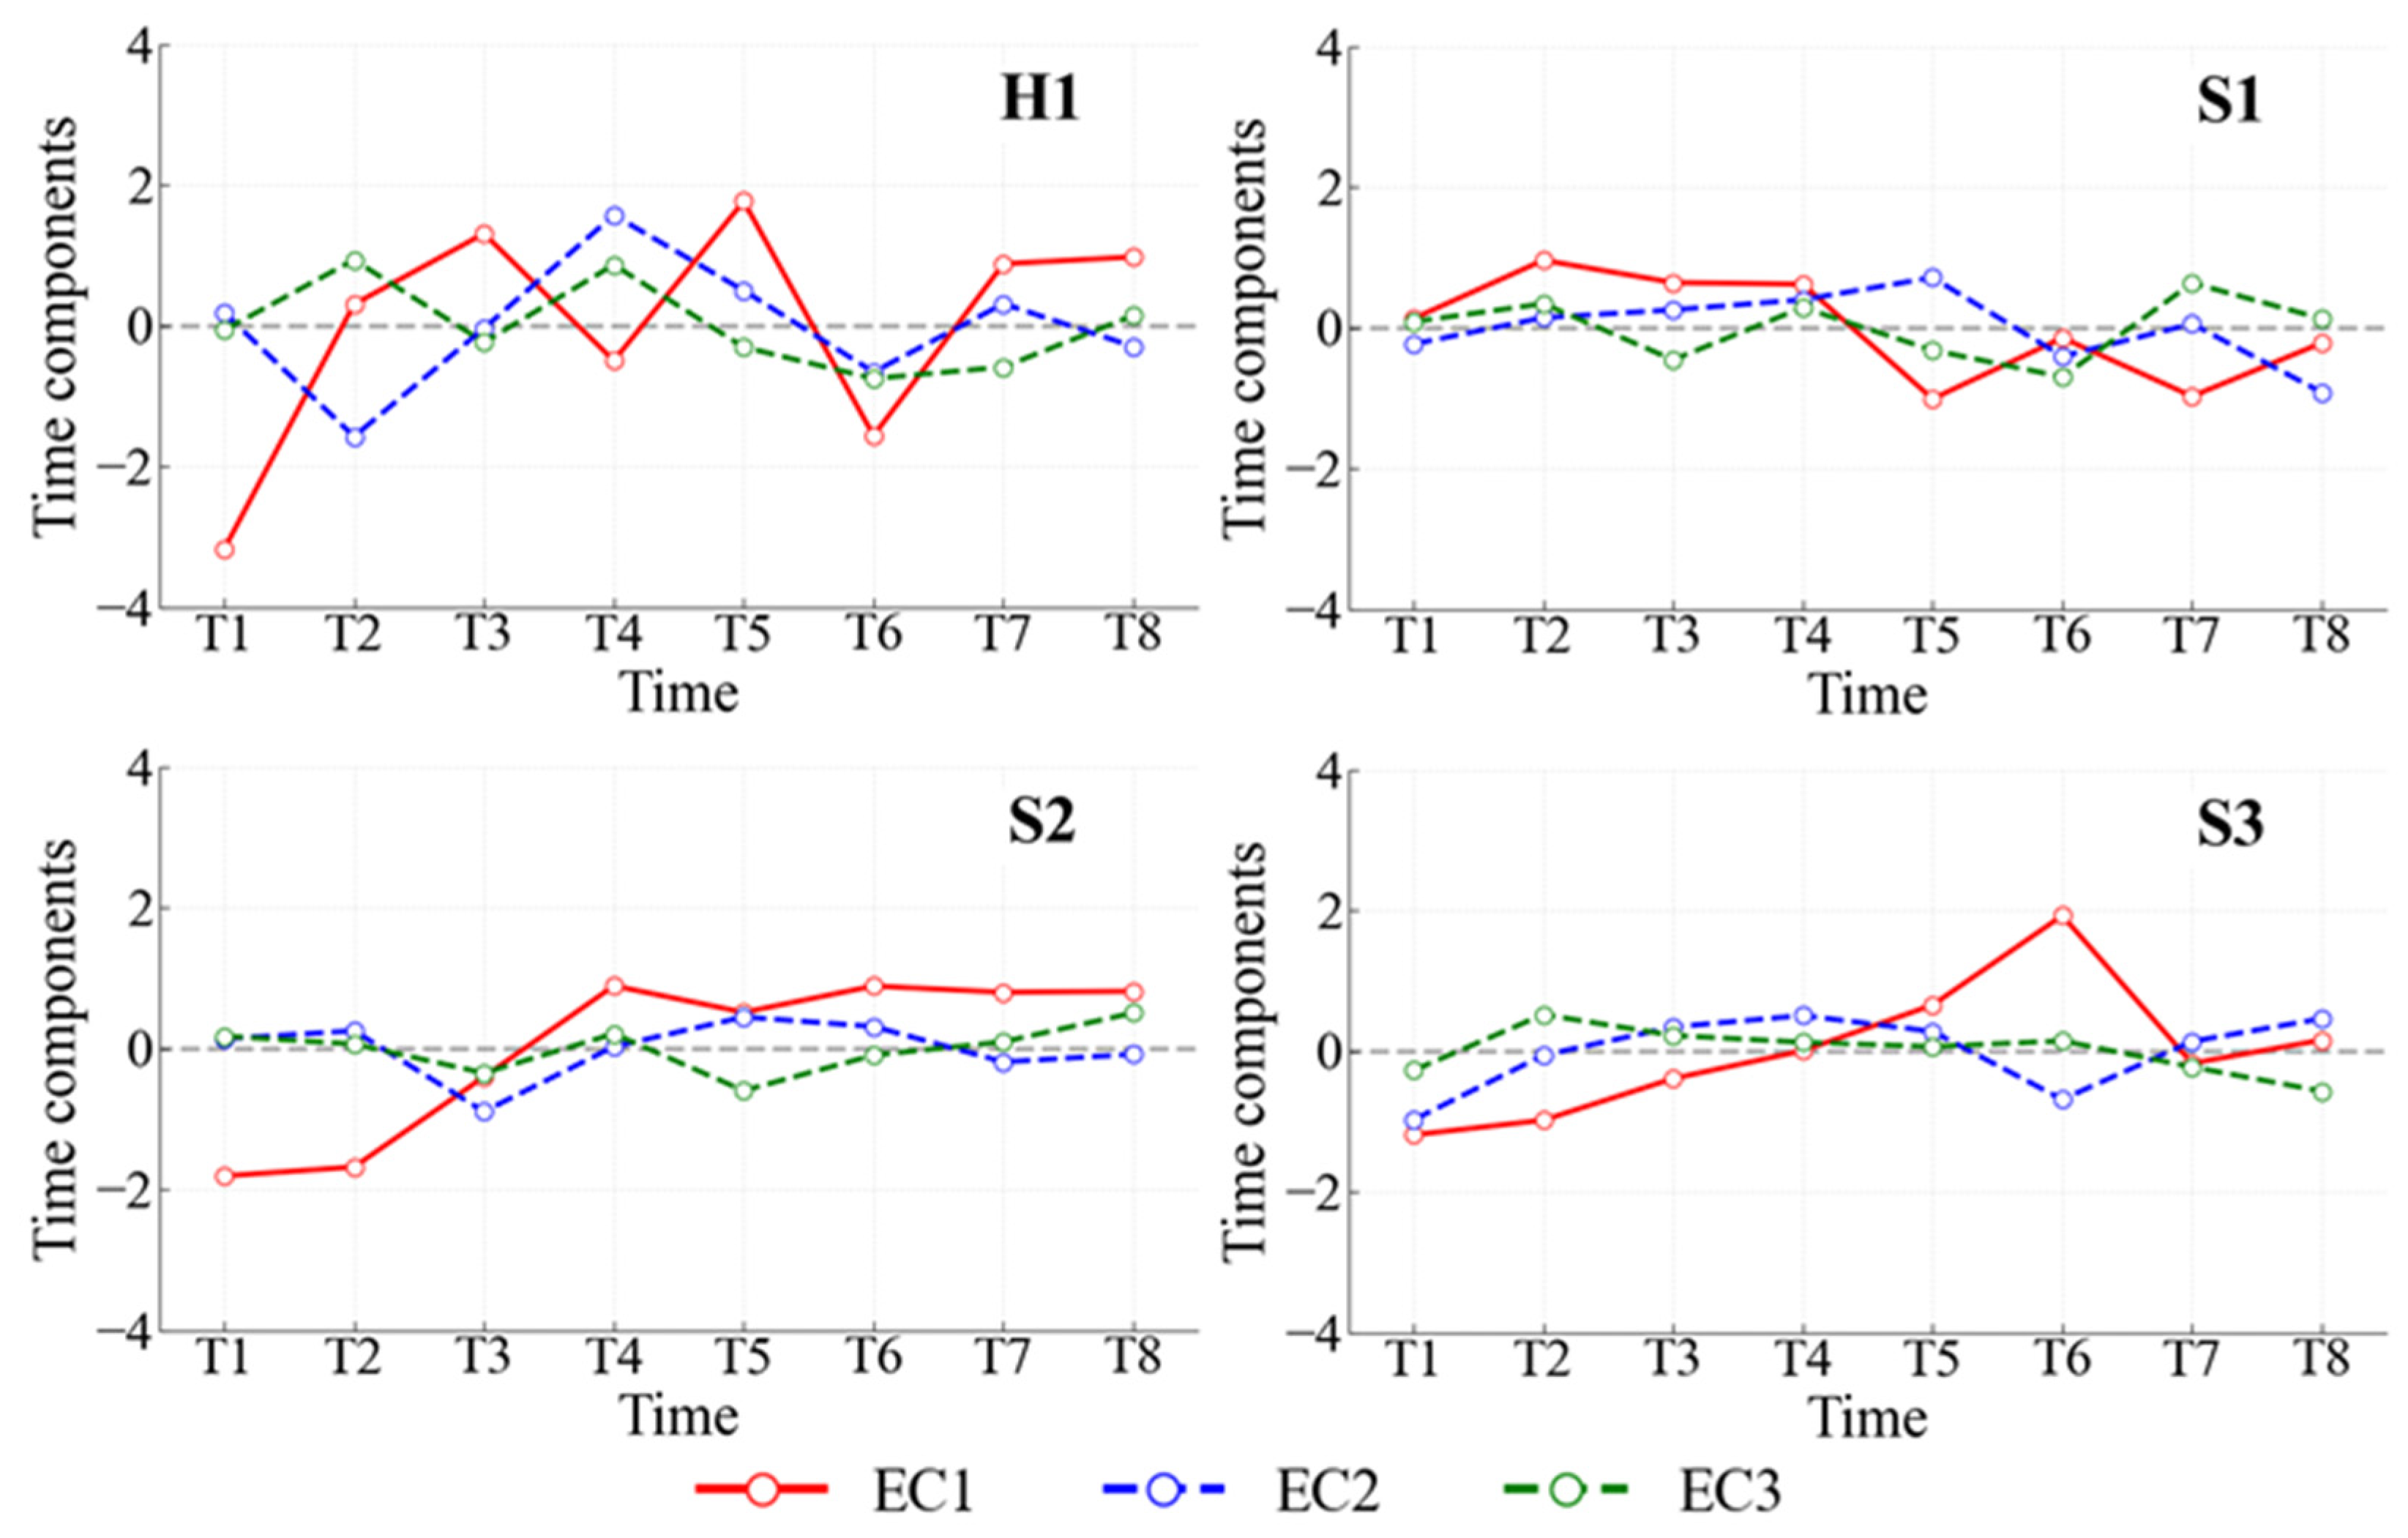
4.2.3. Empirical Orthogonal Function (EOF) Analysis
5. Discussion
5.1. The Effect of Beachrock Outcrop in Beach Morphology
5.2. The Role of Outcrop Beachrock’s Shape and Position
6. Conclusions
- (1)
- The profiles S1~S3, which had exposed beachrocks, demonstrated a higher level of stability in terms of profile morphology, sediment volume, EOF spatial modes, and temporal modes, compared to the H1 profile without exposed beachrocks. The reduction in sediment transport capacity due to the presence of exposed beachrocks resulted in overall smaller variations in erosion and deposition within the profile, leading to a weakened response to dynamic environmental changes.
- (2)
- Differences in the exposed forms of beachrocks determined the influence on the sediment accommodation space of the beach. Lateral variations in the exposure positions of beachrocks decided the main areas of erosion on the profile, and the geomorphic processes of the profiles under the influence of beachrocks showed different degrees of feedback. These geomorphic features can serve as reference indicators for the phased evolution of beach sections influenced by beachrocks.
Author Contributions
Funding
Institutional Review Board Statement
Informed Consent Statement
Data Availability Statement
Conflicts of Interest
References
- Mauz, B.; Vacchi, M.; Green, A.; Hoffmann, G.; Cooper, A. Beachrock: A Tool for Reconstructing Relative Sea Level in the Far-Field. Mar. Geol. 2015, 362, 1–16. [Google Scholar] [CrossRef]
- Vousdoukas, M.I.; Velegrakis, A.F.; Plomaritis, T.A. Beachrock Occurrence, Characteristics, Formation Mechanisms and Impacts. Earth-Sci. Rev. 2007, 85, 23–46. [Google Scholar] [CrossRef]
- Ginsburg, R.N. Beachrock in South Florida. J. Sediment. Res. 1953, 23, 85–92. [Google Scholar] [CrossRef]
- Kneale, D.; Viles, H.A. Beach Cement: Incipient CaCO3-Cemented Beachrock Development in the Upper Intertidal Zone, North Uist, Scotland. Sediment. Geol. 2000, 132, 165–170. [Google Scholar] [CrossRef]
- Falkenroth, M.; Schneider, B.; Hoffmann, G. Beachrock as Sea-Level Indicator–a Case Study at the Coastline of Oman (Indian Ocean). Quat. Sci. Rev. 2019, 206, 81–98. [Google Scholar] [CrossRef]
- Kelletat, D. Beachrock as Sea-Level Indicator? Remarks from a Geomorphological Point of View. J. Coast. Res. 2006, 22, 1558–1564. [Google Scholar] [CrossRef]
- Kelly, C.S.; Green, A.N.; Cooper, J.A.G.; Wiles, E. Beachrock Facies Variability and Sea Level Implications: A Preliminary Study. J. Coast. Res. 2014, 736–742. [Google Scholar] [CrossRef]
- Cooper, J.A.G. Beachrock Formation in Low Latitudes: Implications for Coastal Evolutionary Models. Mar. Geol. 1991, 98, 145–154. [Google Scholar] [CrossRef]
- Rey, D.; Rubio, B.; Bernabeu, A.M.; Vilas, F. Formation, Exposure, and Evolution of a High-Latitude Beachrock in the Intertidal Zone of the Corrubedo Complex (Ria de Arousa, Galicia, NW Spain). Sediment. Geol. 2004, 169, 93–105. [Google Scholar] [CrossRef]
- Rutten, G.L. Interactions between Beachrock Formations and Shoreline Evolution. Case Study: Togo. Master’s Thesis, Delft University of Technology, Delft, The Netherlands, 2011. [Google Scholar]
- Cooper, J.A.G.; Green, A.N.; Wiles, E.A. Beachrock Morphology and Genesis on a Paraglacial Beach. Sediment. Geol. 2017, 360, 47–53. [Google Scholar] [CrossRef]
- Gallop, S. Classification of Perched Beach Morphotypes and the Influence of Coastal Reefs on Sandy Beach Morphodynamics during Storms and Sea Breezes. Ph.D. Thesis, The University of Western Australia, Perth, Australia, 2013. [Google Scholar]
- Gallop, S.L.; Kennedy, D.M.; Loureiro, C.; Naylor, L.A.; Muñoz-Pérez, J.J.; Jackson, D.W.T.; Fellowes, T.E. Geologically Controlled Sandy Beaches: Their Geomorphology, Morphodynamics and Classification. Sci. Total Environ. 2020, 731, 139123. [Google Scholar] [CrossRef] [PubMed]
- Jackson, D.W.T.; Cooper, J.A.G. Geological Control on Beach Form: Accommodation Space and Contemporary Dynamics. J. Coast. Res. 2009, I, 69–72. [Google Scholar]
- McNinch, J.E. Geologic Control in the Nearshore: Shore-Oblique Sandbars and Shoreline Erosional Hotspots, Mid-Atlantic Bight, USA. Mar. Geol. 2004, 211, 121–141. [Google Scholar] [CrossRef]
- Short, A.D. Role of Geological Inheritance in Australian Beach Morphodynamics. Coast. Eng. 2010, 57, 92–97. [Google Scholar] [CrossRef]
- Loureiro, C.; Ferreira, Ó.; Cooper, J.A.G. Geologically Constrained Morphological Variability and Boundary Effects on Embayed Beaches. Mar. Geol. 2012, 329, 1–15. [Google Scholar] [CrossRef]
- Masselink, G.; Short, A.D. The Effect of Tide Range on Beach Morphodynamics and Morphology: A Conceptual Beach Model. J. Coast. Res. 1993, 9, 785–800. [Google Scholar]
- Wright, L.D.; Short, A.D. Morphodynamic Variability of Surf Zones and Beaches: A Synthesis. Mar. Geol. 1984, 56, 93–118. [Google Scholar] [CrossRef]
- Jackson, D.W.T.; Cooper, J.A.G.; Del Rio, L. Geological Control of Beach Morphodynamic State. Mar. Geol. 2005, 216, 297–314. [Google Scholar] [CrossRef]
- Calvet, F.; Cabrera, M.C.; Carracedo, J.C.; Mangas, J.; Pérez-Torrado, F.J.; Recio, C.; Travé, A. Beachrocks from the Island of La Palma (Canary Islands, Spain). Mar. Geol. 2003, 197, 75–93. [Google Scholar] [CrossRef]
- Dickinson, W.R. Holocene Sea-Level Record on Funafuti and Potential Impact of Global Warming on Central Pacific Atolls. Quat. Res. 1999, 51, 124–132. [Google Scholar] [CrossRef]
- Vousdoukas, M.I.; Velegrakis, A.F.; Karambas, T.V. Morphology and Sedimentology of a Microtidal Beach with Beachrocks: Vatera, Lesbos, NE Mediterranean. Cont. Shelf Res. 2009, 29, 1937–1947. [Google Scholar] [CrossRef]
- Muñoz-Perez, J.J.; Medina, R. Comparison of Long-, Medium-and Short-Term Variations of Beach Profiles with and without Submerged Geological Control. Coast. Eng. 2010, 57, 241–251. [Google Scholar] [CrossRef]
- Gischler, E.; Lomando, A.J. Holocene Cemented Beach Deposits in Belize. Sediment. Geol. 1997, 110, 277–297. [Google Scholar] [CrossRef]
- Zhang, X.-Y.; Li, Y.; Sun, F.-L.; Tan, F.; Shi, Q.; Yan, H.-Q.; Wang, G.; Yang, H.-Q. Insights into Microbially Mediated Cementation in Modern Beachrock in the Xisha Islands, South China Sea. Palaeogeogr. Palaeoclimatol. Palaeoecol. 2022, 592, 110904. [Google Scholar] [CrossRef]
- Qianwen, S.; Kangyou, H.; Dehao, X. On the sedimentary environment change since Holocene in the Sanya Bay, Hainan Island. Acta Sci. Nat. Univ. Sunyatseni 2019, 58, 13–21. [Google Scholar] [CrossRef]
- Wang, Y. Study on the Impact of Sanya New Airport Artificial Island on Hongtang Bay Beach; Chinese Society for Oceanography: Beijing, China, 2017; pp. 977–982. [Google Scholar]
- Medellín, G. Morphodynamics along a Micro-Tidal Sea Breeze Dominated Beach in the Vicinity of Coastal Structures. Mar. Geol. 2019, 417, 106013. [Google Scholar] [CrossRef]
- Habel, S.; Fletcher, C.H.; Barbee, M.; Anderson, T.R. The Influence of Seasonal Patterns on a Beach Nourishment Project in a Complex Reef Environment. Coast. Eng. 2016, 116, 67–76. [Google Scholar] [CrossRef]
- Lemke, L.; Miller, J.K. EOF Analysis of Shoreline and Beach Slope Variability at a Feeder Beach Constructed within a Groin Field at Long Branch, New Jersey. Coast. Eng. 2017, 121, 14–25. [Google Scholar] [CrossRef]
- Trenhaile, A.S. Modeling the Accumulation and Dynamics of Beaches on Shore Platforms. Mar. Geol. 2004, 206, 55–72. [Google Scholar] [CrossRef]
- Trenhaile, A.S. Modelling the Effect of Waves, Weathering and Beach Development on Shore Platform Development. Earth Surf. Process. Landf. J. Br. Geomorphol. Res. Group 2005, 30, 613–634. [Google Scholar] [CrossRef]


| Number | Time | H1 | S1 | S2 | S3 |
|---|---|---|---|---|---|
| 1 | September 2017~May 2018 | −9.67 | −1.01 | −1.38 | 2.08 |
| 2 | May 2018~June 2019 | −15.4 | −4.16 | −8.28 | −5.36 |
| 3 | June 2019~November 2019 | 6.19 | 5.37 | −8.31 | −4.38 |
| 4 | November 2019~June 2020 | −9.96 | −2.69 | 0.04 | −7.93 |
| 5 | June 2020~November 2020 | 19.55 | −3.39 | 0.42 | −4.69 |
| 6 | November 2020~June 2021 | −17.2 | 12.79 | 0.84 | 11.78 |
| 7 | June 2021~November 2021 | 2.07 | −3.51 | −7.11 | −1.30 |
| 8 | Account | −24.5 | 3.43 | −23.7 | −9.8 |
| Profiles | Percent of Variance Explained | |||
|---|---|---|---|---|
| e1 (s,t) | e2 (s,t) | e3 (s,t) | Accumulated Variance | |
| H1 | 62.57% | 18.85% | 8.71% | 90.13% |
| S1 | 49.46% | 23.85% | 18.68% | 91.99% |
| S2 | 77.35% | 10.06% | 6.83% | 94.24% |
| S3 | 66.37% | 20.85% | 8.01% | 95.23% |
Disclaimer/Publisher’s Note: The statements, opinions and data contained in all publications are solely those of the individual author(s) and contributor(s) and not of MDPI and/or the editor(s). MDPI and/or the editor(s) disclaim responsibility for any injury to people or property resulting from any ideas, methods, instructions or products referred to in the content. |
© 2024 by the authors. Licensee MDPI, Basel, Switzerland. This article is an open access article distributed under the terms and conditions of the Creative Commons Attribution (CC BY) license (https://creativecommons.org/licenses/by/4.0/).
Share and Cite
Xu, J.; Wang, Y.; Lu, P. The Influence of Beachrock Outcrop on Spatial Variability in Beach Morphology. J. Mar. Sci. Eng. 2024, 12, 945. https://doi.org/10.3390/jmse12060945
Xu J, Wang Y, Lu P. The Influence of Beachrock Outcrop on Spatial Variability in Beach Morphology. Journal of Marine Science and Engineering. 2024; 12(6):945. https://doi.org/10.3390/jmse12060945
Chicago/Turabian StyleXu, Junhui, Yanhong Wang, and Peidong Lu. 2024. "The Influence of Beachrock Outcrop on Spatial Variability in Beach Morphology" Journal of Marine Science and Engineering 12, no. 6: 945. https://doi.org/10.3390/jmse12060945
APA StyleXu, J., Wang, Y., & Lu, P. (2024). The Influence of Beachrock Outcrop on Spatial Variability in Beach Morphology. Journal of Marine Science and Engineering, 12(6), 945. https://doi.org/10.3390/jmse12060945