Article

A Laboratory Dataset on Transport and Deposition of Spherical and Cylindrical Large Microplastics for Validation of Numerical Models

by
Mostafa Bigdeli
1,*,
Abdolmajid Mohammadian
1 and
Abolghasem Pilechi
1,2
1
Department of Civil Engineering, University of Ottawa, Ottawa, ON K1N 6N5, Canada
2
Ocean, Coastal & River Engineering Research Centre, National Research Council Canada, Ottawa, ON K1A 0R6, Canada
*
Author to whom correspondence should be addressed.
J. Mar. Sci. Eng. 2024, 12(6), 953; https://doi.org/10.3390/jmse12060953
Submission received: 12 May 2024 / Revised: 28 May 2024 / Accepted: 4 June 2024 / Published: 6 June 2024
(This article belongs to the Section Marine Environmental Science)

Abstract

:
The widespread presence of micro-sized plastic pollution has raised concerns due to their unique physical and toxic properties. Each year, water bodies carry millions of tons of plastic into the ocean. The inherent characteristics (such as size, shape, and density) of microplastics (MPs), along with flow factors like speed, depth, and pressure, significantly influence how MPs are transported and deposited. Therefore, this research aimed to gather experimental data on the transport and deposition of MPs to serve as a benchmark for numerical modeling. To achieve this goal, various test scenarios were set up in a straight channel flume to investigate different flow velocities, channel dimensions, and particle shapes. It was observed that cylindrical particles with the same density and similar size were more likely to become trapped compared to spherical particles. This study represents progress towards validating numerical models concerning the transport and deposition of microplastics.

1. Introduction

Oceans have been affected adversely because of the huge transport of plastic waste from lands, which occurs through different conduits, such as rivers, with an estimated annual rate ranging from 0.41 to 4.0 Mt [1]. The presence of macro-(>1 cm) [2], meso-(5 mm–2 cm) [2], micro-(<5 mm) [3], and nano-sized (1–100 nm) [4] plastics has emerged as a significant environmental challenge due to their persistent nature, toxic properties, and detrimental impact on the Earth’s hydrosphere [5], aquatic organisms [6,7], wildlife, and human health [8,9].
MPs exhibit diverse regular shapes (e.g., spherical, cylindrical, beads, and fibers) [10] and irregular shapes (fragments) [11]. Furthermore, the physical properties of MPs undergo changes due to various processes and ambient environmental factors, such as algae invasion, salinity, UV index, temperature, and Stokes drift generated by wave action [12,13,14,15]. The interaction between microplastics and microalgae, including colonization and hetero-aggregation, alters the buoyancy of particles, affecting their settling and impacting their fate and transport in surface waters [12]. On the other hand, microplastics pose a threat to microalgae, impeding their growth, diminishing chlorophyll levels and photosynthesis, and inducing morphological changes [12]. Aging MPs, in contrast to freshly emitted particles, exhibit smoother edges as a result of mechanical degradation caused by interactions with other fragments [16].
The behavior and transport of MPs depend on their key physical attributes, including size, density, and shape [17,18]. Denser particles settle faster, even when sharing similar shapes and sizes, and larger particles with the same density experience increased settling velocities due to the higher ratio of gravitational force to fluid viscous resistance [19]. The shape of MPs also influences their movement and settling velocity, with elongated particles settling faster than smaller circular ones of comparable size [20,21].
The prediction of MP transport and deposition considering their different physical properties is of great importance. In this regard, there are several ways to investigate the behavior of MPs within different water bodies. Physical modeling, numerical simulations, and field surveys have been the most popular methods employed in previous studies. Physical and numerical modeling serve as valuable tools for predicting the fate and transport of plastic debris, offering a potential solution to mitigate the plastic pollution problem. Numerical fate and transport models can simulate different physical processes driving MP transport in water, such as advection, diffusion, windage, resuspension, beaching, and washing-off as well as the transformation (biofouling, degradation, and aggregation) [17]. Laboratory experiments have been acknowledged as one of the principal approaches to obtain reliable outcomes. However, there are limitations to physical modeling, numerical simulations, and field analyses. Conducting physical modeling is expensive and may raise questions regarding scaling waterbody geometry and particle transport and deposition patterns, although it can provide reliable results. Numerical modeling can predict potential accumulation zones in remote areas where water quality monitoring is not feasible. Furthermore, numerical models can simulate some key physical processes using fine grid resolution, given the ever-increasing computational capacity and ongoing development of numerical techniques. Moreover, these models can accurately simulate different vertical and horizontal flow patterns encompassing microplastics. In this respect, numerical models can be employed for predicting pathways, hot spots/accumulation zones, and potential sources of plastic pollution in different water settings promisingly (particularly in the calculation of mass balance and the estimation of moving plastic debris versus settled ones). Accordingly, numerical modeling can be considered a promising and relatively inexpensive tool in the simulation of MP behavior, but it must be validated using reliable experimental or field datasets. In other words, the lack of reliable datasets of different MPs in terms of physical properties limits the validation processes of numerical modeling approaches. It should be noted that such a validated numerical model, especially when coupled with field and lab data, can be substantially useful in providing accurate simulations. Field analysis is the most expensive choice when compared to the other two methods, and its feasibility may vary depending on the location and timing.
From a physical modeling perspective, simplified and generic experiments can be useful for generating reliable data for the validation of numerical models. In this regard, several studies have been conducted to experimentally investigate the transport and fate of MPs, which can be helpful in developing numerical methods for predicting MP behavior. For instance, a research study [22] sought to uncover and describe how the secondary movements of microplastic fibers impact their movement. Secondary movements refer to the oscillating movements exhibited by a particle as it descends in calm or still water. Another study [23] introduced an experimental configuration designed for the real-time tracking and measurement of microplastic quantities at the pore scale (ranging from 1 μm to 10 μm) in three distinct environments: (a) surface flow, (b) at the interface of the streambed, and (c) within hyporheic sediments within an experimental flume setting. To investigate the transportation and burial of MPs by turbidity currents, a previous study [24] introduced microplastic fragments and fibers into scaled-down turbidity currents during flume experiments. The primary objective of this study was to assess the presence of MPs in sediment samples collected from turbidity currents and their resulting deposits. Another study [25] investigated the driving forces and processes that control the movement of microplastic particles and their accumulation in the surf zone. To achieve this goal, systematic physical model tests were conducted using MPs of various sizes, shapes, and densities. Additional experimental investigations were conducted [26] to assess the settling and rising velocities of microplastic particles in relation to their density, diameter, and shape. The objective was to explore whether the equations commonly used in sediment transport studies could be applied to MPs and, if necessary, develop more suitable formulas. To ensure robust data and accuracy, the settling or rising rate of each particle was measured three times in separate experiments.
Given the aforementioned descriptions, it is crucial to thoroughly characterize and quantify the deposition of plastic debris in bed materials, especially when developing numerical models to simulate the fate and transport of plastic debris in water bodies. This information is vital for tasks such as mass balance calculations and the estimation of the transport of plastic debris versus their deposition. Accordingly, this study aimed to provide an experimental dataset that can be employed to validate numerical models utilized in the prediction of MP behavior in water bodies. In other words, we aimed to bridge the gap between our present knowledge regarding MP transport and deposition and what happens in real conditions when the velocity of the flow or the geometry of the channel changes by providing an experimental dataset.
This paper is organized as follows. Section 2 describes the experimental setup including details of the instrumentation, the physical characteristics of particles, the flow conditions, and the employed geometrical characteristics of the channel. Section 3 presents the experimental outcomes derived from four distinct cases, varying in terms of the flow velocity and particle shape. Section 4 discusses the implications of these observations, and provides concluding remarks based on the conducted experiments.

2. Experimental Setup

Physical testing was conducted in a tilting flume at the National Research Council Canada Ocean, Coastal, and River Engineering Research Centre (NRC-OCRE) physical testing facility in Ottawa (Figure 1). The model was constructed in a flume measuring 10 m in length, 40 cm in height, and 38 cm in width. It was built using plexiglass and PVC sheets with a thickness of 1 cm. The schematics of the model, illustrating its geometrical characteristics and dimensions of the different components, are shown in Figure 2.
The water surface elevations in the model were measured using three Nortek wave probes, which were mounted at different locations within the flume: first, at the very beginning of the flume (point 1 in Figure 2); second, in zone A, point 2, very close to the area where large expansion and deepening applied to the channel (i.e., zone B); and third (point 6), at the end of the flume just before the titling gate (comprised of a panel supported by a hinge along its lower side, allowing water to pass over it when it is lowered) and a screen for capturing particles before entering the basin. Mesh screens were placed before the first wave probe to help maintain a uniform and steady flow within the model. Moreover, the flume inlet started five meters ahead of zone B. Thus, the flow was fully developed before it reached this area.
As depicted in Figure 2, a ramp with a slope of 1:3 has been added at the initial section of the flume just before the channel that starts in zone A. This addition serves to elevate the bed of the channel and enables the creation of a larger depth area in zone B. In order to replicate river conditions, the model bed was covered with a layer of sediment (i.e., coarse sand (or pebble) [27] with a mean diameter range of 4 mm ≤ D50 ≤ 6 mm) glued to the channel bed in zones A and B. The movement of particles within the channel was recorded by two high-resolution digital cameras positioned above (in zone C) and on the side (in zone B) of the flume at the locations shown in Figure 2. MPs were injected through funnels and injection tubes that were only five centimeters above the flume bed in zone A (Figure 2, point 4) and 20 cm away from the area of the channel (i.e., zone B) where large and moderate expansion and large deepening occurred. Thus, they were injected into the flow from a depth very close to the bed. This allowed the particles to be transported and deposited freely on the bed or between the sediments. Water velocity profiles were measured before and after the funnel and injection tubes to ensure that there was no regime change in the flow’s condition in zone A and just before zone B due to the presence of injection tubes. This setup covers the entire area of zone B. The field of view (FOV) for each of the mentioned cameras is illustrated in Figure 3.
To circulate the flow within the flume, we employed an 8 psi pressure pump. Water velocities were measured using two Nortek Acoustic Doppler Velocimeter (ADV), an adaptable and precise device utilized for measuring three-dimensional water velocity, probes—one deployed (in zone A, point 3) very close to the funnels and injection tubes (in zone A, point 4) and the other in the middle of zone B, in point 5 (see Figure 2). The probes were mounted at 0.6 of the total depth from the water surface. Velocity measurements for each test were recorded at a frequency of 25 Hz for a duration of 5 min. The selection of this duration and frequency was part of an iterative process aimed at ensuring that the resolution and duration of the recorded data were sufficient in the sense that the slope of the spectrum of the measured velocity satisfied Kolmogorov’s −5/3 law. The reported velocity magnitudes in this study are the averages of the recorded data over a 300 s measurement period.
The time of each test started 100 s before releasing the particles and it lasted five minutes. The experiments were repeated three times for each test, and all were recorded using a digital camera to track the particle path, ensuring minimized errors and uncertainties.
The experiments were conducted using fresh water with a density of 1000 kg/m3. Two types of microplastic particles, polyethylene terephthalate (PET) and polyvinyl chloride (PVC), each with an approximate density of 1380 kg/m³, were used for testing. The PET and PVC particles were shaped as spherical and cylindrical particles, respectively (Figure 4).
The diameters of both the spherical and cylindrical particles were 3 mm, and the average length of the cylindrical particles was 4 mm.
The spherical and cylindrical particles were coated both in green and red. They were coated with waterproof dyes in order to differentiate them along the channel’s bed. The density of the coated particles was checked very carefully to see if the coating changed their density, and we found that the change in their density was negligible. The green particles were injected into the flow from the middle funnel while the red particles reached the channel through two side funnels, as shown in Figure 5. The experiments were performed for two flow velocities, 0.1 m/s and 0.5 m/s, at the location of the first ADV (i.e., zone A, point 3 in Figure 2). However, because of expansion and deepening, the velocities in zone B were much less than 0.1 m/s and 0.5 m/s; thus, the particles had more time to settle and dynamically interact with the near-bed flow.

Experimental Cases

Multiple model setups were constructed, incorporating both expansions in the width of the channel along with increases in the depth of the channel. Four test series were defined for this study based on two particle shapes (spherical and cylindrical) and two flow conditions (0.1 m/s and 0.5 m/s), as outlined in Table 1. Each test series involved the examination of two width and depth values for the expansion region, resulting in a total of 16 tests.
On the other hand, the aforesaid cases were classified as shown in Table 2 in terms of large deepening or moderate and large expansion in the width of the channel. Both expansion and deepening were applied to the channel in zone B. The expansion applied to the width of the channel and increased its value from 20 cm to 38 cm within zone B. In addition, deepening made the channel bed 7 cm deeper in zone B.

3. Results

In this section, the observed trap efficiencies for the testing program are provided and discussed. In this study, 1000 particles were injected into the flow in each single test and also in the repeats. The number of settled MPs in zone B (as shown in Figure 2) was considered the trap efficiency (TE) in each test. It is important to highlight that when calculating the TEs, only the number of particles that both reached and potentially departed from this area was considered. In other words, particles deposited before this area were excluded from the study. As shown in Table 2, each case includes different tests (A to C) in terms of the depth and width of zone B, while the velocity of the flow and the shape of particles remained the same. In addition, each of these tests (i.e., Test A to C) was repeated three times. Thus, we named the first trial in implementing each test Trial 1. Trial 2 and Trial 3 indicated the second and third trials in each test, respectively. It should be noted that outliers (i.e., the unreasonable observations that may have occurred by laboratory errors) were excluded from the observations in each case when preparing the dataset. For instance, if the number of observed green MPs that were trapped in zone B was more than the red ones, the test was considered an outlier.
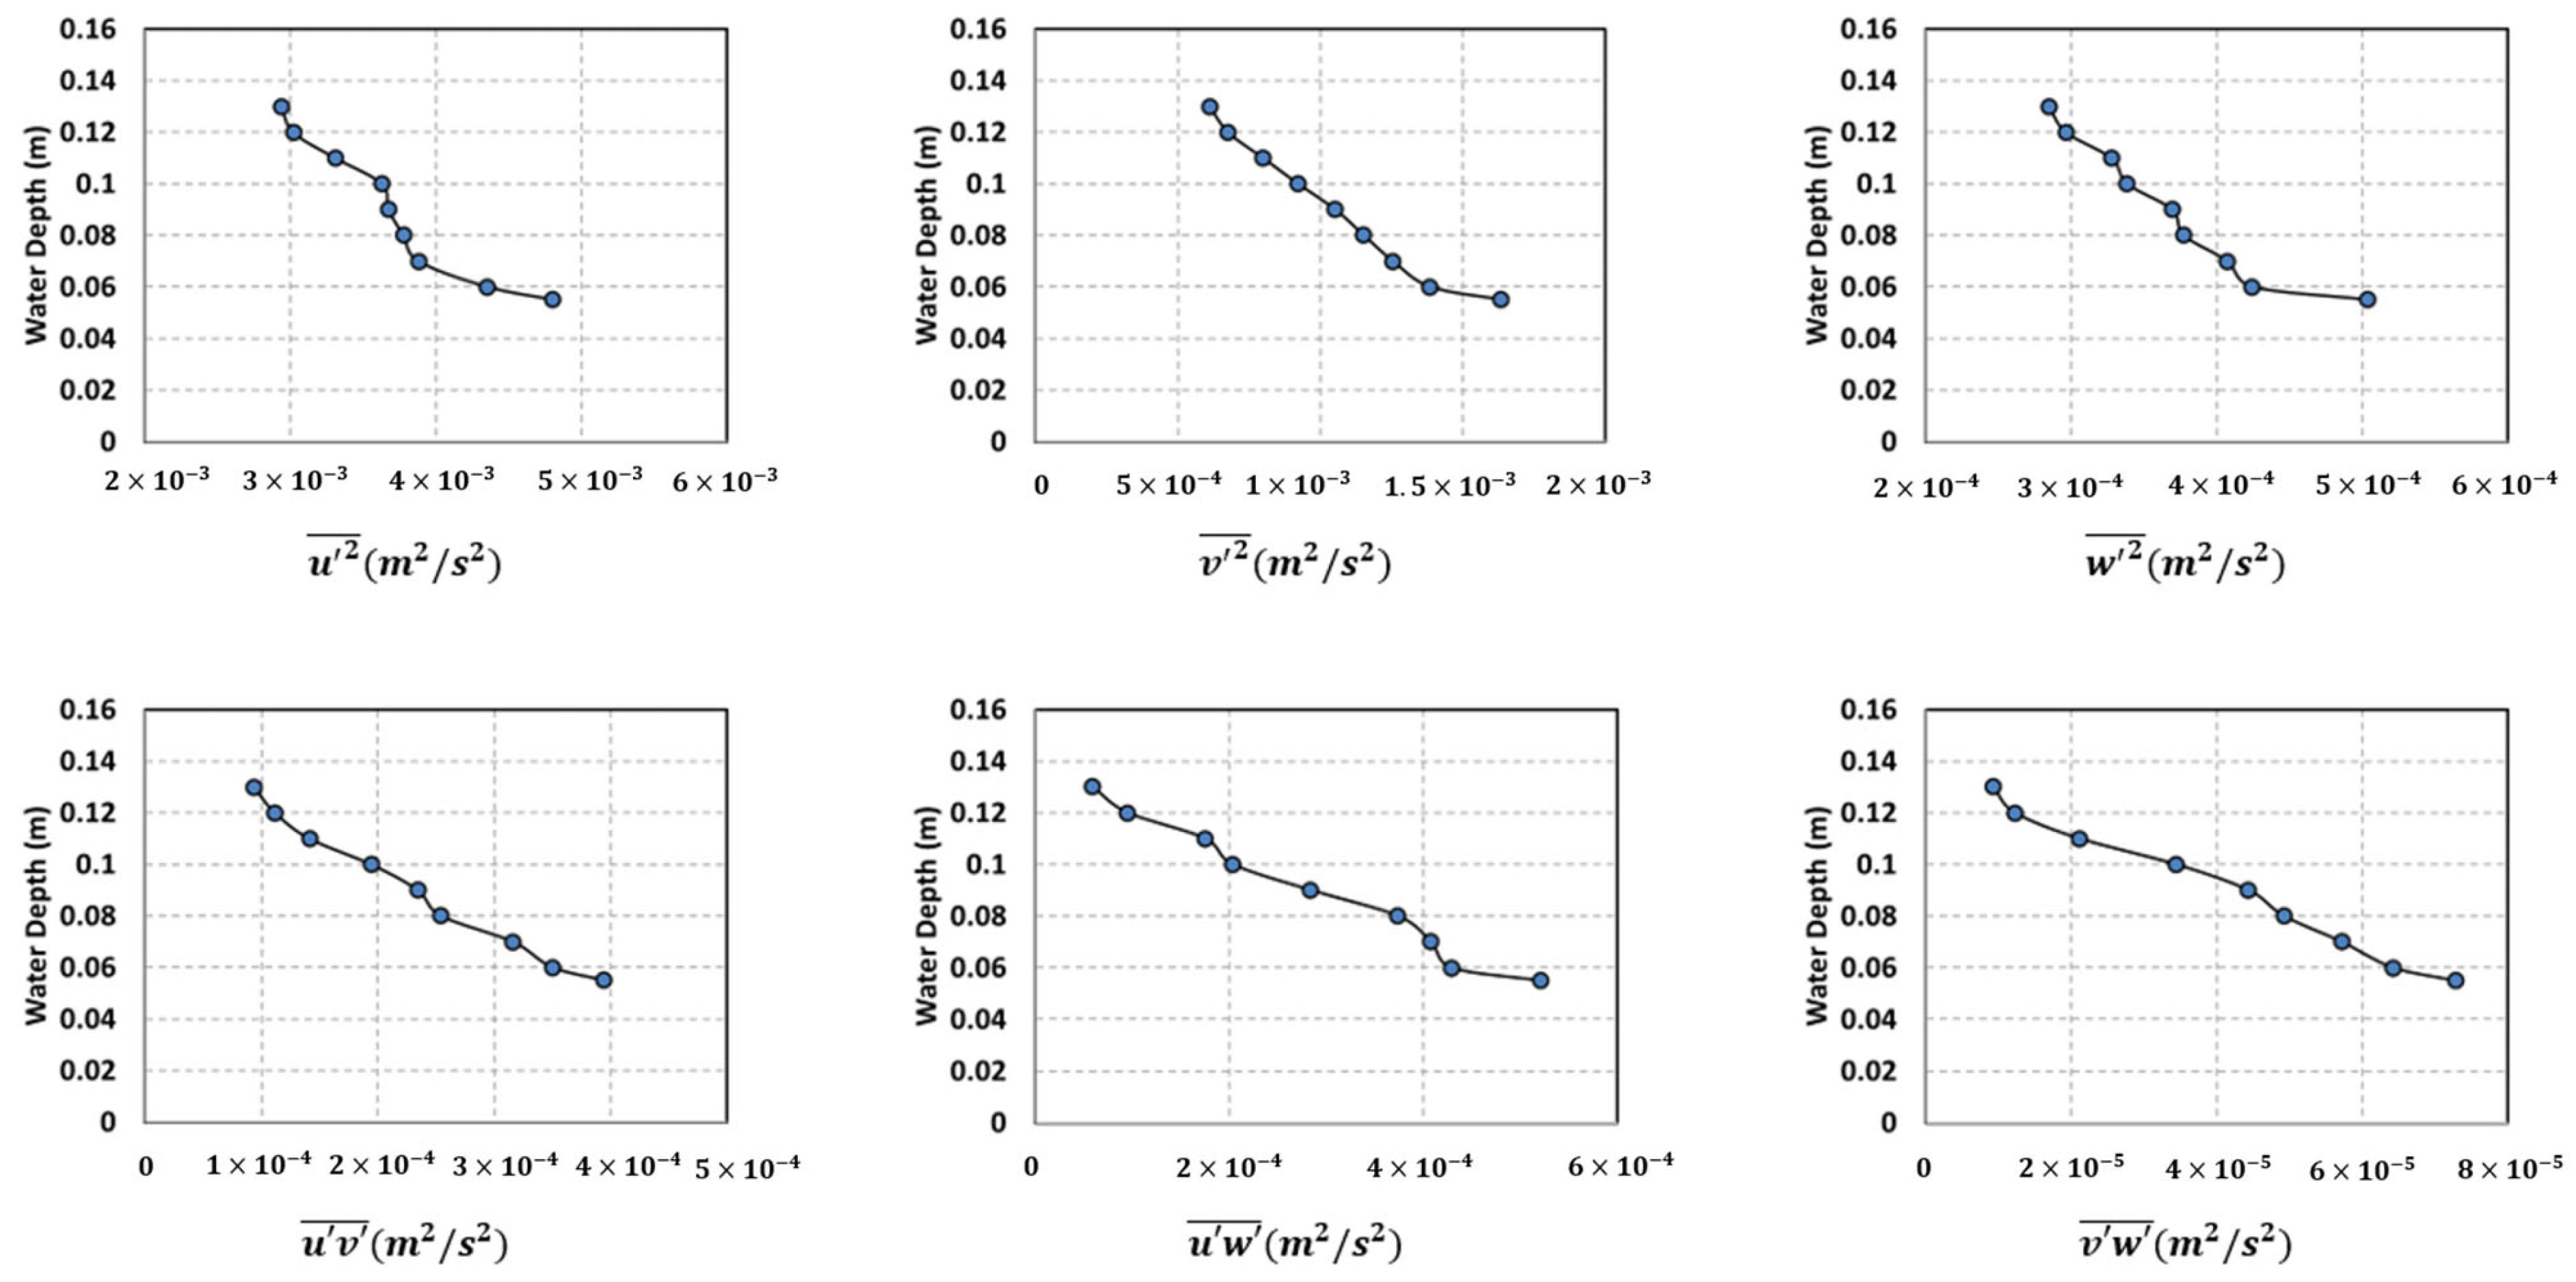
In this study, the water velocity profiles for two flow conditions (i.e., the average velocity profile of 0.1 m/s and 0.5 m/s) were measured, as shown in Figure A1, in order to provide a better picture of the boundary conditions of the implemented tests. Moreover, the Reynolds stresses profiles are depicted in Figure A2 and Figure A3 (see Appendix A).

3.1. Settling Velocity of Spherical and Cylindrical Microplastics

There are various equations for determining the settling velocity of spherical microplastics [28,29,30], and there are some equations for cylindrical plastic particles [10]. Thus, the measured settling velocities of both spherical and cylindrical particles in this study were compared to the calculated velocities. The settling velocity was obtained using a graduated breaker with a height of 25 cm. MPs were injected into the flow from the water surface and the time that each of the spherical and cylindrical particles took to reach the breaker bottom was recorded. The settling velocity of the spherical and cylindrical particles was recorded as 0.14 and 0.18 m/s, respectively.
The settling velocity, w s ( m / s ), of the spherical particles was calculated using the Equation (1) [28]:
w s = v 2 R d 3 ( 38.1 + 0.93 d 12 / 7 ) 7 / 8
where v is the water kinematic viscosity ( m 2 / s ), R is the radius of the spherical particle ( m ), d is the dimensionless diameter of the particle ( d = 2 R ( g ( ρ p ρ w ) / ρ w v 2 ) 1 / 3 ), g is the gravity acceleration ( m / s 2 ), and ρ p and ρ w are the particle and the water density (with the same units), respectively.
In addition, some previous studies employed Equation (2) to determine the settling velocity of spherical particles [29,30,31]:
w s = 4 ρ p ρ w g d n 3 ρ w C d
where d n is the dimensionless diameter of the volume equivalent sphere ( d n = 6 V / π 3 ) and V is the volume of the particle. C d is the drag coefficient and can be calculated using different methods (e.g., [29,30]). In this study, C d was calculated using Equation (3) [29], which covers the turbulent regime ( 10 3 R e p < 2 × 10 5 ) as well:
C d = 24 R e p + 24 R e p 0.15 R e p 0.687 + 0.42 1 + 42,500 R e p 1.16
where R e p is the Reynolds number of the particle ( R e p = ρ w w s d n μ ). In this study, the settling velocity was calculated as 0.11 and 0.13 m / s using Equations (1) and (2), respectively.
On the other hand, in this study, the settling velocity of the cylindrical particles was calculated based on the equation proposed in the previous study [10], which was not close to the measured settling velocity in the lab.

3.2. Case 1—Spherical MP Deposition in Channel with a Low Velocity of Flow

In this case, the observations demonstrate the deposition of spherical particles in a flow with a mean streamwise velocity of 0.1 m/s, which is considered a low velocity in this study, by varying the depth and width of the channel (Figure 6). Notably, across all the tests, the trap efficiency (TE) of the red particles (i.e., particles came from the sides of the channel) consistently surpassed that of the green particles that were injected into the flow from the middle of the channel. In Figure 6a, the average values of TE, in Test A, for the green, red, and total particles are approximately 44, 70, and 57%, respectively. In Figure 6b, the observations in Test B (with large expansion and deepening) indicated that the average TE was notably (over 20%) higher than that in Test A, involving only a large expansion (Figure 6a). The average TEs for the green, red, and total particles were approximately 80, 89, and 84%, respectively. In Test C, when moderate changes were applied to the width of the channel while maintaining large deepening, the resulting TE values for the green, red, and total particles were considerably lower than that in Test B, at approximately 59, 68, and 63%, respectively, as indicated in Figure 6c. Trial 1 was excluded in Test C because it was identified as an outlier.

3.3. Case 2—Spherical MP Deposition in Channel with a High Velocity of Flow

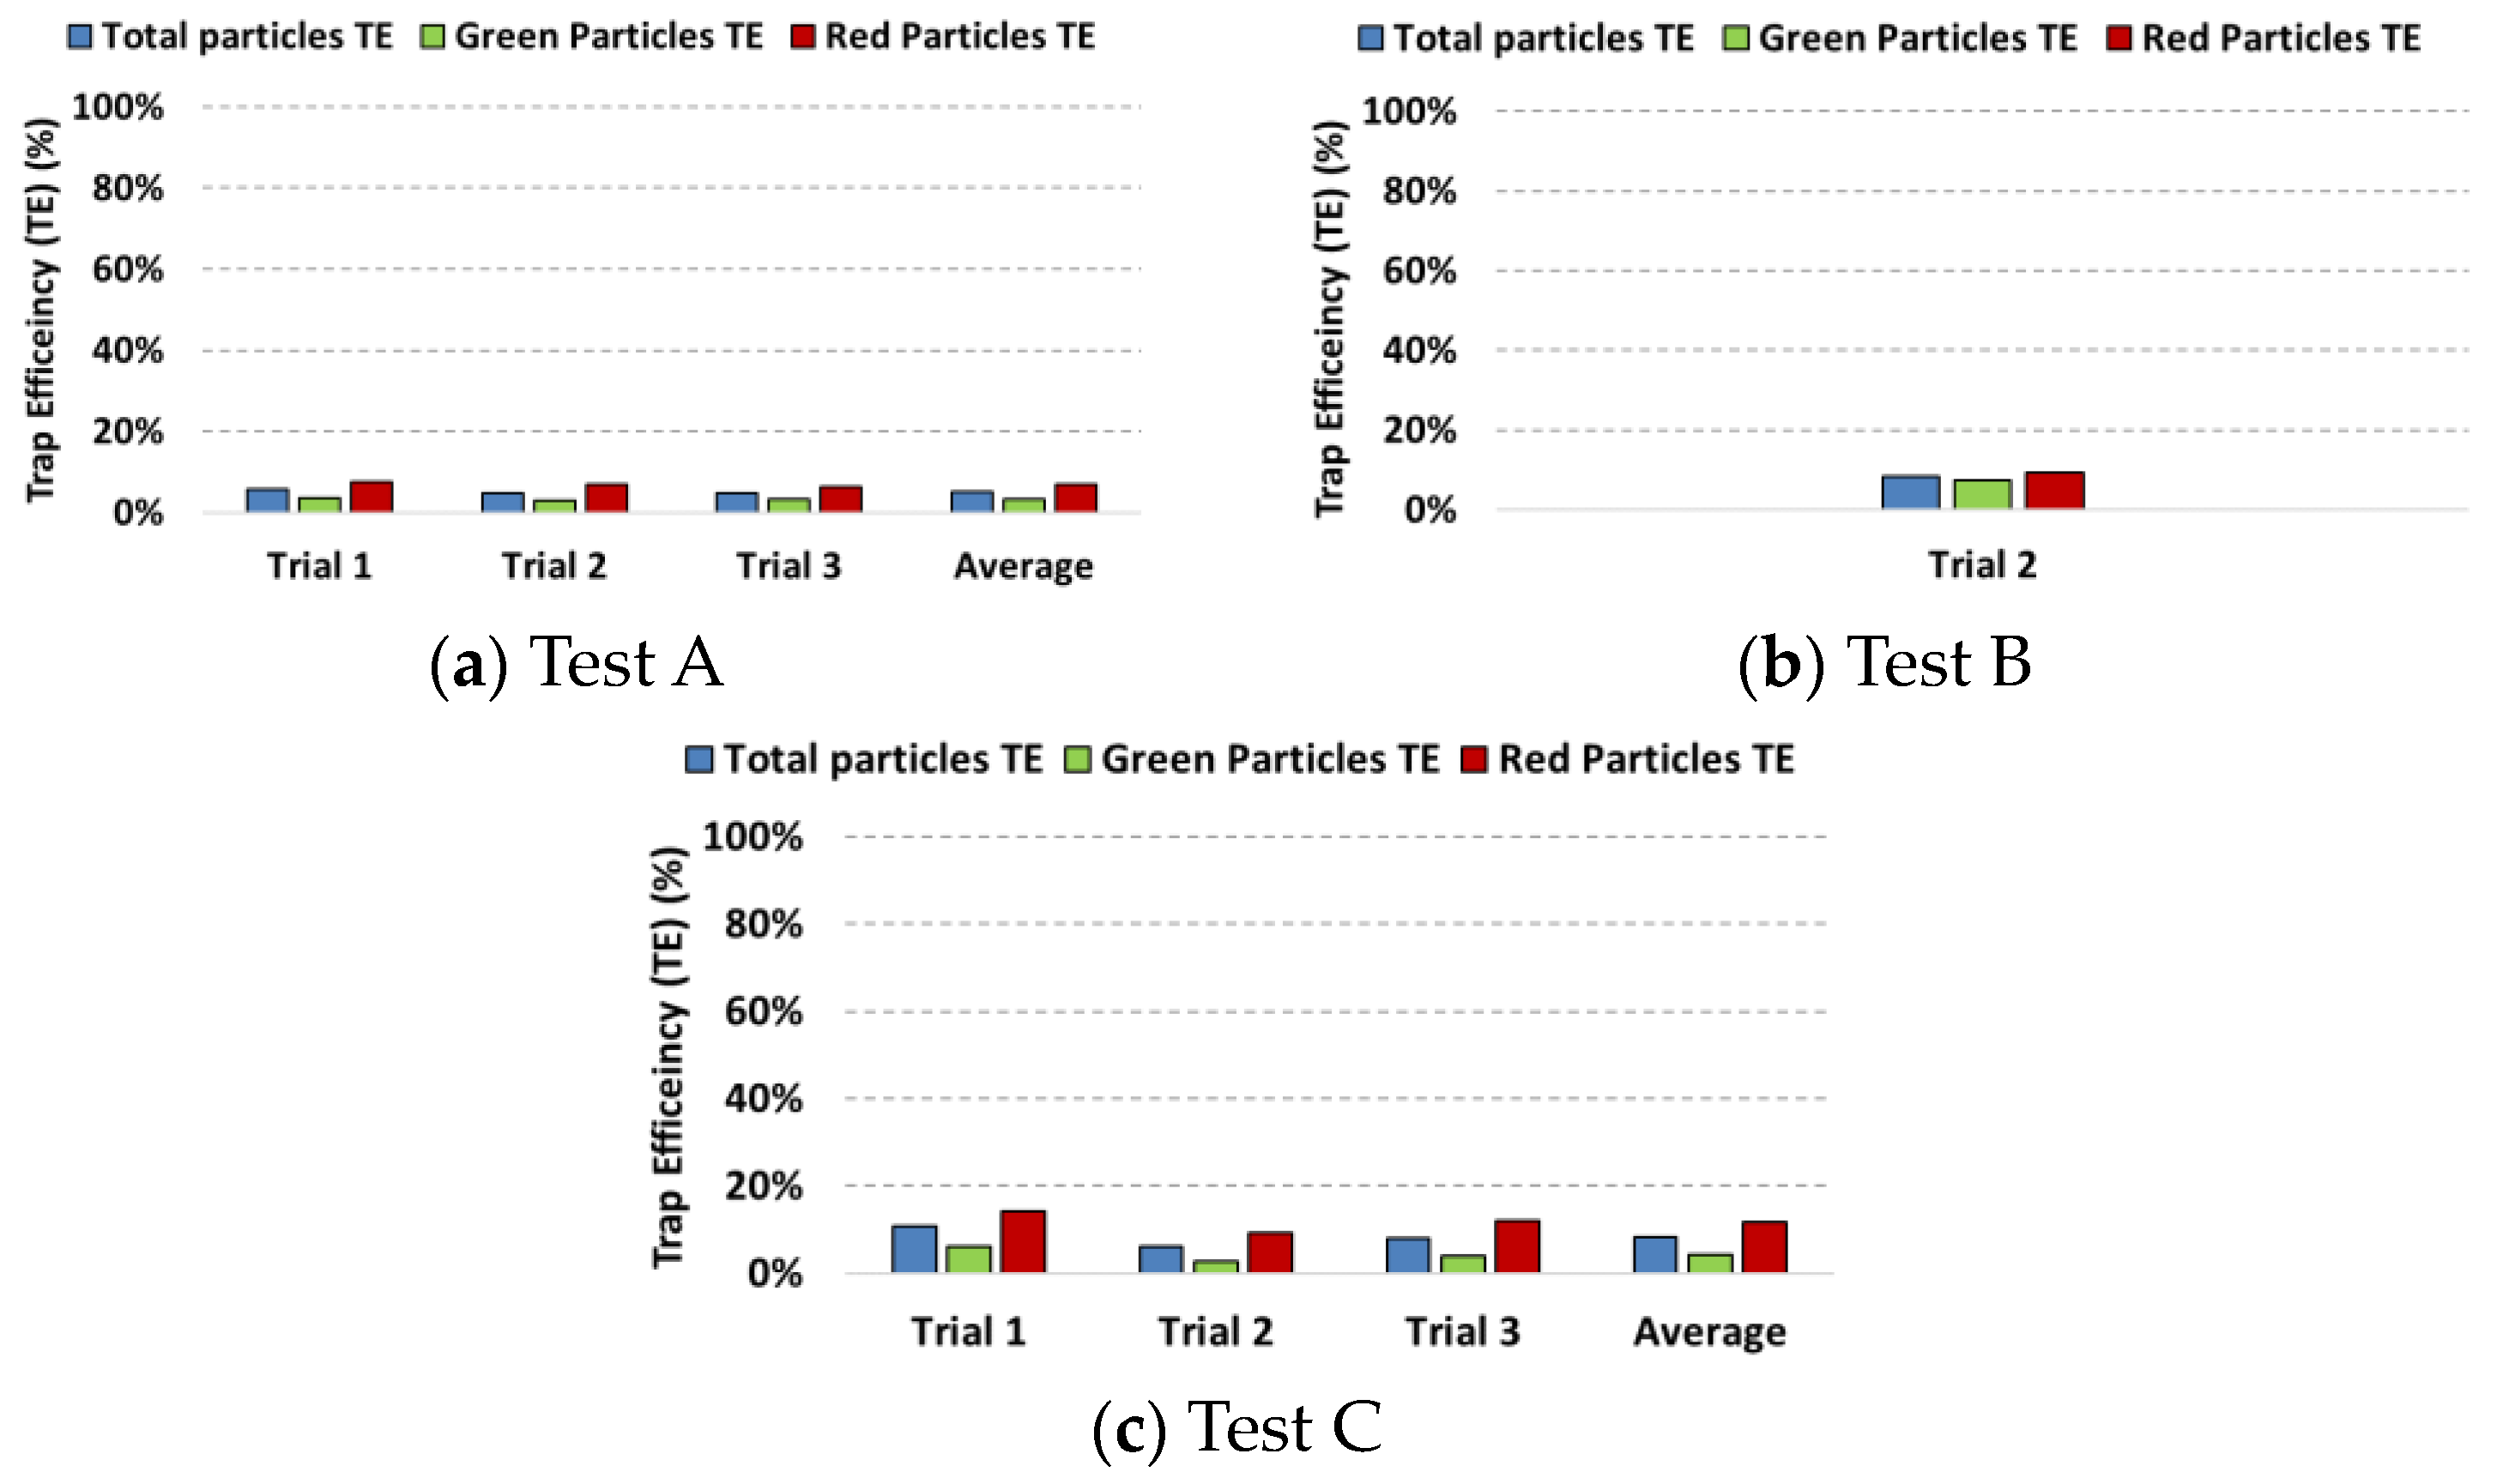
The observations of spherical particle deposition in a flow with a mean streamwise velocity of 0.5 m/s, considered a high-velocity condition in this study, are shown in Figure 7, considering the changes in the depth and width of the channel. Significantly, in all the tests, the TE for the red particles injected from the sides of the channel consistently exceeded that of the green particles (i.e., particles came into the flow from the middle of the channel) despite the minimal difference between the observed values for the green and red particles. The average values of the TE for the green, red, and total particles were approximately 3, 7, and 5%, respectively, as shown in Figure 7a for Test A (i.e., where only a large expansion applies to the width of the channel). The observations in Test B, where large deepening applies to the channel in addition to large expansion, indicate that there is no significant change in the TE values (Figure 7b) compared to that in Test A. The average TEs for the green, red, and total particles were approximately 7, 9, and 8%, respectively. In Figure 7b, the observations in Trial 1 and Trial 3 were excluded because they yielded outlier data. In the case of moderate changes applied only to the width of the channel while the deepening in depth was large (i.e., Test C), the TE values for the green (4%), red (12%), and total particles (8%) are depicted in Figure 7c.

3.4. Case 3—Cylindrical MP Deposition in Channel with a Low Velocity of Flow

As shown in Figure 8, the laboratory observations illustrate the deposition of cylindrical particles in the different conditions of the channel (in terms of different depths and widths) where the flow with a mean streamwise velocity of 0.1 m/s may translocate particles. Among all the tests in this case, the trap efficiency (TE) for the red particles injected into the flow from the sides of the channel was higher than that for the green particles injected into the flow from the middle of the channel. In Test A, the average values of the TE for the green, red, and total particles were approximately 77, 85, and 82%, respectively (Figure 8a). The application of a large expansion and deepening on the channel (i.e., Test B) led to a significant increase in the TEs of the green and red particles. Accordingly, the average TEs for the green, red, and total particles were approximately 96, 98, and 97%, respectively. While a moderate change was applied only to the width of the channel (i.e., Test C), compared to the previous test (i.e., Test B), the resulting TE values for the green, red, and total particles were considerably smaller (i.e., 78%, 84%, and 81%, respectively), as indicated in Figure 8c. Two replicates of this test (i.e., Trials 2 and 3) were excluded from the dataset because they were identified as outliers.

3.5. Case 4—Cylindrical MP Deposition in Channel with a High Velocity of Flow

In this case, it was observed that some cylindrical particles were deposited on the bed in a flow even with a mean streamwise velocity of 0.5 m/s, as shown in Figure 9. As stated above, the red and green particles were injected into the flow from the sides and the middle of the channel, respectively. In both tests (i.e., Test A and B) of this case, the values of the TE for the red particles were consistently higher than those of the green particles, as in the previous cases. When only a large expansion was applied to the width of the channel (i.e., Test A), the average values of the TE for the green, red, and total particles were approximately 7, 11, and 9%, respectively, as shown in Figure 9a. By applying both a large deepening and expansion to the depth and width of the channel (i.e., Test B), different TE values were observed for both the green and red particles. In this regard, the average TEs for the green, red, and total particles were approximately 19, 29, and 21%, respectively, as shown in (Figure 9b). One of the limitations of this study is the lack of observations of cylindrical particles when they undergo moderate expansion in width and a large increase in the depth of the channel.

4. Discussion and Conclusions

It is crucial to know how different shapes of MPs are transported and deposited in channels. Here, a simple and typical geometry was used without any complexity. Numerical models need to be fed by experimental or field data in order to yield reliable results. Experimental tests can validate numerical simulations so that they can be employed when there is no access to experimental results observed in real conditions. The results of this study shed light on the behavior of MPs when they undergo different flow velocities. On the other hand, MP transport and deposition were observed when bathymetrical changes were applied to the channel’s bed. Accordingly, numerical simulations can be calibrated and validated based on experimental observations. The applications of the generated dataset are the calibration and validation of numerical models. In this regard, the initial conditions and boundary conditions in numerical models, particularly CFD models, need to be defined properly in order to simulate the real conditions. This is an essential step to determine some parameters in the numerical model, including the initial flow velocity and pressure, the flow and particle density, the size of the particles, their material, and the static and rolling friction between the particles and the walls (or boundaries) of the channel. According to the dataset, it is possible to define the parameters for the numerical models that affect particle transport and deposition appropriately so that numerical models can be validated and employed for other cases where there is no access to experimental data.
According to the aforementioned observations, it can be seen that by increasing the velocity of the flow from 0.1 m/s to 0.5 m/s, the values of the TE for both the green and red particles become smaller among all the cases, as expected. It was observed that fewer green particles injected into the middle of the channel were trapped compared to the red particles injected into the sides of the channel because the velocity at the centerline of the channel was higher than that at the sides. Among the different tests for each case, the values of the TE for both the green and red particles were the highest when large expansion and deepening were applied simultaneously to the width and depth of the channel, respectively. By comparing the observed results between the cases implemented using spherical and cylindrical particles, it was observed that more cylindrical particles were trapped, which is compatible with previous studies (e.g., [20]). However, it should be noted that since PVC and PET have the same density of 1380 kg/m3, there is no significant difference in the settling velocity of these materials.
There are some limitations in this study that need to be investigated further in the future. For instance, this study focused on the investigation of the deposition of microplastics of the same density and size, overlooking the diverse range of microplastics observed in water bodies, which vary in terms of both density and size. In addition, there are various shapes of microplastics, including regular and irregular, found in aquatic environments, whereas spherical and cylindrical particles were solely investigated in this study. On the other hand, the effect of a slope on the bottom of the channel was not investigated. In this study, only coarse sand was considered as the sediment on the bed of the channel. Moreover, a very limited range of Froude numbers (using two flow velocities and water levels) were included in implementing the tests.
It has been suggested that more in-depth studies are needed in future to obtain a better insight into MP transport and deposition.

Author Contributions

Conceptualization, A.M. and A.P.; data curation, M.B.; formal analysis, M.B.; funding acquisition, A.M. and A.P.; investigation, M.B.; methodology, A.M. and A.P.; project administration, A.M. and A.P.; resources, M.B.; software, M.B., A.M. and A.P.; supervision, A.M. and A.P.; validation, M.B.; visualization, M.B.; writing—original draft, M.B.; writing—review and editing, A.M. and A.P. All authors have read and agreed to the published version of the manuscript.

Funding

The research of M.B and A.P. was supported by the National Research Council of Canada (NRC), grant number OCN-300-1. The research of A.M. was supported by the Natural Sciences and Engineering Research Council of Canada (NSERC), grant number 210717.

Institutional Review Board Statement

Not applicable.

Informed Consent Statement

Not applicable.

Data Availability Statement

Some or all of the data are available from the corresponding author upon request.

Conflicts of Interest

The authors declare no conflicts of interest.

Appendix A

Figure A1. The streamwise water velocity profile in the channel with (a) a low velocity of flow (U = 0.1 m/s) and (b) a high velocity of flow (U = 0.5 m/s). The error bars indicate the standard deviation.
Jmse 12 00953 g0a1
Figure A2. The profiles of Reynolds stresses in the channel with a low velocity of flow (U = 0.1 m/s).
Jmse 12 00953 g0a2
Figure A3. The profiles of Reynolds stresses in the channel with a high velocity of flow (U = 0.5 m/s).
Jmse 12 00953 g0a3

References

  1. Corcoran, L.; Belontz, S.L.; Ryan, K.; Walzak, M.J. Factors controlling the distribution of microplastic particles in benthic sediment of the Thames River, Canada. Environ. Sci. Technol. 2019, 54, 818–825. [Google Scholar] [CrossRef] [PubMed]
  2. Hartmann, N.B.; Skjolding, L.M.; Nolte, T.; Baun, A. Aquatic ecotoxicity testing of nanoplastics-lessons learned from nanoecotoxicology. In SETAC Europe 26th Annual Meeting; SETAC Europe: Brussels, Belgium, 2016; pp. 43–44. [Google Scholar]
  3. Rocha-Santos, T.; Duarte, A.C. A critical overview of the analytical approaches to the occurrence, the fate and the behavior of microplastics in the environment. TrAC Trends Anal. Chem. 2015, 65, 47–53. [Google Scholar] [CrossRef]
  4. EU. Environmental and Health Risks of Microplastic Pollution; EU: Maastricht, The Netherlands, 2019. [Google Scholar]
  5. Barnes, D.K.; Galgani, F.; Thompson, R.C.; Barlaz, M. Accumulation and fragmentation of plastic debris in global environments. Philos. Trans. R. Soc. B Biol. Sci. 2009, 364, 1985–1998. [Google Scholar] [CrossRef] [PubMed]
  6. Koelmans, A.A.; Bakir, A.; Burton, G.A.; Janssen, C.R. Microplastic as a vector for chemicals in the aquatic environment: Critical review and model-supported reinterpretation of empirical studies. Environ. Sci. Technol. 2016, 50, 3315–3326. [Google Scholar] [CrossRef] [PubMed]
  7. Carrol, C.; Sousa, J.; Thevenon, F. Plastic Debris in the Ocean: The Characterization of Marine Plastics and Their Environmental Impacts, Situation Analysis Report; International Union for Conservation of Nature (IUCN): Gland, Switzerland, 2014; Volume 52, pp. 549–562. [Google Scholar]
  8. Napper, I.E.; Thompson, R.C. Marine plastic pollution: Other than microplastic. In Waste; Academic Press: Cambridge, MA, USA, 2019; pp. 425–442. [Google Scholar]
  9. Wright, S.L.; Kelly, F.J. Plastic and human health: A micro issue? Environ. Sci. Technol. 2017, 51, 6634–6647. [Google Scholar] [CrossRef] [PubMed]
  10. Khatmullina, L.; Isachenko, I. Settling velocity of microplastic particles of regular shapes. Mar. Pollut. Bull. 2017, 114, 871–880. [Google Scholar] [CrossRef] [PubMed]
  11. Schwarzer, M.; Brehm, J.; Vollmer, M.; Jasinski, J.; Xu, C.; Zainuddin, S.; Fröhlich, T.; Schott, M.; Greiner, A.; Scheibel, T.; et al. Shape, size, and polymer dependent effects of microplastics on Daphnia magna. J. Hazard. Mater. 2022, 426, 128136. [Google Scholar] [CrossRef]
  12. Nava, V.; Leoni, B. A critical review of interactions between microplastics, microalgae and aquatic ecosystem function. Water Res. 2021, 188, 116476. [Google Scholar] [CrossRef] [PubMed]
  13. Liu, P.; Zhan, X.; Wu, X.; Li, J.; Wang, H.; Gao, S. Effect of weathering on environmental behavior of microplastics: Properties, sorption and potential risks. Chemosphere 2020, 242, 125193. [Google Scholar] [CrossRef]
  14. Miranda, M.N.; Sampaio, M.J.; Tavares, B.; Silva, A.M.; Pereira, M.F.R. Aging assessment of microplastics (LDPE, PET and uPVC) under urban environment stressors. Sci. Total Environ. 2021, 796, 148914. [Google Scholar] [CrossRef]
  15. De Leo, A.; Cutroneo, L.; Sous, D.; Stocchino, A. Settling velocity of microplastics exposed to wave action. J. Mar. Sci. Eng. 2021, 9, 142. [Google Scholar] [CrossRef]
  16. Doyle, M.J.; Watson, W.; Bowlin, N.M.; Sheavly, S.B. Plastic particles in coastal pelagic ecosystems of the Northeast Pacific ocean. Mar. Environ. Res. 2011, 71, 41–52. [Google Scholar] [CrossRef] [PubMed]
  17. Bigdeli, M.; Mohammadian, A.; Pilechi, A.; Taheri, M. Lagrangian modeling of marine microplastics fate and transport: The state of the science. J. Mar. Sci. Eng. 2022, 10, 481. [Google Scholar] [CrossRef]
  18. Kooi, M.; Nes, E.H.V.; Scheffer, M.; Koelmans, A.A. Ups and downs in the ocean: Effects of biofouling on vertical transport of microplastics. Environ. Sci. Technol. 2017, 51, 7963–7971. [Google Scholar] [CrossRef]
  19. Jalón-Rojas, I.; Wang, X.H.; Fredj, E. A 3D numerical model to Track Marine Plastic Debris (TrackMPD): Sensitivity of microplastic trajectories and fates to particle dynamical properties and physical processes. Mar. Pollut. Bull. 2019, 141, 256–272. [Google Scholar] [CrossRef] [PubMed]
  20. Mason, S.A.; Daily, J.; Aleid, G.; Ricotta, R.; Smith, M.; Donnelly, K.; Knauff, R.; Edwards, W.; Hoffman, M.J. High levels of pelagic plastic pollution within the surface waters of Lakes Erie and Ontario. J. Great Lakes Res. 2020, 46, 277–288. [Google Scholar] [CrossRef]
  21. Decuzzi, P.; Lee, S.; Bhushan, B.; Ferrari, M. A theoretical model for the margination of particles within blood vessels. Ann. Biomed. Eng. 2005, 33, 179–190. [Google Scholar] [CrossRef]
  22. Choi, C.E.; Zhang, J.; Liang, Z. Towards realistic predictions of microplastic fiber transport in aquatic environments: Secondary motions. Water Res. 2022, 218, 118476. [Google Scholar] [CrossRef] [PubMed]
  23. Boos, J.; Gilfedder, B.S.; Frei, S. Tracking microplastics across the streambed interface: Using laser-induced-fluorescence to quantitatively analyze microplastic transport in an experimental flume. Water Resour. Res. 2021, 57, e2021WR031064. [Google Scholar] [CrossRef]
  24. Pohl, F.; Eggenhuisen, J.T.; Kane, I.A.; Clare, M.A. Transport and burial of microplastics in deep-marine sediments by turbidity currents. Environ. Sci. Technol. 2020, 54, 4180–4189. [Google Scholar] [CrossRef]
  25. Kerpen, N.B.; Schlurmann, T.; Schendel, A.; Gundlach, J.; Marquard, D.; Hüpgen, M. Wave-induced distribution of microplastic in the surf zone. Front. Mar. Sci. 2020, 7, 590565. [Google Scholar] [CrossRef]
  26. Waldschläger, K.; Schüttrumpf, H. Effects of particle properties on the settling and rise velocities of microplastics in freshwater under laboratory conditions. Environ. Sci. Technol. 2019, 53, 1958–1966. [Google Scholar] [CrossRef] [PubMed]
  27. Middleton, G.V. Hydraulic interpretation of sand size distributions. J. Geol. 1976, 84, 405–426. [Google Scholar] [CrossRef]
  28. Zhiyao, S.; Tingting, W.; Fumin, X.; Ruijie, L. A simple formula for predicting settling velocity of sediment particles. Water Sci. Eng. 2008, 1, 37–43. [Google Scholar] [CrossRef]
  29. Clift, R.; Gauvin, W. Motion of entrained particles in gas streams. Can. J. Chem. Eng. 1971, 49, 439–448. [Google Scholar] [CrossRef]
  30. Cheng, N.-S. Comparison of formulas for drag coefficient and settling velocity of spherical particles. Powder Technol. 2009, 189, 395–398. [Google Scholar] [CrossRef]
  31. Shankar, M.S.; Pandey, M.; Shukla, A.K. Analysis of existing equations for calculating the settling velocity. Water 2021, 13, 1987. [Google Scholar] [CrossRef]
Figure 1. Tilting flume at NRC-OCRE.
Jmse 12 00953 g001
Figure 2. Schematic of the experimental setup: Top figure: Side view, Bottom figure: Top view.
Jmse 12 00953 g002
Figure 3. FOV in the experimental setup from (a) top and (b) side view.
Jmse 12 00953 g003
Figure 4. Particles used in the experiments. (a) Spherical. (b) Cylindrical.
Jmse 12 00953 g004
Figure 5. Injection tubes across the channel’s width.
Jmse 12 00953 g005
Figure 6. Trap Efficiency of MPs in Case 1: Spherical MP deposition in the channel with a low velocity of flow (U = 0.1 m/s). (a) Test A (large expansion). (b) Test B (large expansion and deepening). (c) Test C (moderate expansion and large deepening). The graphs illustrate the results of two repetitions of each test along with the average trap efficiency for both green and red particles, with the total trap efficiency depicted in blue columns.
Jmse 12 00953 g006
Figure 7. Trap Efficiency of MPs in Case 2: Spherical MP deposition in the channel with a high velocity of flow (U = 0.5 m/s). (a) Test A (large expansion). (b) Test B (large expansion and deepening). (c) Test C (moderate expansion and large deepening). The graphs illustrate the results of two repetitions of each test along with the average trap efficiency for both green and red particles, with the total trap efficiency depicted in blue columns.
Jmse 12 00953 g007
Figure 8. Trap Efficiency of MPs in Case 3: Cylindrical MP deposition in the channel with a low velocity of flow (U = 0.1 m/s). (a) Test A (large expansion). (b) Test B (large expansion and deepening). (c) Test C (moderate expansion and large deepening). The graphs illustrate the results of two repetitions of tests along with the average trap efficiency for both green and red particles, with the total trap efficiency depicted in blue columns.
Jmse 12 00953 g008
Figure 9. Trap Efficiency of MPs in Case 4: Cylindrical MP deposition in the channel with a high velocity of flow (U = 0.5 m/s). (a) Test A (large expansion). (b) Test B (large expansion and deepening). The graphs illustrate the results of two repetitions of tests along with the average trap efficiency for both green and red particles, with the total trap efficiency depicted in blue columns.
Jmse 12 00953 g009
Table 1. Experimental cases implemented in this study.
CaseFlow Velocity (m/s)Deepening in Depth (cm)Expansion in Width (cm)MaterialShape
Case 1—Spherical MP deposition in channel with a low velocity of flowLow velocity
U = 0.1 m/s
0 and 710 and 18PETSpherical
Case 2—Spherical MP deposition in channel with a high velocity of flowHigh velocity
U = 0.5 m/s
0 and 710 and 18PETSpherical
Case 3—Cylindrical MP deposition in channel with a low velocity of flowLow velocity
U = 0.1 m/s
0 and 710 and 18PVCCylindrical
Case 4—Cylindrical MP deposition in channel with a high velocity of flowHigh velocity
U = 0.5 m/s
0 and 710 and 18PVCCylindrical
Table 2. Definition of large and moderate expansion in this study.
CaseTestFlow Velocity (m/s)Water Surface Elevation (cm)Channel Depth at Zone B (cm)Channel Width at Zone B(cm)Large/Moderate Expansion/Deepening
Case 1ALow velocity
U = 0.1 m/s
19.1038Large expansion
B19.8738Large expansion and deepening
C19.8730Moderate expansion and large deepening
Case 2 AHigh velocity
U = 0.5 m/s
35038Large expansion
B37738Large expansion and deepening
C37730Moderate expansion and large deepening
Case 3 ALow velocity
U = 0.1 m/s
19.1038Large expansion
B19.8738Large expansion and deepening
C19.8730Moderate expansion and large deepening
Case 4 AHigh velocity
U = 0.5 m/s
35038Large expansion
B37738Large expansion and deepening
Disclaimer/Publisher’s Note: The statements, opinions and data contained in all publications are solely those of the individual author(s) and contributor(s) and not of MDPI and/or the editor(s). MDPI and/or the editor(s) disclaim responsibility for any injury to people or property resulting from any ideas, methods, instructions or products referred to in the content.