
Experimental Study on Local Scour at the Monopile Foundation of an Offshore Wind Turbine under the Combined Action of Wave–Current–Vibration


Abstract
:1. Introduction
2. Experimental Research Program
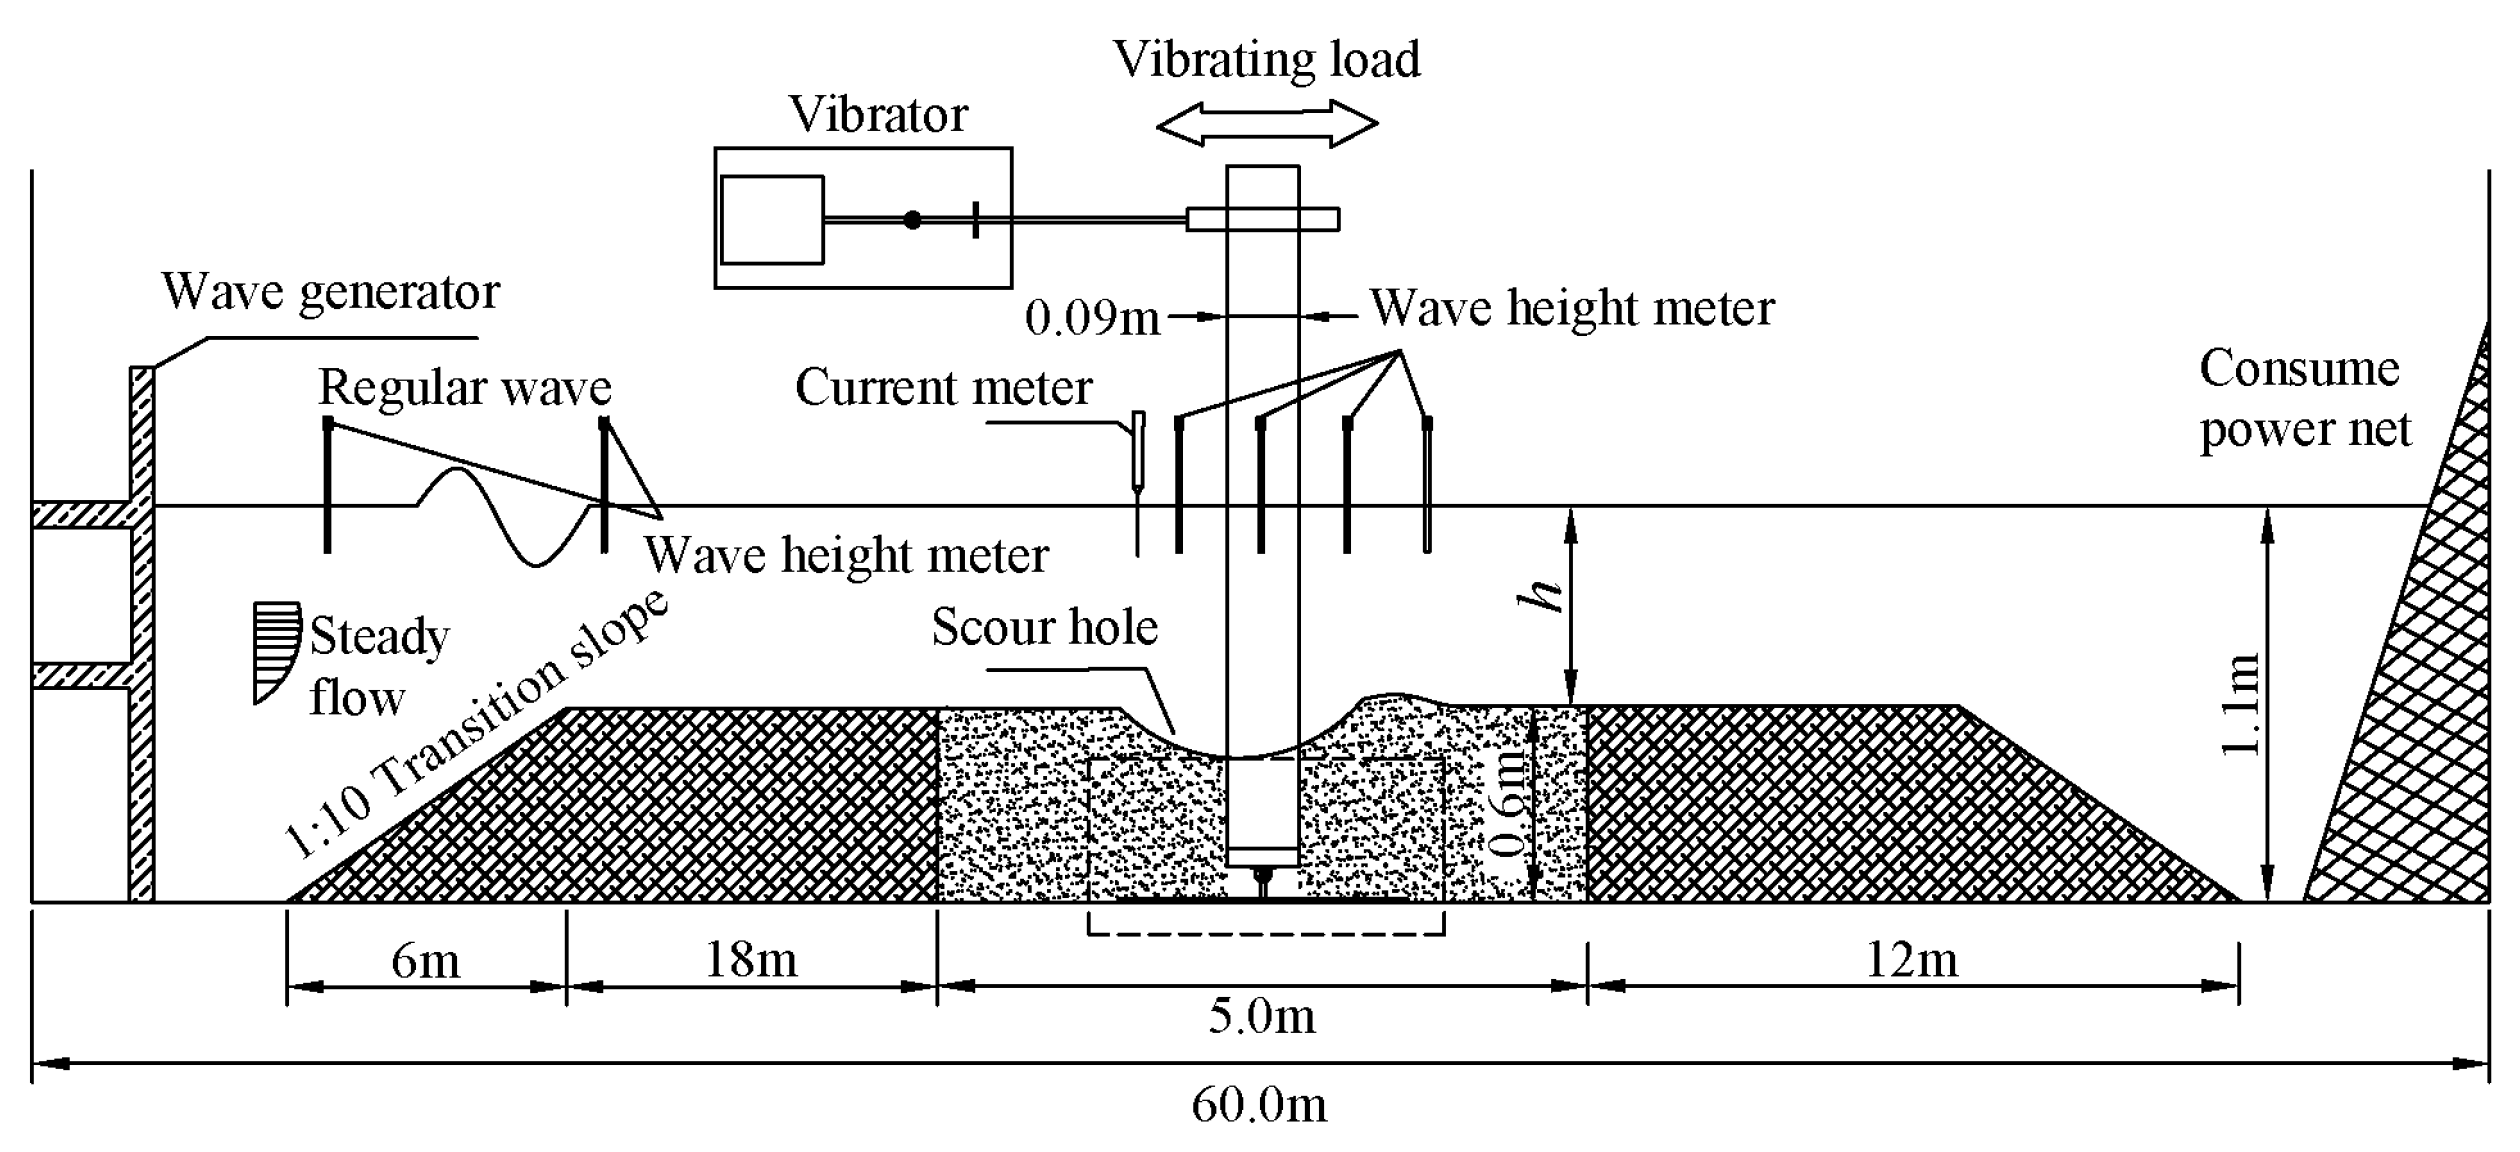
2.1. Experimental Layout
2.2. Key Parameters of the Experimental
2.3. Experimental Scheme
2.3.1. Wave–Current Test Conditions
2.3.2. Wave–Current–Vibration Test Conditions
3. Study on Scour Characteristics around a Monopile under Wave–Current–Vibration Interaction
3.1. The Variation Law of Wave Height and Reference Point Velocity
3.1.1. The Variation Law of Velocity and Wave Height at the Reference Point under Wave Action
- Water particle trajectory at the reference point;
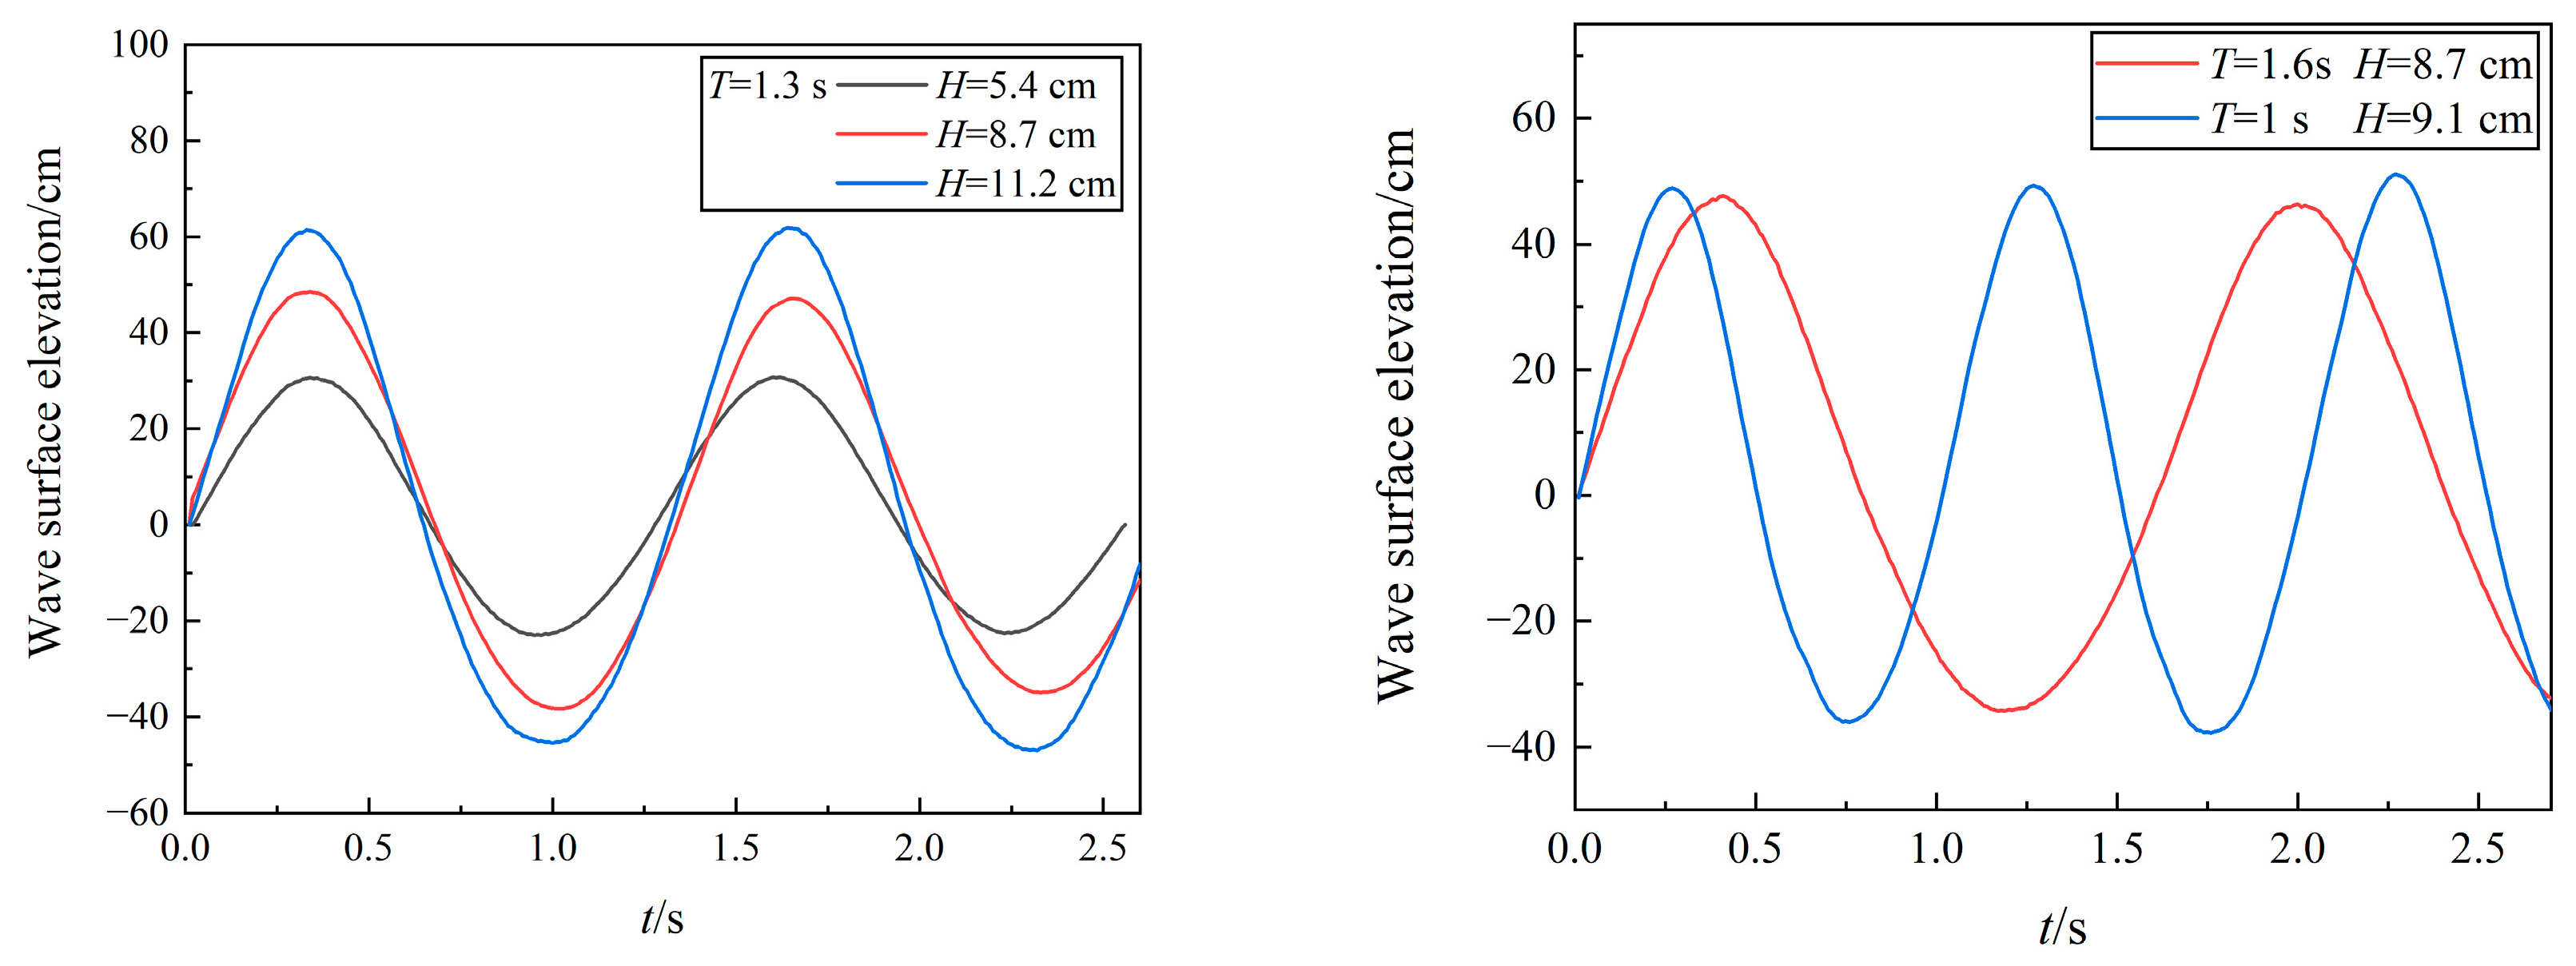
- Wave height curve and horizontal velocity change at the reference point;
3.1.2. The Variation Law of Velocity and Wave Height at the Reference Point under the Action of Wave–Current
3.2. Study on the Development of the Local Scour Depth of a Monopile under the Combined Action of Wave–Current–Vibration
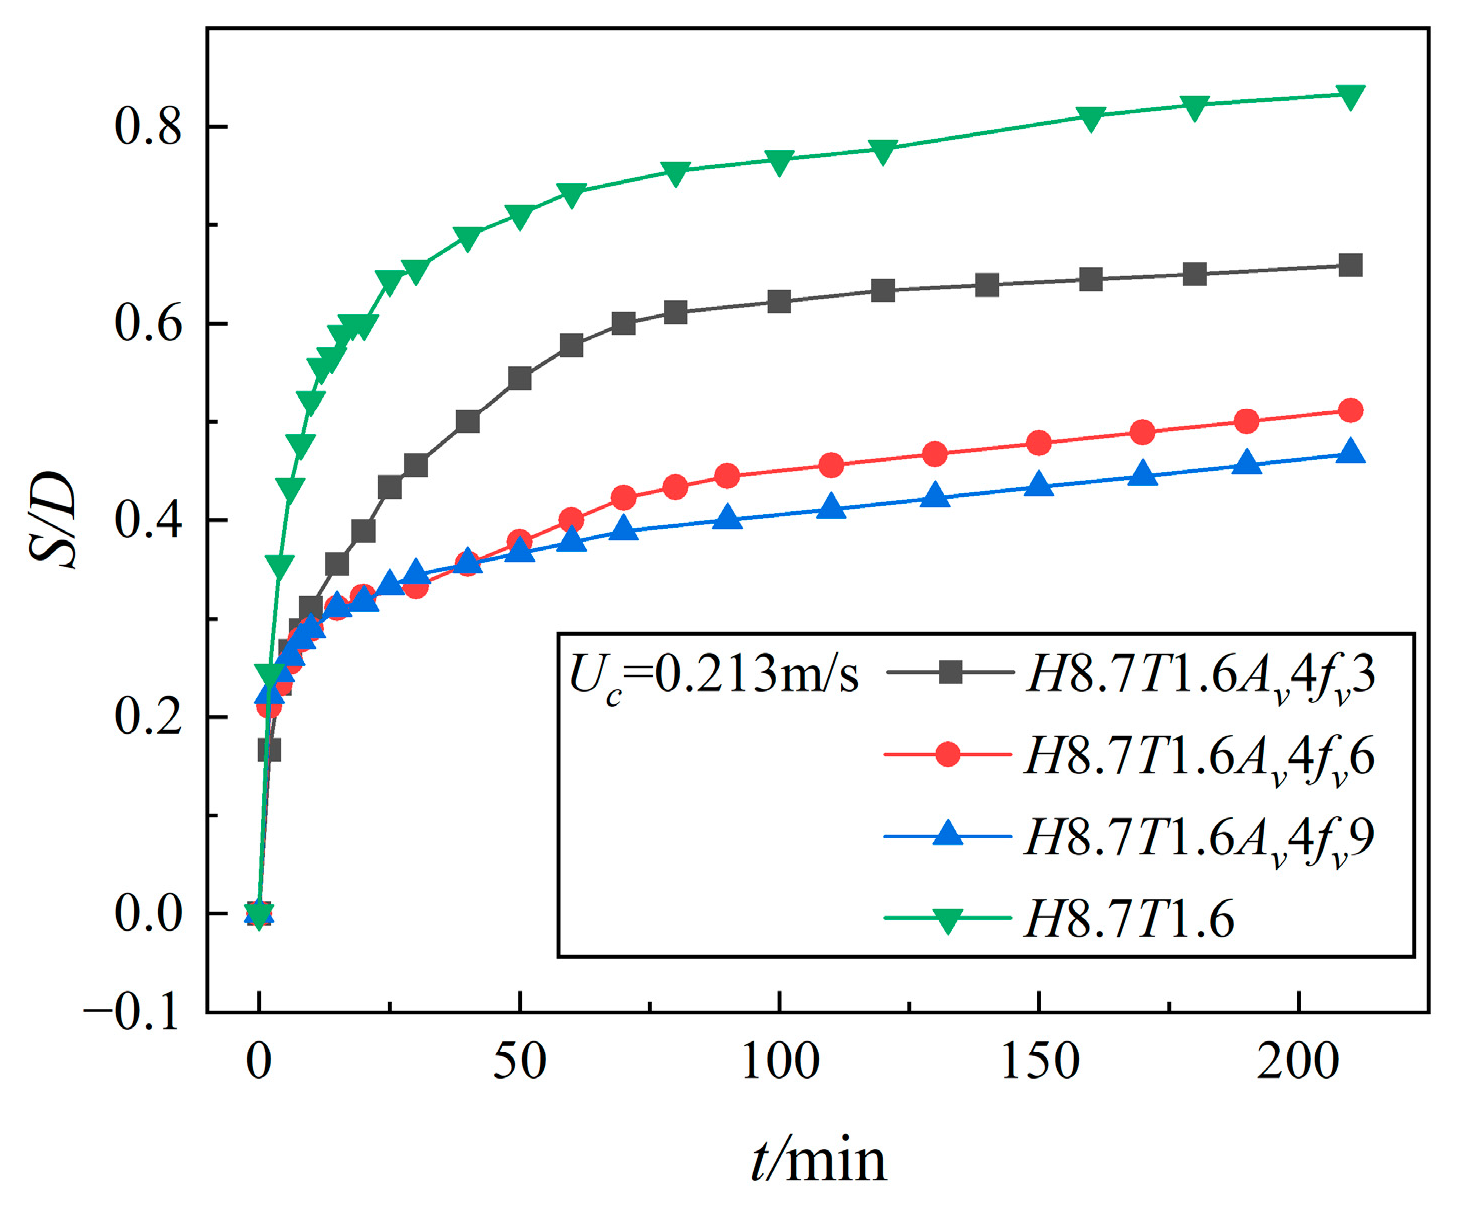
3.2.1. The Influence of Vibration Frequency on the Duration of Scour Depth Development
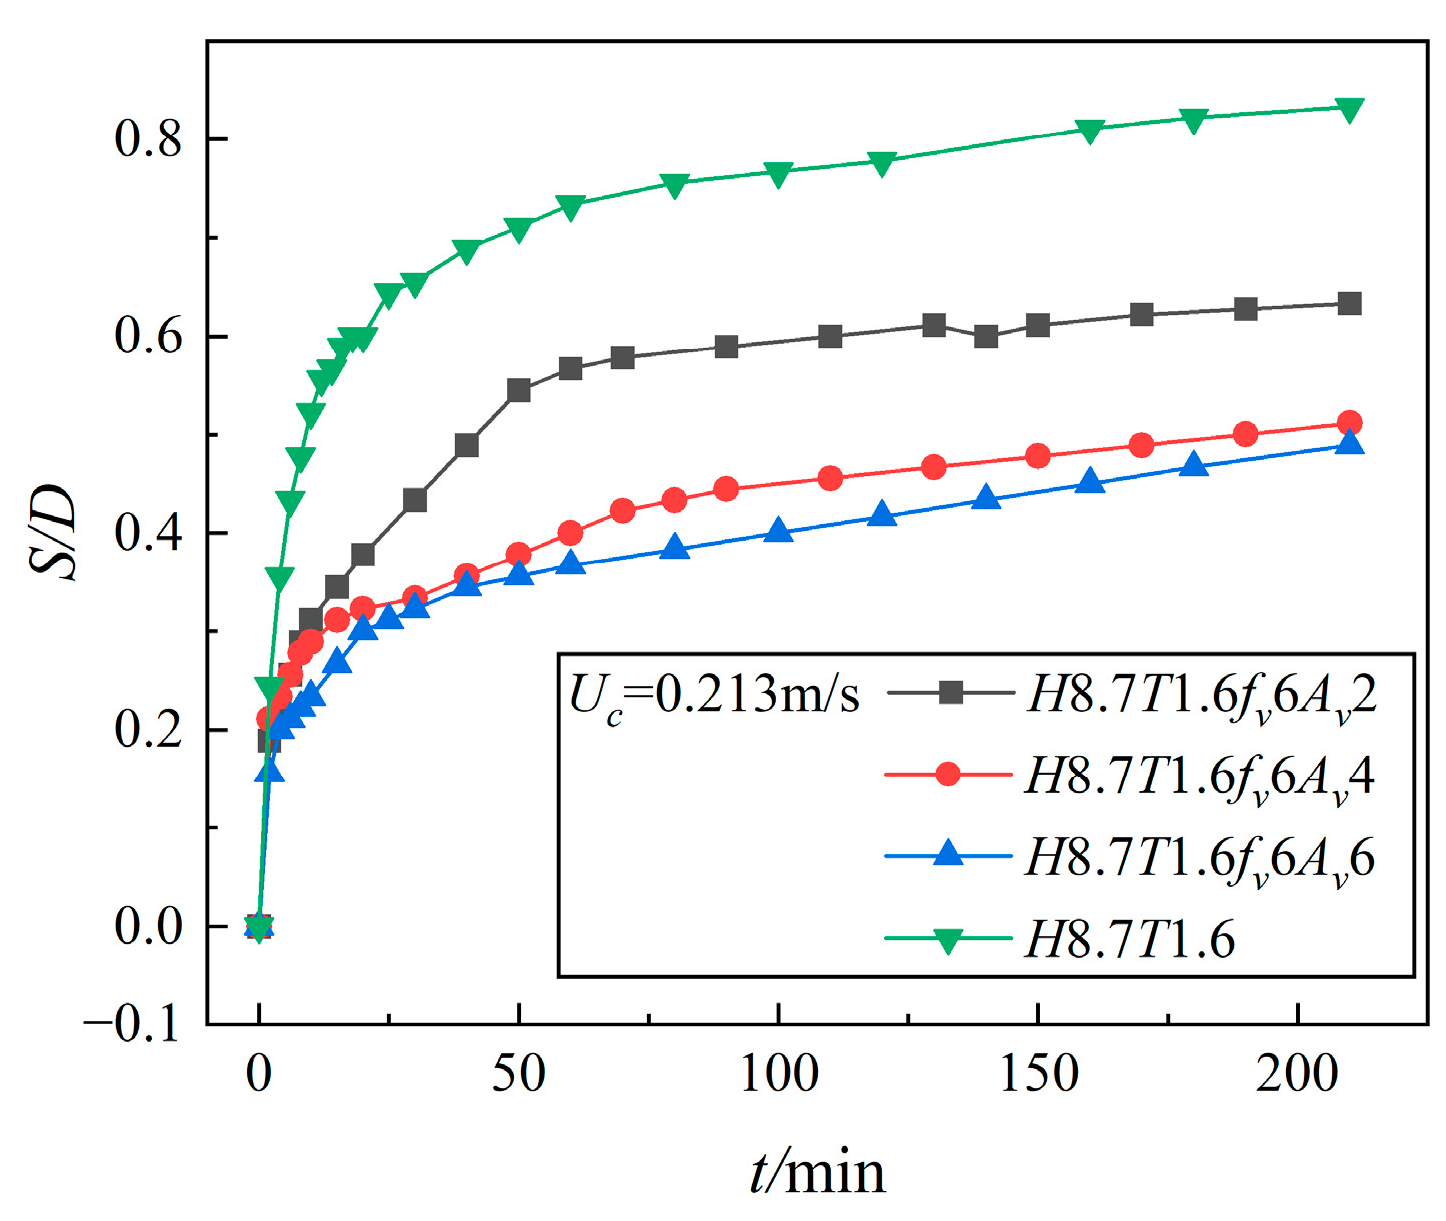
3.2.2. The Influence of Amplitude on the Duration of Scour Depth Development
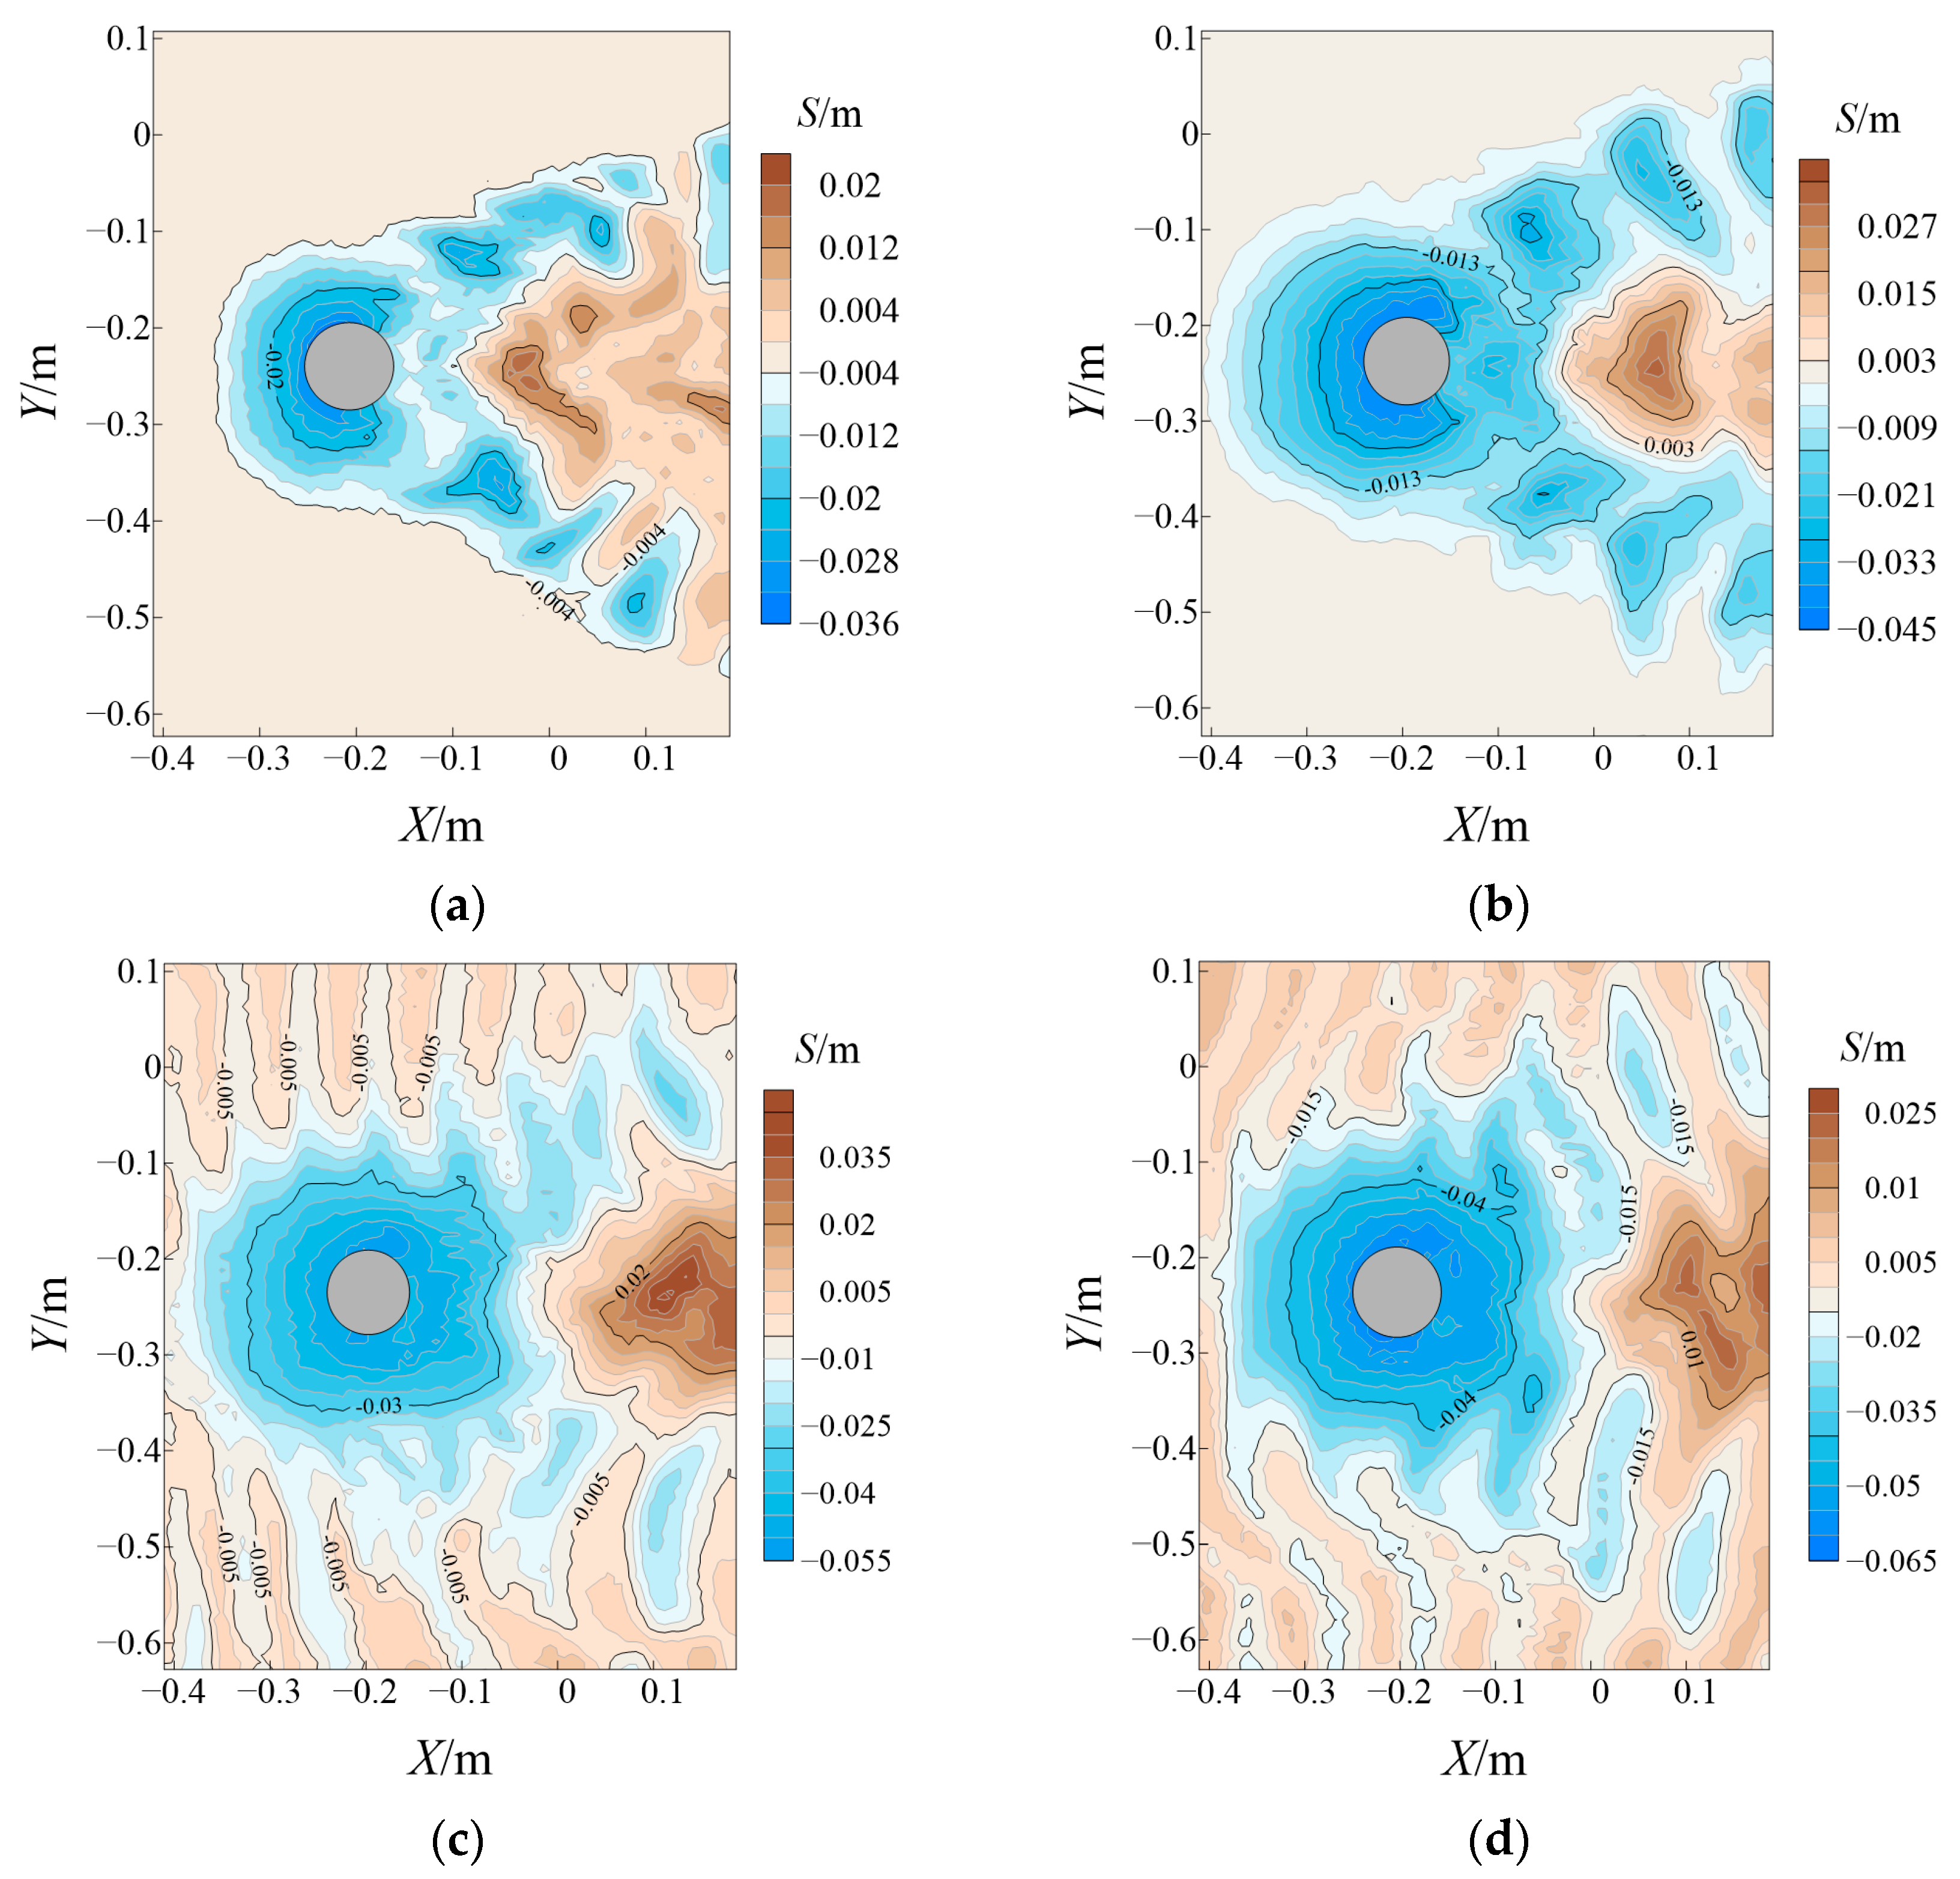
3.3. Development Process and Morphological Characteristics of the Scour Hole
3.3.1. The Development Process of the Scour Hole under the Combined Action of Current and Vibration
3.3.2. The Development Process of the Scour Hole under the Action of Current and Vibration
3.3.3. The Development Process of the Scour Hole under the Action of Current and Vibration
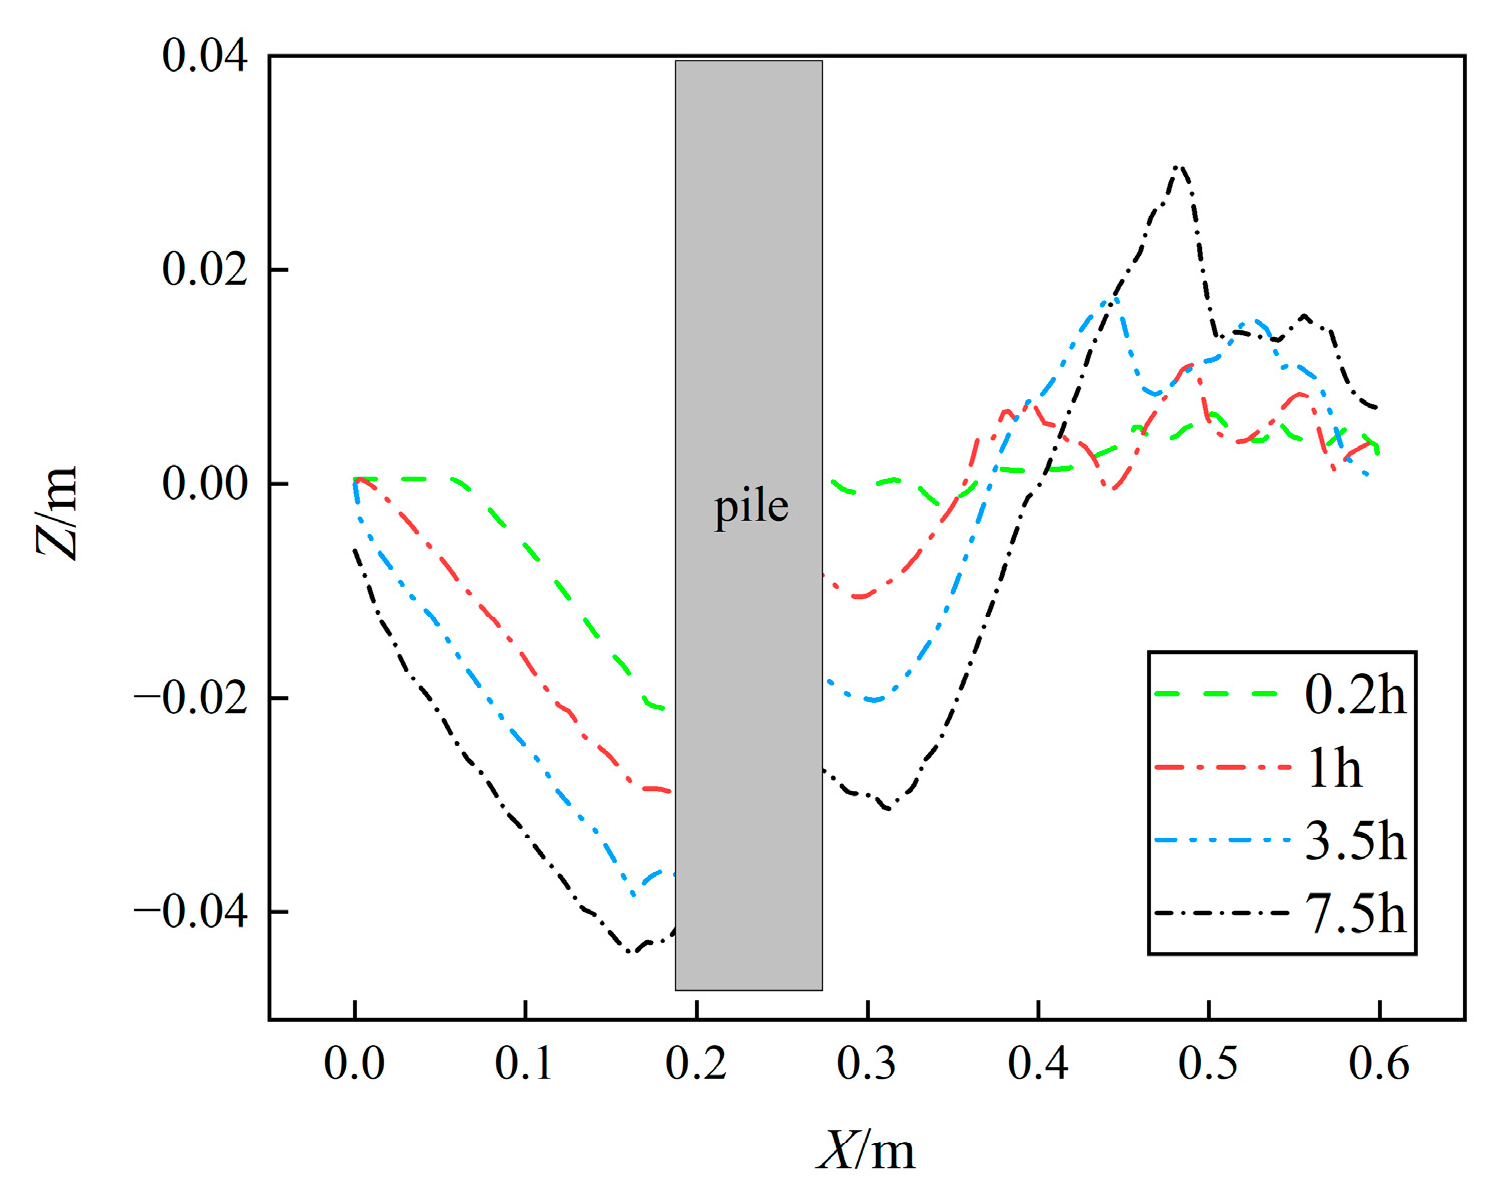
3.4. The Influence of Vibration Load on the Profile of the Scour Hole
4. Analysis of Influencing Factors on the Local Scour Depth of a Monopile under the Combined Action of Wave–Current–Vibration
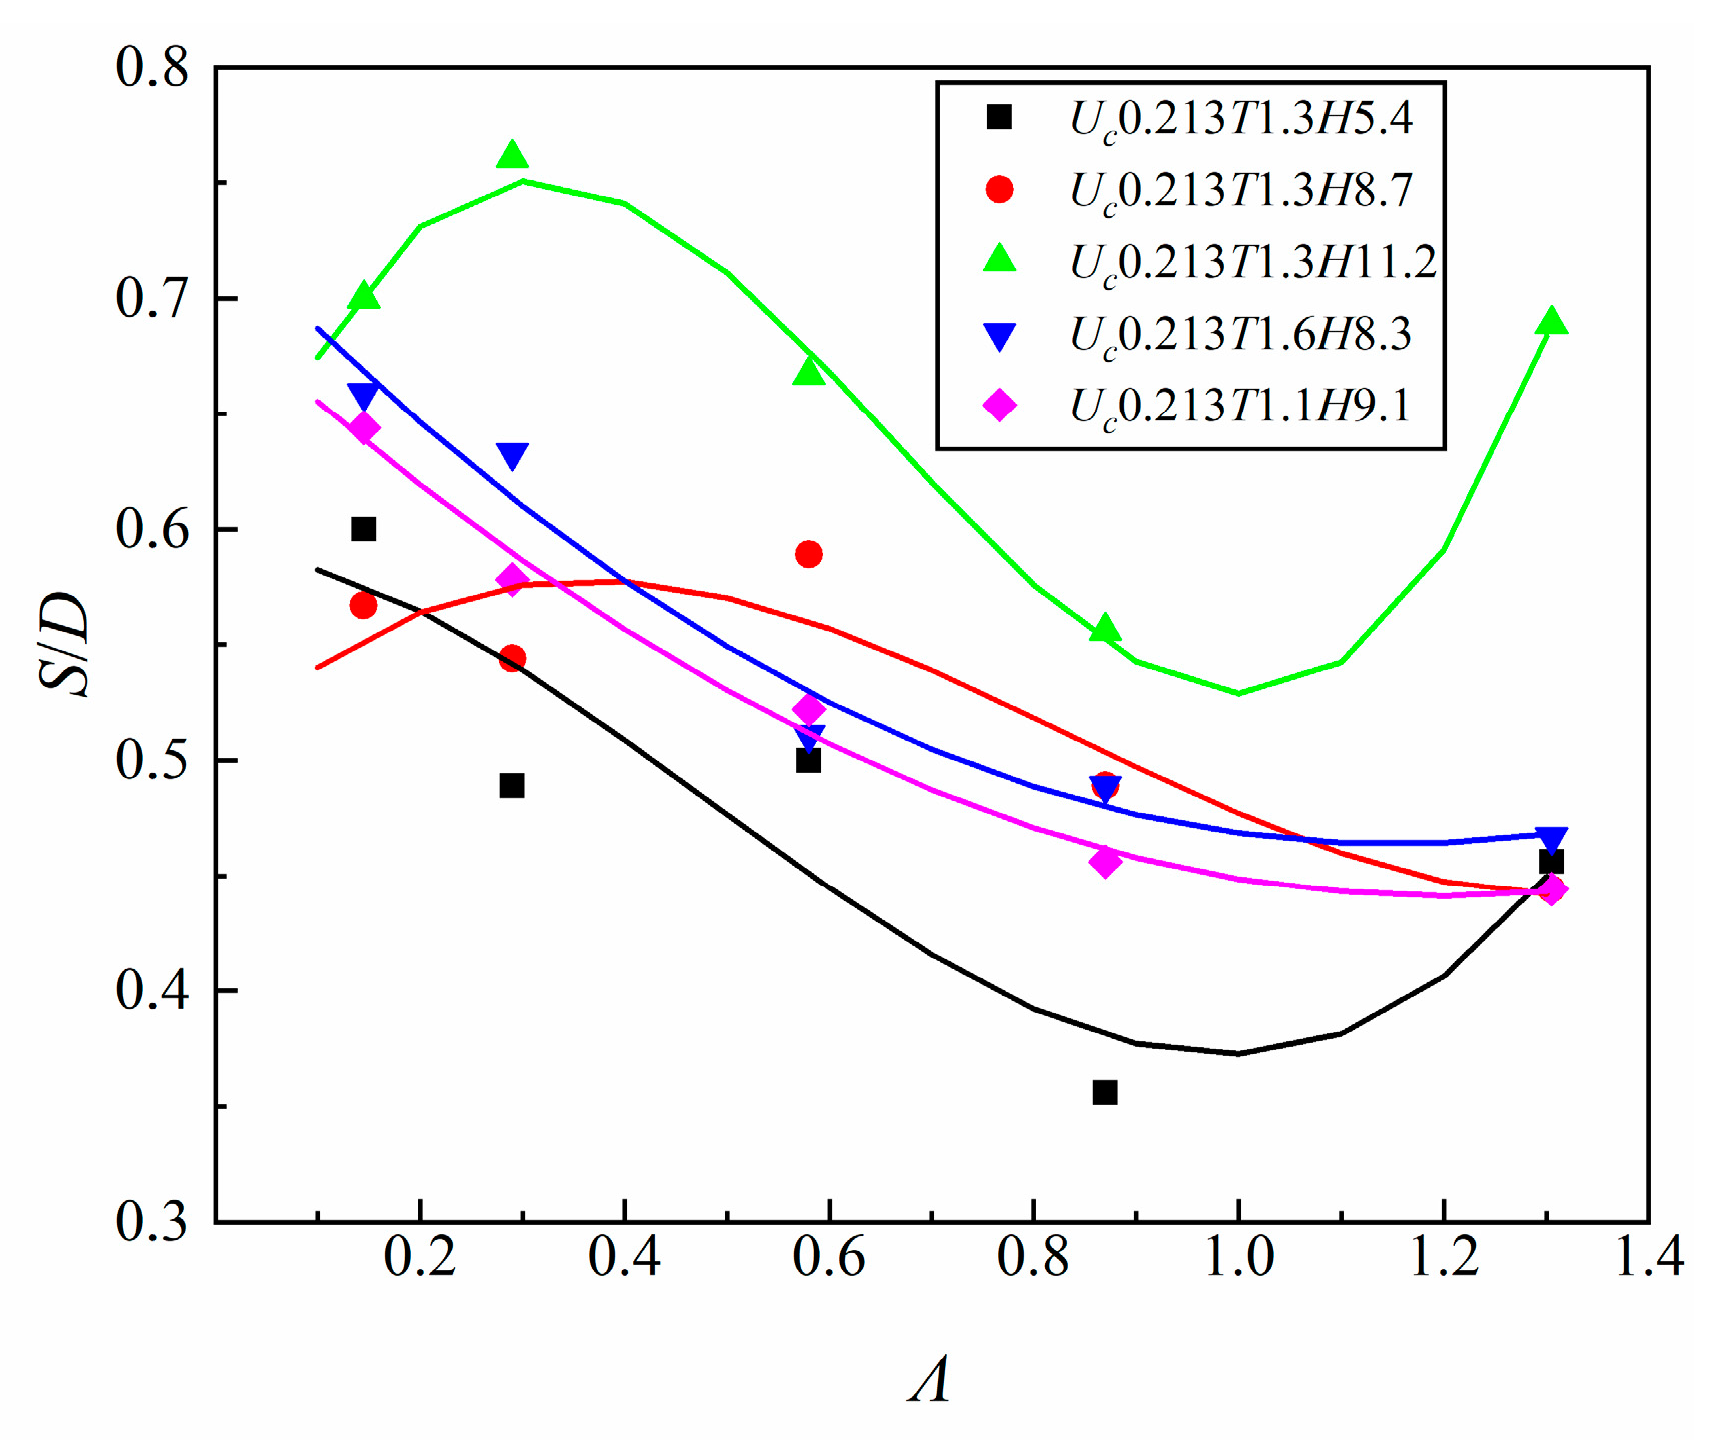
4.1. The Influence of Vibration Intensity on the Maximum Scour Depth
4.2. The Influence of the Froude Number Fr on the Maximum Scour Depth
4.3. The Influence of the KC Number on the Maximum Scour Depth
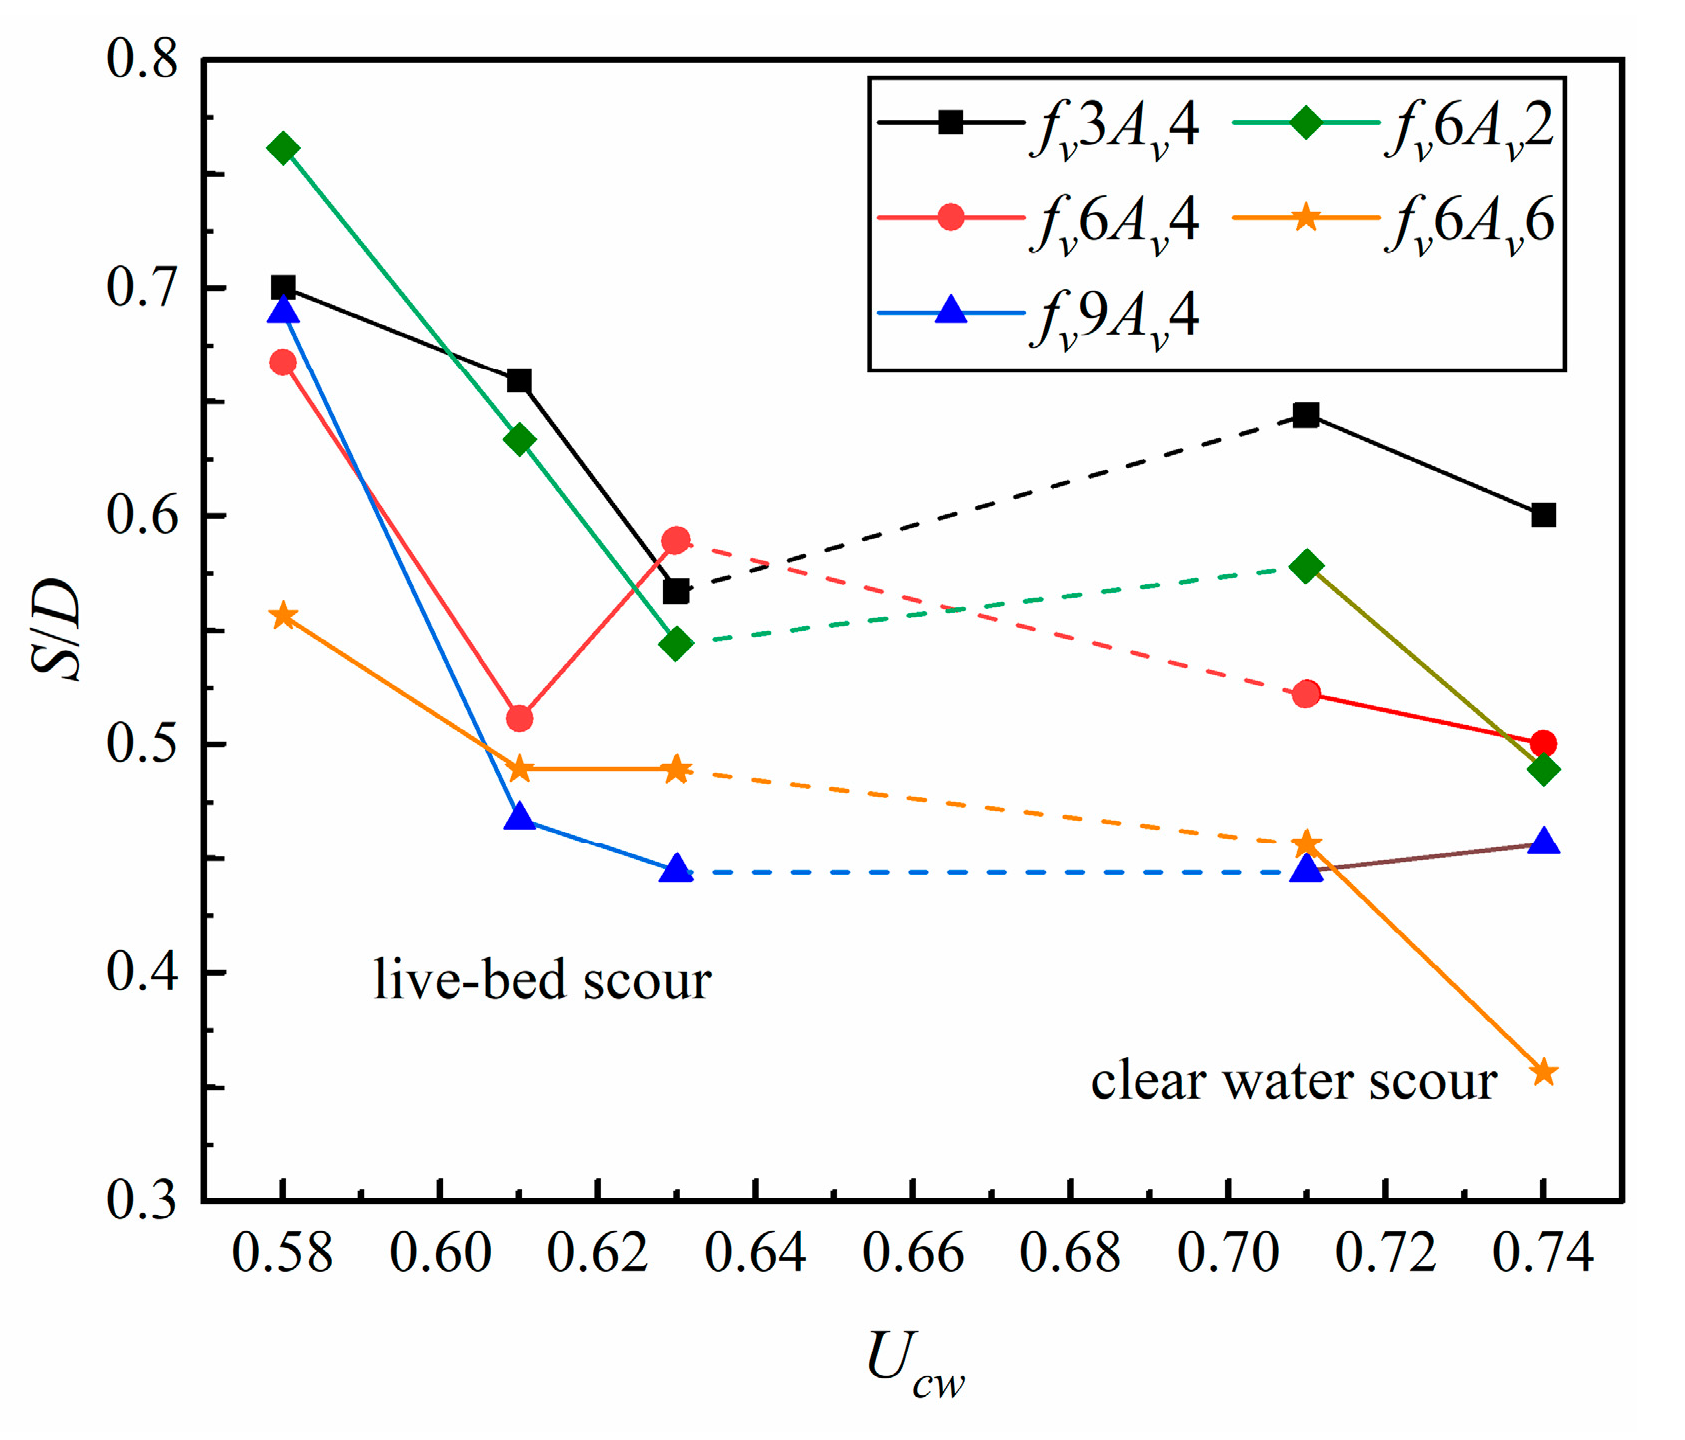
4.4. Effect of Ucw on the Maximum Scour Depth
4.5. Empirical Formula of Local Scour Depth of a Monopile under Combined Action of Wave–Current–Vibration
5. Conclusions
- (1)
- The maximum scour depth under the combined action of wave–current–vibration will be significantly smaller than the maximum scour depth under wave action. Vibration load will reduce the quasi-equilibrium scour depth, and with the increase in vibration frequency and amplitude, the quasi-equilibrium scour depth around the monopile will gradually decrease. The local scour topography of the monopile under the combined action of current and vibration is highly symmetrical, and the maximum scour depth is on the side of the pile, with the scour hole type presenting a spoon-like shape. As the amplitude increases, the width of the scour hole will increase significantly. As the vibration frequency increases, the backfill will be more obvious, and the maximum scour depth in front of the pile will be significantly reduced.
- (2)
- Under the combined action of wave–current–vibration, the relative scour depth decreases with the increase in vibration intensity under the scouring of clear water. Under live-bed scour, when θ/θc ≤ 1.1, the relationship between relative scour depth and vibration intensity is similar to that of clear water scour. When θ/θc > 1.1, the relative scour depth increases first, then decreases, and finally increases with the increase in vibration intensity.
- (3)
- S/D is the function of vibration intensity Λ and Froude number Fr, KC number, Ucw under the wave–current–vibration interaction. The relative scour depth S/D increases with the increase in Fr and KC, and has the same trend as the vertical pile fitting curve. However, with the increase in Ucw, the relative scour depth under clear water scour and live-bed scour shows a downward trend.
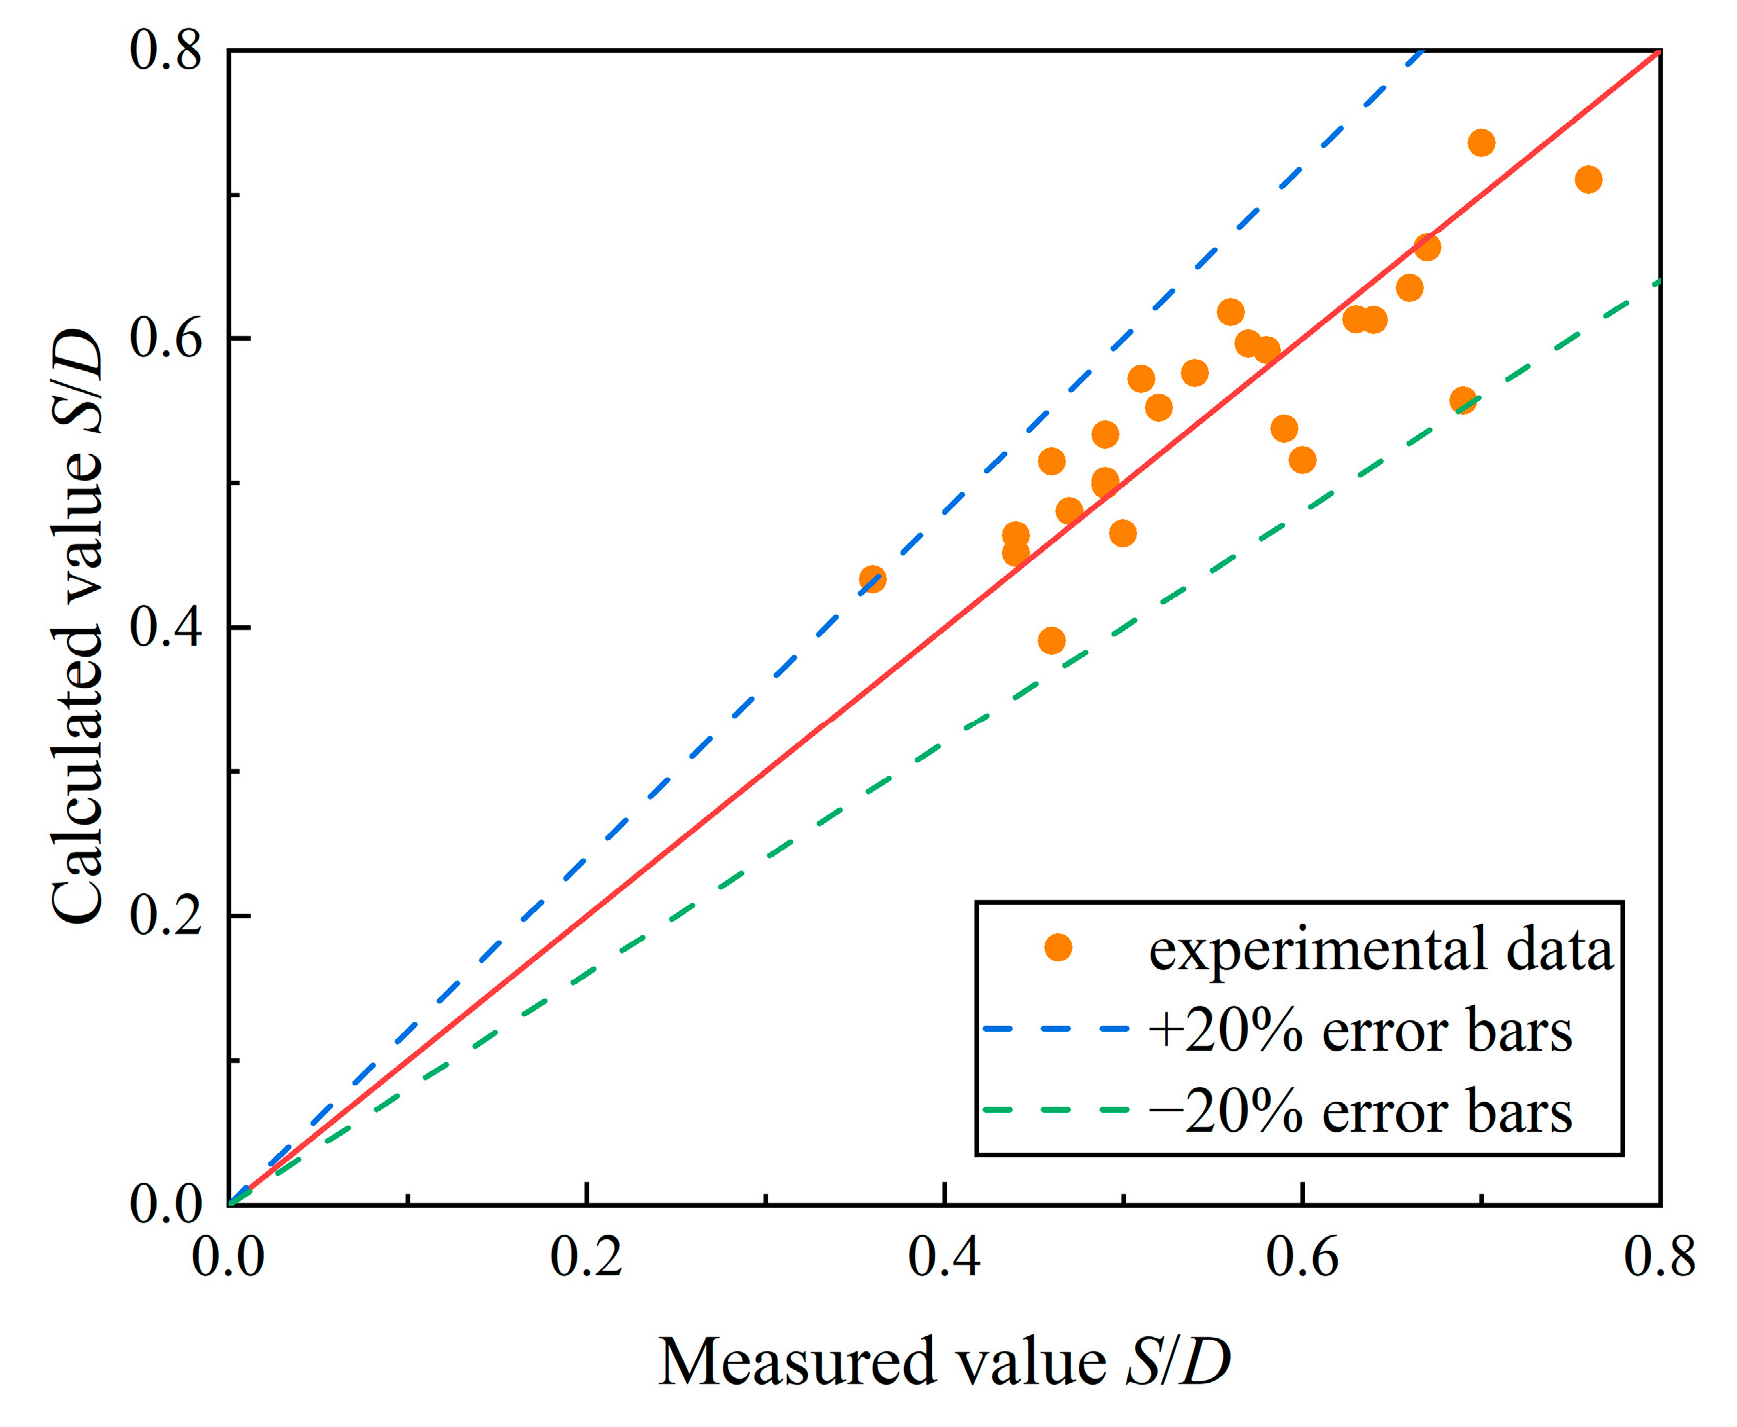
- (4)
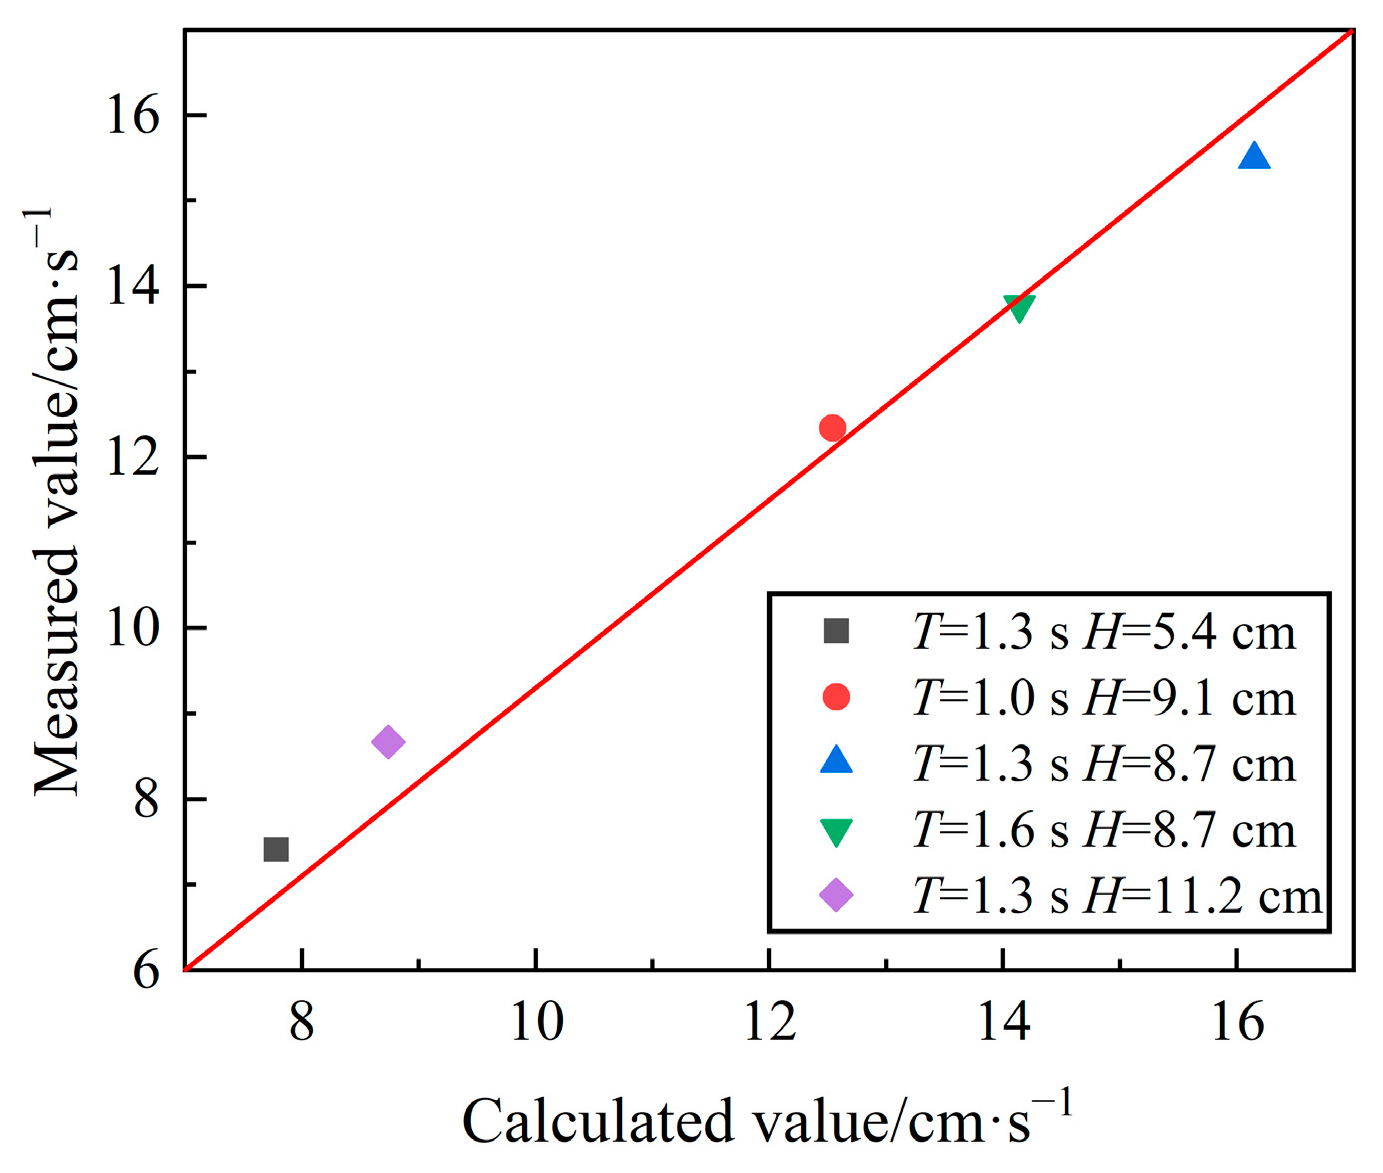
- The four dimensionless parameters of the Keulegan–Carpenter number (KC), vibration intensity (Λ), velocity ratio (Ucw), and Froude number (Fr) are used as multivariate regression model variables. The prediction formula of the local scour depth of a monopile under wave–current–vibration is obtained by fitting. A comparison is made between the measured and calculated values of the error in this formula. The results show that this formula can predict the local scour depth of a monopile under wave–current–vibration.
Author Contributions
Funding
Institutional Review Board Statement
Informed Consent Statement
Data Availability Statement
Conflicts of Interest
References
- He, K.; Ye, J. Seismic Dynamics of Offshore Wind Turbine-Seabed Foundation: Insights from a Numerical Study. Renew. Energy 2023, 205, 200–221. [Google Scholar] [CrossRef]
- Yu, L.-Q.; Wang, L.-Z.; Guo, Z.; Bhattacharya, S.; Nikitas, G.; Li, L.-L.; Xing, Y.-L. Long-Term Dynamic Behavior of Monopile Supported Offshore Wind Turbines in Sand. Theor. Appl. Mech. Lett. 2015, 5, 80–84. [Google Scholar] [CrossRef]
- Cuéllar, P.; Georgi, S.; Baeßler, M.; Rücker, W. On the Quasi-Static Granular Convective Flow and Sand Densification around Pile Foundations under Cyclic Lateral Loading. Granul. Matter 2012, 14, 11–25. [Google Scholar] [CrossRef]
- Nanda Kishore, Y.; Narasimha Rao, S.; Mani, J.S. The Behavior of Laterally Loaded Piles Subjected to Scour in Marine Environment. KSCE J. Civ. Eng. 2009, 13, 403–408. [Google Scholar] [CrossRef]
- Shi, S.; Zhai, E.; Xu, C.; Iqbal, K.; Sun, Y.; Wang, S. Influence of Pile-Soil Interaction on Dynamic Properties and Response of Offshore Wind Turbine with Monopile Foundation in Sand Site. Appl. Ocean Res. 2022, 126, 103279. [Google Scholar] [CrossRef]
- Van Der Tempel, J.; Diepeveen, N.F.B.; Salzmann, D.J.C.; De Vries, W.E. Design of Support Structures for Offshore Wind Turbines. In WIT Transactions on State of the Art in Science and Engineering; WIT Press: Southampton, UK, 2010; Volume 1, pp. 559–591. ISBN 978-1-84564-205-1. [Google Scholar]
- Wang, X.; Li, S.; Li, J. Load Bearing Mechanism and Simplified Design Method of Hybrid Monopile Foundation for Offshore Wind Turbines. Appl. Ocean Res. 2022, 126, 103286. [Google Scholar] [CrossRef]
- Matutano, C.; Negro, V.; López-Gutiérrez, J.-S.; Esteban, M.D. Scour Prediction and Scour Protections in Offshore Wind Farms. Renew. Energy 2013, 57, 358–365. [Google Scholar] [CrossRef]
- Negro, V.; López-Gutiérrez, J.-S.; Esteban, M.D.; Matutano, C. Uncertainties in the Design of Support Structures and Foundations for Offshore Wind Turbines. Renew. Energy 2014, 63, 125–132. [Google Scholar] [CrossRef]
- Luengo, J.; Negro, V.; García-Barba, J.; López-Gutiérrez, J.-S.; Esteban, M.D. New Detected Uncertainties in the Design of Foundations for Offshore Wind Turbines. Renew. Energy 2019, 131, 667–677. [Google Scholar] [CrossRef]
- Wu, M.; Stratigaki, V.; Fazeres-Ferradosa, T.; Rosa-Santos, P.; Taveira-Pinto, F.; Troch, P. Experimental Uncertainty Analysis of Monopile Scour Protection Stability Tests. Renew. Energy 2023, 210, 174–187. [Google Scholar] [CrossRef]
- Sumer, B.M.; Hatipoglu, F.; Fredsøe, J. Wave Scour around a Pile in Sand, Medium Dense, and Dense Silt. J. Waterw. Port Coast. Ocean Eng. 2007, 133, 14–27. [Google Scholar] [CrossRef]
- Qi, W.-G.; Gao, F.-P. Physical Modeling of Local Scour Development around a Large-Diameter Monopile in Combined Waves and Current. Coast. Eng. 2014, 83, 72–81. [Google Scholar] [CrossRef]
- Zhang, B.; Li, J.; Liu, W.; Zhang, H.; Shi, P.; Fu, X. Experimental Study on Dynamic Characteristics of a Monopile Foundation Based on Local Scour in Combined Waves and Current. Ocean Eng. 2022, 266, 113003. [Google Scholar] [CrossRef]
- Gautam, S.; Dutta, D.; Bihs, H.; Afzal, M.S. Three-Dimensional Computational Fluid Dynamics Modelling of Scour around a Single Pile Due to Combined Action of the Waves and Current Using Level-Set Method. Coast. Eng. 2021, 170, 104002. [Google Scholar] [CrossRef]
- Shi, Y.; Cheng, Y.; Huang, X.; Li, Y. Numerical Simulation of Unsteady Flow Field around Monopile under the Combined Influence of Wave and Vibration. Ocean Eng. 2023, 276, 114238. [Google Scholar] [CrossRef]
- Yu, Z.; Cheng, Y.; Cheng, H. Experimental Investigation on Seabed Response Characteristics Considering Vibration Effect of Offshore Monopile Foundation. Ocean Eng. 2023, 288, 116000. [Google Scholar] [CrossRef]
- Yang, W.; Tan, S.K.; Wang, H.; Yu, G. Rheological Properties of Bed Sediments Subjected to Shear and Vibration Loads. J. Waterw. Port Coast. Ocean Eng. 2014, 140, 109–113. [Google Scholar] [CrossRef]
- Awad-Allah, M.F.; Yasufuku, N.; Abdel-Rahman, A.H. Cyclic Response of Wind Turbine on Piles in Unsaturated Sand. Int. J. Phys. Model. Geotech. 2017, 17, 161–176. [Google Scholar] [CrossRef]
- Al-Hammadi, M.; Simons, R.R. Local Scour Mechanism around Dynamically Active Marine Structures in Noncohesive Sediments and Unidirectional Current. J. Waterw. Port Coast. Ocean Eng. 2020, 146, 04019026. [Google Scholar] [CrossRef]
- Guan, D.; Chiew, Y.-M.; Melville, B.W.; Zheng, J. Current-Induced Scour at Monopile Foundations Subjected to Lateral Vibrations. Coast. Eng. 2019, 144, 15–21. [Google Scholar] [CrossRef]
- Qin, B.; Xie, Y.; Yang, W.; Qu, R.; Geng, F. A Further Study on the Scour around the Monopile Foundation of Offshore Wind Turbines. Sustain. Energy Technol. Assess. 2023, 57, 103198. [Google Scholar] [CrossRef]
- Cheng, Y.; Xie, H.; Zheng, Y.; Shi, L. Experimental Study on the Sediment Movement around Monopile under Vibration Action. Ocean Eng. 2023, 288, 116206. [Google Scholar] [CrossRef]
- Whitehouse, R. Scour at Marine Structures; Thomas Telford Publishing: London, UK, 1998. [Google Scholar]
- Cuéllar, P.; Baeßler, M.; Rücker, W. Ratcheting Convective Cells of Sand Grains around Offshore Piles under Cyclic Lateral Loads. Granul. Matter 2009, 11, 379. [Google Scholar] [CrossRef]
- Yang, Y.; Melville, B.W.; Macky, G.H.; Shamseldin, A.Y. Experimental Study on Local Scour at Complex Bridge Pier under Combined Waves and Current. Coast. Eng. 2020, 160, 103730. [Google Scholar] [CrossRef]
- Mawatari, Y.; Koide, T.; Tatemoto, Y.; Uchida, S.; Noda, K. Effect of Particle Diameter on Fluidization under Vibration. Powder Technol. 2002, 123, 69–74. [Google Scholar] [CrossRef]
- Xu, C.; Zhu, J. Parametric Study of Fine Particle Fluidization under Mechanical Vibration. Powder Technol. 2006, 161, 135–144. [Google Scholar] [CrossRef]
- Sumer, B.M.; Fredsøe, J. Scour around Pile in Combined Waves and Current. J. Hydraul. Eng. 2001, 127, 403–411. [Google Scholar] [CrossRef]
- Sumer, B.M.; Petersen, T.U.; Locatelli, L.; Fredsøe, J.; Musumeci, R.E.; Foti, E. Backfilling of a Scour Hole around a Pile in Waves and Current. J. Waterw. Port Coast. Ocean Eng. 2013, 139, 9–23. [Google Scholar] [CrossRef]
- Rudolph, D.; Bos, K.J. Scour around a Monopile under Combined Wavecurrent Conditions and Low KC-Numbers. In Proceedings of the 3rd International Conference on Scour and Erosion (ICSE-3), Amsterdam, The Netherlands, 1–3 November 2006; pp. 582–588. [Google Scholar]
- Sumer, B.M.; Fredsøe, J.; Christiansen, N. Scour Around Vertical Pile in Waves. J. Waterw. Port Coast. Ocean Eng. 1992, 118, 15–31. [Google Scholar] [CrossRef]
- Dogan, M. The Equilibrium Depth of Wave Scour around Both Slender and Large Piles. Ocean Eng. 2021, 236, 109474. [Google Scholar] [CrossRef]
- Qi, W.; Gao, F. Equilibrium Scour Depth at Offshore Monopile Foundation in Combined Waves and Current. Sci. China Technol. Sci. 2014, 57, 1030–1039. [Google Scholar] [CrossRef]


| Working Condition | Wave Height H/cm | Wave Period T/s | KC | Uwm | θ | θ/θc |
|---|---|---|---|---|---|---|
| 1 | 5.4 | 1.3 | 1.07 | 0.074 | 0.012 | 0.321 |
| 2 | 8.7 | 1.3 | 1.78 | 0.123 | 0.024 | 0.639 |
| 3 | 11.2 | 1.3 | 2.23 | 0.155 | 0.035 | 0.930 |
| 4 | 8.3 | 1.6 | 2.45 | 0.138 | 0.027 | 0.724 |
| 5 | 9.1 | 1 | 0.96 | 0.087 | 0.014 | 0.382 |
| Working Condition | Incidence Velocity Uc/m·s−1 | Wave Height H/cm | Wave Period T/s | KC | Ucw | Fr | S/cm | S/D | θ | θ/θc |
|---|---|---|---|---|---|---|---|---|---|---|
| 1 | 0.213 | 0 | 0 | 0 | 0 | 0 | 7.5 | 0.83 | 0.014 | 0.38 |
| 2 | 0.213 | 5.4 | 1.3 | 1.07 | 0.74 | 0.28 | 7.7 | 0.86 | 0.026 | 0.70 |
| 3 | 0.213 | 8.7 | 1.3 | 1.78 | 0.63 | 0.31 | 7.3 | 0.81 | 0.038 | 1.02 |
| 4 | 0.213 | 11.2 | 1.3 | 2.23 | 0.58 | 0.33 | 7.2 | 0.8 | 0.049 | 1.31 |
| 5 | 0.213 | 8.3 | 1.6 | 2.45 | 0.61 | 0.32 | 7.5 | 0.83 | 0.041 | 1.1 |
| 6 | 0.213 | 9.1 | 1 | 0.96 | 0.71 | 0.29 | 7.7 | 0.86 | 0.028 | 0.96 |
| Working Condition | Incidence Velocity Uc/m·s−1 | Vibration Frequency fv/Hz | Amplitude Av/mm | Wave Height H/cm | Wave Period T/s |
|---|---|---|---|---|---|
| 1 | 0.213 | 6 | 4 | 0 | 0 |
| 2 | 0.213 | 5 | 5 | 8.7 | 1.3 |
| Working Condition | Incidence Velocity Uc/m·s−1 | Vibration Frequency fv/Hz | Amplitude Av/mm | Wave Height H/cm | Wave Period T/s | S/cm | S/D |
|---|---|---|---|---|---|---|---|
| 1 | 0.213 | 6 | 4 | 0 | 0 | 4.1 | 0.456 |
| 2 | 0.213 | 3 | 4 | 5.4 | 1.3 | 5.4 | 0.6 |
| 3 | 0.213 | 6 | 4 | 5.4 | 1.3 | 4.5 | 0.5 |
| 4 | 0.213 | 9 | 4 | 5.4 | 1.3 | 4.1 | 0.456 |
| 5 | 0.213 | 6 | 2 | 5.4 | 1.3 | 4.4 | 0.489 |
| 6 | 0.213 | 6 | 6 | 5.4 | 1.3 | 3.2 | 0.356 |
| 7 | 0.213 | 3 | 4 | 8.7 | 1.3 | 5.1 | 0.567 |
| 8 | 0.213 | 6 | 4 | 8.7 | 1.3 | 4.6 | 0.589 |
| 9 | 0.213 | 9 | 4 | 8.7 | 1.3 | 4 | 0.444 |
| 10 | 0.213 | 6 | 2 | 8.7 | 1.3 | 4.9 | 0.544 |
| 11 | 0.213 | 6 | 6 | 8.7 | 1.3 | 4.4 | 0.489 |
| 12 | 0.213 | 3 | 4 | 11.2 | 1.3 | 6.3 | 0.7 |
| 13 | 0.213 | 6 | 4 | 11.2 | 1.3 | 6 | 0.667 |
| 14 | 0.213 | 9 | 4 | 11.2 | 1.3 | 5.75 | 0.689 |
| 15 | 0.213 | 6 | 2 | 11.2 | 1.3 | 6.85 | 0.761 |
| 16 | 0.213 | 6 | 6 | 11.2 | 1.3 | 5 | 0.556 |
| 17 | 0.213 | 3 | 4 | 8.3 | 1.6 | 5.93 | 0.659 |
| 18 | 0.213 | 6 | 4 | 8.3 | 1.6 | 4.6 | 0.511 |
| 19 | 0.213 | 9 | 4 | 8.3 | 1.6 | 4.2 | 0.467 |
| 20 | 0.213 | 6 | 2 | 8.3 | 1.6 | 5.7 | 0.633 |
| 21 | 0.213 | 6 | 6 | 8.3 | 1.6 | 4.4 | 0.489 |
| 22 | 0.213 | 3 | 4 | 9.1 | 1 | 5.8 | 0.644 |
| 23 | 0.213 | 6 | 4 | 9.1 | 1 | 4.7 | 0.522 |
| 24 | 0.213 | 9 | 4 | 9.1 | 1 | 4 | 0.444 |
| 25 | 0.213 | 6 | 2 | 9.1 | 1 | 5.2 | 0.578 |
| 26 | 0.213 | 6 | 6 | 9.1 | 1 | 4.1 | 0.456 |
| Wave Period T/s | Wave Height H/cm | Long Half-Axis a/cm | Short Half-Axis b/cm | Moving Trajectory |
|---|---|---|---|---|
| 1.3 | 5.4 | 1.530 | 0.367 | ellipse |
| 1.3 | 8.7 | 2.468 | 0.591 | ellipse |
| 1.3 | 11.2 | 3.174 | 0.761 | ellipse |
| 1.6 | 8.3 | 3.496 | 0.635 | ellipse |
| 1 | 9.1 | 1.241 | 0.443 | ellipse |
| Working Condition | KC | Uwm | Calculated by Formula (6) [34] | Calculated by Formula (9) | Data Comparison | |
|---|---|---|---|---|---|---|
| 1 | 1.07 | 0.74 | 0.28 | 0.618 | 0.756 | −13.84% |
| 2 | 1.78 | 0.63 | 0.31 | 0.713 | 0.847 | −13.41% |
| 3 | 2.23 | 0.58 | 0.33 | 0.771 | 0.908 | −13.66% |
| 4 | 2.45 | 0.61 | 0.32 | 0.743 | 0.883 | −13.99% |
| 5 | 0.96 | 0.71 | 0.29 | 0.651 | 0.782 | −13.14% |
Disclaimer/Publisher’s Note: The statements, opinions and data contained in all publications are solely those of the individual author(s) and contributor(s) and not of MDPI and/or the editor(s). MDPI and/or the editor(s) disclaim responsibility for any injury to people or property resulting from any ideas, methods, instructions or products referred to in the content. |
© 2024 by the authors. Licensee MDPI, Basel, Switzerland. This article is an open access article distributed under the terms and conditions of the Creative Commons Attribution (CC BY) license (https://creativecommons.org/licenses/by/4.0/).
Share and Cite
Shi, L.; Cheng, Y.; Zheng, Y.; Xia, B.; Huang, X. Experimental Study on Local Scour at the Monopile Foundation of an Offshore Wind Turbine under the Combined Action of Wave–Current–Vibration. J. Mar. Sci. Eng. 2024, 12, 963. https://doi.org/10.3390/jmse12060963
Shi L, Cheng Y, Zheng Y, Xia B, Huang X. Experimental Study on Local Scour at the Monopile Foundation of an Offshore Wind Turbine under the Combined Action of Wave–Current–Vibration. Journal of Marine Science and Engineering. 2024; 12(6):963. https://doi.org/10.3390/jmse12060963
Chicago/Turabian StyleShi, Li, Yongzhou Cheng, Yuwei Zheng, Bo Xia, and Xiaoyun Huang. 2024. "Experimental Study on Local Scour at the Monopile Foundation of an Offshore Wind Turbine under the Combined Action of Wave–Current–Vibration" Journal of Marine Science and Engineering 12, no. 6: 963. https://doi.org/10.3390/jmse12060963