Abstract
Fish object detection and counting in pelagic fisheries face many challenges in complex environments. Sonar imaging technology offers a solution because it generates high-resolution images underwater. In this paper, we propose a sonar-based fish object detection and counting method using an improved YOLOv8 combined with BoT-SORT to address issues such as missed detection, false detection, and low accuracy caused by complex factors such as equipment motion, light changes, and background noise in pelagic environments. The algorithm utilizes the techniques of lightweight upsampling operator CARAFE, generalized feature pyramid network GFPN, and partial convolution. It integrates with the BoT-SORT tracking algorithm to propose a new region detection method that detects and tracks the schools of fish, providing stable real-time fish counts in the designated area. The experimental results indicate that while focusing on maintaining a lightweight design, the improved algorithm achieved a 3.8% increase in recall and a 2.4% increase in mAP0.5 compared to the original algorithm. This significantly impacts scientific and rational fishery planning, marine resource protection, and improved productivity. At the same time, it provides important data support for marine ecological monitoring, environmental protection, and fishery management, contributing to sustainable fishery development and marine ecology preservation.
1. Introduction
Fish play an important part in marine ecosystems as well as in human culture and industry. However, pollution, overfishing, and habitat destruction can lead to population decline or even extinction. Therefore, the accurate detection and enumeration of fish are essential to prevent overfishing, maintain the balance of marine ecosystems, and ensure the sustainability of fisheries [1,2].
The traditional fish object detection process typically involves traversing the image using a sliding window, which generates a candidate region, using SIFT [3] and HOG [4] for feature extraction, and then inputting these extracted feature vectors into a classifier such as SVM [5] for classification. However, the limitations of the sliding window approach lead to high time complexity and low relevance of the model. The traditional operators of SIFT and HOG struggle with diversity changes, resulting in poor feature robustness. Through the application of deep learning techniques, computer vision has advanced significantly in recent years, and convolutional neural networks are now frequently used for fish object detection.
Current object detection algorithms based on convolutional neural networks are mainly categorized into two main groups: two-stage algorithms and one-stage algorithms. Representatives of two-stage algorithms are RCNN [6] and Fast R-CNN [7]. These algorithms typically generate candidate frames through heuristics or region proposal networks, then regress and classify the samples using convolutional neural networks. While these methods perform better in detection accuracy and localization precision, they come at the cost of slower detection speed. In contrast, one-stage algorithms such as YOLO [8,9,10,11] and SSD [12] transform the object detection and border localization problem directly into a single regression problem, thus eliminating the step of candidate box generation, greatly saving time and providing a significant advantage in detection speed to meet the tasks with strong real-time requirements. Although the single-stage algorithm may be slightly inferior to the two-stage algorithm in terms of detection accuracy, related research is rapidly advancing, and many scholars are working to improve the accuracy of the single-stage algorithm [13,14]. Advances in deep learning have promoted the development of object detection algorithms based on convolutional neural networks and expanded their application in fish identification. With the deepening of fish identification research, some scholars have begun to use these techniques for fish target tracking and counting, thus providing new methods for the automated processing of fish data. Currently, the mainstream tracking algorithms include DeepSORT [15], ByteTrack [16], and StrongSORT [17]. Wu et al. [18] utilized YOLOv5 and DeepSORT algorithms to achieve dynamic identification and automatic counting of fish species in response to significant deformations caused by fish body distortion. Zhao et al. [19] used ByteTrack to track fish in complex environments and thus analyze their behaviors. These studies have progressed in optical camera-based fish target tracking and counting. Still, in complex underwater environments, optical imaging may be limited by water quality, light, and other physical conditions, resulting in degradation of the imaging quality and thus affecting the reliability of fish identification and tracking. Han et al. [20] attempted the counting and length extraction of migratory and farmed large fish using dual-frequency identification sonar. Liang Liu et al. trained a network using an improved combination of “loss and balance regularization” to implement computer vision to count fish in sonar images [21]. Dunlop et al. utilized the Multibeam forward-looking sonar installed on underwater ROVs to explore the classification and behavioral data of deep-sea fish, aiming to further understand the connections between benthic animals in the middle and upper layers of the deep sea [22].
Although these tracking methods for sonar images have made significant progress in some aspects, they also have some limitations. Firstly, in situations where fish schools are dense and may be obstructed, it is often difficult to accurately identify multiple targets, resulting in missed detections and affecting the tracking performance of fish schools. Secondly, the irregular fish movement in the water can make it difficult for the tracking algorithms to accurately track the targets, leading to misdetections and missed detections, which affects the accuracy of counting. The tracking algorithm’s effectiveness depends largely on object detection accuracy. Suppose that fish object detection fails to recognize the target correctly. In this case, errors in the tracking process can accumulate rapidly, leading to tracking interruptions, confusion, or even complete loss of the target. Due to the lack of a good reference dataset for sonar images of fish schools, we collected data from lakes and ponds and completed the production of the dataset. Compared to ocean ecosystems, lakes and ponds have smaller scales, making it convenient to conduct control experiments and collect data on different postures of fish schools, which can also meet the testing requirements for identifying and counting fish schools in marine environments. Next, to solve the above problems, this study adopted an improved YOLOv8 algorithm combined with the BoT-SORT algorithm, which not only achieves accurate identification of underwater fish schools, but also improves the subsequent counting performance of fish schools. Additionally, this article proposes an ecological monitoring method for the number of fish schools in the detection area, which assists in the real-time detection and evaluation of the fishery ecological environment in relevant areas.
2. Materials
2.1. Data Acquisition
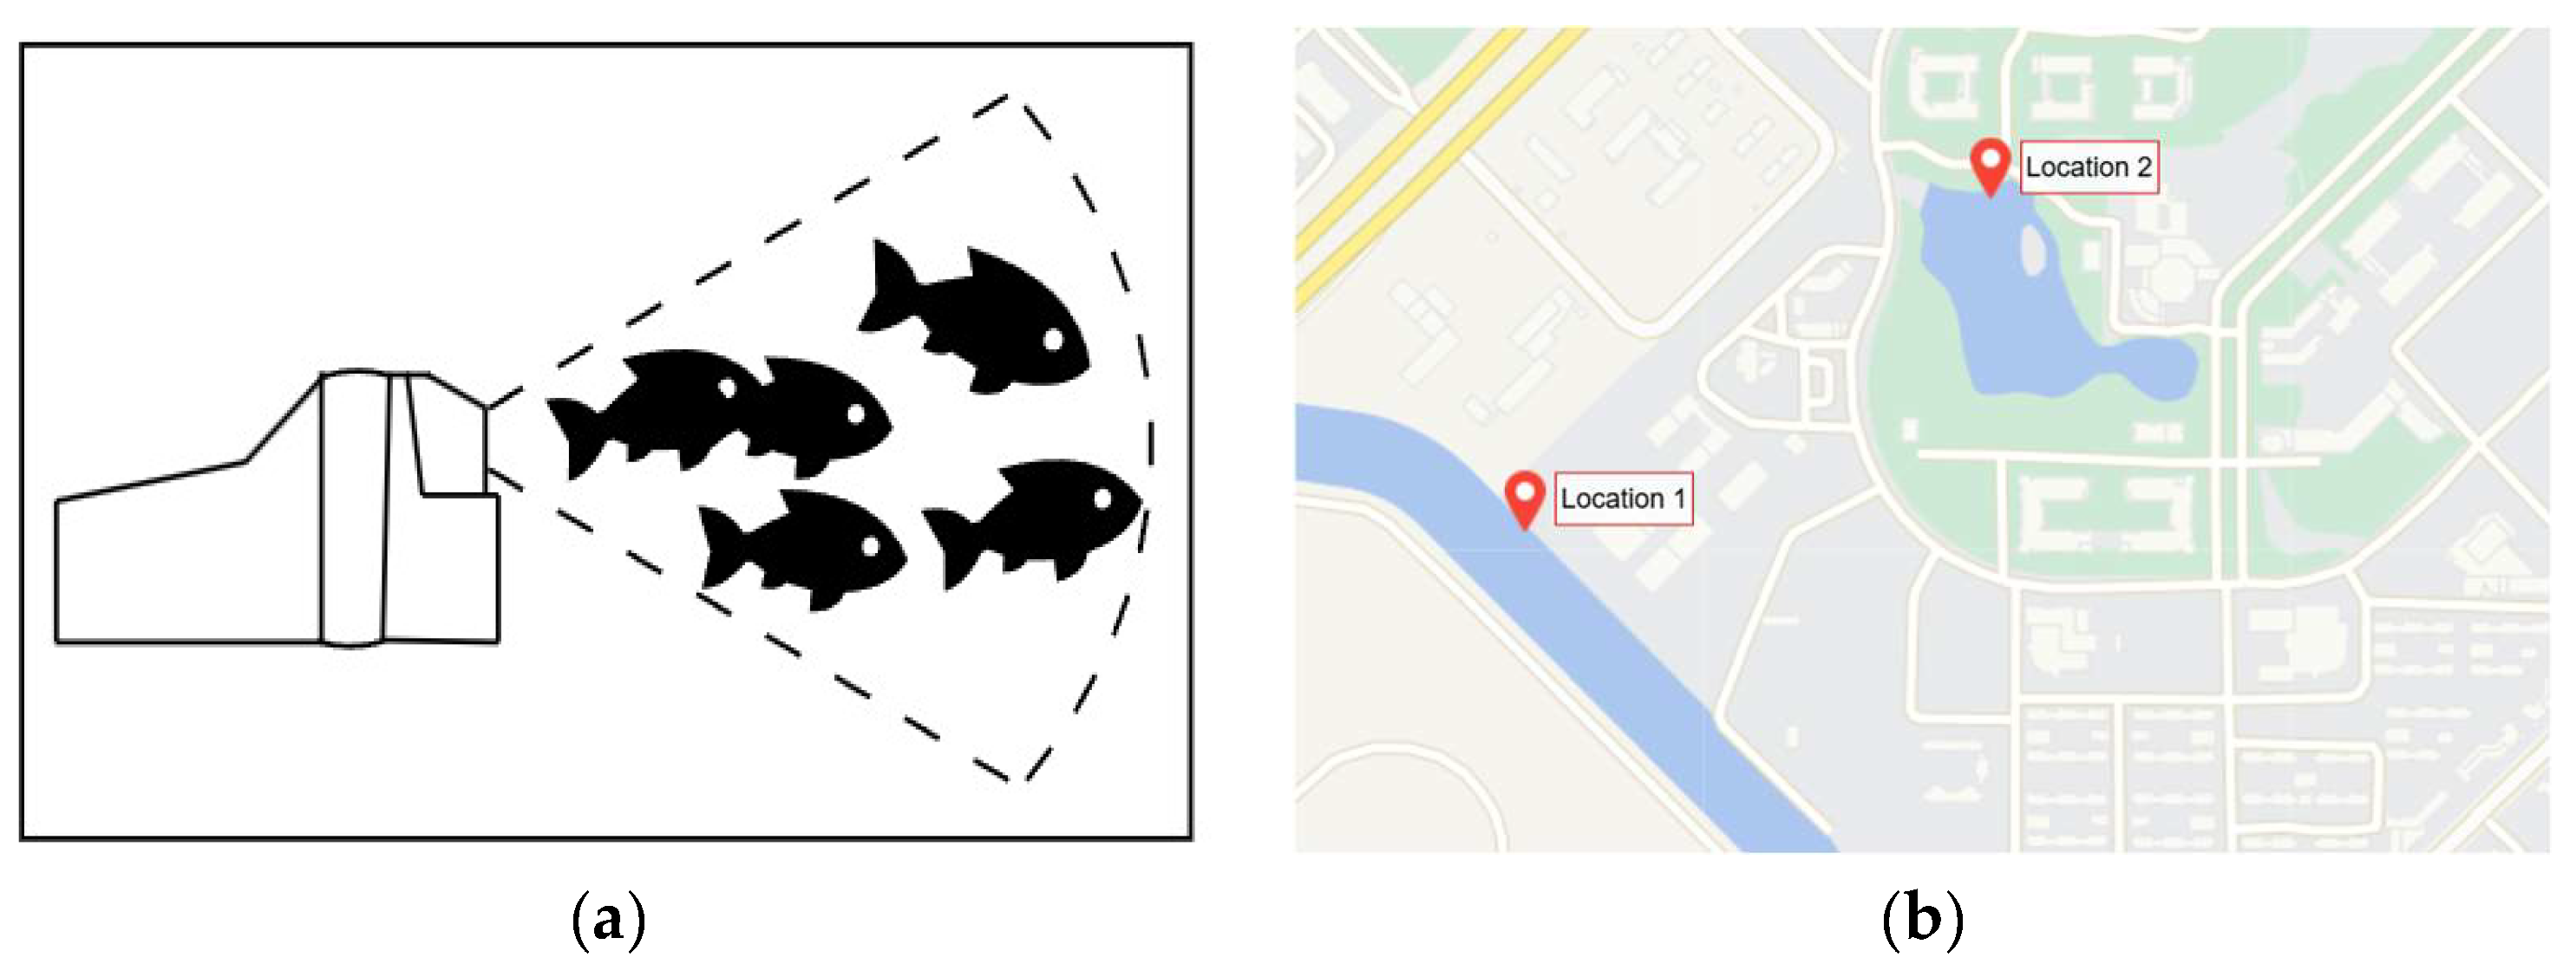
Sample data were collected in the lakes of the Luchao River and the pond in front of the library of Shanghai Ocean University. The sonar model is oculusM750d (Blueprint Design Engineering Ltd, Cumbria, UK), with a horizontal viewing angle of 130 degrees, a vertical viewing angle of 20 degrees, and a maximum range of 120 m. To collect data on fish in different postures under different environments, the data were collected during the daytime and night-time, on sunny and rainy days, and with or without bait. The data collection method of the sonar equipment is shown in Figure 1a, and the data collection locations are shown in Figure 1b. To ensure the validity and diversity of the data, the collected video data were subjected to frame extraction [23], and the data with high similarity and poor imaging quality were manually deleted. One thousand, one hundred and seventy-two images with abundant fish postures and relatively low noise were selected from 9875 images. At the same time, to avoid too many images with the same posture, the same position, and too simple background conditions, the selected 1172 images were screened twice, and finally, 158 representative images were obtained.
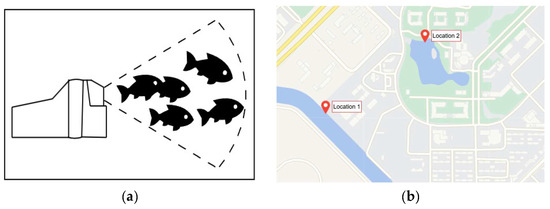
Figure 1.
Data collection method and locations. (a) Data collection method; (b) two data collection locations.
2.2. Data Expansion and Dataset Production
Considering that deep learning models require a large amount of labeled data to enhance their generalization ability, sonar equipment in the real world can be affected by light, surges, vibrations, and other factors that impact reflected echoes, resulting in variations in imaging quality. Therefore, this paper used random rotations, cropping [24], panning, adding noise [25], changing brightness, and mirror flipping operations to simulate possible variations in fish appearances in real underwater environments, thereby enhancing the diversity of the dataset. Meanwhile, to avoid data leakage, which can lead to abnormal detection results, 158 original sonar images of fish schools were divided into training validation sets according to the ratio of 8:2. Then, each set was augmented separately, resulting in 1580 images. Labellmg 1.8.6 was used for dataset labeling to label fish schools in sonar images as “fish”, and store the relevant information in a txt file.
3. Fish Object Detection and Counting Methods
3.1. YOLOv8 Object Detection Algorithm
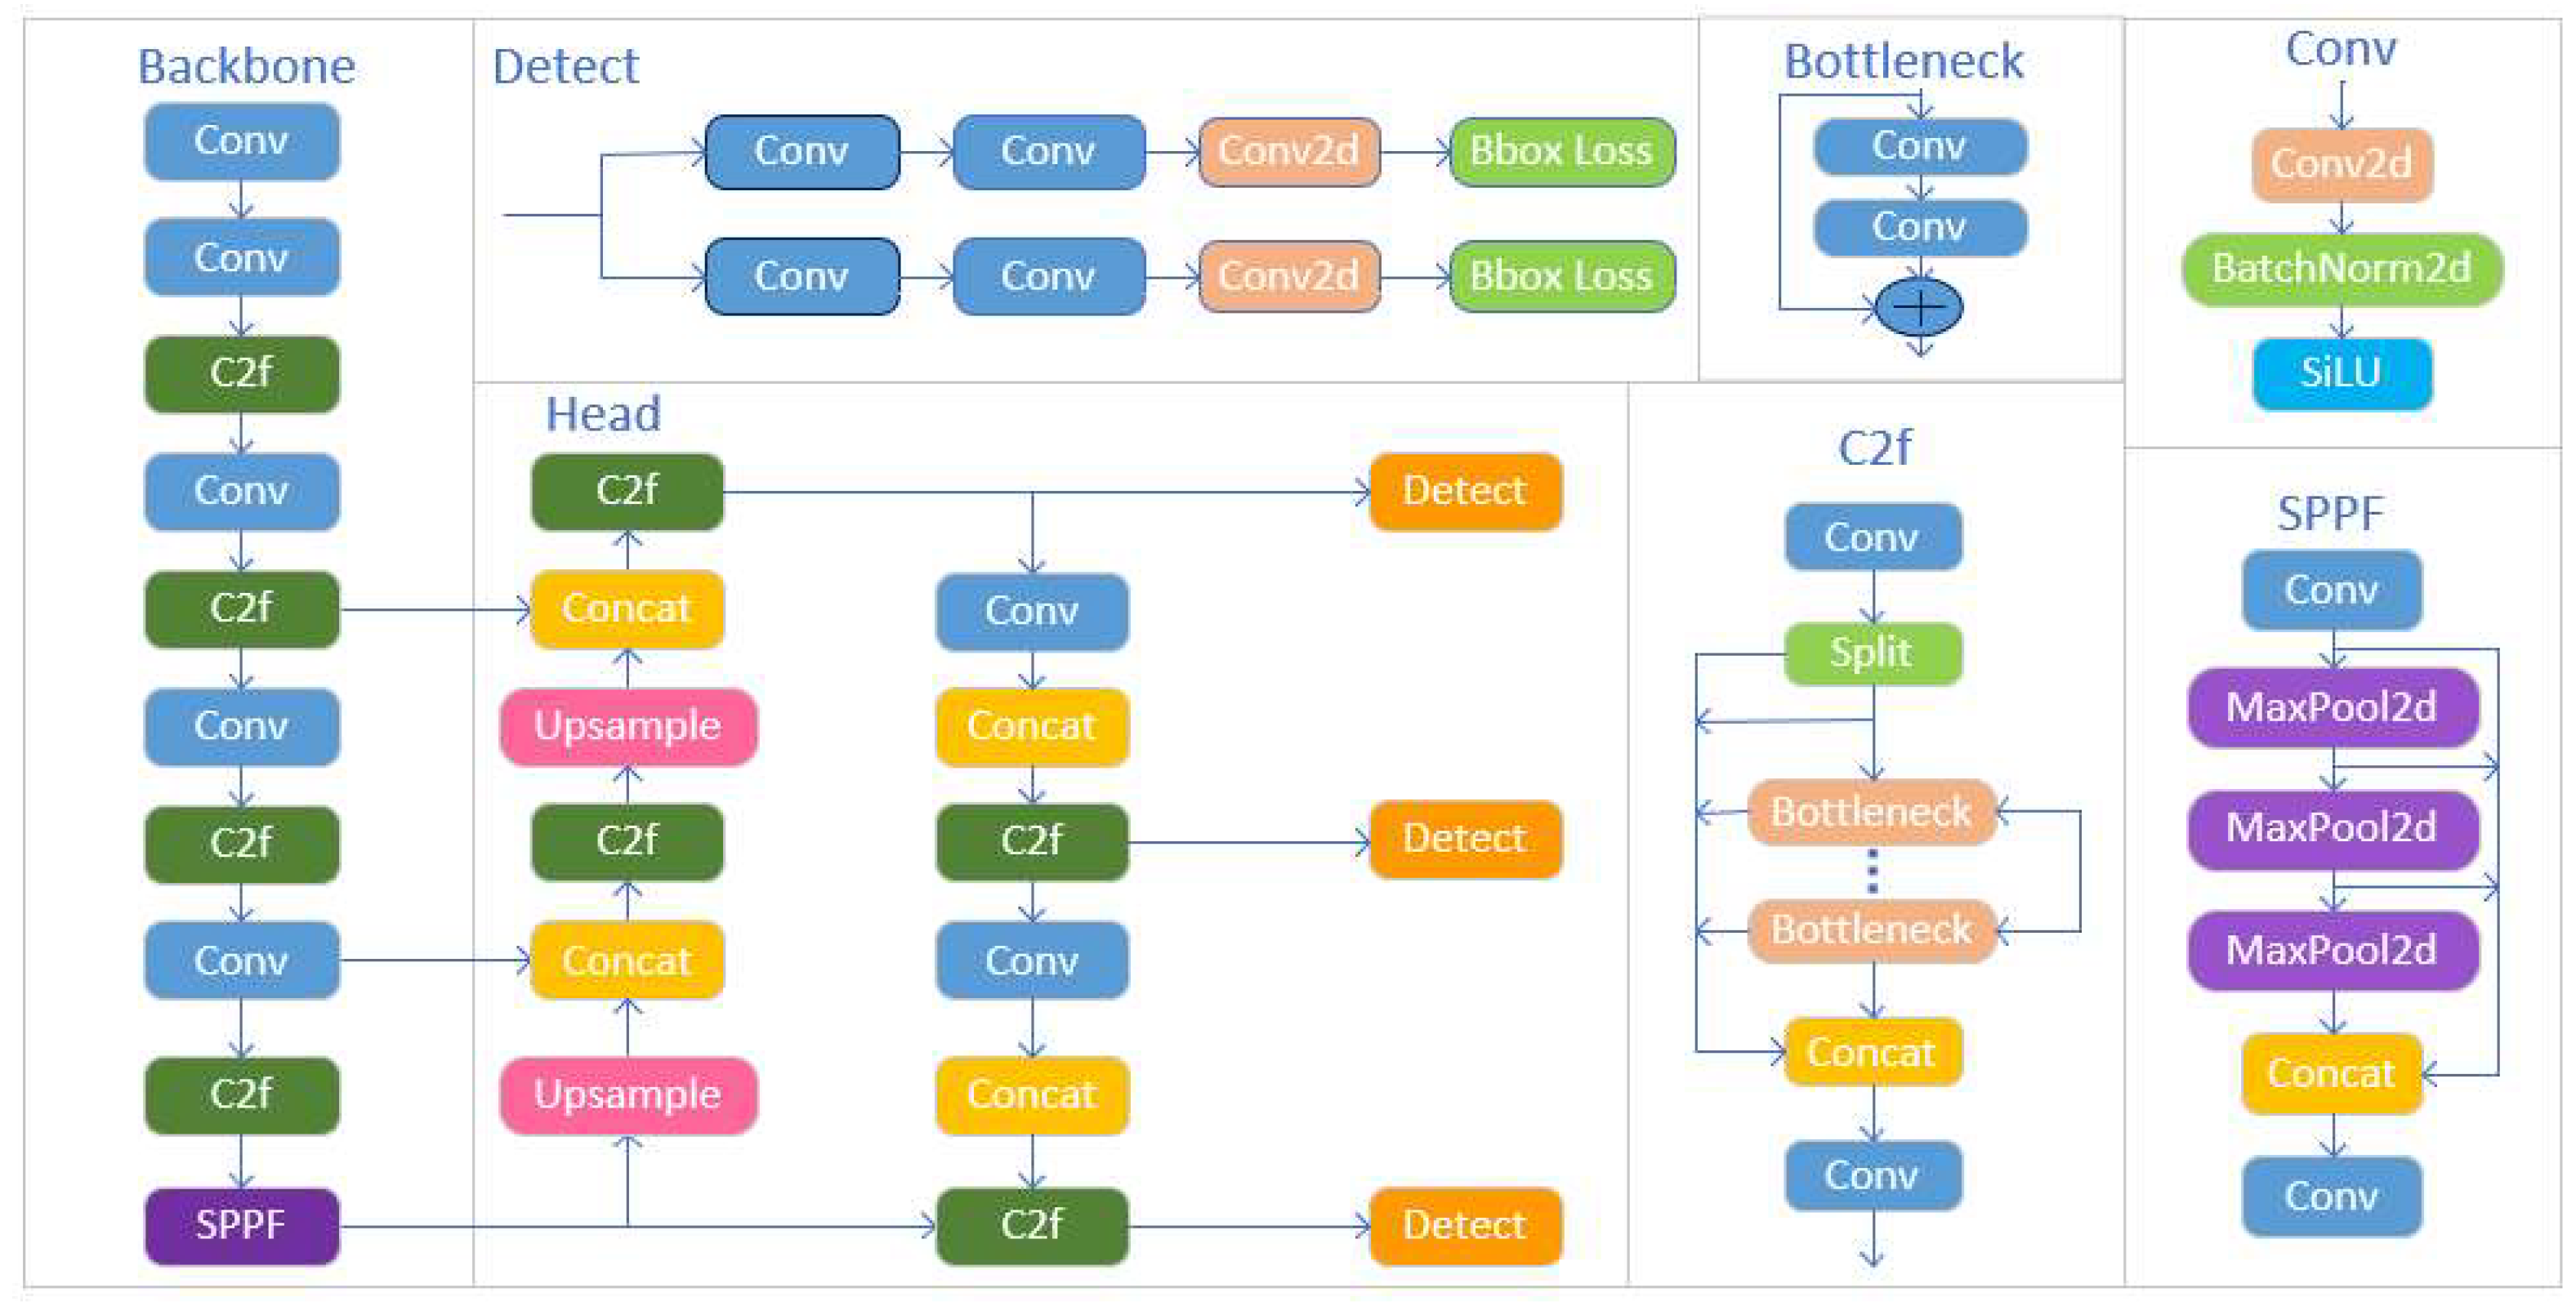
The YOLOv8 network consists mainly of a backbone and a head section. The network structure is shown in Figure 2.
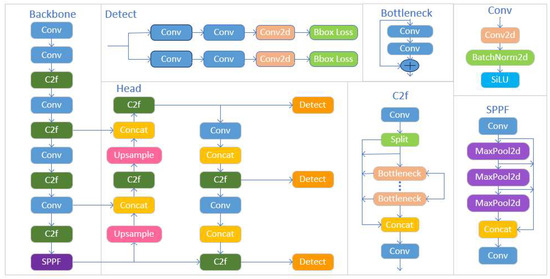
Figure 2.
YOLOv8 network architecture diagram.
The YOLOv8 object detection algorithm is based on the previous version of YOLO and introduces some innovations and improvements to enhance the performance of the model. Specific improvements include the creation of a new backbone network, the adoption of a new Anchor-Free detection head, and the utilization of a new loss function. The backbone network refers to the ELAN design concept of YOLOv7 [11], using the gradient flow-rich C2f structure and adjusting the number of channels according to different models, significantly improving the model performance. The head part adopts the current mainstream decoupled head structure, separates the classification and detection heads, and the Anchor-Based is replaced by the Anchor-Free. The loss function adopts the dynamic, positive sample allocation strategy of a task aligned assignor and introduces the distribution focal loss. YOLOv8 adopts Mosaic data enhancement during training, and Mosaic enhancement was turned off in the last ten iterations, which effectively improves accuracy. Based on the above improvements, the accuracy of YOLOv8 is much higher than that of YOLOv5. According to the scaling factor of the network, several models with different scale sizes of n, s, m, l, and x are offered. Since this paper was applied to sonar fish image detection, the YOLOv8s network model was used considering the related installation and deployment costs and the balance between measurement accuracy and detection speed.
3.2. Improved YOLOv8s Detection Model
To address issues of missed detection, false detection, and low detection accuracy caused by ship motion, lighting, and background effects in complex environments of pelagic fisheries, this study proposed a sonar fish school target detection algorithm based on the YOLOv8s network model, integrating lightweight upsampling operator CARAFE, generalized feature pyramid network (GFPN), and partial convolution (PConv).
The specific improvements include three aspects. Firstly, the original upsample in layers 10 and 13 were replaced by a lightweight upsampling operator, CARAFE, to gather aggregated semantic information over a wider range. Secondly, we adopted GFPN to aggregate features from the same and neighboring levels, providing more efficient information transfer. Additionally, a new feature fusion module, CSPStage, was proposed. Finally, a layer of PConv was added to the network to effectively utilize the redundancy in the feature map, thus reducing the computational cost. The improved network structure is shown in Figure 3.
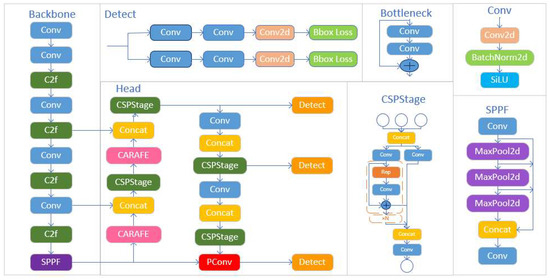
Figure 3.
The overall network structure of the improved YOLOv8.
3.2.1. The Lightweight Upsampling Operator CARAFE
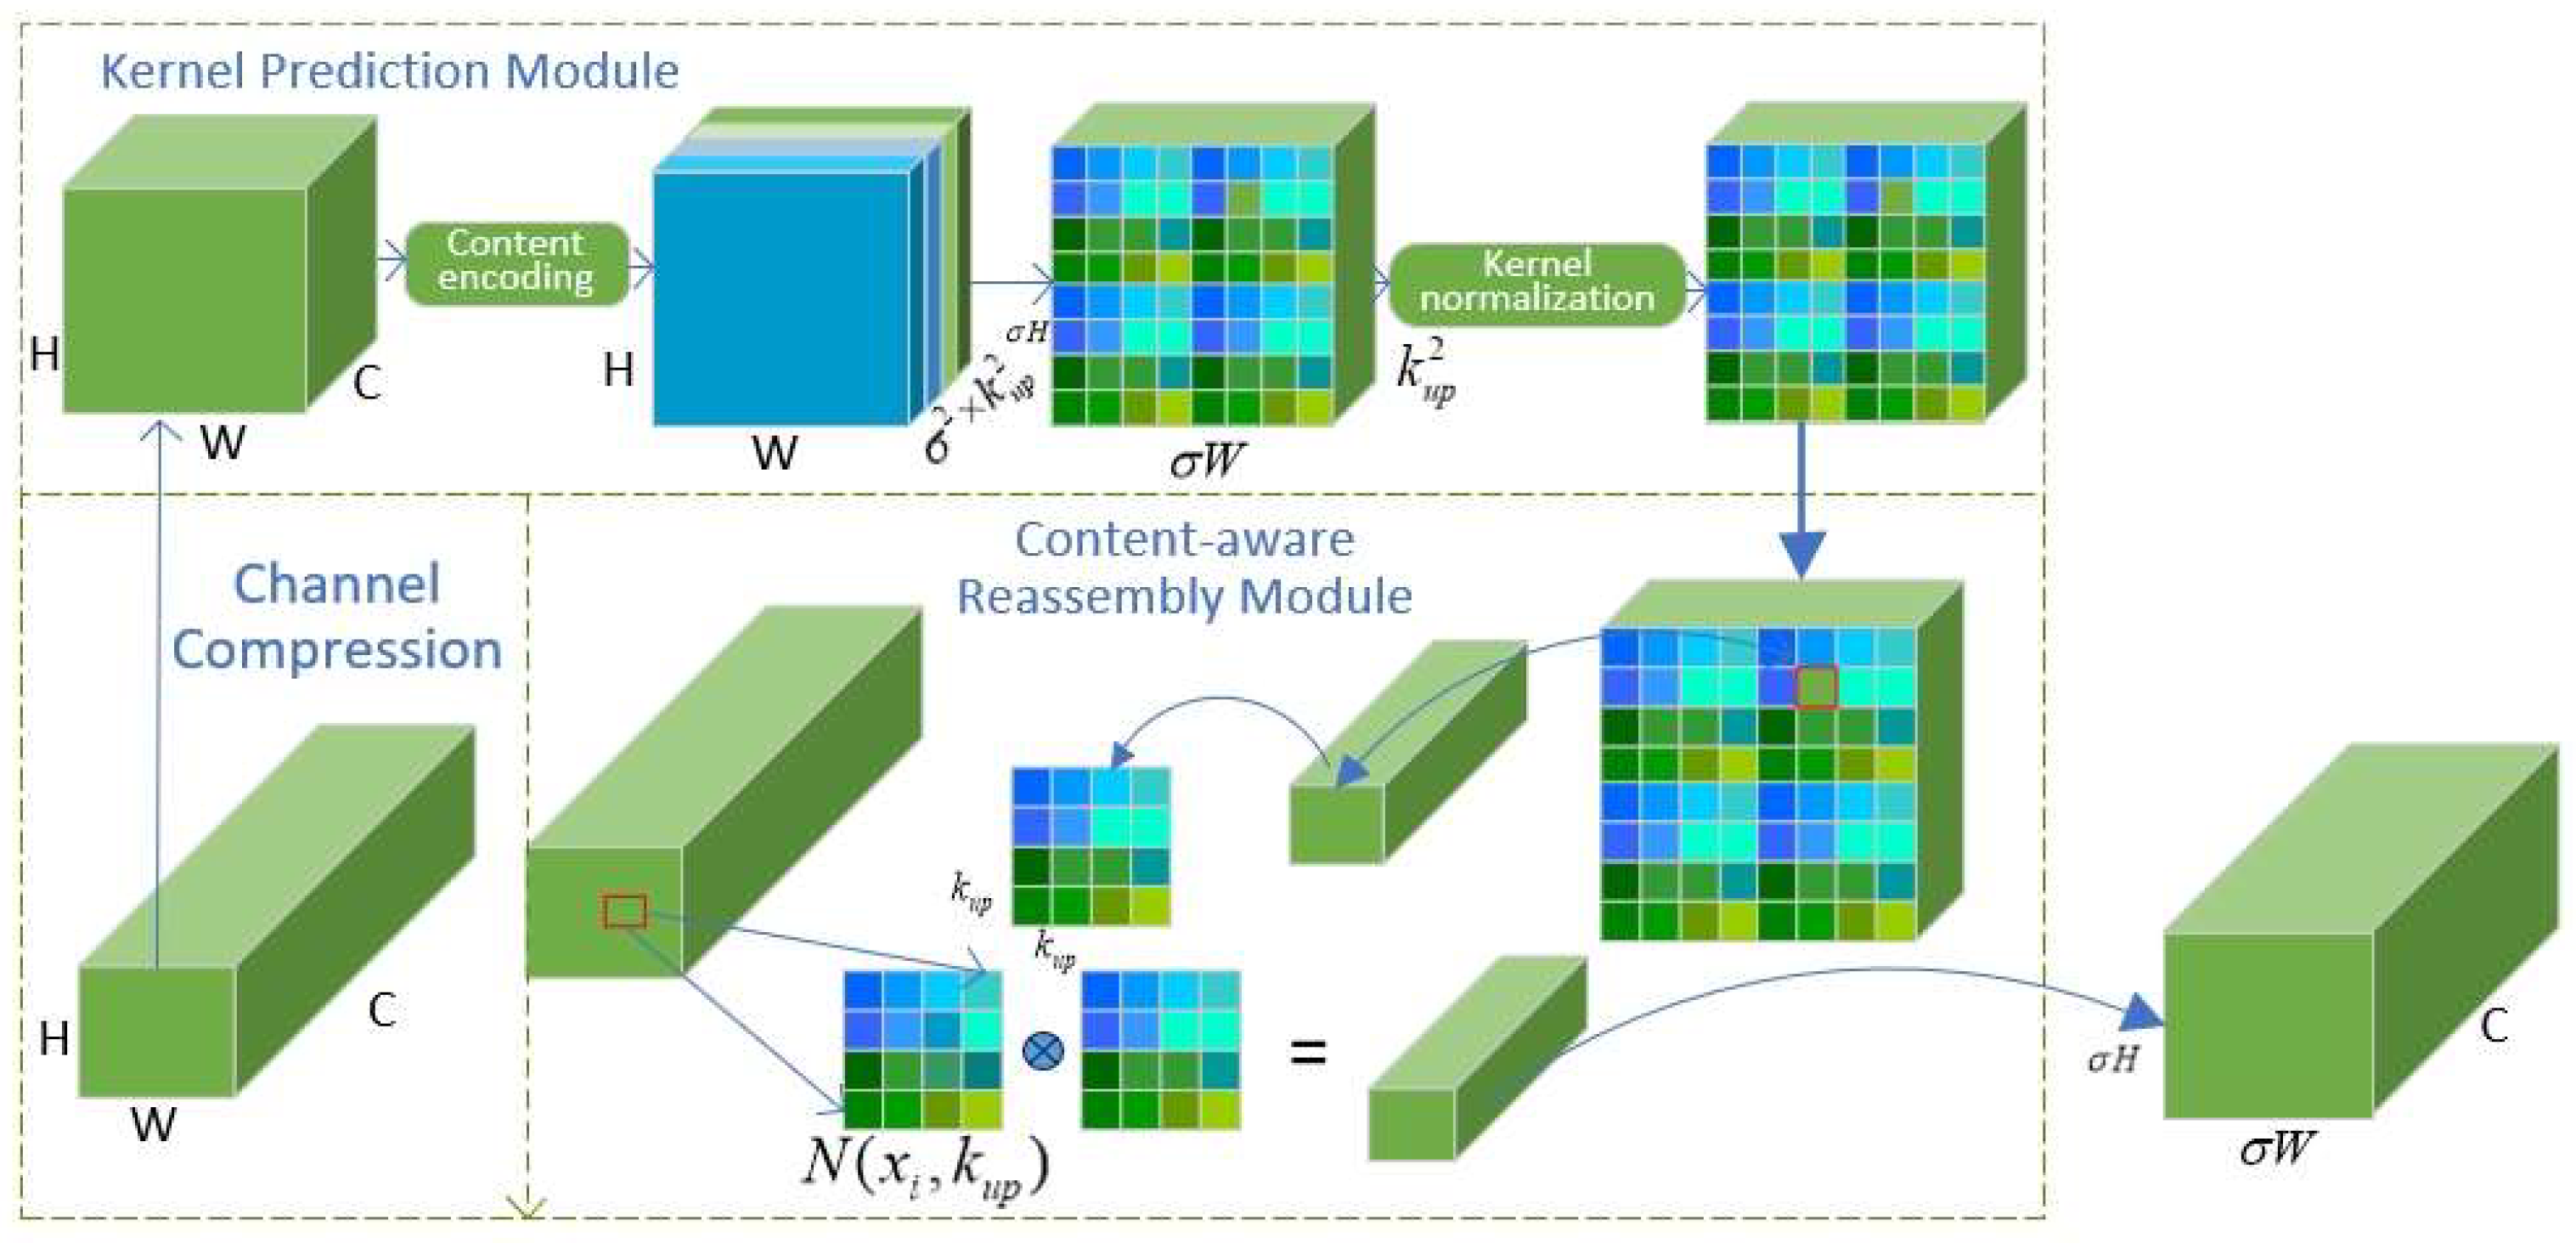
The upsample layer of YOLOv8 is dominated by the nearest neighbor interpolation method, which relies on the nearest neighbor pixel values and cannot capture the subtle changes and dense semantic information in images, making the image distorted. When the image is enlarged, it blurs the image, and the perception field of view becomes smaller, which affects the results of object detection. To solve the above problems, this paper adopted CARAFE, a lightweight upsampling operator with a large perceptual field of view to replace the original upsampling module. CARAFE used feature-aware recombination to upsample the features, predicted the recombination kernel, and defined the recombination features at each position using the underlying information [26]. The flow of CARAFE is shown in Figure 4, which consists of the upsampling kernel prediction module and the feature recombination module in two parts. Firstly, the feature map was compressed by 1 × 1 convolution into a feature map, and then after content encoding and upsampling kernel prediction, a upsampling kernel was obtained. After the content encoding and upsampling kernel prediction, the up-sampling kernel was normalized so that its convolutional kernel weights are summed to 1. Next, each position in the output feature map was mapped back to the input feature map, the region with the center was taken out, and dot produced it with the predicted upsampling kernel for that position to obtain the output value. Different channels at the same position shared the same upsampling kernel and finally output the feature map. The lightweight upsampling operator CARAFE could better capture and aggregate the semantic information of fish schooling sonar images without increasing the computational cost [27], thus improving the object detection performance.

Figure 4.
CARAFE module.
3.2.2. Generalized Feature Pyramid Network (GFPN)
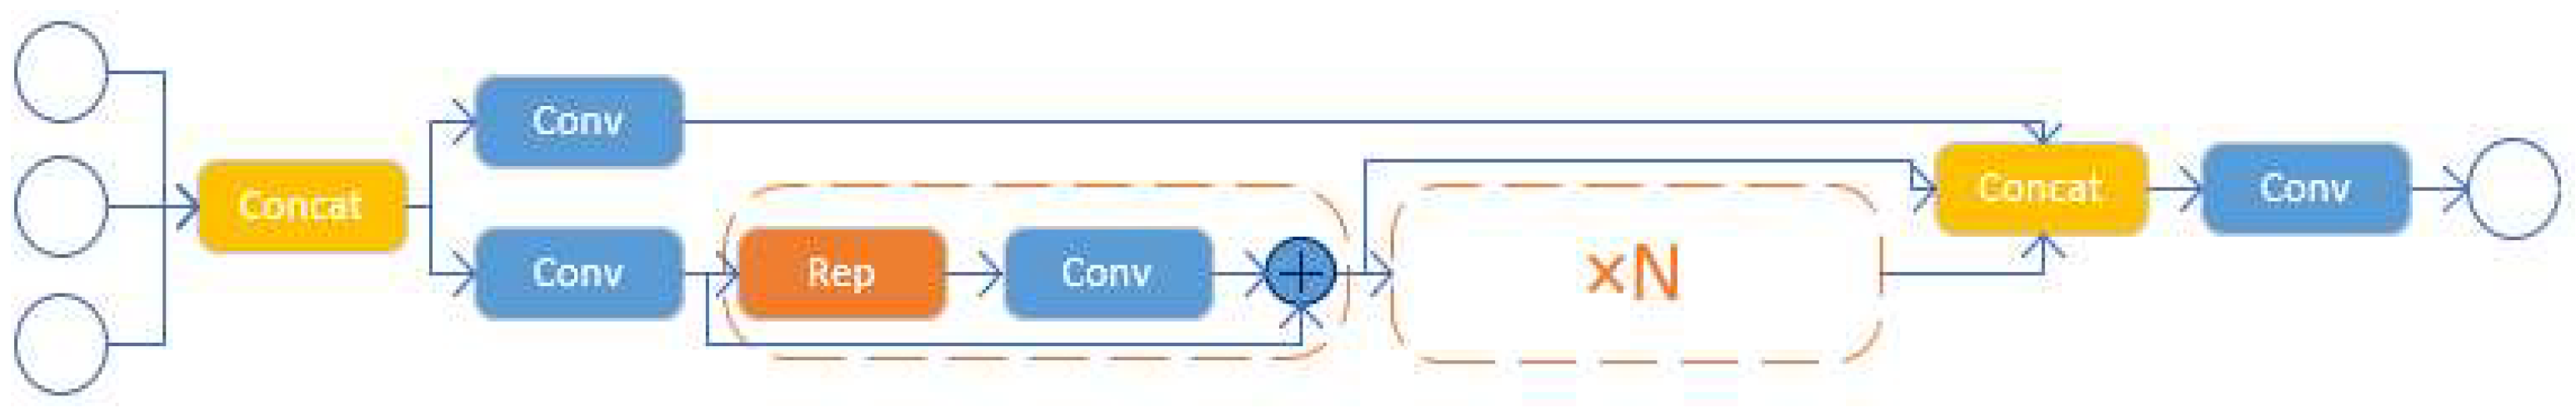
Feature fusion is now the main method to deal with the multi-scale disparity problem, and the representative algorithms are feature pyramid network (FPN) [28], path aggregation network (PANet) [29], and bidirectional feature pyramid network (BIFPN) [30]. Their core idea is to aggregate multi-scale features extracted from the backbone network. However, these feature pyramid network structures only focus on feature scales and ignore feature levels. GFPN uses a new cross-scale fusion method to provide more efficient information transfer by aggregating features from the same and neighboring levels [31], and its network structure is shown in Figure 5. To increase feature fusion across more scales within the fish population, a new skip connection method was proposed, where each level received input from the previous node along with those from nodes diagonally above and diagonally below. In addition, the Concat method is used for feature fusion, which efficiently prevents the disappearance of the gradient and extends it to a deeper network. The module formed by the method is the CSPStage, and its network structure is shown in Figure 6.
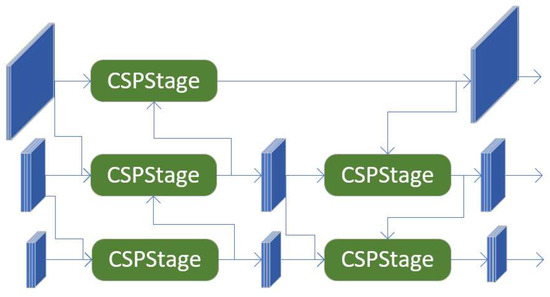
Figure 5.
GFPN network structure.
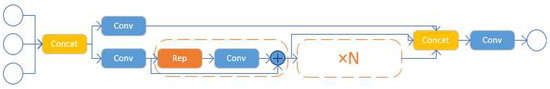
Figure 6.
CSPStage module structure.
When the size of the detected objects is similar to fish schooling sonar images, it is difficult for the network to differentiate between objects with simple appearances and those with more complex ones because the fish schooling feature maps contain only single-level or few multi-level features. In this paper, we used GFPN with the CSPStage module, which can improve the detection accuracy of the model in processing sonar images through cross-scale and multi-level feature fusion.
3.2.3. Partial Convolution (PConv)
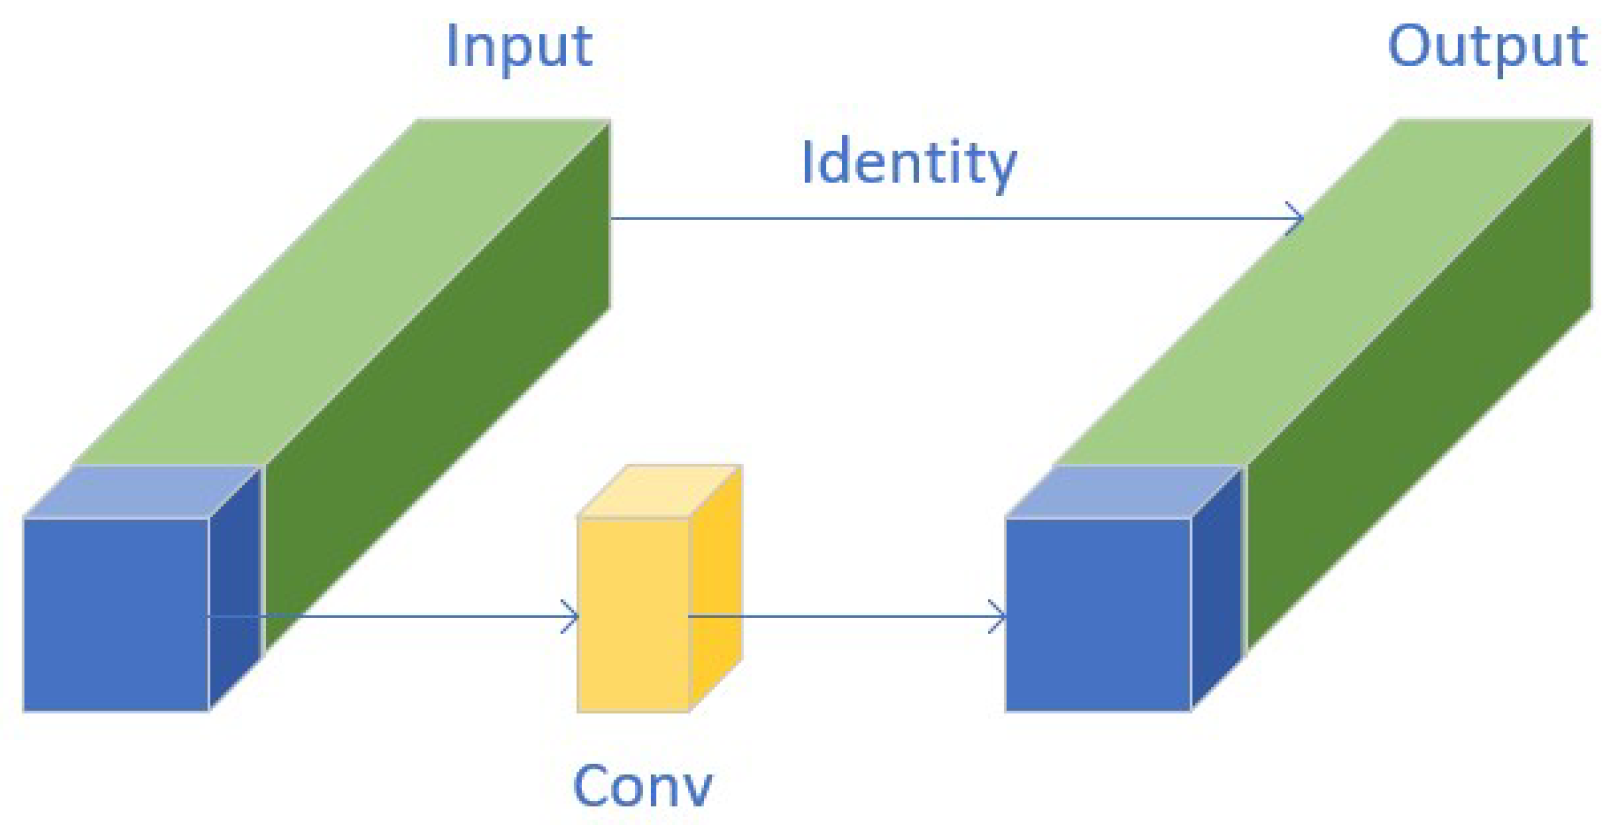
Eliminating interference feature redundancy and reducing model complexity are conducive to improving object detection accuracy. To design fast neural networks, much of the work has focused on reducing the number of floating-point operations (FLOPs). However, in the process of this reduction, the operators usually suffer the side effect of an increase in memory access. PConv utilizes feature mapping redundancy to systematically apply regular convolution on some input channels without affecting the state of other channels [32], which eliminates redundant features, reduces model complexity, and avoids increasing memory access. Partial convolution is a lightweight convolution operator that can effectively use redundancy in the sonar feature map due to the noise in the sonar image, thus reducing the computational cost and improving the extraction of features from the target fish population. Figure 7 illustrates the workflow of partial convolution, which selectively applies convolution operations to extract a portion of the input channels of spatial features while keeping the remaining channels unchanged.

Figure 7.
Partial convolution module.
3.3. BoT-SORT Counting Methods
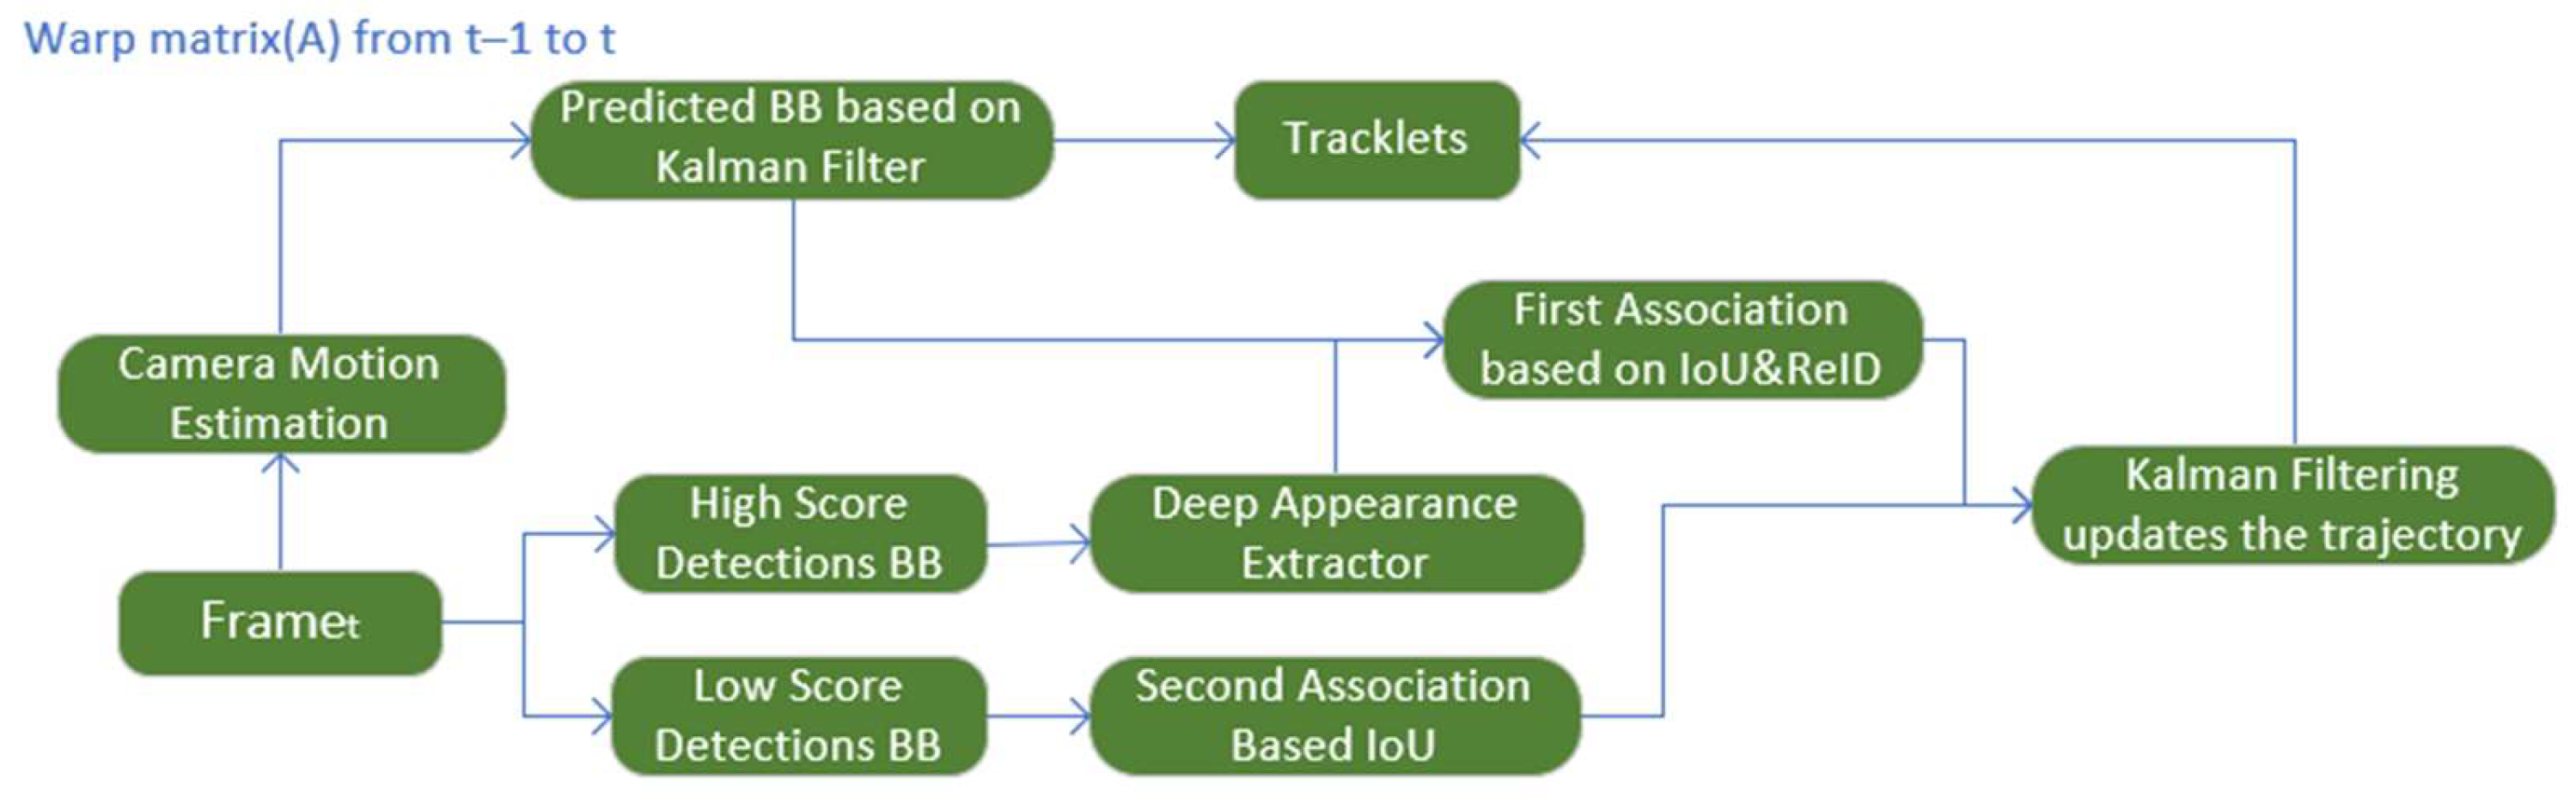
The BoT-SORT tracking algorithm significantly enhances the overall performance of the tracking process by associating each detection bounding box, even the low-scoring detection bounding box, to monitor numerous targets. It is based on ByteTrack, and adopts the SORT framework in its entirety, combining the advantages of motion features and appearance information, adding camera motion compensation and a more accurate Kalman filter (KF) state vector as well as adding the Re-ID metric to improve the tracking accuracy, which realizes stable multi-target fish schooling in complex scenes as well as tracking and counting in complex scenarios, and the algorithm flow is shown in Figure 8.
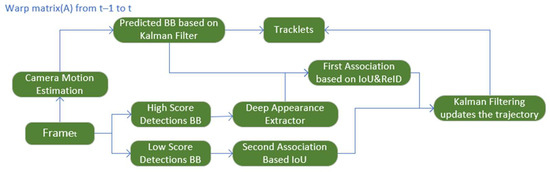
Figure 8.
The flow of the fish tracking and counting algorithm.
3.3.1. Kalman Filtering
To simulate the motion trajectory on the sonar image, the motion of the moving detection target is usually modeled using a discrete Kalman filter (KF) with a constant velocity model. Equation (1) is the state vector of the KF in the initial tracking algorithm.
where x and y are the center coordinates of the bounding box, s is the area of the bounding box, a is the horizontal-to-vertical ratio of the bounding box, and denote the predicted value of the state.
Since sonar uses acoustic waves to generate acoustic images, however, the underwater environment is more complex, and the size and shape of the bounding box may change due to the distance of the target, the angle, the noise, the change of acoustic wave propagation, and other factors. In this case, the traditional area and aspect ratio may not accurately reflect the changes in the bounding box. Equation (2) is the improved KF state vector in the BoT-SORT algorithm.
where the original aspect ratio a and area s have been changed to predict the width w and height h, which can better match the bounding box of the target, ensure accurate positioning of the target, and improve the IoU in tracking matching.
3.3.2. Motion Estimation of Sonar Equipment
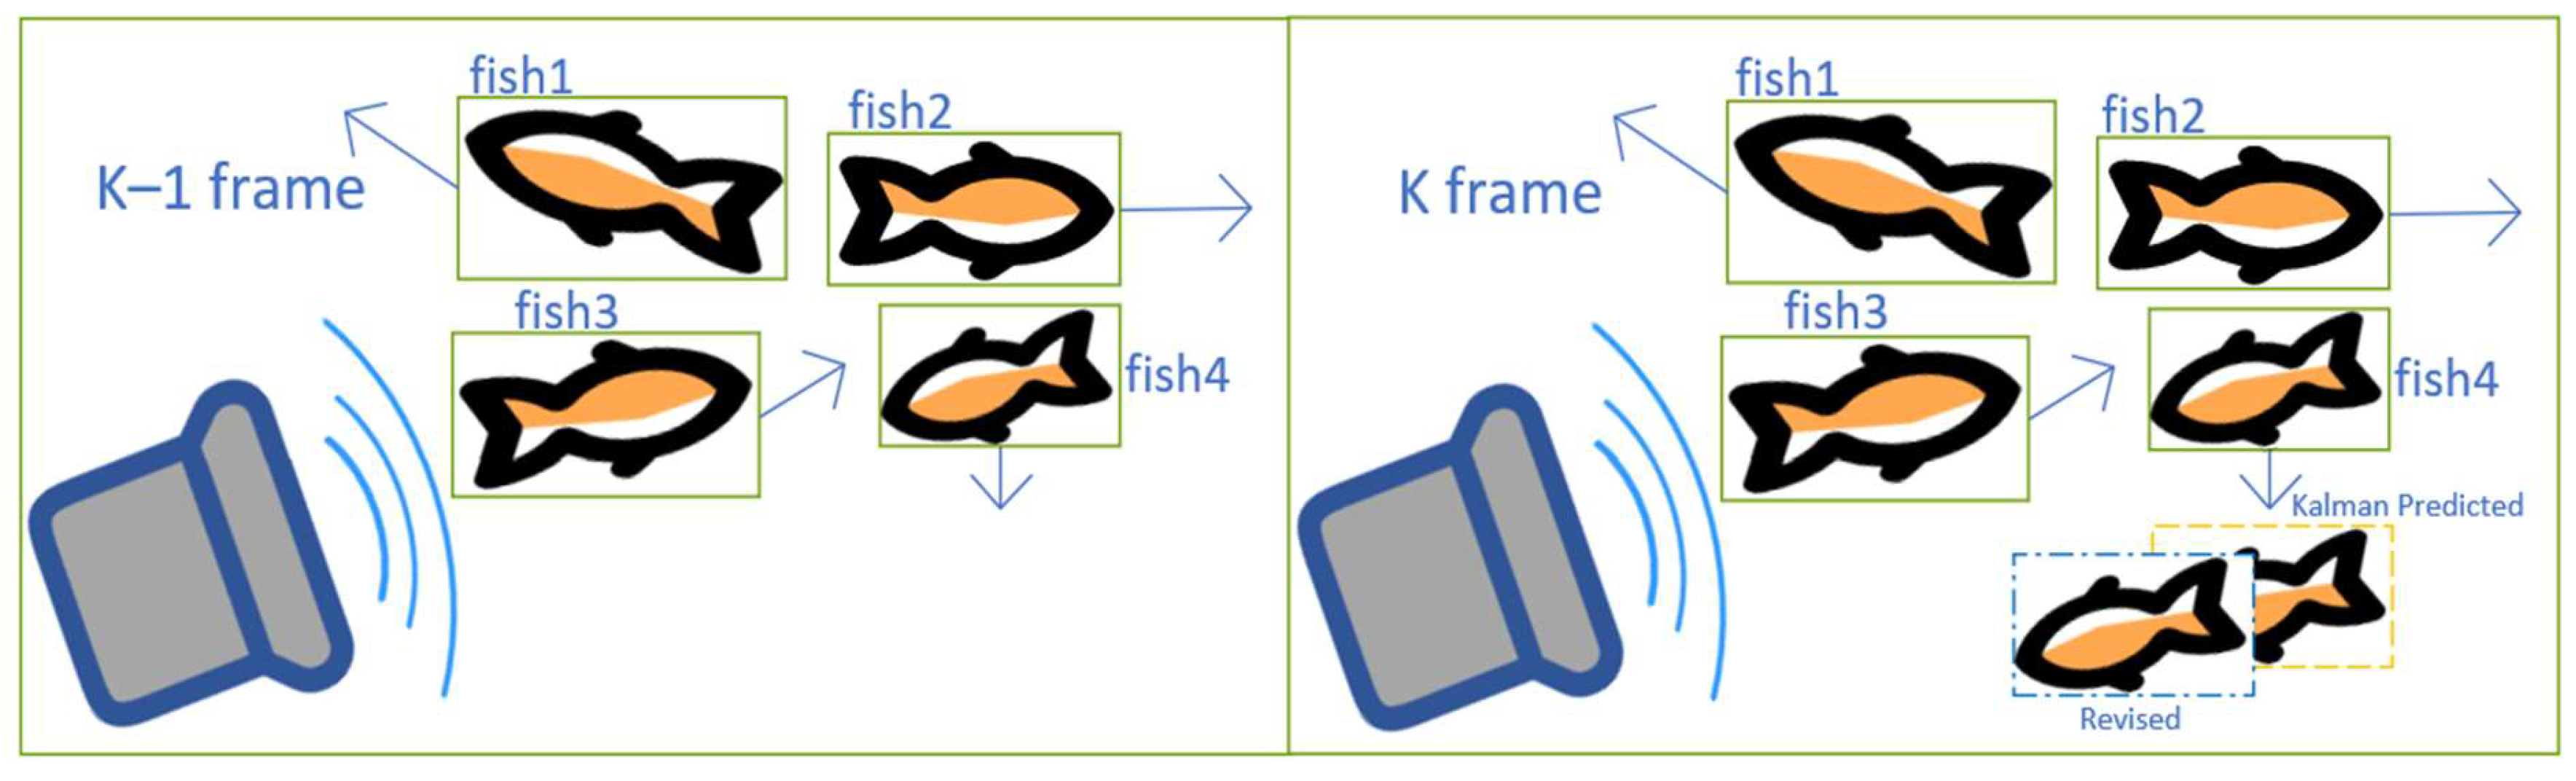
The tracker relies on the overlap of the predicted target motion trajectory borders and the detected target trajectory borders. The dynamic nature of sonar equipment can cause the video image to shake and the border position to shift, resulting in inaccurate prediction matching. Meanwhile, since KF is a unified linear motion model, it is unsuitable for tracking nonlinear motion targets, and the underwater sonar equipment can be impacted by surge currents, resulting in fish positions in the pixel image becoming jittery and the tracking target is lost. Therefore, the BoT-SORT algorithm uses OpenCV’s global motion estimation (GME) technique to improve this limitation. Firstly, the key points of the image are extracted, then the sparse optical flow is performed to match the images between neighboring frames, which is regarded as an approximation of the projection of the rigid motion of the camera on the image plane. Finally, the random sample consistency is used to compute the affine transformation matrix, predicting the fish boundary frame transformed from the k − 1 frame coordinate system to the K frame coordinate system. Thus, the relative motion of the fish school is converted to changes in the coordinate system, which compensates for the blurring of the bounding box caused by the irregular motion of the target. The schematic diagram of the sonar device to compensate for the movement of the fish school is shown in Figure 9.
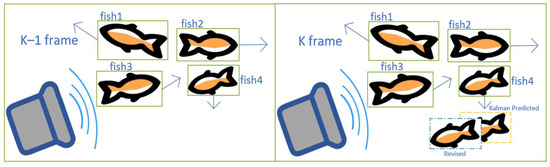
Figure 9.
Schematic diagram of the compensation of fish movement by sonar equipment.
3.3.3. IoU+ReID Convergence Mechanism
To track the location of the target fish more accurately, BoT-SORT fuses the appearance features of the detection target with the tracker. ResNeSt50 [33] from the FastReID library is the backbone, while BoT is the baseline to train the ReID network. Exponential moving average (EMA) is used to update the trajectory state. The appearance of fish may change due to disturbances in the underwater environment, and the ReID mechanism can maintain a high level of stability amidst visual changes by tracking the appearance characteristics of the target. By combining IoU and ReID, it is possible to filter out candidates with low cosine similarity or distant distances through the dual matching of motion and appearance, then selecting the minimum value of each element in the matrix as the final cost matrix [34] to enhance the accuracy of target tracking. Equations (3) and (4) are the formulas for the IoU+ReID fusion mechanism.
where is the element of the cost matrix C; is the IoU distance between the ith trajectory prediction bounding box and the jth detection bounding box, denoting the motion cost; is the cosine distance between the average trajectory appearance descriptor i and the new detection descriptor j; is the new appearance cost; is the proximity threshold used to discard impossible trajectories; is the appearance threshold separating the positive and negative association between the trajectory appearance state and the detection embedding vector.
3.4. Regional Fish Counting Method
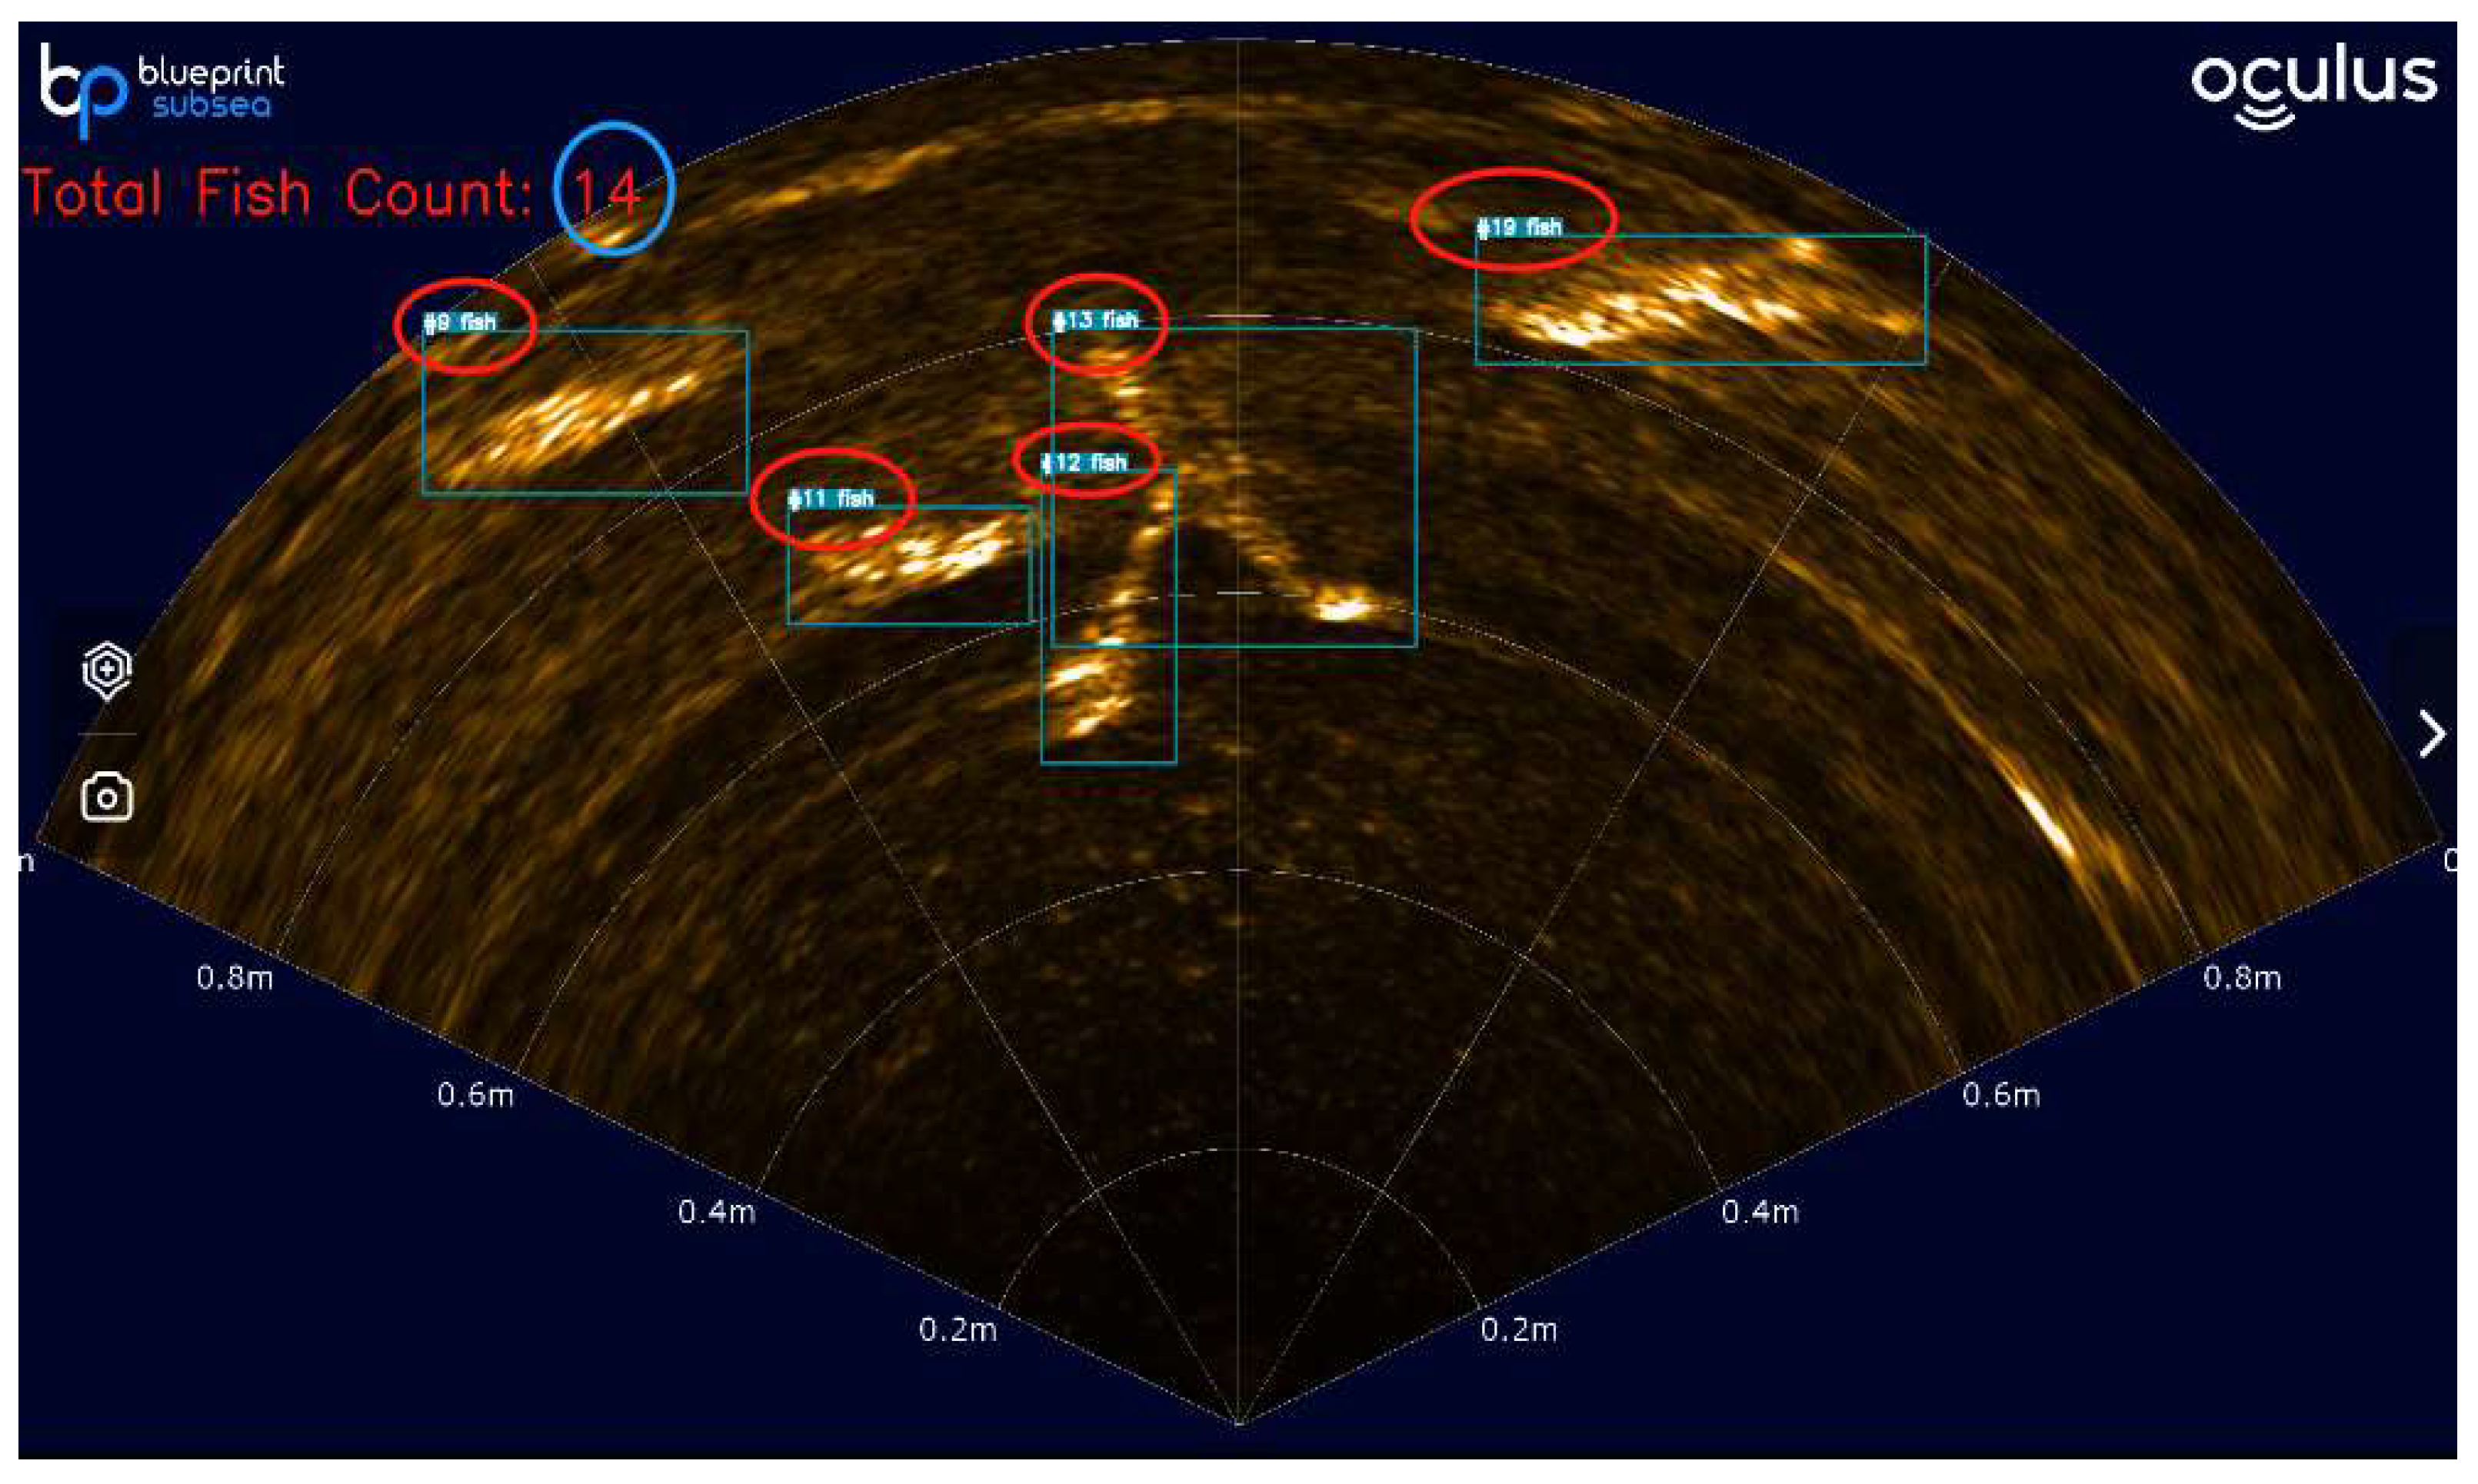
In this paper, we used the YOLOv8 and BoT-SORT algorithms to observe the tracking and counting effects of the algorithm on fish schools by inputting sonar imaging videos. The traditional approach to cumulative counting is to track detected target IDs by using a global collection. In each frame, the detected IDs are compared with those in the collection, and if they are new, they are added to the collection and cumulatively counted. This ensures that the accumulation is carried out only when a new target is present, thus avoiding double counting and incorrect accumulation. However, if this method assigns different IDs to the same target at different frames, incorrectly assigns IDs in overlapping situations, or causes tracking loss due to changes in fish movement patterns, it may result in significant deviation in the counting results. The traditional accumulation counting method is shown in Figure 10. As can be seen from Figure 10, the actual tracking fish ID had already reached 19, but the counting result was only 14. This leads to growing errors in counting and a deviation from the actual results as the monitoring time increases and the number of fish grows.

Figure 10.
Traditional sonar image accumulation counting method.
Therefore, we proposed a new region-counting method: the number of detected fish in the current image was displayed in real-time in the upper left corner of the video without accumulation. This design avoids counting accumulation errors due to missed or false detections. Additionally, it allows us to visualize the number of fish in each frame without being affected by the counts of previous frames. By displaying the number of fish in real-time, it is possible to keep track of the dynamics of the fish population in the monitoring area and respond more flexibly. This is essential for maintaining ecosystem balance and ensuring sustainable fisheries.
4. Experimental Results and Analysis
4.1. Training Environment and Parameter Settings
To ensure the fairness and rationality of the experiments in this article, all experiments were conducted in the same experimental environment and with the same experimental configuration parameters. The experimental environment of this article was based on the Windows 11 operating system with a Nvidia GeForce RTX3060 graphics card. Python 3.8 and CUDA11.8 were the compilation environment, PyTorch 2.0.1 was the network training framework, and the model was optimized using a random gradient descent (SGD) optimizer. The total number of training rounds was set to 300, the batch size was set to 8, and the other parameters were set to default values.
4.2. Evaluation Indicators
To validate the fish object detection performance of the improved model, this study mainly evaluated the model in terms of accuracy P (Precision), recall R (Recall), mean average precision mAP (mean average precision), number of parameters, and floating point operations per second (GFLOPs). In the experiment, the IoU threshold of mAP was set to 0.5 (). Accuracy indicates the proportion of positive and correct predictions among all samples with positive predictions, and recall indicates the proportion of correct positive predictions among all samples with actual positives. With the accuracy and recall metrics, we can comprehensively evaluate the detection performance of the model. Equations (5) and (6) provide the formulas for the accuracy and recall metrics, respectively.
where TP denotes the number of samples that were predicted to be positive and were actually positive. FP denotes the number of samples that were predicted to be positive but were actually negative. FN denotes the number of samples that were actually positive but were predicted by the model to be negative.
4.3. Experimental Results
4.3.1. Comparison of Different Baseline Models
To balance the accuracy and computational cost of the fish detection model, this paper trained the YOLOv8n, YOLOv8s, YOLOv8m, YOLOv8l, and YOLOv8x models separately to find a suitable baseline model. The self-constructed sonar fish dataset was used for training with the above official baseline models, respectively, and parameters such as accuracy, recall, mean precision, computation, and number of parameters of fish detection were compared to evaluate the performance of the models. The results are shown in Table 1.

Table 1.
Comparison of different versions of YOLOv8.
In sonar imaging, fish detection faces additional problems such as noise interference and image blurring. Although deep networks can extract more features, they may be more prone to overfitting or more sensitive to noise. As a medium-sized model, YOLOv8s has sufficient feature extraction capabilities to avoid overfitting due to excessive complexity, while also providing lower resource consumption and computational costs. Therefore, choosing YOLOv8s as the base model for fish detection can ensure that overfitting is avoided and that the computational cost is reduced while the accuracy is improved.
4.3.2. Comparison of Algorithm Results before and after Improvement
The recall rate of the improved model reached 76.7%, and was 78.5%. Compared with the base YOLOv8s model, each index increased by 3.8% and 2.5%. Compared with the YOLOv8n model, each index increased by 6.1% and 4.8%. A comparison of the results of the algorithm before and after the improvement is shown in Figure 11.
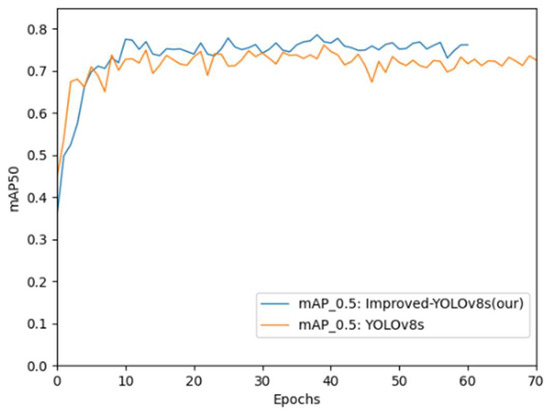
Figure 11.
Comparison of the algorithmic improvement results.
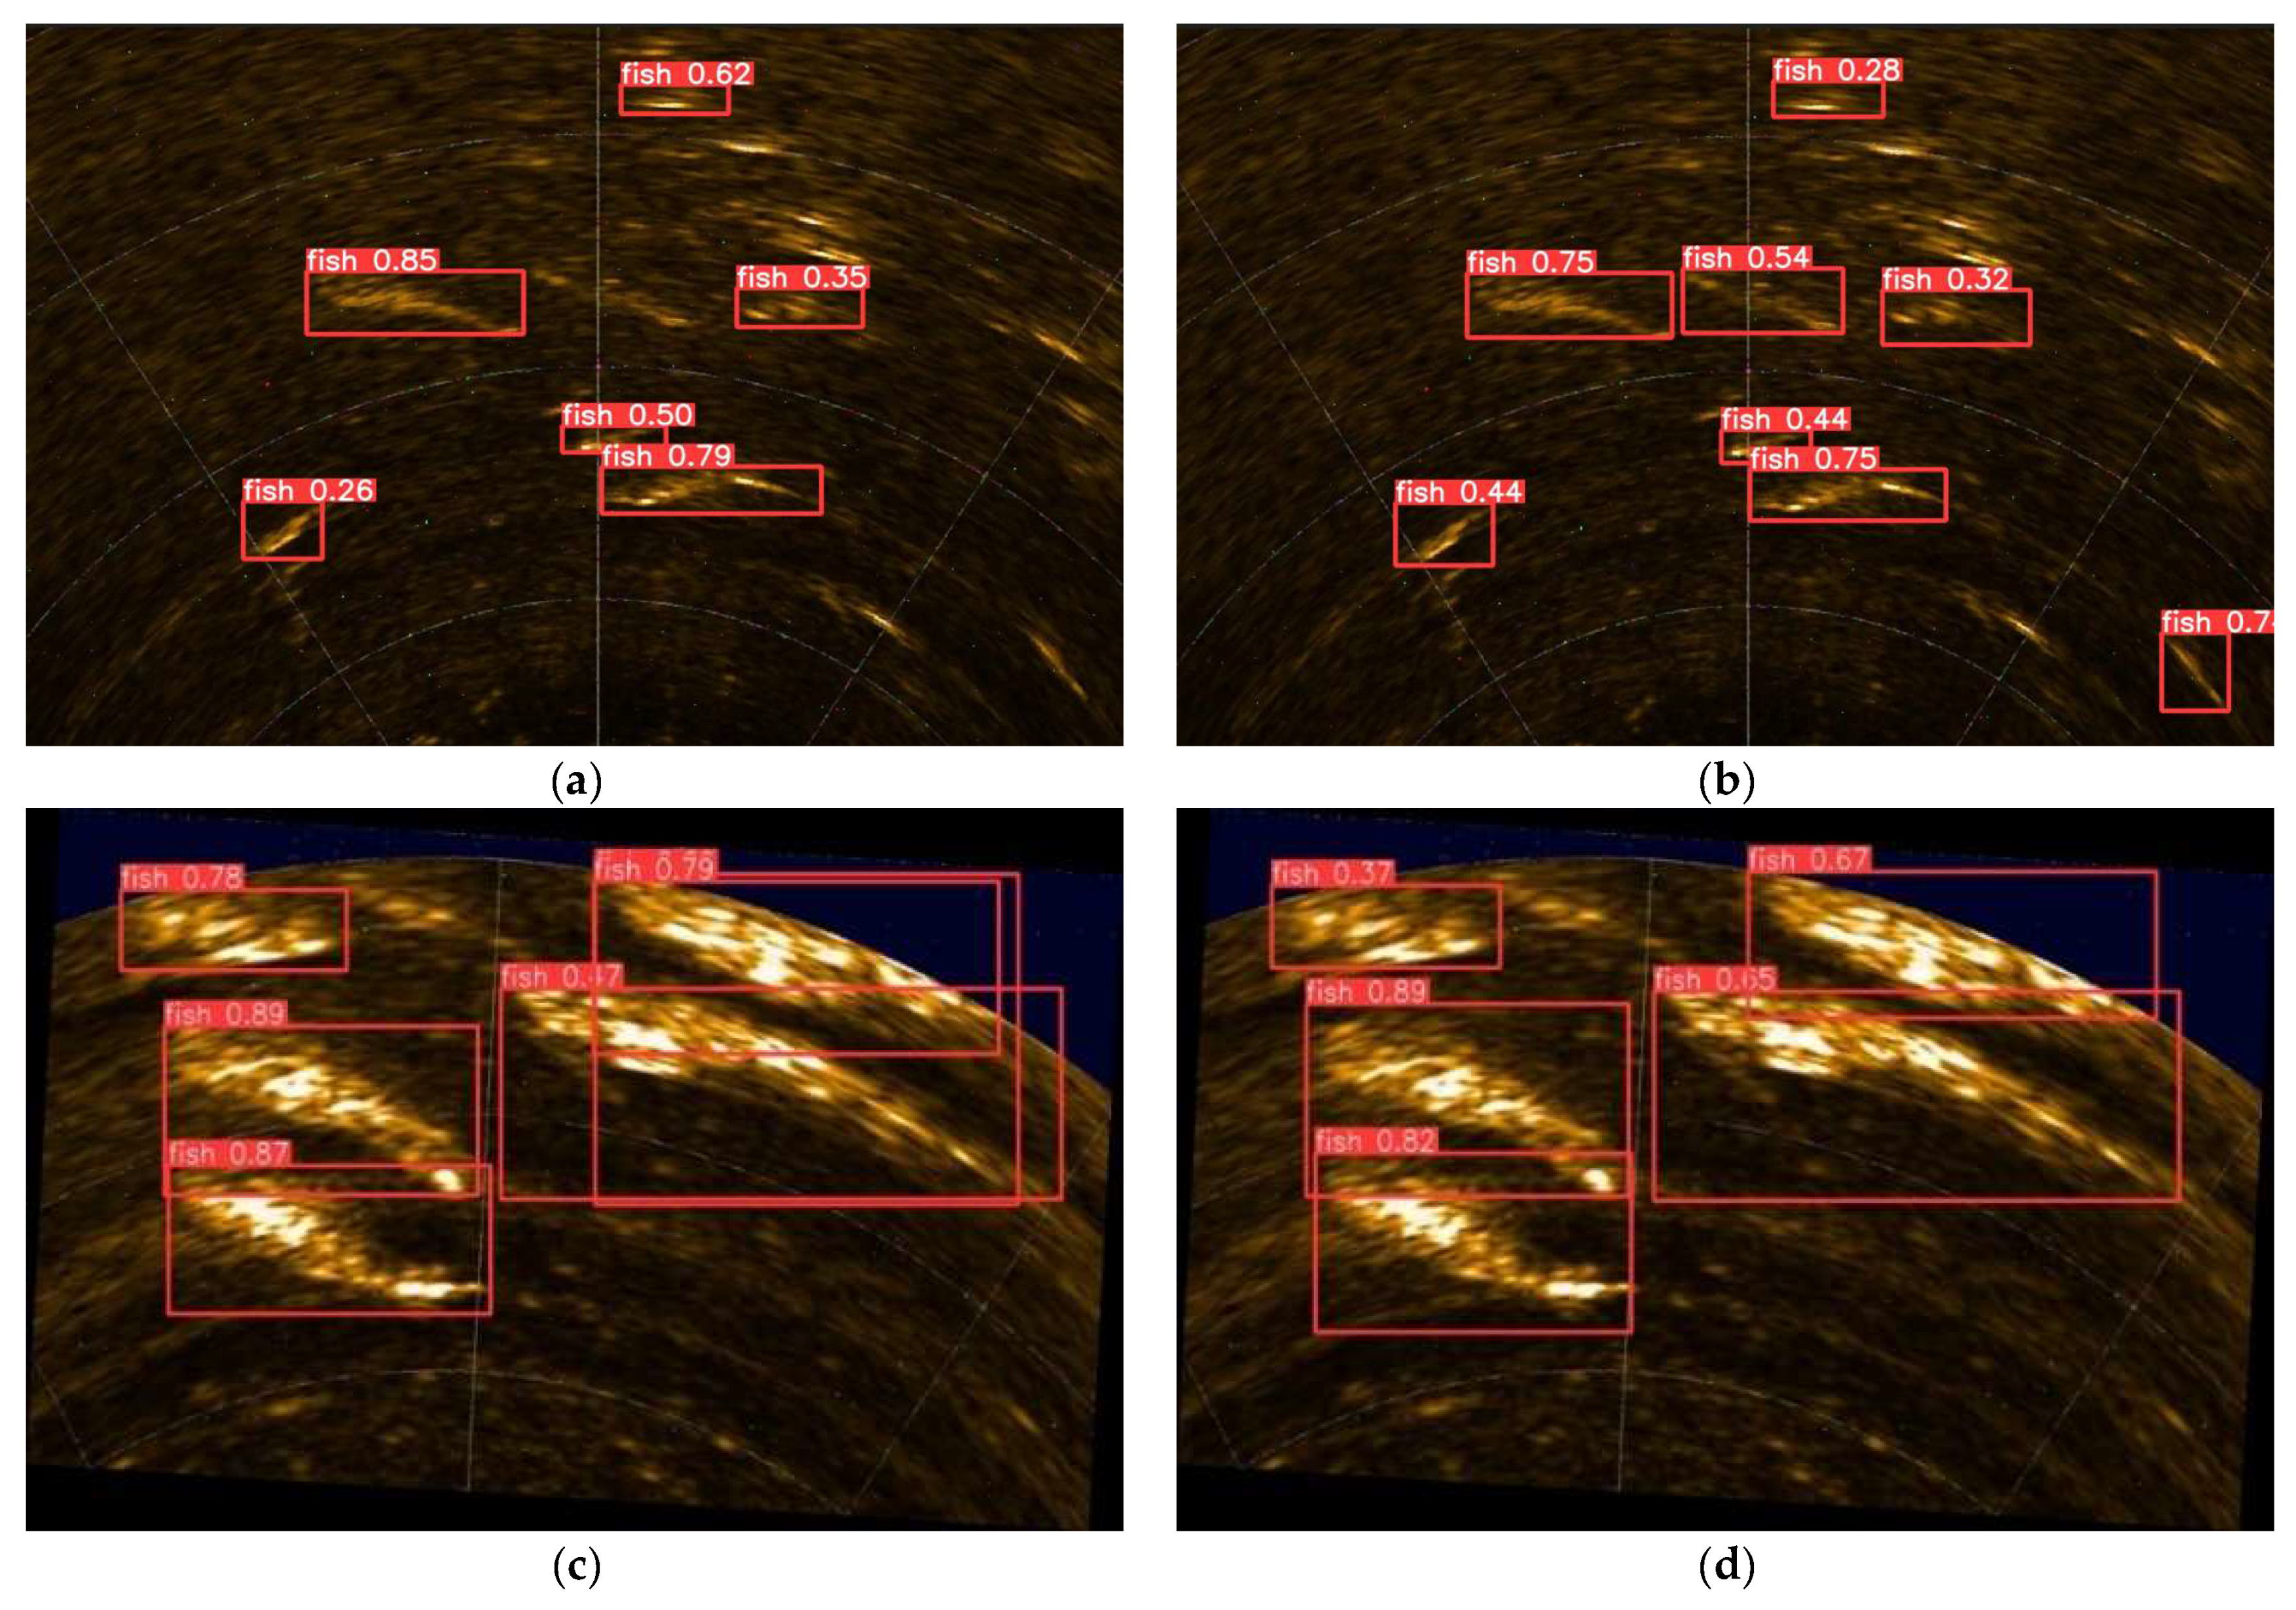
To verify the effectiveness of the improved algorithm and eliminate the possibility of accuracy improvement caused by an increase in the missed detection rate or false detection rate, two images were randomly selected from the dataset for detection, and the prediction results were compared, as shown in Figure 12.
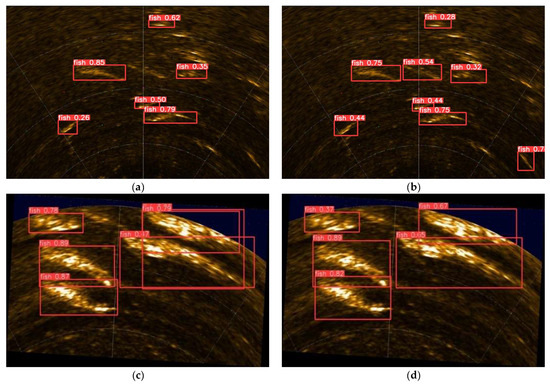
Figure 12.
Comparison of detection results. (a) Original model leakage; (b) improved; (c) original model multi-test; (d) improved.
The left side in Figure 12 shows the results of the model detection before improvement, and the right side shows the results of the improved model detection. By analyzing the figure, we can observe the difference before and after the model improvement. The pre-improved model missed two fish targets in Figure 12a, while in Figure 12b, the two missed targets were detected normally. One fish target was overdetected in Figure 12c, and in Figure 12d, it can be seen that the false detection was improved. The results show that the improved algorithm reduced the missed detection rate and false detection rate while increasing the accuracy and mAP, which provides strong support for subsequent fish tracking and counting.
4.3.3. Analysis of Counting Results Based on Improved YOLOv8 and BoT-SORT Algorithm
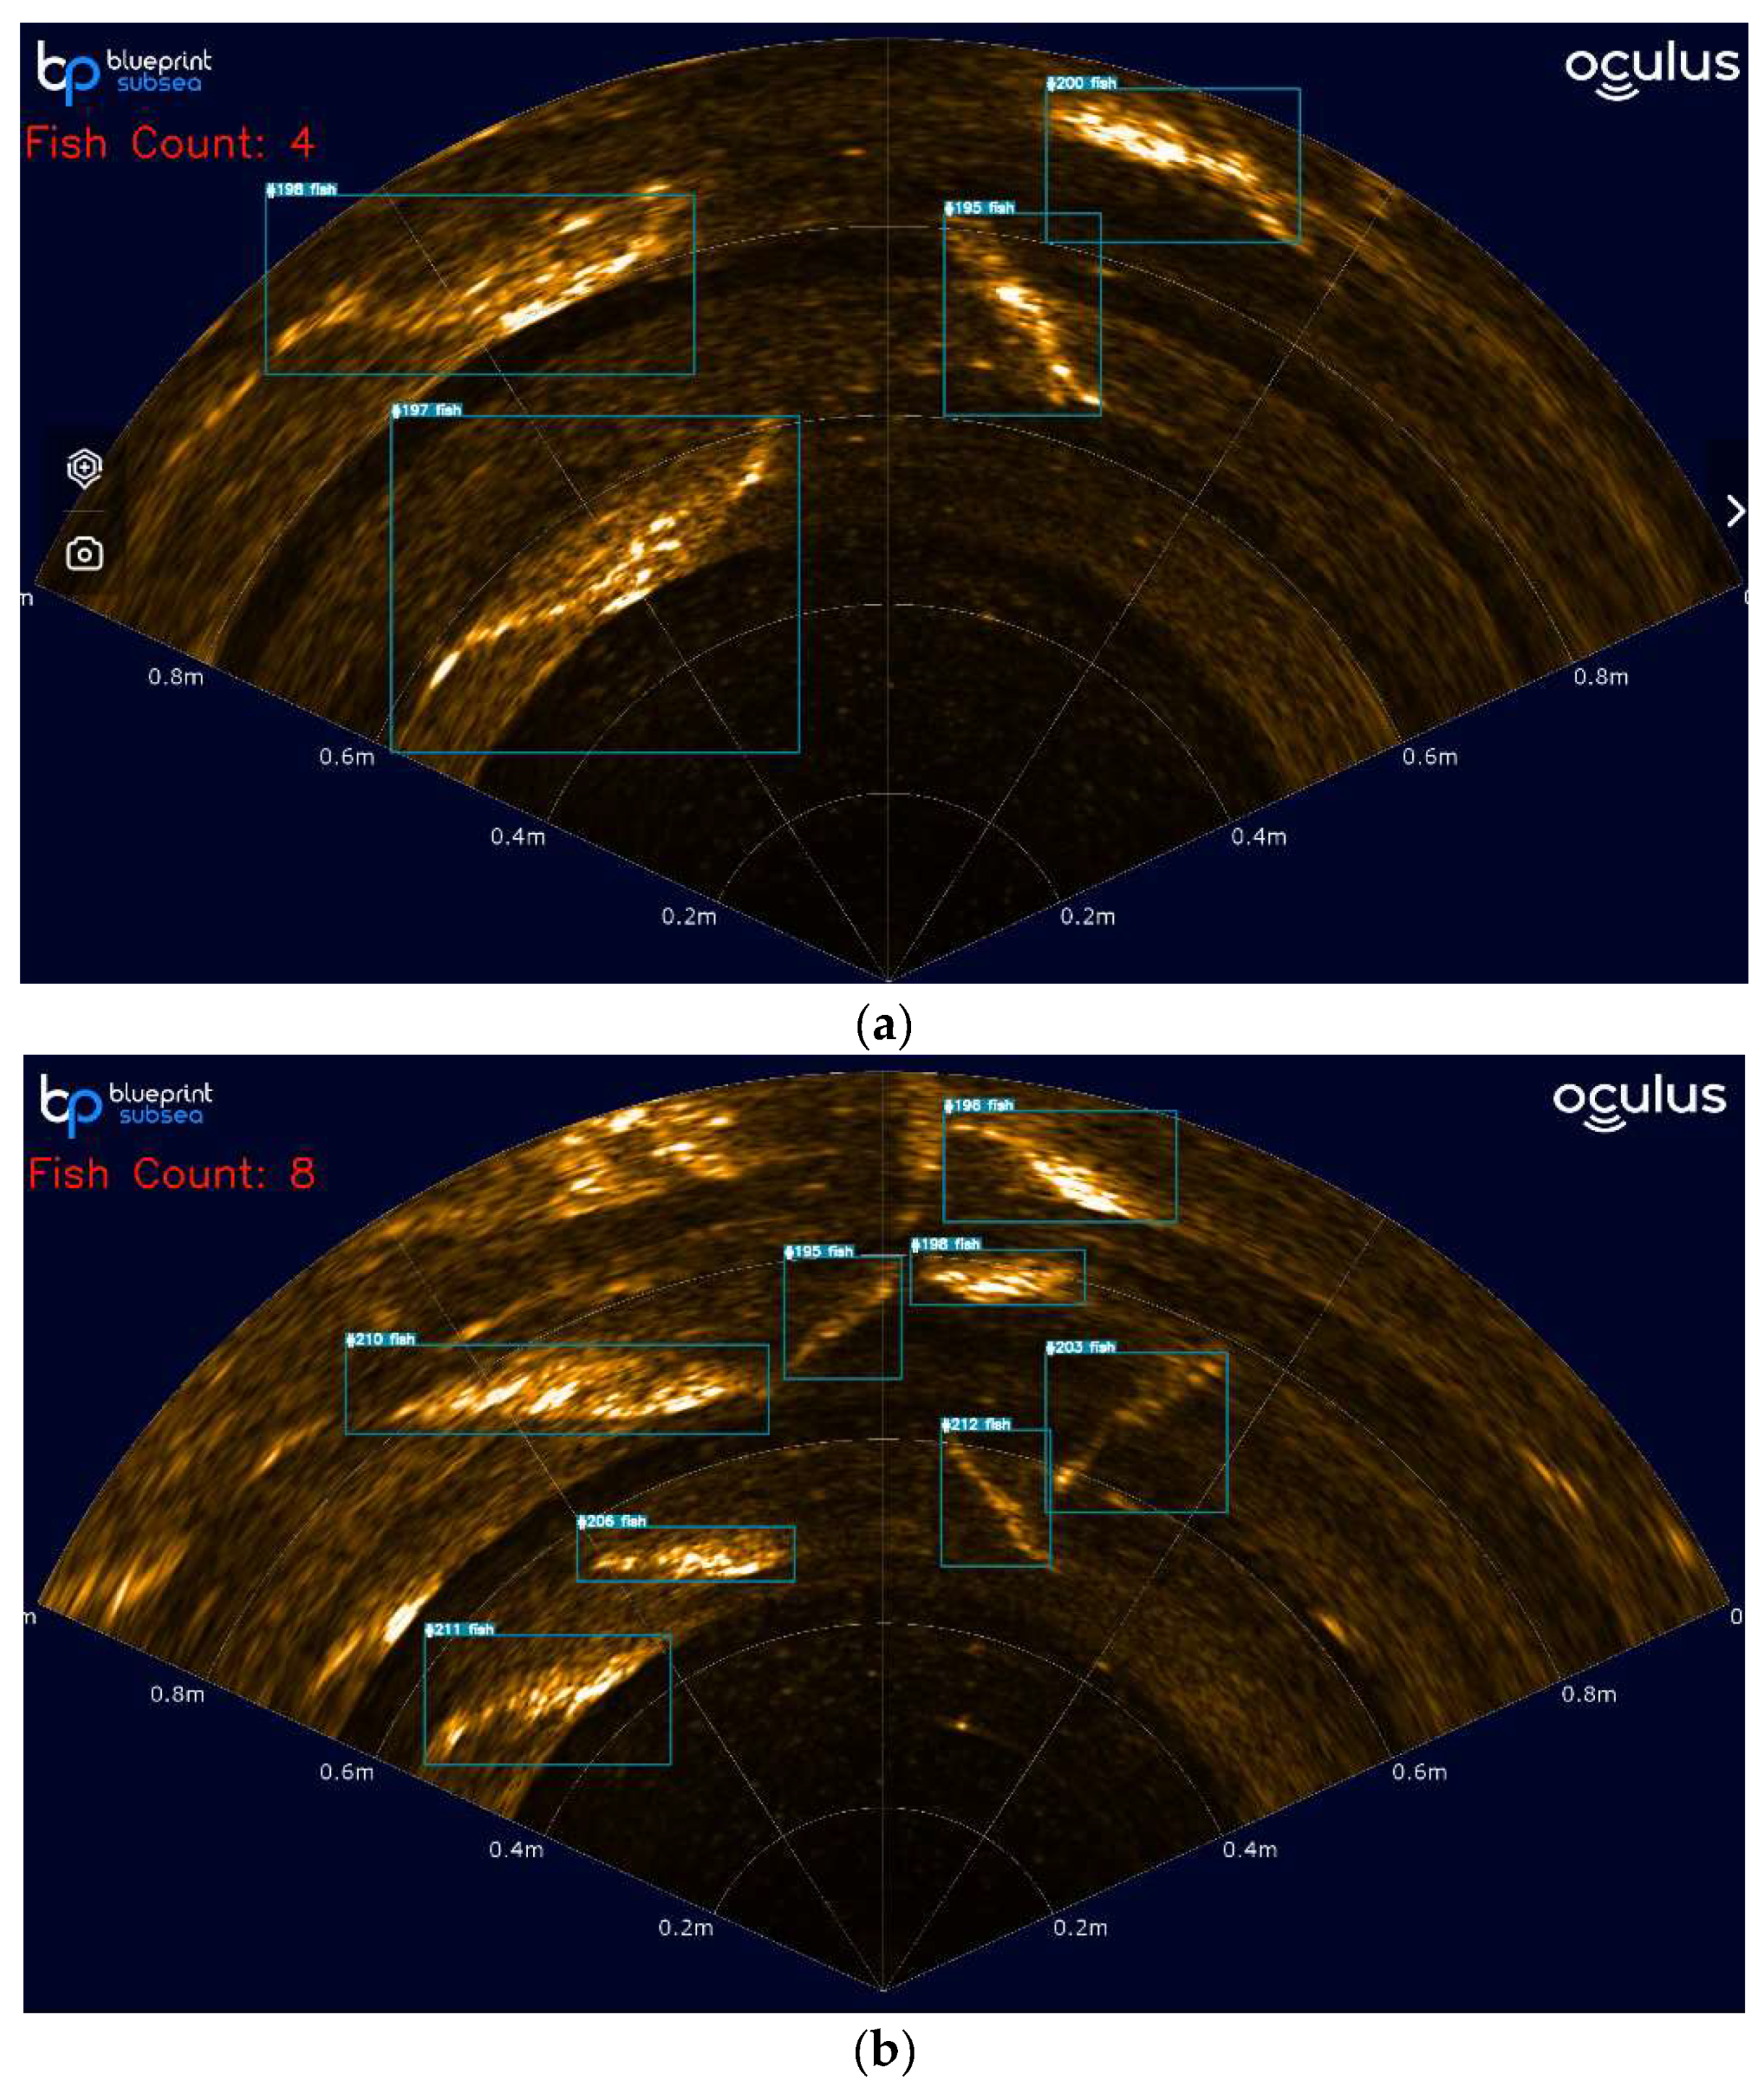
Since the tracking and counting performance of YOLOv8 and BoT-SORT algorithms depend on object detection accuracy, two frames containing the counting effect of fish were randomly selected from the video data to verify the tracking and counting effects. Due to the high amount of noise in sonar imaging, the IoU threshold was set to 0.7, and targets below 0.7 were suppressed to avoid false positives. These frames represent the cases of a small number of fish and a large number of fish, respectively, as shown in Figure 13.
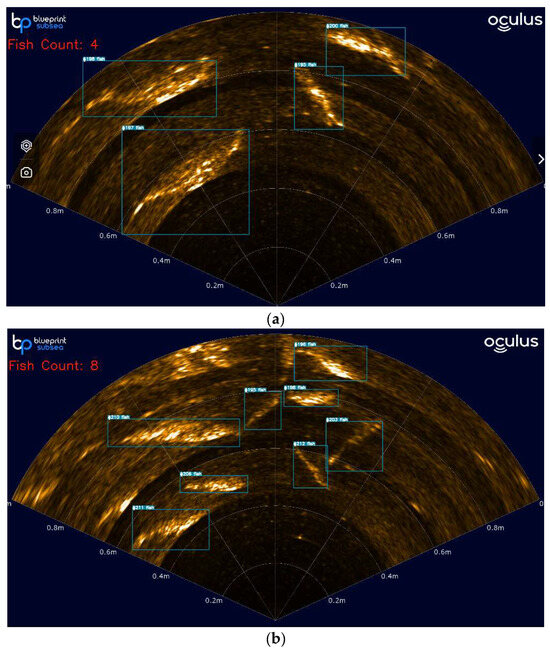
Figure 13.
Counting results for the improved YOLOv8 and BoT-SORT algorithms. (a) Smaller fish population; (b) larger fish population.
From the analysis of the counting results, it can be seen that the algorithm can quickly and accurately identify the fish targets in the video and promptly update the number of detected fish. Regardless of the situation in Figure 13a has a small number of fish, or Figure 13b has a large number of fish, or regardless of how the movement pattern of the fish changes, the improved YOLOv8 and BoT-SORT algorithms can track and count stably, effectively reducing the missed and false detections. This ability makes the algorithm robust in complex underwater environments. The number of fish displayed in real-time in the upper left corner is consistent with the number of fish appearing in the actual video, further validating the reliability and accuracy of the algorithm.
4.4. Model Validation
4.4.1. Ablation Experiments
To realize accurate and efficient fish detection, this paper conducted six groups (experiments 1–6) of ablation experiments based on the original YOLOv8s model, and the experimental results are shown in Table 2.
Table 2.
Comparison of ablation experiments.
The experimental results showed that the detection performance varied when CARAFE, GFPN, or PConv were introduced alone but improved significantly when different combinations were introduced, as in Experiments 4 and 5. Specifically, when CARAFE, GFPN, and PConv were introduced simultaneously, the detection accuracy, recall, and were significantly improved. Compared to the original YOLOv8s model, they had been improved by 0.8%, 3.8%, and 2.4%, respectively. This indicates that the improved model can effectively enhance the accuracy and efficiency of fish detection without significant additional computational costs, providing a basis for accurate fish counting.
4.4.2. Comparative Experiments with Different Models
To further verify the effectiveness of the improved algorithm, the same experimental parameters and dataset were used, along with the same experimental equipment and training strategy. The evaluation indices included accuracy, recall, mean average precision, and the number of parameters. The improved algorithm was compared with mainstream object detection algorithms such as Faster R-CNN, YOLOv6, YOLOv7 tiny, and YOLOv8. The experimental results are shown in Table 3.
Table 3.
Comparison results of different algorithms.
The experimental results showed that the improved algorithm had better detection accuracy and detection speed compared with mainstream object detection algorithms such as Faster R-CNN, YOLOv6, YOLOv7-tiny, and YOLOv8. Since the model backbone network introduced the lightweight upsampling operator CARAFE, the generalized feature pyramid network (GFPN), and the partially convolutional (PConv), the improved model could reduce the computational cost without decreasing the detection precision. In summary, the improved model performed better in terms of the precision rate, recall rate, average precision rate, and computational cost.
5. Conclusions
This study proposed a sonar fish school detection and counting method based on improved YOLOv8 and BoT-SORT, modified to address the challenges of fish object detection and counting in pelagic fisheries. By utilizing CARAFE, GFPN, and partial convolution, combined with the BoT-SORT tracking algorithm, accurate fish identification and tracking were successfully improved, and the real-time number of fish in the relevant area was a stable output. However, this paper also has shortcomings, and we expect to improve the applicability and stability of the method by further field verification and optimization of the algorithm in the future to meet the needs of different marine environments. Meanwhile, we will also work on expanding the diversity of data samples, optimizing computational efficiency, and exploring the possible room for improvement in the future to provide more effective support for the development of pelagic fisheries.
Author Contributions
Conceptualization, B.X. and M.S.; Methodology, M.S.; Software, M.S.; Validation, M.S., L.G. and C.Y.; Formal analysis, M.S. and Z.L.; Investigation, C.H.; Resources, B.X. and J.H.; Data curation, M.S.; Writing—original draft preparation, M.S.; Writing—review and editing, B.X.; Visualization, M.S.; Supervision, B.X. and L.G.; Project administration, Z.L.; Funding acquisition, B.X., Z.L. and C.Y. All authors have read and agreed to the published version of the manuscript.
Funding
This research was funded by the Shanghai Science and Technology Committee (STCSM), Local Universities Capacity-Building Project, grant number 22010502200.
Institutional Review Board Statement
Not applicable.
Informed Consent Statement
Not applicable.
Data Availability Statement
Data are contained within the article.
Conflicts of Interest
Zhenchong Liu and Chuanxu Yan are employed by Shanghai Zhongchuan NERC-SDT Co., Ltd. Jitao Han is employed by China State Shipbuilding Star&inertia Technology (Wuhan) Co., Ltd. The remaining authors declare that the research was conducted in the absence of any commercial or financial relationships that could be construed as potential conflicts of interest.
References
- Abe, S.; Takagi, T.; Torisawa, S.; Abe, K.; Habe, H.; Iguchi, N.; Takehara, K.; Masuma, S.; Yagi, H.; Yamaguchi, T. Development of fish spatio-temporal identifying technology using SegNet in aquaculture net cages. Aquac. Eng. 2021, 93, 102146. [Google Scholar] [CrossRef]
- Labao, A.B.; Naval, P.C., Jr. Cascaded deep network systems with linked ensemble components for underwater fish detection in the wild. Ecol. Inform. 2019, 52, 103–121. [Google Scholar] [CrossRef]
- Lowe, D.G. Object recognition from local scale-invariant features. In Proceedings of the Seventh IEEE International Conference on Computer Vision, Kerkyra, Greece, 20–27 September 1999; pp. 1150–1157. [Google Scholar]
- Dalal, N.; Triggs, B. Histograms of oriented gradients for human detection. In Proceedings of the 2005 IEEE Computer Society Conference on Computer Vision and Pattern Recognition (CVPR’05), San Diego, CA, USA, 20–25 June 2005; pp. 886–893. [Google Scholar]
- Pisner, D.A.; Schnyer, D.M. Support vector machine. In Machine Learning; Elsevier: Amsterdam, The Netherlands, 2020; pp. 101–121. [Google Scholar]
- Girshick, R.; Donahue, J.; Darrell, T.; Malik, J. Rich feature hierarchies for accurate object detection and semantic segmentation. In Proceedings of the IEEE Conference on Computer Vision and Pattern Recognition, Columbus, OH, USA, 23–28 June 2014; pp. 580–587. [Google Scholar]
- Ren, S.; He, K.; Girshick, R.; Sun, J. Faster R-CNN: Towards real-time object detection with region proposal networks. IEEE Trans. Pattern Anal. Mach. Intell. 2016, 39, 1137–1149. [Google Scholar] [CrossRef]
- Bochkovskiy, A.; Wang, C.-Y.; Liao, H.-Y.M. Yolov4: Optimal speed and accuracy of object detection. arXiv 2020, arXiv:2004.10934. [Google Scholar]
- Redmon, J.; Divvala, S.; Girshick, R.; Farhadi, A. You only look once: Unified, real-time object detection. In Proceedings of the IEEE Conference on Computer Vision and Pattern Recognition, Las Vegas, NV, USA, 27–30 June 2016; pp. 779–788. [Google Scholar]
- Redmon, J.; Farhadi, A. Yolov3: An incremental improvement. arXiv 2018, arXiv:1804.02767. [Google Scholar]
- Yu, G.; Cai, R.; Su, J.; Hou, M.; Deng, R. U-YOLOv7: A network for underwater organism detection. Ecol. Inform. 2023, 75, 102108. [Google Scholar] [CrossRef]
- Liu, W.; Anguelov, D.; Erhan, D.; Szegedy, C.; Reed, S.; Fu, C.-Y.; Berg, A.C. SSD: Single shot multibox detector. In Computer Vision–ECCV 2016: Proceedings of the 14th European Conference, Amsterdam, The Netherlands, 11–14 October 2016; Proceedings, Part I; Springer: Cham, Switzerland, 2016; pp. 21–37. [Google Scholar]
- Jia, R.; Lv, B.; Chen, J.; Liu, H.; Cao, L.; Liu, M. Underwater Object Detection in Marine Ranching Based on Improved YOLOv8. J. Mar. Sci. Eng. 2023, 12, 55. [Google Scholar] [CrossRef]
- van Essen, R.; Mencarelli, A.; van Helmond, A.; Nguyen, L.; Batsleer, J.; Poos, J.-J.; Kootstra, G. Automatic discard registration in cluttered environments using deep learning and object tracking: Class imbalance, occlusion, and a comparison to human review. ICES J. Mar. Sci. 2021, 78, 3834–3846. [Google Scholar] [CrossRef]
- Wojke, N.; Bewley, A.; Paulus, D. Simple online and realtime tracking with a deep association metric. In Proceedings of the 2017 IEEE International Conference on Image Processing (ICIP), Beijing, China, 17–20 September 2017; pp. 3645–3649. [Google Scholar]
- Shen, L.; Liu, M.; Weng, C.; Zhang, J.; Dong, F.; Zheng, F. ColorByte: A real time MOT method using fast appearance feature based on ByteTrack. In Proceedings of the 2022 Tenth International Conference on Advanced Cloud and Big Data (CBD), Guilin, China, 4–5 November 2022; pp. 1–6. [Google Scholar]
- Du, Y.; Zhao, Z.; Song, Y.; Zhao, Y.; Su, F.; Gong, T.; Meng, H. Strongsort: Make deepsort great again. IEEE Trans. Multimedia 2023, 25, 8725–8737. [Google Scholar] [CrossRef]
- Wu, B.; Liu, C.; Jiang, F.; Li, J.; Yang, Z. Dynamic identification and automatic counting of the number of passing fish species based on the improved DeepSORT algorithm. Front. Environ. Sci. 2023, 11, 1059217. [Google Scholar] [CrossRef]
- Zhao, H.; Cui, H.; Qu, K.; Zhu, J.; Li, H.; Cui, Z.; Wu, Y. A fish appetite assessment method based on improved ByteTrack and spatiotemporal graph convolutional network. Biosyst. Eng. 2024, 240, 46–55. [Google Scholar] [CrossRef]
- Han, J.; Honda, N.; Asada, A.; Shibata, K. Automated acoustic method for counting and sizing farmed fish during transfer using DIDSON. Fish. Sci. 2009, 75, 1359–1367. [Google Scholar] [CrossRef]
- Liu, L.; Lu, H.; Cao, Z.; Xiao, Y. Counting fish in sonar images. In Proceedings of the 2018 25th IEEE International Conference on Image Processing (ICIP), Athens, Greece, 7–10 October 2018; pp. 3189–3193. [Google Scholar]
- Dunlop, K.M.; Benoit-Bird, K.J.; Waluk, C.M.; Henthorn, R.G. Ecological insights into abyssal bentho-pelagic fish at 4000 m depth using a multi-beam echosounder on a remotely operated vehicle. Deep Sea Res. II Top. Stud. Oceanogr. 2020, 173, 104679. [Google Scholar] [CrossRef]
- Asha Paul, M.K.; Kavitha, J.; Jansi Rani, P.A. Key-frame extraction techniques: A review. Recent Pat. Comput. Sci. 2018, 11, 3–16. [Google Scholar] [CrossRef]
- Shorten, C.; Khoshgoftaar, T.M. A survey on image data augmentation for deep learning. J. Big Data 2019, 6, 60. [Google Scholar] [CrossRef]
- Moreno-Barea, F.J.; Strazzera, F.; Jerez, J.M.; Urda, D.; Franco, L. Forward noise adjustment scheme for data augmentation. In Proceedings of the 2018 IEEE Symposium Series on Computational Intelligence (SSCI), Bangalore, India, 18–21 November 2018; pp. 728–734. [Google Scholar]
- Wang, J.; Chen, K.; Xu, R.; Liu, Z.; Loy, C.C.; Lin, D. Carafe++: Unified content-aware reassembly of features. IEEE Trans. Pattern Anal. Mach. Intell. 2021, 44, 4674–4687. [Google Scholar] [CrossRef]
- Liu, Y.; An, D.; Ren, Y.; Zhao, J.; Zhang, C.; Cheng, J.; Liu, J.; Wei, Y. DP-FishNet: Dual-path Pyramid Vision Transformer-based underwater fish detection network. Expert Syst. Appl. 2024, 238, 122018. [Google Scholar] [CrossRef]
- Zhu, L.; Lee, F.; Cai, J.; Yu, H.; Chen, Q. An improved feature pyramid network for object detection. Neurocomputing 2022, 483, 127–139. [Google Scholar] [CrossRef]
- Yu, H.; Li, X.; Feng, Y.; Han, S. Multiple attentional path aggregation network for marine object detection. Appl. Intell. 2023, 53, 2434–2451. [Google Scholar] [CrossRef]
- Yu, C.; Shin, Y. SAR ship detection based on improved YOLOv5 and BiFPN. ICT Express 2024, 10, 28–33. [Google Scholar] [CrossRef]
- Jiang, Y.; Tan, Z.; Wang, J.; Sun, X.; Lin, M.; Li, H. Giraffedet: A heavy-neck paradigm for object detection. arXiv 2022, arXiv:2202.04256. [Google Scholar]
- Chen, J.; Kao, S.-H.; He, H.; Zhuo, W.; Wen, S.; Lee, C.-H.; Chan, S.-H.G. Run, Don’t walk: Chasing higher FLOPS for faster neural networks. In Proceedings of the IEEE/CVF Conference on Computer Vision and Pattern Recognition, Vancouver, BC, Canada, 17–24 June 2023; pp. 12021–12031. [Google Scholar]
- Zhang, H.; Wu, C.; Zhang, Z.; Zhu, Y.; Lin, H.; Zhang, Z.; Sun, Y.; He, T.; Mueller, J.; Manmatha, R. Resnest: Split-attention networks. In Proceedings of the IEEE/CVF Conference on Computer Vision and Pattern Recognition, New Orleans, LA, USA, 18–24 June 2022; pp. 2736–2746. [Google Scholar]
- Aharon, N.; Orfaig, R.; Bobrovsky, B.-Z. BoT-SORT: Robust associations multi-pedestrian tracking. arXiv 2022, arXiv:2206.14651. [Google Scholar]


Disclaimer/Publisher’s Note: The statements, opinions and data contained in all publications are solely those of the individual author(s) and contributor(s) and not of MDPI and/or the editor(s). MDPI and/or the editor(s) disclaim responsibility for any injury to people or property resulting from any ideas, methods, instructions or products referred to in the content. |
© 2024 by the authors. Licensee MDPI, Basel, Switzerland. This article is an open access article distributed under the terms and conditions of the Creative Commons Attribution (CC BY) license (https://creativecommons.org/licenses/by/4.0/).