
The Morphodynamics of a Double-Crescent Bar System under a Mediterranean Wave Climate: Leucate Beach

 , ,
, ,  , , ,
, , ,
Abstract
1. Introduction
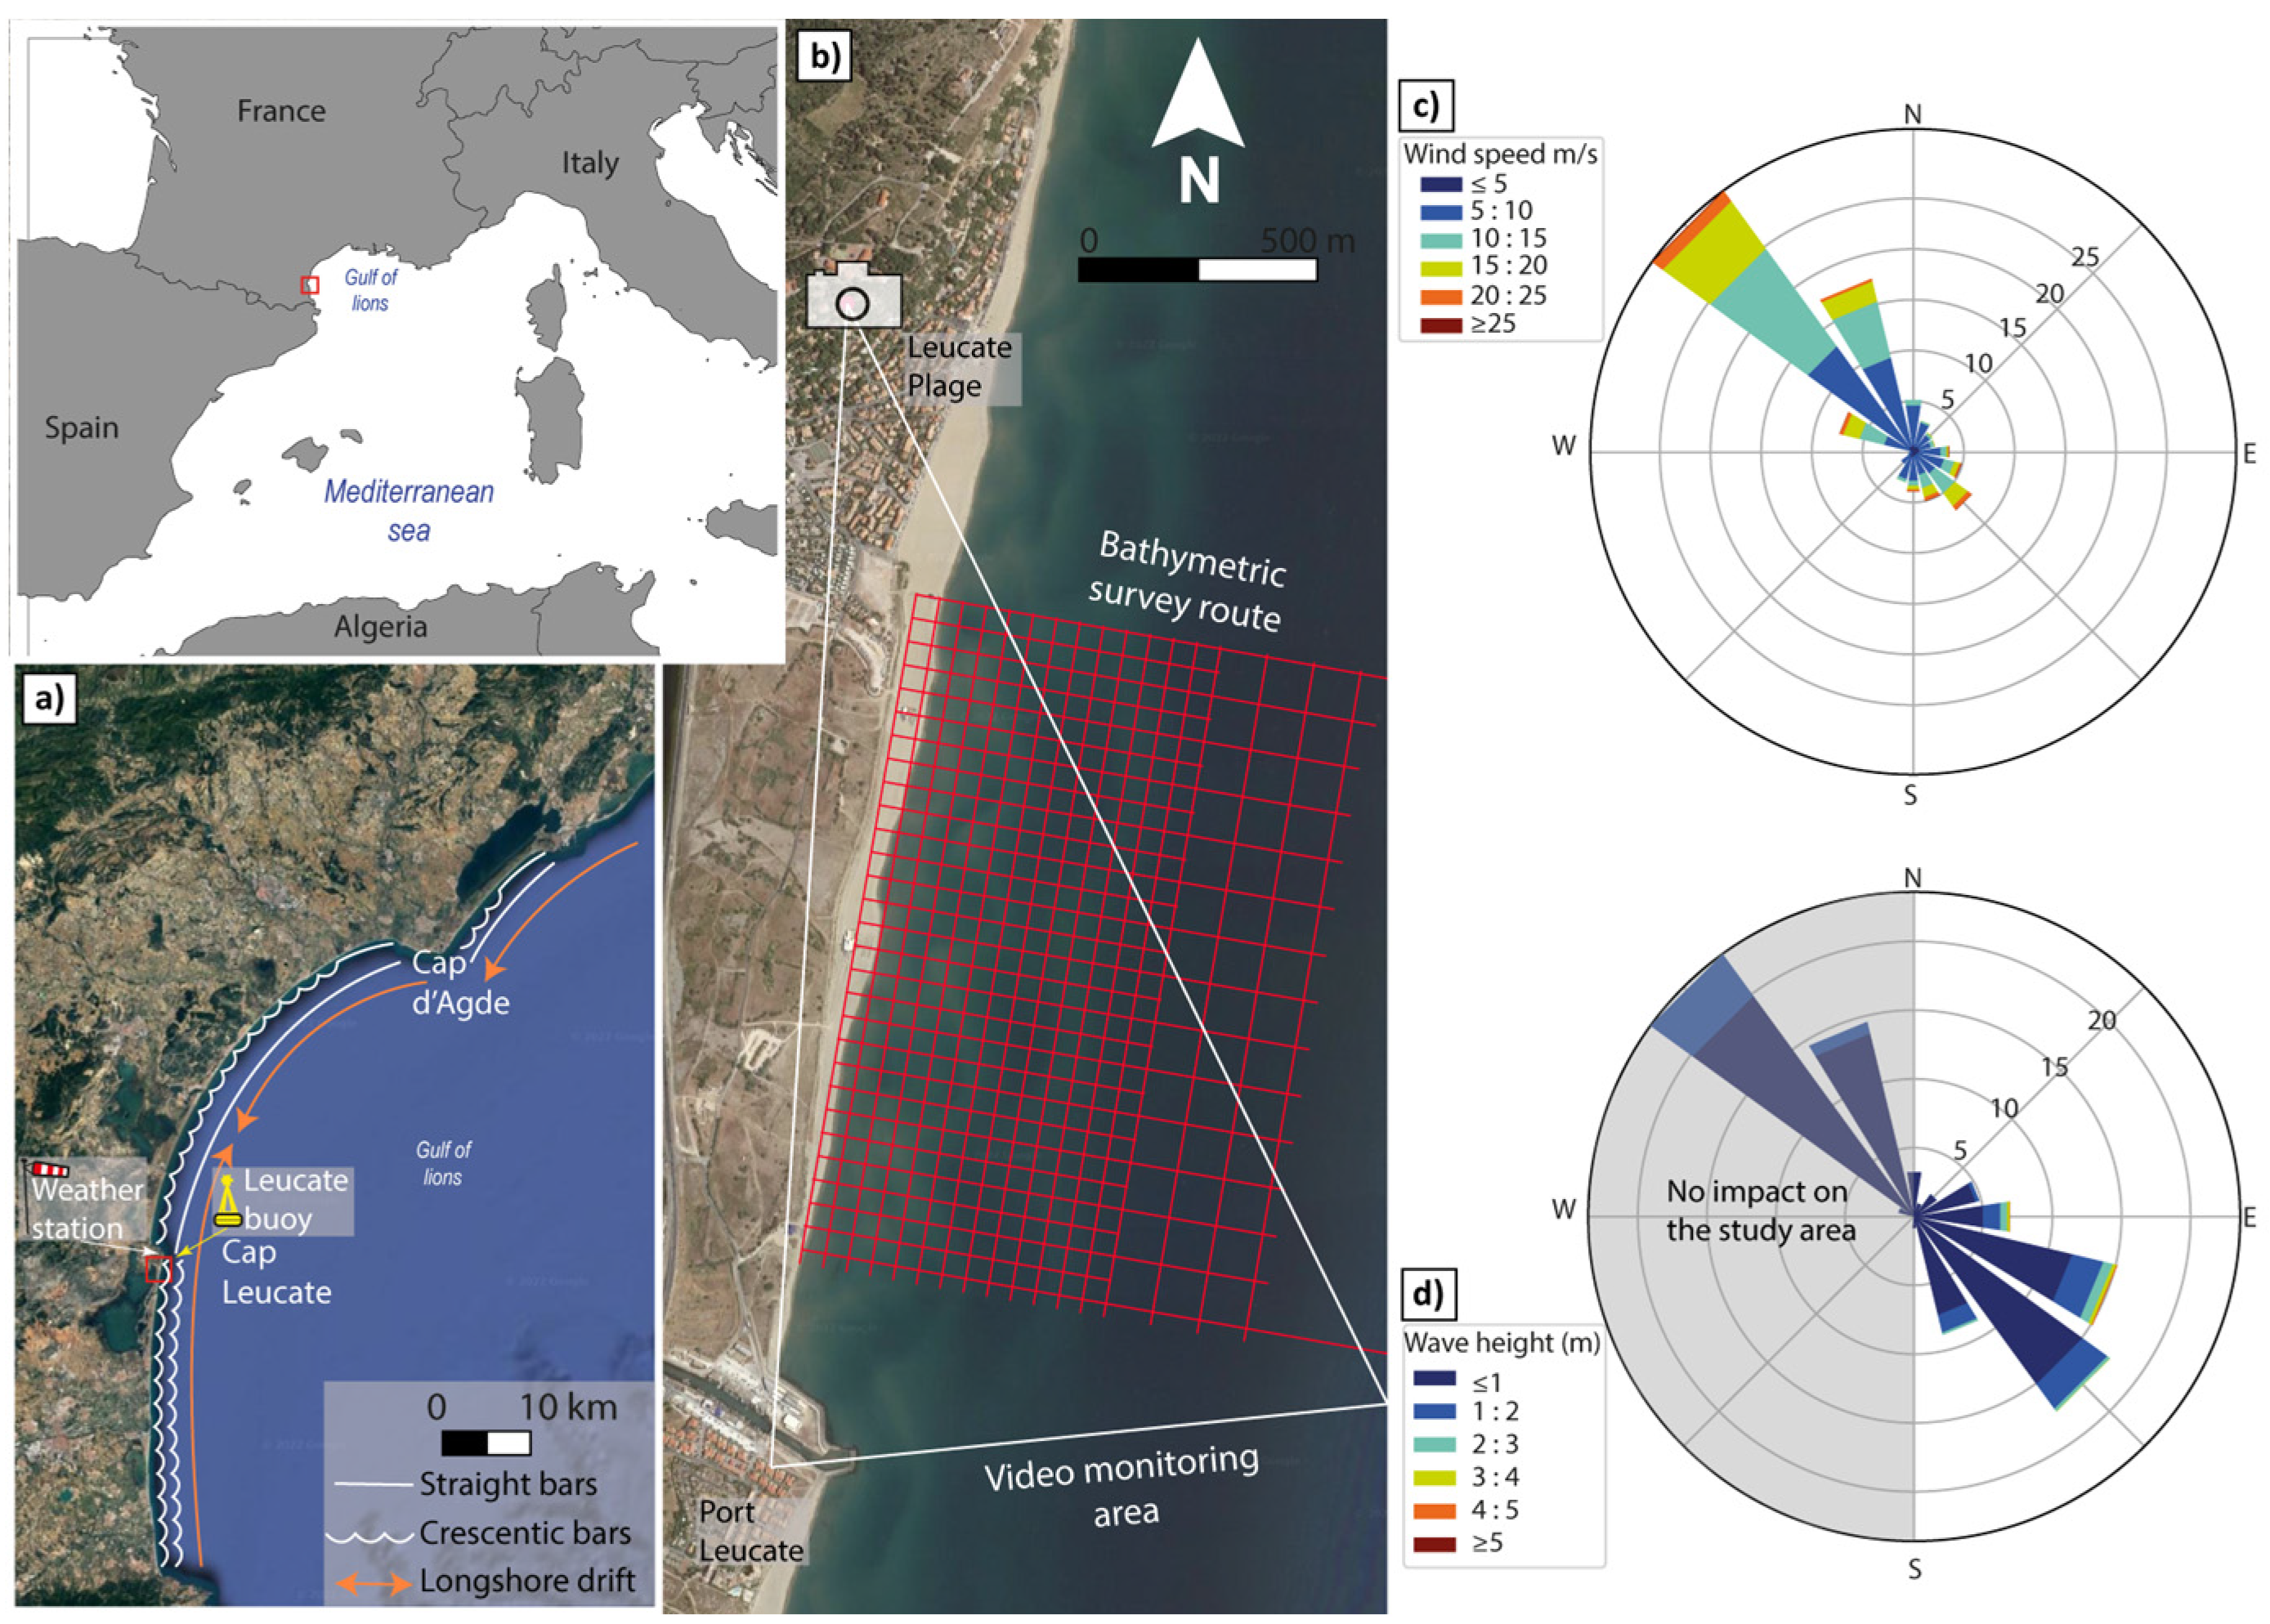
2. Study Site
3. Materials and Methods
3.1. Morphology of the Nearshore
3.1.1. Bathymetric Survey
3.1.2. Remote Sensing Data
3.1.3. Classification of Bar Typologies
3.1.4. Classification of Bar Coupling Types
3.2. Hydrodynamic and Meteorological Forcing
4. Results
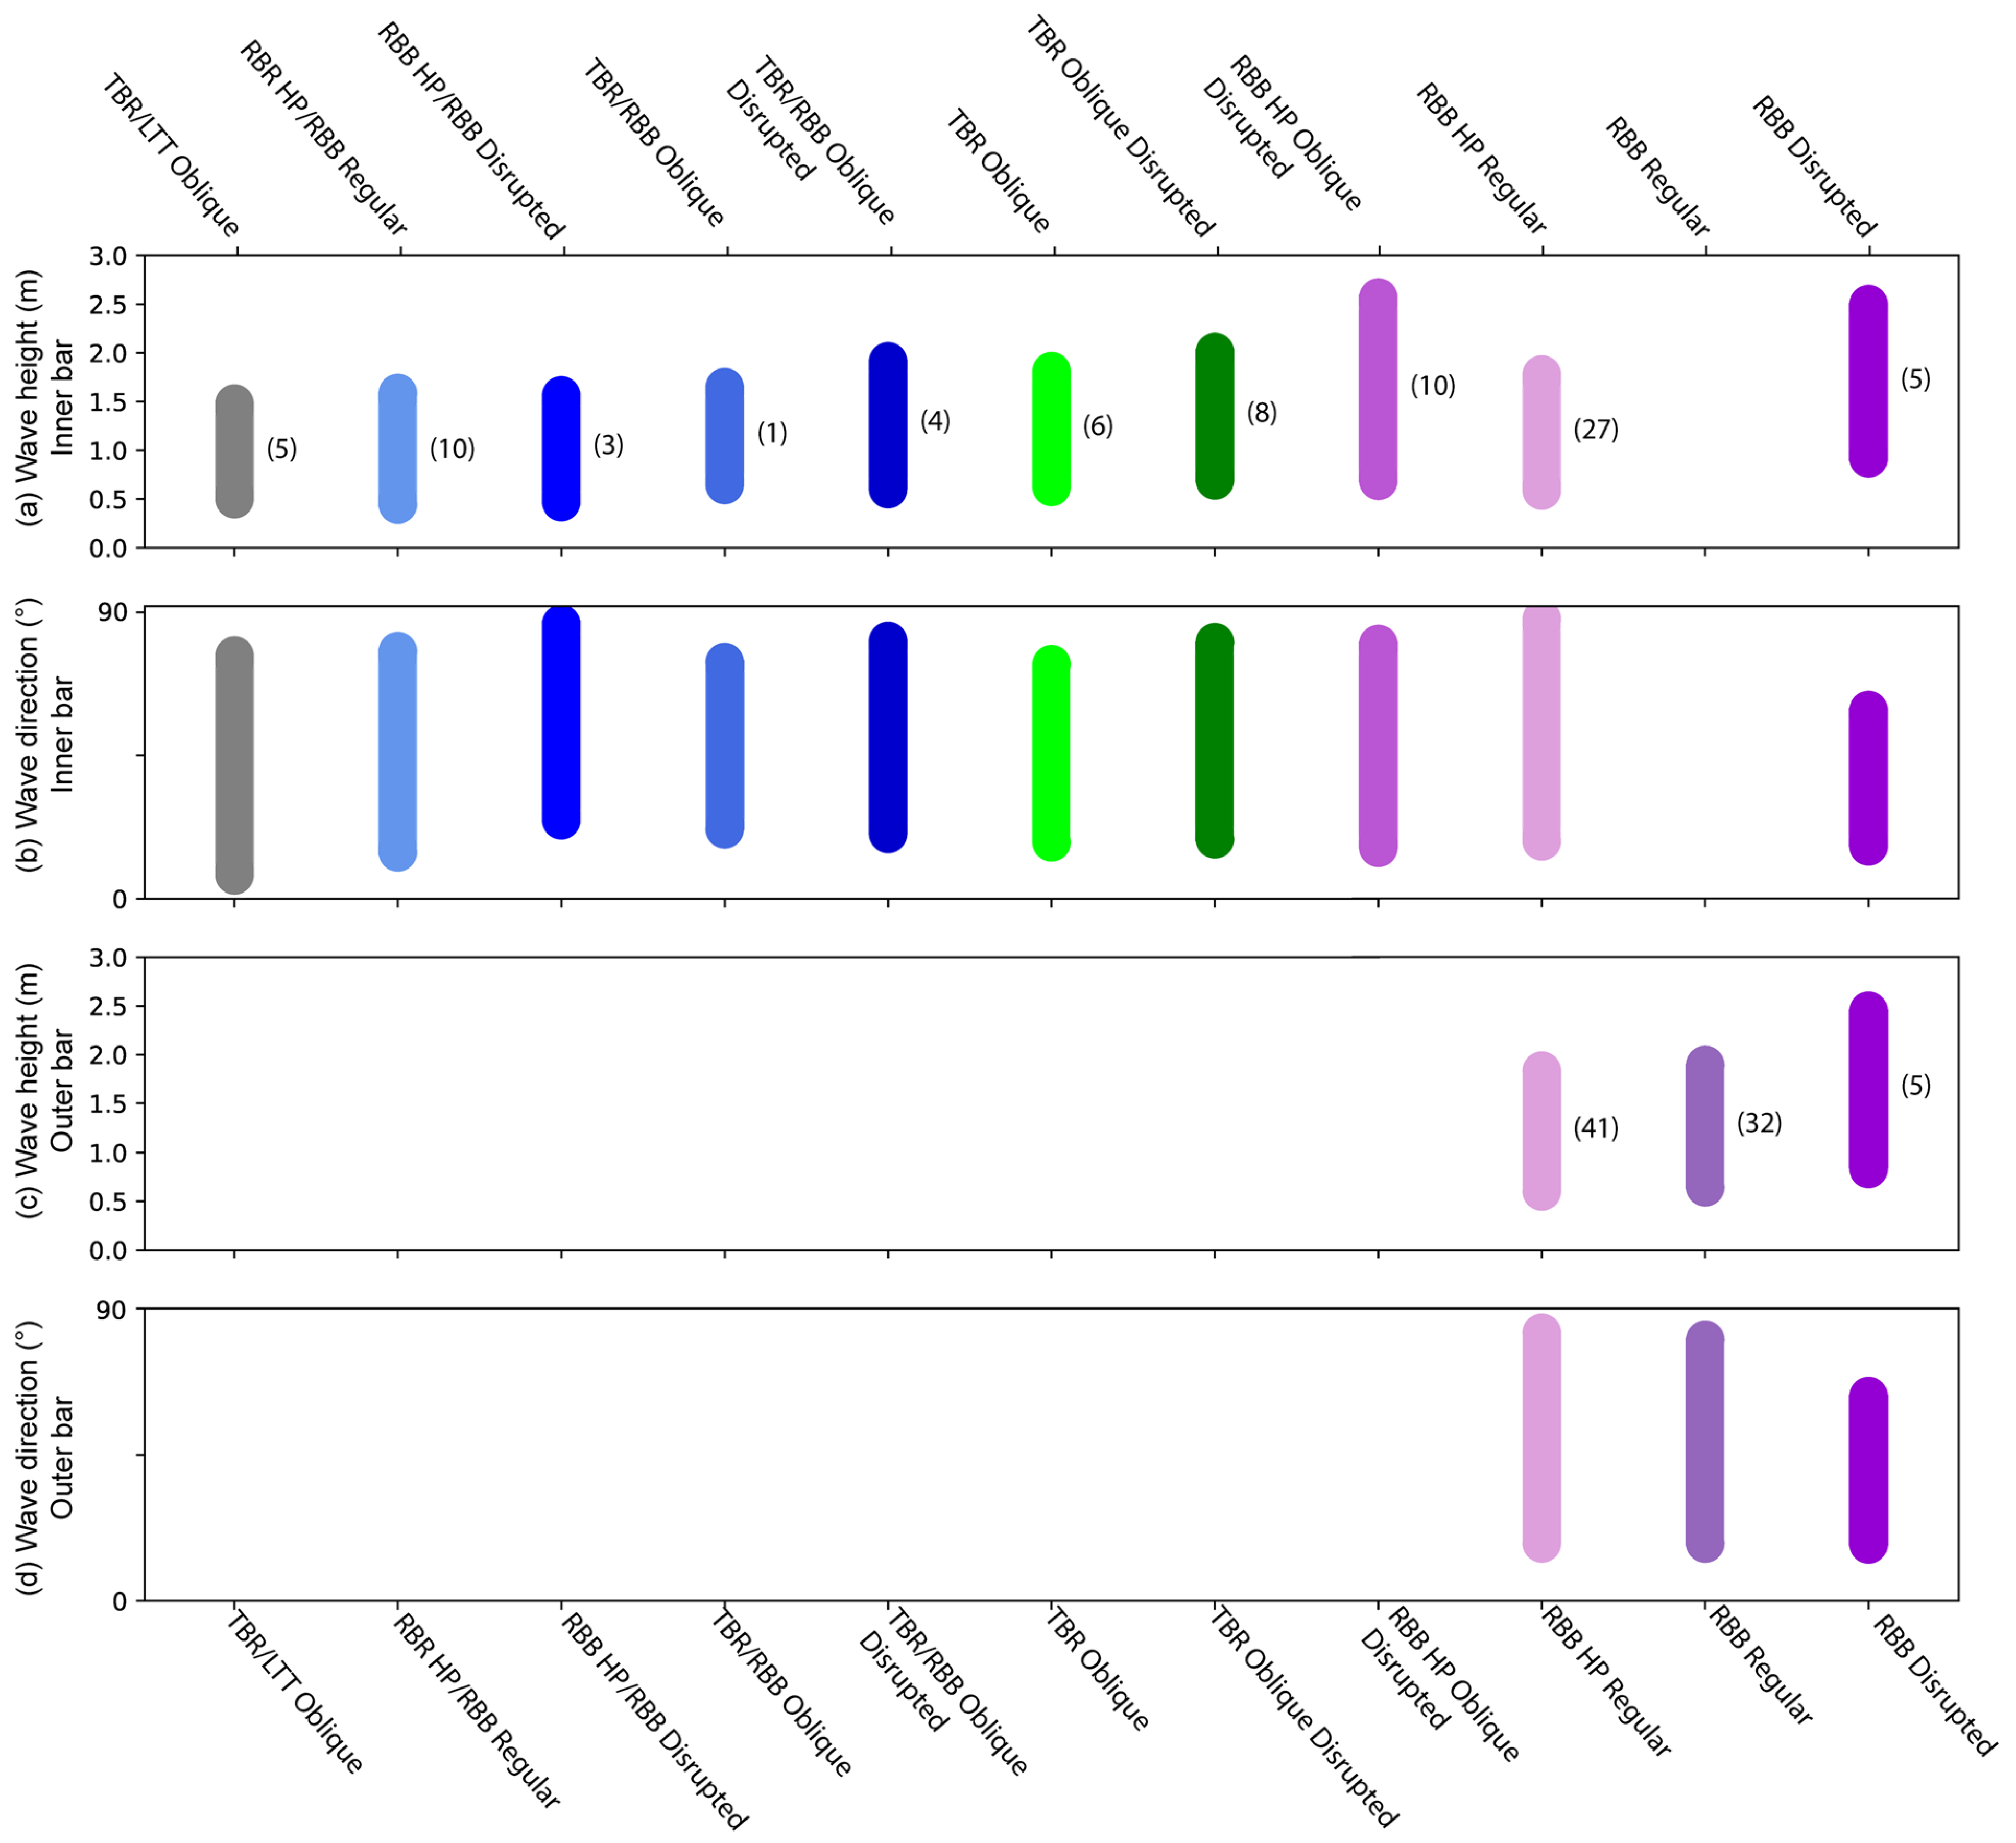
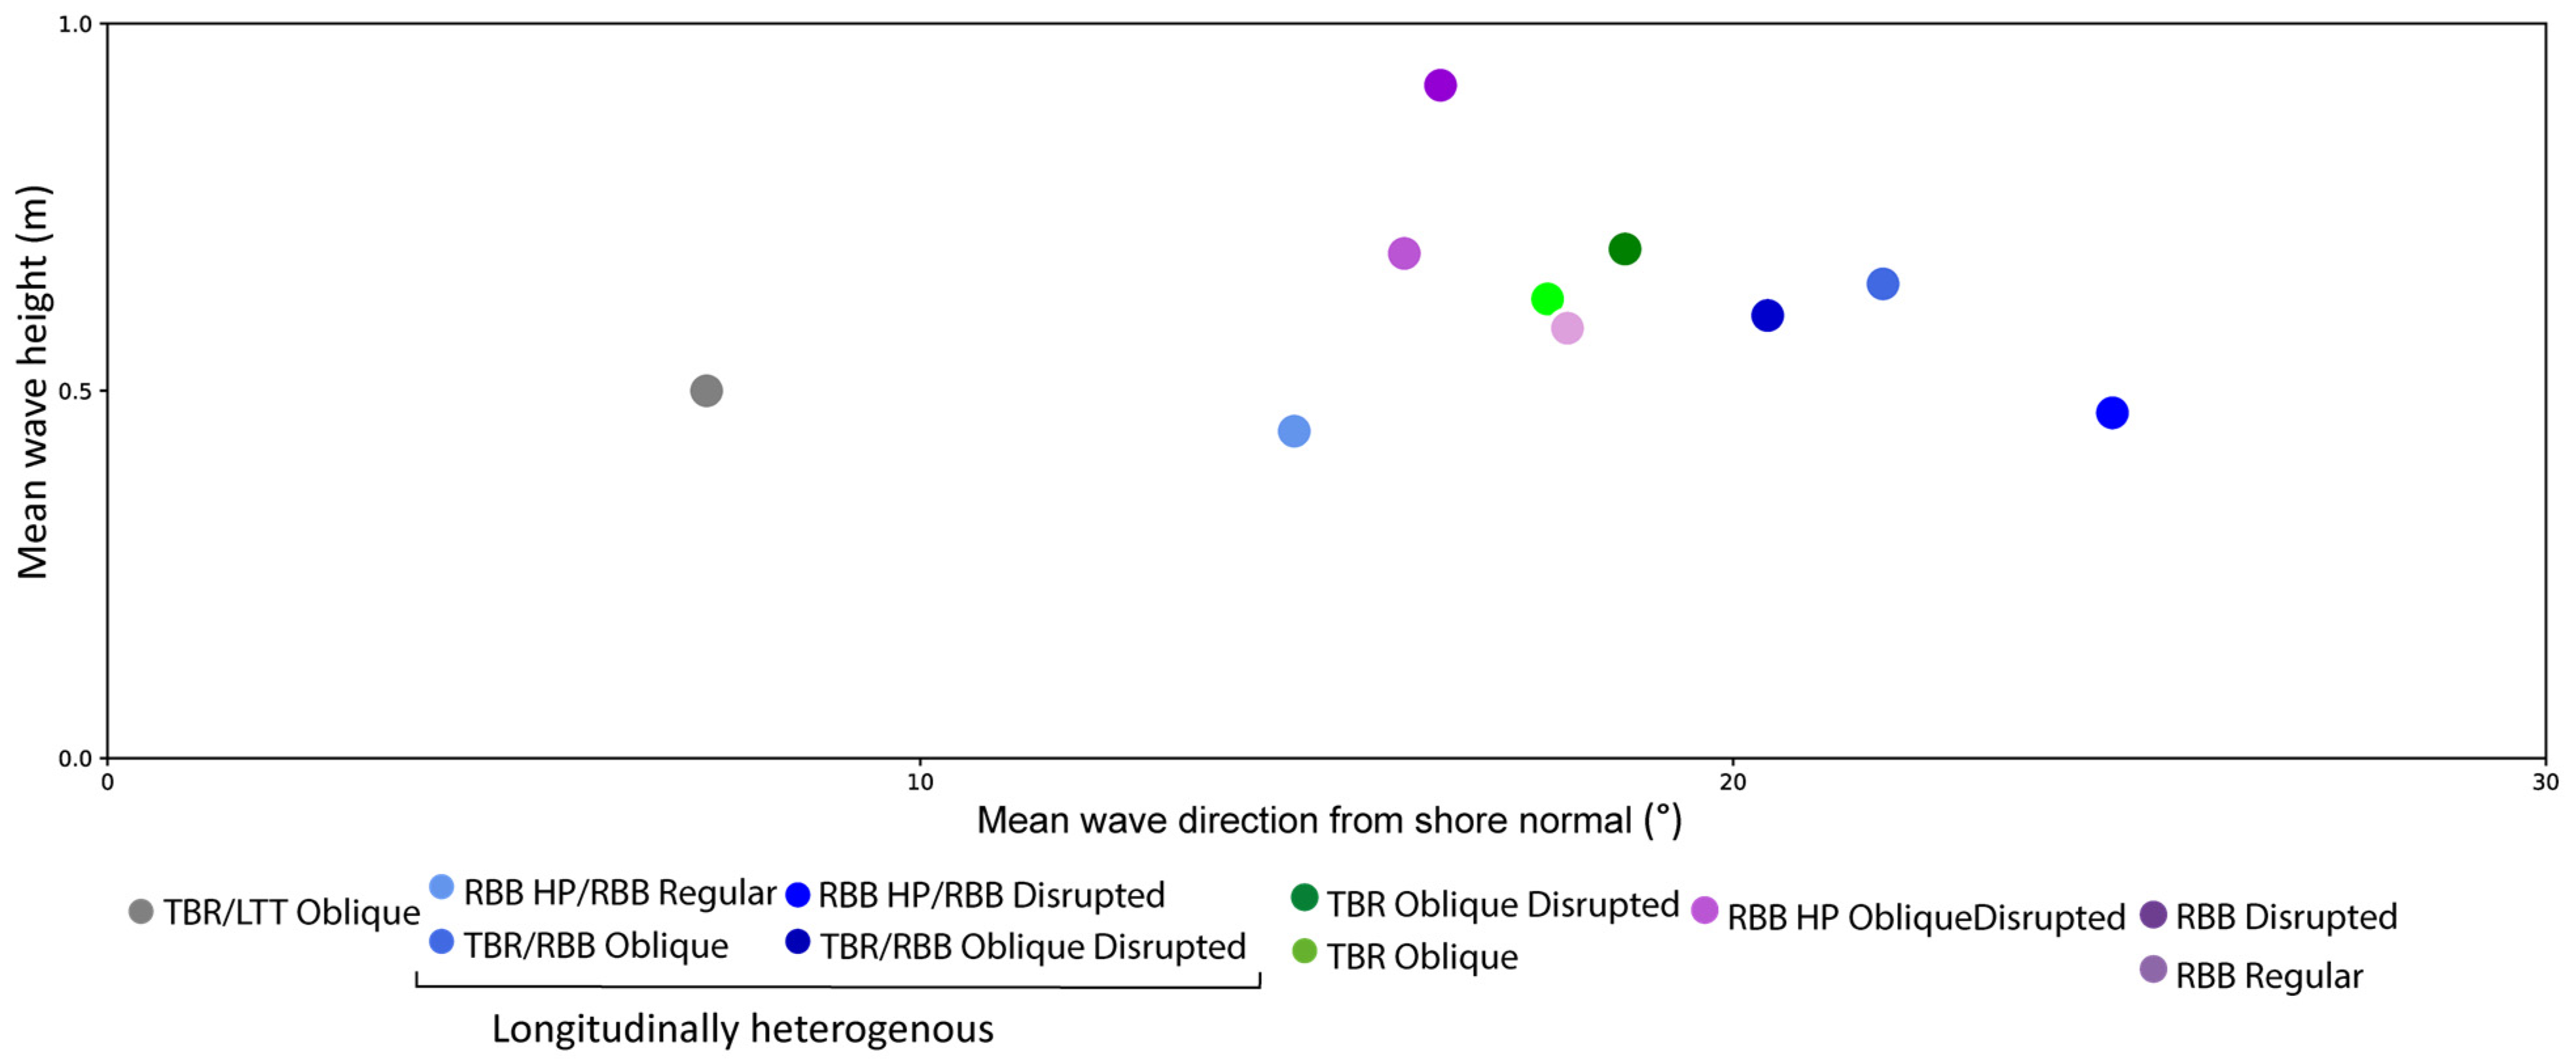
4.1. Nearshore Typologies Based on 20 Years of Observations
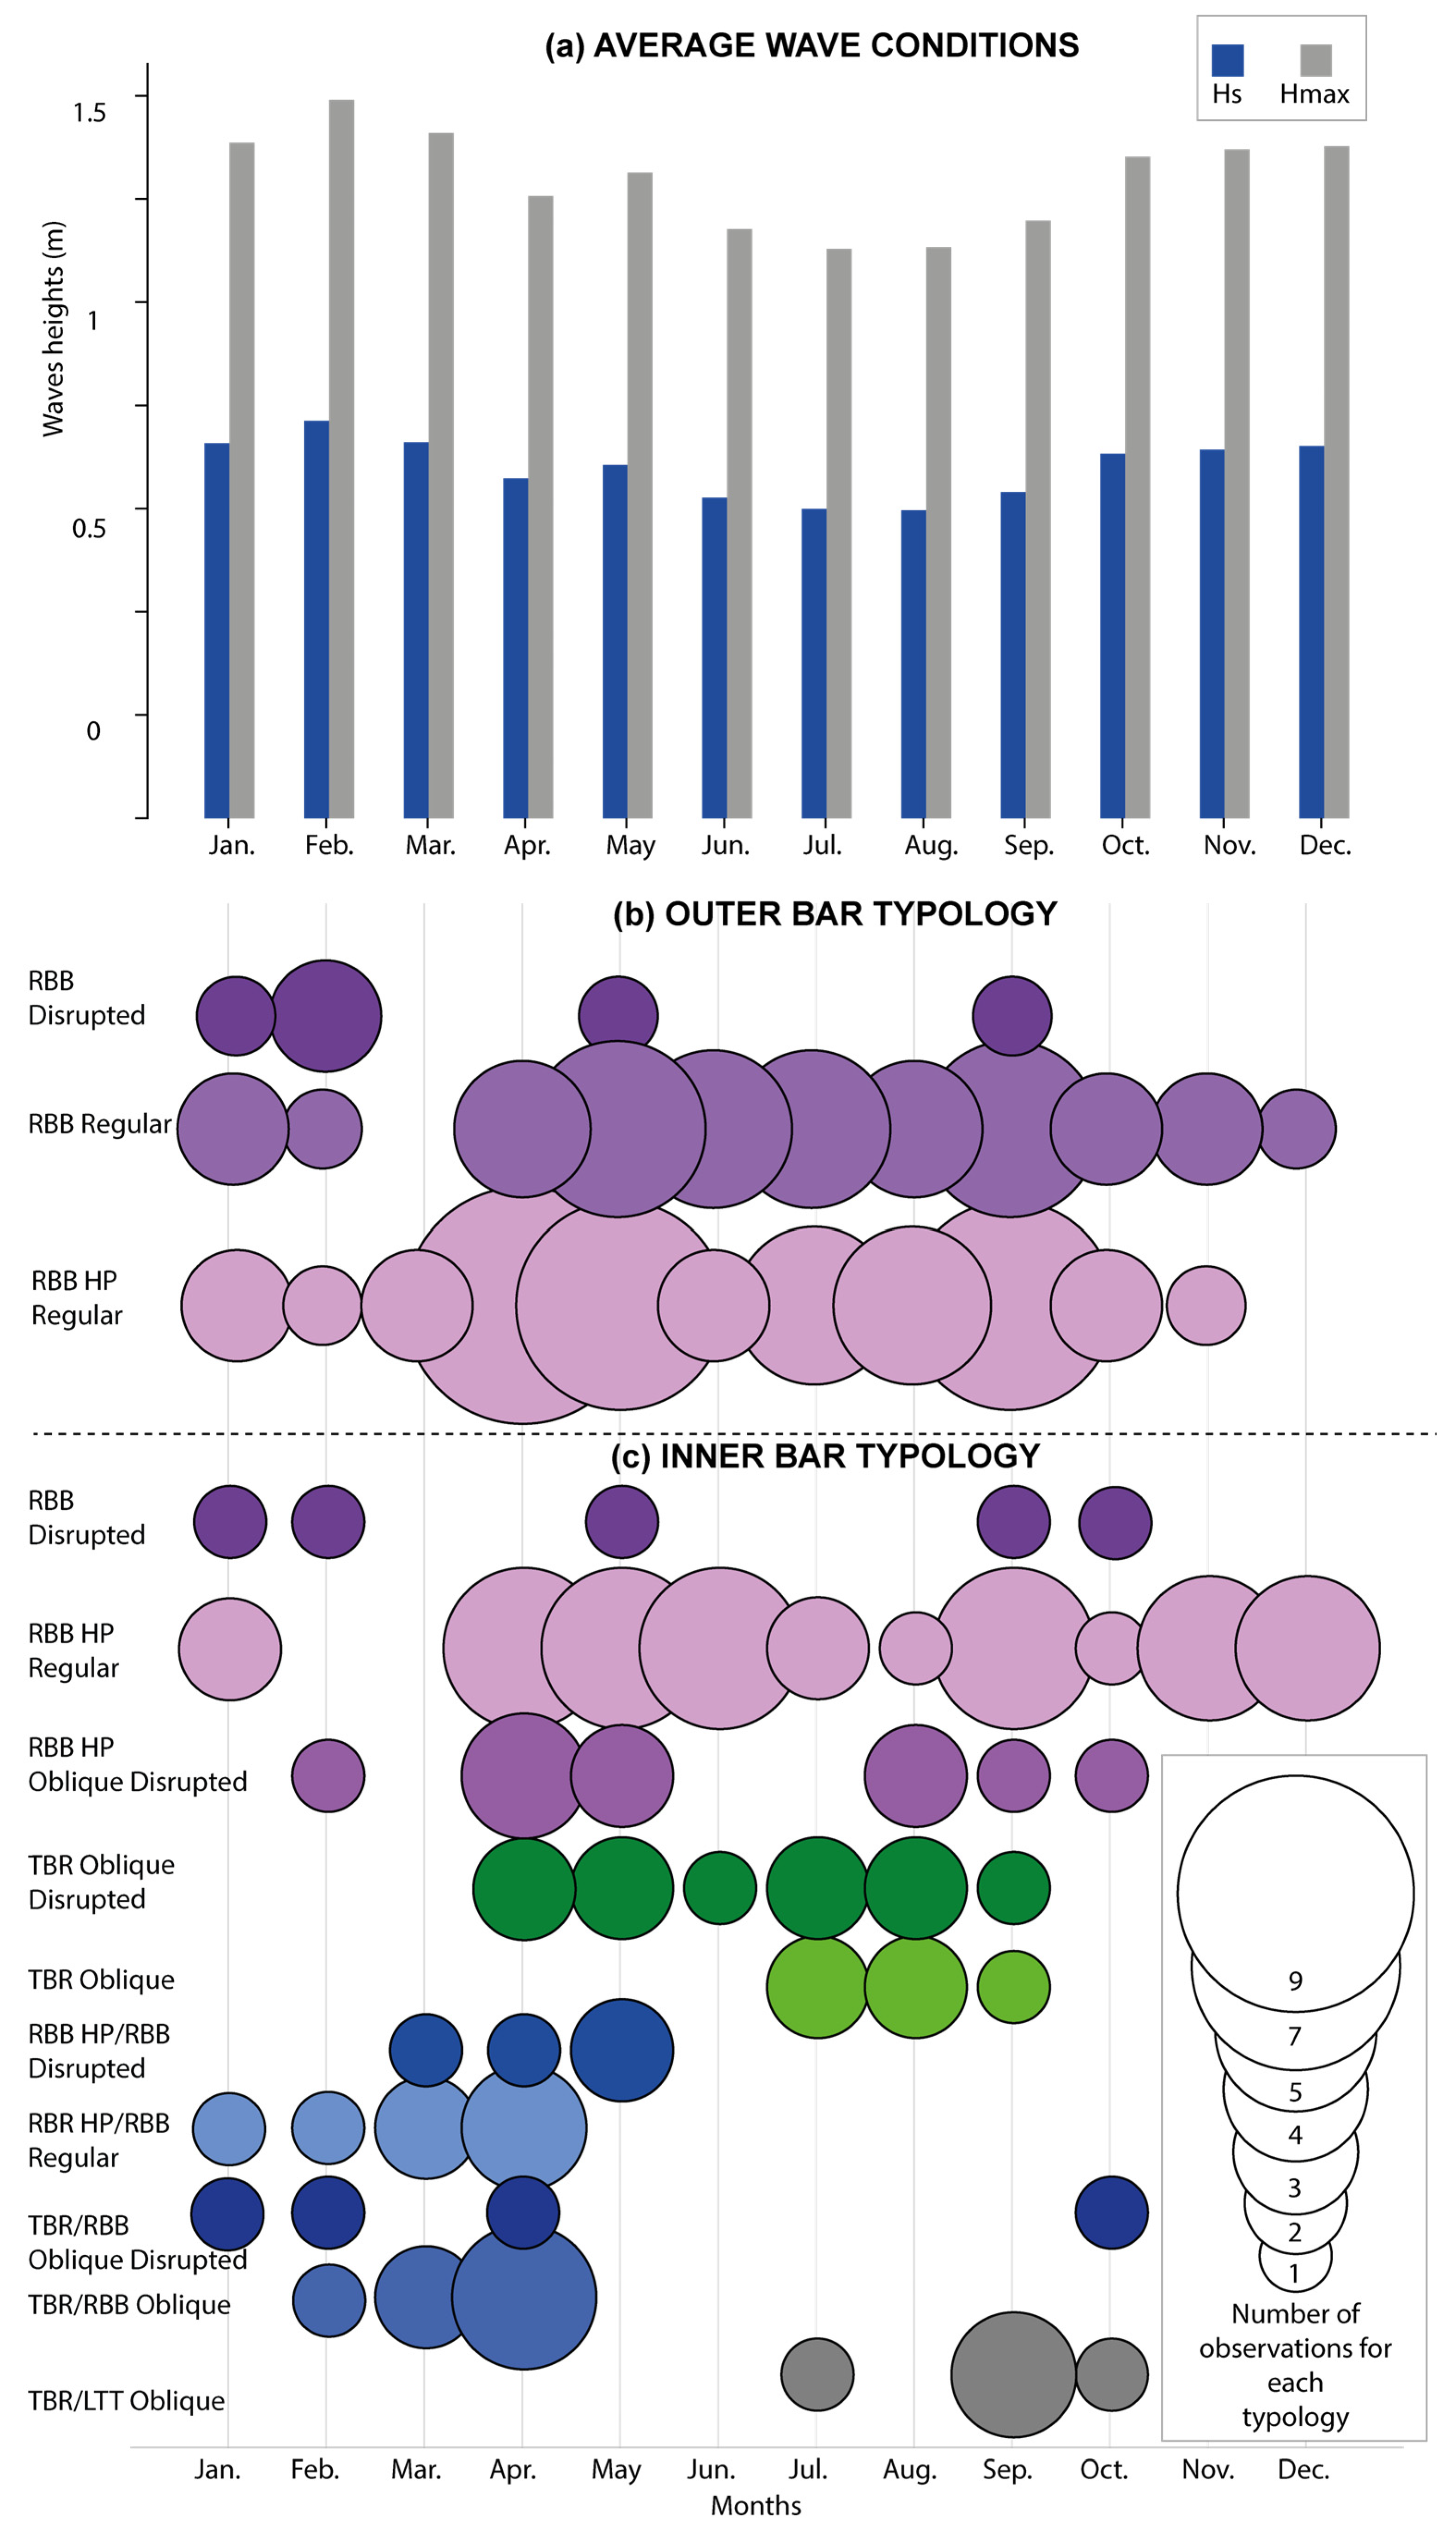
4.2. Temporal Evolutions of Bar Typologies on a Seasonal Scale
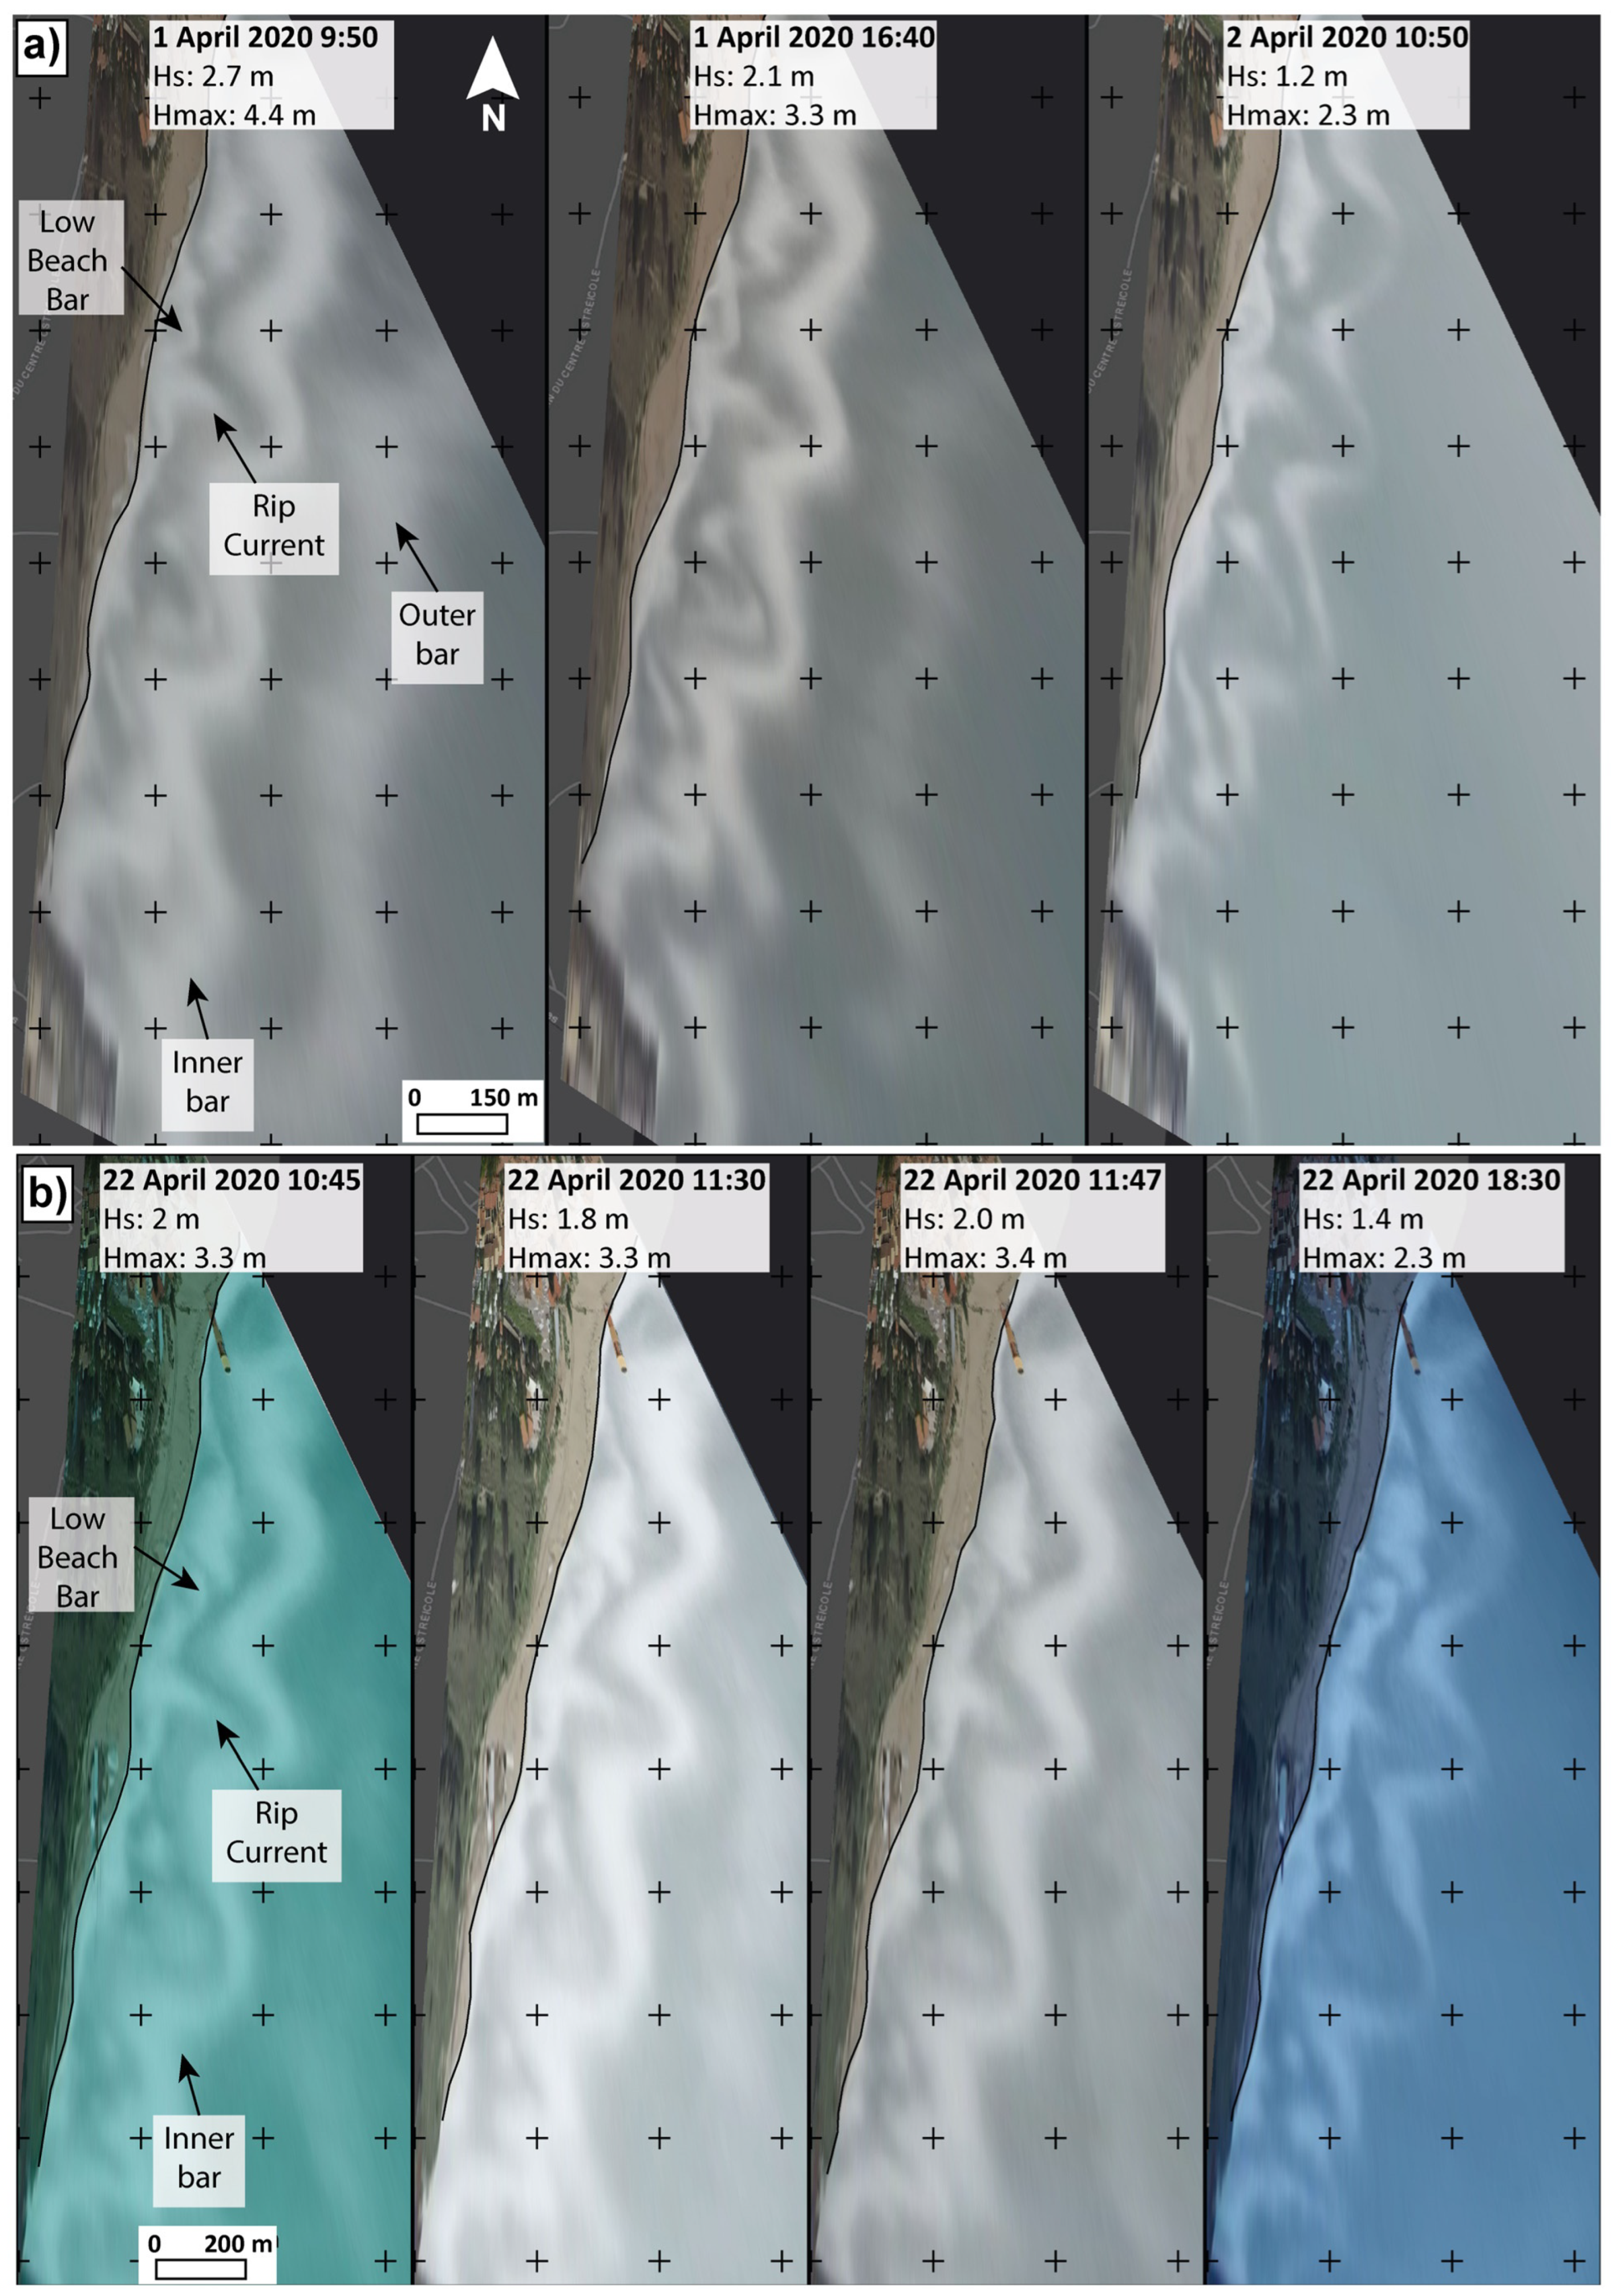
4.3. Temporal Evolutions of Bar Typologies at the Event Scale
- (1)
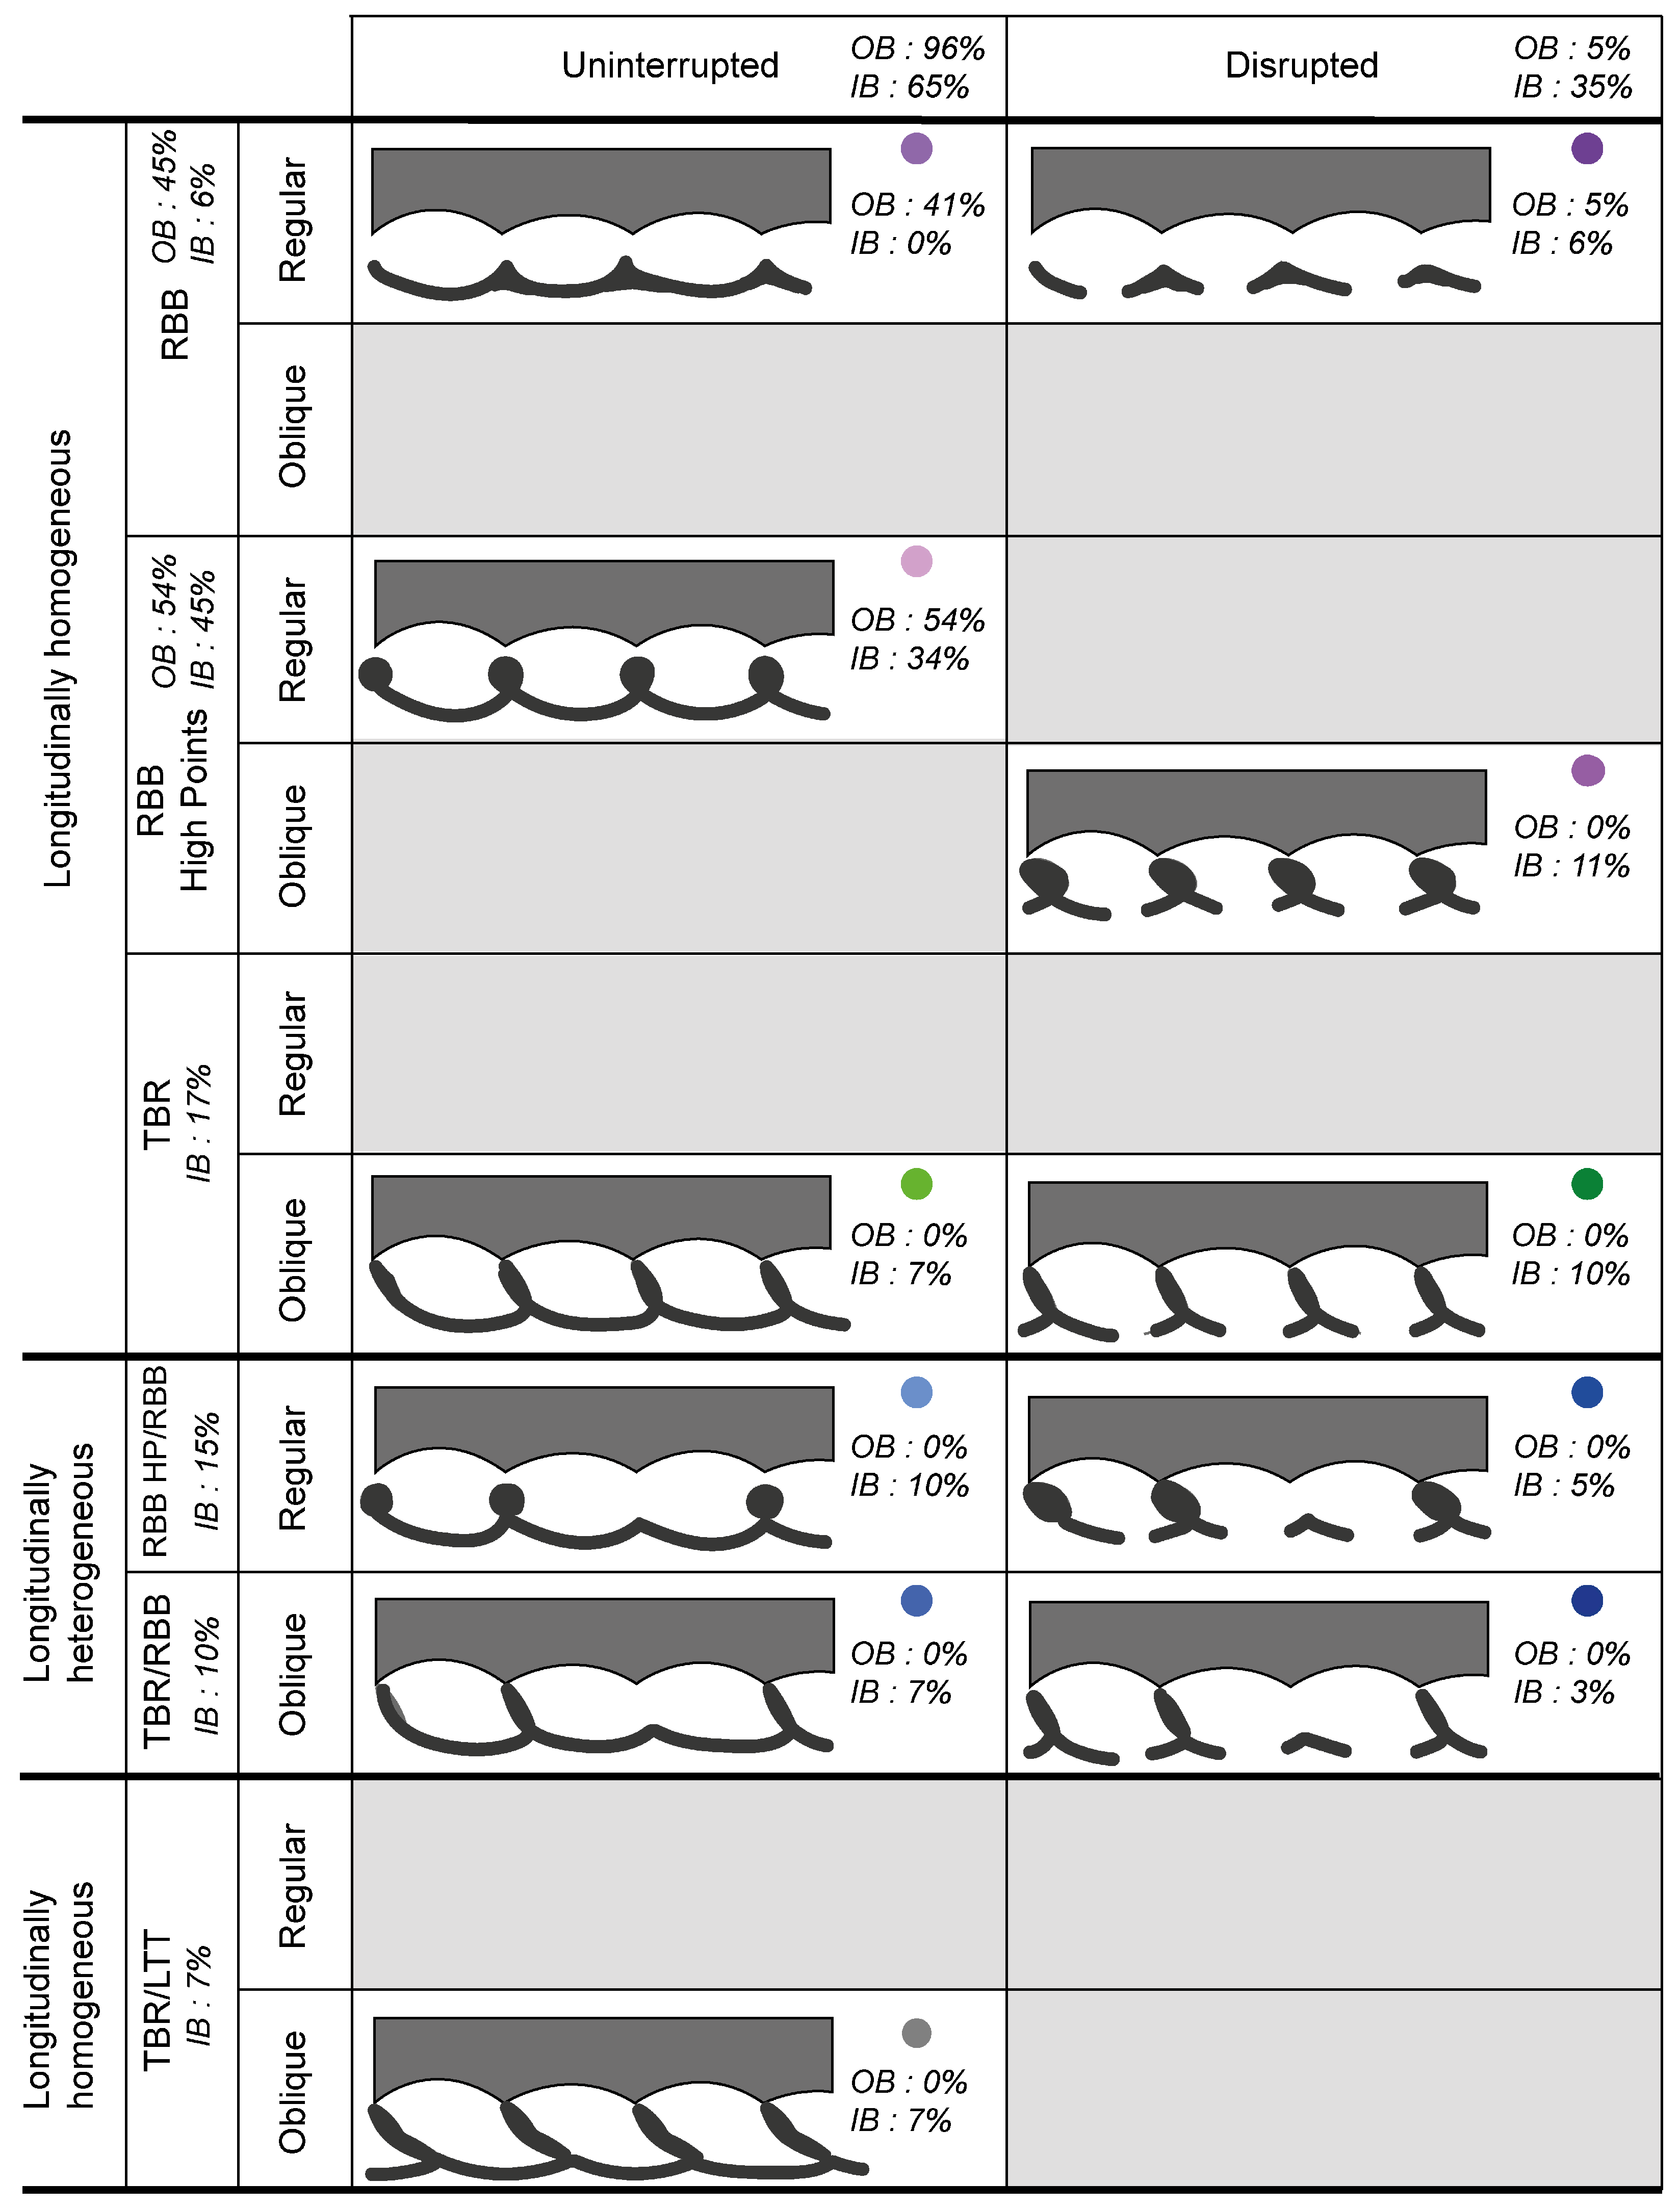
- The RBB HP Regular typology is the one for which the most changes have been observed, accounting for almost 34% of the total (27/79 observations, Table 1). This is also the most common initial typology and the most stable: on 11 occasions during the monitoring period, this bar morphology withstood various forcing conditions without changing typology (Figure 8a). In the case where a change of typology is observed, seventeen of the twenty-seven cases are within the RBB category, while in seven of the twenty-seven cases, the change is to the TBR category (Table 1).
- (2)
- Ten changes are observed towards the RBB HP Oblique Disrupted typology (nearly 13% of the total), which take place following energetic forcing conditions, with an average Hs between 1.5 and 3 m (Figure 8b). Once established, in six cases out of nine, these typologies will evolve towards a RBB HP regular typology (Table 1) by infilling of the rip channel.
- (3)
- The heterogeneous typology RBB HP/RBB Regular (Table 1 and Figure 8c) remains either within the heterogeneous category (four/ten observations) or changes into RBB (four/ten observations) or TBR Oblique (two/ten observations), especially when the waves are very oblique to the shoreline (>20°, Figure 8c).
4.4. Bar System Dynamics
4.4.1. Pattern Dynamics over 20 Years of Observation
4.4.2. Syn-Storm Evolution of Nearshore Bars
4.5. Coupling between Inner and Outer Bars
5. Discussion
5.1. Classification of Nearshore Bar Typology
5.2. Nearshore Morphodynamics
5.3. A Bar System Predominantly Characterized by RBB Typologies
5.4. Low Mobility of the Bar System
5.5. Development and Evolution of Rip Channels
6. Conclusions
Author Contributions
Funding
Institutional Review Board Statement
Informed Consent Statement
Data Availability Statement
Acknowledgments
Conflicts of Interest
References
- Wijnberg, K.M.; Kroon, A. Barred Beaches. Geomorphology 2002, 48, 103–120. [Google Scholar] [CrossRef]
- Lippmann, T.C.; Holman, R.A. The Spatial and Temporal Variability of Sand Bar Morphology. J. Geophys. Res. 1990, 95, 11575. [Google Scholar] [CrossRef]
- Phillips, M.S.; Harley, M.D.; Turner, I.L.; Splinter, K.D.; Cox, R.J. Shoreline Recovery on Wave-Dominated Sandy Coastlines: The Role of Sandbar Morphodynamics and Nearshore Wave Parameters. Mar. Geol. 2017, 385, 146–159. [Google Scholar] [CrossRef]
- Angnuureng, D.B.; Almar, R.; Senechal, N.; Castelle, B.; Addo, K.A.; Marieu, V.; Ranasinghe, R. Shoreline Resilience to Individual Storms and Storm Clusters on a Meso-Macrotidal Barred Beach. Geomorphology 2017, 290, 265–276. [Google Scholar] [CrossRef]
- Wright, L.D.; Short, A.D. Morphodynamic Variability of Surf Zones and Beaches: A Synthesis. Mar. Geol. 1984, 56, 93–118. [Google Scholar] [CrossRef]
- Short, A.D.; Aagaard, T. Single and Multi-Bar Beach Change Models. J. Coast. Res. 1993, 141–157. [Google Scholar]
- Short, A.; Woodroffe, C. The Coast of Australia; Faculty of Science–Papers (Archive); Cambridge University Press: Cambridge, UK, 2009. [Google Scholar]
- Castelle, B.; Bonneton, P.; Dupuis, H.; Sénéchal, N. Double Bar Beach Dynamics on the High-Energy Meso-Macrotidal French Aquitanian Coast: A Review. Mar. Geol. 2007, 245, 141–159. [Google Scholar] [CrossRef]
- Wijnberg, K.; Holman, R. Video-Observation of Shoreward Propagating Accretionary Waves. In Proceedings of the RCEM 2007, Enschede, The Netherlands, 17–21 September 2007; Volume 2. [Google Scholar] [CrossRef]
- Almar, R.; Castelle, B.; Ruessink, B.G.; Sénéchal, N.; Bonneton, P.; Marieu, V. Two- and Three-Dimensional Double-Sandbar System Behaviour under Intense Wave Forcing and a Meso–Macro Tidal Range. Cont. Shelf Res. 2010, 30, 781–792. [Google Scholar] [CrossRef]
- Castelle, B.; Ruessink, B.G.; Bonneton, P.; Marieu, V.; Bruneau, N.; Price, T.D. Coupling Mechanisms in Double Sandbar Systems. Part 1: Patterns and Physical Explanation. Earth Surf. Process. Landf. 2010, 35, 476–486. [Google Scholar] [CrossRef]
- Ferrer, P.; Certain, R.; Barusseau, J.P.; Gervais, M. Conceptual Modelling of a Double Crescentic Barred Coast (Leucate Beach, France). In Proceedings of the Coastal Dynamics 2009: Impacts of Human Activities on Dynamic Coastal Processes (with CD-ROM); World Scientific: Singapore, 2009; pp. 1–13. [Google Scholar]
- Aleman, N.; Robin, N.; Certain, R.; Vanroye, C.; Barusseau, J.P.; Bouchette, F. Typology of Nearshore Bars in the Gulf of Lions (France) Using LIDAR Technology. J. Coast. Res. 2011, 64, 721–725. [Google Scholar]
- Aleman, N.; Certain, R.; Robin, N.; Barusseau, J.-P. Morphodynamics of Slightly Oblique Nearshore Bars and Their Relationship with the Cycle of Net Offshore Migration. Mar. Geol. 2017, 392, 41–52. [Google Scholar] [CrossRef]
- McCarroll, R.J.; Brander, R.W.; Turner, I.L.; Leeuwen, B.V. Shoreface Storm Morphodynamics and Mega-Rip Evolution at an Embayed Beach: Bondi Beach, NSW, Australia. Cont. Shelf Res. 2016, 116, 74–88. [Google Scholar] [CrossRef]
- Komar, P.D. Beach Processes and Sedimentation; Prentice-Hall: Englewood Cliffs, NJ, USA, 1976; ISBN 978-0-13-072595-0. [Google Scholar]
- Price, T.D.; Ruessink, B.G. State Dynamics of a Double Sandbar System. Cont. Shelf Res. 2011, 31, 659–674. [Google Scholar] [CrossRef]
- Nnafie, A.; van Andel, N.; de Swart, H. Modelling the Impact of a Time-Varying Wave Angle on the Nonlinear Evolution of Sand Bars in the Surf Zone. Earth Surf. Process. Landf. 2020, 45, 2603–2612. [Google Scholar] [CrossRef]
- Castelle, B.; Masselink, G. Morphodynamics of Wave-Dominated Beaches. Camb. Prism. Coast. Futures 2022, 1, e1. [Google Scholar] [CrossRef]
- Holman, R.; Symonds, G.; Thornton, E.; Ranasinghe, R. Rip Spacing and Persistence on an Embayed Beach. J. Geophys. Res. 2006, 111. [Google Scholar] [CrossRef]
- van Enckevort, I.M.J. Observations of Nearshore Crescentic Sandbars. J. Geophys. Res. 2004, 109, C06028. [Google Scholar] [CrossRef]
- Ojeda, E.; Guillén, J.; Ribas, F. Dynamics of Single-Barred Embayed Beaches. Mar. Geol. 2011, 280, 76–90. [Google Scholar] [CrossRef]
- de Swart, R.; Ribas, F.; Calvete, D.; Simarro, G.; Guillen, J. Observations of Megacusp Dynamics and Their Coupling with Crescentic Bars at an Open, Fetch-limited Beach. Earth Surf. Process. Landf. 2022, 47, 3180–3198. [Google Scholar] [CrossRef]
- Goldsmith, V.; Bowman, D.; Kiley, K. Sequential Stage Development of Crescentic Bars: Hahoterim Beach, Southeastern Mediterranean. J. Sediment. Res. 1982, 52, 233–249. [Google Scholar] [CrossRef]
- Armaroli, C.; Ciavola, P. Dynamics of a Nearshore Bar System in the Northern Adriatic: A Video-Based Morphological Classification. Geomorphology 2011, 126, 201–216. [Google Scholar] [CrossRef]
- Parlagreco, L.; Melito, L.; Devoti, S.; Perugini, E.; Zitti, G.; Brocchini, M. Monitoring for Coastal Resilience: Preliminary Data from Five Italian Sandy Beaches. Sensors 2019, 19, 1854. [Google Scholar] [CrossRef]
- Melito, L.; Parlagreco, L.; Perugini, E.; Postacchini, M.; Devoti, S.; Soldini, L.; Zitti, G.; Liberti, L.; Brocchini, M. Sandbar Dynamics in Microtidal Environments: Migration Patterns in Unprotected and Bounded Beaches. Coast. Eng. 2020, 161, 103768. [Google Scholar] [CrossRef]
- Fanini, L.; Defeo, O.; Elliott, M. Advances in Sandy Beach Research—Local and Global Perspectives. Estuar. Coast. Shelf Sci. 2020, 234, 106646. [Google Scholar] [CrossRef]
- Power, H.E.; Pomeroy, A.W.M.; Kinsela, M.A.; Murray, T.P. Research Priorities for Coastal Geoscience and Engineering: A Collaborative Exercise in Priority Setting From Australia. Front. Mar. Sci. 2021, 8, 252. [Google Scholar] [CrossRef]
- Brocchini, M. Wave-forced Dynamics in the Nearshore River Mouths, and Swash Zones. Earth Surf. Process. Landf. 2020, 45, 75–95. [Google Scholar] [CrossRef]
- Roelvink, J.A.; Stive, M.J.F. Bar-Generating Cross-Shore Flow Mechanisms on a Beach. J. Geophys. Res. Ocean. 1989, 94, 4785–4800. [Google Scholar] [CrossRef]
- Gallagher, E.L.; Elgar, S.; Guza, R.T. Observations of Sand Bar Evolution on a Natural Beach. J. Geophys. Res. 1998, 103, 3203–3215. [Google Scholar] [CrossRef]
- Ruessink, B.G.; Kroon, A. The Behaviour of a Multiple Bar System in the Nearshore Zone of Terschelling, The Netherlands: 1965–1993. Mar. Geol. 1994, 121, 187–197. [Google Scholar] [CrossRef]
- Aleman, N.; Robin, N.; Certain, R.; Barusseau, J.-P.; Gervais, M. Net Offshore Bar Migration Variability at a Regional Scale: Inter-Site Comparison (Languedoc-Roussillon, France). J. Coast. Res. 2013, 165, 1715–1720. [Google Scholar] [CrossRef]
- Shand, R.D.; Bailey, D.G. A Review of Net Offshore Migration with Photographic Illustrations from Wanganui. J. Coast. Res. 1999, 15, 365–378. [Google Scholar]
- Ruessink, B.G.; Pape, L.; Turner, I.L. Daily to Interannual Cross-Shore Sandbar Migration: Observations from a Multiple Sandbar System. Cont. Shelf Res. 2009, 29, 1663–1677. [Google Scholar] [CrossRef]
- Certain, R.; Barusseau, J.-P. Conceptual Modelling of Sand Bars Morphodynamics for a Microtidal Beach (Sète, France). Bull. Société Géologique Fr. 2005, 176, 343–354. [Google Scholar] [CrossRef]
- Coco, G.; Murray, B.; Ashton, A.D. Chapter 13—Rhythmic Patterns in the Surfzone. In Sandy Beach Morphodynamics; Elsevier: Amsterdam, The Netherlands, 2020; pp. 297–312. [Google Scholar]
- Calvete, D.; Dodd, N.; Falqués, A.; van Leeuwen, S. Morphological Development of Rip Channel Systems: Normal and near-Normal Wave Incidence. J. Geophys. Res 2005, 110. [Google Scholar] [CrossRef]
- Castelle, B.; Ruessink, B.G. Modeling Formation and Subsequent Nonlinear Evolution of Rip Channels: Time-Varying versus Time-Invariant Wave Forcing. J. Geophys. Res. Earth Surf. 2011, 116. [Google Scholar] [CrossRef]
- Deigaard, R.; Drønen, N.K.; Fredsøe, J.; Hjelmager Jensen, J.; Jørgensen, M.P. A Morphological Stability Analysis for a Long Straight Barred Coast. Coast. Eng. 1999, 36, 171–195. [Google Scholar] [CrossRef]
- Garnier, R.; Calvete, D.; Falqués, A.; Dodd, N. Modelling the Formation and the Long-Term Behavior of Rip Channel Systems from the Deformation of a Longshore Bar. J. Geophys. Res. Ocean. 2008, 113. [Google Scholar] [CrossRef]
- Reniers, A.J.H.M.; Roelvink, J.A.; Thornton, E.B. Morphodynamic Modeling of an Embayed Beach under Wave Group Forcing. J. Geophys. Res. Ocean. 2004, 109. [Google Scholar] [CrossRef]
- Smit, M.W.J.; Reniers, A.; Ruessink, G.; Roelvink, D.J.A. The Morphological Response of a Nearshore Double Sandbar System to Constant Wave Forcing. Coast. Eng. 2008, 55, 761–770. [Google Scholar] [CrossRef]
- Contardo, S.; Symonds, G. Sandbar Straightening under Wind-Sea and Swell Forcing. Mar. Geol. 2015, 368, 25–41. [Google Scholar] [CrossRef]
- Garnier, R.; Falqués, A.; Calvete, D.; Thiébot, J.; Ribas, F. A Mechanism for Sandbar Straightening by Oblique Wave Incidence. Geophys. Res. Lett. 2013, 40, 2726–2730. [Google Scholar] [CrossRef]
- Calvete, D.; Coco, G.; Falqués, A.; Dodd, N. (Un)Predictability in Rip Channel Systems. Geophys. Res. Lett. 2007, 34. [Google Scholar] [CrossRef]
- Smit, M.W.J.; Reniers, A.J.H.M.; Stive, M.J.F. Role of Morphological Variability in the Evolution of Nearshore Sandbars. Coast. Eng. 2012, 69, 19–28. [Google Scholar] [CrossRef]
- Tiessen, M.; Dodd, N.; Garnier, R. Development of Crescentic Bars for a Periodically Perturbed Initial Bathymetry. J. Geophys. Res. 2011, 116, 4016. [Google Scholar] [CrossRef]
- Castelle, B.; Bonneton, P.; Butel, R. Modélisation du festonnage des barres sableuses d’avant-côte: Application à la côte aquitaine, France. Comptes Rendus Geosci. 2006, 338, 795–801. [Google Scholar] [CrossRef]
- de Swart, R.L.; Ribas, F.; Simarro, G.; Guillén, J.; Calvete, D. The Role of Bathymetry and Directional Wave Conditions on Observed Crescentic Bar Dynamics. Earth Surf. Process. Landf. 2021, 46, 3252–3270. [Google Scholar] [CrossRef]
- Dubarbier, B.; Castelle, B.; Ruessink, G.; Marieu, V. Mechanisms Controlling the Complete Accretionary Beach State Sequence. Geophys. Res. Lett. 2017, 44, 5645–5654. [Google Scholar] [CrossRef]
- Marchesiello, P.; Chauchat, J.; Shafiei, H.; Almar, R.; Benshila, R.; Dumas, F.; Debreu, L. 3D Wave-Resolving Simulation of Sandbar Migration. Ocean Model. 2022, 180, 102127. [Google Scholar] [CrossRef]
- Coco, G.; Calvete, D.; Ribas, F.; de Swart, H.E.; Falqués, A. Emerging Crescentic Patterns in Modelled Double Sandbar Systems under Normally Incident Waves. Earth Surf. Dyn. 2020, 8, 323–334. [Google Scholar] [CrossRef]
- Castelle, B.; Bonneton, P.; Butel, R. Modélisation de La Morphodynamique Des Barres En Croissant de La Côte Aquitaine. In Proceedings of the VIIIèmes Journées Nationales Génie Civil–Génie Côtier, Compiègne, France, 7–9 September 2004; p. 174, ISBN 978-2-9505787-7-8. [Google Scholar]
- D’Alessandro, F.; Tomasicchio, G.R. Wave–Dune Interaction and Beach Resilience in Large-Scale Physical Model Tests. Coast. Eng. 2016, 116, 15–25. [Google Scholar] [CrossRef]
- Ranasinghe, R.; Symonds, G.; Black, K.; Holman, R. Morphodynamics of Intermediate Beaches: A Video Imaging and Numerical Modelling Study. Coast. Eng. 2004, 51, 629–655. [Google Scholar] [CrossRef]
- Hom-ma, M.; Sonu, C. Rhythmic Pattern of Longshore Bars Related to Sediment Characteristics. Coast. Eng. Proc. 1962, 1, 16. [Google Scholar] [CrossRef]
- Short, A.D. Handbook of Beach and Shoreface Morphodynamics; John Wiley: Oxford, UK, 1999; ISBN 0-471-96570-7. [Google Scholar]
- Ruessink, B.G.; Coco, G.; Ranasinghe, R.; Turner, I.L. Coupled and Noncoupled Behavior of Three-Dimensional Morphological Patterns in a Double Sandbar System. J. Geophys. Res. Ocean. 2007, 112. [Google Scholar] [CrossRef]
- Price, T.D.; Ruessink, B.G.; Castelle, B. Morphological Coupling in Multiple Sandbar Systems—A Review. Earth Surf. Dynam. 2014, 2, 309–321. [Google Scholar] [CrossRef]
- Sonu, C. Field Observation of Nearshore Circulation and Meandering Currents. J. Geophys. Res. (1896–1977) 1972, 77, 3232–3247. [Google Scholar] [CrossRef]
- Price, T.; Rutten, J.; Ruessink, G. Coupled Behaviour within a Double Sandbar System. J. Coast. Res. 2011, SI64, 125–129. [Google Scholar]
- Thiébot, J.; Idier, D.; Garnier, R.; Falqués, A.; Ruessink, B.G. The Influence of Wave Direction on the Morphological Response of a Double Sandbar System. Cont. Shelf Res. 2012, 32, 71–85. [Google Scholar] [CrossRef]
- Balouin, Y.; Tesson, J.; Gervais, M. Cuspate Shoreline Relationship with Nearshore Bar Dynamics during Storm Events—Field Observations at Sete Beach, France. J. Coast. Res. 2013, 65, 440–445. [Google Scholar] [CrossRef]
- van de Lageweg, W.I.; Bryan, K.R.; Coco, G.; Ruessink, B.G. Observations of Shoreline–Sandbar Coupling on an Embayed Beach. Mar. Geol. 2013, 344, 101–114. [Google Scholar] [CrossRef]
- Lamy, A.; Robin, N.; Smyth, T.; Hesp, P.; René, C.; Pierre, F.; Raynal, O.; Hebert, B. Impact of Temporal Beach Grain Size Variability on Aeolian Sediment Transport and Topographic Evolution in a Microtidal Environment. Geomorphology 2024, 453, 109126. [Google Scholar] [CrossRef]
- Lamy, A.; Smyth, T.; Robin, N.; Hesp, P. Using Computational Fluid Dynamics (CFD) to Investigate Airflow and Sand Transport on a Human-Made Coastal Foredune Dominated by Offshore Wind: Impact of the Shape Variability. Coast. Eng. 2024, 191, 104534. [Google Scholar] [CrossRef]
- Aleman, N.; Robin, N.; Certain, R.; Anthony, E.J.; Barusseau, J.P. Longshore Variability of Beach States and Bar Types in a Microtidal, Storm-Influenced, Low-Energy Environment. Geomorphology 2015, 241, 175–191. [Google Scholar] [CrossRef]
- Certain, R. Morphodynamique D’une Côte Sableuse Microtidale à Barres: Le Golfe du Lion (Languedoc-Roussillon). Ph.D. Thesis, Université de Perpignan, Perpignan, France, 2002. [Google Scholar]
- Mendoza, E.; Jiménez, J. Storm-Induced Beach Erosion Potential on the Catalonian Coast. J. Coast. Res. SI 2006, 48, 81–88. [Google Scholar]
- Cerema Centre D’Étude et D’Expertise Sur Les Risques, L’Environnement, la Mobilité et L’Aménagement; Dreal Languedoc-Roussillon. Observatoire Océanologique de Banyuls CANDHIS—Détail de La Campagne 01101—Leucate. Available online: https://candhis.cerema.fr/_public_/campagne.php?Y2FtcD0wMTEwMQ== (accessed on 1 April 2019).
- Guizien, K. Spatial Variability of Wave Conditions in the Gulf of Lions (NW-Mediterranean Sea). Life Environ. 2009, 59, 261–270. [Google Scholar]
- Falqués, A.; Ribas, F.; Mujal-Colilles, A.; Puig-Polo, C. A New Morphodynamic Instability Associated with Cross-Shore Transport in the Nearshore. Geophys. Res. Lett. 2021, 48, e2020GL091722. [Google Scholar] [CrossRef]
- Feyssat, P.; Certain, R.; Robin, N.; Raynal, O.; Lamy, A.; Hebert, B. Low Beach Bars: A Discontinuous Subtidal System of Proximal Bars within Mediterranean Low Microtidal Crescentics Systems. In Proceedings of the XVIIèmes Journées Nationales Génie Côtier—Génie Civil, Chatou, France, 11–13 October 2022; p. 10. [Google Scholar]
- Vos, K.; Splinter, K.; Harley, M.; Simmons, J.; Turner, I. CoastSat: A Google Earth Engine-Enabled Python Toolkit to Extract Shorelines from Publicly Available Satellite Imagery. Environ. Model. Softw. 2019, 122, 104528. [Google Scholar] [CrossRef]
- Caballeria, M.; Coco, G.; Falqués, A.; Huntley, D.A. Self-Organization Mechanisms for the Formation of Nearshore Crescentic and Transverse Sand Bars. J. Fluid Mech. 2002, 465, 379–410. [Google Scholar] [CrossRef]
- Splinter, K.; Holman, R.; Plant, N. A Behavior-Oriented Dynamic Model for Sandbar Migration and 2DH Evolution. J. Geophys. Res. 2011, 116, C01020. [Google Scholar] [CrossRef]
- de Swart, R.; Ribas, F.; Calvete, D.; Simarro, G.; Guillén, J. Characteristics and Dynamics of Crescentic Bar Events at an Open, Mediterranean Beach. In Proceedings of the EGU2020: Sharing Geoscience, Online, 8 May 2020. [Google Scholar]
- Kergadallan, X. Candhis: Analyses 2022 Des États de Mer Tome 1—Mer Du Nord, Manche et Atlantique; Cerema: Bron, France, 2022. [Google Scholar]
- van Enckevort, I.M.J.; Ruessink, B.G. Video Observations of Nearshore Bar Behaviour. Part 2: Alongshore Non-Uniform Variability. Cont. Shelf Res. 2003, 23, 513–532. [Google Scholar] [CrossRef]
- Vidal, J.; Ruiz de Alegria-Arzaburu, A. Variability of Sandbar Morphometrics over Three Seasonal Cycles on a Single-Barred Beach. Geomorphology 2019, 333, 61–72. [Google Scholar] [CrossRef]
- Garnier, R.; Dodd, N.; Falqués, A.; Calvete, D. Mechanisms Controlling Crescentic Bar Amplitude. J. Geophys. Res. Earth Surf. 2010, 115. [Google Scholar] [CrossRef]
- Ferrer, P.; Certain, R.; Adloff, F.; Bouchette, F.; Meulé, S.; Robin, N. Hydrodynamics over a Microtidal Double Crescentic Barred Beach in Low Energetic Conditions (Leucate Beach, France). J. Coast. Res. 2011, 5, 2032–2036. [Google Scholar]
- Bujan, N. Application d’un Modèle de Circulation Quasi-Tridimensionnel Littoral à la Dynamique des Plages du Languedoc-Roussillon. Ph.D. Thesis, Université Montpellier II-Sciences et Techniques du Languedoc, Montpellier, France, 2009. [Google Scholar]
- Orzech, M.D.; Reniers, A.J.H.M.; Thornton, E.B.; MacMahan, J.H. Megacusps on Rip Channel Bathymetry: Observations and Modeling. Coast. Eng. 2011, 58, 890–907. [Google Scholar] [CrossRef]
- Macmahan, J.; Brown, J.; Brown, J.; Thornton, E.; Reniers, A.; Stanton, T.; Henriquez, M.; Gallagher, E.; Morrison, J.; Austin, M.; et al. Mean Lagrangian Flow Behavior on an Open Coast Rip-Channeled Beach: A New Perspective. Mar. Geol. 2010, 268, 1–15. [Google Scholar] [CrossRef]
- Coco, G.; Murray, A.B. Patterns in the Sand: From Forcing Templates to Self-Organization. Geomorphology 2007, 91, 271–290. [Google Scholar] [CrossRef]
- Nnafie, A.; de Swart, H.E.; Falqués, A.; Calvete, D. Long-Term Morphodynamics of a Coupled Shelf-Shoreline System Forced by Waves and Tides, a Model Approach. J. Geophys. Res. Earth Surf. 2021, 126, e2021JF006315. [Google Scholar] [CrossRef]
- Aagaard, T.; Masselink, G. The Surf Zone. In Handbook of Beach and Shoreface Morphodynamics; Wiley: Chichester, UK, 1999; ISBN 978-0-471-96570-1. [Google Scholar]
- Masselink, G.; Scott, T.; Austin, M.; Russell, P. Experience the Power of Rip Currents. Bang Goes The Theory, Episode 2. 2011. Available online: https://www.researchgate.net/publication/235651705_Experience_the_power_of_rip_currents_Bang_Goes_The_Theory_Episode_2 (accessed on 2 May 2024).
- Hoefel, F.; Elgar, S. Wave-Induced Sediment Transport and Sandbar Migration. Science 2003, 299, 1885–1887. [Google Scholar] [CrossRef]
- Berni, C.; Barthélemy, E.; Michallet, H. Surf Zone Cross-Shore Boundary Layer Velocity Asymmetry and Skewness: An Experimental Study on a Mobile Bed. J. Geophys. Res. Ocean. 2013, 118, 2188–2200. [Google Scholar] [CrossRef]
- Fernández-Mora, A.; Calvete, D.; Falqués, A.; de Swart, H.E. Onshore Sandbar Migration in the Surf Zone: New Insights into the Wave-Induced Sediment Transport Mechanisms. Geophys. Res. Lett. 2015, 42, 2869–2877. [Google Scholar] [CrossRef]
- Brander, R.W. Field Observations on the Morphodynamic Evolution of a Low-Energy Rip Current System. Mar. Geol. 1999, 157, 199–217. [Google Scholar] [CrossRef]
- Shepard, F.P.; Inman, D.L. Nearshore Circulation; Coastal Engineering Proceedings; Scripps Institution of Oceanography: La Jolla, CA, USA, 1950; pp. 50–59. [Google Scholar] [CrossRef]
- Ribas, F.; Kroon, A. Characteristics and Dynamics of Surfzone Transverse Finger Bars. J. Geophys. Res. Earth Surf. 2007, 112. [Google Scholar] [CrossRef]
- Ribas, F.; Doeschate, A.T.; de Swart, H.E.; Ruessink, B.G.; Calvete, D. Observations and Modeling of Surf Zone Transverse Finger Bars at the Gold Coast, Australia. Ocean Dyn. 2014, 64, 1193–1207. [Google Scholar] [CrossRef]
- Almar, R.; Castelle, B.; Ruessink, B.G.; Sénéchal, N.; Bonneton, P.; Marieu, V. High-Frequency Video Observation of Two Nearby Double-Barred Beaches under High-Energy Wave Forcing. J. Coast. Res. 2009, SI56, 1706–1710. [Google Scholar]
- Grasso, F.; Michallet, H.; Barthélemy, E. Experimental Flume Simulation of Shoreface Nourishements under Storm Conditions. In Proceedings of the Coastal Dynamics 2009, Tokyo, Japan, 7–11 September 2009; World Scientific: Tokyo, Japan, 2009; pp. 1–12. [Google Scholar]
- Bouvier, C.; Korteling, J.; Price, T.; Balouin, Y.; Castelle, B. Observation and Modelling of Shoreward Propagating Accretionary Waves (SPAWs) on Microtidal Beaches. Coast. Eng. Proc. 2020, 27. [Google Scholar] [CrossRef]
- Price, T.; van Kuik, N.; de Wit, L.; António, S.; Ruessink, G. Shoreward Propagating Accretionary (SPAWs):Observation from a Multiple Sandbar System. In Proceedings of the Coastal Dynamics 2017 Conference, Helsingør, Denmark, 12–16 June 2017. [Google Scholar]
- Mendoza, E.; Jiménez, J.; Mateo, J. A Coastal Storms Intensity Scale for the Catalan Sea (NW Mediterranean). Nat. Hazards Earth Syst. Sci. 2011, 11, 2453–2462. [Google Scholar] [CrossRef]
- Baldock, T.E.; Birrien, F.; Atkinson, A.; Shimamoto, T.; Wu, S.; Callaghan, D.P.; Nielsen, P. Morphological Hysteresis in the Evolution of Beach Profiles under Sequences of Wave Climates—Part 1; Observations. Coast. Eng. 2017, 128, 92–105. [Google Scholar] [CrossRef]
- Baldock, T.; Alsina, J.; Caceres, I.; Vicinanza, D.; Contestabile, P.; Power, H.; Sanchez-Arcilla, A. Large-Scale Experiments on Beach Profile Evolution and Surf and Swash Zone Sediment Transport Induced by Long Waves, Wave Groups and Random Waves. Coast. Eng. 2011, 58, 214–227. [Google Scholar] [CrossRef]
- Birrien, F.; Atkinson, A.; Shimamoto, T.; Baldock, T. Hysteresis in the Evolution of Beach Profile Parameters under Sequences of Wave Climates—Part 2; Modelling. Coast. Eng. 2018, 133, 13–25. [Google Scholar] [CrossRef]
- Dudkowska, A.; Boruń, A.; Malicki, J.; Schönhofer, J.; Gic-Grusza, G. Rip Currents in the Non-Tidal Surf Zone with Sandbars: Numerical Analysis versus Field Measurements. Oceanologia 2020, 62, 291–308. [Google Scholar] [CrossRef]
- Thornton, E.B.; MacMahan, J.; Sallenger, A.H. Rip Currents, Mega-Cusps, and Eroding Dunes. Mar. Geol. 2007, 240, 151–167. [Google Scholar] [CrossRef]
- Castelle, B.; Scott, T.; Brander, R.; Mccarroll, R. Rip Current Types, Circulation and Hazard. Earth-Sci. Rev. 2016, 163, 1–21. [Google Scholar] [CrossRef]
- De Melo Apoluceno, D. Morphodynamique des Plages à Barres en Domaine Méso à Macrotidal: Exemple de La Plage Du Truc Vert, Gironde, France. Ph.D. Thesis, University of Bordeaux, Bordeaux, France, 2003. [Google Scholar]
- Houser, C.; Wernette, P.; Trimble, S.; Locknick, S. 11—Rip Currents. In Sandy Beach Morphodynamics; Jackson, D.W.T., Short, A.D., Eds.; Elsevier: Amsterdam, The Netherlands, 2020; pp. 255–276. ISBN 978-0-08-102927-5. [Google Scholar]
- Castelle, B.; Marieu, V.; Coco, G.; Bonneton, P.; Bruneau, N.; Ruessink, B.G. On the Impact of an Offshore Bathymetric Anomaly on Surf Zone Rip Channels. J. Geophys. Res. Earth Surf. 2012, 117. [Google Scholar] [CrossRef]
- Brander, R.W.; Short, A.D. Morphodynamics of a Large-Scale Rip Current System at Muriwai Beach, New Zealand. Mar. Geol. 2000, 165, 27–39. [Google Scholar] [CrossRef]


| Final Typology | ||||||||||||
|---|---|---|---|---|---|---|---|---|---|---|---|---|
| TBR/LTT Oblique | TBR Oblique | TBR Oblique Disrupted | TBR/RBB Oblique | TBR/RBB Oblique Disrupted | RBB HP/RBB Regular | RBB HP/RBB Disrupted | RBB HP Regular | RBB HP Disrupted | RBB Disrupted | Total | ||
| Initial typology | TBR/LTT Oblique | 2 | 1 | 2 | 1 | 6 | ||||||
| TBR Oilique | 1 | 1 | 2 | 1 | 5 | |||||||
| TBR Oblique disrupted | 1 | 4 | 3 | 2 | 10 | |||||||
| TBR/RBB Oblique | 1 | 1 | 1 | 3 | ||||||||
| TBR/RBB Oblique disrupted | 1 | 1 | 2 | |||||||||
| RBB HP/RBB Regular | 1 | 2 | 1 | 3 | 7 | |||||||
| RBB HP/RBB Disrupted | 1 | 1 | 2 | 4 | ||||||||
| RBB HP Regular | 1 | 4 | 3 | 1 | 1 | 11 | 5 | 1 | 27 | |||
| RBB HP Disrupted | 1 | 1 | 1 | 6 | 9 | |||||||
| RBB Disrupted | 2 | 1 | 1 | 2 | 6 | |||||||
| Total | 5 | 6 | 8 | 1 | 4 | 10 | 3 | 27 | 10 | 5 | 79 | |
Disclaimer/Publisher’s Note: The statements, opinions and data contained in all publications are solely those of the individual author(s) and contributor(s) and not of MDPI and/or the editor(s). MDPI and/or the editor(s) disclaim responsibility for any injury to people or property resulting from any ideas, methods, instructions or products referred to in the content. |
© 2024 by the authors. Licensee MDPI, Basel, Switzerland. This article is an open access article distributed under the terms and conditions of the Creative Commons Attribution (CC BY) license (https://creativecommons.org/licenses/by/4.0/).
Share and Cite
Feyssat, P.; Certain, R.; Robin, N.; Raynal, O.; Lamy, A.; Barusseau, J.-P.; Hebert, B. The Morphodynamics of a Double-Crescent Bar System under a Mediterranean Wave Climate: Leucate Beach. J. Mar. Sci. Eng. 2024, 12, 969. https://doi.org/10.3390/jmse12060969
Feyssat P, Certain R, Robin N, Raynal O, Lamy A, Barusseau J-P, Hebert B. The Morphodynamics of a Double-Crescent Bar System under a Mediterranean Wave Climate: Leucate Beach. Journal of Marine Science and Engineering. 2024; 12(6):969. https://doi.org/10.3390/jmse12060969
Chicago/Turabian StyleFeyssat, Pierre, Raphaël Certain, Nicolas Robin, Olivier Raynal, Antoine Lamy, Jean-Paul Barusseau, and Bertil Hebert. 2024. "The Morphodynamics of a Double-Crescent Bar System under a Mediterranean Wave Climate: Leucate Beach" Journal of Marine Science and Engineering 12, no. 6: 969. https://doi.org/10.3390/jmse12060969
APA StyleFeyssat, P., Certain, R., Robin, N., Raynal, O., Lamy, A., Barusseau, J.-P., & Hebert, B. (2024). The Morphodynamics of a Double-Crescent Bar System under a Mediterranean Wave Climate: Leucate Beach. Journal of Marine Science and Engineering, 12(6), 969. https://doi.org/10.3390/jmse12060969