Article

Hydrodynamic Characteristics Analysis and Mooring System Optimization of an Innovative Deep-Sea Aquaculture Platform

1
School of Naval Architecture and Ocean Engineering, Dalian University of Technology, Dalian 116024, China
2
China Institute for Radiation Protection, Taiyuan 030006, China
*
Authors to whom correspondence should be addressed.
J. Mar. Sci. Eng. 2024, 12(6), 972; https://doi.org/10.3390/jmse12060972
Submission received: 8 May 2024 / Revised: 2 June 2024 / Accepted: 6 June 2024 / Published: 9 June 2024
(This article belongs to the Section Ocean Engineering)

Abstract

:
As nearshore aquaculture spaces become saturated, the development of fisheries aquaculture for deep sea has become an inevitable trend. This paper proposes an innovative deep-sea aquaculture platform that incorporates a vessel-shaped main structure and a single-point mooring system. The potential flow theory and the Morison equation are utilized to calculate the hydrodynamic loads on the main structure and the netting and mooring systems, respectively. The deformation and force of the netting in current are simulated, and the accuracy of the analytical methods used is validated based on experimental results. The influences of the netting system on the hydrodynamic characteristics of the platform are analyzed. Optimization on the single-point mooring system is conducted under static and dynamic conditions, considering the influences of various mooring parameters, including mooring line length, buoyancy of buoys, and mass of sinkers. The patterns of changes in motion response, mooring line tension, and minimum touchdown length under different mooring parameters are calculated and analyzed. The results indicate that changes in mooring line length have minimal impact on the dynamic response of the platform and mooring system. The addition of appropriate buoys or sinkers can reduce the motion response of the platform and the tension in the mooring lines. Moreover, compared to adding buoys, incorporating sinkers more effectively enhances the overall safety and stability of the platform system.

1. Introduction

In recent years, due to excessive fishing, which has led to severe damage to the marine ecosystem, the output of capture fisheries has stagnated. To meet the demand for protein, aquaculture has developed rapidly. Over the past 70 years, aquaculture production has increased annually. However, as nearshore aquaculture space tends to be saturated, it weakens the exchange capacity of water flow, leading to deterioration of the aquaculture environment and a decrease in fish quality. Compared to nearshore areas, deep-sea areas offer more space, higher current speeds, and better water quality. Fish grow faster and are of better quality in this natural environment, with a lower disease rate. The development of aquaculture into deep-sea areas has become an inevitable trend.
Many scholars have conducted extensive research on the hydrodynamic characteristics of aquaculture cage systems. Gravity cages are the most widely used type of net cages in the world today. Moe et al. [1] developed and validated a structural analysis method for aquaculture cages, using parallel truss elements to simulate the netting structure and thereby obtaining the stress and deformation patterns of the cages in water flow. Cifuentes et al. [2] analyzed the hydrodynamic response characteristics of circular gravity cages under wave and current loads based on the Morison equation. They adjusted drag and inertia coefficients of the model according to the Re number and KC number to obtain the loads on the floating frame and the resistance on the netting. Huang et al. [3] proposed a finite element model to simulate the motion response of circular gravity cages under wave and current actions, and conducted experimental verification. Zhao et al. [4], based on the finite element method, simulated the floating tube using shell elements, and conducted simulations of its deformation and stress distribution under water flow using the Morison equation and the lumped mass method.
With the breakthrough of key technologies in deep-sea aquaculture, marine aquaculture is gradually advancing into deeper waters, and aquaculture equipment is being upgraded from traditional cage systems to large-scale aquaculture platforms [5,6]. Zhao et al. [7] conducted a series of physical experiments to study the hydrodynamic response of semi-submersible aquaculture farms to waves. Jin et al. [8] proposed a numerical simulation method and established a numerical model of Ocean Farm 1 to study the structural load and motion response characteristics under the influence of waves and currents. Martin T [9], based on computational fluid dynamics, proposed a new numerical framework that, combined with structural dynamics models, explained the motion and deformation of the netting under wave and current actions. Miao [10] proposed a numerical method that combines direct and indirect time-domain approaches, and conducted numerical simulations and experimental analyses to study the interaction between semi-submersible deep-sea aquaculture platforms and waves. Yu et al. [11] studied the nonlinear vertical accelerations and mooring system loads of semi-submersible aquaculture farm models under extreme conditions. Liu et al. [12] combined diffraction theory and the Morison equation to study the effects of draft, wave period, and linear elasticity coefficient on the hydrodynamic response characteristics of semi-submersible aquaculture platforms under regular waves.
The mooring system serves as the foundation for aquaculture cages in the ocean and holds significant importance in enabling the cages to withstand harsh marine conditions. Common mooring methods in aquaculture systems include multipoint mooring, single-point mooring, and grid mooring. Research on mooring systems mainly focuses on the dynamic characteristics of mooring lines and the optimization of mooring system design. Colbourne et al. [13] conducted experimental analyses of the hydrodynamic characteristics of deep-water cages under different mooring methods. The results showed that wave action was not the primary environmental load; rather, water flow played a dominant role. Xu et al. [14] studied the motion response and mooring tensions of large-scale fish farms with multiple cages under wave and current conditions using numerical simulations. Li et al. [15] proposed a comprehensive optimization method for mooring system design, establishing a numerical model of a ship-shaped fish farm. They conducted time-domain numerical simulations under extreme wave and current conditions and, based on optimization algorithms, found the optimal mooring design solution. Subong Park et al. [16] designed four different grid mooring schemes to assess the impact of different connection methods on the structural safety of cage systems. Yu et al. [17] proposed a numerical assessment method for hydrodynamic loads on aquaculture platforms based on potential flow theory and the Morison equation. They designed mooring system of the platform and conducted time-domain analysis of its performance.
C. A. Goudey et al. [18] conducted research on aquaculture cages moored under single-point mooring systems. These systems allow the cages to move around the mooring point, thereby dispersing fish waste and uneaten feed, reducing their impact on the marine environment. Additionally, due to the reduced mooring components, construction costs can be reduced by 50%. Huang et al. [19,20] established a numerical model for cages moored under single-point mooring systems, investigating their mooring forces and cage deformations under extreme sea conditions. They also evaluated the risk of mooring failure under long-term environmental loads. J. DeCew et al. [21] conducted hydrodynamic analysis of small-scale aquaculture cage systems moored under single-point mooring systems in various water flows, studying the relationship between immersion depth, mooring tension, and compactness. Shainee et al. [22,23] conducted numerical simulations and model experiments to analyze the dynamic response of self-submerging single-point moored cage systems under wave loading, demonstrating good motion characteristics of the system. Xu et al. [24] conducted a numerical simulation to study the hydrodynamic characteristics of a submersible single-point moored aquaculture cage in a wave-current environment, analyzing the impact of different mooring parameters on the submersion performance of the cage. Huang et al. [25] conducted physical experiments to measure and compare mooring forces in different single-point mooring layouts in fish farms under wave conditions, finding that increasing chain length or adding weight to the chain can significantly reduce mooring forces. Ma et al. [26] simulated the hydrodynamic response of single-point moored ship-shaped floating aquaculture platforms in waves using potential flow theory and dynamic compound cable theory.
To alleviate the pressure on coastal aquaculture, this paper proposes an innovative deep-sea aquaculture platform moored under a single-point system, considering the characteristics of gravity cages and large-scale aquaculture platforms. Compared to coastal aquaculture, deep-sea aquaculture involves higher investment and greater risks. To ensure the structural integrity of the platform and the safety of personnel in harsh marine conditions, it is necessary to conduct research on the overall hydrodynamic characteristics of the innovative deep-sea aquaculture platform and optimize its mooring system design.
The structure of this paper is as follows. Section 2 introduces the theories and methods used in this study. Section 3 describes the numerical model of the aquaculture platform and the computational conditions. In Section 4, the computational results are presented, and the effects of different parameters on the hydrodynamic characteristics of the platform and mooring system are discussed. Finally, Section 5 summarizes the research findings of this paper.

2. Methodology for Hydrodynamic Analysis and Mooring System Optimization

2.1. Framework and Process of the Methodology

The framework of this study is illustrated in Figure 1. Initially, the numerical model of an innovative deep-sea aquaculture platform was established, with design parameters set including mooring line length, buoyancy of buoys, mass of sinkers, and environmental conditions. Numerical simulations were then conducted to analyze the static and dynamic characteristics of the system. Finally, based on the response results of the platform and mooring system, a comprehensive evaluation of various mooring design scenarios was performed to determine the impact of different design parameters on the dynamic response of the system. This section introduces the theoretical basis of the numerical methods applied in this study.

2.2. Simulation Method of the Main Structure

When calculating wave loads on small-scale structures ( D / L 0.2 , where D is the characteristic dimension of the structure and L is the wavelength), the Morison equation is generally used. The general form of the Morison equation is
F = F D + F I = 1 2 ρ C D A u x ˙ u x ˙ + ρ V C M u ˙ C A x ¨
where F is the total wave force; F D is the drag force; F I is the inertial force; ρ is the density of water; C D represents the drag coefficient; C M is the added mass coefficient; C A is the inertia force coefficient; A is the projected area of the structure in the direction of water velocity; V is the volume of the structure; u and u ˙ are the velocity and acceleration of the water particle, respectively; x ˙ and x ¨ are the velocity and acceleration of the structure, respectively.
When calculating wave forces on large-scale structures, diffraction and radiation effects must be considered; thus, potential flow theory is used [27,28]. Assuming the fluid is inviscid, homogeneous, irrotational, and incompressible, a velocity potential exists in the flow field. Additionally, under linear theory analysis, the wave amplitude is very small and the structure undergoes small amplitude oscillations. Therefore, the velocity potential ϕ x , y , z , t in the flow field can be represented by three components:
ϕ x , y , z , t = ϕ I x , y , z , t + ϕ D x , y , z , t + ϕ R x , y , z , t
where ϕ I x , y , z , t is the incident wave potential, ϕ D x , y , z , t is the diffraction potential, and ϕ R x , y , z , t is the radiation potential.
The velocity potential satisfies the Laplace equation and the boundary conditions at the seabed, free surface, object surface, and at infinity. After solving the Laplace equation to obtain the fluid velocity potential, the pressure distribution in the flow field can be determined using Bernoulli equation and Lagrange integral. This allows for the determination of the wave forces acting on the platform.
Additionally, according to CCS (China Classification Society) [29] standards, when using potential flow theory to calculate wave loads, current loads can be calculated using the drag force term in the Morison equation.

2.3. Simulation Method of the Netting System

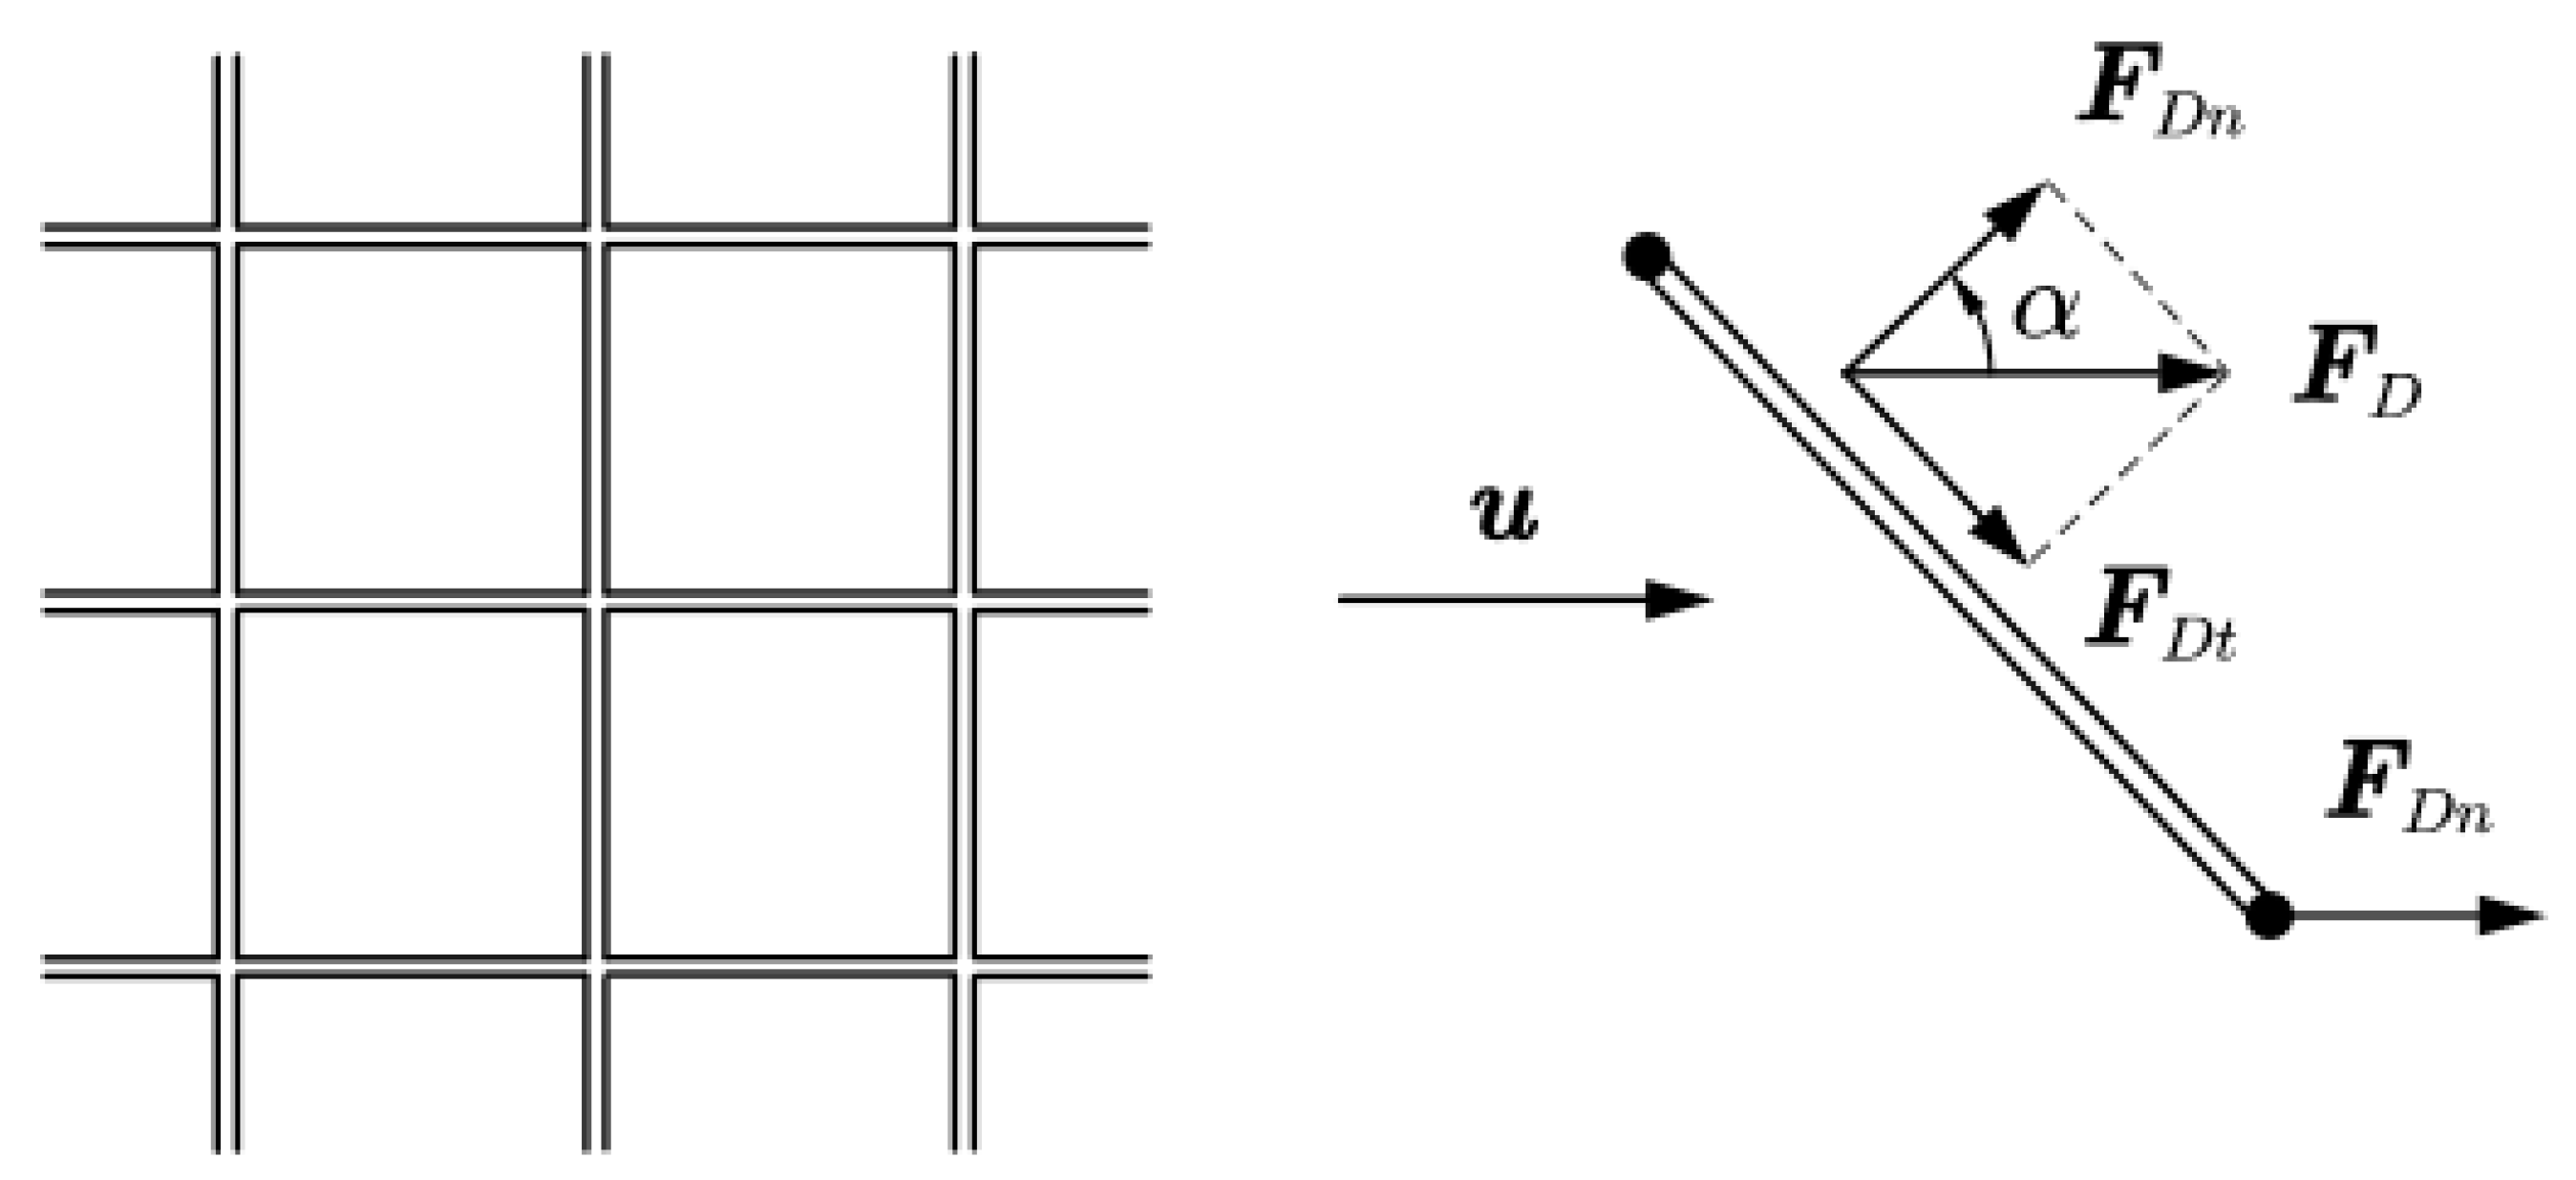
2.3.1. Calculation Method of the Force on the Netting

In this paper, the Morison model is applied for the numerical simulation of the netting. The Morison model is illustrated in Figure 2.
The principle of the model is to decompose the netting into individual net threads. Due to their small scale, the drag acting on each net thread can be calculated using Morison equation, as shown in Equation (1). The total drag on the netting is the sum of the forces experienced by each net thread.
For knotless netting systems, the forces are primarily divided into inertia and drag components. The added mass coefficient can be taken as 1 based on the work by Lader et al. [31]. The drag coefficient can be calculated using the formula proposed by Choo and Casarella [32]:
C D n = 8 π R e s 1 0.87 s 2                                       0 < R e 1           1.45 + 8.55 R e 0.90                                 1 < R e 30         1.1 + 4 R e 0.50             30 < R e 2.33 × 10 5        
C D t = π μ 0.55 R e 1 2 + 0.084 R e 2 3
where C D n and C D t represent the vertical and tangential components of the drag coefficient on the net thread, respectively; R e = ρ D v / μ , D is thread diameter, v is flow speed; s = 0.07721565 + ln 8 / R e ; and μ is the viscosity of the liquid.

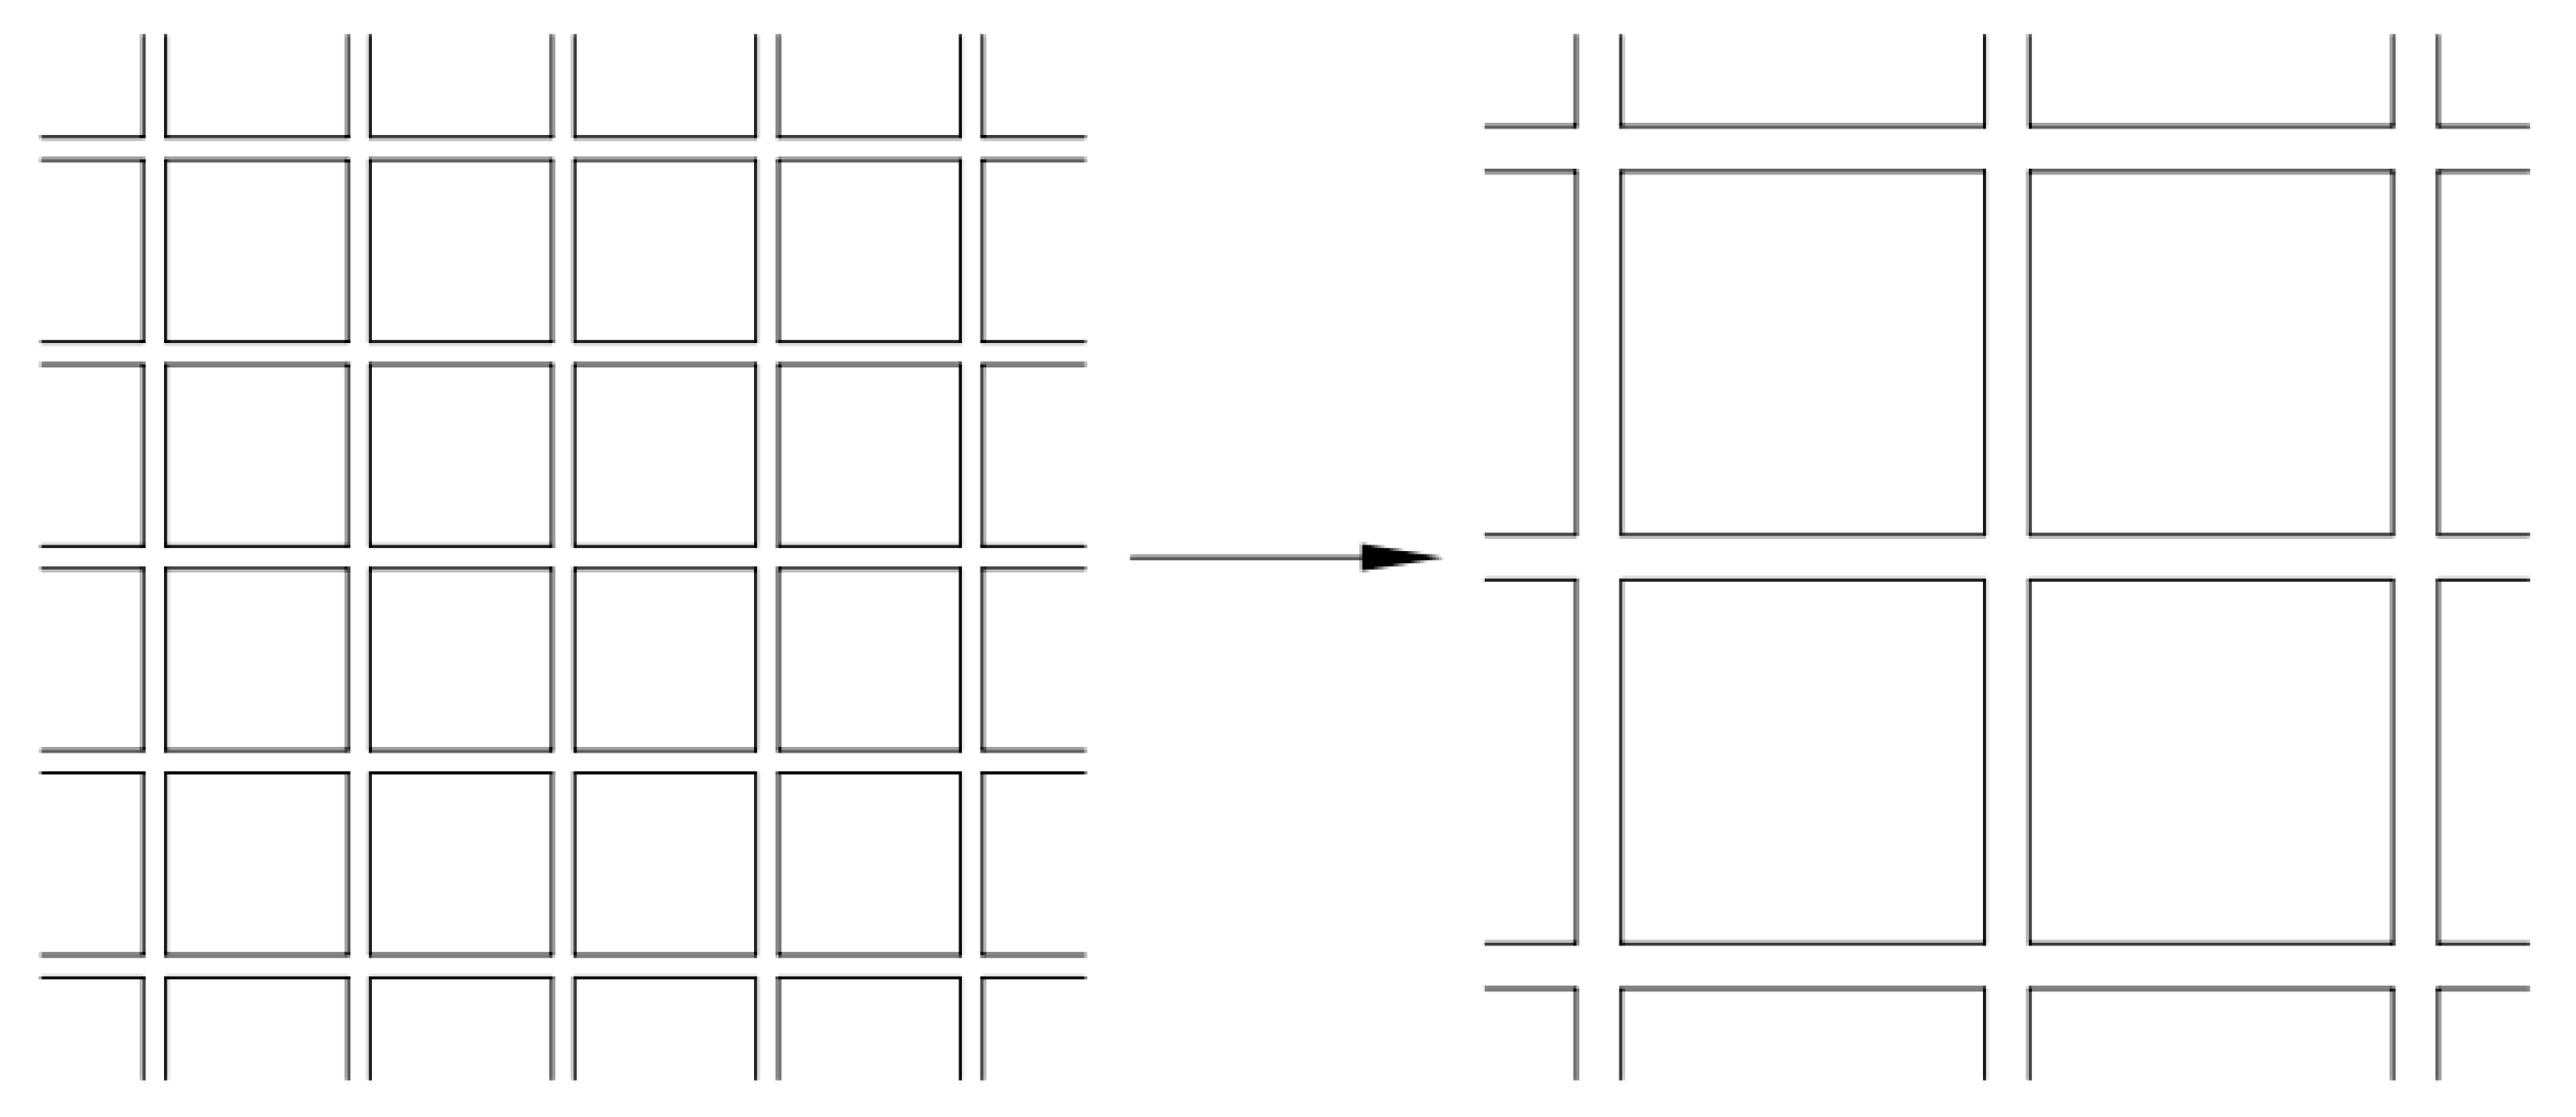
2.3.2. Equivalent Model of the Netting

In practical engineering, the number of meshes in a netting structure is typically very large. Direct numerical simulation of such structures would require substantial computational resources and be extremely time-consuming. To simulate the hydrodynamic characteristics of the netting structure in fluids more accurately and efficiently, it is necessary to establish an equivalent model of the netting. For this purpose, this paper introduces the concept of mesh group method, which has already been widely used in the research of numerical simulation of netting.
The mesh group method involves approximating several small meshes as a single larger mesh, thereby simplifying the computational model and enhancing computational efficiency. The equivalence method is illustrated in Figure 3.
To ensure that the equivalent model of the netting maintains the same hydrodynamic characteristics as the actual netting, the equivalence process must adhere to the following principles:
(1)
The mass of the netting after equivalence must be equal to the mass of the actual netting;
(2)
The area covered by the netting after equivalence must be equal to the area covered by the actual netting;
(3)
The projected area of the netting along the direction of flow after equivalence must be equal to that of the actual netting.

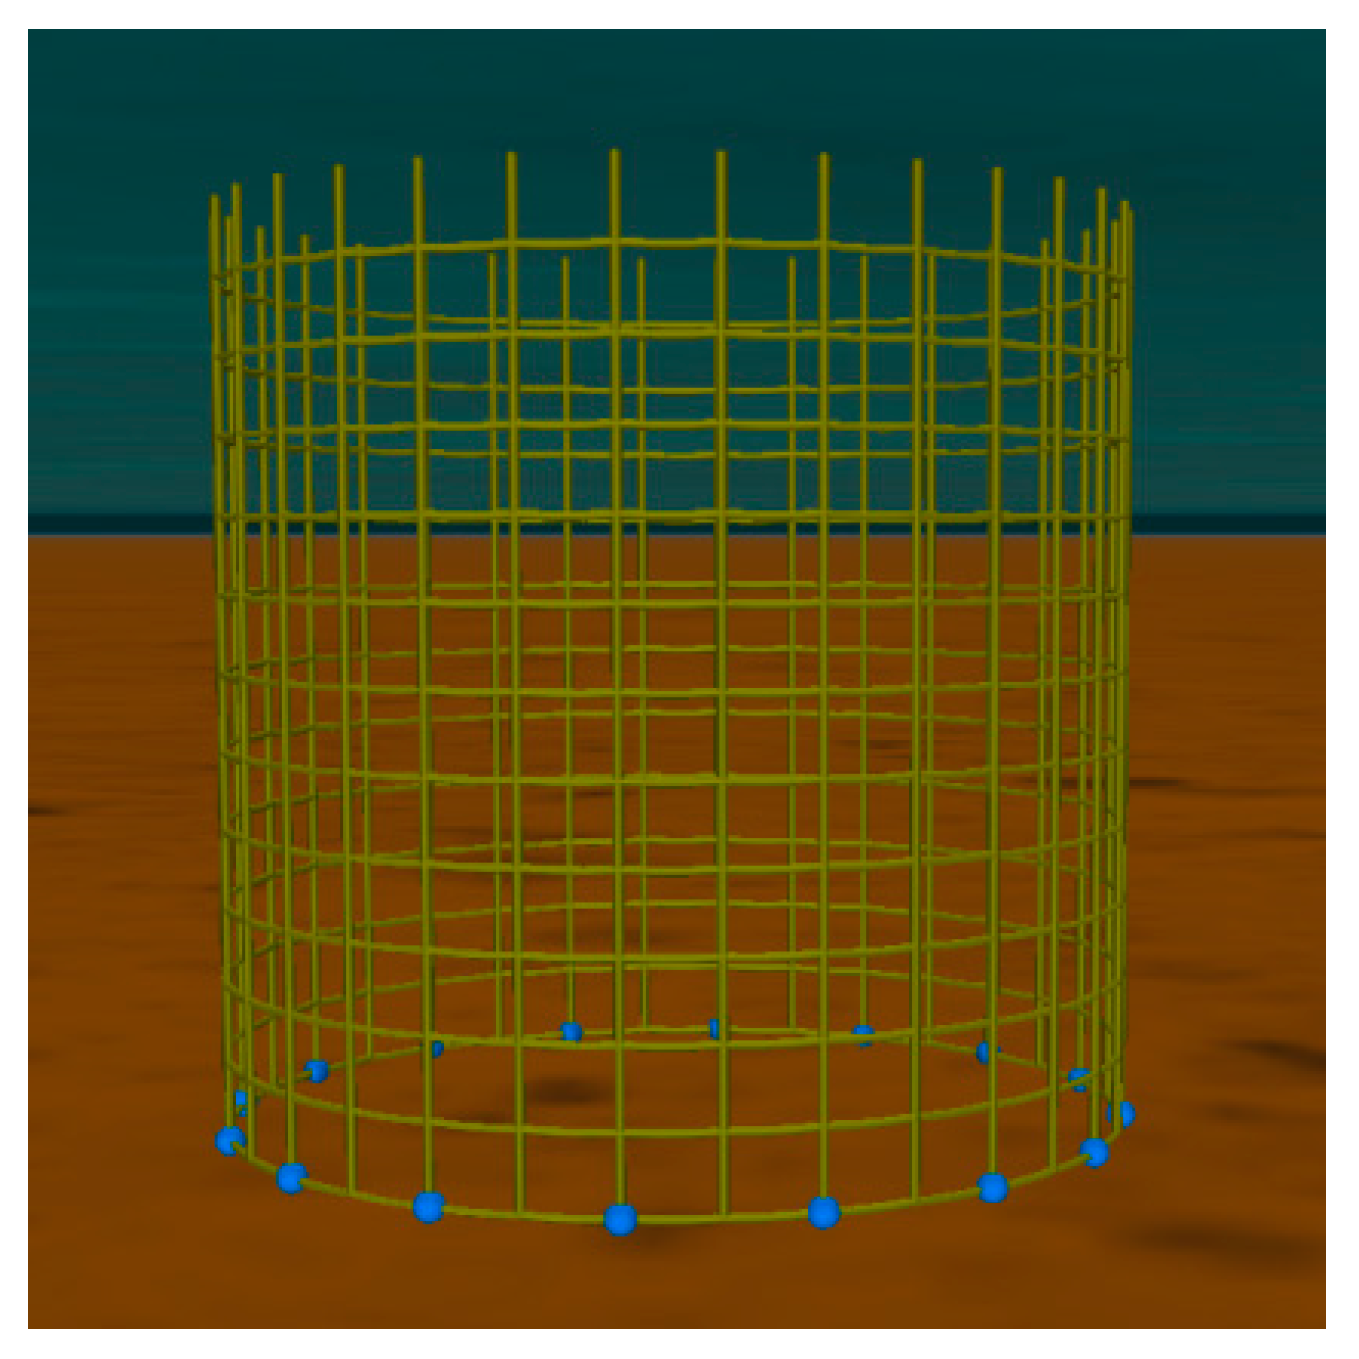
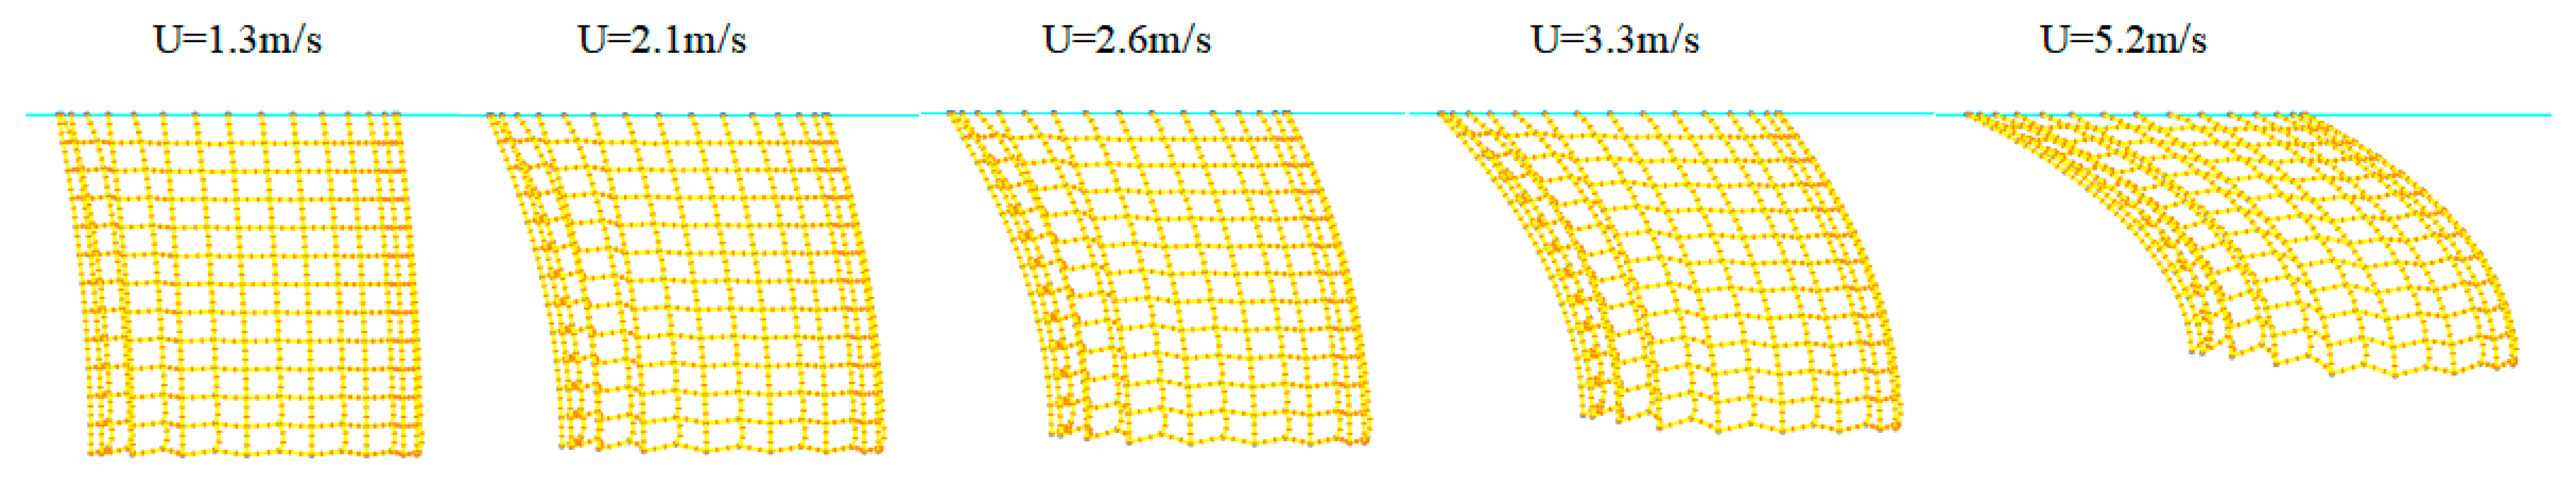
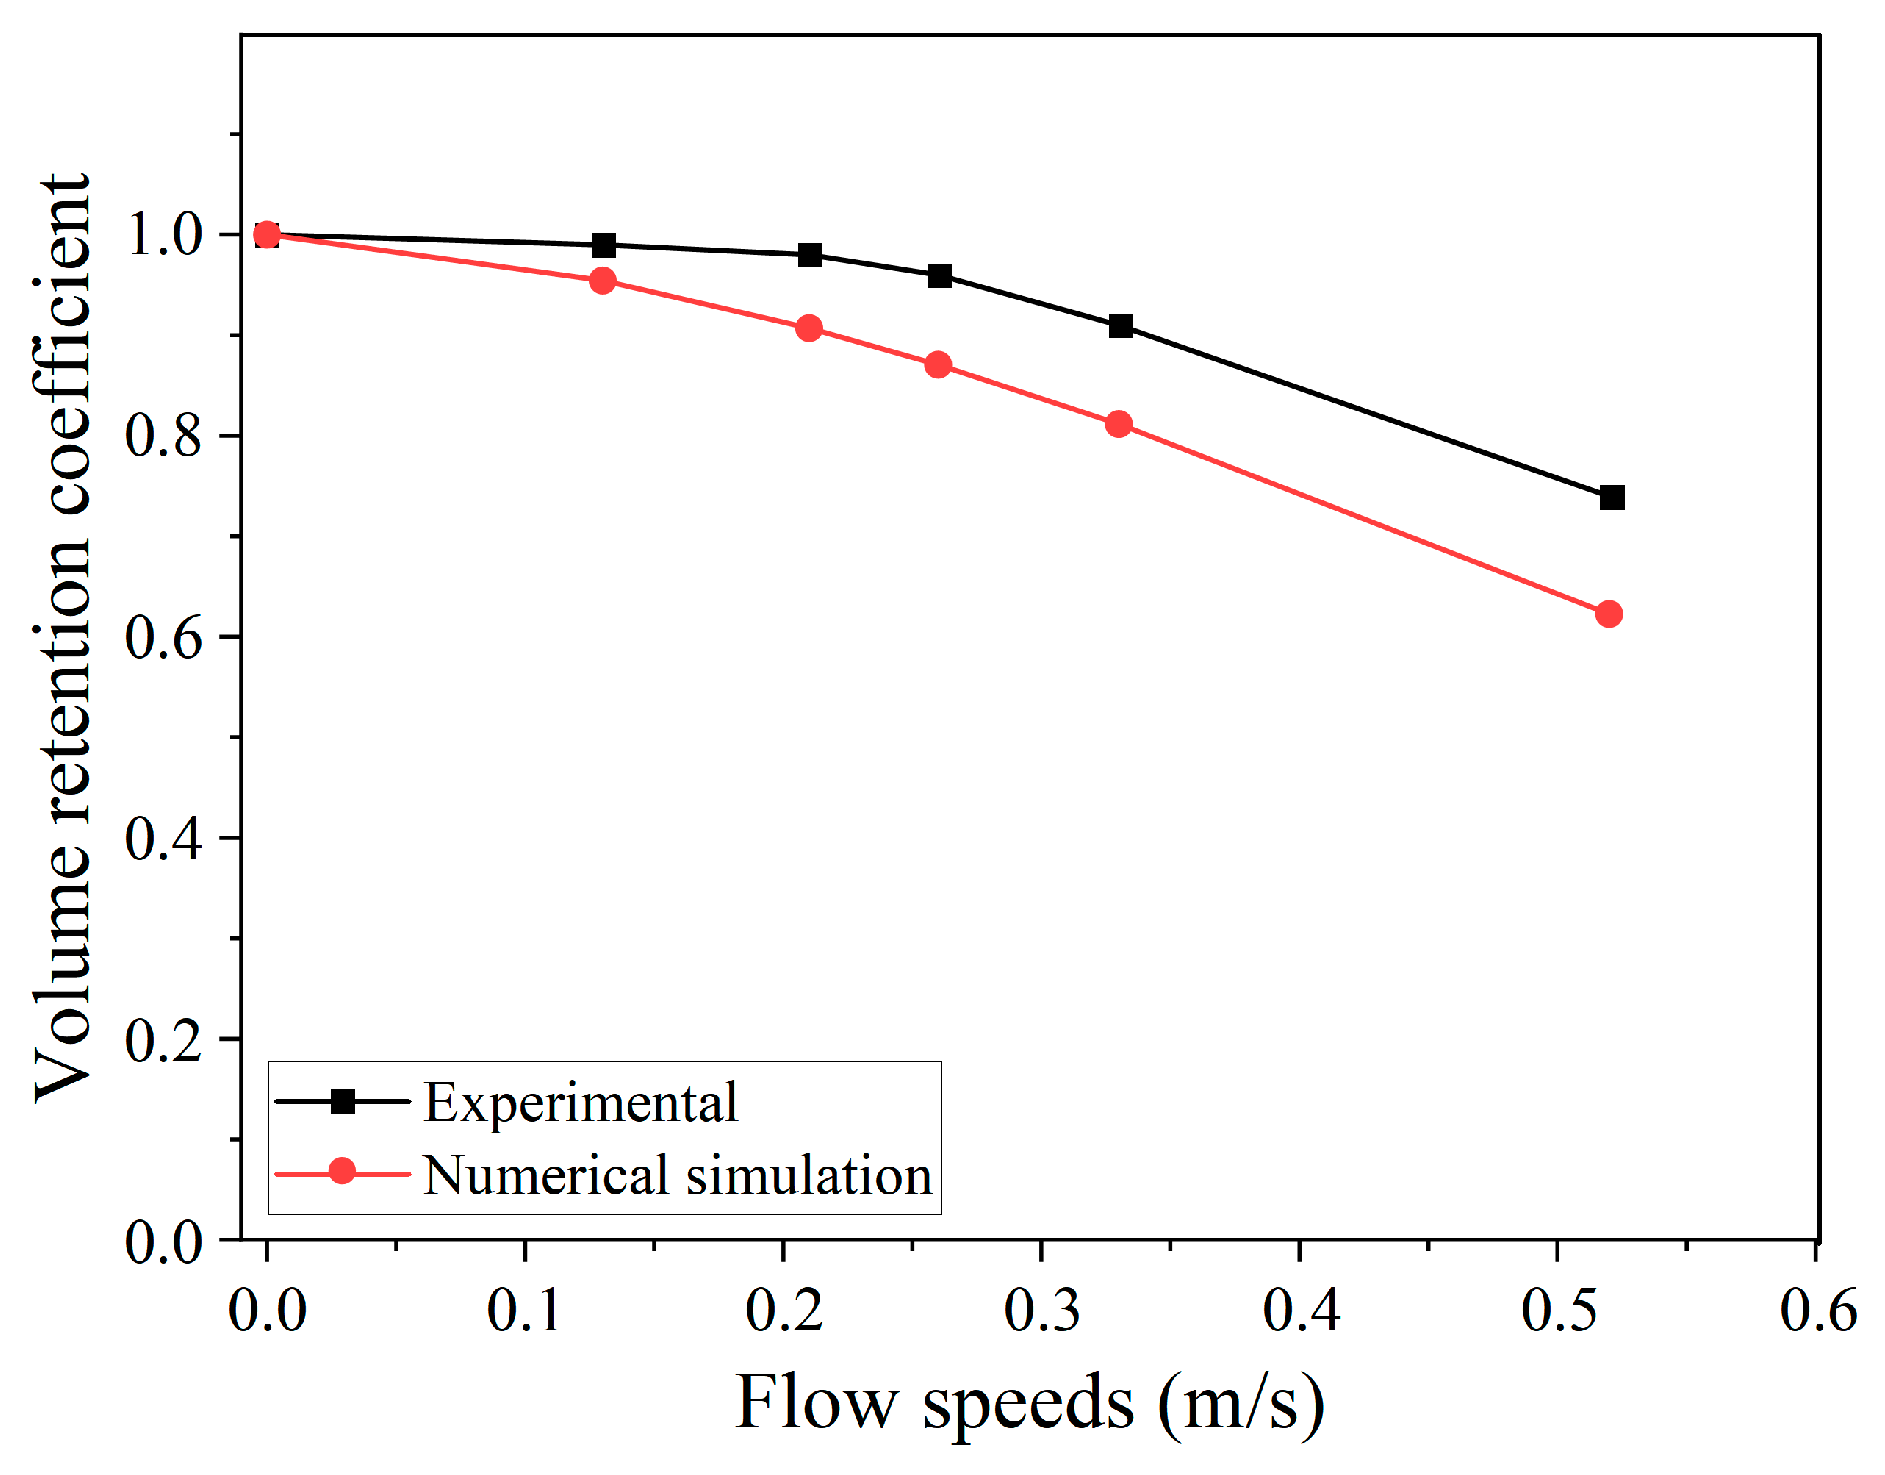
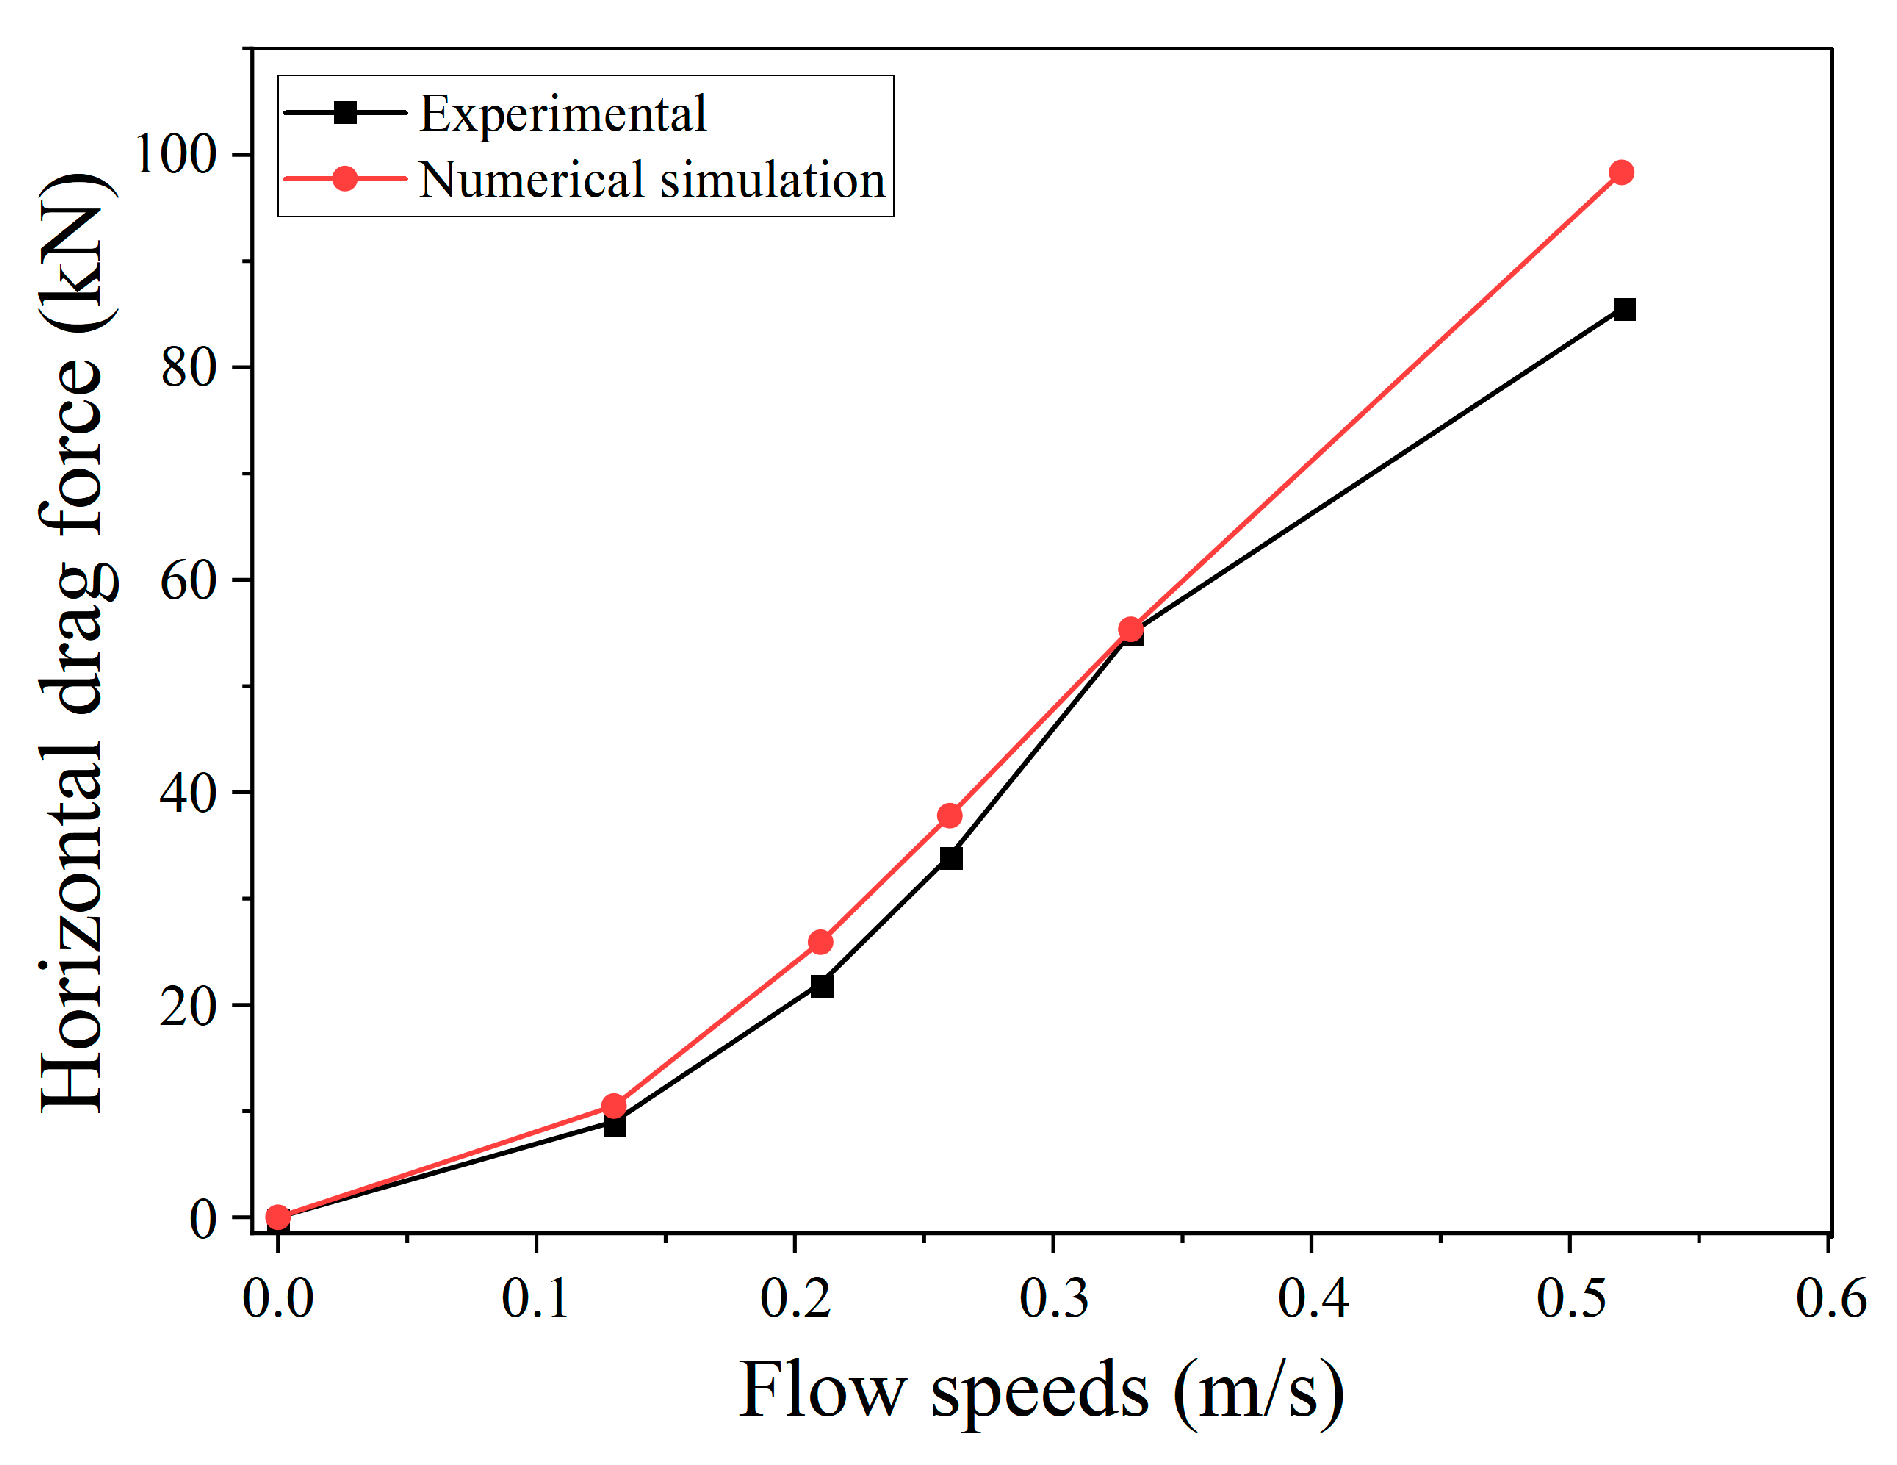
2.3.3. Verification of the Numerical Model

To verify the accuracy of the netting force analysis method and the netting equivalent model applied in this article, this section establishes a numerical model of netting equivalent to the experimental scale based on experiments by Lader and Enerhaug [33]. The experimental model mainly consists of a top ring, netting, and some sinkers attached to the bottom of the net. The netting is mounted on the top ring and is fixed during the experiment. The ring is made of steel, and the experimental netting is made of nylon. Sinkers are attached to the bottom of the net to maintain the shape of the netting under the action of water flow, using three different weighting modes, each with 16 sinkers, and the weight of each sinker in the three modes are 400 g, 600 g, and 800 g, respectively.
In the numerical simulation, the netting structure was represented equivalently using the mesh group method, as shown in Figure 4. The parameters of the experimental model and the numerical model are listed in Table 1. The numerical model consists of 32 × 12 meshes along the circumference and radial directions of the netting, respectively. The displacement and deformation of the top of the netting were neglected, with the upper nodes fixed directly at the water surface. Taking a sinker weight of 600 g as an example, the bottom weighting in the numerical model was set the same as in the experiment.
In the numerical simulation, the deformation results of the netting at different flow velocities, after stabilization, are shown in Figure 5. It can be observed that the deformation of the netting increases with the flow velocity.
Quantitative validation of the deformation and forces on the netting was conducted. The simulated results for volume reduction coefficient and horizontal drag force are compared with experimental results in Figure 6 and Figure 7. As the flow velocity increases, the volume reduction coefficient gradually decreases, while the horizontal drag force increases. The maximum relative error between simulation and experimental results for the volume reduction coefficient is 15.8%, and for the horizontal drag force, it is 17.8%. This indicates a good agreement between the numerical simulations and experimental results. The simulated values for the volume reduction coefficient are consistently lower than the experimental values, possibly due to the neglect of top displacement in the numerical simulation.

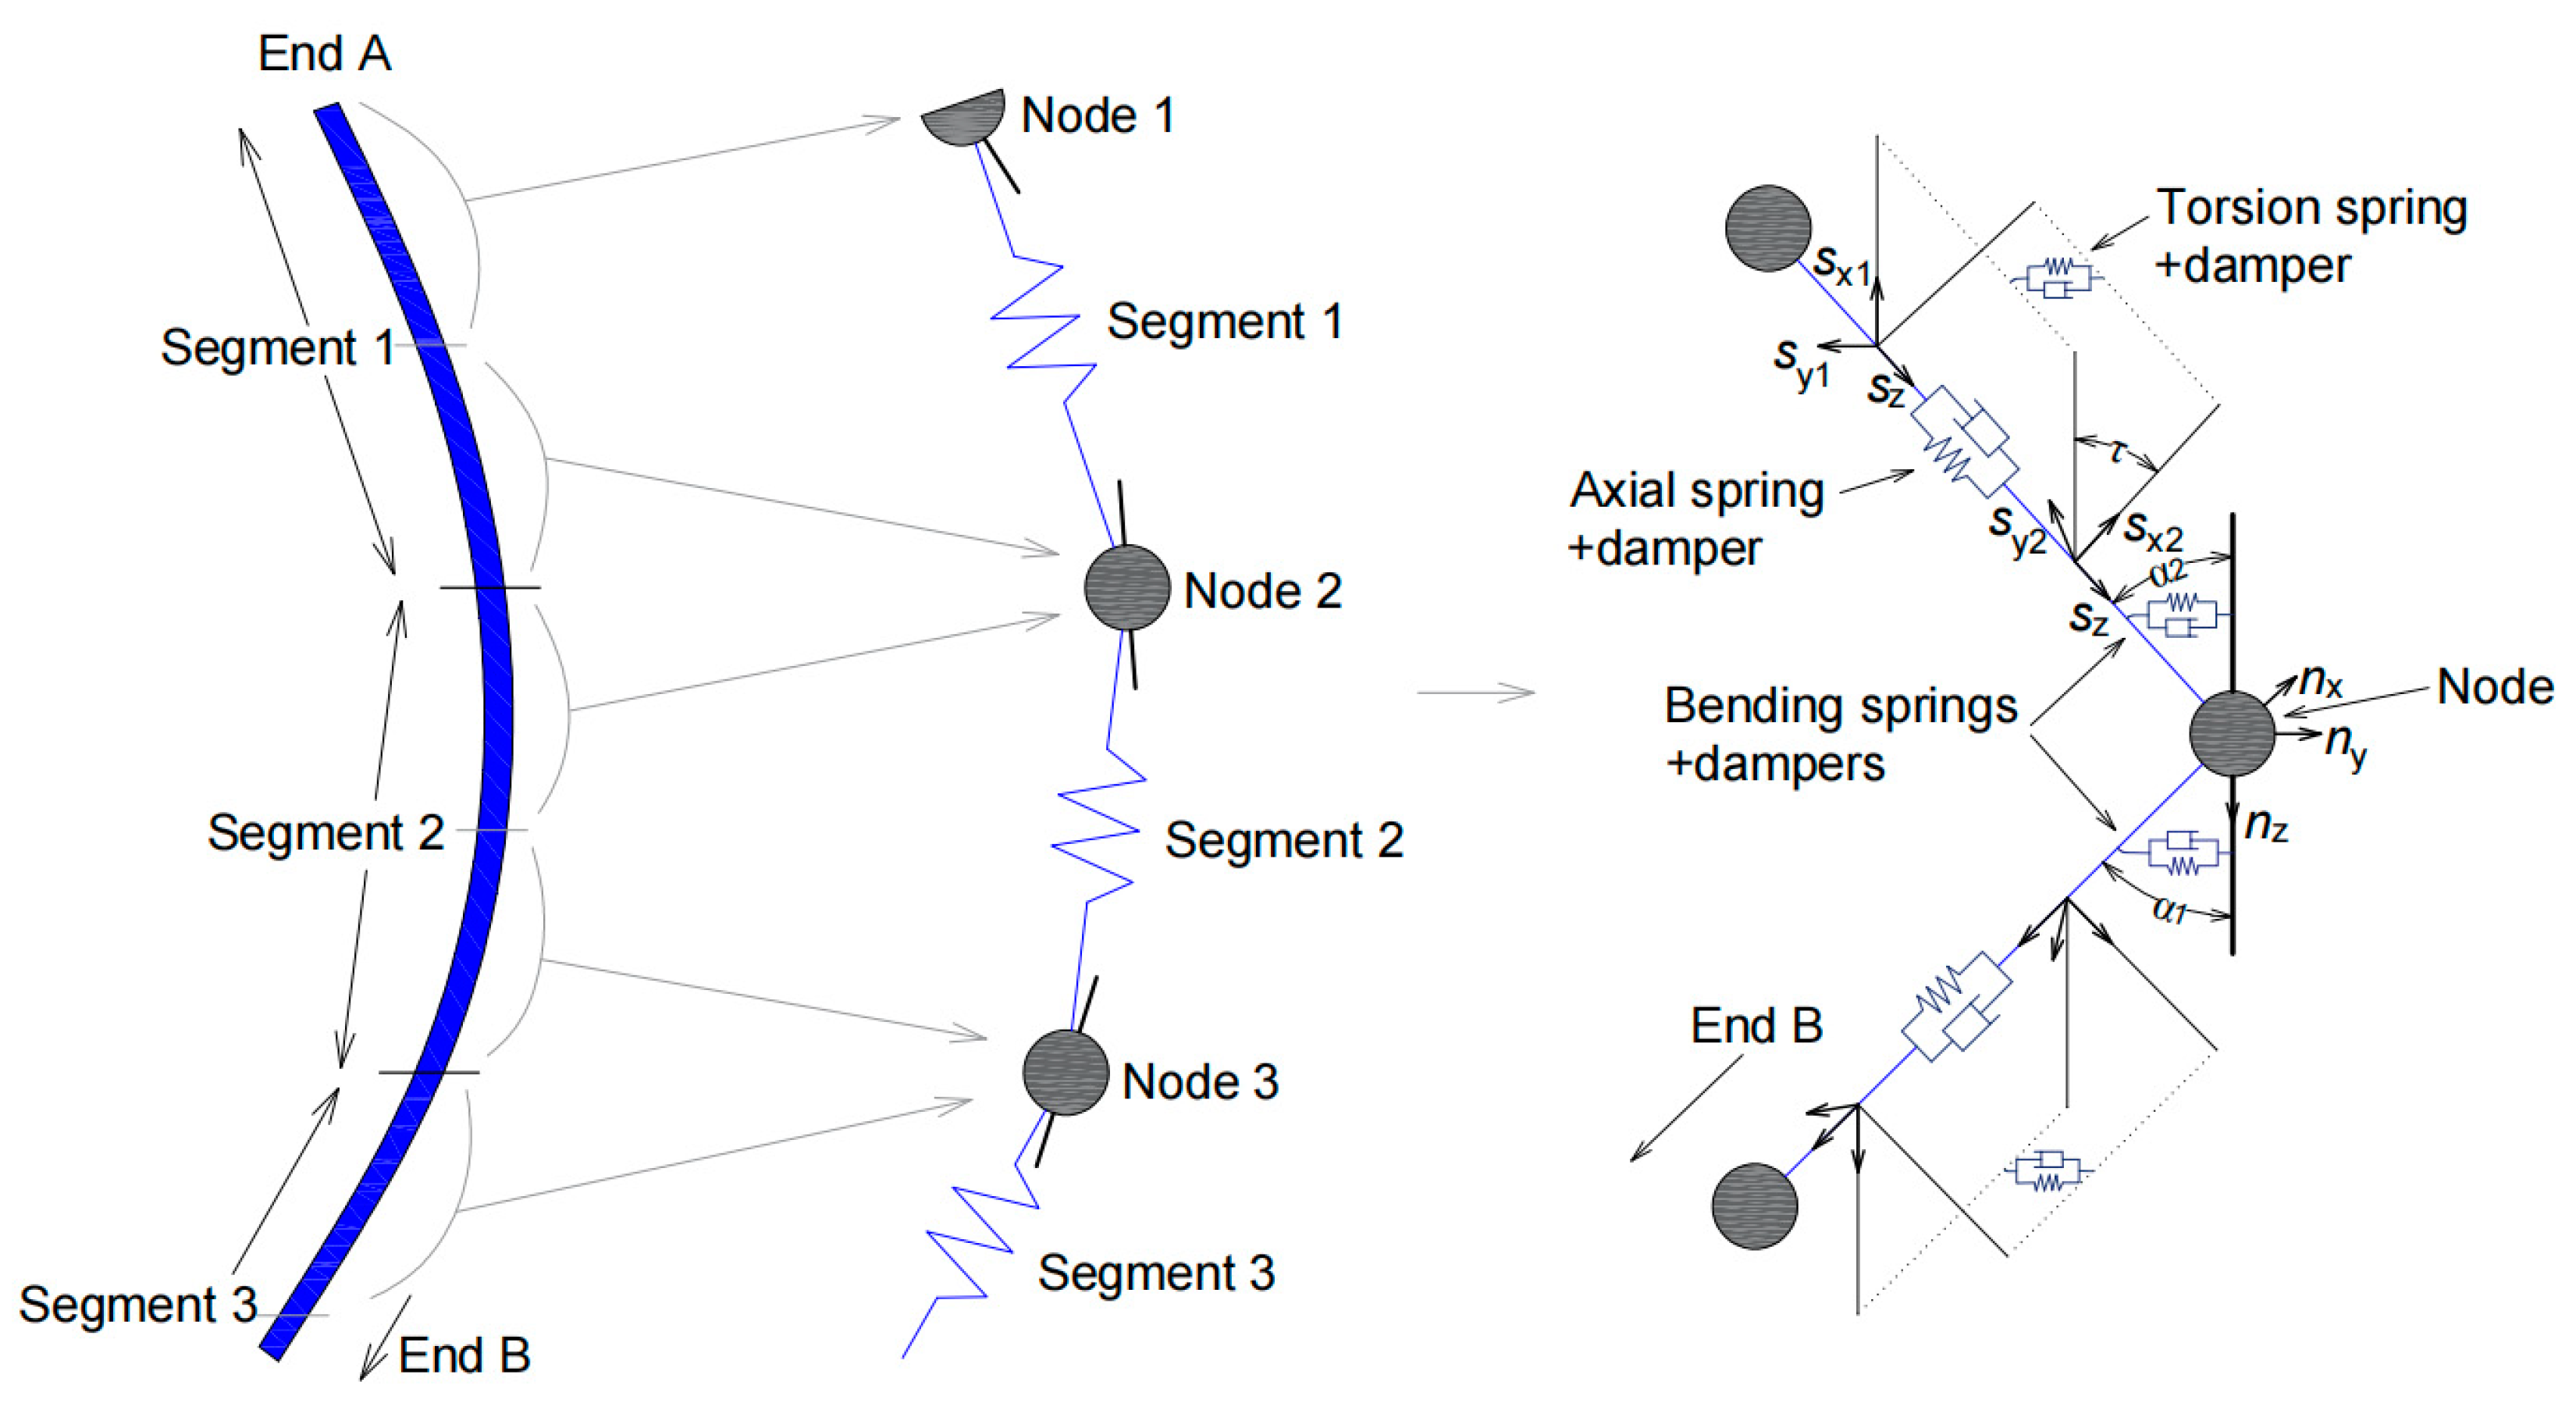
2.4. Modeling Method of the Mooring System

The mooring system is the foundation of the platform in the marine environment, so it is essential to accurately analyze the dynamic response of the mooring system. This paper employs the finite element model [34] to investigate the dynamic response of mooring lines. The finite element model of the mooring line is shown in Figure 8:
In the finite element model, the mooring line is divided into a series of segments and nodes. Each segment is modeled by massless elements, incorporating axial and torsional spring-dampers to simulate the axial and torsional characteristics of the line. Each node effectively represents a short straight rod that accounts for the two half-segments on either side of it. Other properties of the segments, such as mass, weight, buoyancy, etc., are lumped at the corresponding nodes, where forces and moments are also applied. The bending properties of the line are represented by bending spring-dampers between the segments and nodes. However, in this paper, the mooring line is modeled using chains; thus. the bending stiffness can be neglected. According to Newton’s second law, the equation of motion for each node can be expressed as [3]:
M p , a + C p , v + K p = F p , v , t
where M p , a is the inertial load; C p , v is the damping load; K p is the stiffness load; F p , v , t is the external load; p , v , and a represent the position, velocity, and acceleration of the node, respectively; and t represents time.
By solving the motion equations for all nodes using the finite difference method, the position, velocity, and acceleration of each node can be obtained. This enables the dynamic response analysis of the entire mooring line.

2.5. Time-Domain Motion Equation

Considering various loads acting on the platform (excluding wind load), the equations of motion in the time domain for the platform and mooring system can be expressed as
M + m x ¨ t + C x ˙ t + K x t = F w t + F c t + F m t + F n t
where M is the platform mass matrix; m is the additional mass matrix of the platform; C is the damping matrix; K is the static stiffness matrix of the platform; F w is the wave load; F c is the current load; F m is the restoring force provided by the mooring system; F n is the hydrodynamic force acting on the netting.
In the time-domain analysis, the platform and the mooring system are considered as a unified whole. Given the initial conditions, the above equation allows for iterative solutions of the overall motion and forces at each time step.

3. Case Study

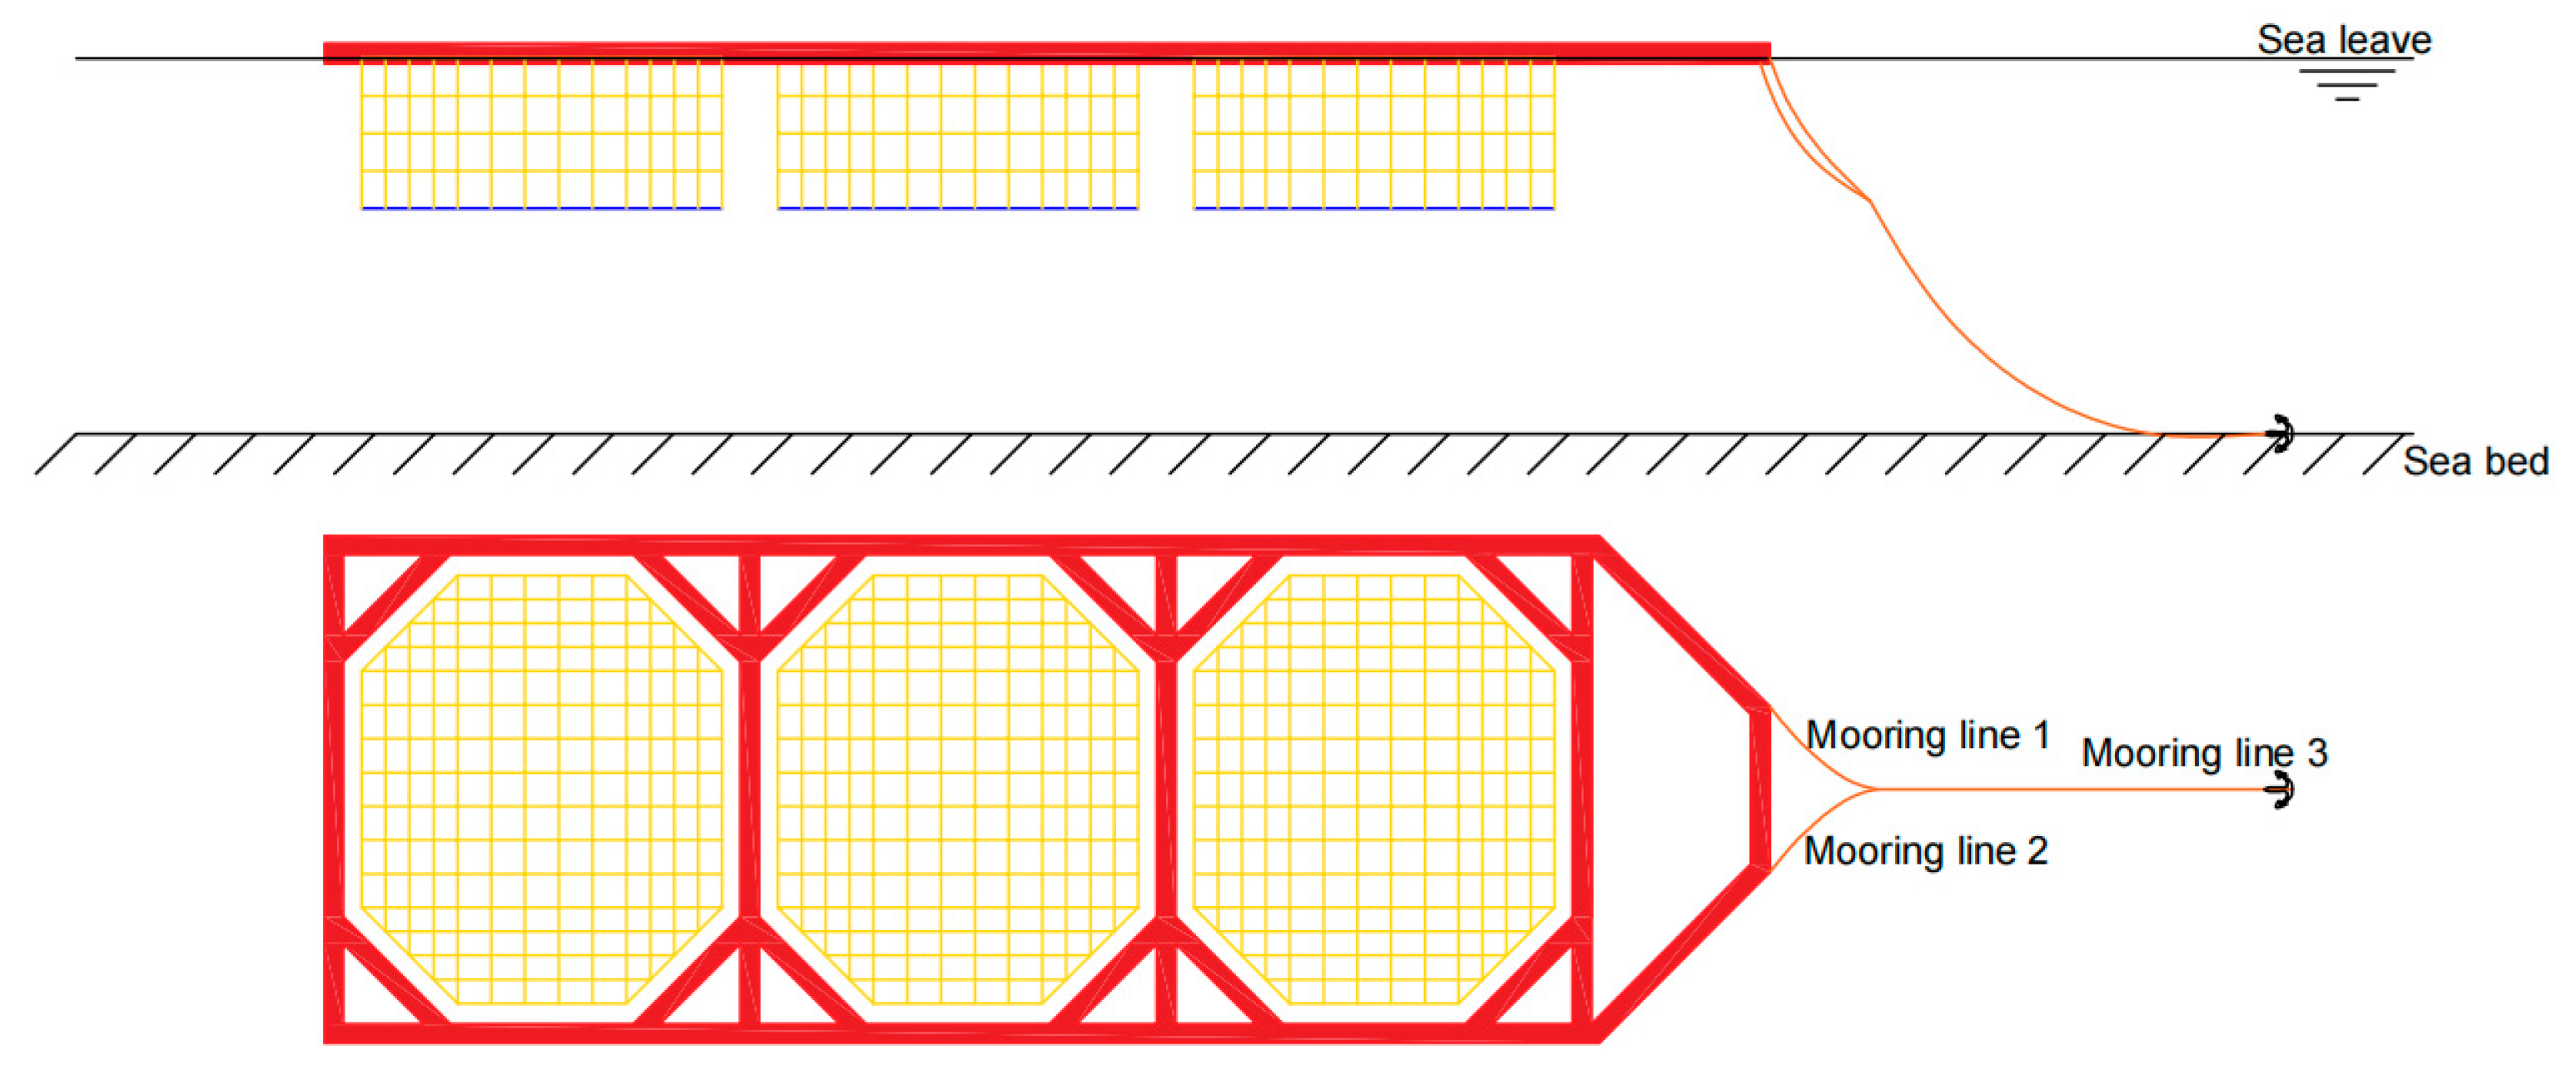
3.1. Description of the Platform

3.1.1. Design Concept and Main Parameters of the Platform

The innovative deep-sea aquaculture platform studied in this paper consists of the main structure and the netting system, as illustrated in Figure 9. The frame of the main structure is ship-shaped and made of steel. Underneath the frame, floats made of HDPE material are arranged, which provide buoyancy and reduce costs. The frame and the floats are connected by bolts. The setup includes three cages, with walkways between adjacent cages to facilitate staff access for managing the aquaculture conditions within each cage. The main parameters of the platform and the cages are shown in Table 2 and Table 3, respectively.
Compared to traditional gravity cages, the platform design presented in this paper addresses the needs for integration, scalability, and automation in deep-sea aquaculture; it also requires less steel and incurs lower investment costs than large-scale aquaculture platforms. This makes it a more economically viable option while still meeting the demands for modern, large-scale, and technologically advanced aquaculture operations.

3.1.2. Hydrodynamic Model of the Main Structure

Based on the main parameters of the platform, the geometric model of the main structure is established using ANSYS-APDL 18.0. After completing the modeling, the geometric model is meshed with a mesh size of 0.3 m. Subsequently, the hydrodynamic calculation model of the main structure is exported from ANSYS-AQWA 18.0, as shown in Figure 10. This model is then used to perform a frequency domain response analysis of the main structure.

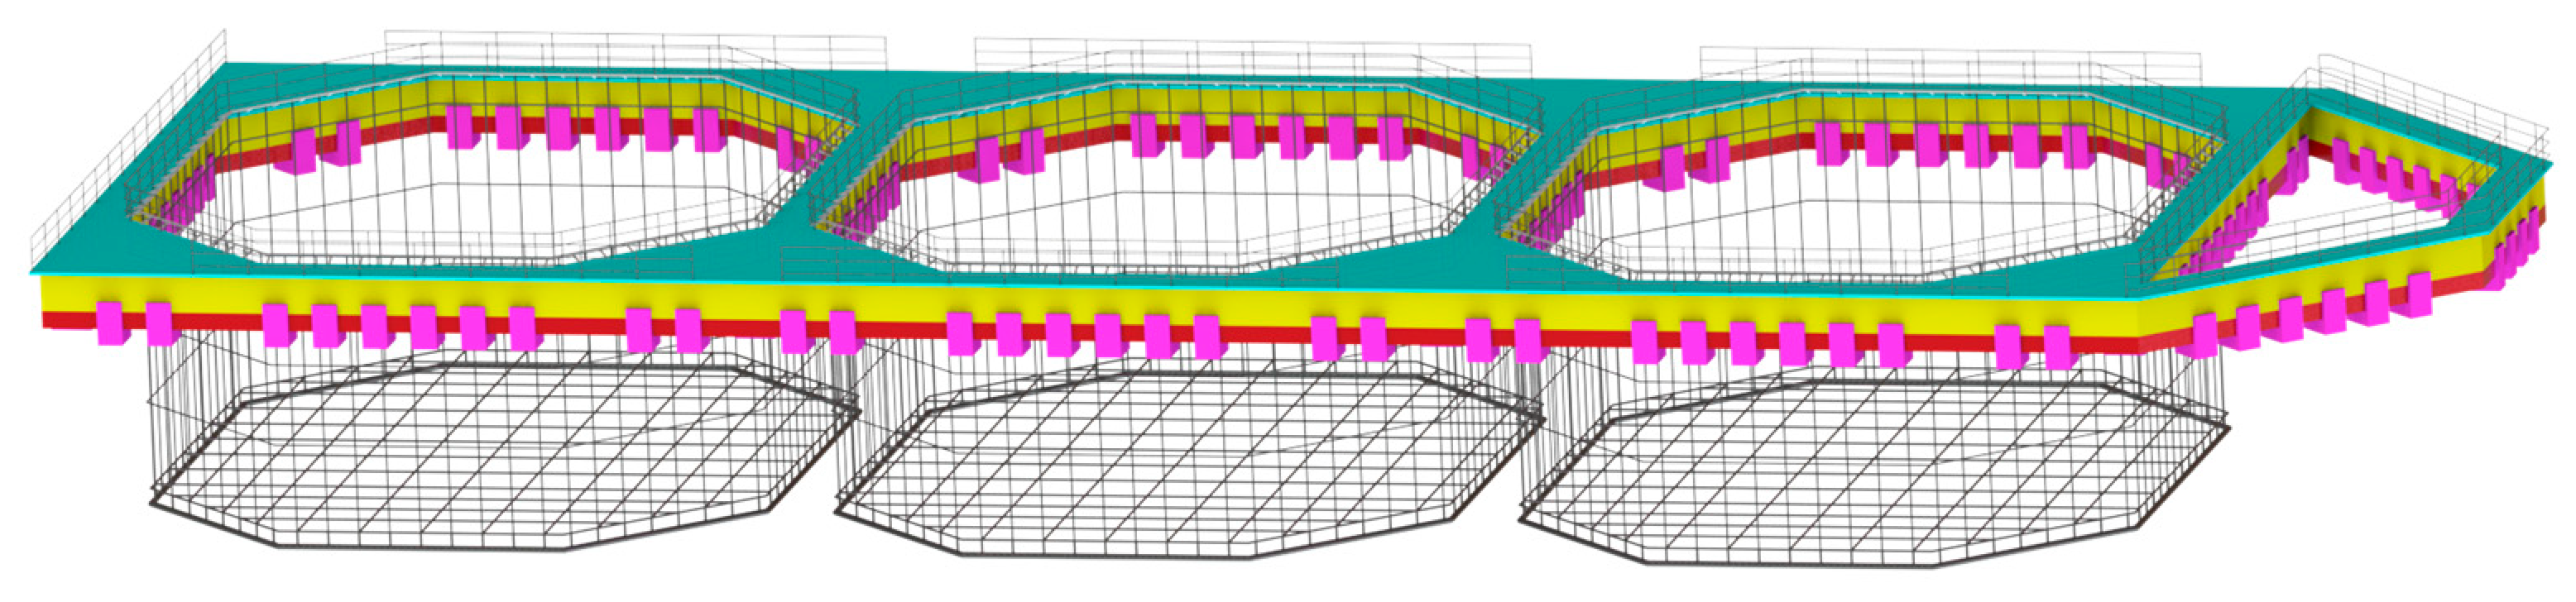
3.1.3. Numerical Model of the Platform

A numerical model of the platform and net system is established in OrcaFlex 11.1, as shown in Figure 11. Since OrcaFlex cannot perform 3D radiation-diffraction hydrodynamic calculations, it is necessary to input parameters such as gravity, buoyancy, and various hydrodynamic parameters obtained from frequency domain calculations into OrcaFlex. This allows for the time-domain coupled analysis of the overall dynamic response of the platform.

3.2. Mooring System Design and Optimization Scheme

3.2.1. Design Criteria

Considering the structural safety of the platform system, a comprehensive mooring design verification should include the Ultimate Limit State (ULS), Fatigue Limit State (FLS), and Accidental Limit State (ALS) according to DNVGL [35]. This paper focuses on ULS design verification, with FLS and ALS analyses planned for future research. The main criteria for the design and optimization of the mooring system in this paper are the following:
(1)
Given the importance of the safety of the platform structure and the stability of its internal environment, the displacement of the platform must be restricted to a reasonable range.
(2)
The mooring lines must be sufficiently strong. Taking safety factors into account, the maximum tension in the mooring lines must not exceed the allowable stress. While a comprehensive mooring design typically considers fatigue damage, this paper specifically focuses on limit states.
(3)
The mooring lines should be long enough to ensure that even when the platform reaches its maximum offset position, a portion of the mooring lines still remains in contact with the seabed, ensuring that the anchor structures only bear horizontal forces and not vertical forces.

3.2.2. Design Basis

The platform mooring system employs a single-point mooring method, as illustrated in Figure 12. To enhance platform stability, the mooring system is divided into two main sections. The upper part consists of two anchor chains of equal length, each attached to the bow of the platform on opposite sides, converging at a single point with the Mooring Line 3 at the bottom. Considering the economic efficiency and durability of the mooring system, the mooring lines use R3 grade stud link anchor chains, with specific parameters detailed in Table 4. This paper selects a drag embedment anchor (DEA), which can be adapted to different soil conditions by adjusting the rod angle.

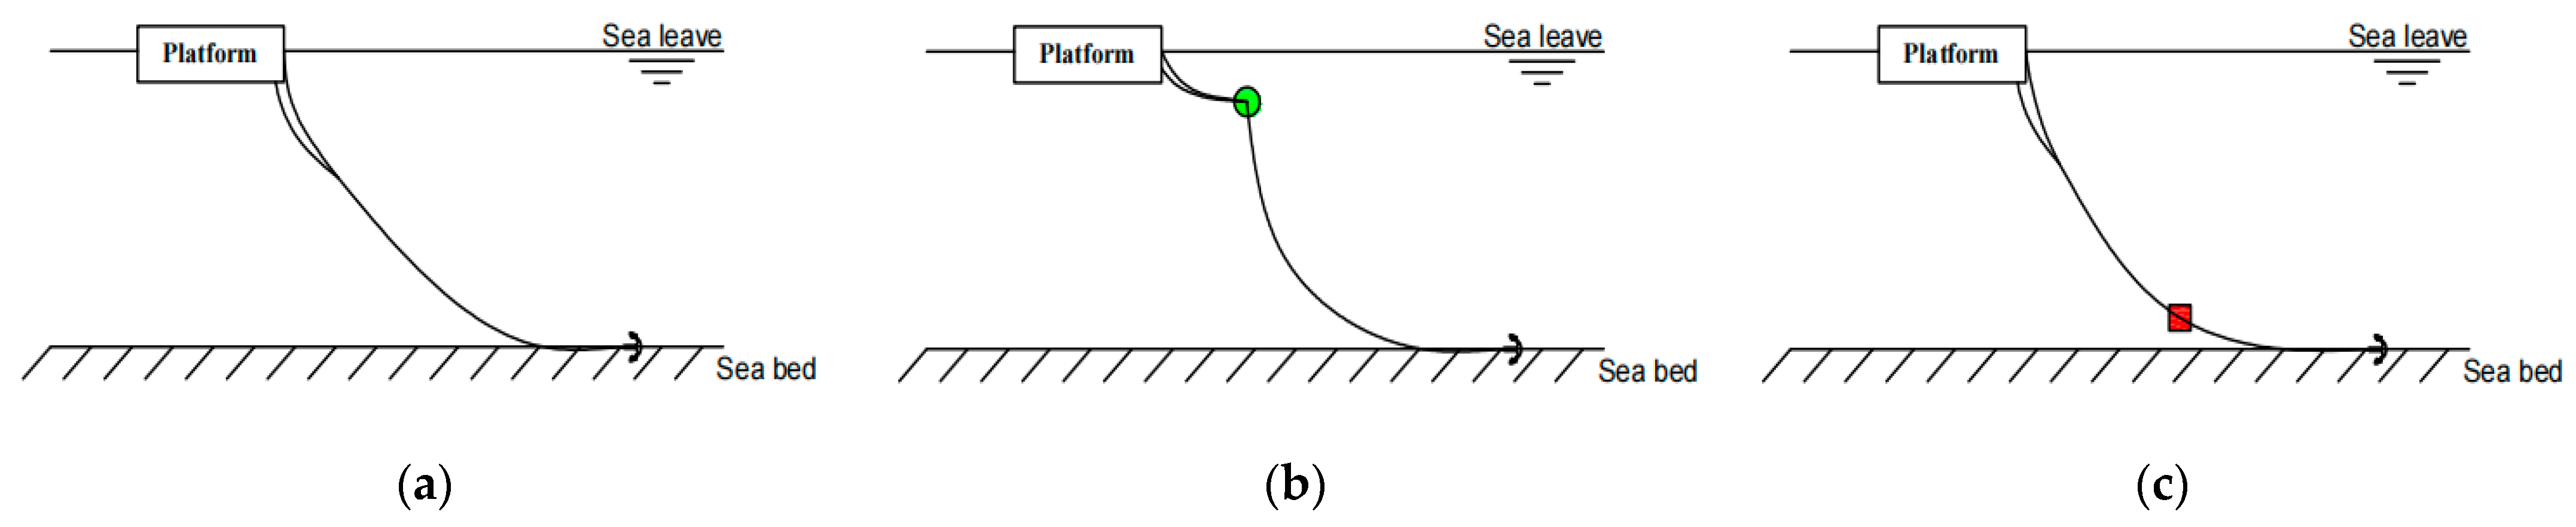
3.2.3. Mooring System Optimization Scheme

Mooring lines are crucial for the positioning of platforms. In deep-sea aquaculture platforms, the conditions due to waves and currents are complex. Therefore, selecting the appropriate length of mooring lines is essential for optimizing the motion response of the platform and enhancing the safety of the mooring system.
In mooring systems, buoys and sinkers are commonly used components that significantly impact the performance of the system. Adding buoys to the mooring lines typically reduces the weight of the lines, increases the horizontal stiffness of the system, and reduces the vertical loads on the platform. Including sinkers in the mooring system increases the weight of the mooring lines, enhancing the restoring force of the system. This improvement helps control the motion response of the platform, thereby achieving the goals of reducing costs and enhancing the characteristics of the mooring system.
Combining the design criteria from Section 3.2.1 and the design basis from Section 3.2.2, this paper proposes 11 mooring design schemes. These schemes are categorized into three types: Schemes I to III consider the impact of different mooring line lengths on the dynamic responses of the platform and the mooring system; Schemes IV to VII examine the effects of different buoyancy levels of buoys on the dynamic responses of the platform and the mooring system; Schemes VIII to XI address the impact of different weights of sinkers on the dynamic responses of the platform and the mooring system. The mooring design schemes are illustrated in Figure 13.
Table 5 summarizes the detailed attributes of each mooring system. The scenario without netting will serve as a reference to study the impact of netting on the dynamic responses of the platform and the mooring system. Relative to the global coordinate system, the X-axis and Z-axis coordinates of the buoys and sinkers are shown in Table 6.

3.3. Environmental Conditions

In the marine environment, the innovative deep-sea aquaculture platforms are primarily subjected to loads from waves and currents. This paper focuses on the optimization design of the mooring system, therefore prioritizing the ULS for computational analysis, while studies on the FLS and ALS will be conducted in the future.
In the mooring analysis, 0° indicates that the wave and current propagate along the positive direction of the X-axis, and 90° indicates propagation along the Y-axis. In this study, waves and currents are simulated in the same direction, both selected at 180°. The influence of water depth on the seawater flow rate is ignored, and the environmental conditions experienced by the platform are detailed in Table 7.

4. Results and Discussion

4.1. Response Amplitude Operators of the Main Structure

To investigate the hydrodynamic characteristics of the platform, this section considers the main structure of the platform as a rigid body. Without introducing the netting system and the mooring system, three-dimensional potential flow theory is applied to analyze the response of the platform to regular waves in the frequency domain. This analysis yields various hydrodynamic parameters of the platform under different wave frequencies and directions, including response amplitude operators (RAOs), radiation damping, added mass, first-order wave forces, and second-order wave forces.
Due to the directional sensitivity of the single-point mooring system and the platform’s symmetry, this section presents RAOs of the main structure only for wave directions ranging from 90° to 180°, as depicted in Figure 14. It is observed that the motion of the platform primarily occurs in the low-frequency range. Overall, as the frequency of incident waves increases, the RAOs tend to decrease, indicating favorable hydrodynamic characteristics of the structure.

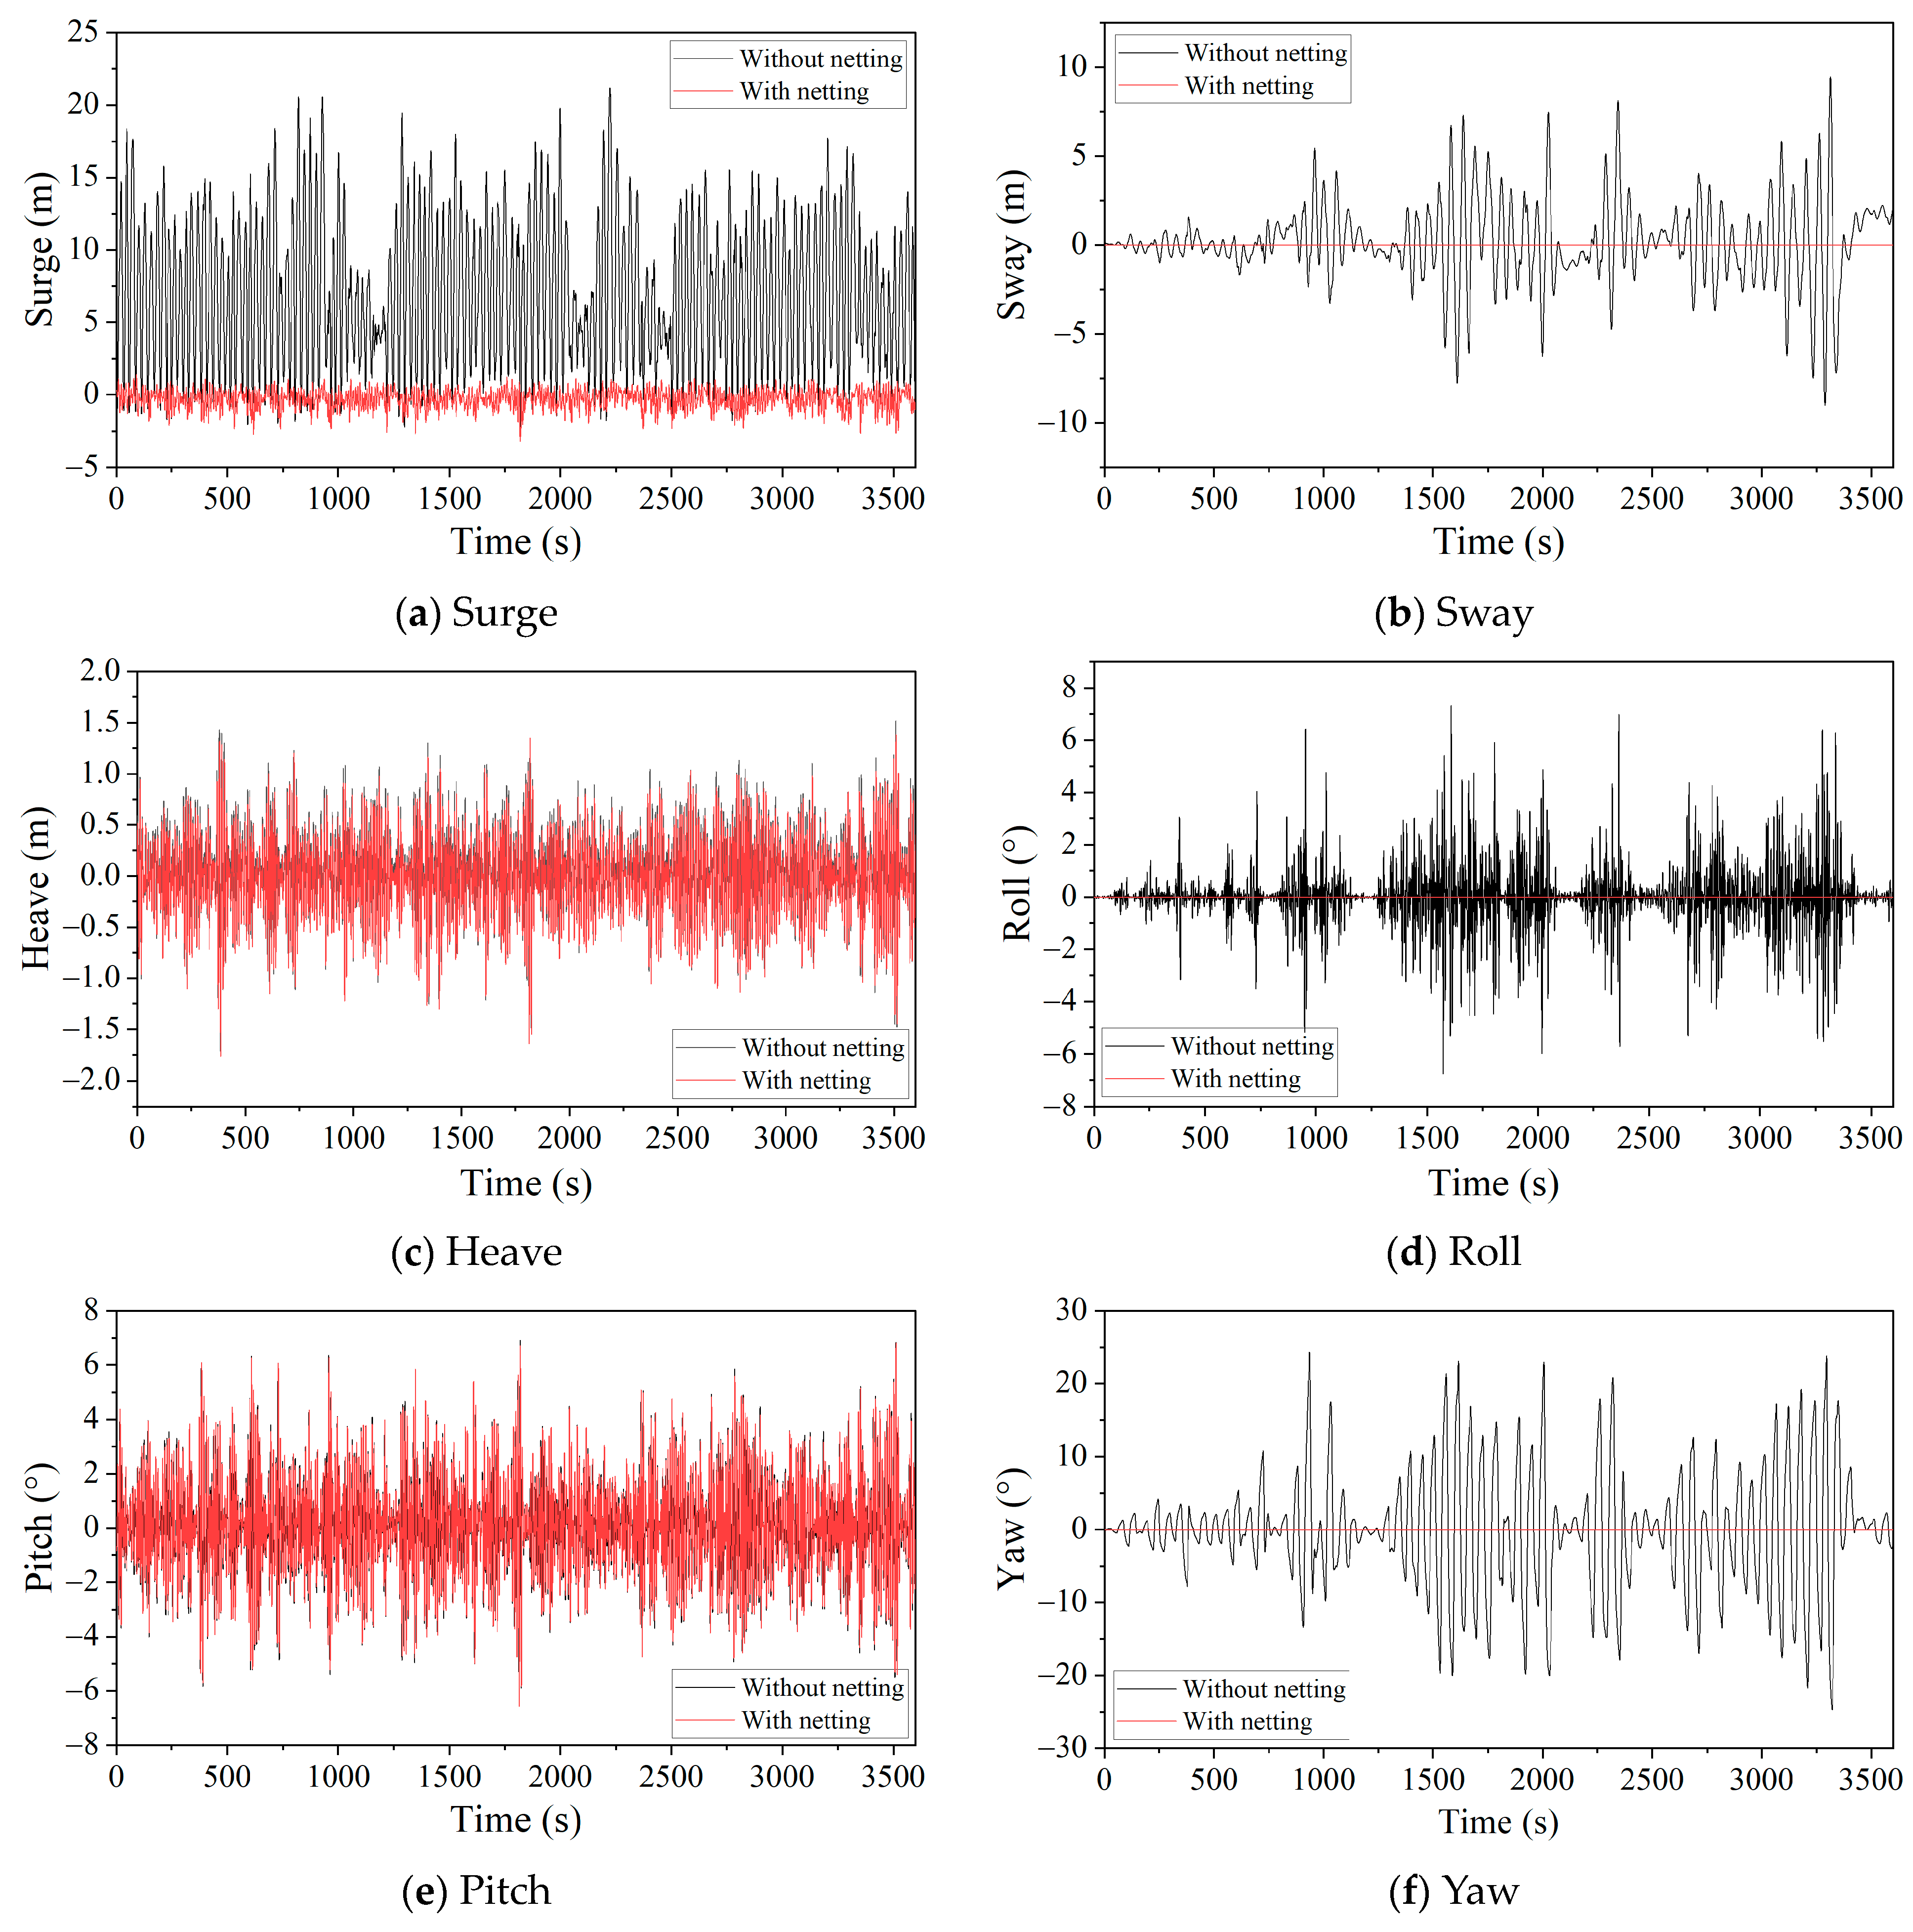
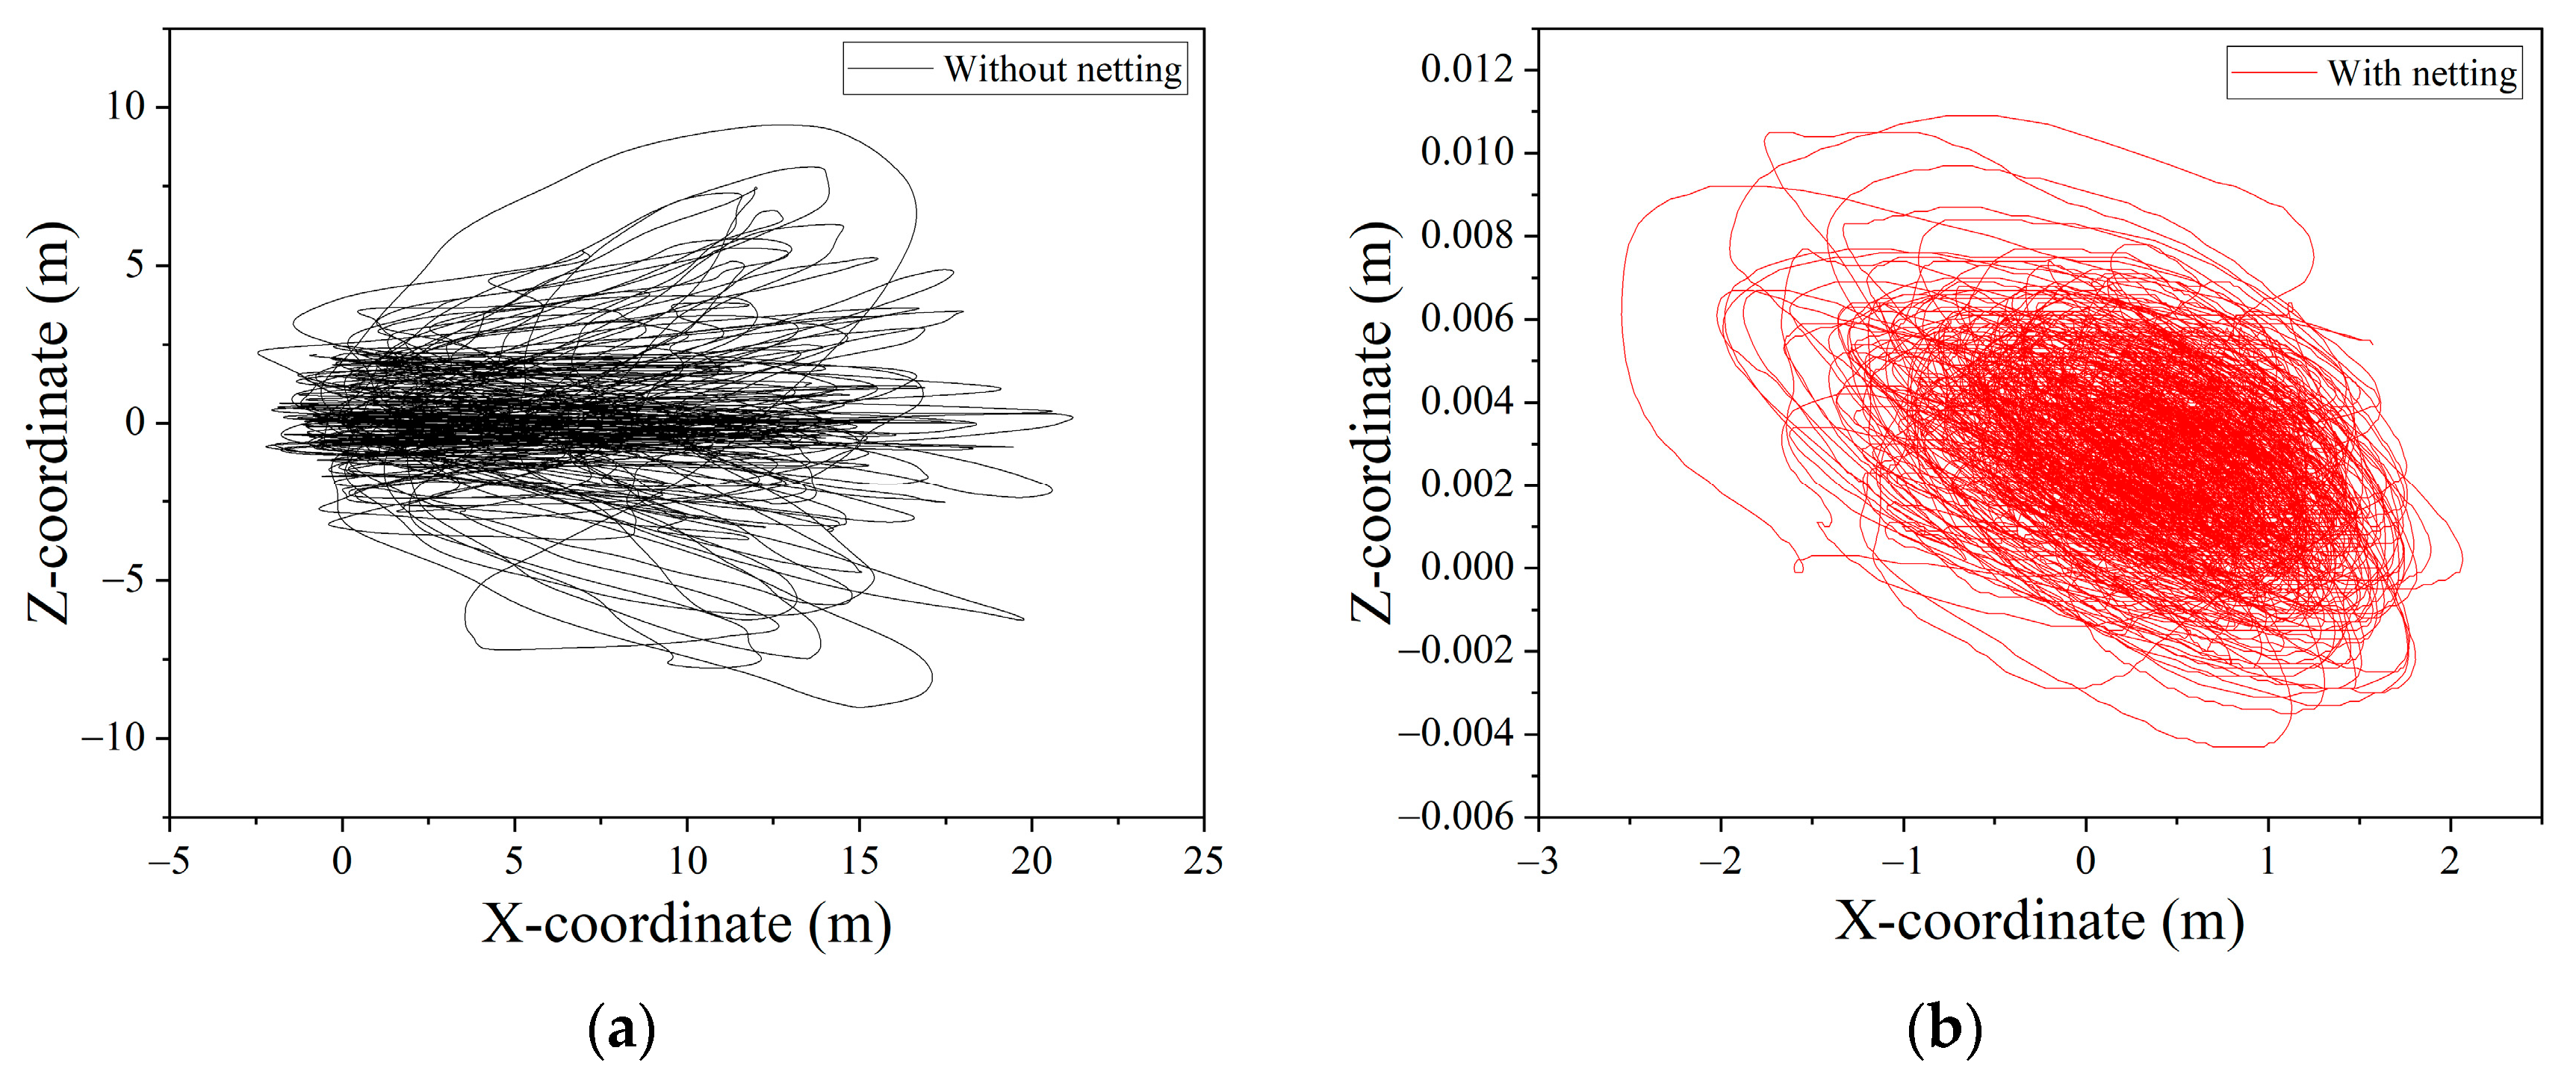
4.2. Influence of Netting System on Hydrodynamic Characteristics of the Platform

The netting system, as a flexible body structure with numerous nodes, presents a complex simulation challenge. Current research on the hydrodynamic properties of offshore aquaculture platforms often overlooks the impact of the netting system on the motion response of the platform, or it simulates this by adjusting the drag coefficient of platform to account for the presence of netting. However, as the netting system is a crucial component of deep-sea aquaculture platforms, it is essential to conduct thorough research on the netting structure to determine its influence on the dynamic response of both the platform and the mooring system.
Figure 15 shows the six degrees of freedom motion response of the platform with and without netting under extreme conditions, with statistical results presented in Table 8. For the numerical model without the netting structure, the platform exhibits greater motion response amplitudes in all six degrees of freedom. This study employs a catenary single-point mooring system, and when the platform is not aligned with the mooring lines, it is subjected to torques from wave and current loads, causing the platform to exhibit fish-tailing motion, primarily affecting the sway, roll, and yaw jointly. As shown in Figure 15b,d,f, the fish-tailing motion begins to manifest around 900 s into the simulation.
The occurrence of fish-tailing motion intensifies the loads and mooring line fatigue, posing a threat to the safety of the mooring system. After adding netting, except for the response in pitch, the amplitude and standard deviation of the motion response of the platform in the other degrees of freedom are significantly reduced. Specifically, the surge amplitude decreased from 11.820 m to 2.306 m; the sway amplitude reduced from 9.233 m to 0.008 m; the roll amplitude decreased from 7.033° to 0.004°; and the yaw amplitude dropped from 24.523° to 0.005°. This reduction is due to the increased damping provided by the netting structure, which offers a force along the direction of wave and current flow, correcting the tendency of the platform to yaw, reducing the fish-tailing motion, and, thus, enhancing platform stability.
Figure 16 illustrates that, compared to the scenario without netting system, the overall planar motion amplitude of the platform is significantly reduced with netting system installed.
Figure 17 illustrates the time history curves of mooring line tension responses for the platform with and without netting, with statistical results shown in Table 9. In both scenarios, Mooring Line 3 exhibits the highest tension response. For the numerical model without a netting structure, the tensions in Mooring Line 1 and Mooring Line 2 are 568.60 kN and 511.66 kN, respectively. Due to the intense fish-tailing motion of the platform, the maximum tension difference between the two lines is 59.64 kN, although their average tensions are essentially identical. After incorporating netting into the numerical model, the average tensions in each line show varying degrees of increase, while the standard deviations decrease. This change is attributed to the netting causing an overall increase in the flow load on the platform, but the increased damping reduces the amplitude of the motion response of the platform. Consequently, this leads to a higher average level of tension in the lines but with a tendency towards stability. For mooring line 1, the peak tension values are similar in both scenarios, which is because the tension in the mooring line is related to the movement of the platform. Since the direction of the waves and the current is 180°, the smaller the surge value of the platform, the farther the platform is from the anchor point, resulting in a longer suspended segment of the mooring line and higher tension. As shown in Figure 15a, the minimum surge values of the platform are similar in both scenarios. Combined with the fish-tailing motion of the platform, this results in higher peak tension in mooring line 1 when the netting is absent.
The coordinates of the touchdown point are related to the catenary shape of the mooring line. Figure 18 displays the time history curve of the changes in the X-coordinates of the mooring line touchdown points for the platform with and without netting. The overall trend shows an increase in the X-coordinate of the touchdown points following the addition of the netting structure. This increase is attributed to the enhanced wave and current loads experienced by the platform due to the netting, necessitating a greater restoring force from the mooring system. As a result, the length of the hanging segment of the mooring system is extended, causing the touchdown points on the seabed to shift further out.

4.3. Static Analysis of the Optimization Scheme

4.3.1. Pre-Tension of the Mooring Line

Adequate pre-tension can prevent significant displacements of the platform caused by environmental loads. In catenary mooring systems, the weight of the mooring line is a major factor affecting pre-tension. The pre-tension values for each design scenario are listed in Table 10. As expected, in scenarios IV to VII, where buoys are added to the mooring lines, the pre-tension in the lines decreases progressively with the increase in buoyancy of the buoys. Conversely, in scenarios VIII to XI, where sinkers are added to the mooring lines, the pre-tension in the lines increases as the weight of the sinkers increases. The length of the mooring lines has a minor impact on pre-tension.

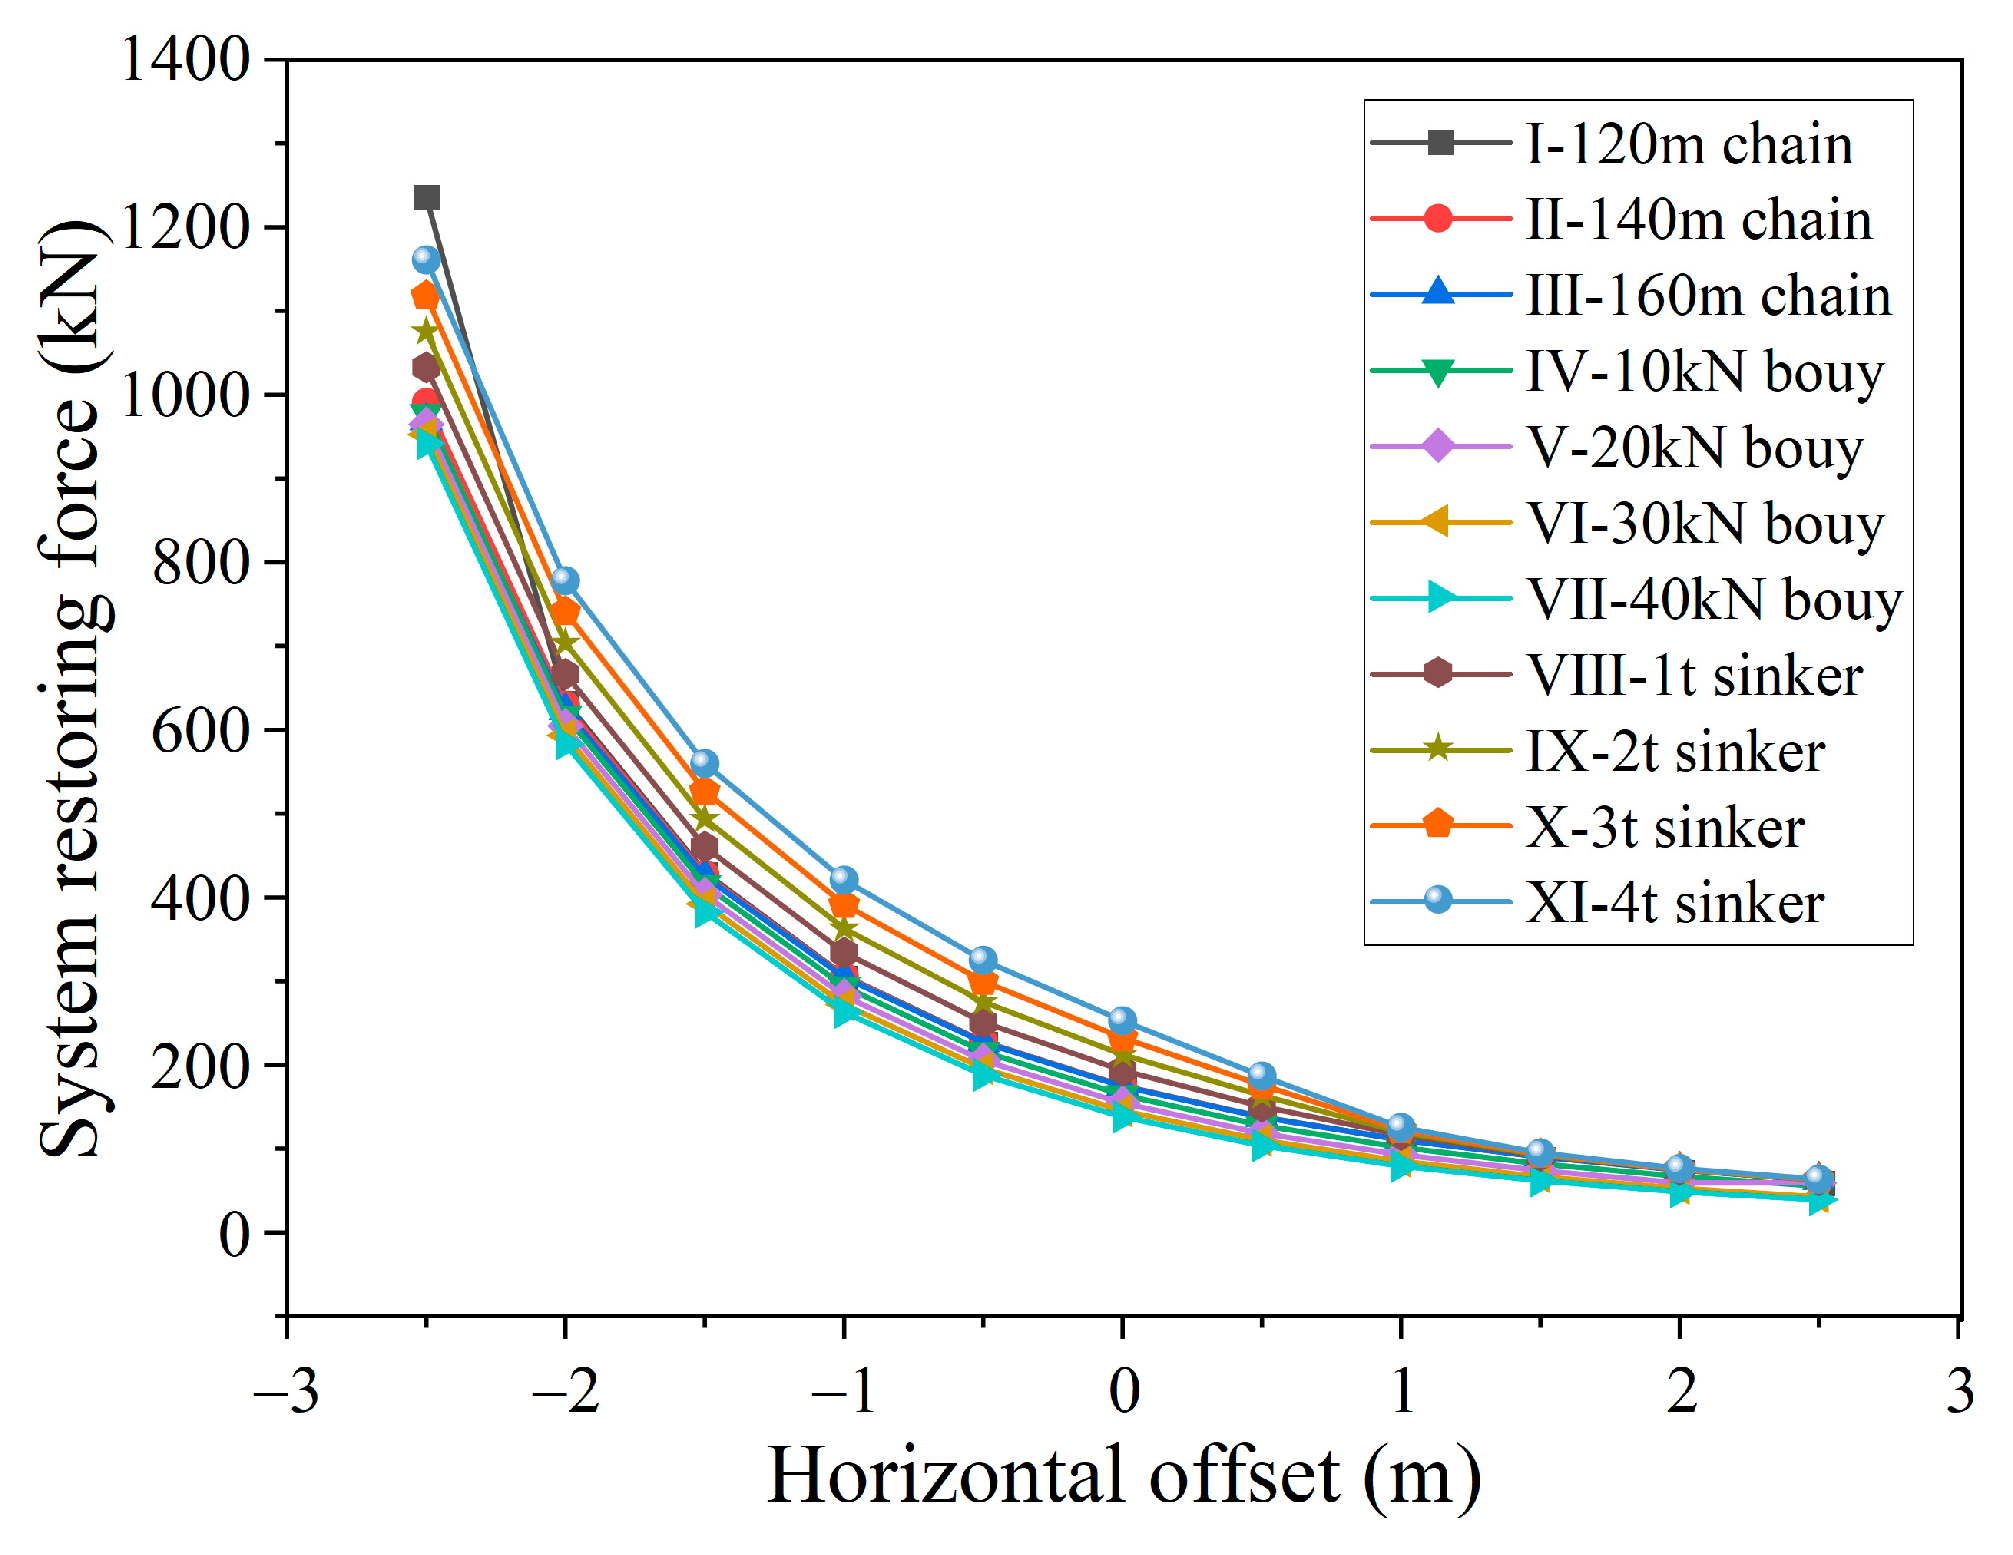
4.3.2. Offset Characteristics of the Mooring System

Figure 19 examines the variation characteristics of the top tension of the mooring lines at the fairlead as the platform shifts along the X-axis. As the platform moves closer to the anchor point, the decrease in top tension of the mooring lines in all scenarios exhibits a nonlinear behavior. In scenario Ⅰ, when the X-coordinate of the platform is at −2.5 m, the top tension of the mooring line is at its maximum. This could be due to the insufficiency in mooring line length, causing the lying segment on the seabed to be completely lifted off. After adding buoys to the mooring lines, the top tension decreases as the buoyancy of the buoys increases. Conversely, after adding sinkers to the mooring lines, the top tension increases with the mass of the sinkers when the platform is far from the anchor point. As the platform approaches the anchor point and the sinkers transition from a suspended state to resting on the seabed, the influence of the weight on the top tension of the mooring lines decreases. For reference, the total horizontal restoring force provided by the mooring system as the platform shifts along the X-axis is illustrated in Figure 20.

4.4. Dynamic Analysis of the Optimization Scheme

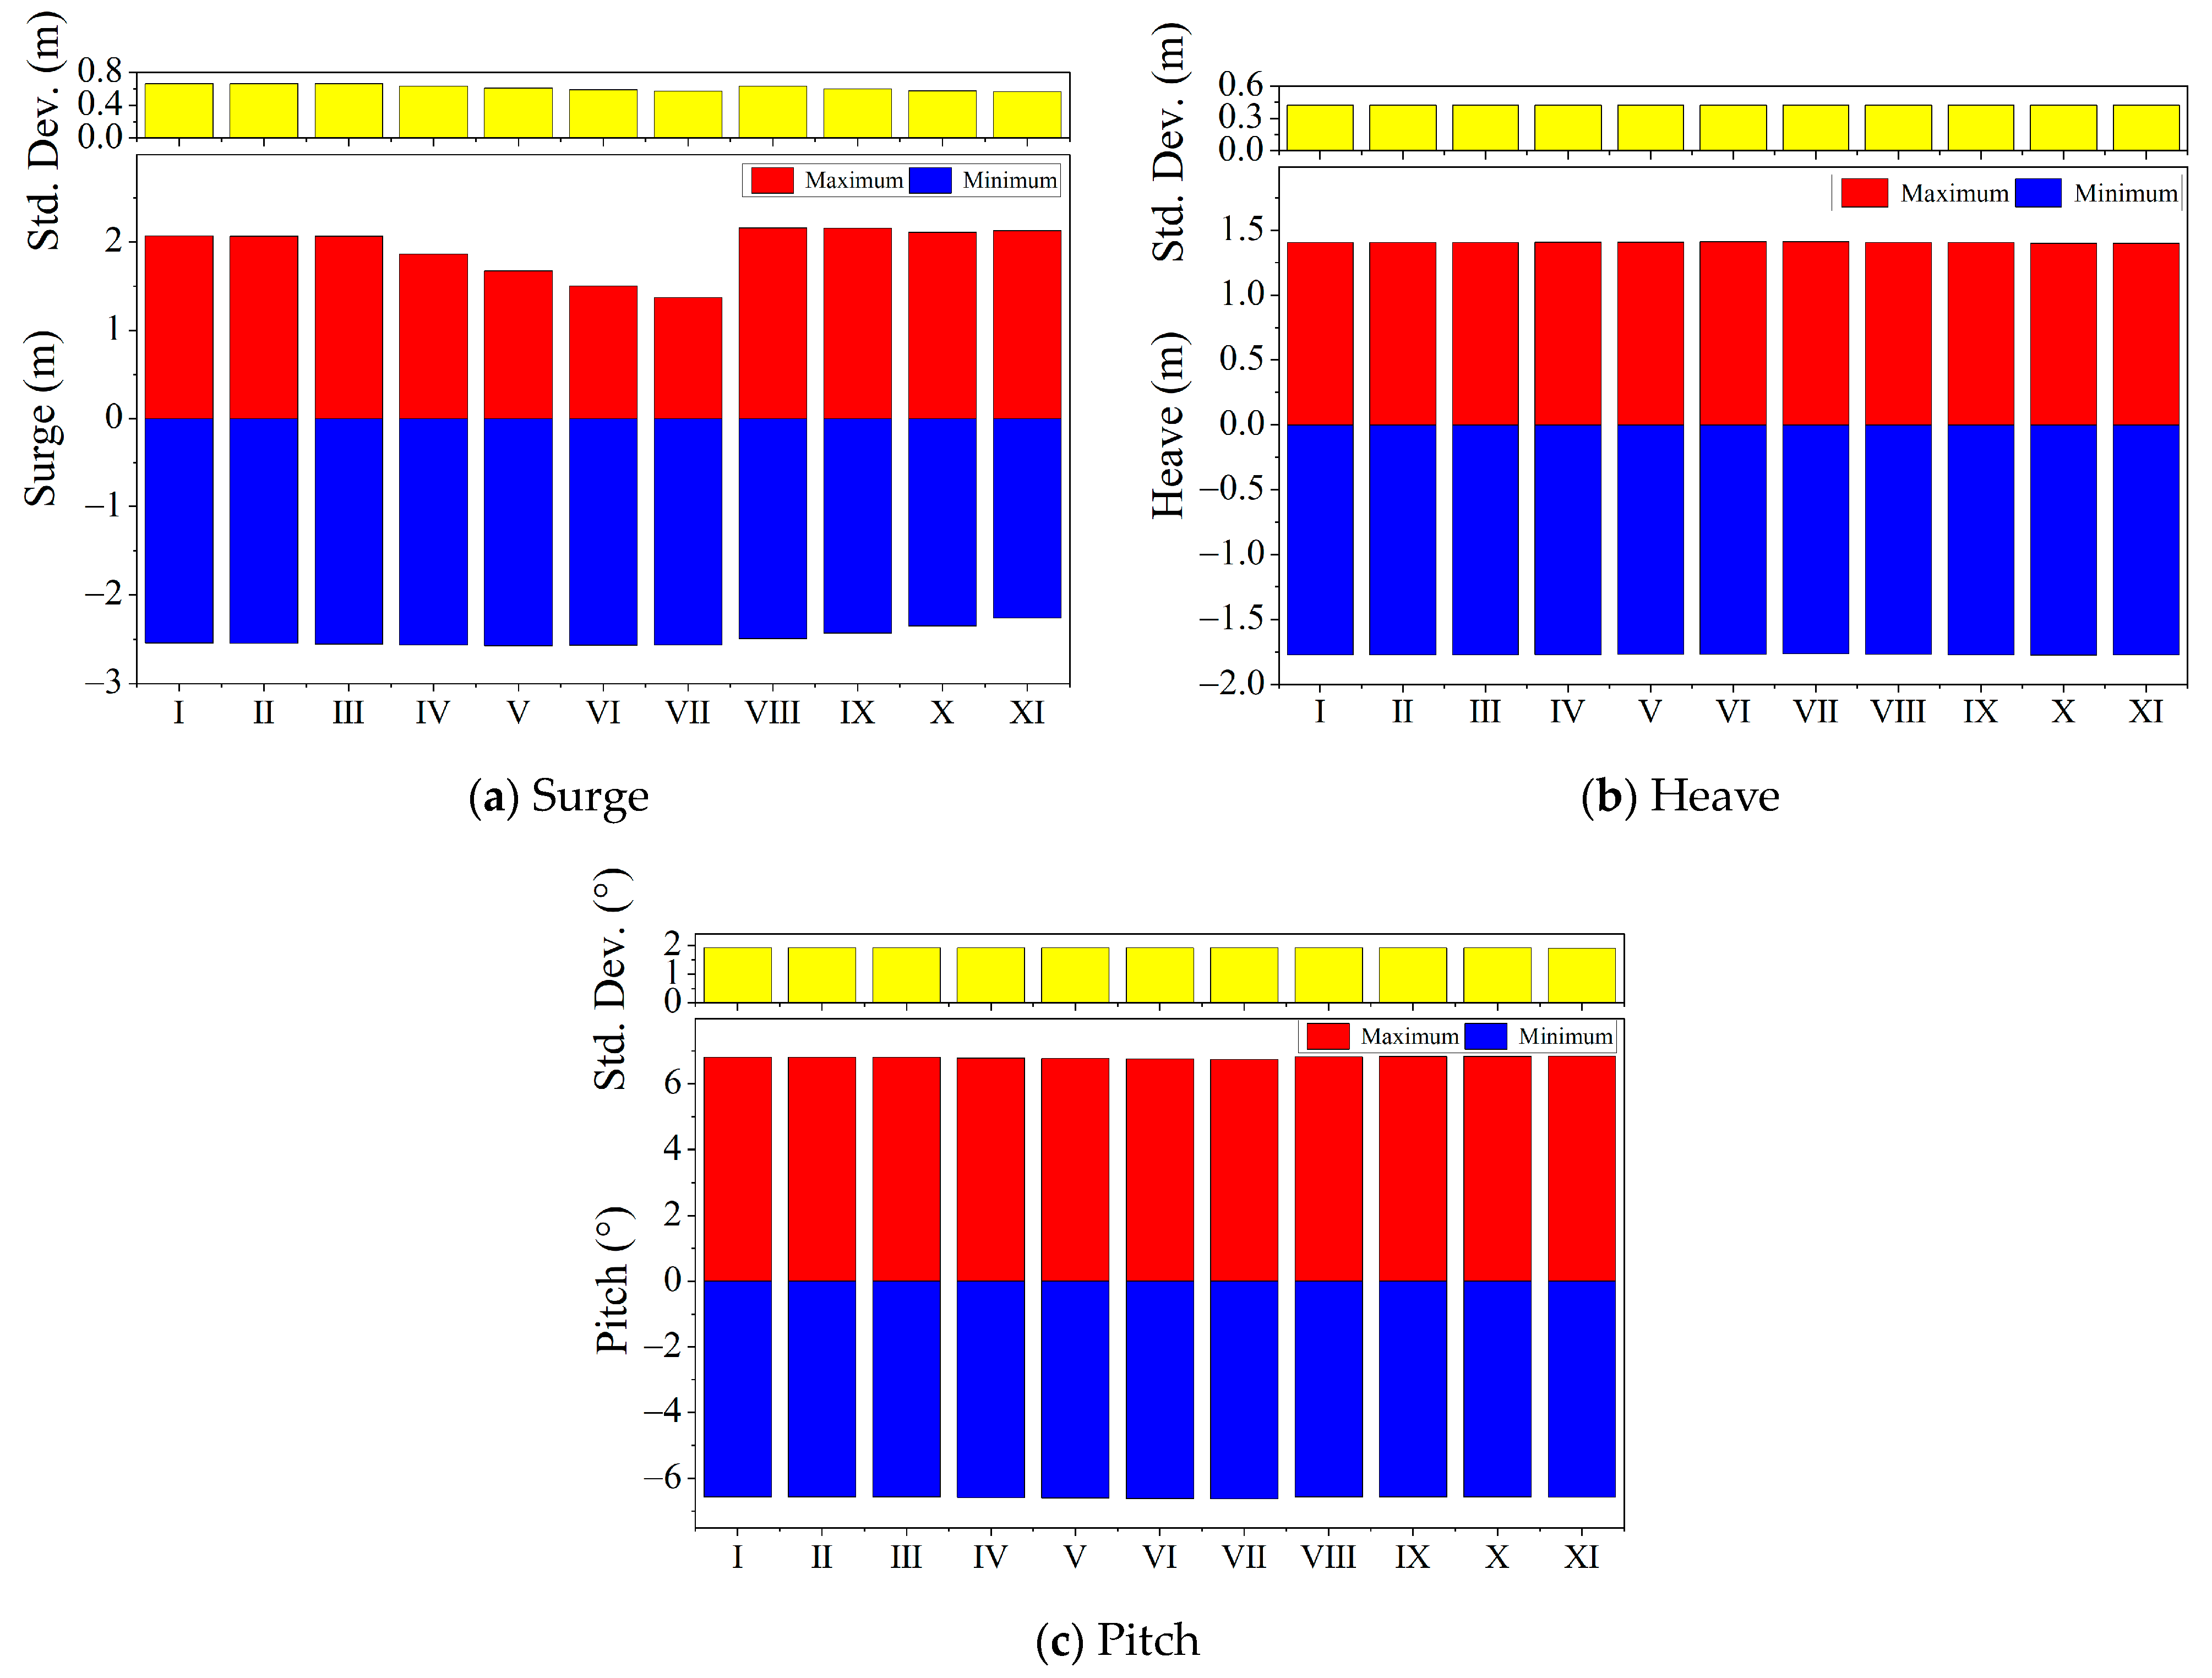
4.4.1. Motion Response of the Platform

The motion response statistics for the platform under various scenarios are shown in Figure 21, with a particular focus on the surge, heave, and pitch motions of the platform. It is observed that for the innovative deep-sea aquaculture platform, the motion response is not particularly sensitive to changes in the length of the mooring lines.
Adding buoys alters the motion characteristics of the platform. As the buoyancy of the buoys increases, both the amplitude and the standard deviation of the surge response gradually decrease. This could be because the addition of buoys to the mooring lines increases the horizontal stiffness of the mooring system, thereby reducing the horizontal displacement of the platform under external loads.
After incorporating sinkers into the mooring lines, as the mass of the sinkers increases, the surge amplitude of the platform decreases. Compared to the mooring system without sinkers, when the sinker mass is 4 tons, the surge amplitude of the platform decreases from 2.304 m to 2.192 m, a reduction of 4.86%, and the standard deviation of the surge amplitude decreases from 0.659 to 0.564, a reduction of 14.42%. This is because the sinkers increase the weight of the mooring lines, which is beneficial in enhancing the restoring force of the mooring system, thereby reducing the surge response of the platform.
Adding buoys or sinkers to the mooring lines results in minimal changes to platform heave and pitch responses. This phenomenon likely arises because the single-point mooring system does not effectively provide vertical restoring forces to the aquaculture cage. Consequently, vertical motion responses primarily depend on water particle movement. Therefore, integrating mooring components into the lines does not effectively control heave and pitch motion responses of the cage.

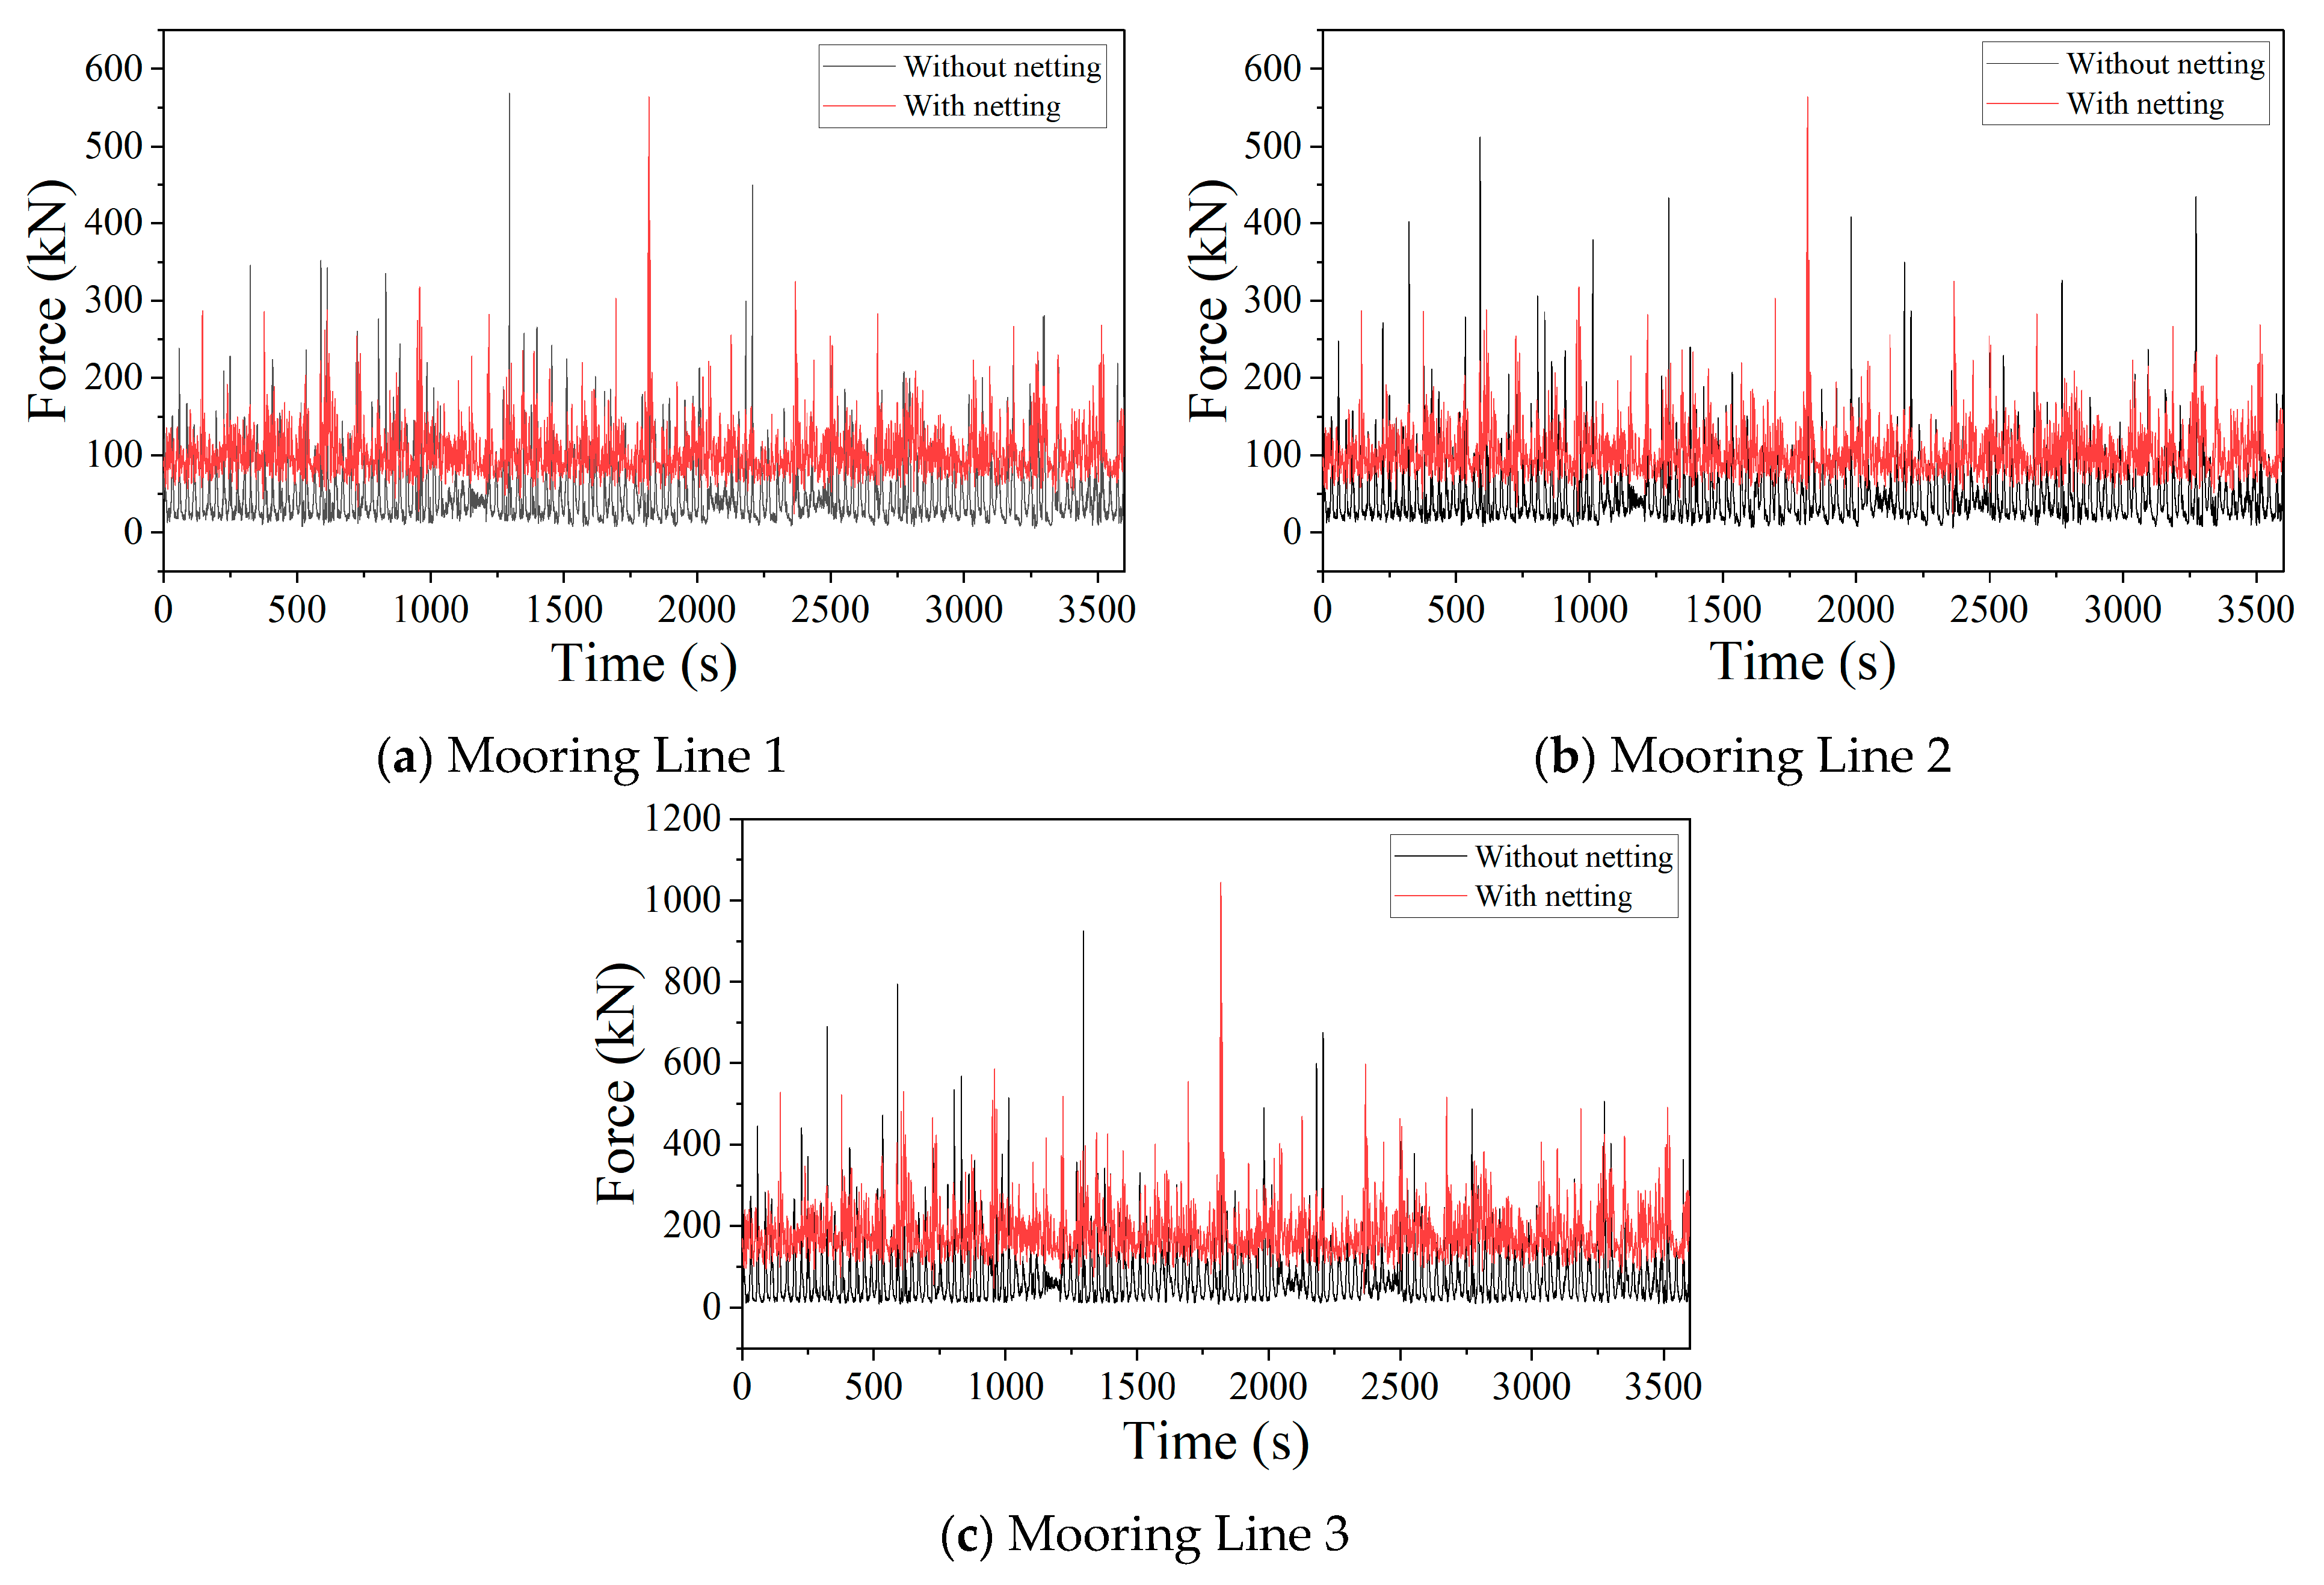
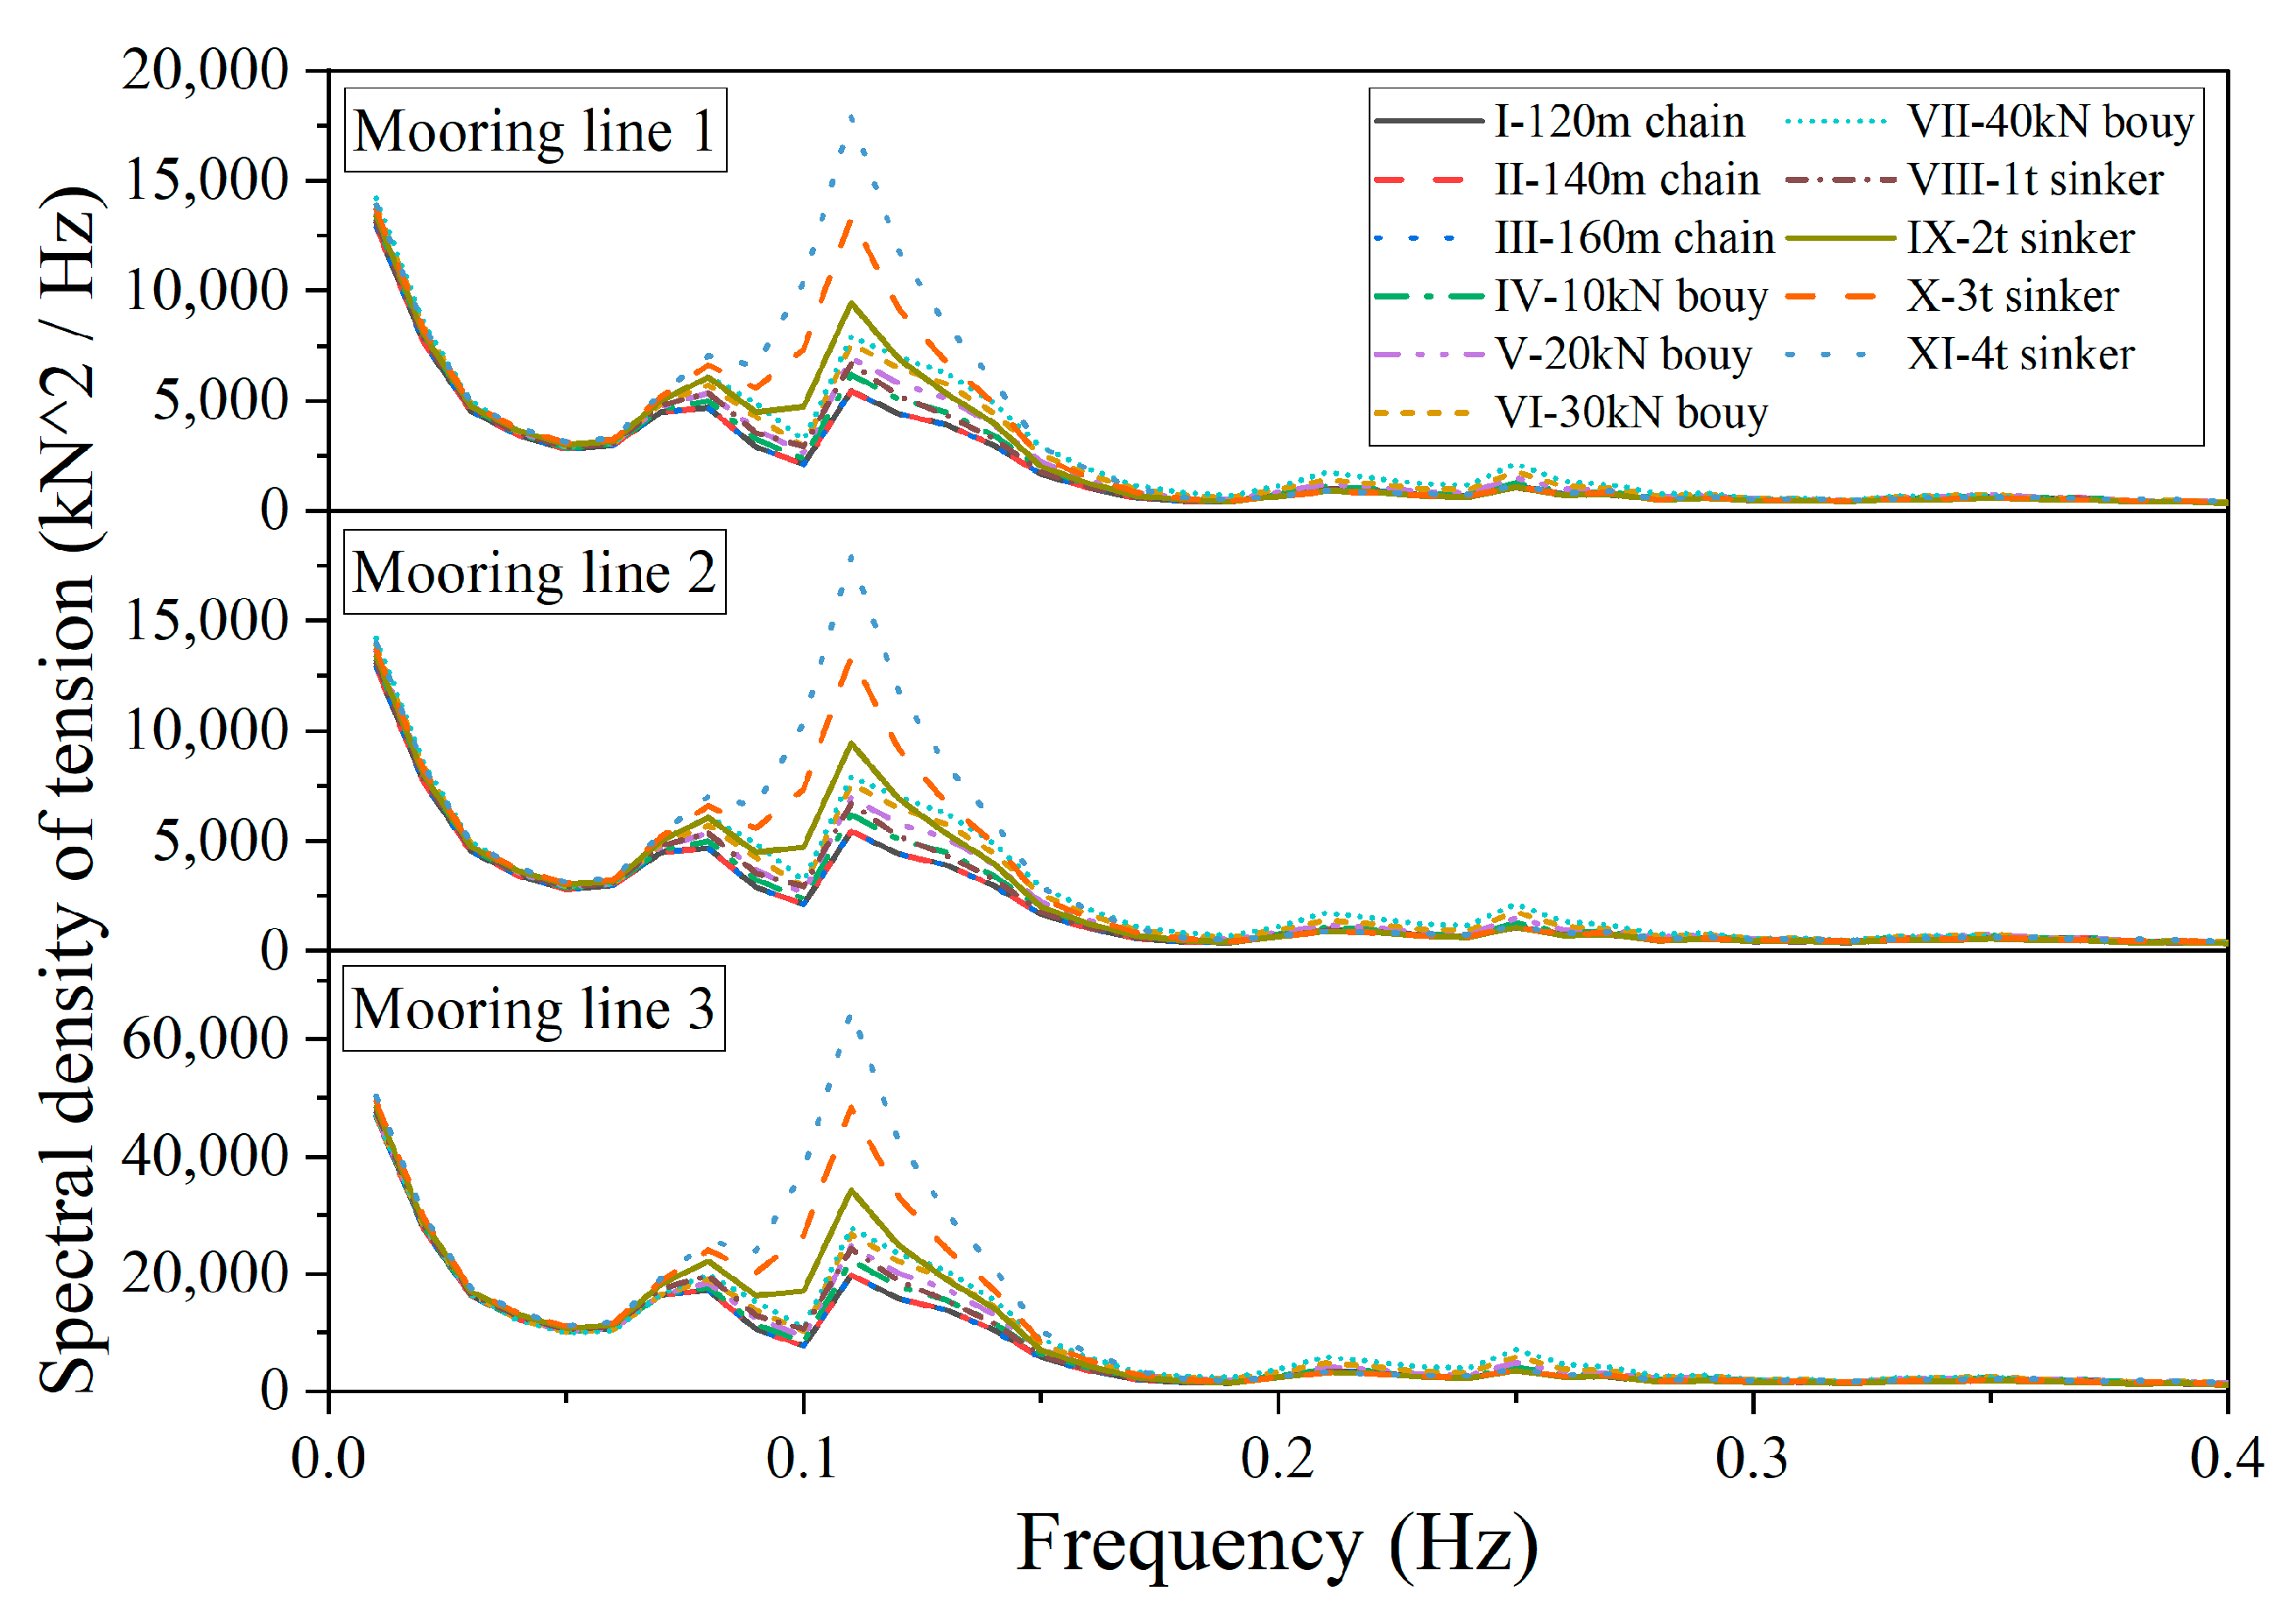
4.4.2. Mooring Line Tension

The statistical results of the tensions in the mooring lines for different scenarios are shown in Figure 22.
The analysis reveals that due to the symmetrical arrangement of Mooring Lines 1 and 2, the force conditions on these lines are quite similar across all cases, with Mooring Line 3 experiencing the highest degree of tension. As the length of the mooring lines increases, there is no significant change in the maximum and average tensions experienced by the lines.
As the buoyancy of the buoys increases, the maximum tension experienced by the mooring lines shows a trend of first decreasing and then increasing. This trend could be attributed to the fact that at lower buoyancies, adding buoys helps reduce the amplitude of the motion response of the platform, thereby reducing the peak tensions in the mooring lines. However, as the buoyancy of the buoys continues to increase, the dynamic response of the buoys themselves increases the load acting on the mooring lines, consequently causing an increase in peak tensions. Regarding the average tension experienced by the mooring lines, with the increase in buoyancy of the buoys, the average tension in Mooring Lines 1 and 2 gradually decreases, while the average tension in Mooring Line 3 gradually increases. This change might be due to the altered orientation of the mooring lines in the water after the addition of buoys. The presence of buoys shares the vertical load that would otherwise be fully imposed on the upper mooring lines, but it also causes the lower mooring lines to be lifted, increasing the hanging length of the mooring lines. This increase in hanging length results in a slight increase in the average tension experienced by Mooring Line 3.
After incorporating sinkers into the mooring lines, an increase in the mass of these weights significantly reduces the peak tensions in the lines. This reduction is likely due to the added damping effect of the sinkers, which minimizes the motion response of the platform and thereby decreases the maximum tension in the mooring lines. Specifically, when the weight of the sinker reaches 4 tons, the maximum tension in Mooring Line 1 decreases from 563.94 kN to 401.46 kN, a reduction of 28.81%, and the maximum tension in Mooring Line 3 decreases from 1044.87 kN to 737.38 kN, a reduction of 29.44%. Adding sinkers to the mooring lines increases the overall load-bearing level, causing a slight increase in the average tension of the lines as the mass of the sinkers increases. For instance, with a sinker of 4 tons, compared to a system without sinkers, the average tension in Mooring Line 1 increases from 104.86 kN to 106.70 kN, an increase of 1.75%, and the average tension in Mooring Line 3 increases from 184.14 kN to 187.06 kN, an increase of 1.59%.
Figure 23 investigates the power spectra of various mooring lines. For the platform structure, the impact of current-induced loads is significant, and the contribution of low-frequency responses to the overall tension response cannot be ignored. Altering the length of mooring lines has minimal impact on tension responses; however, adding mooring components alters the distribution of tension within the mooring lines, increasing wave frequency tension responses, with sinkers having a more pronounced effect.

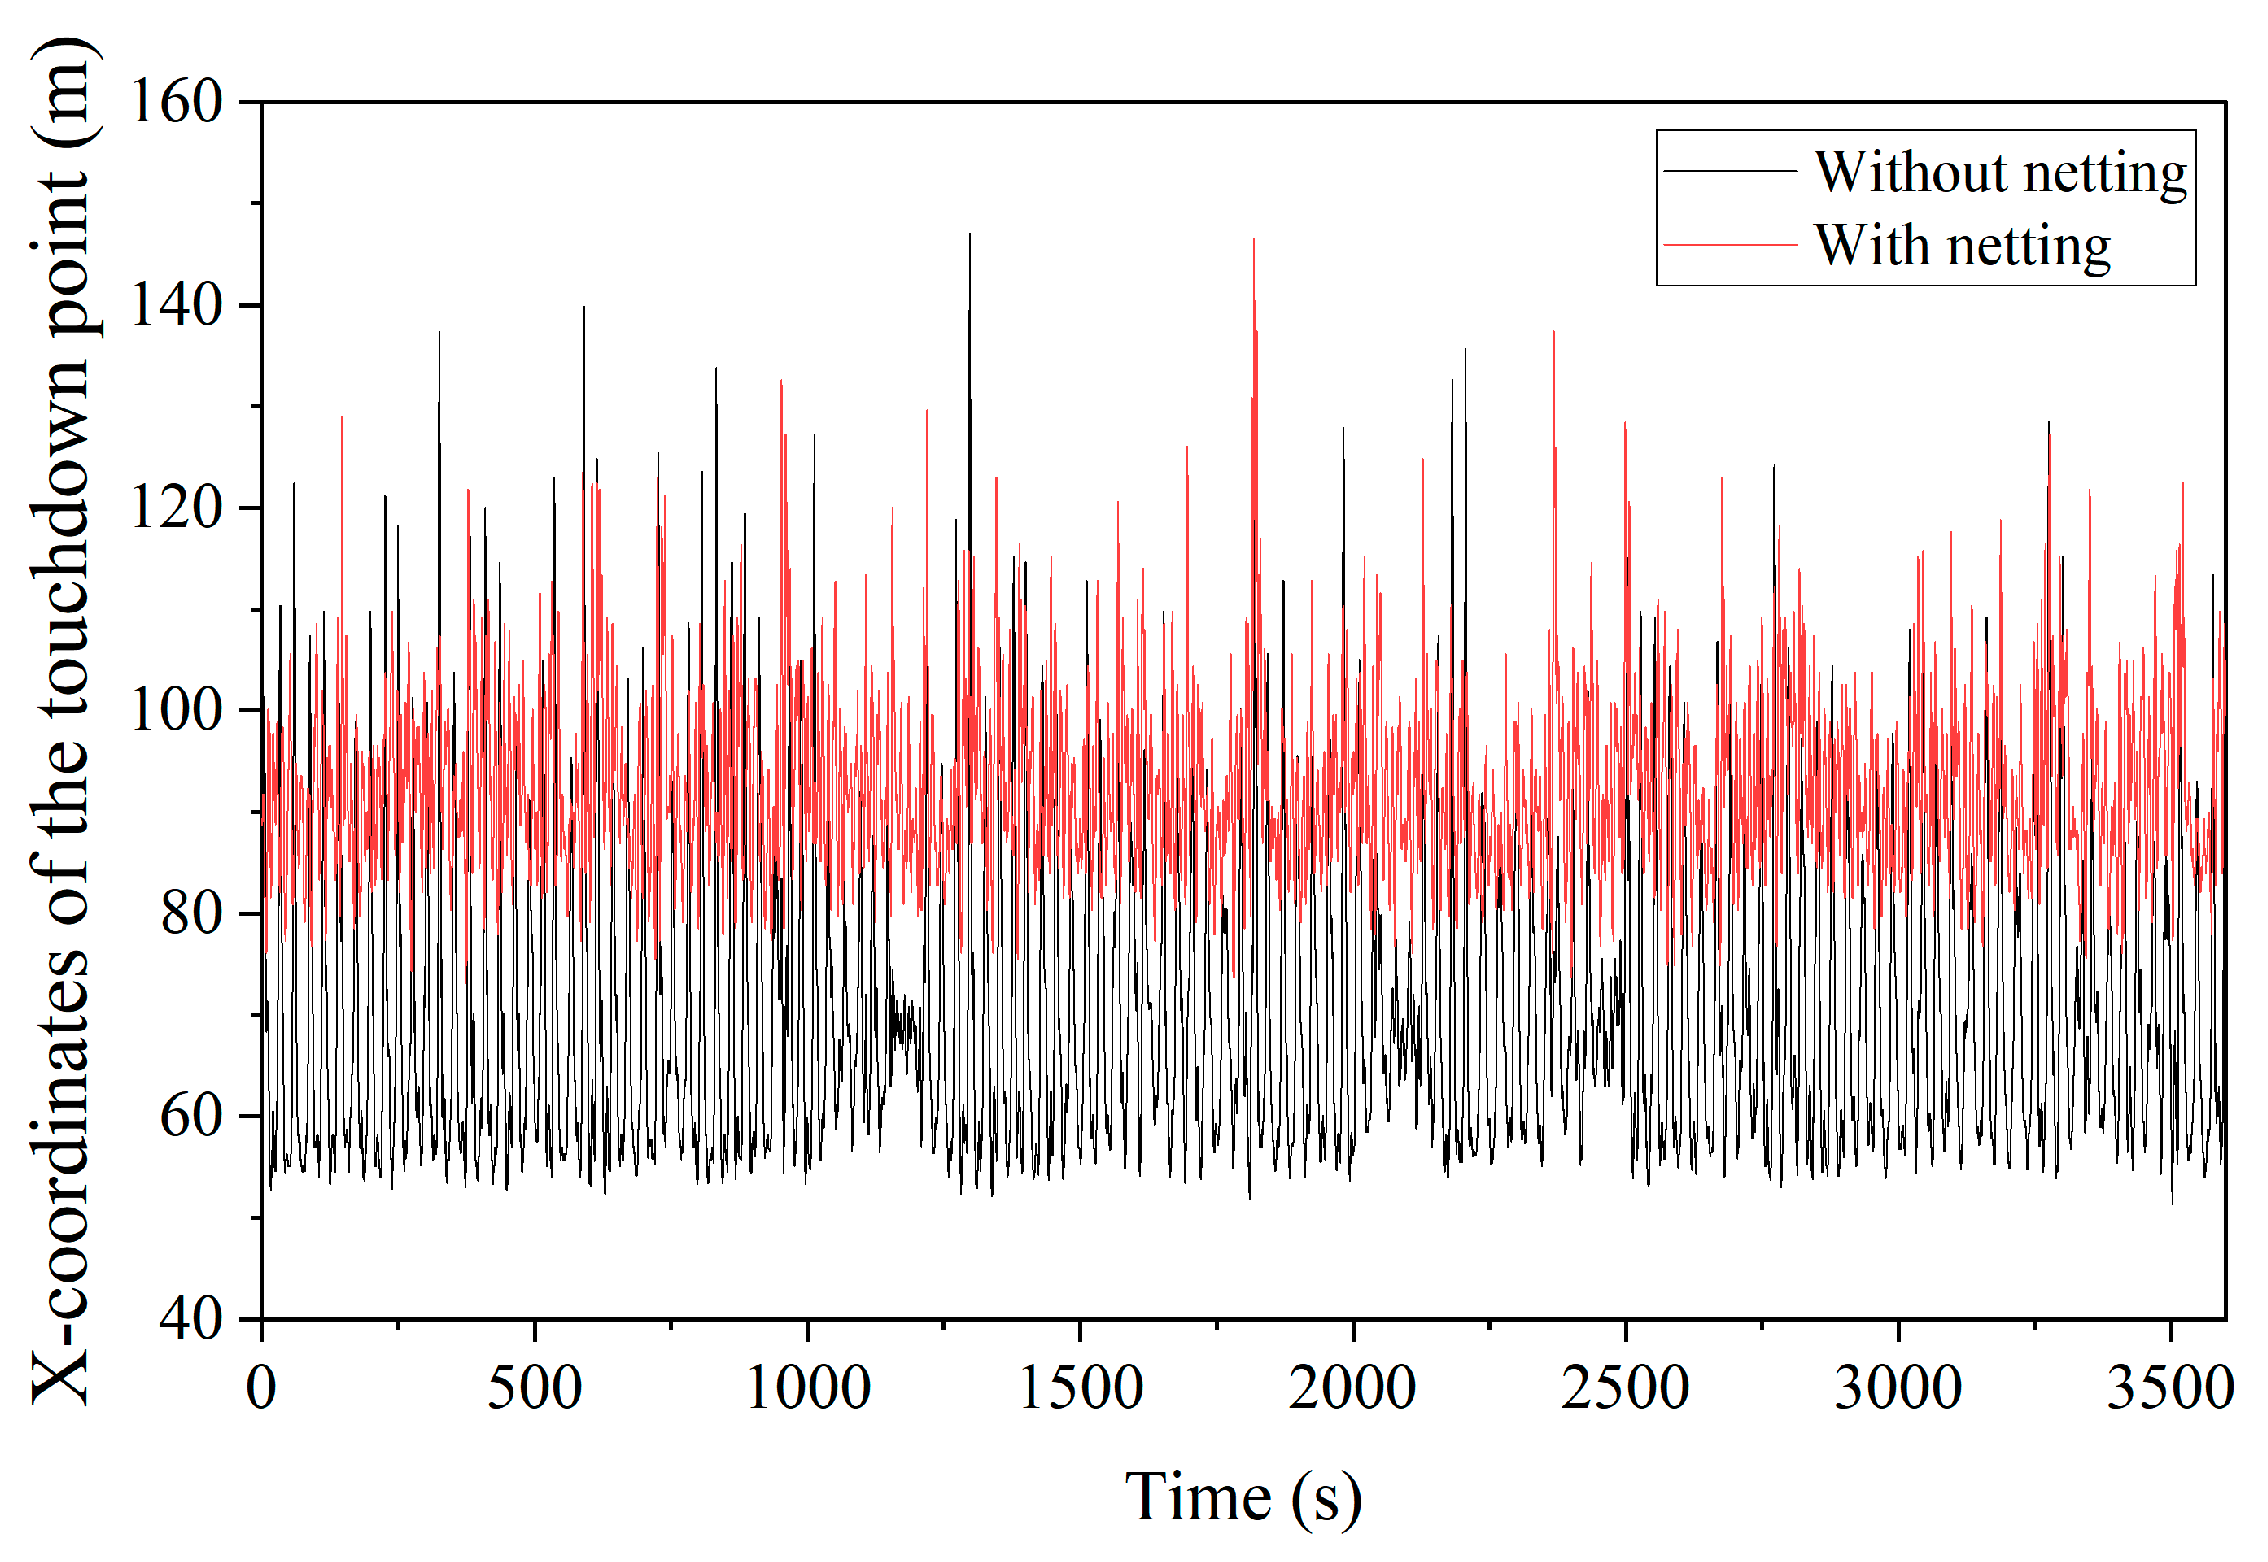
4.4.3. Minimum Touchdown Length of the Mooring Line

Figure 24 illustrates the variation curves of the minimum touchdown length of the mooring lines across different scenarios. To ensure the safety of the mooring system, it is necessary that when the platform reaches its maximum displacement, a portion of the mooring line still touches the seabed. Therefore, mooring line schemes with longer lengths should be chosen as much as possible. However, the length of the mooring lines cannot be arbitrarily increased due to factors such as the scope of the sea area and construction costs. The graph shows that the touchdown length of the mooring lines increases with the total length of the lines, and the relationship between the two is essentially linear.
With an increase in the net buoyancy of buoys, the touchdown length of the mooring lines decreases. This reduction is due to the vertical force exerted by the added buoys in the mooring lines, which increases the hanging length of the lines, thereby reducing their touchdown length on the seabed. For instance, when the static buoyancy of the buoys is 4 tons, compared to the scenario without buoys, the touchdown length decreases from 27.05 m to 22.84 m, a reduction of 15.56%.
Conversely, adding sinkers to the mooring lines replaces part of the chains and increases the restoring force of the mooring system, reducing the hanging length of the mooring lines and, thus, increasing their touchdown length as the weight of the sinkers increases. When the net weight of the sinkers is 4 tons, compared to the scenario without sinkers, the touchdown length of the mooring lines increases from 27.05 m to 38.01 m, an increase of 40.51%.

5. Conclusions

This paper proposes an innovative deep-sea aquaculture platform with a single-point mooring system. Based on potential flow theory, the finite element model, and Morison equation, the hydrodynamic characteristics of the innovative deep-sea aquaculture platform under extreme conditions are analyzed. Different mooring parameters and components are selected for static and dynamic analysis to optimize the mooring design. The main conclusions are summarized as follows.
(1)
The motion response of the platform is significantly affected by the damping of the netting system. Compared to numerical models without netting, the addition of the netting substantially reduces fish-tailing movements of the platform, making the motion responses in sway, roll, and yaw negligible. As the overall resistance of the platform increases, providing higher recovery forces, the effective tension in the mooring lines also increases.
(2)
The motion response of the platform and the tension in the mooring lines are not significantly affected by the length of the mooring lines. Adding appropriate buoys can reduce the motion response of the platform and the load on the mooring lines, but if the buoys are too large, their dynamic response may increase the environmental loads on the mooring lines. Adding sinkers to the mooring lines increases the damping of the system, thereby reducing the extreme values of the platform motion response and mooring line tension. Additionally, due to the gravitational effect of the sinkers, the minimum touchdown length of the mooring lines increases with the increase in the mass of the sinkers.
(3)
Considering the motion response of the platform, the tension in the mooring lines, and the minimum touchdown length of the mooring lines, adding sinkers to the mooring lines of the innovative deep-sea aquaculture platform system can effectively improve the overall stability and safety of the platform. When the weight of the sinkers is 4 tons, compared to the configuration without sinkers, the maximum tensions in Mooring Lines 1 and 3 decrease by 28.81% and 29.44%, respectively, while the minimum touchdown length increases by 40.51%.

Author Contributions

Conceptualization, L.Z., X.Z. and Y.L.; methodology, L.Z. and Q.D.; software, L.Z.; validation, L.Z., X.Z. and Q.D.; formal analysis, L.Z.; investigation, L.Z. and Y.L.; resources, Y.H. and C.C.; data curation, L.Z.; writing—original draft preparation, L.Z.; writing—review and editing, X.Z., Q.D. and Y.H.; supervision, X.Z. and Y.H.; project administration, Y.H.; funding acquisition, X.Z. All authors have read and agreed to the published version of the manuscript.

Funding

This research is financially supported by the CIRP Open Fund of Radiation Protection Laboratories (ZFYFSHJ-2023003).

Institutional Review Board Statement

Not applicable.

Informed Consent Statement

Not applicable.

Data Availability Statement

Data underpinning the findings of this study can be obtained from the corresponding author upon a reasonable request.

Conflicts of Interest

The authors declare no conflicts of interest.

References

  1. Moe, H.; Fredheim, A.; Hopperstad, O.S. Structural analysis of aquaculture net cages in current. J. Fluids Struct. 2010, 26, 503–516. [Google Scholar] [CrossRef]
  2. Cifuentes, C.; Kim, M.H. Hydrodynamic response of a cage system under waves and currents using a morison-force model. Ocean Eng. 2017, 141, 283–294. [Google Scholar] [CrossRef]
  3. Huang, X.; Guo, G.; Tao, Q.; Hu, Y.; Liu, H.; Wang, S.; Hao, S. Dynamic deformation of the floating collar of a net cage under the combined effect of waves and current. Aquac. Eng. 2018, 83, 47–56. [Google Scholar] [CrossRef]
  4. Zhao, Y.; Bai, X.; Dong, G.; Bi, C. Deformation and stress distribution of floating collar of net cage in steady current. Ships Offshore Struct. 2019, 14, 371–383. [Google Scholar] [CrossRef]
  5. Chu, Y.; Wang, C.M.; Park, J.C.; Lader, P.F. Review of cage and containment tank designs for offshore fish farming. Aquaculture 2020, 519, 734928. [Google Scholar] [CrossRef]
  6. Fan, Z.; Liang, Y.; Zhao, Y. Review of the research on the hydrodynamics of fishing cage nets. Ocean Eng. 2023, 276, 114192. [Google Scholar] [CrossRef]
  7. Zhao, Y.; Guan, C.; Bi, C.; Liu, H.; Cui, Y. Experimental investigations on hydrodynamic responses of a semi-submersible offshore fish farm in waves. J. Mar. Sci. Eng. 2019, 7, 238. [Google Scholar] [CrossRef]
  8. Jin, J.; Su, B.; Dou, R.; Luan, C.; Li, L.; Nygaard, I.; Fonseca, N.; Gao, Z. Numerical modelling of hydrodynamic responses of ocean farm 1 in waves and current and validation against model test measurements. Mar. Struct. 2021, 78, 103017. [Google Scholar] [CrossRef]
  9. Martin, T.; Tsarau, A.; Bihs, H. A numerical framework for modelling the dynamics of open ocean aquaculture structures in viscous fluids. Appl. Ocean Res. 2021, 106, 102410. [Google Scholar] [CrossRef]
  10. Miao, Y.; Ding, J.; Tian, C.; Chen, X.; Fan, Y. Experimental and numerical study of a semi-submersible offshore fish farm under waves. Ocean Eng. 2021, 225, 108794. [Google Scholar] [CrossRef]
  11. Yu, S.; Qin, H.; Li, P.; Xu, Z. Nonlinear vertical accelerations and mooring loads of a semi-submersible offshore fish farm under extreme conditions. Aquac. Eng. 2021, 95, 102193. [Google Scholar] [CrossRef]
  12. Liu, H.; Liu, Y. Numerical investigation on the dynamic response of the semi-submersible aquaculture platform in regular waves. Ocean Eng. 2024, 294, 116718. [Google Scholar] [CrossRef]
  13. Colbourne, D.B.; Allen, J.H. Observations on motions and loads in aquaculture cages from full scale and model scale measurements. Aquac. Eng. 2001, 24, 129–148. [Google Scholar] [CrossRef]
  14. Xu, T.; Dong, G.; Zhao, Y.; Li, Y.; Gui, F. Numerical investigation of the hydrodynamic behaviors of multiple net cages in waves. Aquac. Eng. 2012, 48, 6–18. [Google Scholar] [CrossRef]
  15. Li, L.; Jiang, Z.; Ong, M.C.; Hu, W. Design optimization of mooring system: An application to a vessel-shaped offshore fish farm. Eng. Struct. 2019, 197, 109363. [Google Scholar] [CrossRef]
  16. Park, S.; Lee, J.; Lee, C. Design evaluation of a fish cage mooring system with different bridle line connections using model experiments and simulations. Aquac. Eng. 2021, 94, 102177. [Google Scholar] [CrossRef]
  17. Yu, J.; Cheng, X.; Fan, Y.; Ni, X.; Chen, Y.; Ye, Y. Mooring design of offshore aquaculture platform and its dynamic performance. Ocean Eng. 2023, 275, 114146. [Google Scholar] [CrossRef]
  18. Goudey, C.A.; Loverich, G.; Kite-Powell, H.; Costa-Pierce, B.A. Mitigating the environmental effects of mariculture through single-point moorings (spms) and drifting cages. ICES J. Mar. Sci. 2001, 58, 497–503. [Google Scholar] [CrossRef]
  19. Huang, C.; Tang, H.; Pan, J. Numerical modeling of a single-point mooring cage with a frontal rigid frame. IEEE J. Ocean. Eng. 2009, 34, 113–122. [Google Scholar] [CrossRef]
  20. Huang, C.; Pan, J. Mooring line fatigue: A risk analysis for an spm cage system. Aquac. Eng. 2010, 42, 8–16. [Google Scholar] [CrossRef]
  21. Decew, J.; Tsukrov, I.; Risso, A.; Swift, M.R.; Celikkol, B. Modeling of dynamic behavior of a single-point moored submersible fish cage under currents. Aquac. Eng. 2010, 43, 38–45. [Google Scholar] [CrossRef]
  22. Shainee, M.; Decew, J.; Leira, B.J.; Ellingsen, H.; Fredheim, A. Numerical simulation of a self-submersible spm cage system in regular waves with following currents. Aquac. Eng. 2013, 54, 29–37. [Google Scholar] [CrossRef]
  23. Shainee, M.; Leira, B.J.; Ellingsen, H.; Fredheim, A. Investigation of a self-submersible spm cage system in random waves. Aquac. Eng. 2014, 58, 35–44. [Google Scholar] [CrossRef]
  24. Xu, T.; Dong, G.; Li, Y.; Guo, W. Numerical study of a self-submersible single-point mooring gravity cage in combined wave-current flow. Appl. Ocean Res. 2014, 48, 66–79. [Google Scholar] [CrossRef]
  25. Huang, X.; Liu, H.; Hu, Y.; Yuan, T.; Tao, Q.; Wang, S.; Liu, Z. Hydrodynamic performance of a semi-submersible offshore fish farm with a single point mooring system in pure waves and current. Aquac. Eng. 2020, 90, 102075. [Google Scholar] [CrossRef]
  26. Ma, C.; Zhao, Y.; Bi, C. Numerical study on hydrodynamic responses of a single-point moored vessel-shaped floating aquaculture platform in waves. Aquac. Eng. 2022, 96, 102216. [Google Scholar] [CrossRef]
  27. Faltinsen, O. Sea Loads on Ships and Offshore Structures; Cambridge University Press: Cambridge, UK, 1993. [Google Scholar]
  28. Sarpkaya, T. Wave Forces on Offshore Structures; Cambridge University Press: Cambridge, UK, 2010. [Google Scholar]
  29. China Classification Society. Rules for Classification of Mobile Offshore Units; China Classification Society: Beijing, China, 2020. [Google Scholar]
  30. Wang, C.M.; Ma, M.; Chu, Y.; Jeng, D.; Zhang, H. Developments in modeling techniques for reliability design of aquaculture cages: A review. J. Mar. Sci. Eng. 2024, 12, 103. [Google Scholar] [CrossRef]
  31. Lader, P.; Jensen, A.; Sveen, J.K.; Fredheim, A.; Enerhaug, B.; Fredriksson, D. Experimental investigation of wave forces on net structures. Appl. Ocean Res. 2007, 29, 112–127. [Google Scholar] [CrossRef]
  32. Choo, Y.I.; Casarella, M.J. Hydrodynamic resistance of towed cables. Hydronaut 1971, 5, 126–131. [Google Scholar]
  33. Lader, P.F.; Enerhaug, B. Experimental investigation of forces and geometry of a net cage in uniform. IEEE J. Ocean. Eng. 2005, 30, 79–84. [Google Scholar] [CrossRef]
  34. Orcina Ltd. Orcaflex Manual, Version 11.1a; Orcina Ltd.: Cumbria, UK, 2021. [Google Scholar]
  35. DNV GL. Dnvgl-os-e301 Position Mooring; DNV GL: Oslo, Norway, 2015. [Google Scholar]
Figure 1. Framework and key process of the methodology.
Jmse 12 00972 g001
Figure 2. Schematic diagram of the Morison model [30].
Jmse 12 00972 g002
Figure 3. Schematic diagram of the mesh group method.
Jmse 12 00972 g003
Figure 4. Schematic diagram of the numerical model of the netting structure.
Jmse 12 00972 g004
Figure 5. Results of netting deformation in numerical simulation.
Jmse 12 00972 g005
Figure 6. Comparison of volume retention coefficient between numerical simulation and experiment.
Jmse 12 00972 g006
Figure 7. Comparison of horizontal drag forces between numerical simulation and experiment.
Jmse 12 00972 g007
Figure 8. Schematic diagram of the finite element model.
Jmse 12 00972 g008
Figure 9. Schematic diagram of the innovative deep-sea aquaculture platform.
Jmse 12 00972 g009
Figure 10. Schematic diagram of the hydrodynamic calculation model of the main structure.
Jmse 12 00972 g010
Figure 11. Schematic diagram of the numerical model of the platform.
Jmse 12 00972 g011
Figure 12. Schematic diagram of the mooring system.
Jmse 12 00972 g012
Figure 13. Schematic diagram of the mooring optimization scheme: (a) chain; (b) chain with buoy; (c) chain with sinker.
Jmse 12 00972 g013
Figure 14. Numerical results of RAOs.
Jmse 12 00972 g014
Figure 15. Time history curves of the motion response of the platform.
Jmse 12 00972 g015
Figure 16. Time history result of the planar motion: (a) without netting; (b) with netting.
Jmse 12 00972 g016
Figure 17. Time history curves of the mooring line tension.
Jmse 12 00972 g017
Figure 18. Time history curve of the X-coordinates of the touchdown point.
Jmse 12 00972 g018
Figure 19. Offset–tension relation for the mooring line under different schemes.
Jmse 12 00972 g019
Figure 20. Restoring force of the mooring system under different schemes.
Jmse 12 00972 g020
Figure 21. Statistical results of the motion response of the platform under different schemes.
Jmse 12 00972 g021
Figure 22. Statistical results of mooring line tension under different schemes.
Jmse 12 00972 g022
Figure 23. Spectrum of mooring line tension under different schemes.
Jmse 12 00972 g023
Figure 24. Calculation results for the minimum touchdown length of mooring lines under different schemes.
Jmse 12 00972 g024
Table 1. Main parameters of the experimental and numerical model.
ParametersExperimental ModelNumerical Model
Depth (m)2.72.7
NettingDiameter (m)1.4351.435
Height (m)1.441.44
Horizontal netting linesDiameter (mm)1.813.5
Length (mm)1614.088
Density (kg/m3)11301039.0
Young’s modulus (MPa)35046.67
Vertical
netting lines
Diameter (mm)1.815.85
Length (mm)1612.0
Density (kg/m3)11301036.92
Young’s modulus (MPa)35039.75
Table 2. Main parameters of the platform.
ParametersValue
Length (m)77.5
Breadth (m)27.5
Depth (m)2.3
Design draught (m)1.07
Weight (t)328.084
Center of gravity (m)(−1.085, 0, 1.238)
Roll inertia (kg·m2) 3.720 × 10⁷
Pitch inertia (kg·m2) 1.759 × 10⁸
Yaw inertia (kg·m2) 2.114 × 10⁸
Table 3. Main parameters of the cages.
ComponentParametersValue
Netting systemQuantity3
Length (m)22.8
Width (m)19.2
Height (m)8
Mesh size (mm)40
Twine diameter (mm)2.1
Density (kg/m3)953
Bottom ringWeight (t)7
Table 4. Mooring line parameters.
Mooring LineMaterialDiameter
(mm)
Dry Weight
(kg/m)
Wet Weight
(kg/m)
Axial Stiffness
(kN)
Breaking Tension
(kN)
1Stud link70107.393.24.95 × 1053687.9
2Stud link70107.393.24.95 × 1053687.9
3Stud link100219.0190.21.01 × 1067056.0
Table 5. Design parameters of the mooring optimization scheme.
ModelLength (m)Buoy (kN)Sinker (t)
EntiretyMooring Line 1 and 2Mooring Line 3
Without nets14012128--
I12012108--
II14012128--
III16012148--
IV1401212810-
V1401212820-
VI1401212830-
VII1401212840-
VIII14012128-1
IX14012128-2
X14012128-3
XI14012128-4
Table 6. Horizontal and vertical coordinates of buoys and sinkers in X-Z plane.
ModelComponentX-Coordinate (m)Z-Coordinate (m)
IV~VIIBuoy47.95−5.94
VIII~XISinker81.58−18.32
Table 7. Environment conditions.
EnvironmentParametersValue
Depth (m)20
WaveSpectrumJONSWAP
Wave spectrum factor3.3
Significant wave height (m)5.0
Peak wave period (s)9.8
Direction (°)180
CurrentSpeed (m/s)0.8
Direction (°)180
Table 8. Statistical results of the motion response of the platform.
ModelStatistical ResultsSurge (m)Sway (m)Heave (m)Roll (°)Pitch (°)Yaw (°)
Without nettingAmplitude11.8209.2331.6357.0336.68524.523
Std. Dev.4.9032.1990.4291.2261.9167.874
With nettingAmplitude2.3060.0081.5900.0046.6860.005
Std. Dev.0.6600.0020.4210.0011.9190.001
Table 9. Statistical results of the mooring line tension.
ModelStatistical ResultsMooring Line 1 Mooring Line 2Mooring Line 3
Without nettingMaximum (kN)568.60 511.66 924.84
Mean (kN)48.93 48.95 74.97
Std. Dev. (kN)41.96 41.83 73.41
With nettingMaximum (kN)563.94 564.07 1044.87
Mean (kN)104.86 104.88 184.14
Std. Dev. (kN)30.95 30.97 58.31
Table 10. Calculation results of the pre-tension in mooring lines under different schemes.
ModelIIIIIIIVVVIVIIVIIIIXXXI
Pre-tension (kN)113.8113.7113.6105.497.590.283.9124.6135.9147.6159.5
Disclaimer/Publisher’s Note: The statements, opinions and data contained in all publications are solely those of the individual author(s) and contributor(s) and not of MDPI and/or the editor(s). MDPI and/or the editor(s) disclaim responsibility for any injury to people or property resulting from any ideas, methods, instructions or products referred to in the content.

