Abstract
A fin stabilizer is one of the most effective and frequently used anti-roll devices for maintaining a ship’s operational safety and passengers’ comfort. However, the discrepancy between theoretical hydrofoil-based predictions and the actual dynamic lift force of fin stabilizers due to fin–hull interactions requires more research attention. This study investigates the effect of fin stabilizers on mitigating roll motion through the performance of extensive computational fluid dynamic (CFD) simulations over a range of fin angles and ship speeds. Model tests were carried out to validate the drag and motion results obtained from numerical analyses. The results show that fin stabilizers significantly reduce the roll motion, with the lift coefficient values influenced by the Reynolds number, leading to differences between the theoretical and Reynolds-averaged Navier–Stokes (RANS) calculations. At a high Froude number (Fr), the actual fin lift is about half of the theoretical value. These findings highlight the requirement of selecting an adequate fin area at the predominant ship speeds and ensuring an effective anti-roll effect with fin–hull interaction. This study provides a significant reference for ship design, as well as stabilization system control and optimization.
1. Introduction
Roll motion has a considerable impact on a ship’s normal operation and passengers’ comfort at sea. A fin stabilizer is one of the most effective and frequently used anti-roll-motion devices, which is usually controlled with an electronic device that alters the angle to mitigate the roll motion. Surendran et al. [1] and Cakici et al. [2] used the methods of proportion integration differentiation (PID) and the linear quadratic controller (LQR) to actively control the fin angle for reducing the roll motion, and evaluation was conducted using computational fluid dynamics (CFDs) simulations. However, the lift force and drag force of fins as the input to the controller were calculated using theoretical hydrofoil predictions without considering the fin–hull interaction. The discrepancy between the theoretical calculation and the actual dynamic lift force of fin stabilizers due to the fin–hull interaction requires more attention from researchers.
Figure 1 shows the decomposition of the lift and drag forces on the fin, both longitudinally and transversely. In Figure 1a, is the combined force of lift and drag. While is the lift force generated by the fin and indicates the drag force, as shown in Equation (1). In Figure 1b, is decomposed into the roll reduction component and the other component is . The dotted line is an auxiliary line that breaks down the force, and the arrows indicate the force and its direction.
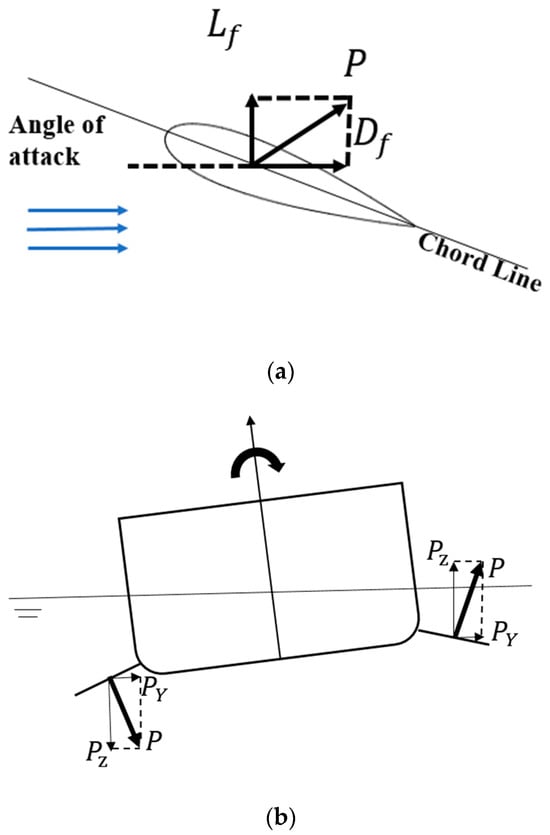
Figure 1.
The forces generated by fins in fin-coordinates and ship-coordinates. (a) Longitudinal fin force decomposition. (b) Transverse fin forces with effective roll reduction component.
In Equation (1), is the resultant force of each foil section that provides the anti-rolling moment to the ship; is the density of water; is the velocity of the flow; is the area of the fin section; and denotes the coefficient of the lift force. In order to obtain the resultant force P, we investigated how the drag forces of the fins were affected by the fin–hull interaction in a previous study [3]. In this study, we investigated the lift force in detail and calculated the anti-roll moment of the ship through the fins.
The lift forces of the actual fins have been investigated in general using the Kutta–Joukowski theorem [4,5], which is referred to as the theoretical method. Mahalatkar [6] discussed the hydrodynamic performance of isolated hydrofoils in potential flow conditions. The actual lift produced by a fin is more complex than might be inferred from hydrofoil testing. Therefore, there is a significant deviation between the static lift and the actual dynamic lift [7].
However, nonlinear factors relating to the ship and fin stabilizer motions, both in calm water and in waves, cannot be elucidated with these theories, and computational fluid dynamics (CFDs) is considered to be a high-fidelity solution. Gokce [8] used StarCCM+ (17.06.007) to conduct free-roll-motion attenuation simulations for DTMB5415 and compared the results with Irvine’s [9] experimental data, with only a 5% error in the roll period. Ji’s [10] work involved using dynamic mesh technology to analyze the hydrodynamic characteristics of fin stabilizers constrained by the hull under open water conditions. During the dynamic operation of anti-rolling fins, the lift coefficient of the fin exhibited a dynamic range of variation [11]. In Guilhem’s study [12] on the lift of fins under unstable conditions, it was found that due to the uncertainty of the surrounding flow field, the lift generated by the fins fluctuated within a certain range. The influence of fin–hull interaction varied at different speeds, according to Bhosale’s research [13]. Therefore, the lift and its moments cannot be simply addressed using only the theoretical hydrofoil results.
Previous studies have separately examined the ship roll and fin stabilizer lift–drag performance. Because the effect of waves during ship operation cannot be ignored, Dallinga investigated the influence of the flow field around the ship on the lift of the fins [14], and the effect of the fins on the ship was compared by adopting the method of cumulative lift moments in time. To obtain the actual lift force of the fin during operation, the concept of lift feedback was first introduced by the American company Sperry [15], who envisioned the installation of detection devices within the hollow fin shaft.
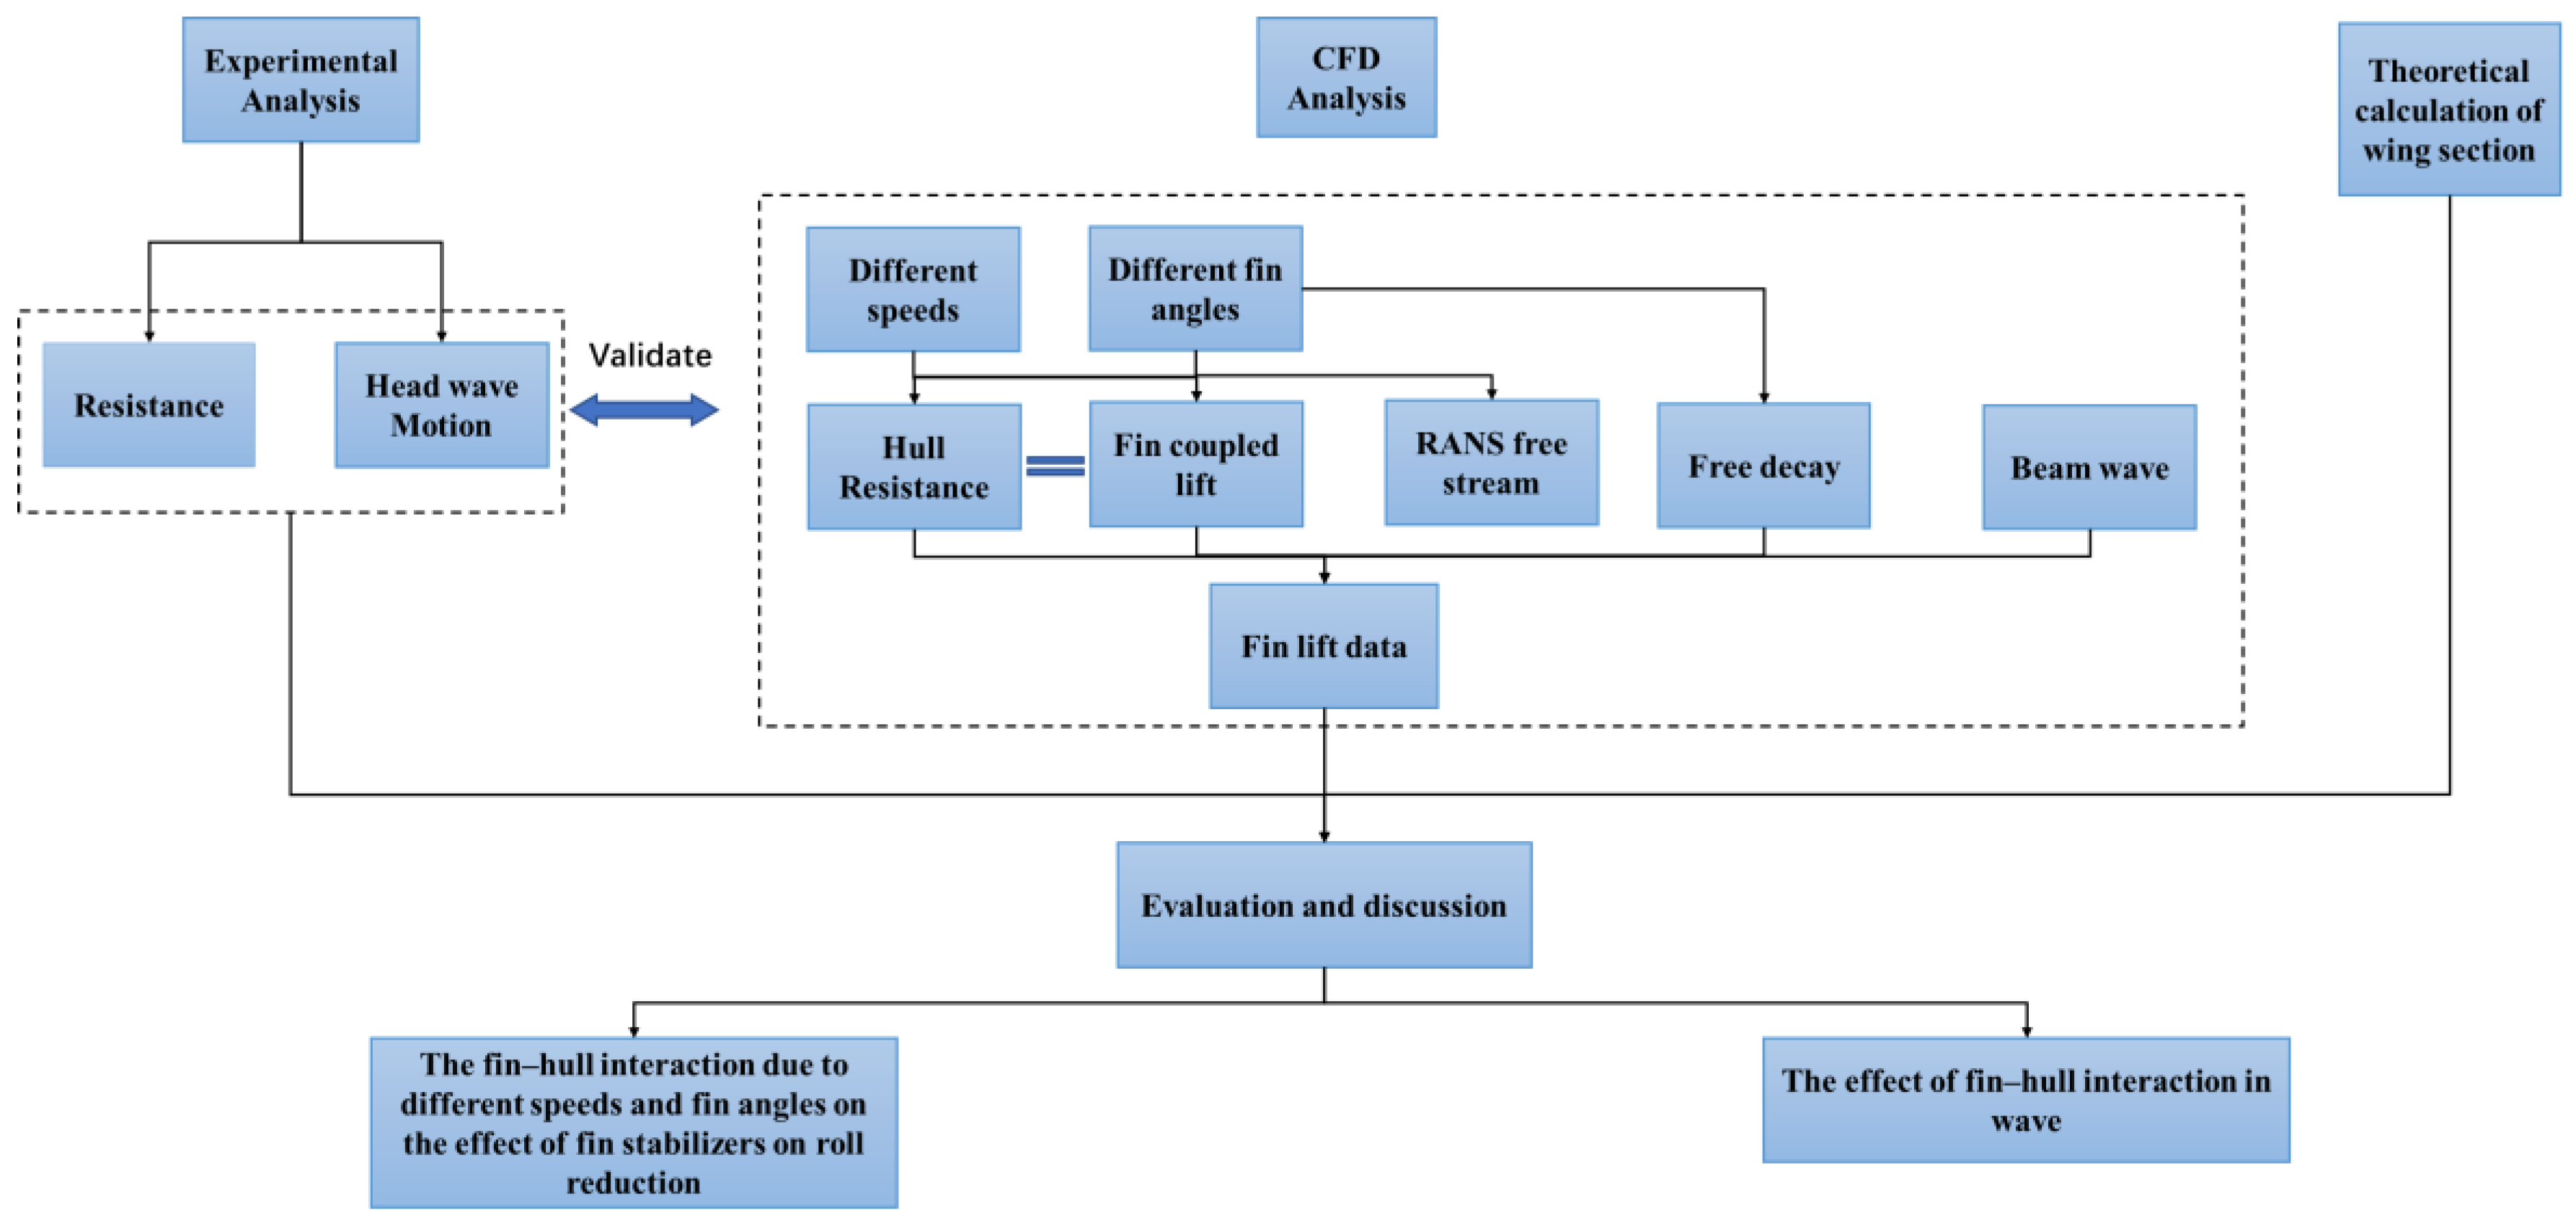
In essence, current research is insufficient for addressing the fin–hull interactions. In order to design better fins for roll reduction, it is necessary to understand the effect that occurs between the hull and the fins. In addition, the 3D design requires validation using a Navier–Stokes solution after first designing the 2D candidate airfoil, as performed in the study by Della Rosa [16]. In this study, combined experimental and numerical techniques were used. The model tests were completed in accordance with the ITTC Recommended Procedures and Guidelines 7.5-02-02-01 and the Seakeeping Experiments–ITTC Recommended Procedures and Guidelines 7.5-02-07-02.1 [17,18]. The motions of vessels and the lift and drag forces of the fins at various fin angles and different ship speeds were calculated both in calm water and under the influence of waves. The technical routes of this study are illustrated in Figure 2.

Figure 2.
A flowchart of the study process.
2. Numerical Simulation via CFDs
2.1. The Geometric Model Set-Up
The model represented a medium-sized cruise ship with a gross tonnage of about 50,000 tons. The main parameters of the 1:55 ratio model are shown in Table 1.

Table 1.
The main parameters of the 1:55 ratio model.
The coordinate system was selected with x pointing to the bow and y pointing to the port side; z was pointed vertically upward. The geometrical model of the ship is shown in Figure 3.
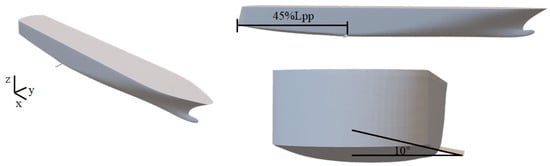
Figure 3.
The geometrical modeling of the ship.
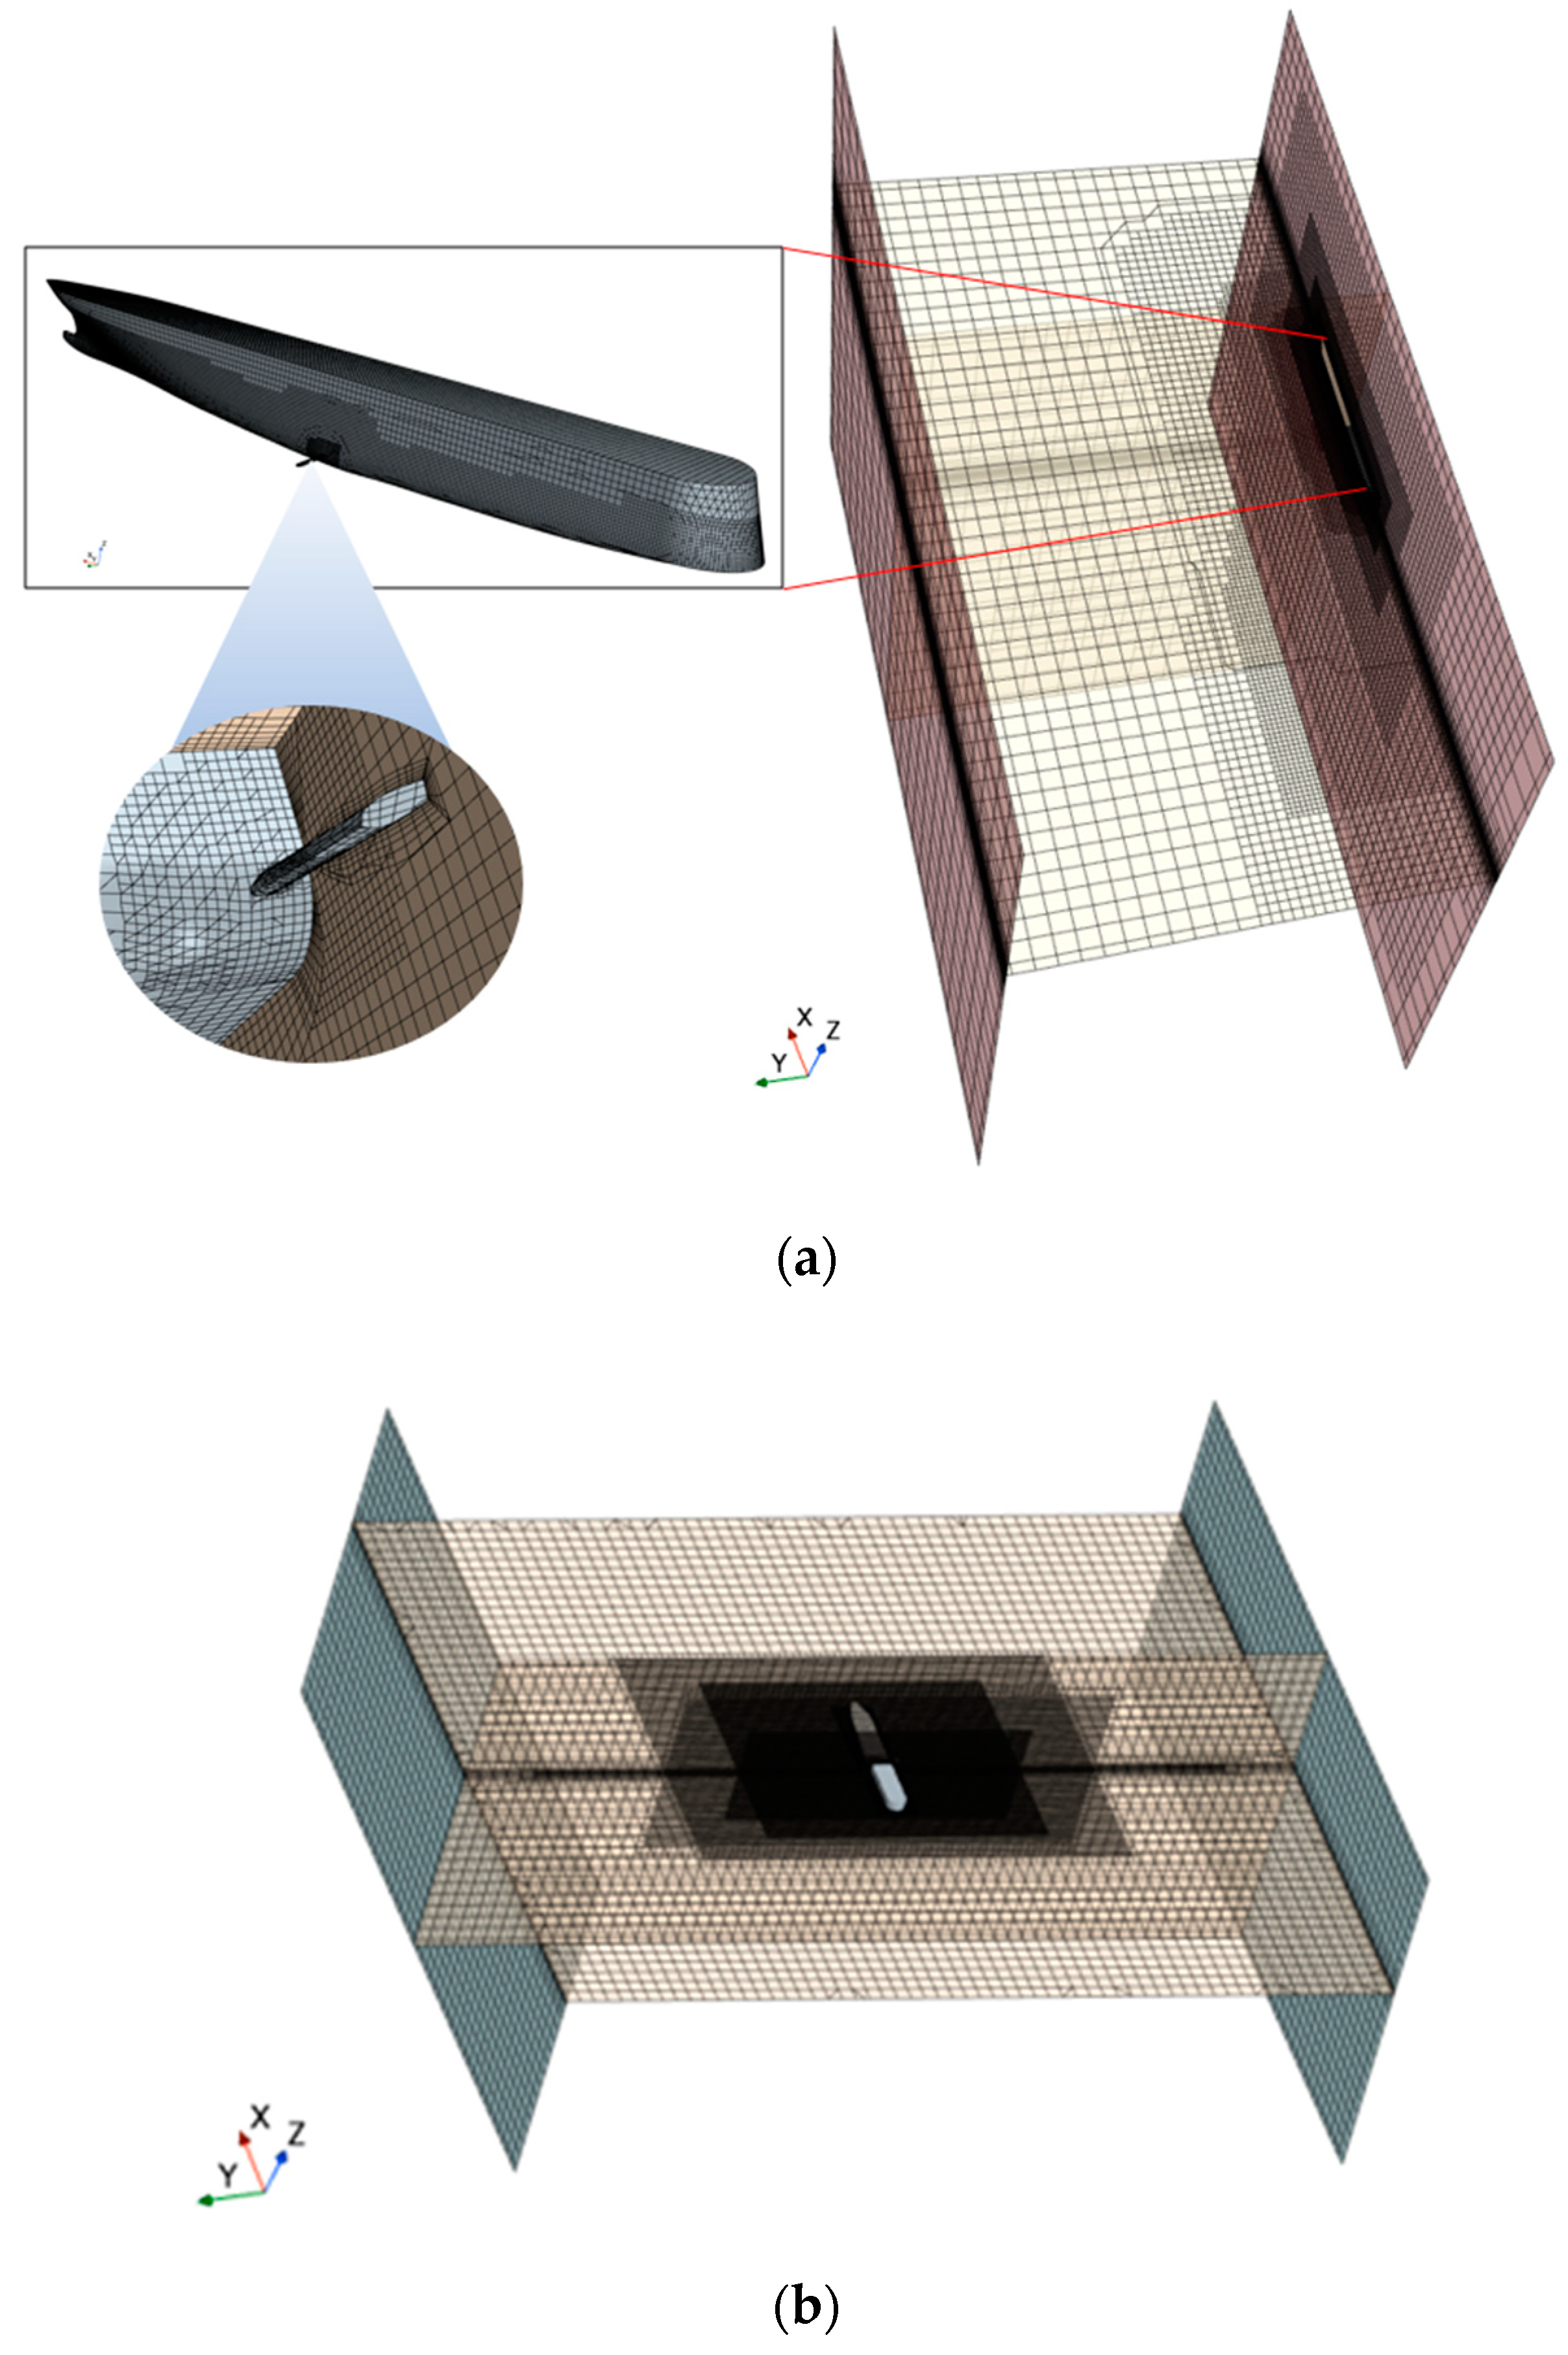
There were two types of computational domains employed in the analysis to separately compute the lift force and free roll of the model ship. One type was applied to the calculation of the fin resistance; the computational domain was 5 × Lpp for the height and length and 8 × Lpp for the width; and the vertical extensions from the still-water level and the top and bottom were 2 × Lpp and 3 × Lpp, respectively, as shown in Figure 4a. The ship only exhibited heave and pitch motions; the yaw and roll motions were not calculated, so the center middle plane was used as the plane of symmetry and only half of the hull was calculated. The numerical tank dimensions were sufficiently large to minimize the boundary effects on the flow around the moving ship.
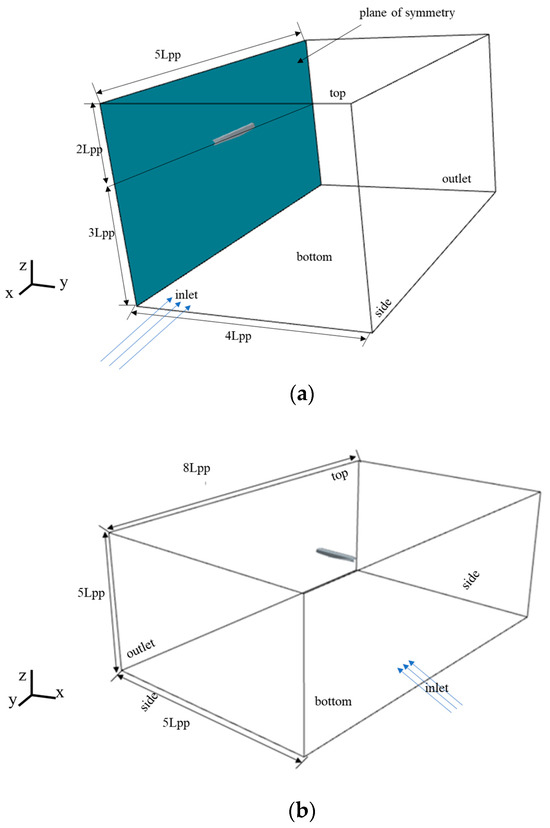
Figure 4.
The computational domains: (a) resistance computation domain; (b) motion computation domain.
To calculate the roll of a finned ship, it is necessary to have an adequate calculation domain on the y-axis to ensure that the waves generated when the ship rolls can be correctly captured and wave dissipation occurs at the boundary. As shown in Figure 4b, the size of the computational domain for both analyses are the same in length and depth. The only difference is that when the roll movement is considered, the computational domain is doubled at the width, in the y direction.
2.2. Mesh Generation
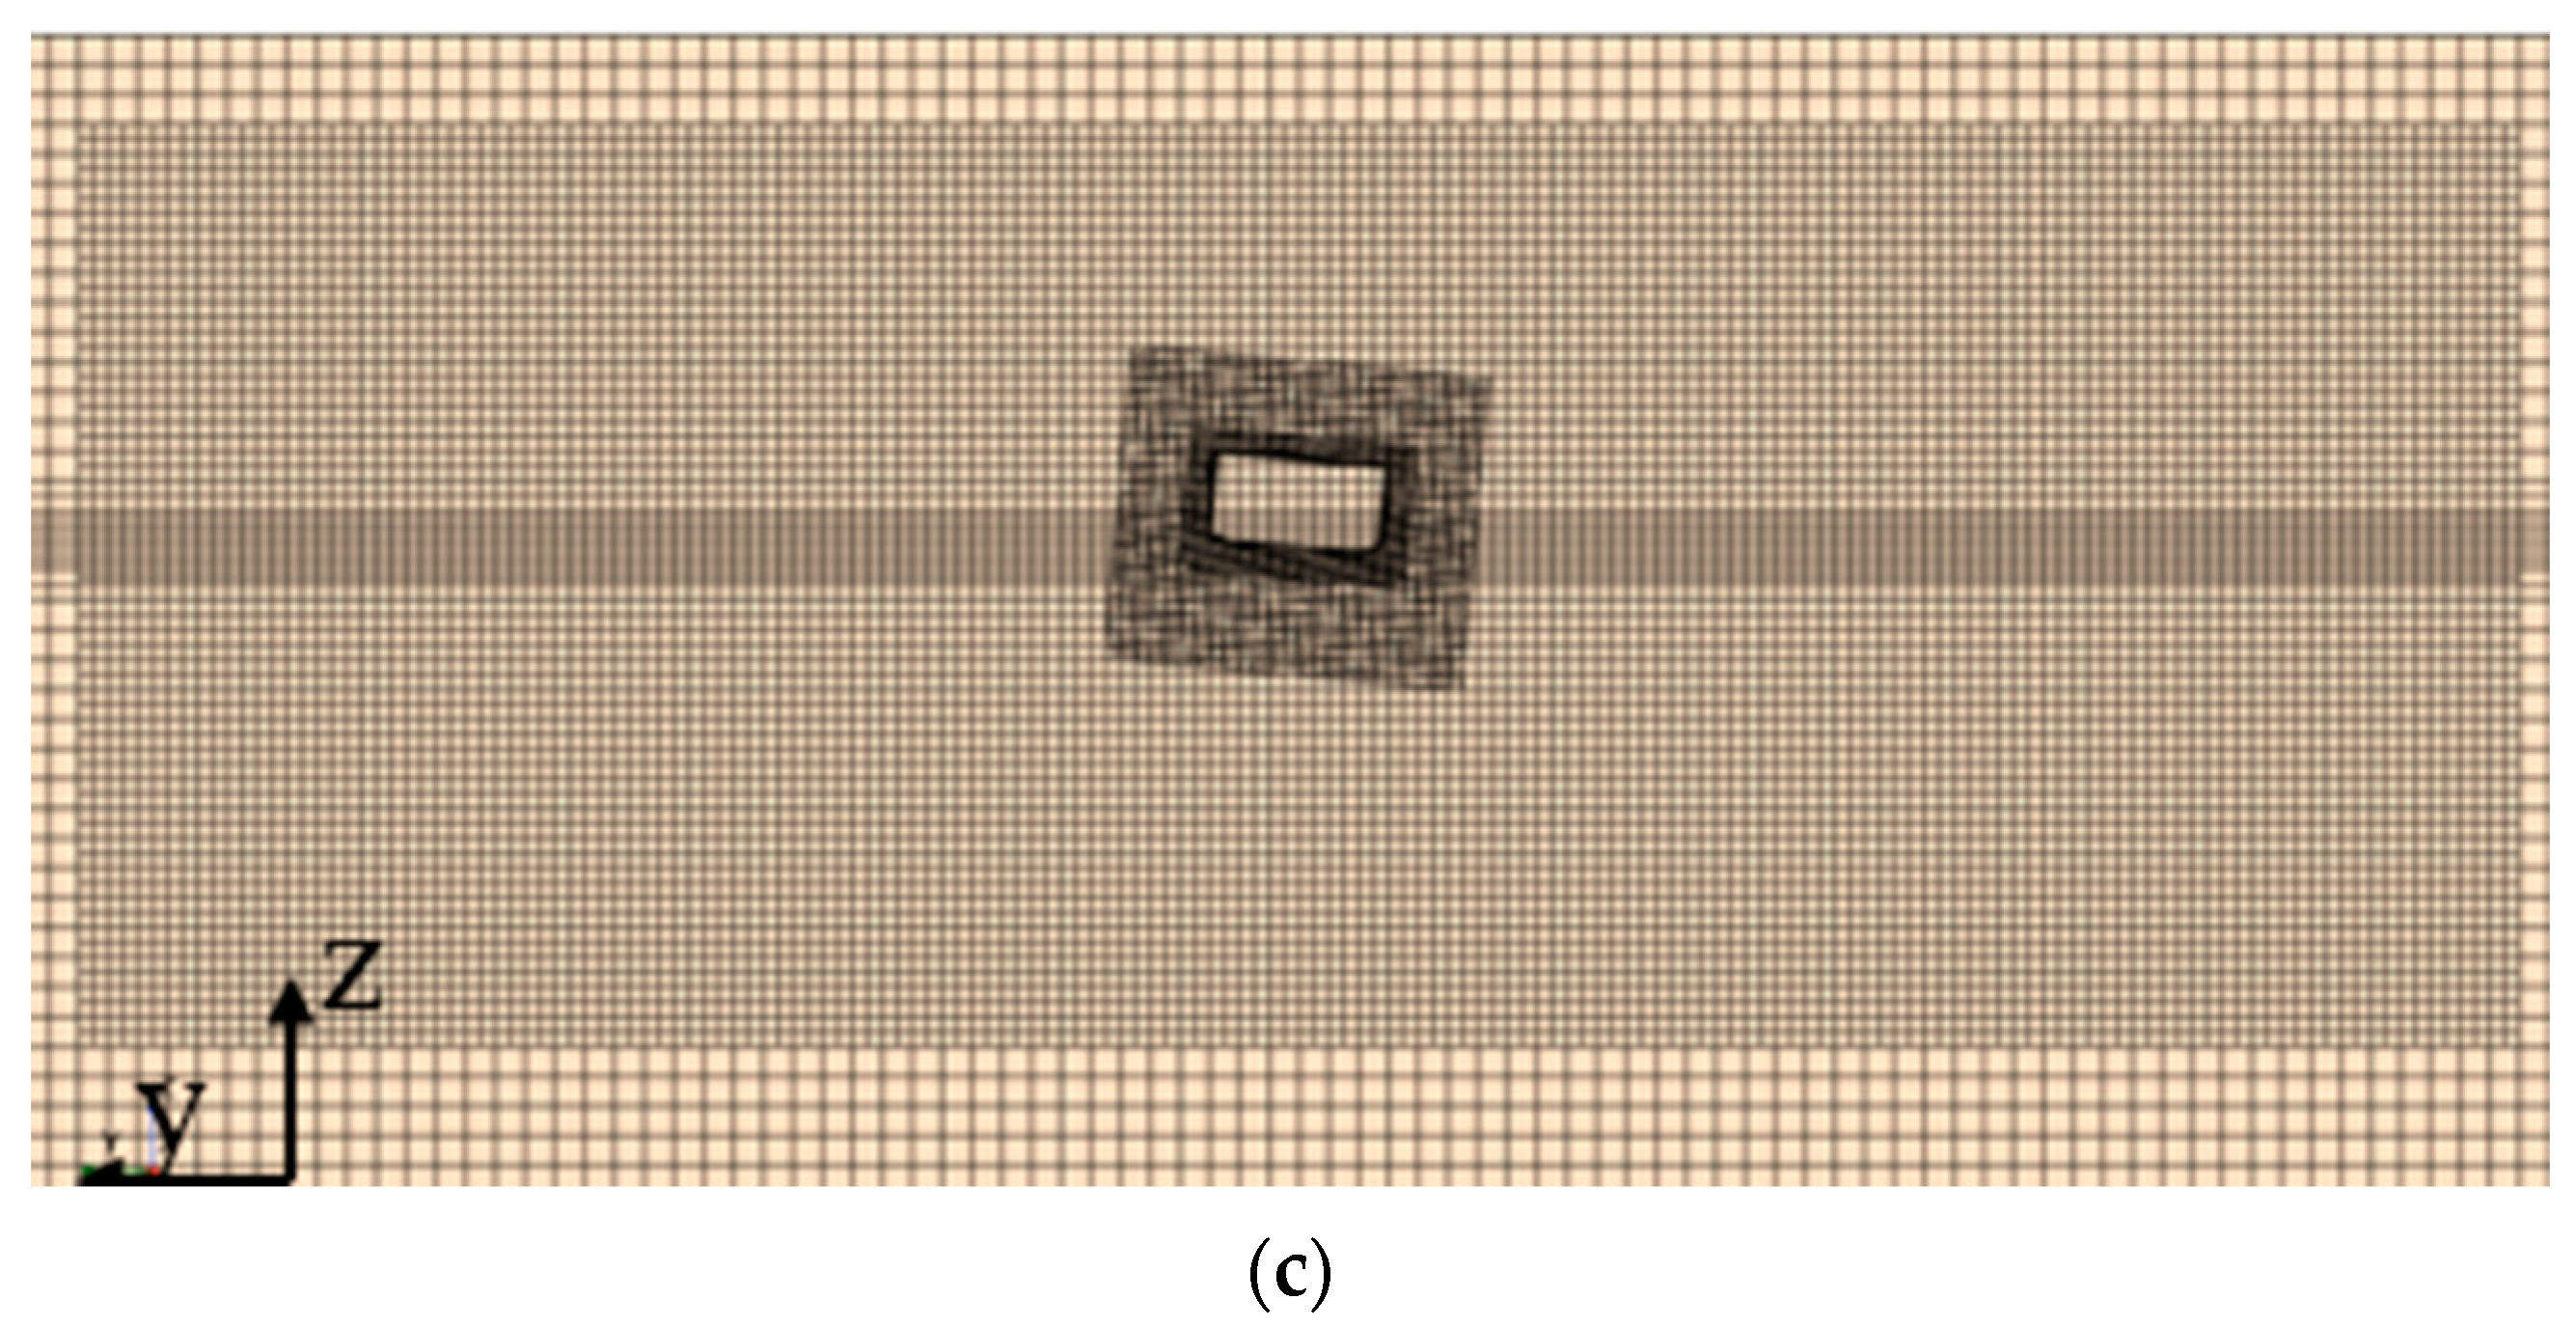
For the two computational domains mentioned above, two sets of grids were used to model the ship: one for the advancing speed and the other for roll motion, as shown in Figure 5. The basic size of the mesh was one-fiftieth of the length of the ship model, approximately 0.075 m. The mesh was gradually coarsened from the hull to the boundary; meanwhile, a numerical damping zone of 7.5 m was set at the pressure outlet as a wave absorber. In addition, the overset meshing method was applied, and the mesh near the hull and the fin stabilizers was refined. According to the wall function, the boundary layer was set to 6 and the first layer thickness was 0.0227 mm. The longitudinal free surface was refined to ensure accurate wave capture; additionally, the free surface length and width had the same dimensions as the background grid, and the height was a total of 0.08 m above and below the waterline. The free surface region was refined at the z-axis direction with the basic size set to 5% of the original mesh. The overset mesh domain was 1.3 × Lpp in length, 1.5 × T in height, and 1.5 × B in width. The basic size of the overset mesh was the same as the background mesh. The boundary conditions of the inlet, bottom, top, and two sides of the background domain were set to the velocity inlets; the outlet was set to the pressure outlet.

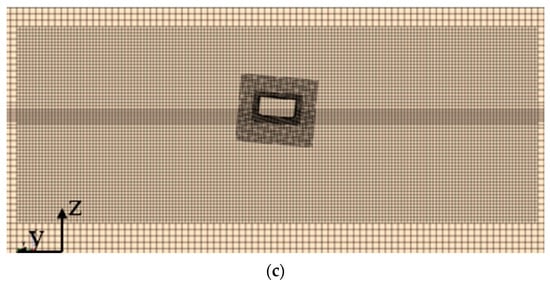
Figure 5.
Mesh generation: (a) resistance mesh; (b) motion simulation meshing of the virtual tank area; and (c) motion simulation overset grids.
For each of the two computational schemes, to ensure independence, different grid sizes were taken and compared. The errors identified in Table 2 and Table 3 refer to the difference in two neighboring solutions. Rtm represents the total resistance at model scale. In the calm water roll decay test, the average period was about 2.57 s. The G2 and G5 grid sizes were selected for the computations and displayed adequate accuracy, i.e., approximately 1.54 million and 2.6 million cells, respectively.
Table 2.
Comparison of the resistance grid.
Table 3.
Comparison of the motion grid.
2.3. Numerical Solution
The ship’s motion and fin stabilizer moment and forces were calculated using a solution method based on the two-phase, incompressible Reynolds-averaged Navier–Stokes (RANS) equation as the control, as shown in Equations (2) and (3):
where denotes the mean viscous stress tensor component; is the mean pressure; denotes the averaged Cartesian components of the velocity vector; and denotes the Reynold’s stresses. ρ denotes the density of the fluid and μ is the dynamic viscosity. is the body force, which is only defined via gravitational acceleration in the z direction as and is present in the RANS solver due to the two-phase flow around the ship.
The finite volume method (FVM), which can handle arbitrarily complex structured grids, was used to discretize the control equation, and the volume of fluid (VOF) method, combined with interface compression technology, was used to capture the free surface. The SST k-ω turbulence model was then used, followed by the pressure-implicit with splitting of operators (PISO) method to handle the coupling between velocity and pressure. The wave-making method used a velocity inlet input with damping wave absorption.
3. Experiment with Fixed Fins
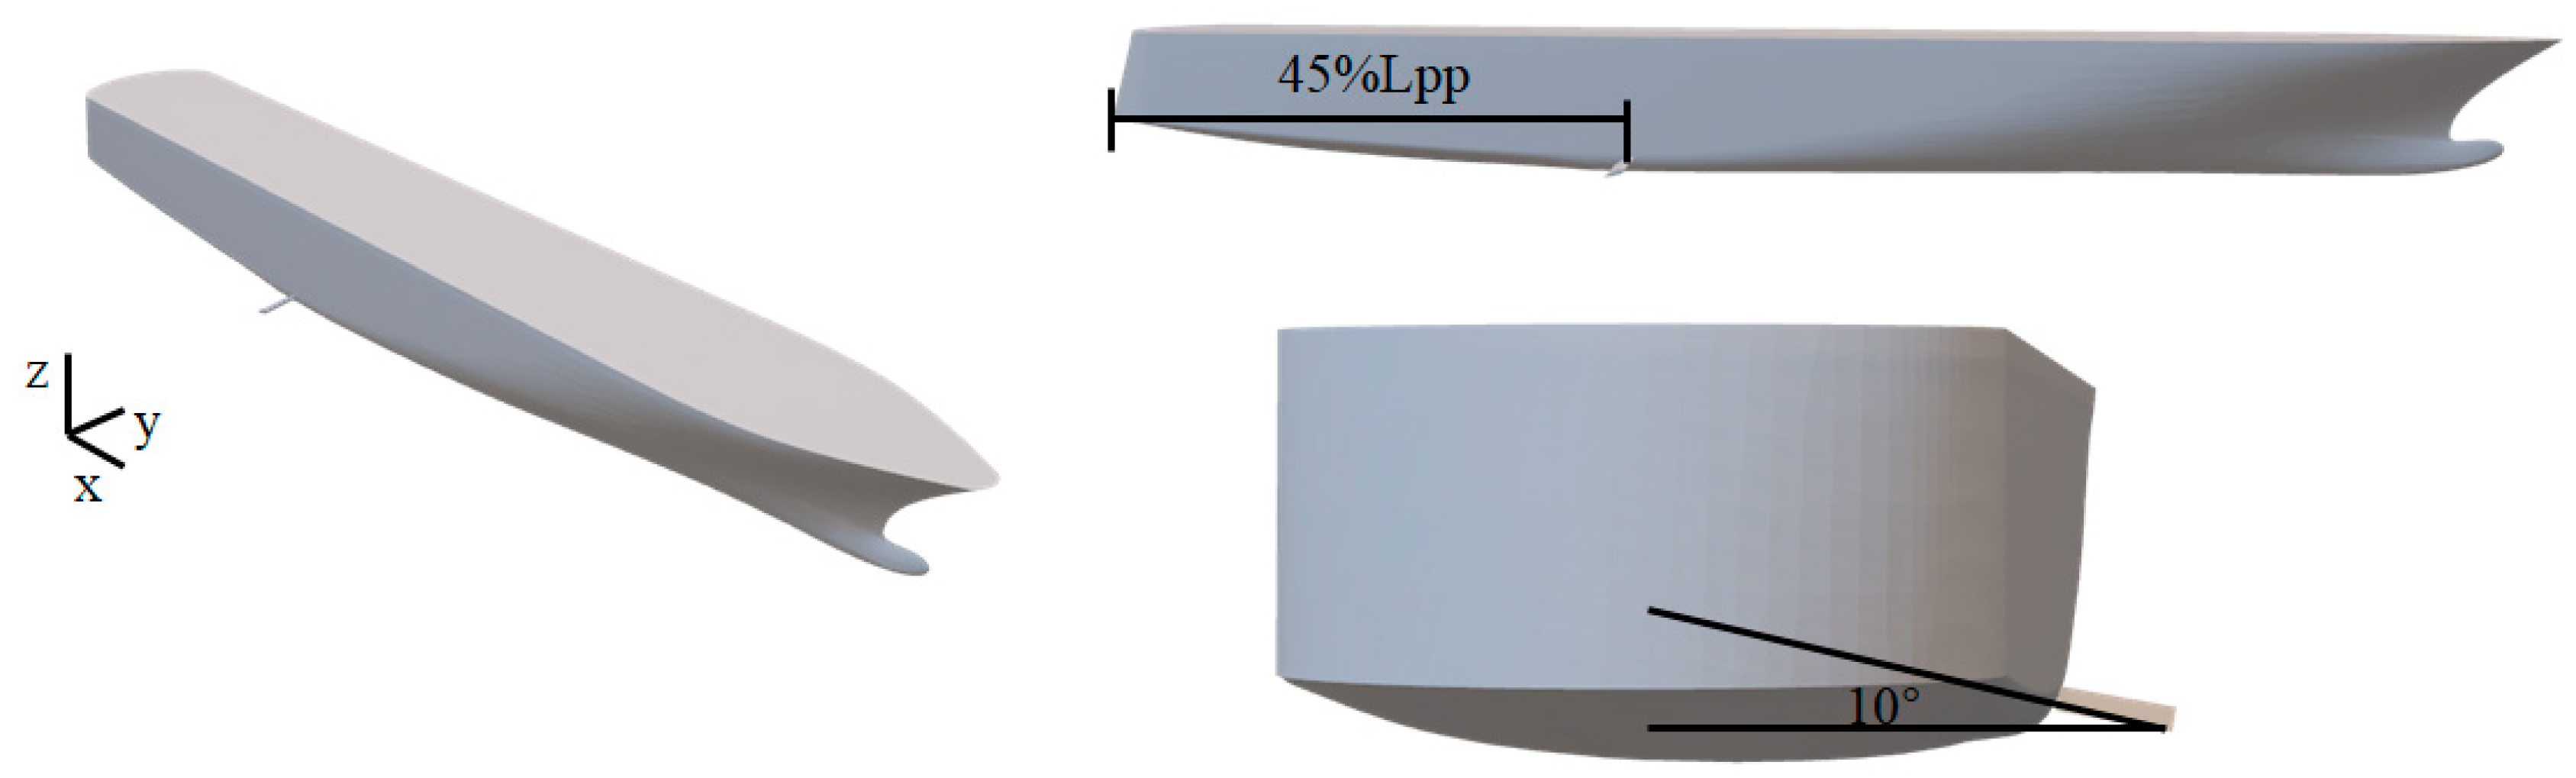
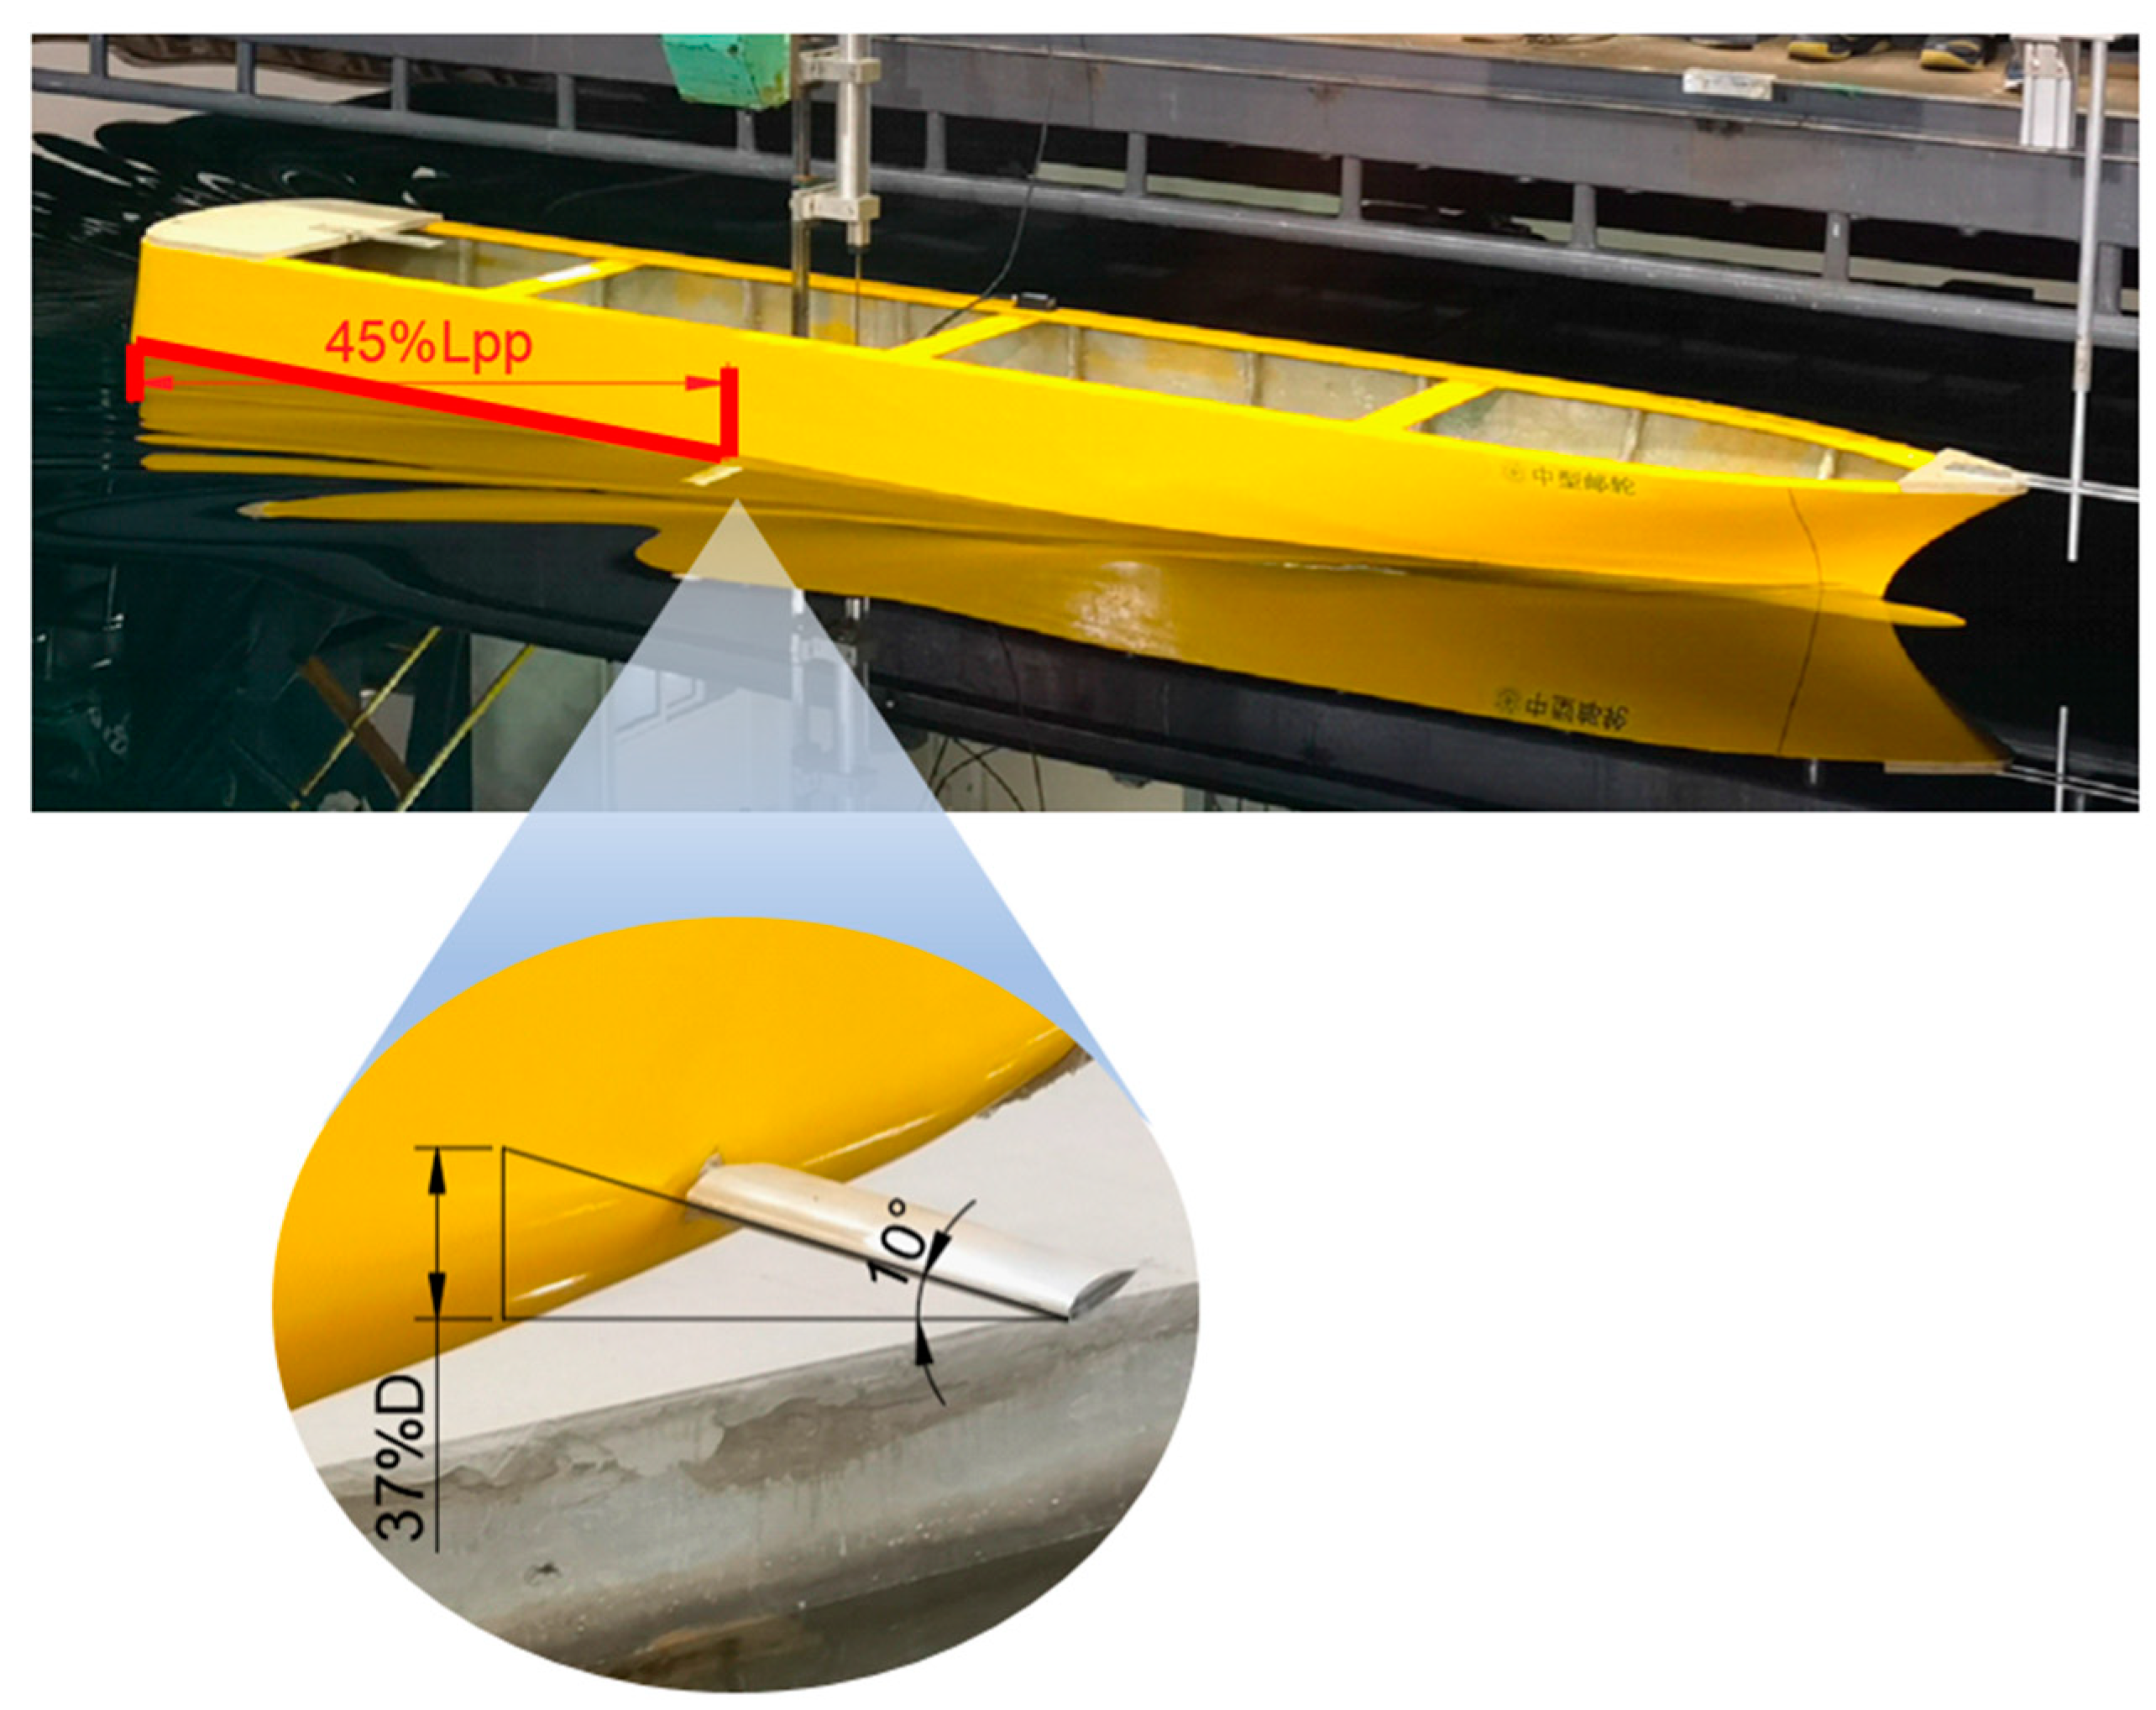
In order to study the lift force of the fin stabilizers with fin–hull interactions, two resistance tests were performed, with or without fin stabilizers, while the ship resistances were recorded. For the former, the angles of the fin stabilizer model were set at 0° and 20° at different ship speeds so the drag forces caused by the fins could be recorded.
The size and scale of the model are illustrated in Table 1. The ship model experiments were carried out in the multifunctional towing tank of Shanghai Jiao Tong University. The main dimensions of the towing tank were 300 m × 16 m × 7.5 m; meanwhile, the maximum towing speed was 10 m/s. The sampling frequency was 50 Hz, while the wave height was measured using a wave meter. This test facility can simulate various marine environmental conditions, such as wind, waves, and currents. The experimental setup is shown in Figure 6.

Figure 6.
The test model with fins. Fins are 45% Lpp from the stern and the fins are at a 10° angle to the bottom panel.
A series of resistance tests in calm water and seakeeping tests with head waves was conducted at a speed of 1.2485 m/s, corresponding to the full-scale ship speed of 18 knots. The wave conditions were set with the fraction of wave length to ship length varying from 0.3 to 1.6. The selection of these wave conditions was based on the study of the hull response of the studied hulls for given draft, speed, and wave incidence conditions, which are explained further in Zhang’s research [19]. The wave heights varied from 3.736 cm to 5.034 cm and 6.57 cm, and the corresponding periods were 0.845 s, 0.978 s, and 1.092 s. The wave course was maintained at 180°, heading the ship.
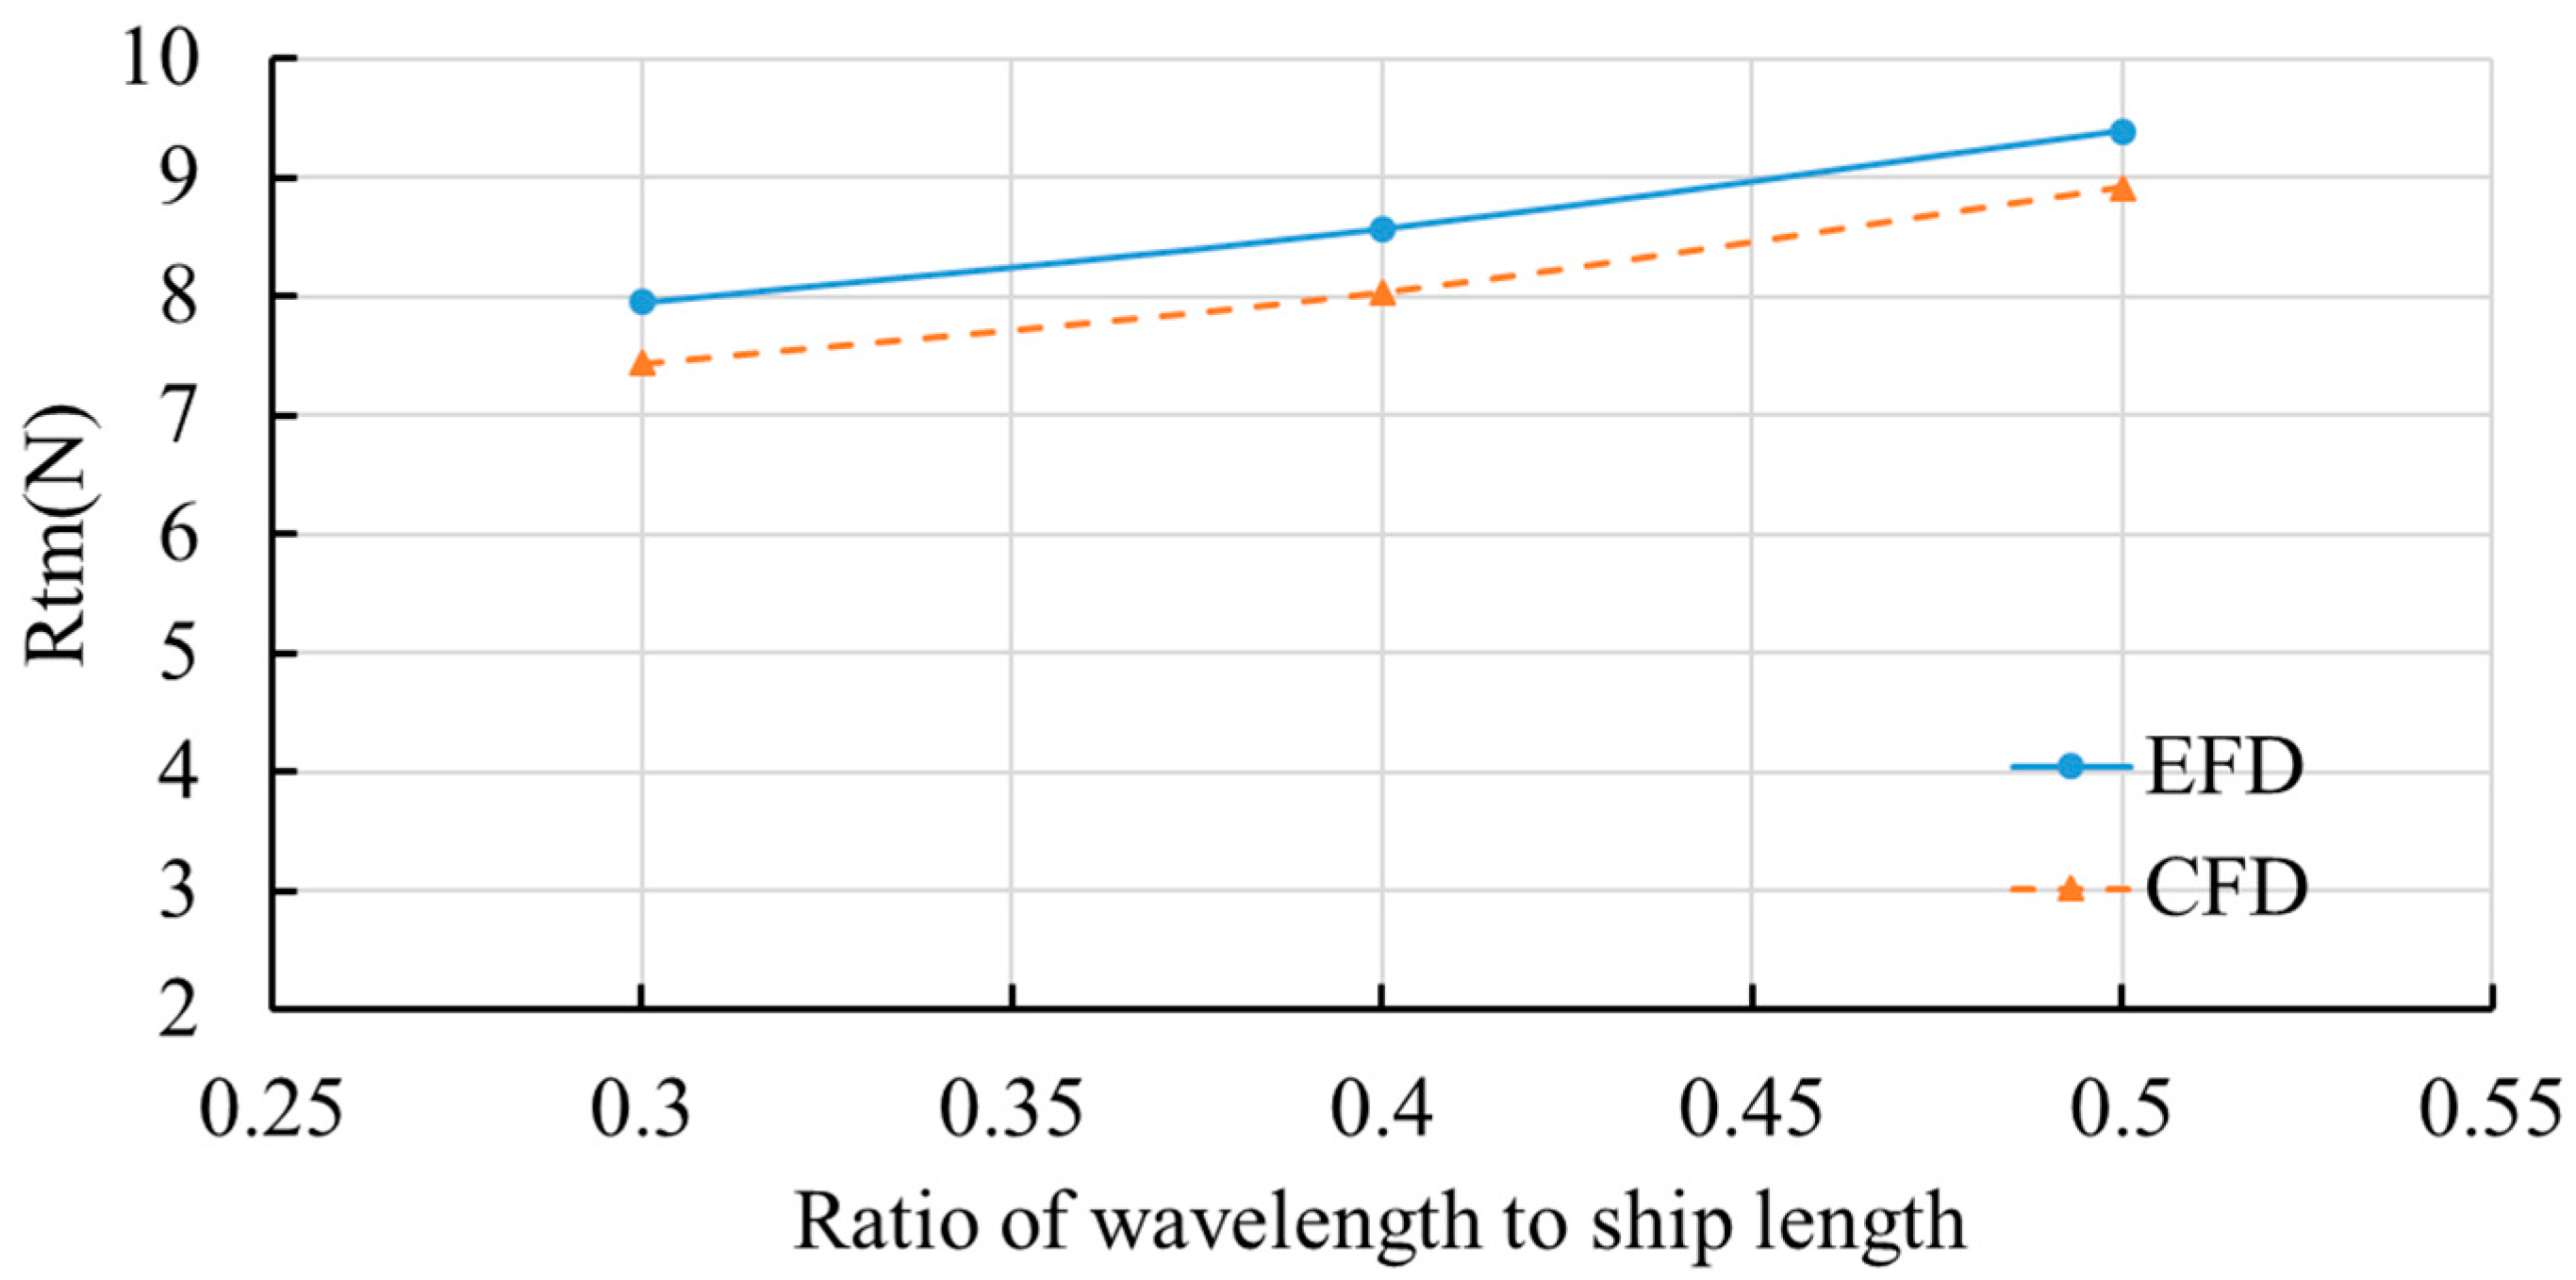
The results calculated with a wave height of 3.736 cm and a period of 0.845 s are shown in Table 4 and Table 5. Table 4 presents the average motion parameters for the fin-equipped ship in calm water, while Table 5 provides the average motion parameters for the ship under the established wave conditions. These parameters were chosen to represent the typical operational conditions for the ship type under study and to ensure that the results were relevant to the ship’s operational conditions. Figure 7 shows the experimental and CFD validation values for wavelength captain ratios from 0.3 to 0.5, with a difference of about 6%.
Table 4.
The resistance test results.
Table 5.
The seakeeping test results.
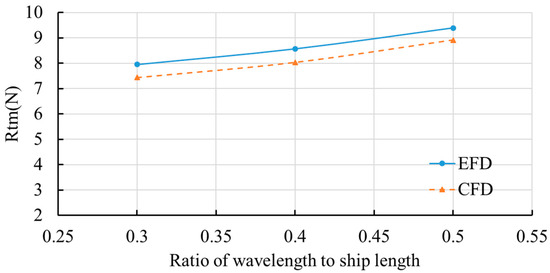
Figure 7.
Headwave experimental and computational resistance validation.
4. Results and Analysis
4.1. Resistance in Calm Water
In order to ensure the accuracy of the numerical simulations, the resistance values of the ship model obtained in the experiments were compared with the resistance values obtained from the CFDs, as shown in Table 6. The calculation results were slightly higher than the test results for the total resistance, with a maximum error within 5.4%.
Table 6.
Comparison of resistance in calm water.
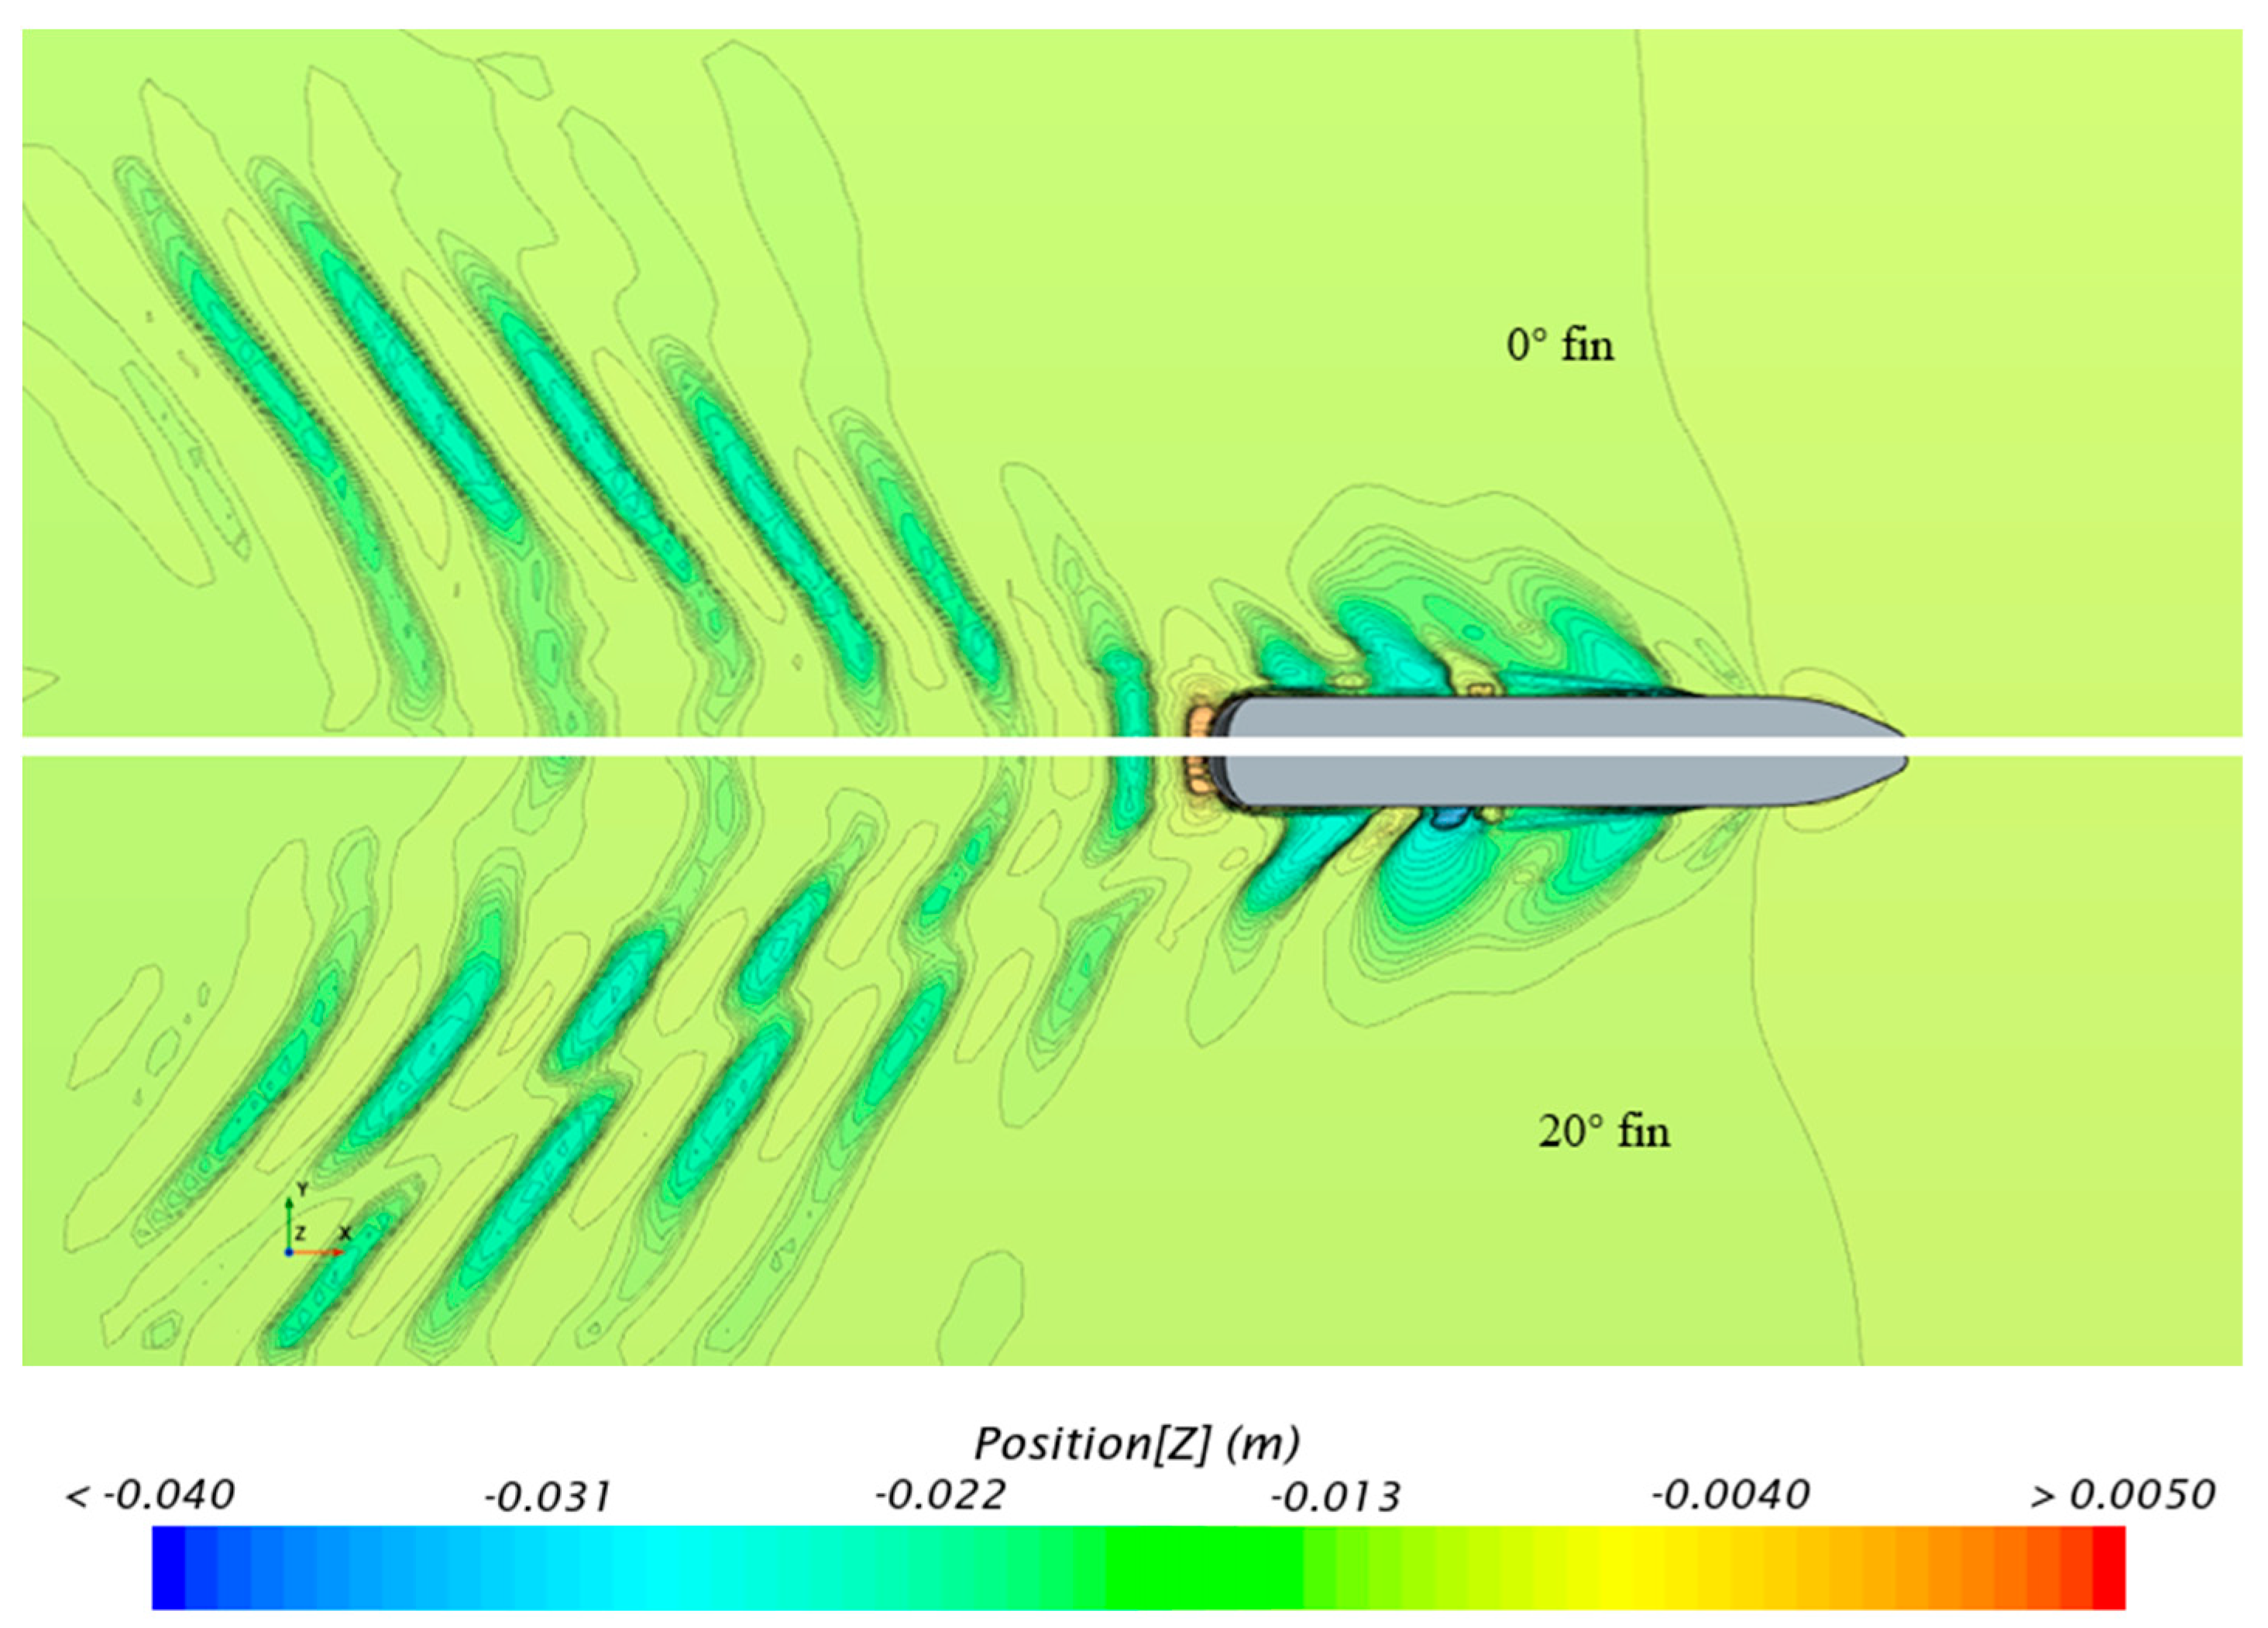
The different waveform contours at different fin angles are shown in Figure 8, which demonstrates the different fin-angle-induced wave discrepancies along the ship’s length.

Figure 8.
An elevation of free surface comparison at service speed.
4.2. Roll Motion
4.2.1. Free Roll Decay Comparison
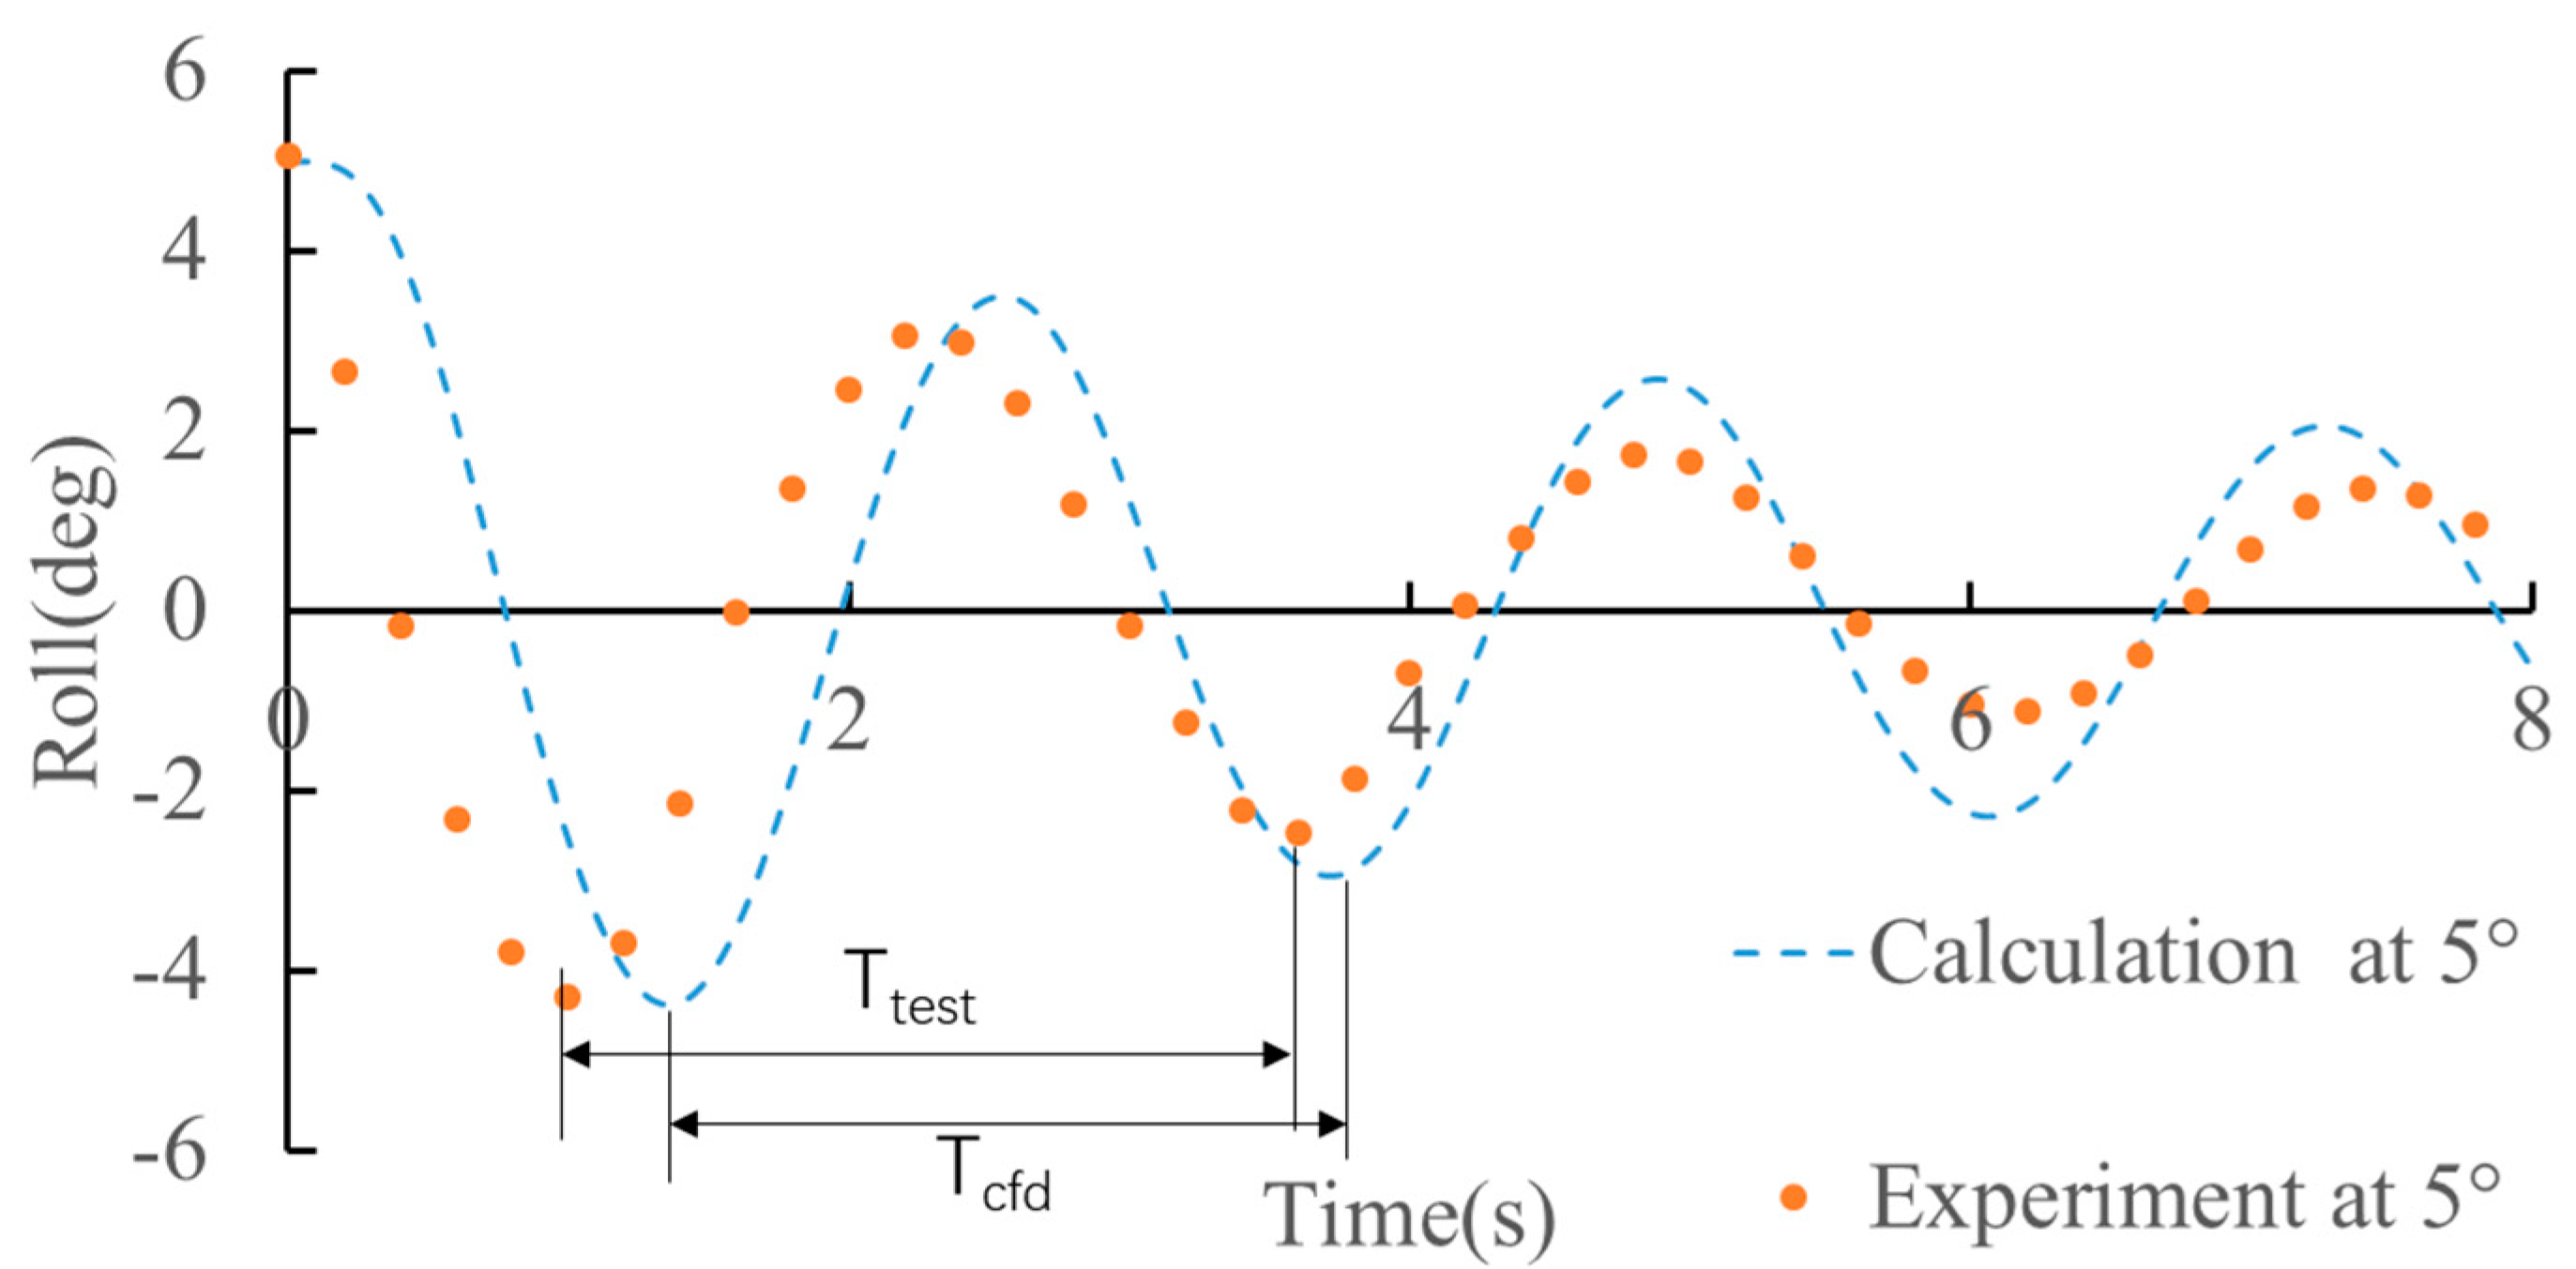
The process outlined in the literature [20] was the source of comparison for the freeroll decay, in which the ship model was released from an initial 5° heel angle and allowed to move freely in calm water. Figure 9 shows the numerical simulation results of the free-rolling decay. The roll amplitude gradually decreased over time, initially rapidly and then more slowly, as described by Fu et al. [21]. After a period of time, the roll angle amplitude decreased towards 0; then, the ship stopped.
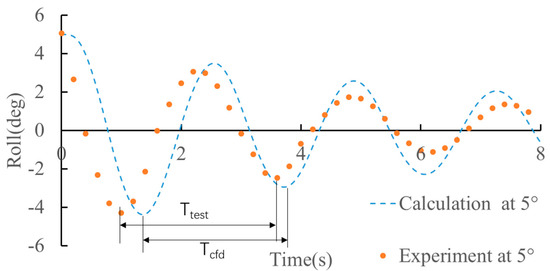
Figure 9.
The free decay comparison of numerical and test data.
The rolling period of the ship model Ttest without fins for free decay at zero speed was 2.58 s. Then, the CFD calculation was carried out and the calculated rolling period was approximately 2.47 s. The errors with respect to the numerical and experimental results for the period were within 5%.
4.2.2. Roll Reduction without or with Fins, or with Fins at Different Angles
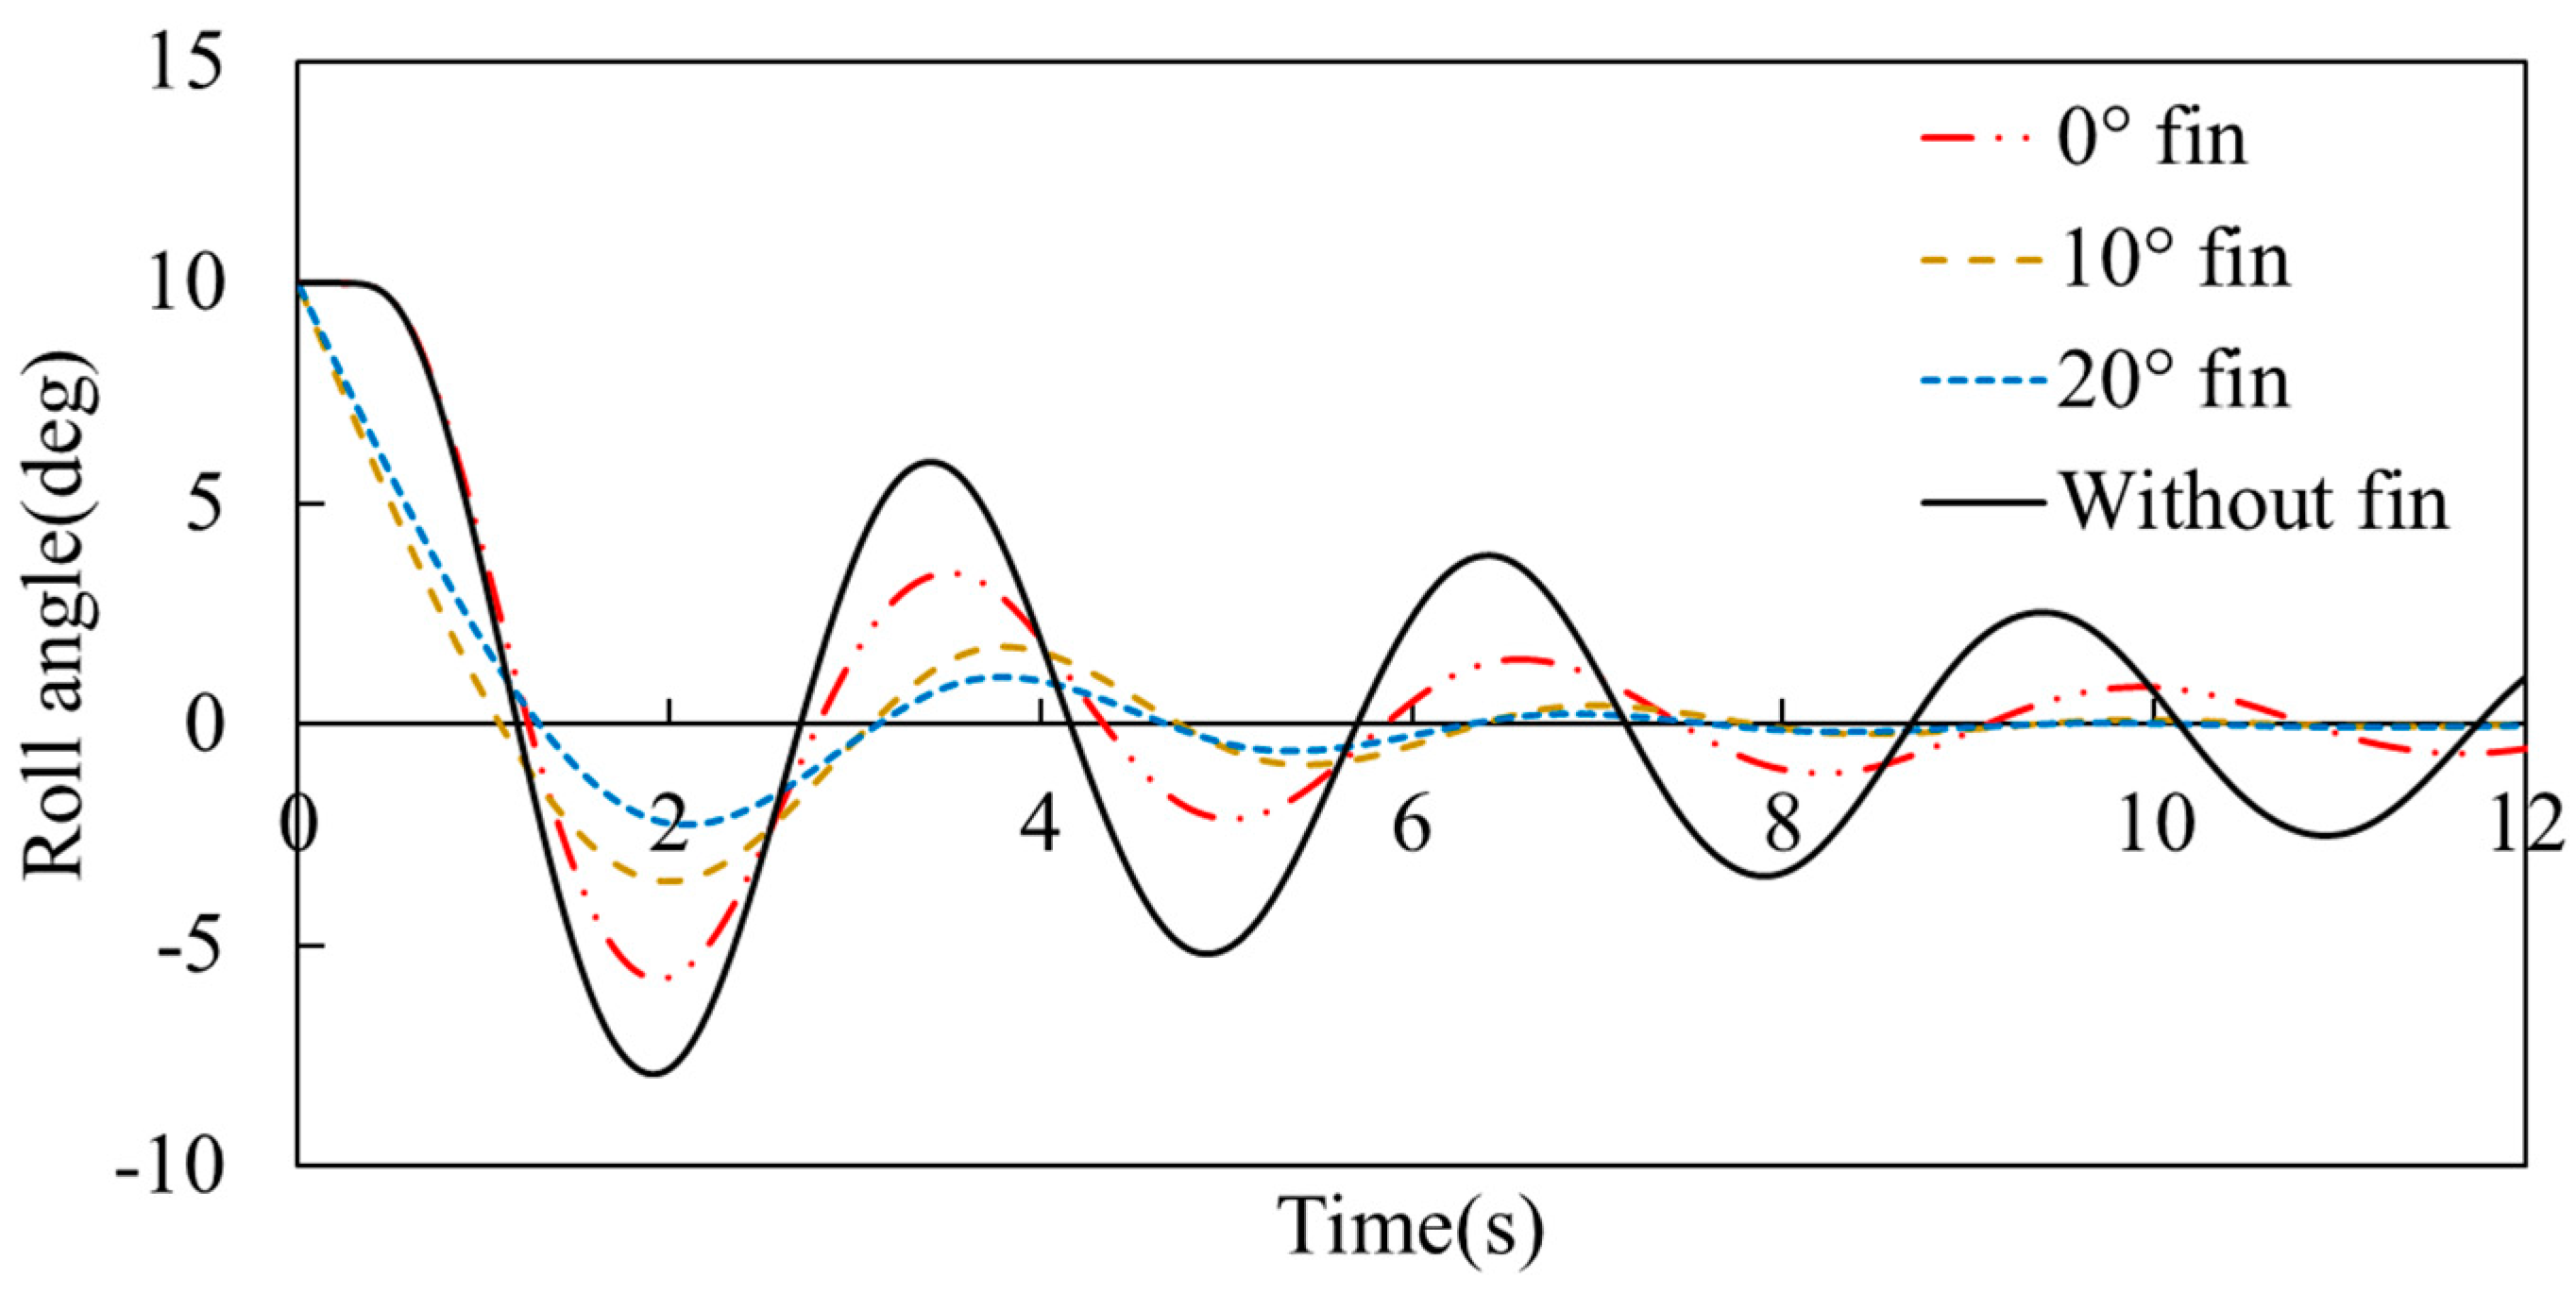
After calculating the free decay, the fin stabilizer reduction roll motion effects were calculated at various fin angles at service speed, as shown in Figure 10. The fin stabilizers can be seen to dramatically decrease the rolling amplitude of the ship compared to the situation without fin stabilizers. Compared to the no-fin-stabilizer condition, at a 0° fin angle, the rolling amplitude was reduced by an average of 34.65%; at a 10° fin angle, it was reduced by an average of 60.95%; and at a 20° fin angle, it was reduced by an average of 75.5%. For comparison with the same basis, as the fin stabilizers were fixed during the port-to-starboard rolling, when the stabilizers rolled back, the fin angle turned to the opposite angle; additionally, the two fins at each side turned in different directions except at the initial 0°.
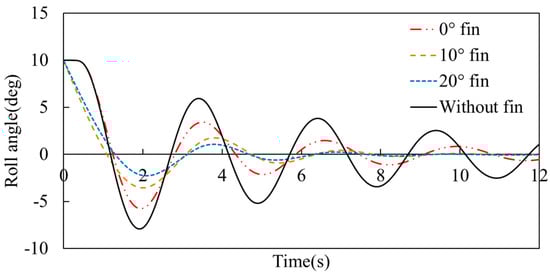
Figure 10.
A time history of the roll motion.
The 0° fin performs a function analogous to that of the bilge keels, acting as a flow-field interference device to introduce added hydrodynamic damping forces that can counteract the roll motion.
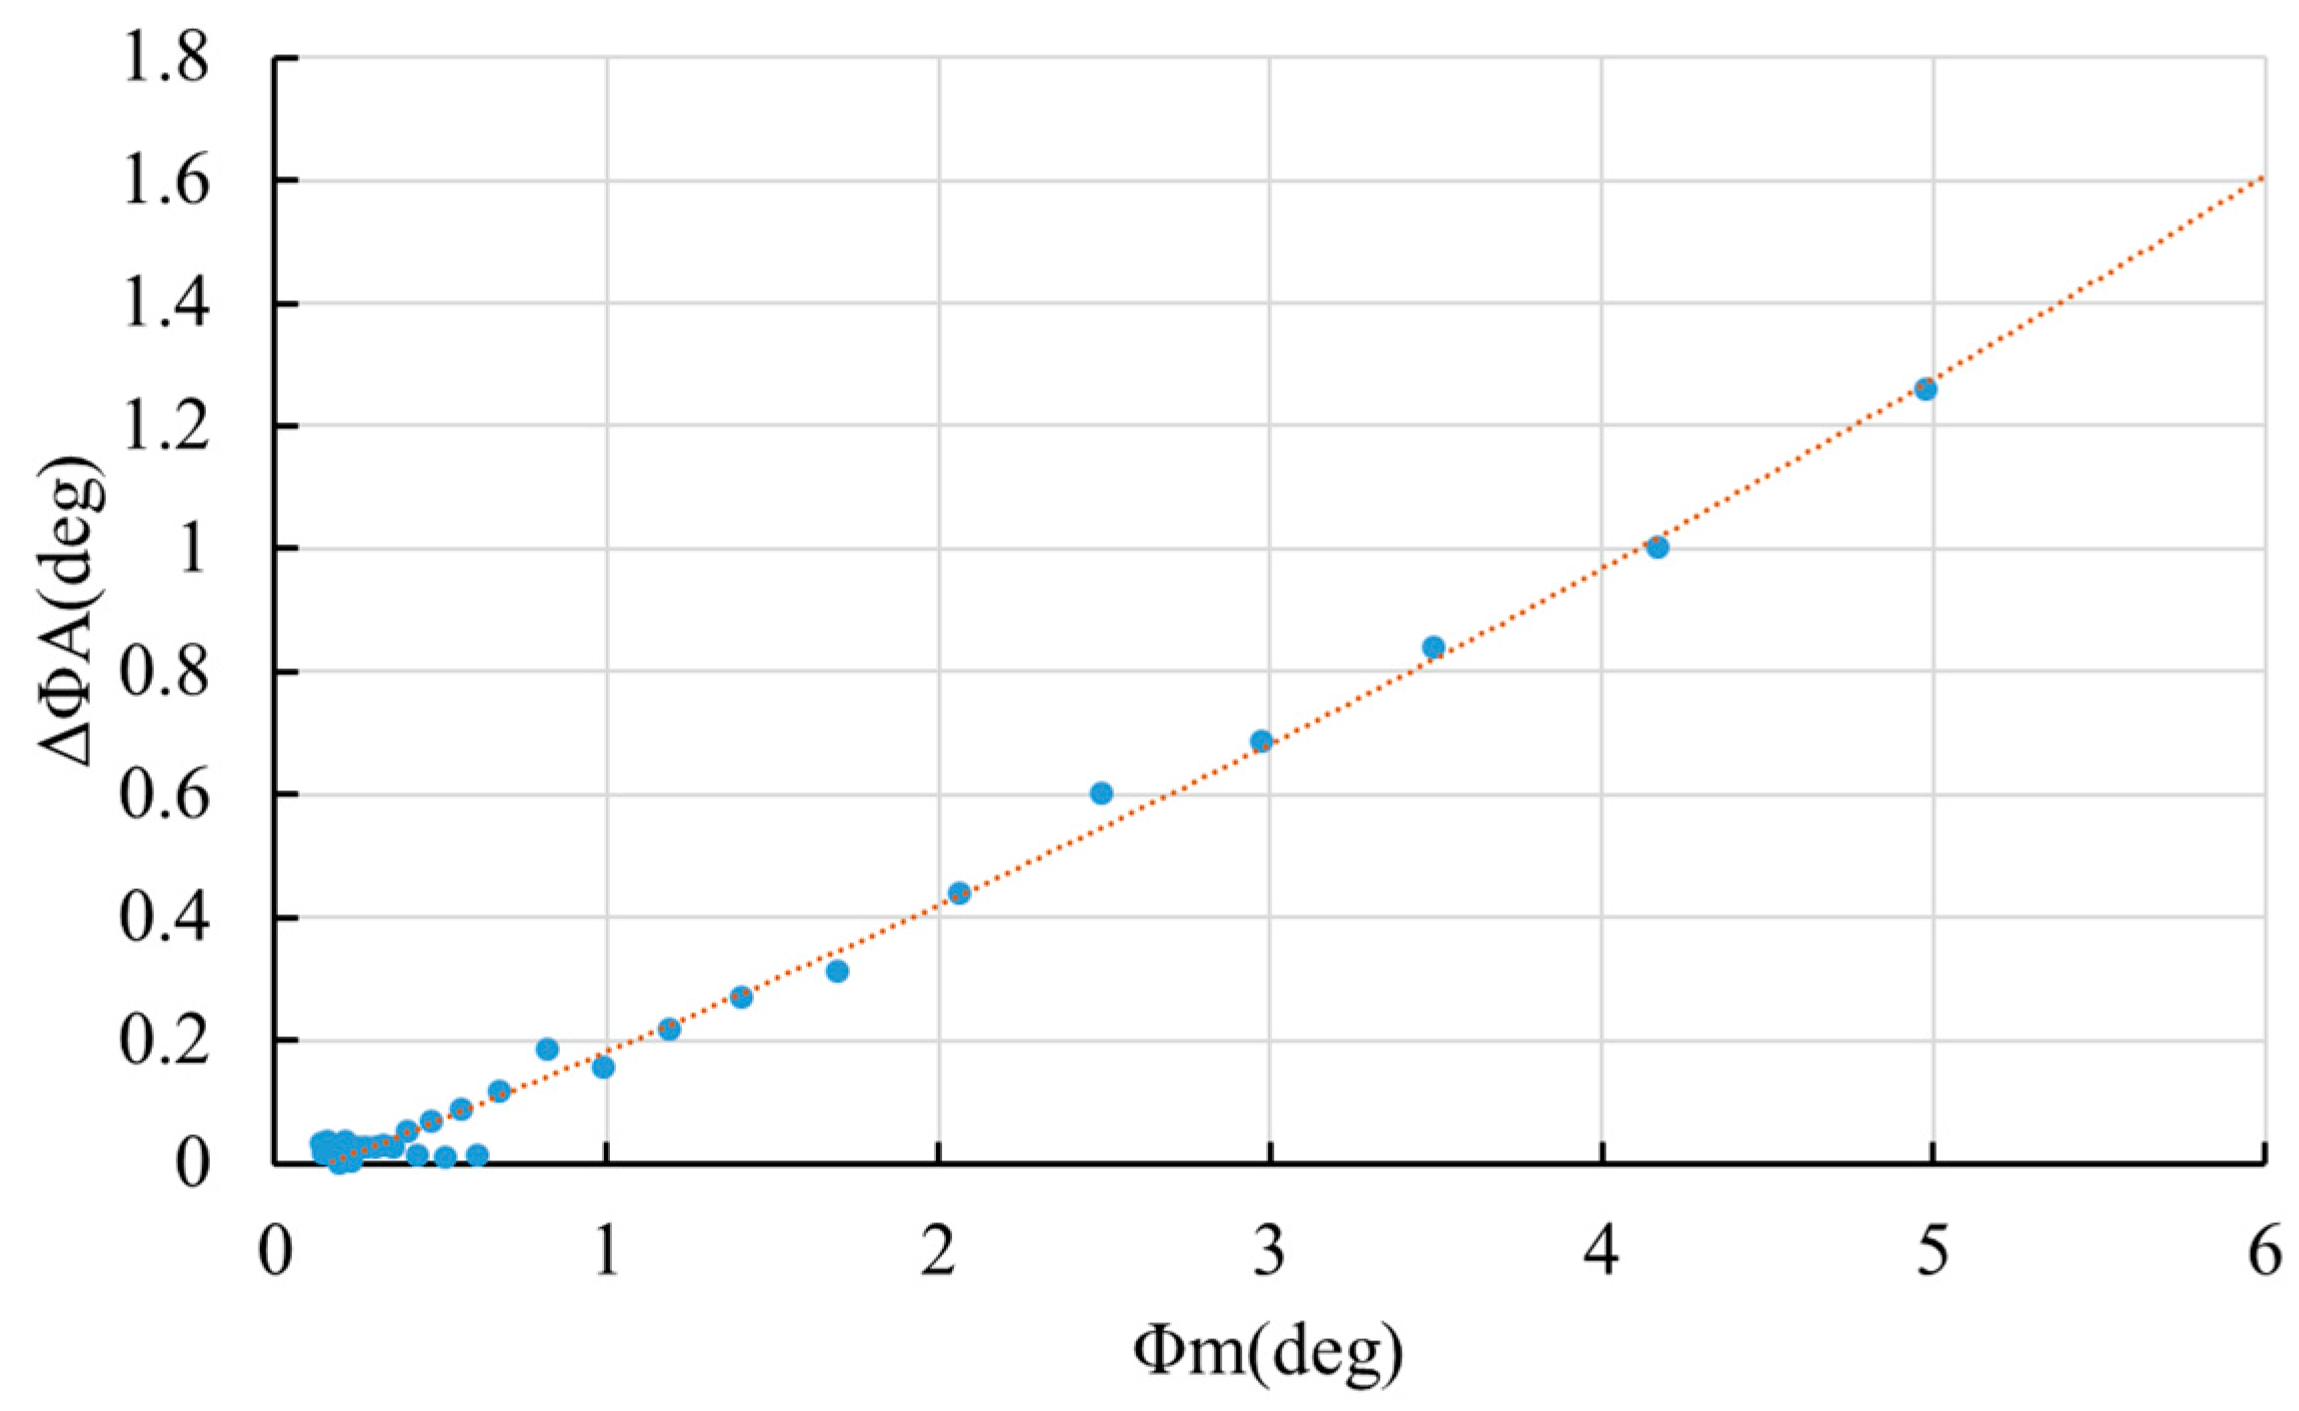
In Figure 11, represents the difference between two adjacent amplitudes and is the average amplitude of two adjacent times. The roll extinction curve of a ship can generally be expressed using a formula in the following format:
where is the inclination angle at the beginning of the roll motion. From the figure, a can be obtained as 0.2032 while b is 0.0117.
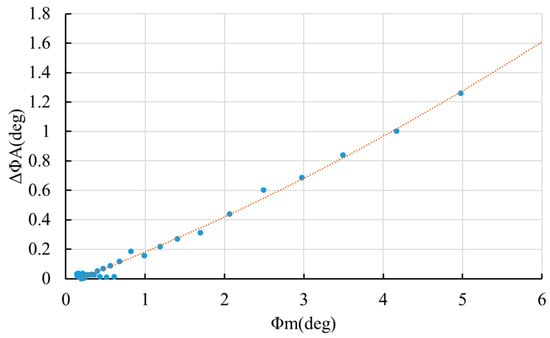
Figure 11.
The roll extinction curve for the 0° fin.
Ship rolling is similar to the process of damped elastic oscillation. The disturbance moment of the waves is represented with the wave slope. The rolling amplitude as the output can be regarded as the dynamic amplification of the wave slope. The dynamic amplification effect is very significant during the harmonic rolling. The fin stabilizer can provide an additional stabilizing moment, which can reduce the roll. Therefore, the function of the anti-rolling device can be regarded as the reduction in the wave slope. This reduction in the wave slope is called the capacity of the anti-rolling device or the equivalent wave slope, denoted as (°) [22]. Typically, Equation (5) would be used to design the fins to ensure they can meet the roll reduction criteria, as follows:
where is the model speed; is the fin total area, which is 0.00744 m2; and the distance from the center of the fin to the center of gravity is . is a variable quantity. as the displacement and as the metacentric height that are provided in the previous Section 2.1.
The equivalent wave slope varied for a 0° fin with , a 10° fin with and a 20° fin with . The wave slope of a 10° fin was about 2.035 times that of a 0° fin, and the wave slope of a 20° fin was about 3.24 times that of a 0° fin.
4.2.3. Comparison from Energy Point of View
Analyzing the rolling motion of a finned ship in the time domain is complicated. Using the energy method to analyze the role of the stabilizer can more directly reflect the role of the lift force. The work performed by the stabilizer from the wave crest to the wave trough during the rolling process is equivalent to the work performed by its lift moment during the corresponding motion. In Equation (6), is the work performed by the stabilizer to resist rolling, is the moment generated by the stabilizer, is the roll angle peak in half a cycle, and is the same half-cycle internal roll angle trough.
Table 7 shows the work performed by the 0°, 10°, and 20° fins (the calculation of the work only includes the work performed by a single fin) in three cycles (Figure 10), since, after three cycles, the amplitudes of the 10° and 20° fins were already less than 1°.
Table 7.
The work performed using the fin stabilizer (the unit of the values in the table is joules).
In the first cycle, the reductions in the free-rolling amplitude for the 10° fin and 20° fin compared to the 0° fin free-rolling amplitude were 38.26% and 61.39%, respectively. The work performed using the 0° fin was reduced by 33.73% and 49.22% compared with the 10° fin and the 20° fin.
Since the initial roll angle of the ship is the same, the energy required for the ship to return to the equilibrium position is equal. The greater the lift generated by the fins, the faster the ship can regain its balance.
5. Discussion
To ensure the accuracy of the numerical simulation, the states of motion in waves from the model tests were compared with the numerical simulations. For an average heave of −0.612 mm for the model tests and −0.508 mm for the CFD simulation tests under the same wave conditions, the difference between the tests and the calculations was acceptable.
5.1. Fin Force Comparison
The interactions of the fin and hull, which vary at different speeds, have been demonstrated by Bhosale [13]; however, an analysis of the different fin angles is lacking. In this section, with the five ship speeds, the lift coefficients at four different fin angles were analyzed using CFDs, which are listed in Table 8. The relative measurements of the Froude number are taken from Lpp.
Table 8.
The lift force of fin–hull interaction at different speeds and angles of attack (Unit: N).
When is the fluid density, is the free-steam velocity, and is the fin area, and represent the lifting and drag forces induced via the fin foil at a certain attack angle, respectively. Then, the lift coefficient and drag coefficient can be defined as per the following Equations (7) and (8):
Due to unsteady local velocities, a steady evaluation method for the average local Reynolds number Re is introduced where is the coefficient of dynamic viscosity and L is the fin length, as follows:
According to the local Reynolds number of the fins, the fin drags were computed and compared with the EFD results [3].
When Fr is 0.2, in the velocity vector diagram of the fin stabilizer section, it can be seen that the velocity of the flow field decreases significantly when approaching the fin stabilizer, resulting in a mismatch with the theoretically calculated lift value. There is a significant discrepancy between the theoretical (or steady) and the actual lift forces. At an angle of attack of 10°, the difference is 11.35%; meanwhile, at 20°, the discrepancy increases to 11.81%.
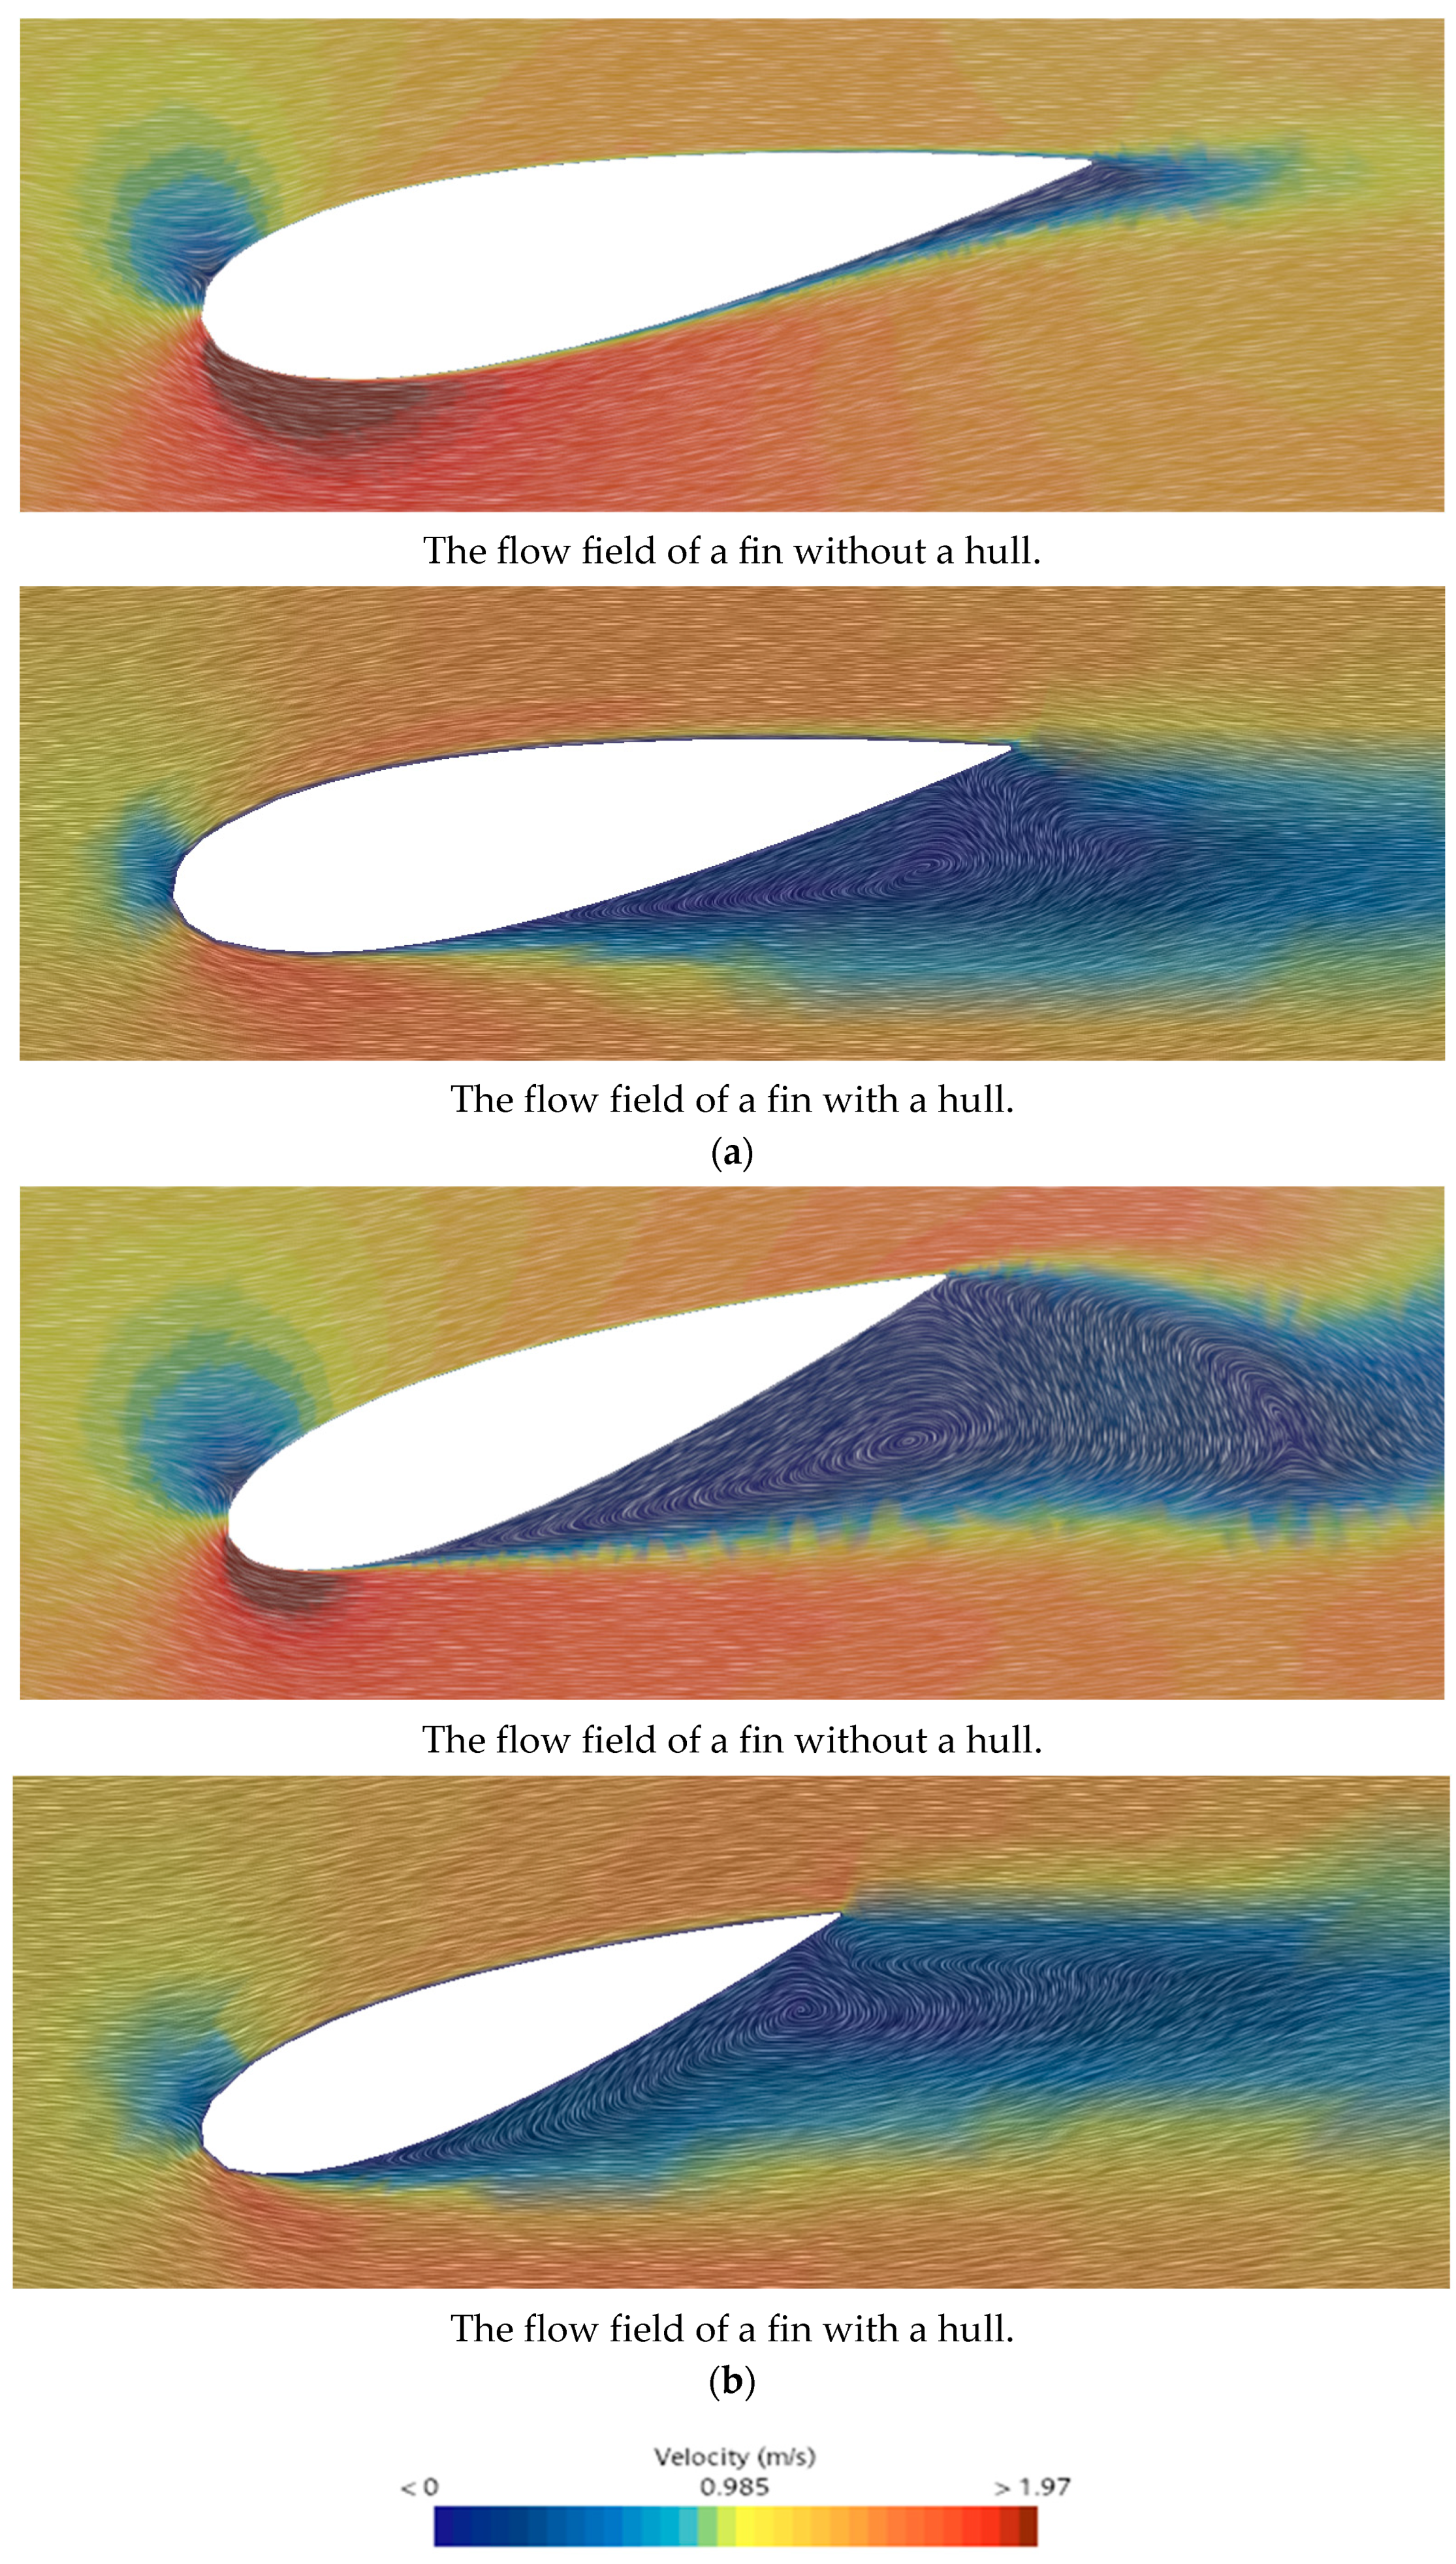
Furthermore, the analysis can be completed for the influence of the flow field with and without considering the fin–hull interaction via the CFD results. Figure 12 shows a comparison of the velocity field of the fin with and without the hull flow-field at 10° and 20° angles of attack. At an angle of attack of 10°, the velocity distribution of the fin is clearly different. With the velocity change in the 10° fin with the hull, the flow field is relatively gentle at the leading edge; meanwhile, without the flow field, there are obvious velocity changes at the leading edge. The velocity is stratified, the speed in the low-speed area is lower, and the speed in the high-speed area is higher. In the wake part, it can be seen that, under the influence of the hull flow field, the low-speed area appears earlier, the wake range is larger, and the low-speed area is much larger than the high-speed area. The low-speed zone of the 10° fin is affected by the hull flow field.

Figure 12.
The velocity contours around the fins with different angles of roll motion with/without hull interaction. (a) 10° fin angle. (b) 20° fin angle.
At an angle of attack of 20°, the 20° fin with the influence of the hull flow field has a relatively gentle speed change at the leading edge, while the 20° fin without the influence of the hull flow field has obvious velocity stratification at the leading edge. The wake part illustrates that there is a phase difference in the low-speed area. Although it is smaller, the wake affected by the hull flow field is smoother and has no trapped vortices.
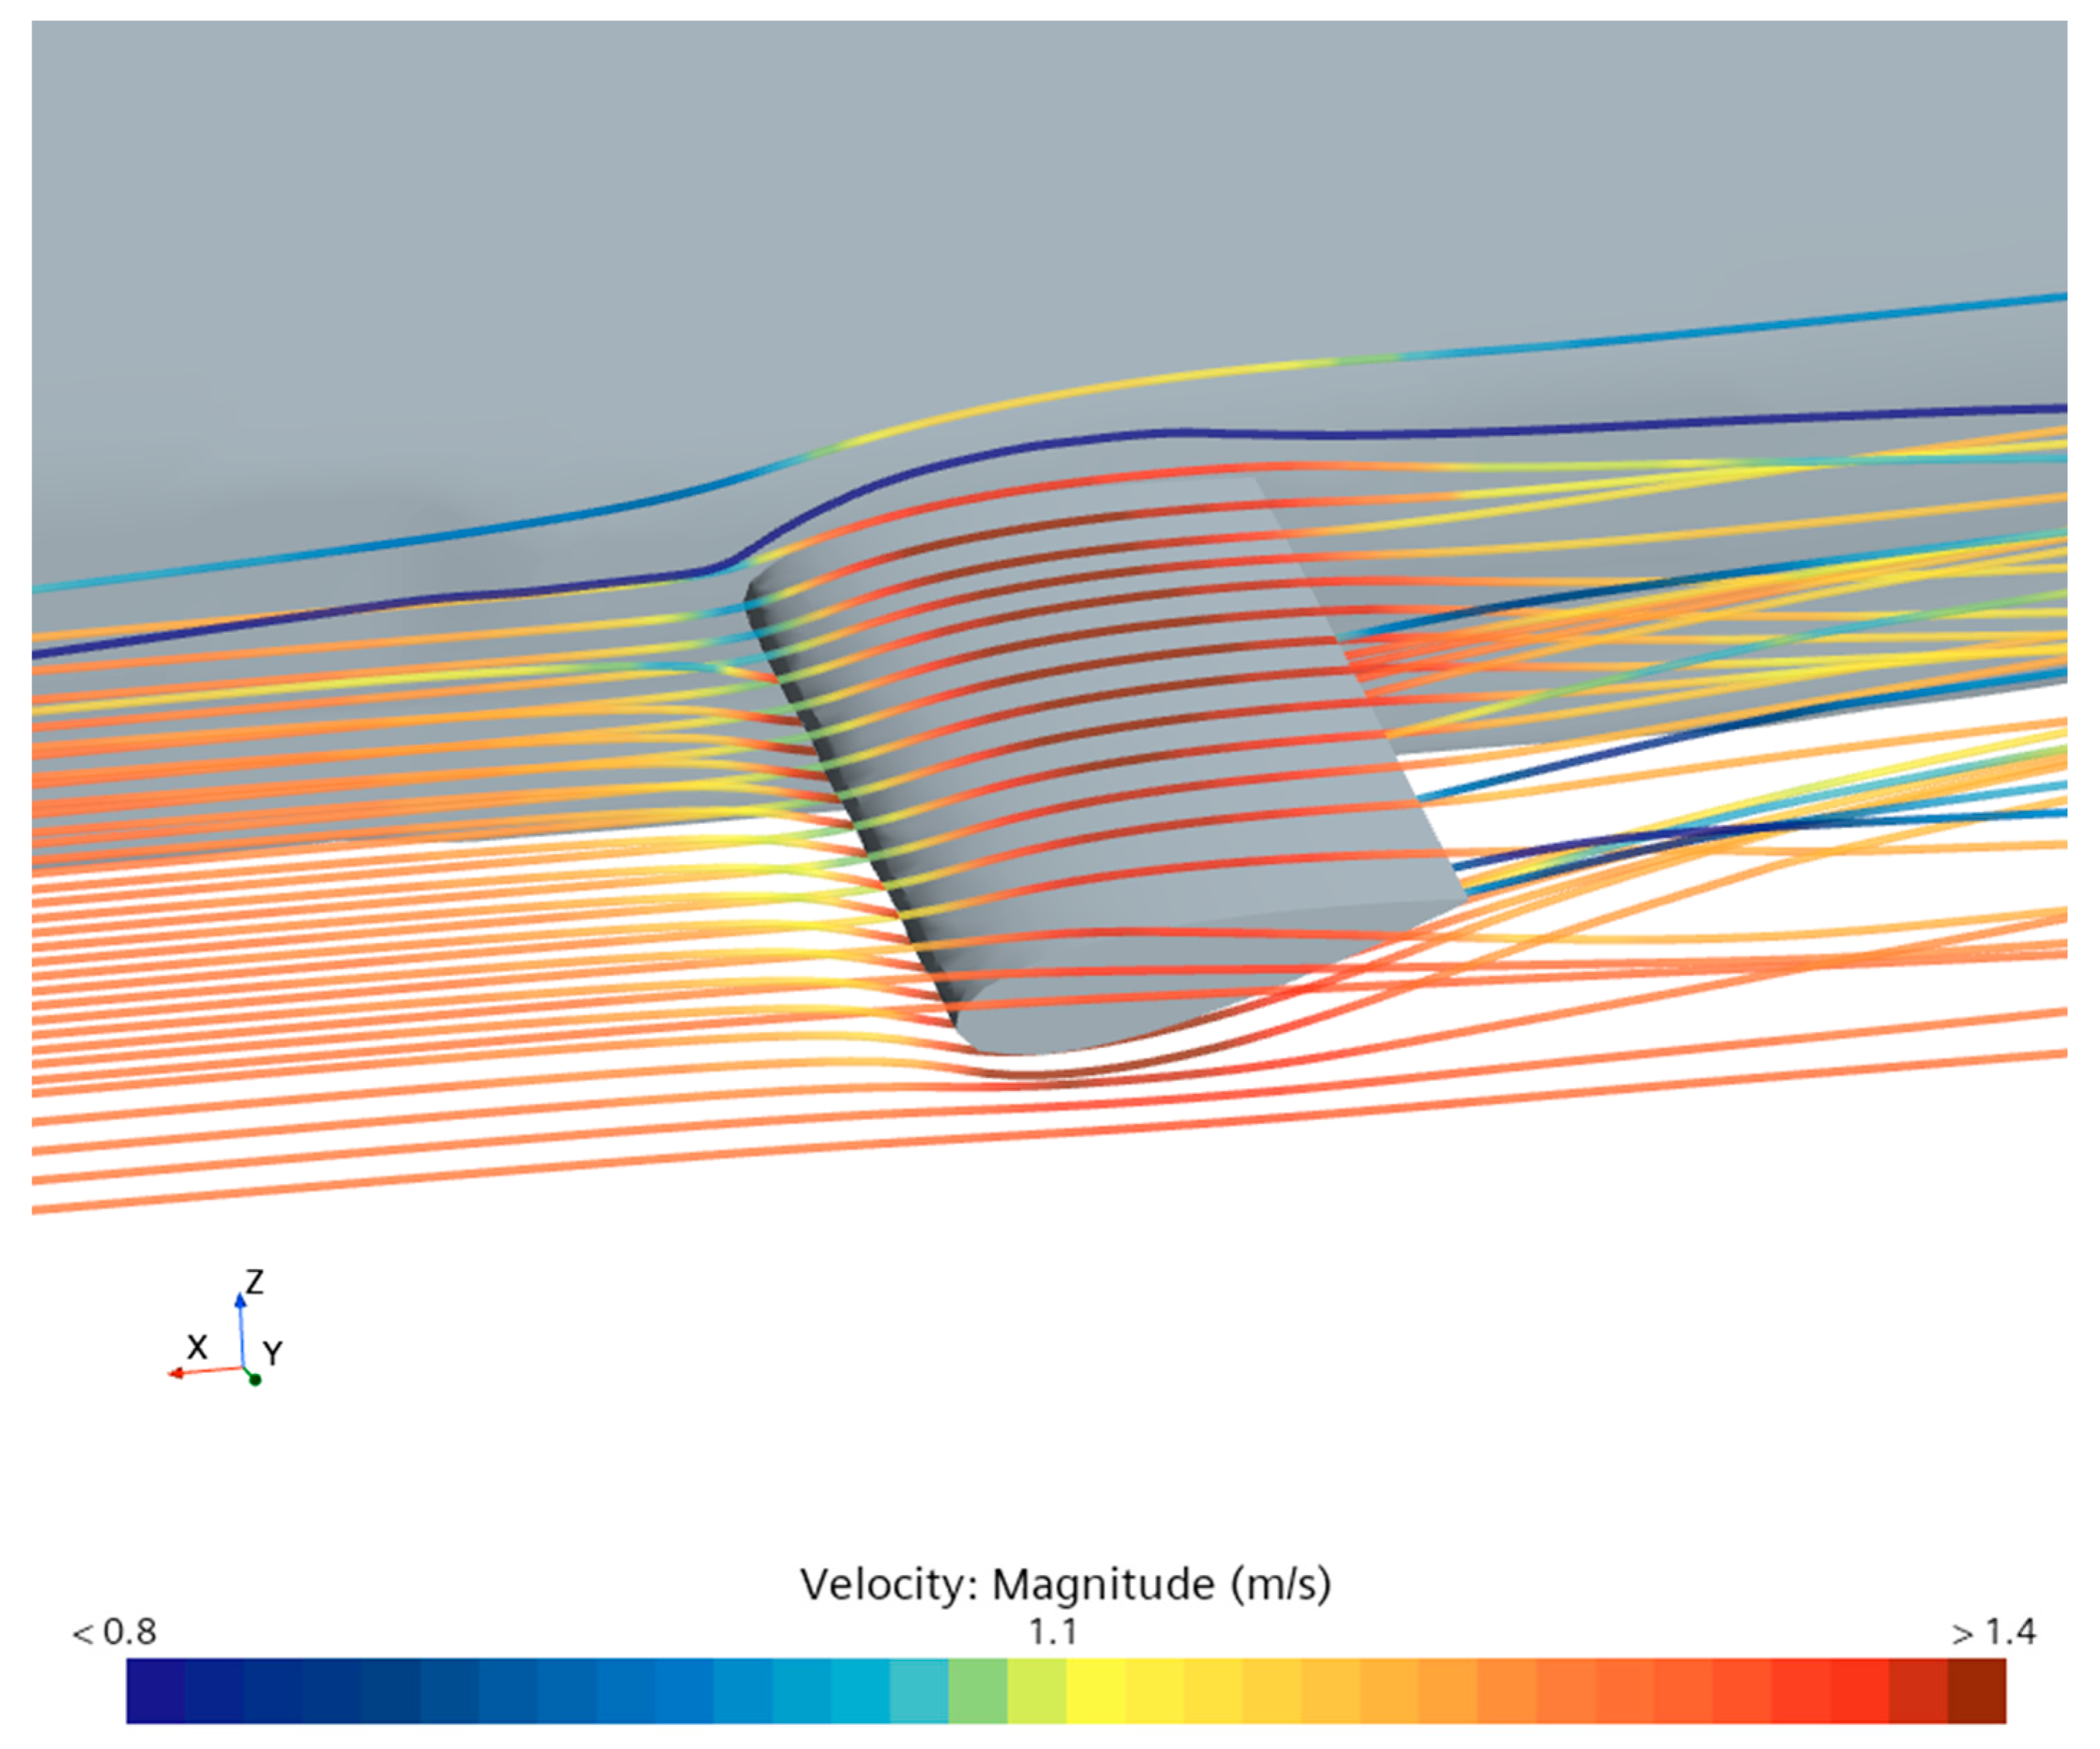
As can be seen from the flow diagram in Figure 13, the fins are subjected to incoming velocities that are smaller when they approach the hull more closely, which is one of the reasons why the fin lift is less than the theoretical calculations.

Figure 13.
The flow diagram of fin–hull interaction for a 10° fin.
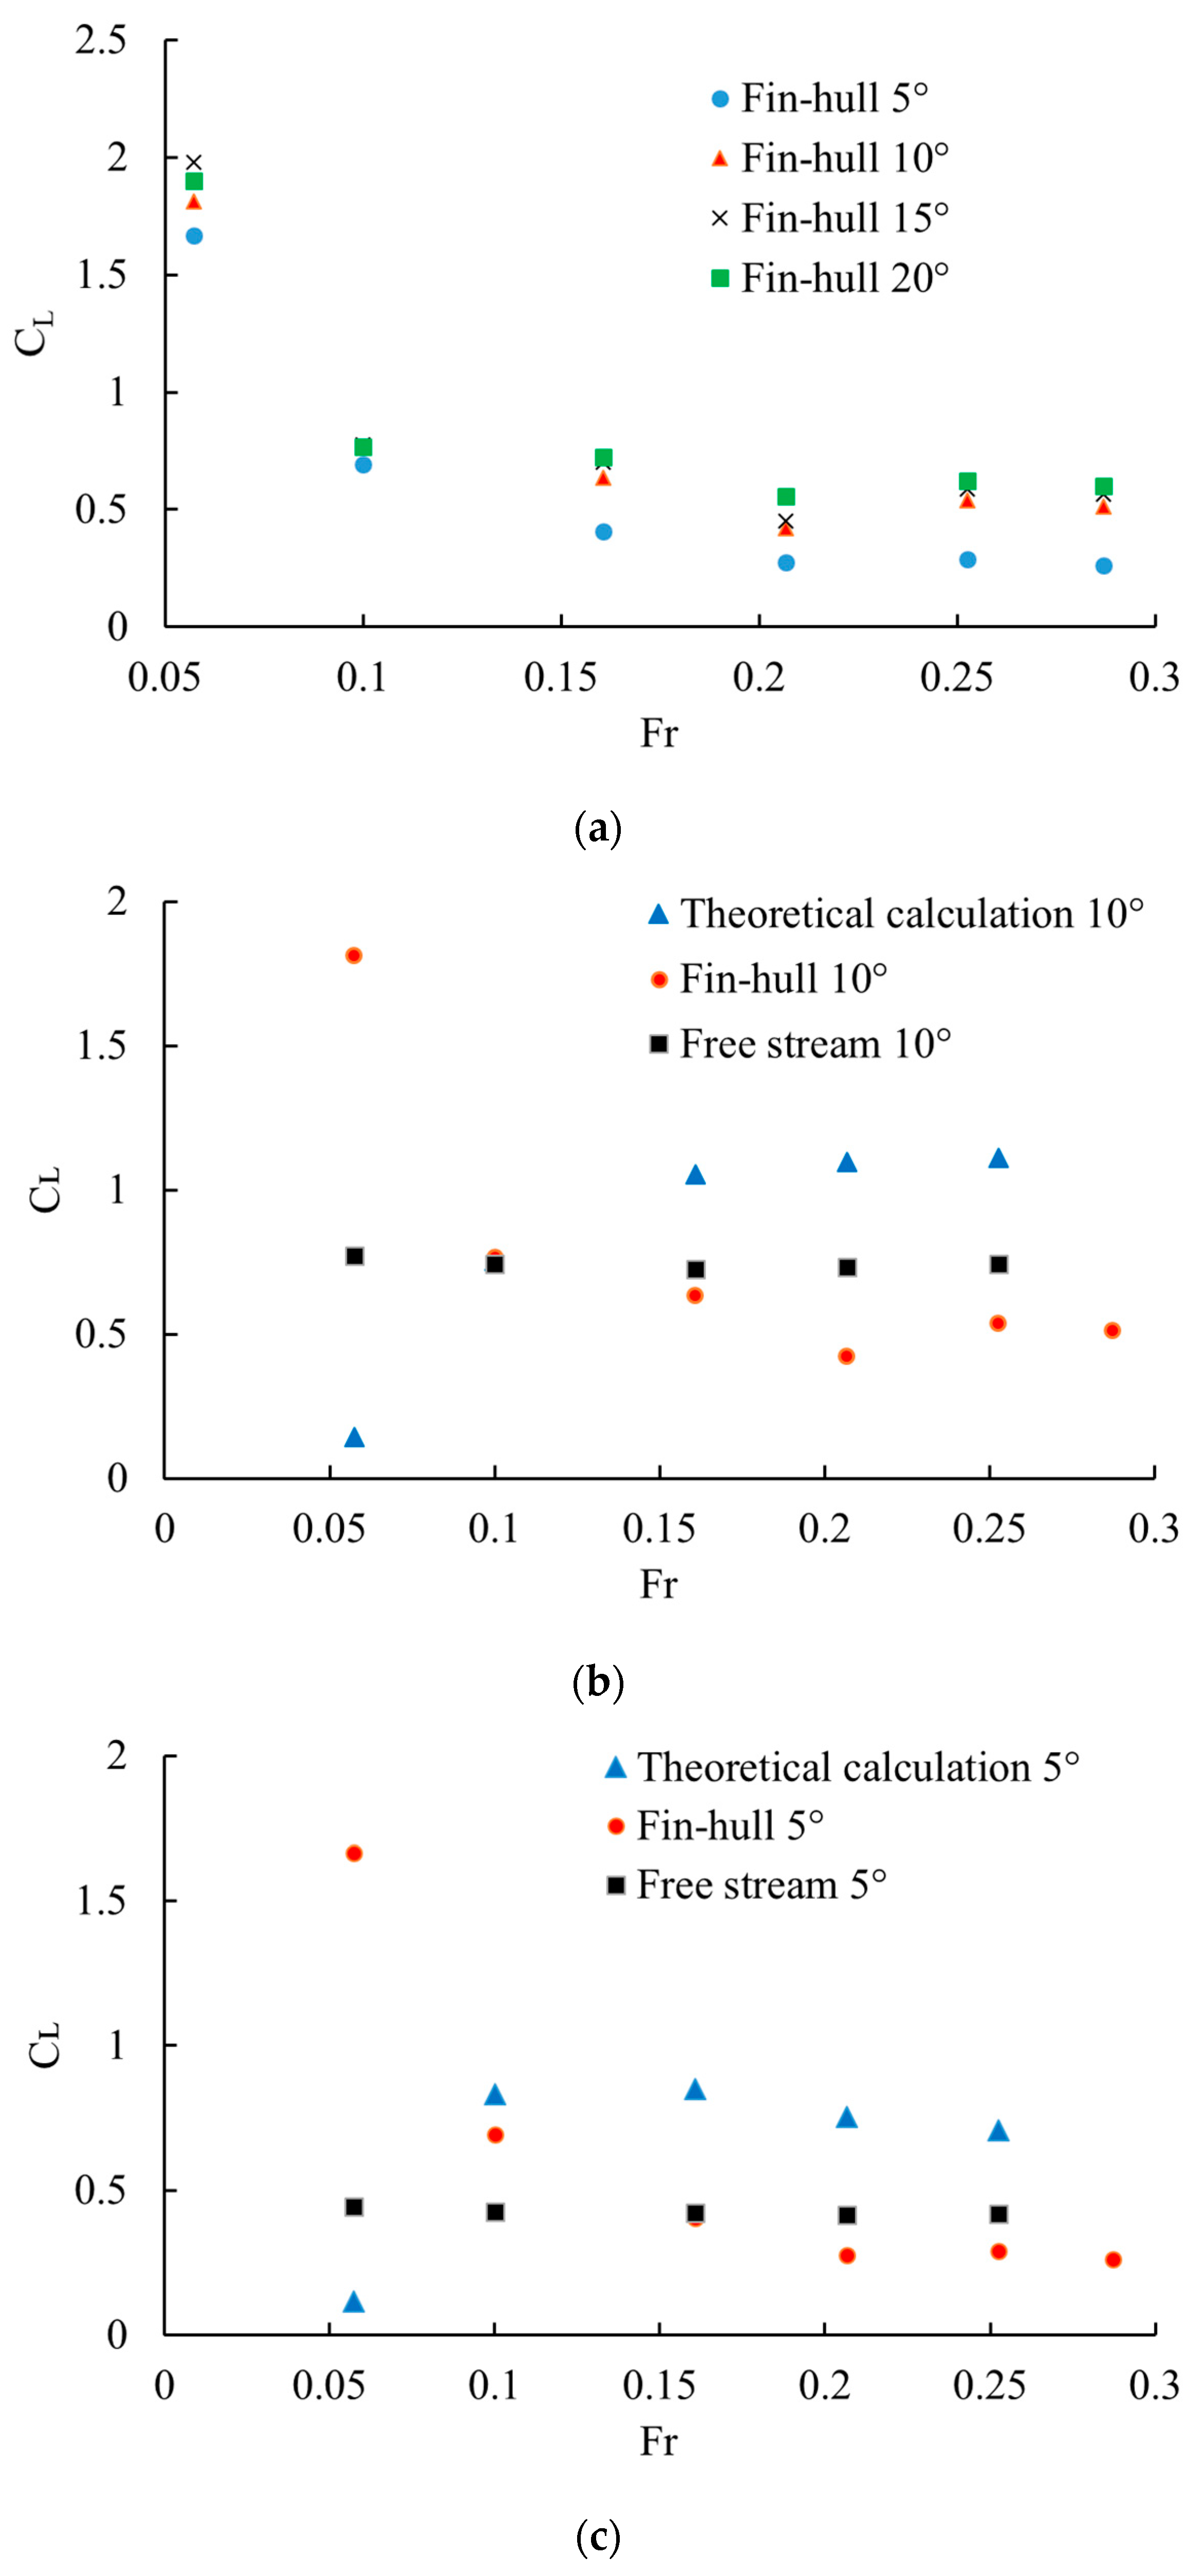
5.2. Lift Coefficient Diagram
The specific variations in the fin lift coefficient are shown in Figure 14. As the figure shows, when Fr is less than 0.15, the lift coefficient of the fin in the free-stream condition is lower than that in the coupled state with the ship’s fin. However, when Fr exceeds 0.15, the lift coefficient of the fin in the free-stream condition becomes greater than the results considering the fin–hull interaction. The main reason for the increase in at a low Fr is that the Re number is below 3 × 10⁶. At this time, the flow field near the fin is not turbulence-dominant. We calculated that the Re number should be greater than 3 × 10⁶ and the Fr should be greater than 0.15 to attain a turbulent state.
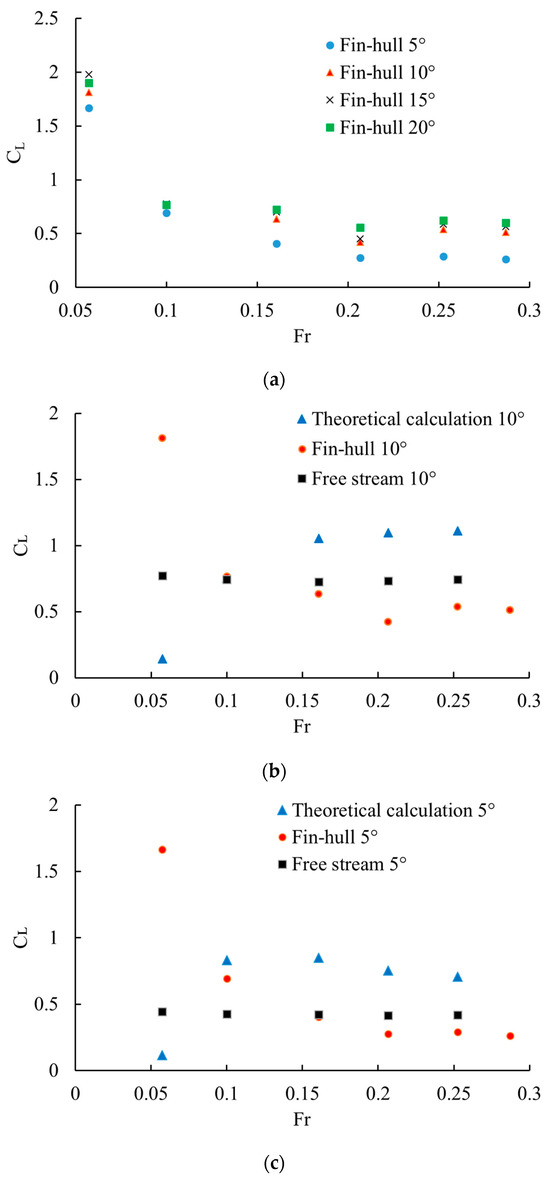
Figure 14.
(a) The variation in velocity lift coefficients for different angles of attack with fin–hull interaction; (b) a comparison of fins at a 10° angle of attack with and without a hull using RANS and theoretical calculations; (c) a comparison of fins at a 5° angle of attack with and without a hull using RANS and theoretical calculations.
According to Figure 14b,c, the difference in Fr leads to different lift coefficients for the theoretically calculated as well as numerically analyzed fin forces in RANS.
The fins were evaluated using the above Equation (7), and the results are shown in Table 9 below.
Table 9.
The lifting force (units: N): (a) 5° values and comparison; (b) 10° values and comparison; (c) 15° values and comparison; (d) 20° values and comparison.
According to Table 9, for this ship, at a low Fr, the theoretically calculated fin force is 0.25 times that of the case with fin–hull interaction; at a high Fr, the theoretically calculated fin action is 1.93 times that of the case with fin–hull interaction. Following this method, this ship obtains the result of 1.93–0.25, which will vary depending on the ships.
Due to the influence of the fin–hull interaction, it is not suitable to only use Equation (5) for the selection of fin shape and size. For this ship, using both Equation (7) and Table 9, it can be seen that the can be reduced to 0.25 at low speeds and increased to 1.93 times that at high speeds. When designing and optimizing fins, the role of the fin–hull interaction and the of its effects should be taken into account.
5.3. Fin Force in Beam Wave
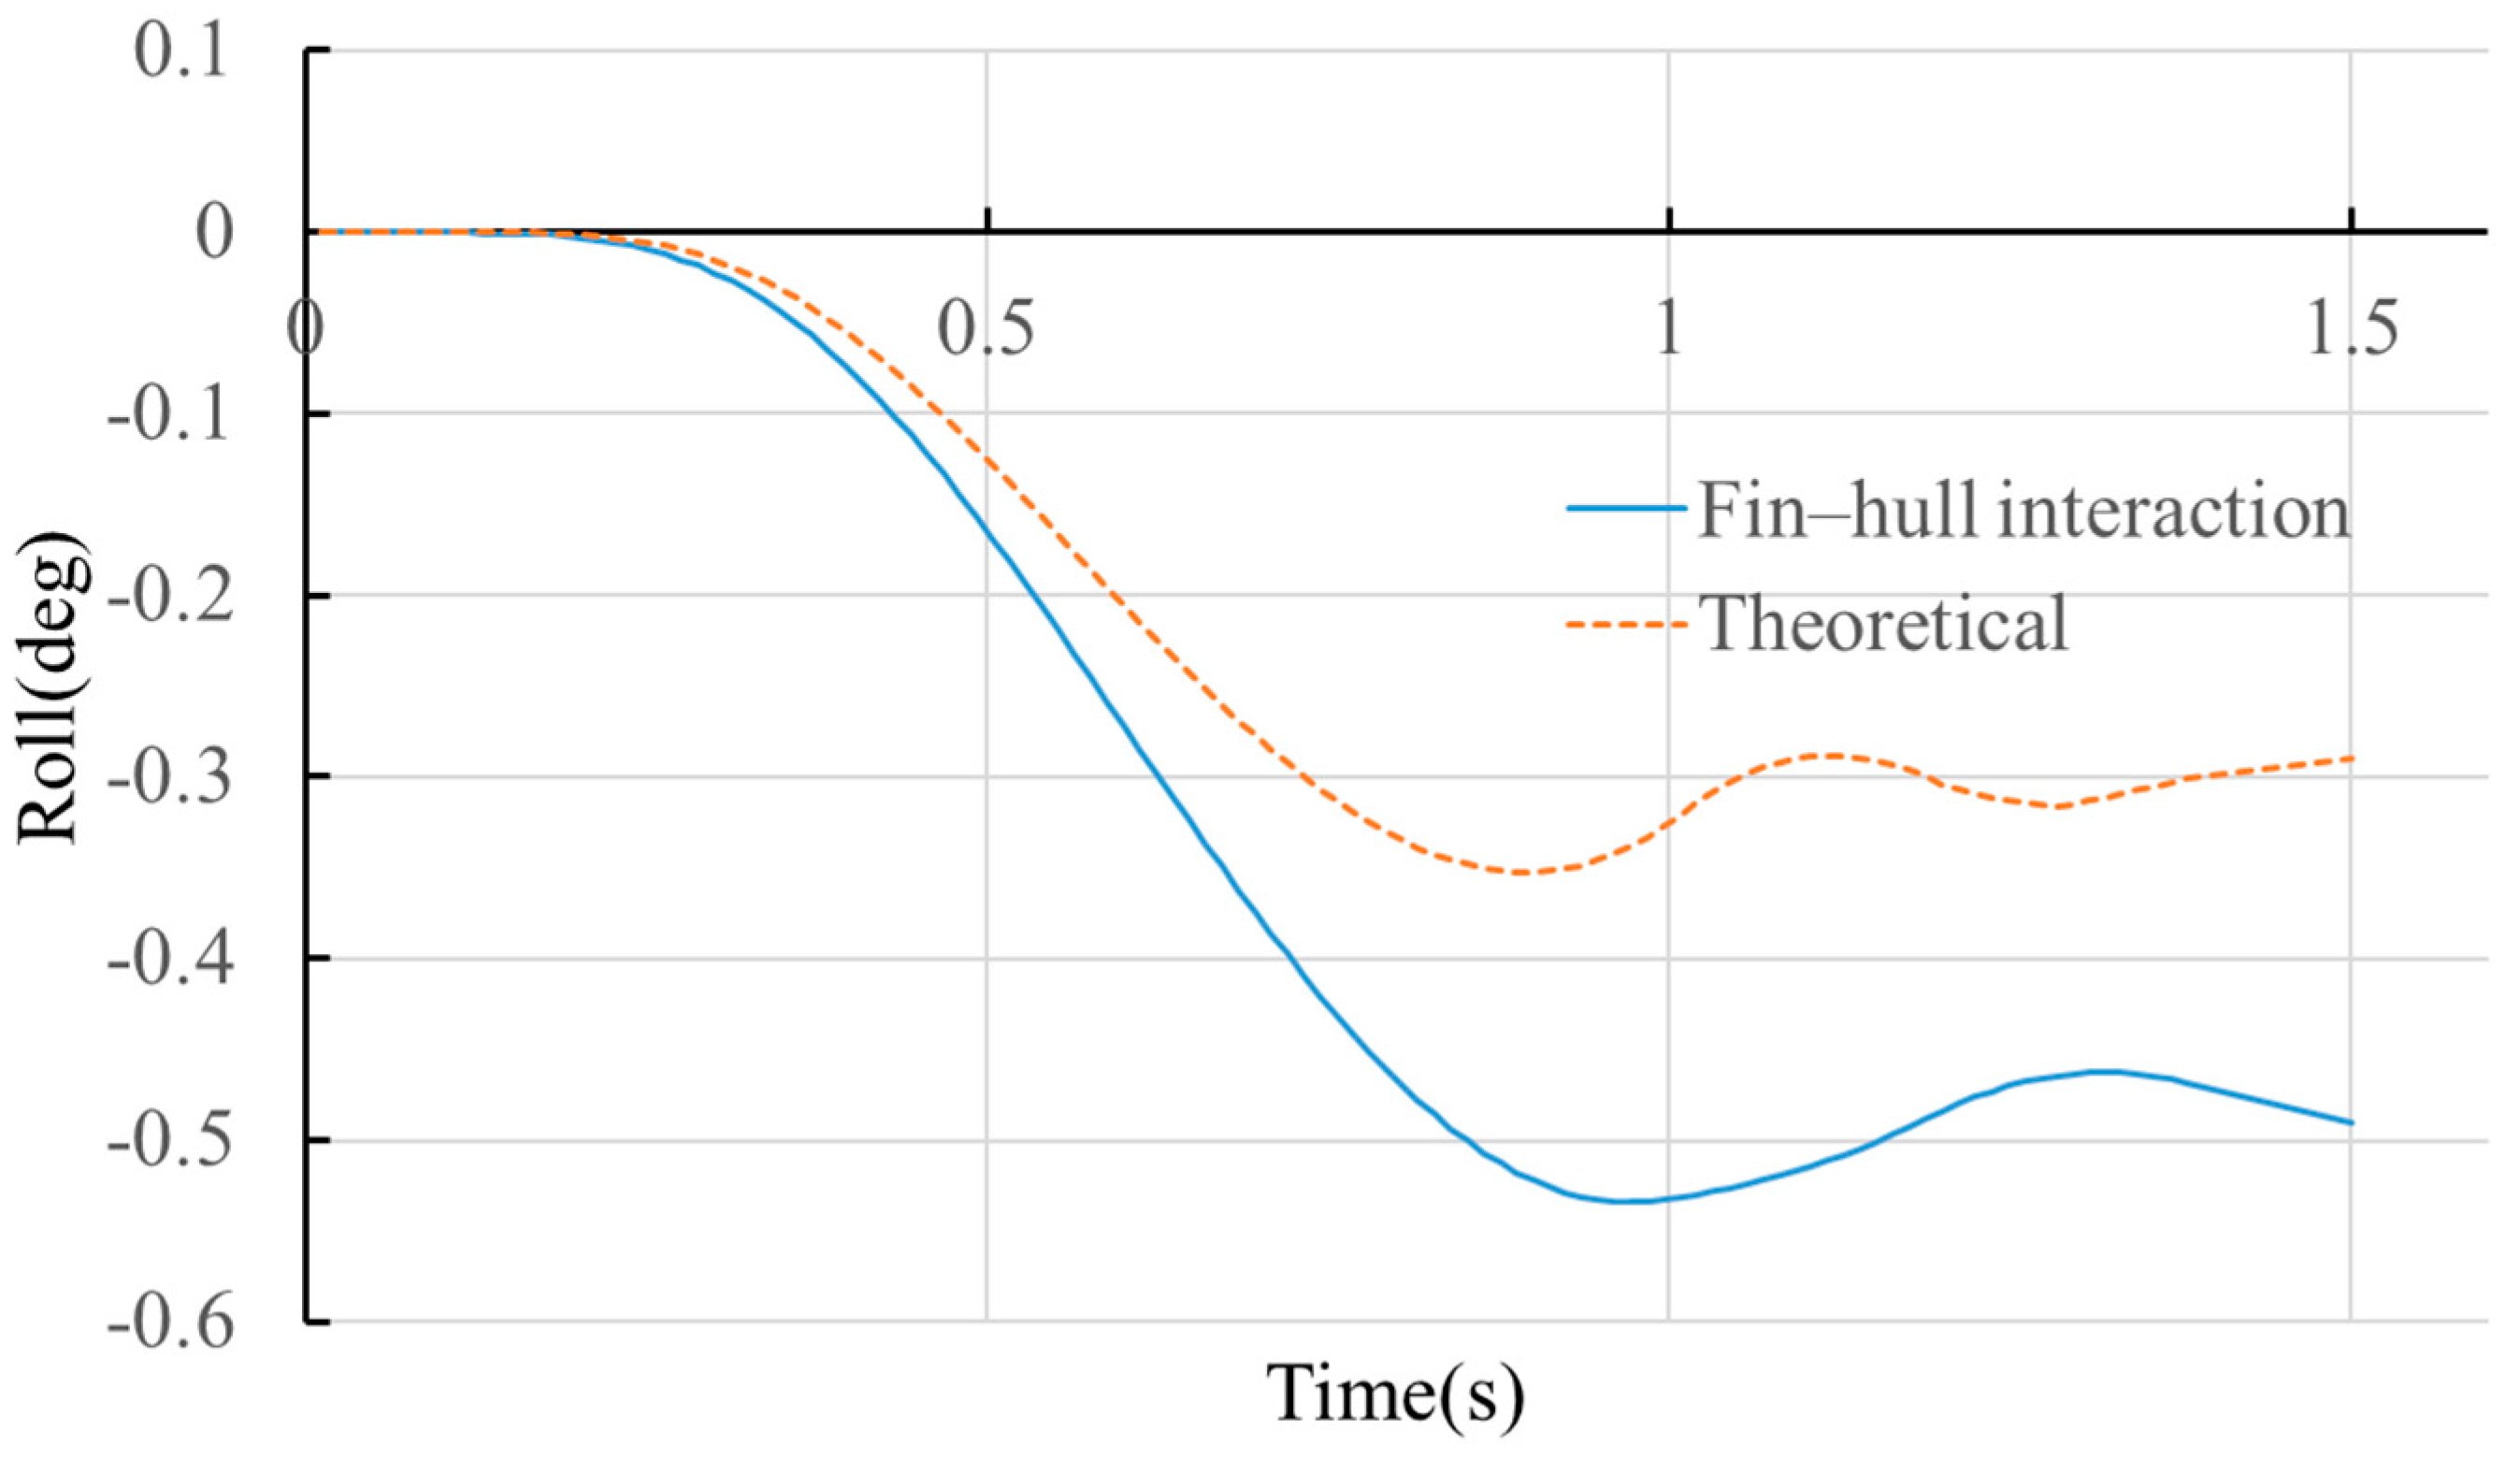
The roll motion of the ship was also calculated when it was subjected to a beam wave with the model ship speed of 1.249 m/s. The wave height was set at 3 cm and the wave period to 2 s, while the time step was 0.012 s.
Figure 15 shows the effect of the fin stabilizer reducing the roll motion with and without fin–hull interaction considerations in the beam wave. Since the ship is affected by transverse waves at this time, the rotation of the fins’ angle should be adjusted to provide the right moment to balance the ship heeling moment during the calculations. In the case where the ship wake was considered, the righting moment induced by the fins was calculated. In the other case, no ship wake was considered in the calculations of the fin-lifting forces; therefore, a moment calculated using the theoretical hydrofoil theory was directly added. For comparison purposes, the fluctuations in the fin angles were not considered; this means that during the rolling process, the fin angles were maintained during the rolling from one side to the other. Meanwhile, only their directions changed periodically.
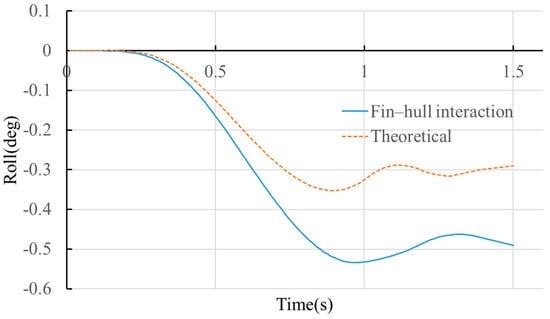
Figure 15.
The roll motion at the beam wave.
As the previous analysis in Section 5.2 showed, the lifting forces accounting for the fin–hull interaction were smaller than those calculated using the hydrofoil theory, as shown in Figure 15. Although the heeling angles of both conditions were not large enough to exceed the requirements of the code, the differences were still significant. Due to the exaggeration at the moment, the maximum heel angle calculated using the hydrofoil theory was 34% less than that of the fin–hull interaction. This indicates that the fin stabilizers were affected by the ship’s wake field under beam wave conditions, which should not be neglected when designing fin stabilizers.
6. Conclusions
In this study, through model tests and numerical analysis, the lift and drag forces of the fin stabilizers considering fin–hull interactions were investigated. The effect of different angles at various ship speeds were also studied using CFD calculations and model tests to address resistances and roll motions, respectively. Due to the influence of the Reynolds number, the lift coefficient values obtained from the theoretical calculations using the hydrofoil theory were different from those of the numerical results. The detailed results can be described as follows:
- Once the fin type has been determined, the fin area needs to be determined while accounting for the fin–hull interaction. When provided a certain anti-roll moment, compared with the theoretical results, the fin lift force calculated using CFD is larger at low speeds and smaller at high speeds.
- From an energy point of view, the work performed by the fin stabilizer during the rolling process was introduced to evaluate its effect. In the first cycle, the reductions in free-rolling amplitude for a 10° and a 20° fin compared to the 0° fin free-rolling amplitude were 38.26% and 61.39%, respectively. The work performed by the 0° fin was reduced by 33.73% and 49.22% compared with the 10° fin and the 20° fin.
- For this ship, at low Fr values (Fr < 0.15), the free-stream theoretical hydrofoil results were about 0.25 times the lifting force with fin–hull interaction. At high Fr values (Fr > 0.15), the theoretical results were 1.93 times the lifting force with fin–hull interaction. Considering the fin–hull interaction, the results for this ship would be 0.25–1.93, but these would vary from ship to ship (there would be similar results, but the values would be different).
- Under the beam wave conditions, the fin stabilizers that were affected by the ship’s wake had 34% less capacity than the theoretical calculation, which means the theoretical calculation exaggerated the capability; therefore, the fin–hull interaction should be considered.
During the analysis, the controls of the fin angle were not considered for comparison, so further studies should explore the adjustment of the fin angles with a controller under more complex wave conditions.
Author Contributions
Conceptualization, Q.F. and L.Y.; methodology, Q.F.; software, Q.F.; validation, Q.F.; investigation, Q.F.; writing—original draft preparation, Q.F.; writing—review and editing, L.Y. and X.W.; supervision, L.Y. and X.W.; project administration, L.Y.; funding acquisition, L.Y. and X.W. All authors have read and agreed to the published version of the manuscript.
Funding
This work was funded by the Fundamental Research Funds for the Central Universities from the People’s Republic of China and Open Program of State Key Laboratory of Maritime Technology and Safety (QZ2022-Z002).
Data Availability Statement
The raw data supporting the conclusions of this article will be made available by the authors upon request.
Conflicts of Interest
All authors declare that the research was conducted in the absence of any commercial or financial relationships that could be construed as potential conflicts of interest.
References
- Surendrana, S.; Leeb, S.K.; Kimb, S.Y. Studies on an algorithm to control the roll motion using active fins. Ocean Eng. 2007, 34, 542–551. [Google Scholar] [CrossRef]
- Cakici, F.; Kahramanoglu, E. Numerical roll motion control by using fins based on the linear quadratic regulator and dynamic mode decomposition. Appl. Ocean Res. 2024, 142, 103828. [Google Scholar] [CrossRef]
- Yao, R.; Yu, L.; Fan, Q.; Wang, X. Experimental and Numerical Resistance Analysis for a Cruise Ship W/O Fin Stabilizers. J. Mar. Sci. Eng. 2022, 10, 1054. [Google Scholar] [CrossRef]
- Kutta, W.M. Auftriebskräfte in Strömenden Flüssigkeiten. Illus-Trier. Aeronaut. Mitteilungen 1902, 6, 133–135. [Google Scholar]
- Joukowski, N. On Annexed Vortices; Section A; PhysicalSociety: London, UK, 1906; Volume 13, pp. 12–25. [Google Scholar]
- Kartikeya, K.M.; Jeff, L.; Karman, G.; Urmila, G. Cavitating Multiphase Flow over Oscillating Hydrofoils. In Proceedings of the 44th AIAA Aerospace Sciences Meeting and Exhibit, Reno, NV, USA, 9–12 January 2006; American Institute of Aeronautics and Astronautics: Reston, VA, USA, 2006. [Google Scholar]
- Sun, M.; Luan, T.; Liang, L.; Liu, Y. Lift detection and analysis of fin stabilizers shaft based on Euler-Bernoulli stiffness matrix. J. Ship Mech. 2018, 22, 944–954. [Google Scholar]
- Gokce, M.K.; Kinaci, O.K. Numerical simulations of free roll decay of DTMB 5415. Ocean Eng. 2018, 159, 539–551. [Google Scholar] [CrossRef]
- Irvine, M., Jr.; Longo, J.; Stern, F. Forward speed calm water roll decay for surface combatant 5415: Global and local flow measurements. J. Ship Res. 2013, 57, 202–219. [Google Scholar] [CrossRef]
- Ji, M.; Ye, Q.; Yu, C. Numerical Simulation of the Suitability of Stabilizer Fins and the Hull. Chin. J. Ship Res. 2014, 9, 8–19. [Google Scholar]
- Liang, L.; Sun, M.; Shi, H.; Luan, T. Design and Analyze a New Measuring Lift Device for Fin Stabilizers Using Stiffness Matrix of Euler-Bernoulli Beam. PLoS ONE 2017, 12, e0168972. [Google Scholar] [CrossRef] [PubMed]
- Gaillarde, G. Dynamic stall and cavitation of stabiliser fins and their influence on the ship behaviour. In Proceedings of the 7th International Conference on Fast Sea Transportation (FAST), Ischia, Italy, 7 October 2003. [Google Scholar]
- Bhosale, K.A.; Duffy, J.T. A case study on stabilizer fin-hull interaction using cfd and model experiments. Int. J. Marit Eng. 2021, 12, 157. [Google Scholar]
- Dallinga, R.P. Hydromechanic aspects of the design of fin stabilisers. Trans. R. Inst. Nav. Archit. 1994, 136 Pt B, 189. [Google Scholar]
- Chadwick, J.H.; Etal, J.R. Roll Stabilization System Marine Vessels. US Patent 2960959, 22 November 1960. [Google Scholar]
- Della Rosa, S.; Maceri, S.; Viola, I.M.; Bartesaghi, S. Design and optimization of a fin stabilizer using CFD codes and optimization algorithms. In Proceedings of the 16th International Conference of Ship and Shipping Research, Messina, Italy, 26–27 November 2009. [Google Scholar]
- ITTC, 2021e 7.5-02-02-01; Resistance Test. ITTC–Recommended Procedures and Guidelines 7.5-02-02-01. ITTC: Zürich, Switzerland, 2011.
- ITTC, 2021e 7.5-02-07-02.1; Seakeeping Experiments. ITTC–Recommended Procedures and Guidelines 7.5-02-07-02.1. ITTC: Zürich, Switzerland, 2011.
- Zhang, H.X.; Zhang, Z.H.; Zhang, X.S.; Lu, J.; Wang, X.F. Research on seakeeping performance and added resistance characteristics of medium-sized cruise ship. In Proceedings of the 33rd National Conference on Hydrodynamics, Chongqing, China, 28–31 October 2022. [Google Scholar]
- Jiang, Y.; Zhao, X.; Zong, Z. Numerical study for free-roll damping of a ship with bilge. J. Harbin Eng. Univ. 2019, 40, 81–87. [Google Scholar]
- Fu, J.; Chen, W.; Ge, H.; Chen, T. Effects of bilge keel on a one-thousand-ton deep-vee monohull with calm water resistance and rolling motion. Chin. J. Ship Res. 2015, 10, 22–26. [Google Scholar]
- Molland, A.F. Seakeeping. In The Maritime Engineering Reference Book, 1st ed.; Butterworth-Heinemann: Oxford, UK, 2008; pp. 575–578. [Google Scholar]


Disclaimer/Publisher’s Note: The statements, opinions and data contained in all publications are solely those of the individual author(s) and contributor(s) and not of MDPI and/or the editor(s). MDPI and/or the editor(s) disclaim responsibility for any injury to people or property resulting from any ideas, methods, instructions or products referred to in the content. |
© 2024 by the authors. Licensee MDPI, Basel, Switzerland. This article is an open access article distributed under the terms and conditions of the Creative Commons Attribution (CC BY) license (https://creativecommons.org/licenses/by/4.0/).