Article

Study on the Characteristics and Mechanism of Inorganic Nitrogen Nutrients Preferential Assimilation by Phaeocystis globosa

1
College of Chemistry and Molecular Engineering, Qingdao University of Science and Technology, Qingdao 266042, China
2
CAS Key Laboratory of Marine Ecology and Environmental Sciences, Institute of Oceanology, Chinese Academy of Sciences, Qingdao 266071, China
3
Laboratory for Marine Ecology and Environmental Science, Qingdao Marine Science and Technology Center, Qingdao 266237, China
4
University of Chinese Academy of Sciences, Beijing 100049, China
*
Author to whom correspondence should be addressed.
J. Mar. Sci. Eng. 2024, 12(6), 989; https://doi.org/10.3390/jmse12060989
Submission received: 29 April 2024 / Revised: 29 May 2024 / Accepted: 3 June 2024 / Published: 13 June 2024
(This article belongs to the Section Marine Ecology)

Abstract

:
Phaeocystis globosa is an important harmful algal species that is globally distributed. Previous studies have indicated that P. globosa preferentially uptake nitrate, but the underlying mechanism is still unclear. To further verify this preference and reveal the underlying mechanism, the assimilation rates of nitrate and ammonium by P. globosa at different concentrations was quantitatively studied by using a nitrogen stable isotope (15N) tracer technique, and the regulatory mechanism was determined from the physiological and biochemical responses. The findings revealed that the preferential assimilation of nitrate by P. globosa was influenced by the ambient ammonium concentration. When the ambient concentration of ammonium was less than approximately 3.5 μmol·L−1, the assimilation rates of nitrate form P. globosa were as high as 1.05 × 10⁻⁵ μmol·L−1·h−1·cell−1. Even though the nitrate assimilation in P. globosa was inhibited at ammonium concentrations greater than this threshold, nitrate assimilation could not be completely suppressed. The activity of NR and the expression of related genes in P. globosa were also affected by ammonium. In addition, 15N signals originally labeled nitrate accumulated in ammonium. This indicated that P. globosa was likely to reduce excess nitrate to ammonium and subsequently release it into the substrate, which might be an important energy dissipation mechanism for P. globosa. These results expand the classical understanding of the utilization of nitrogen nutrients by marine phytoplankton, and offer valuable resources for comprehending the mechanism of harmful algal blooms.

1. Introduction

There are two forms of Phaeocystis globosa: solitary free-living cells and colonies [1]. Colonies consist of numerous flagellate-free cells that are embedded within an elastic membrane [2]. The colonies serve as the primary forms of algal blooms. The membrane of these colonies is composed of polysaccharides, which serve to protect against viral infections and consumption by zooplankton, as well as to store nutrients [3,4]. The presence of colonies is one of the reasons why this algal species competes well with other algae. Extensive blooms of P. globosa have been observed in various locations across Europe, the southeastern shores of Vietnam, and the southern coastline of China [2,5,6]. The blooms of P. globosa have been shown to produce hemolytic toxins, clog fish gills, and cause the death of planktonic organisms [2]. A large amount of white foam is produced due to P. globosa blooms, which leads to the deterioration of the aquatic environment [7,8]. Reports suggest that colonies pose a threat to the safety of nuclear power plants by blocking cooling systems [9]. Therefore, P. globosa blooms exert a profound influence on the structure and function of coastal ecosystems, and greatly hinder social and economic development.
Nitrogen (N) serves as the foundation of marine life. Ammonium (NH4+) and nitrate (NO3) play crucial roles as nutrients for marine phytoplankton. According to previous studies, NH4+ is considered the preferential N form for phytoplankton [10,11], which is determined by the physiological characteristics of microalgae. In terms of energy, algae consume less energy by assimilating NH4+ than NO3. Therefore, NH4+ is generally taken up by algae first, and only after its near depletion is NO3 taken up [12,13]. The NH4+ preference for phytoplankton has been one of the classical physiological theories, and has been grounded in many studies. For instance, when the concentration of NH4+ exceeds 1~2 μmol·L−1, the uptake of NO3 by microalgae in Chesapeake Bay never exceeds 1% of the total N [14]. A previous study revealed that algae assimilated NO3 only when the concentration of NH4+ decreased below 0.5~1 μmol·L−1 [15]. Wheeler (1990) reported that NH4+ completely inhibited the uptake of NO3 within the range of 0.1~0.3 μmol·L−1 [16].
However, the NH4+ preference may also depend on the algal species. Previous research on P. globosa revealed that NO3 significantly contributed to the growth and formation of colonies. In contrast to NH4+ and urea, P. globosa displayed a greater propensity for colony formation when utilizing NO3 as the substrate [17], and the effect of NO3 on P. globosa has been shown to be significant (p < 0.05) [18]. Many field experiments have also shown that P. globosa blooms in most marine areas, such as the Belgian coastal zone and Ross Sea, are accompanied by high NO3 consumption [19,20,21,22]. Notably, Lv (2019) established the NO3enriched group, the NH4+-enriched group, and the NO3- and NH4+-enriched group (both-enriched group), and it was reported that the uptake rate of NO3 was greater than that of NH4+. NH4+ accumulates in the fluid inside colonies of P. globosa [23]. These relevant results contradict the classical physiological theory of NH4+ preference, challenging the in-depth understanding of the mechanism of P. globosa blooms.
Here, we speculate that the preference for NO3 for P. globosa may present as a high threshold of NH4+ for inhibiting the uptake of NO3, while previous research failed to reach this threshold. Additionally, the accumulation of P. globosa intracolonial NH4+ may originate from the excessive reduction of NO3 to NH4+, but there is no direct evidence for this phenomenon. Therefore, this study expanded the substrate NH4+ concentrations to study the threshold of NH4+ for inhibiting the assimilation of NO3. The assimilation rates of NH4+ and NO3 by P. globosa were accurately calculated synchronously by using 15N labeling for NO3 alone. Moreover, the accumulation of 15NH4+ was monitored to verify the hypothesis that NH4+ was released from excessive NO3 reduction. Enzyme activity and related gene expression were used to elucidate the relevant mechanism of action. These results clarify the ecological adaptation mechanism of P. globosa in terms of N utilization, providing a theoretical basis for understanding the formation and prevention of P. globosa blooms.

2. Materials and Methods

2.1. Algae Culture

P. globosa was procured from the northern region of the Beibu Gulf. All culture experiments used a modified formula of artificial seawater [24], which was sterilized at 121 °C for 30 min. P. globosa was cultured under conditions of 20 ± 1 °C and 50 μmol·m−2·s−1 illuminance with a 12 h light: 12 h dark cycle.

2.2. Experimental Setup

The P. globosa culture was at the exponential growth stage. Then, the culture was diluted with artificial seawater sterilized at 121 °C at an algal culture/seawater ratio of 2:7 and acclimated through indoor culture for 3 to 4 days, after which the concentration of NO3 was monitored every day. After the concentration of NO3 was completely consumed, 12 μmol·L−1 NO3 was added, and P. globosa were cultured for 2 days until the concentration of NO3 was lower than the detection limit and the algal density was 7.5 × 10⁵ cells·mL−1 (the concentration of PON was 43~78 μmol·L−1). The cultures were divided into three groups: (a) 20 μmol·L−1 NO3 and 5 μmol·L−1 NH4+ (58% biomass N); (b) 20 μmol·L−1 NO3 and 10 μmol·L−1 NH4+ (43% biomass N); and (c) 20 μmol·L−1 NO3 and 20 μmol·L−1 NH4+ (51% biomass N). The above three groups of experiments were named group 1, group 2, and group 3, respectively. NO3 in the three mixed N media all contained 5% NaNO3 (≥98 atom%, Sigma-Aldrich, St. Louis, MO, USA), with a high abundance of 15N as a tracer of the N cycle. The added algal culture mixture was shaken well and divided into 75 square breathable cell culture bottles (75 cm2, Nest) for the experiment. The experimental environment was the same as that of the algal culture. The nutrient solution was added at the start of the experiment, seven time points were sampled at 0, 2, 4, 6, 8, 10, and 12 h, and three parallel points were designed for each time point to determine the parameters. The sampling points of each experimental group involved three parallel sets. Destructive sampling was used in all experiments.

2.3. Sample Collection

The N mainly included NO3, NH4+, and NO2. The algal culture was filtered through membranes (Whatman GF/F). The filtrate was frozen in a −20 °C freezer until analysis by an automatic nutrient analyzer.
The stable N isotope standards included dissolved δ15N-NH4+ and granular δ15N-PON. The algal culture was filtered through membranes heated at 450 °C for 4 h. The filtrate was frozen at −20 °C for freezing preservation for the detection of δ15N-NH4+. The filter membrane was securely encased in clean aluminum foil and kept at a temperature of −20 °C for storage until the determination of the δ15N-PON value and concentration of the PON.
For enzyme activity and gene analysis, 150 mL of algal culture was collected at 0 h, 4 h, and 10 h in groups 1 and 3, and 150 mL of algal culture was collected at 0 h, 2 h, and 10 h in group 2. The algal culture was centrifuged at 4 °C. Then, the culture was centrifuged at 8000× g for 10 min to collect the algal cells. Samples of algal cells were immediately transferred to liquid nitrogen for flash freezing, and transferred to a freezer at −80 °C for storage until analysis.

2.4. Sample Analysis

The concentrations of NO3, NH4+, and NO2 in the samples were determined by means of a continuous-flow analyzer (Skalar, Breda, The Netherlands). The detection ranges of NO3, NH4+, and NO2 were 0.07~35.7 μmol·L−1, 0.07~35.7 μmol·L−1, and 0.07~14.3 μmol·L−1, respectively. The data were evaluated using commercial nutrient reference material to control the data quality.
To determine the concentration of PON and its stable N isotope, the filter film sample was first wrapped in aluminum foil and loaded into a freeze-dryer for more than 48 h. Subsequently, the dried sample was wrapped in microspheres with 35 × 35 mm2 aluminum foil (Elementar, Hanau, Germany), and the sample was compacted by a tablet press, which removed any air.
The δ15N-PON value and PON value were determined by a Thermo Fisher EA Flash element analyzer and a Delta Q isotope ratio mass spectrometer (Thermo Fisher Scientific, Waltham, MA, USA). Each lot was calibrated using a single point of the USGS-41 reference material. The δ15N-NH4+ value was ascertained using a Gas Bench MAT253 stable isotope mass spectrometer. The δ15N values in PON and NH4+ are expressed relative to the content of atmospheric N according to the following equation: δ15N (‰) = (RsampleRstandard)/Rstandard × 1000, where R = 15N/14N and atom% = 15N/(15N + 14N) × 100.
Enzyme activity was determined by evaluating the activities of nitrate reductase (NR) and glutamine synthetase (GS). First, the cells were crushed using an ultrasonic cell crusher (Scientz, Ningbo, China). Subsequently, the activity of the NR detection kit (Solarbio, Beijing, China) was used to determine the activity of NR, and a GS kit (Solarbio, Beijing, China) was used to determine the activity of GS, both of which were utilized according to the kit instructions. The samples for qPCR were sent to Shengong Bioengineering (Shanghai, China) Co., Ltd., for RNA extraction and qPCR analysis.

2.5. Data Processing

The formula for calculating the growth rates is as follows:
μ = L n N 2 L n N 1 t 2 t 1
where N1 and N2 represent the algal density and t1 and t2 represent the time. In this study, the time interval was 0.5 days.
The uptake rate of N in this study was determined based on the modified uptake rate formula of Mulholland et al. (2006) [25]:
V N O 3 = ( a t o m % P N ) f i n a l ( a t o m % P N ) i n i t i a l ( a t o m %   N   s o u r c e   p o o l a t o m % P N ) i n i t i a l × t i m e × P N
V N H 4 + = P N t i m e V N O 3
where (atom%PN)final is the final atomic particle N value, (atom%PN)initial is the initial atomic particle N value, the source pool is the enrichment dissolved N pool, PN is the particle N on the GF/F membrane (μmol·L−1) (all the above data can be obtained from the isotope mass spectral data), and time is the culture time (h).
This formula is used to determine whether the increase in ammonium isotopes is due to the influence of processes in assimilation (Section 4.3). The isotopic fractionation (ε) of the NH4+ assimilation and utilization processes was calculated by the Rayleigh model. The formula is as follows:
δ s u b s t r a t e ( f ) = δ s u b s t r a t e ( f = 1 ) ε × l n f
where f represents the residual ratio of the reactant, and δsubstrate(f) and δsubstrate(f = 1) represent the stable isotope ratios of the reactant at that moment and at the initial stage, respectively.
Furthermore, the 64-bit version of the Origin 2018 software was used for graph generation.

3. Results

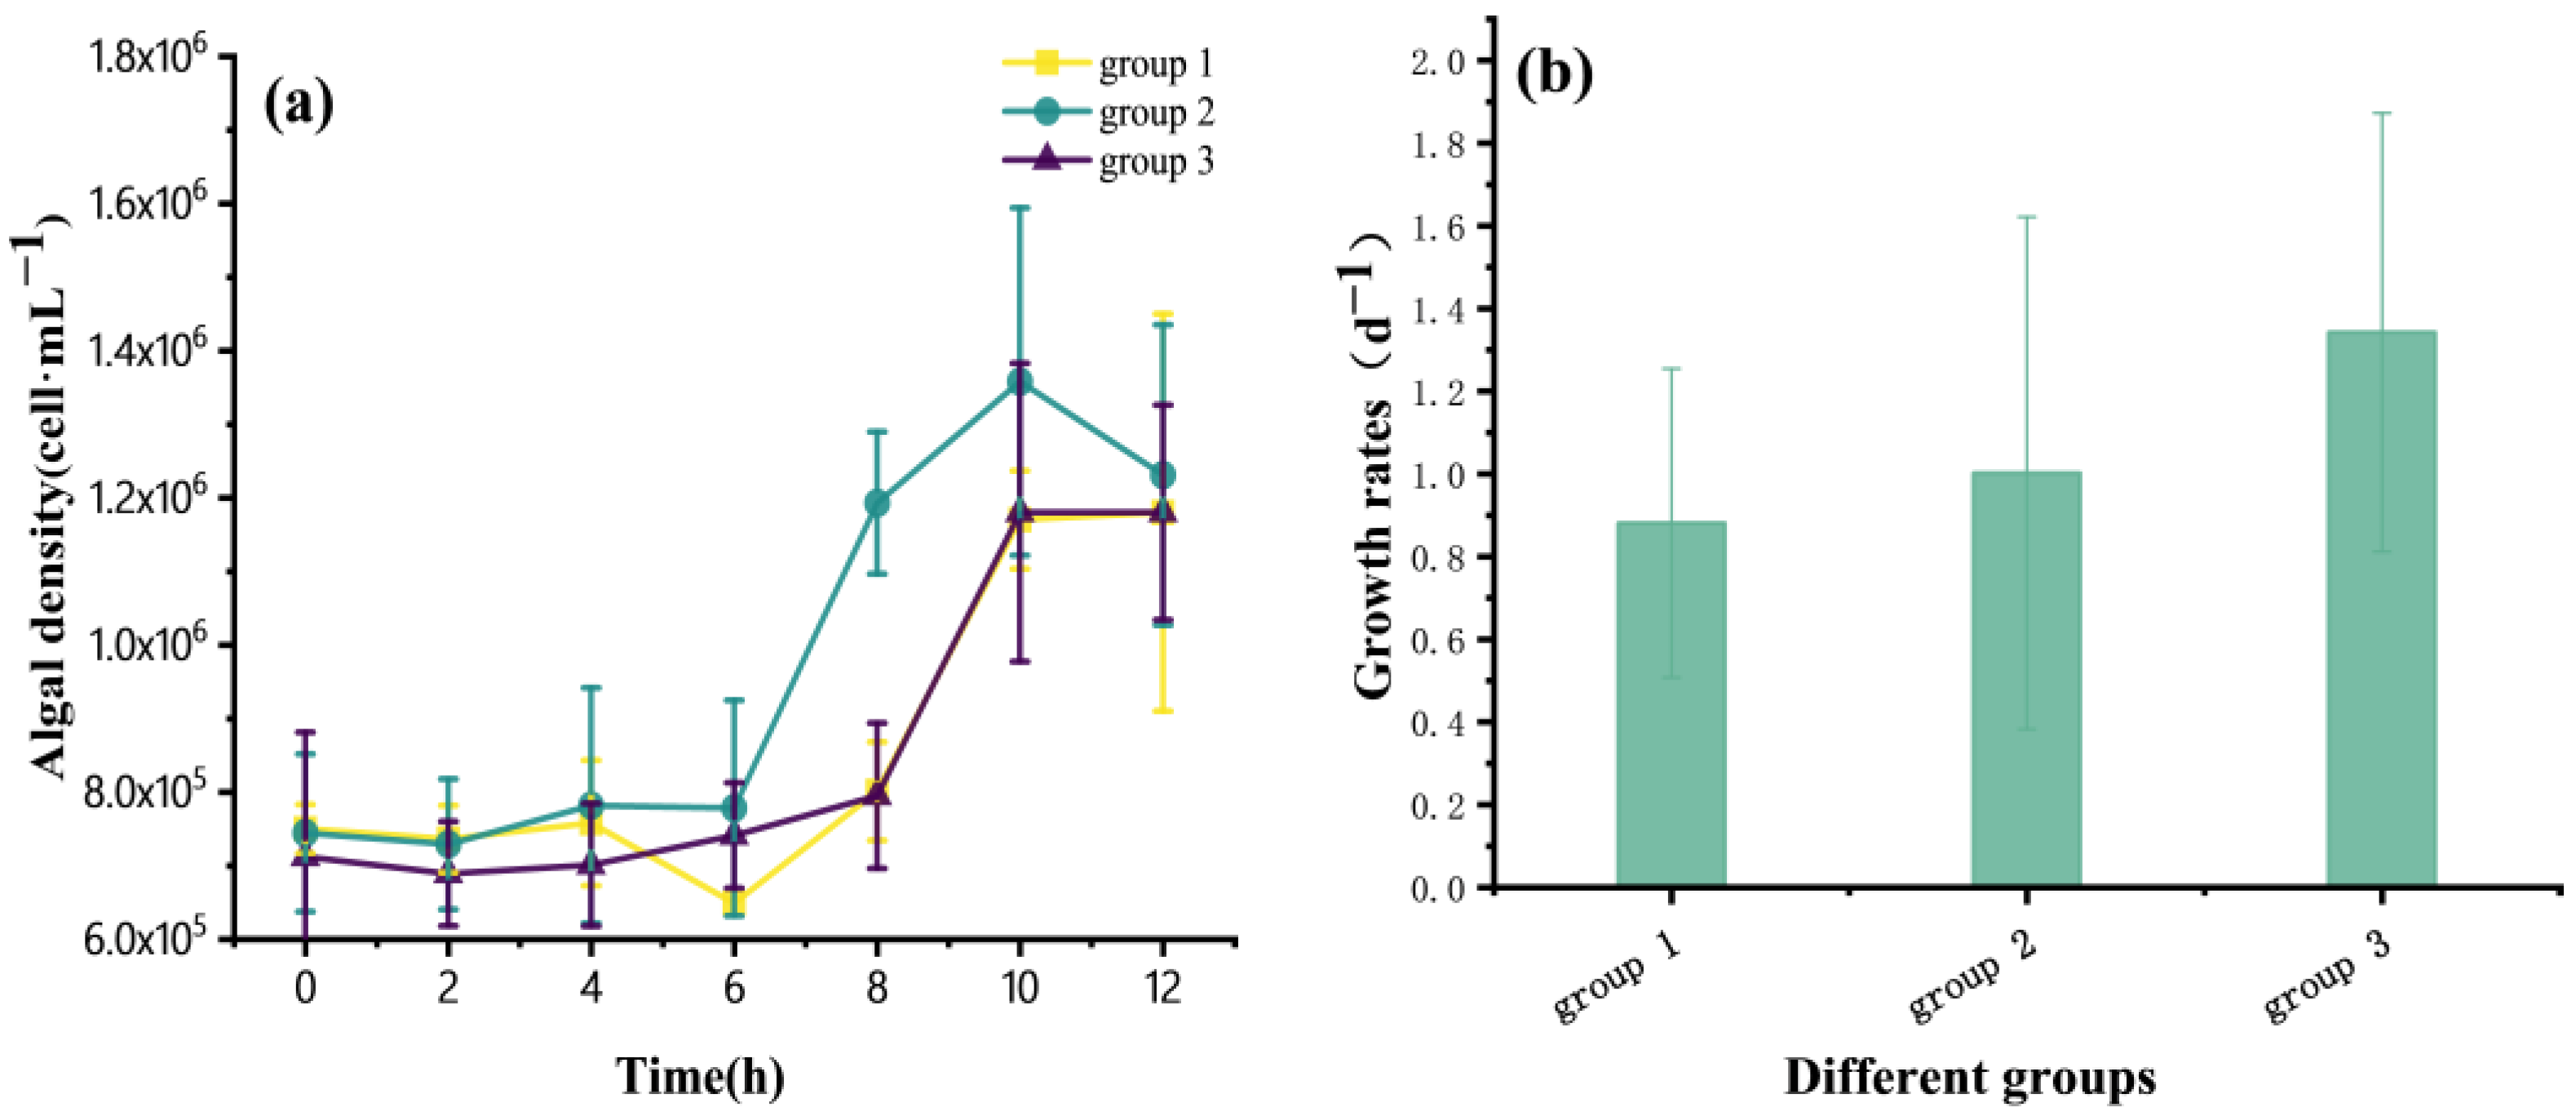
3.1. Growth of P. globosa

According to the growth curves (Figure 1b), the algal density of the three groups increased with time. Specifically, before 6 h, the algal density increased slowly, and after 6 h, the rapid growth in density was observed. According to the growth rate chart (Figure 1b), the growth rates of group 3, group 2, and group 1 increase successively, and the lowest growth rate of group 1 is 0.88 d−1.

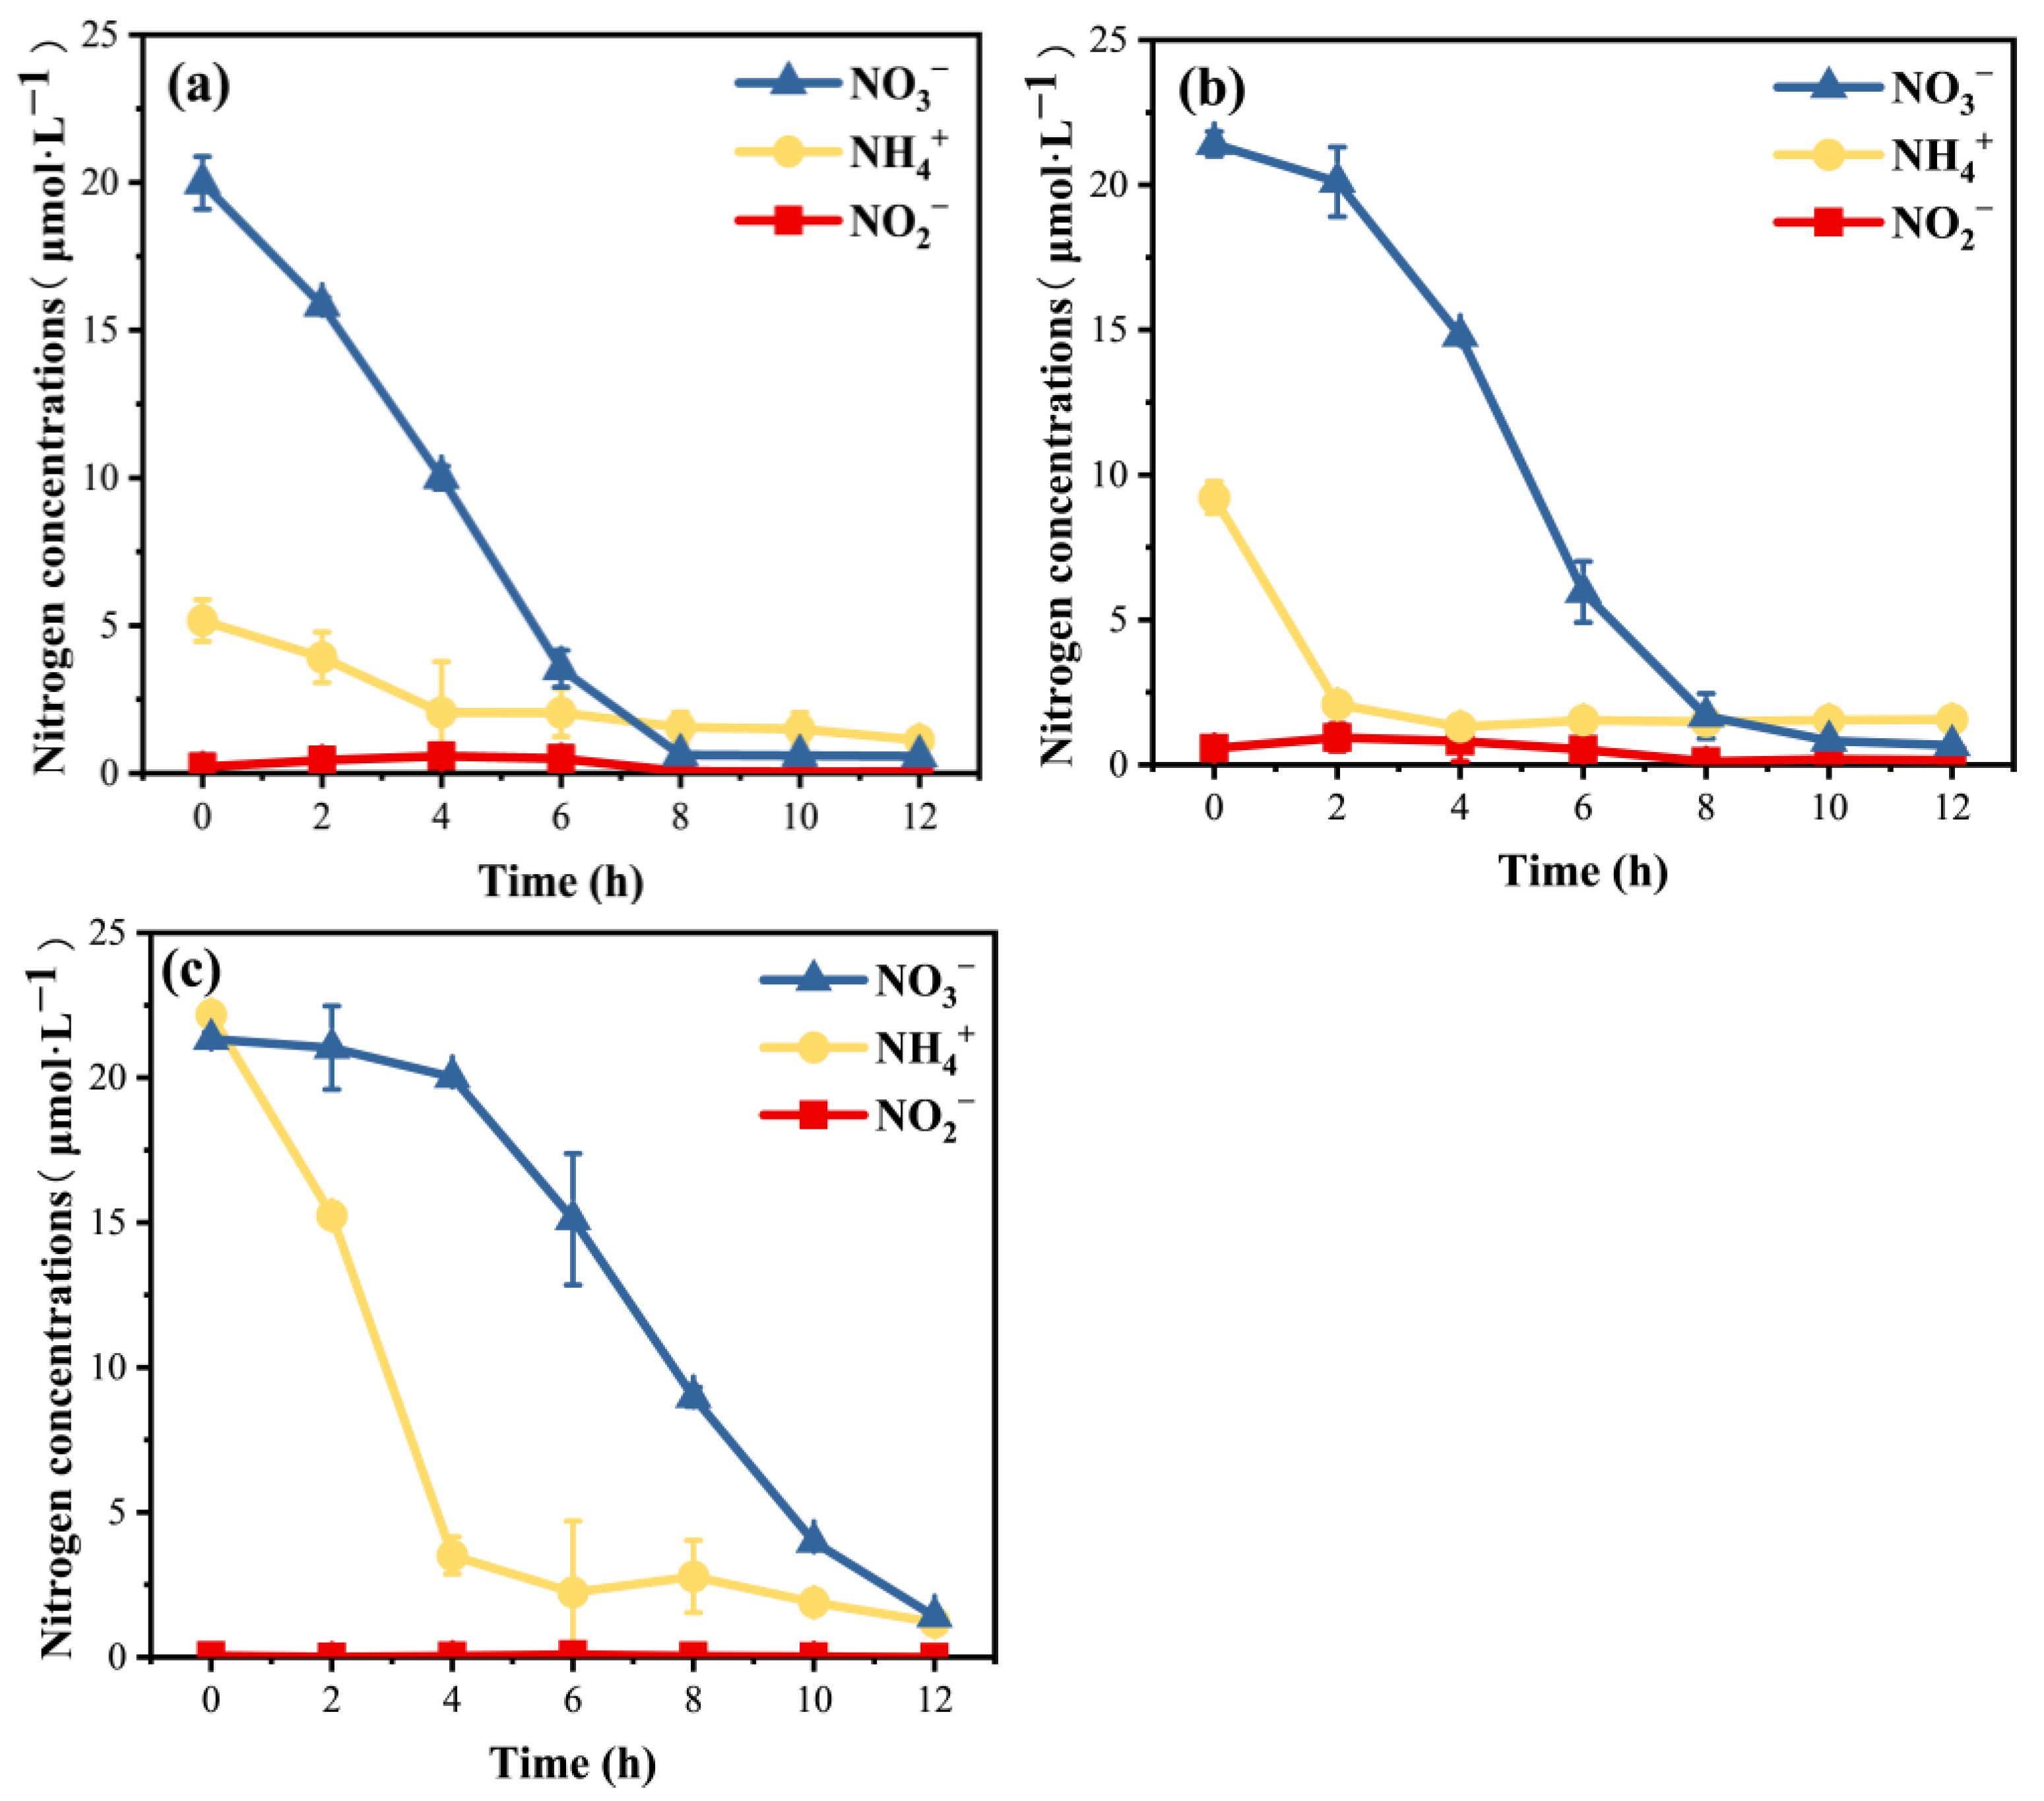
3.2. Variations in Inorganic N Nutrient Concentrations

In this study, the concentrations of NO3 and NH4+ exhibited varying degrees of reduction over time. Specifically, in group 1, the concentration of NO3 decreased from an initial value of 19.99 μmol·L−1 at 0 h to 0.62 μmol·L−1 at 8 h, subsequently stabilizing at approximately 0.6 μmol·L−1. The concentration of NH4+ decreased slightly from 5.17 μmol·L−1 at 0 h to 2.06 μmol·L−1 at 4 h, followed by fluctuations within the range of 1.1~1.5 μmol·L−1. The concentration of NO2 increased slightly initially, followed by a gradual decrease, maintaining a concentration between 0.05~0.6 μmol·L−1 (Figure 2a). In group 2, the concentration of NO3 decreased slightly from 21.42 μmol·L−1 at the initial level to 20.11 μmol·L−1 at 2 h, then rapidly decreased to 1.68 μmol·L−1 at 8 h, and further decreased to below 0.85 μmol·L−1. The concentration of NH4+ decreased from 9.22 μmol·L−1 at 0 h to 2.09 μmol·L−1 at 2 h and then remained stable. The concentration of NO2 increased slightly and then decreased, and the overall concentration was lower than 1 μmol·L−1 (Figure 2b). In group 3, the concentration of NO3 changed little in the first 4 h, from 21.33 μmol·L−1 to 20.02 μmol·L−1, and then rapidly decreased to 3.98 μmol·L−1 at 10 h. The concentration of NH4+ decreased significantly from 22.18 μmol·L−1 at the beginning to 3.51 μmol·L−1 at 4 h and continued to decrease from 6~12 h, with the lowest concentration decreasing to 1.21 μmol·L−1. The concentration of NO2 remained below 0.1 μmol·L−1 throughout the experiment (Figure 2c).

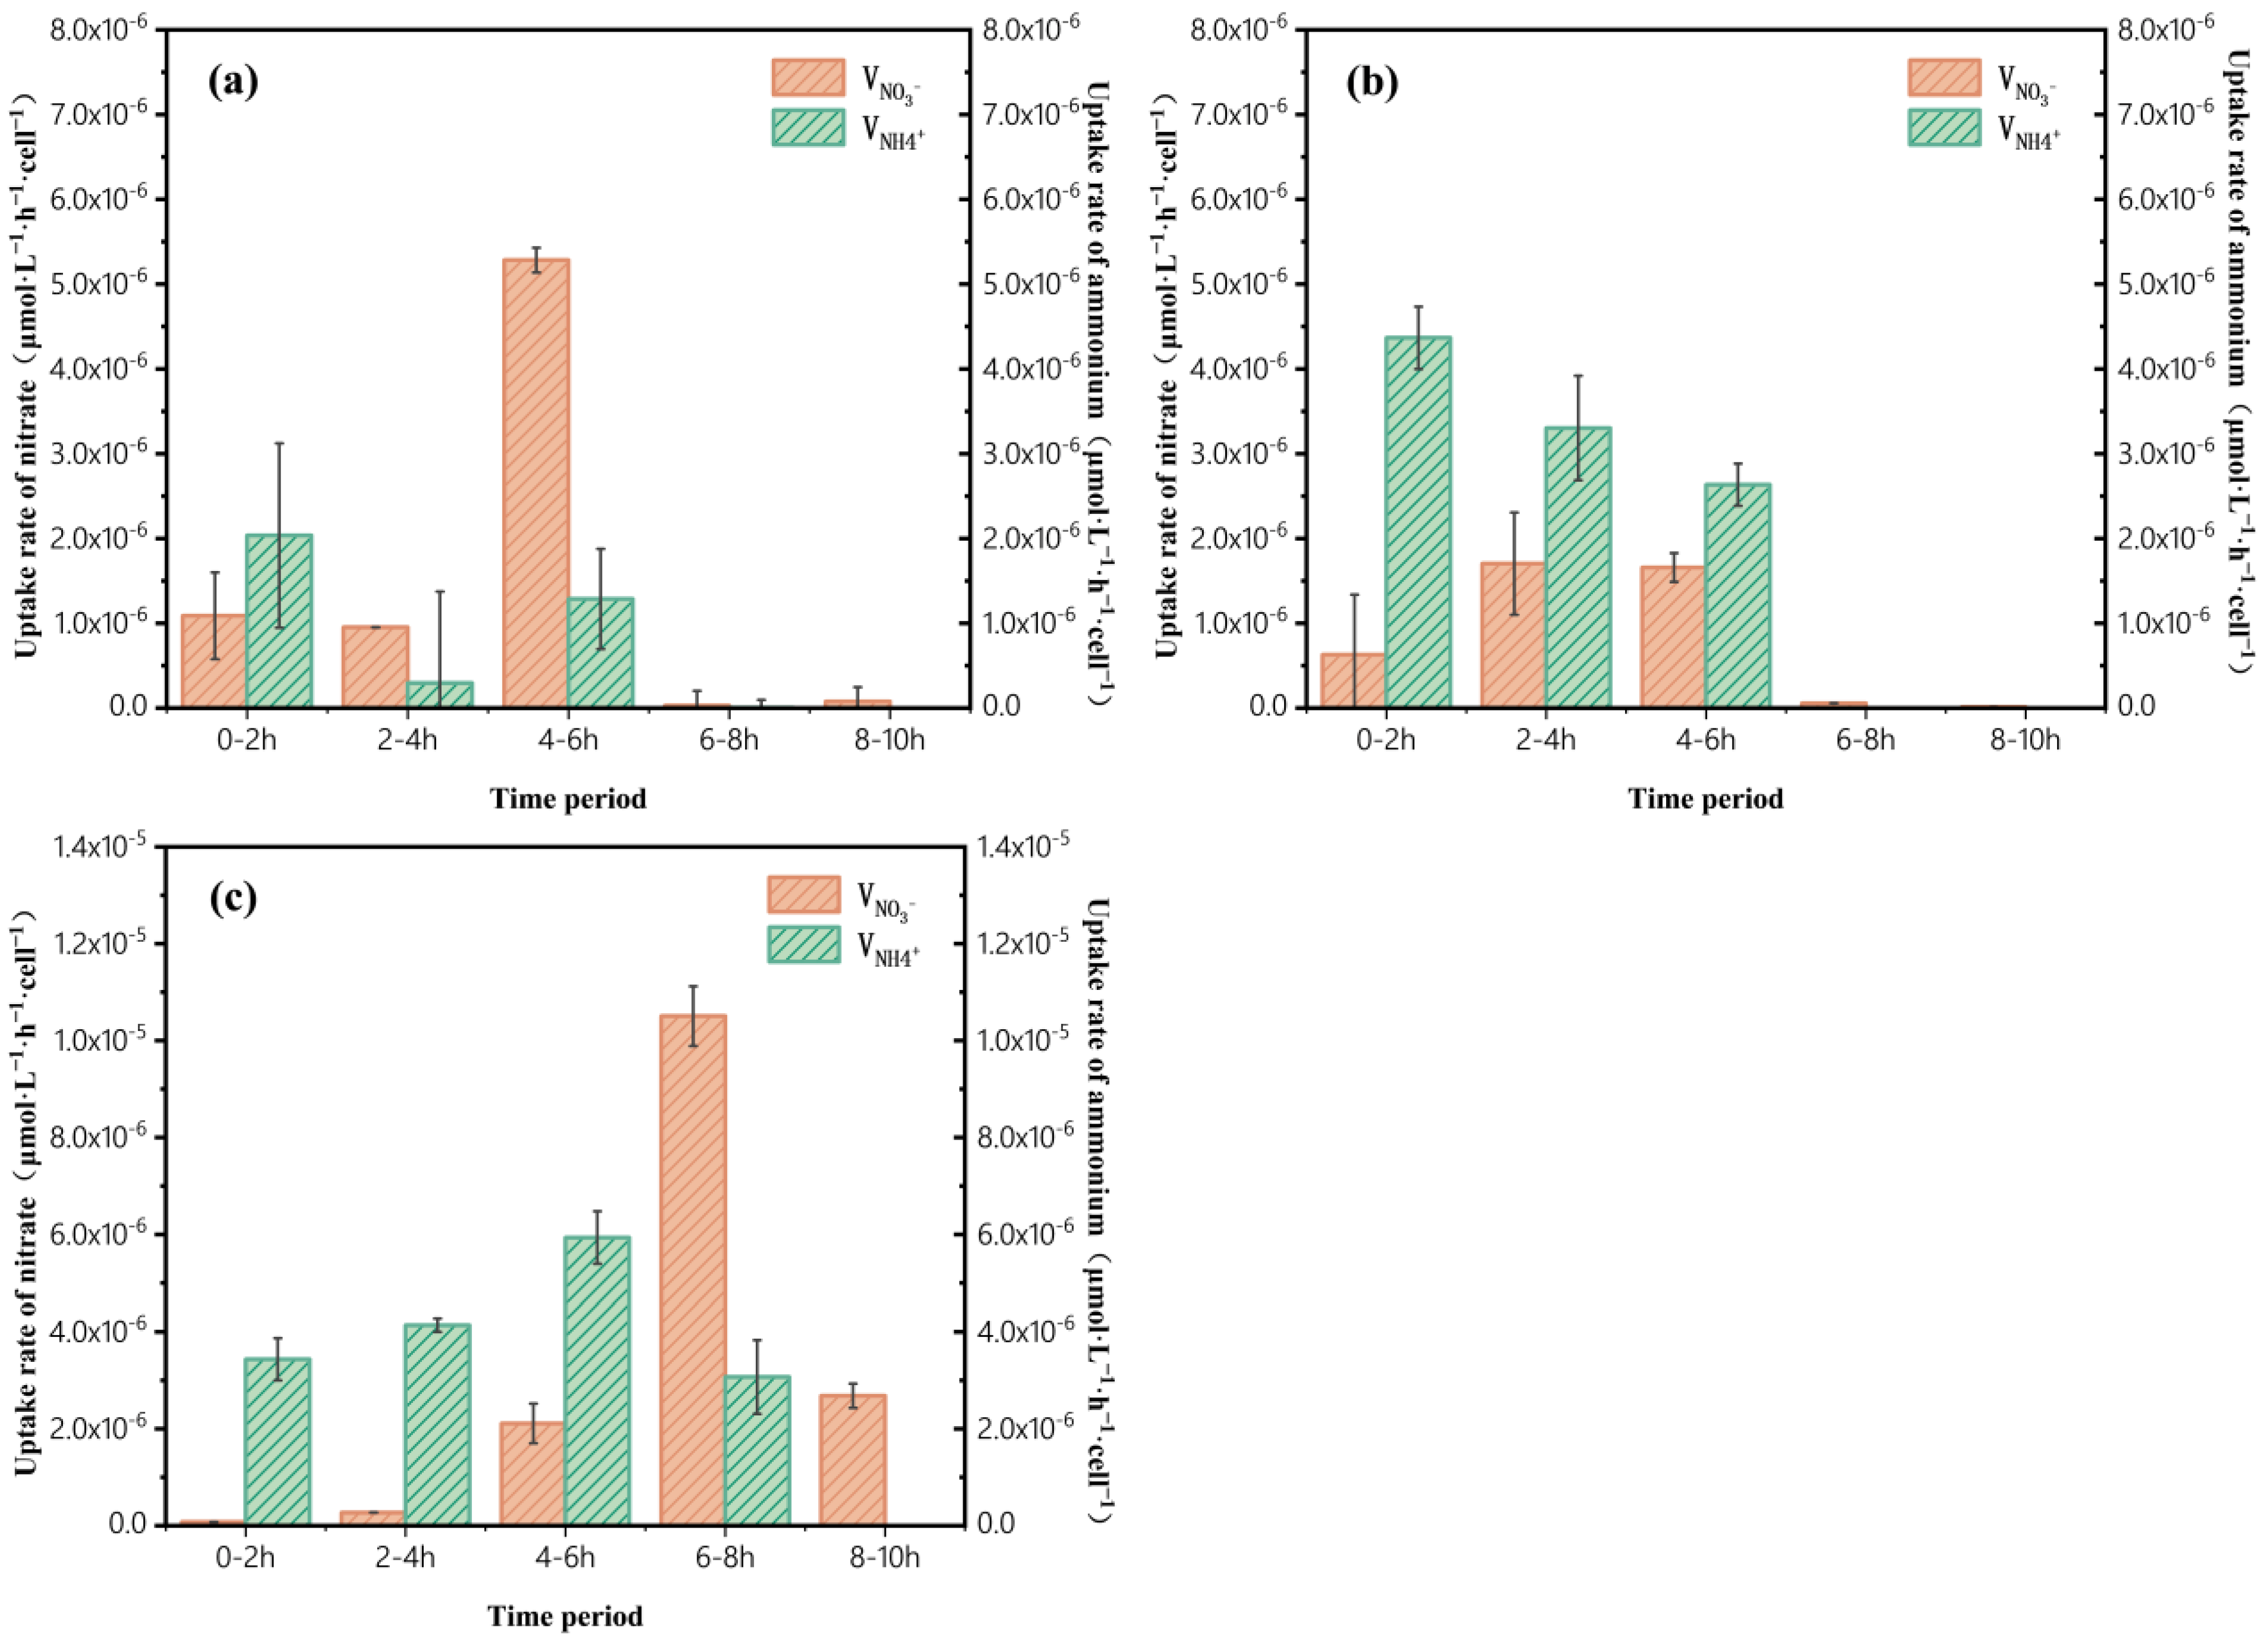
3.3. Variation in Uptake Rates

The maximum uptake rate of NO3 was 5.28 × 10⁻⁶ μmol·L−1·h−1·cell−1 at 4~6 h (Figure 3a). In group 2, the uptake rate of NH4+ was greater than that of NO3 for the initial 6 h. The largest and smallest uptake rates of NH4+ in group 2 were 4.41 × 10⁻⁶ μmol·L−1·h−1·cell−1 and 3.96 × 10⁻⁶ μmol·L−1·h−1·cell−1, respectively (Figure 3b). In group 3, the uptake rate of NO3 was higher than that of NH4+ during the 6~10 h (Figure 3c). Notably, the maximum uptake rate of NO3 in group 3 reached 1.05 × 10⁻⁵ μmol·L−1·h−1·cell−1, while the maximum uptake rate of NH4+ was 5.94 × 10⁻⁶ μmol·L−1·h−1·cell−1.

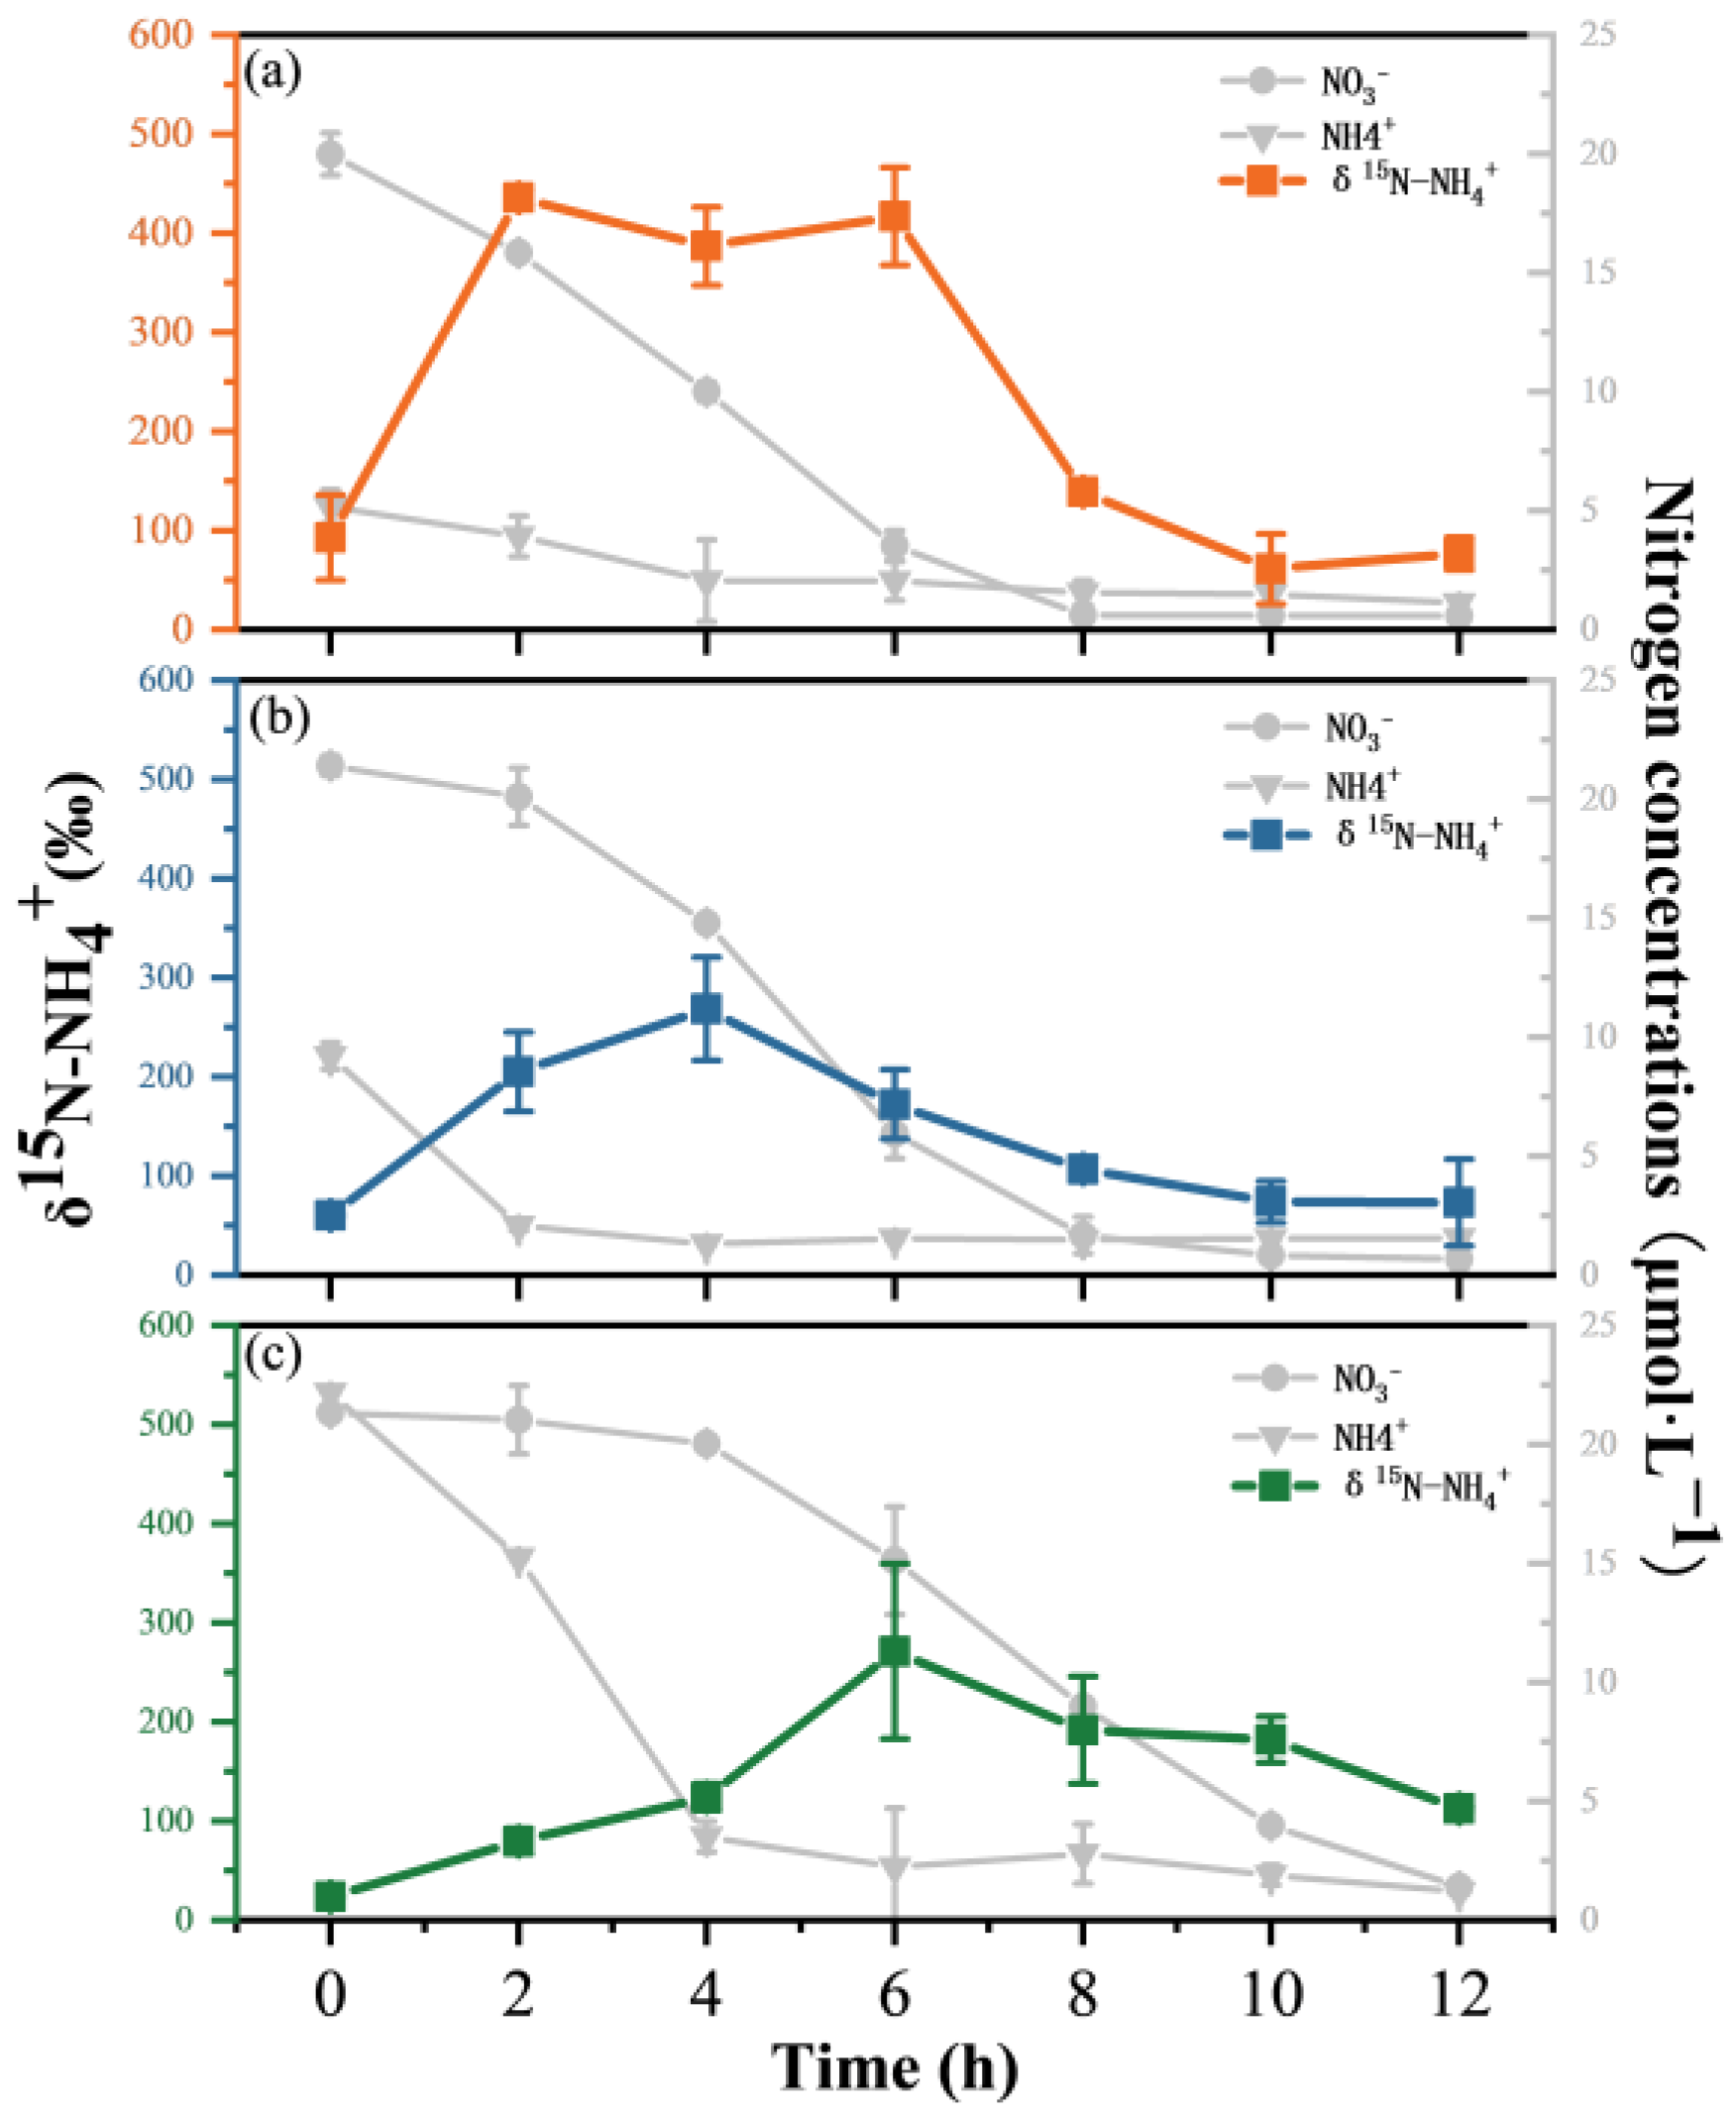
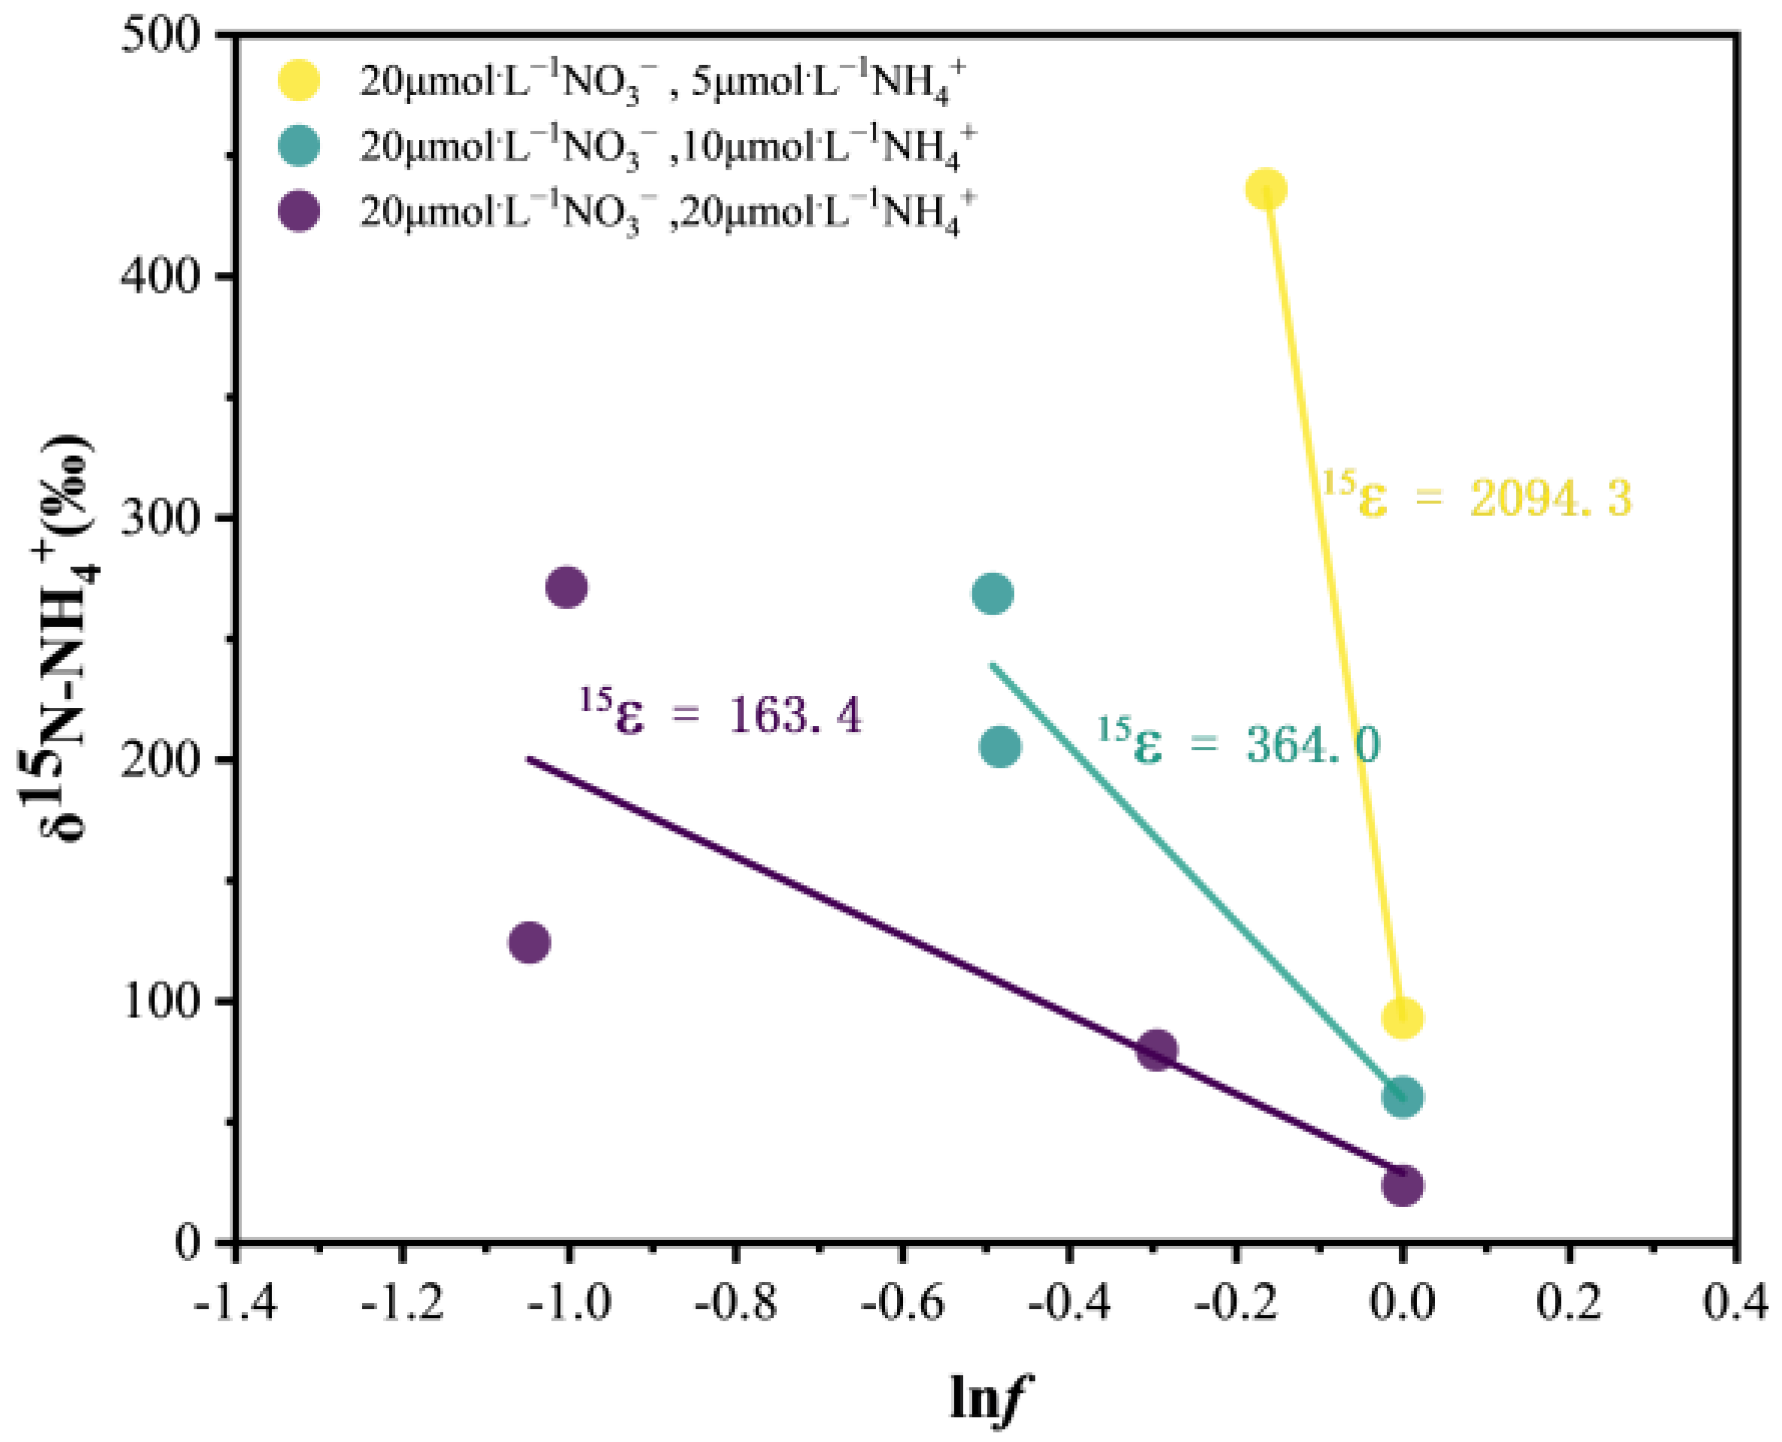
3.4. Variations in N Isotopes and Isotopic Fractionation (ε)

In this study, the δ15 N-PON values in all three groups significantly and continuously increased over time. In group 1, the δ15N-PON value increased rapidly from 4.4‰ at 0 h to 340.3‰ at 8 h, after which the increase slowed and reached its highest value (373.1‰) at 12 h (Figure 4a). In group 2, the overall change characteristics of the δ15 N-PON values were similar to those in group 1, showing a significant increase in the first 8 h, after which the increasing trend slowed. However, it is worth noting that the δ15 N-PON value in group 2 in the first 4 h was lower than that in group 1 at the same time. The δ15N-PON value in group 2 was greater than that in group 1 at 6 h until the results were similar at 8~12 h, with a maximum value of 368.5‰ (Figure 4b). In group 3, the increasing trend of δ15N-PON in the first 4 h was slower than that in the other two groups, increasing to only 122.3‰. Subsequently, the δ15N-PON value increased significantly until it reached the highest value of 283.1‰ at 12 h (Figure 4c).
The δ15N-NH4+ values of the three groups of experiments first increased and then decreased with time. In group 1, the δ15N-NH4+ value increased to 436.1‰ at 2 h and then fluctuated in the range of 60 to 420‰. After 6 h, the δ15N-NH4+ value began to decline rapidly, reaching 61.32‰ at 10 h and 76.9‰ at 12 h (Figure 5a). In group 2, the δ15N-NH4+ value showed an obvious upward trend in the first 4 h, reaching a maximum of 268.6‰, and then continued to decrease to 73.4‰ at 12 h (Figure 5b). In group 3, the δ15N-NH4+ value continuously increased in the first 6 h, peaking at 271.3‰ and then continuing to decrease, and the δ15N-NH4+ value decreased to 112.8‰ at 12 h (Figure 5c).
In the variation of isotopic fractionation (ε) of δ15N-NH4+ (Figure 6), it was found that the isotopic fractionation (ε) of group 1, group 2, and group 3 was 2094.3‰,364.0‰, and 163.4‰, respectively, with the largest ε in group 1.

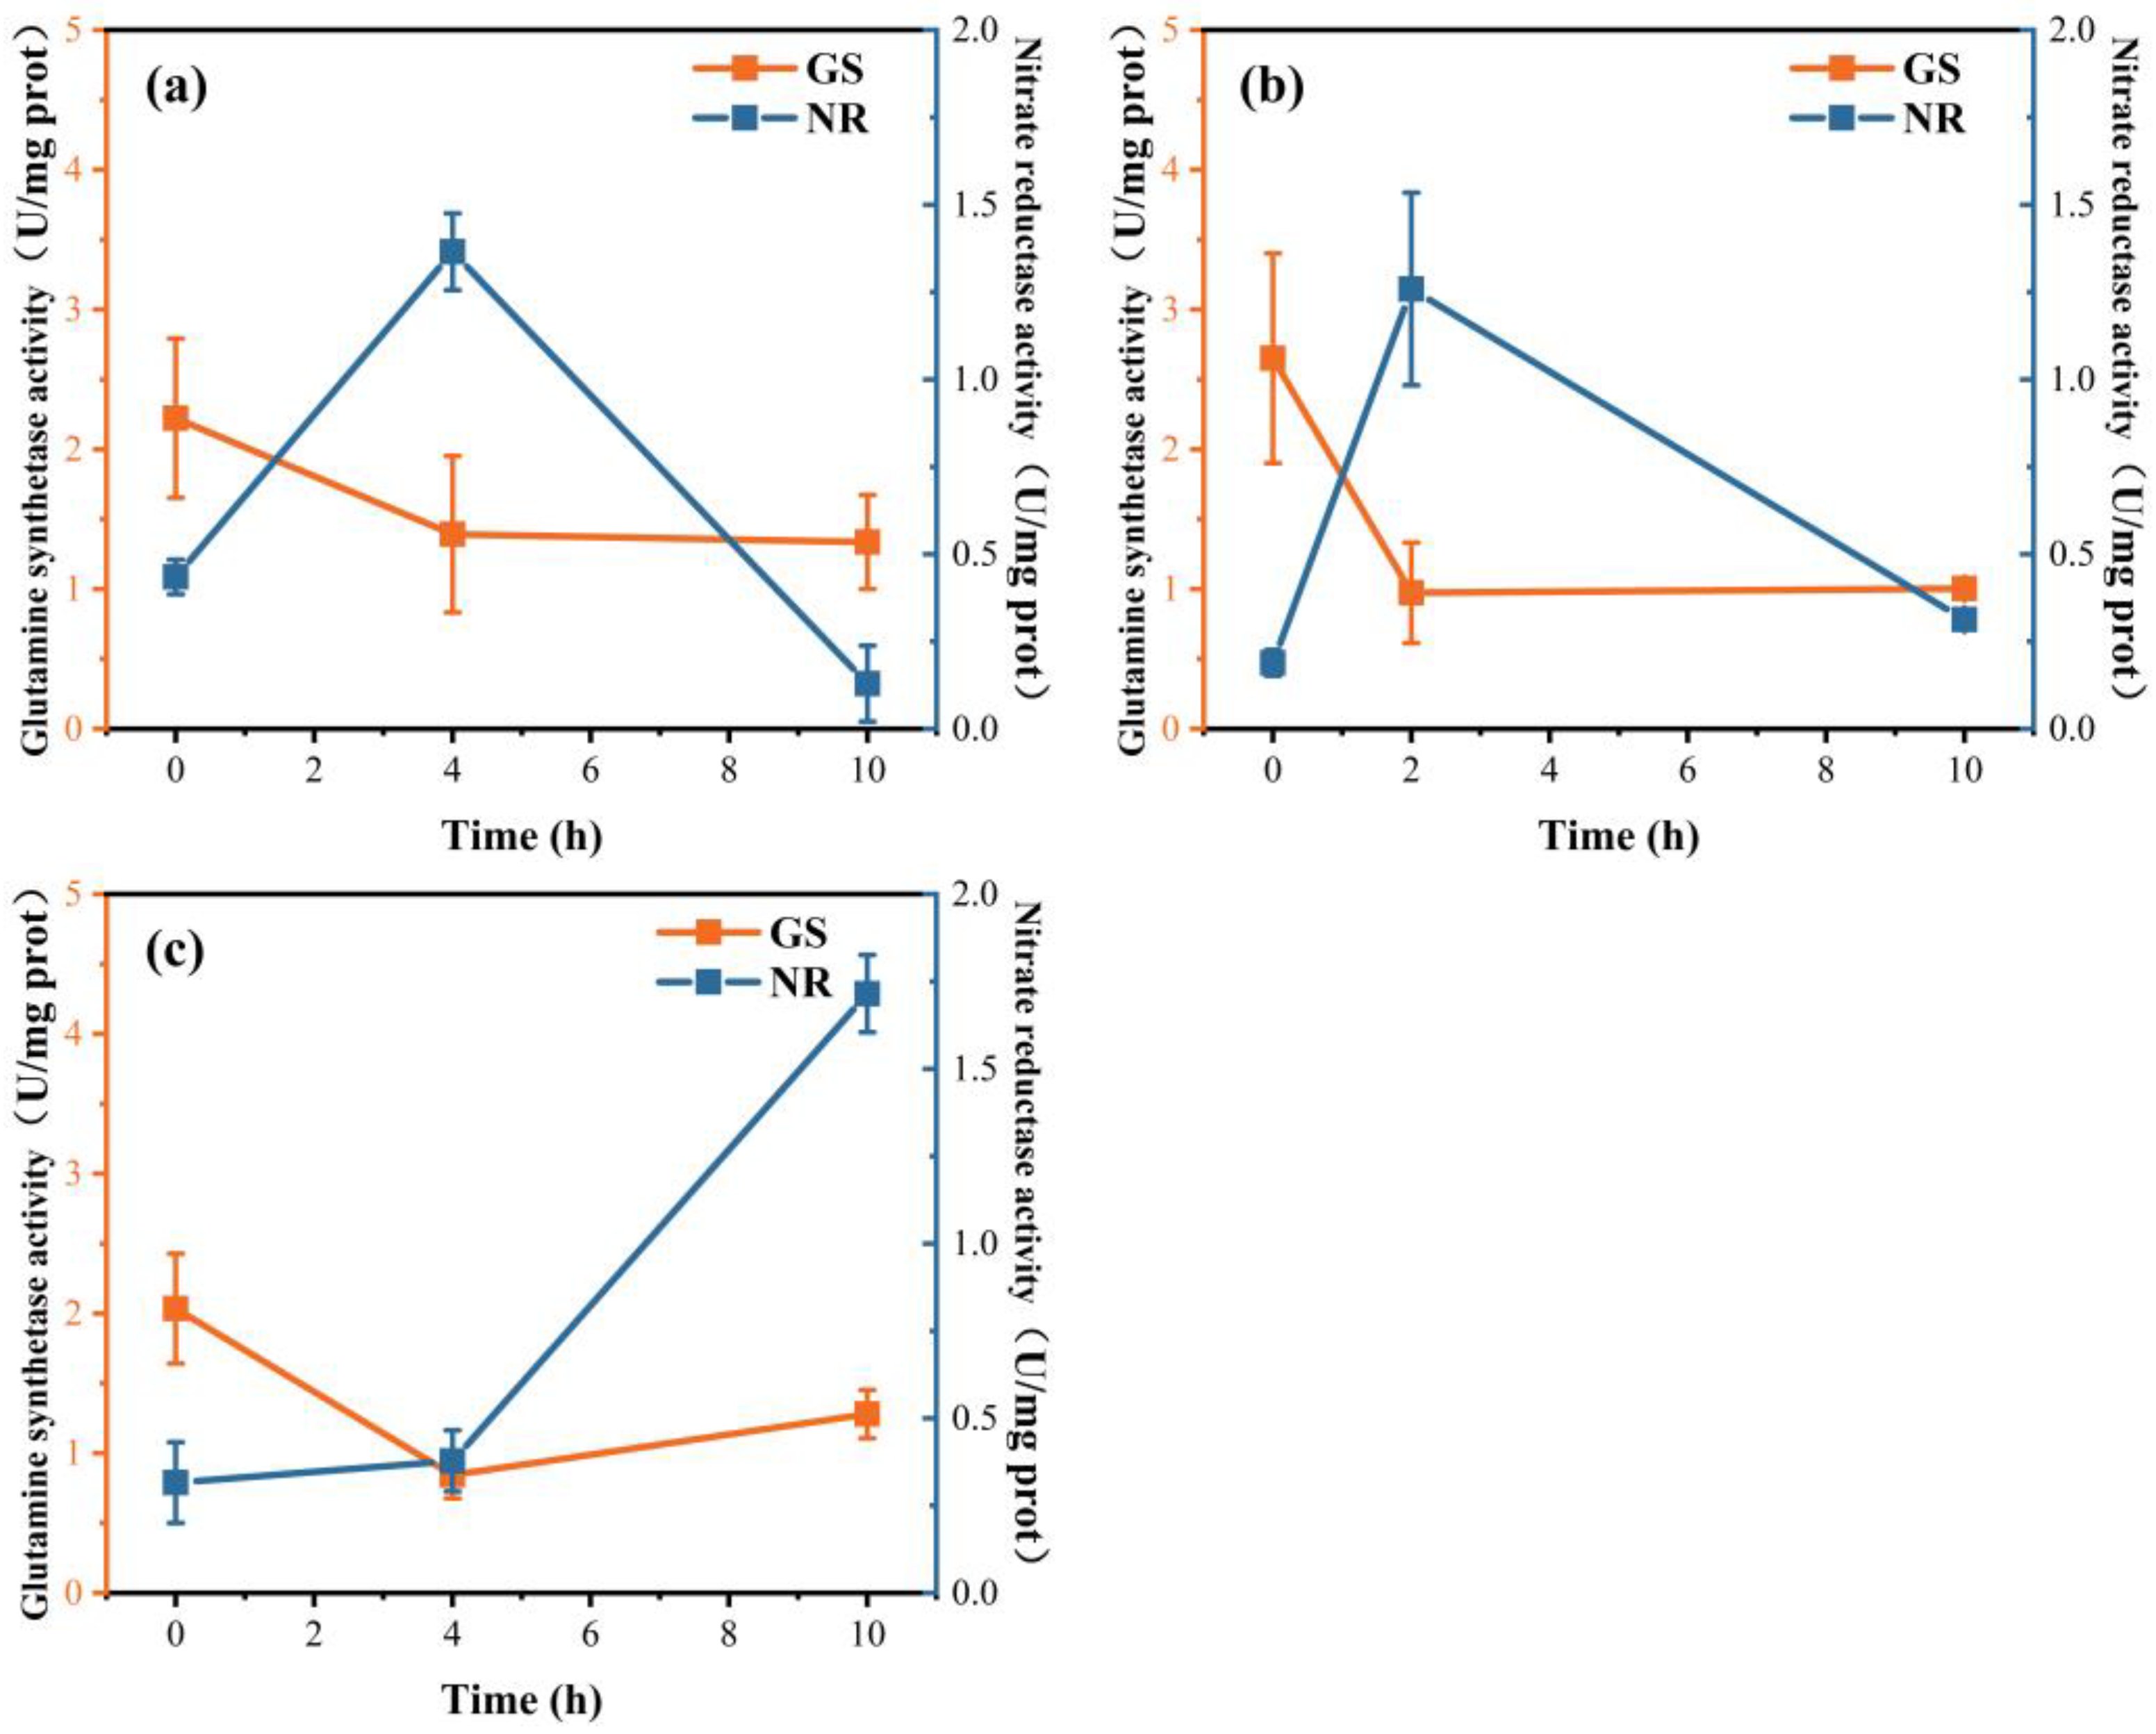
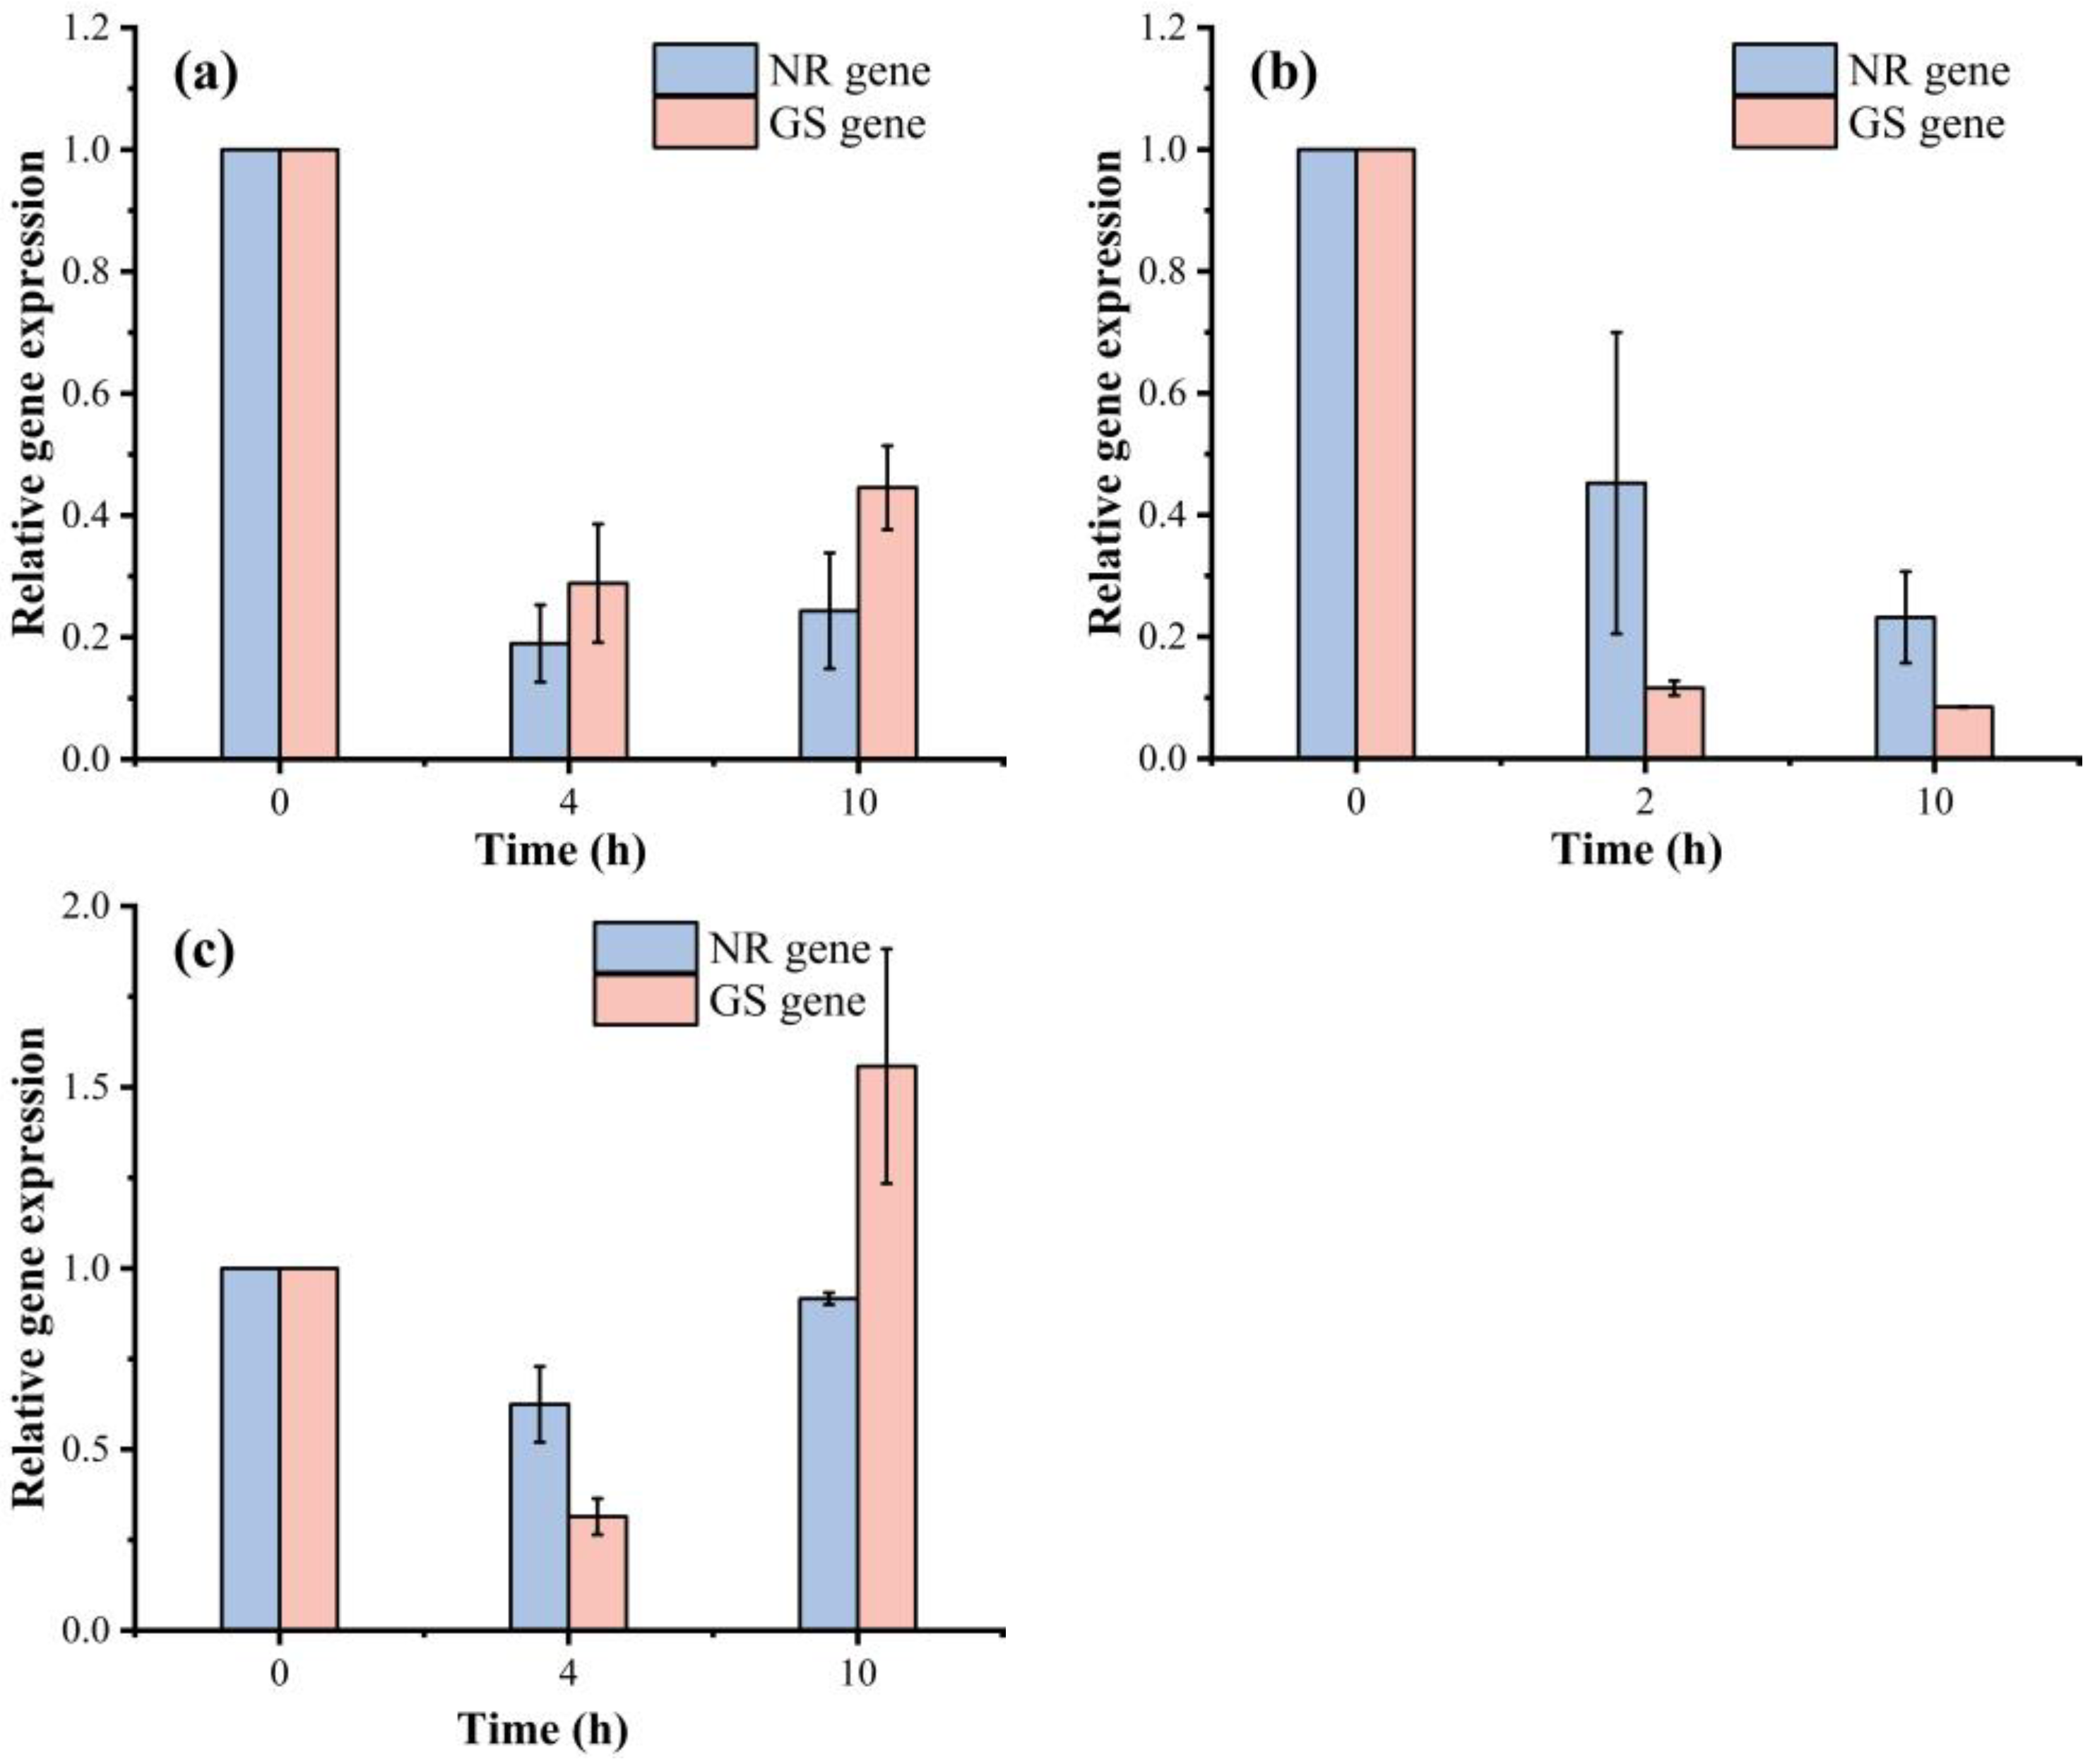
3.5. The Activities of NR and GS and the Expression of NR and GS Genes

In group 1, the activity of NR was 0.43 U/mg prot at 0 h, after which it increased first. The activity of GS at 0 h was 2.22 U/mg prot, which decreased significantly and remained at approximately 1.3 U/mg prot from 4~10 h (Figure 7a). This was related to nutrient consumption, and the activities of the two enzymes decreased when nutrients were almost exhausted at the late stage of the experiment. Their expression levels were downregulated at 4 h, and both the NR and GS gene expression levels were upregulated at 10 h (Figure 8a). In group 2, the activity of NR tended to increase. After 2 h, the change in activity was small; it remained at approximately 0.31 U/mg prot and subsequently showed a downward trend (Figure 7b). In group 2, the NR and GS gene expression levels were downregulated (Figure 8b). In group 3, the activity of NR increased significantly to 1.72 U/mg prot at 10 h. The activity of GS at 0 h was 2.04 U/mg prot after which it decreased first (Figure 7c). The gene expression level of GS and NR also tended to first decrease and then increase, reaching the highest relative expression level at 10 h (Figure 8c).

4. Discussion

4.1. The Characteristics of NO3 and NH4+ Assimilation by P. globosa

4.1.1. Comparison of the Assimilation Rates of NO3 and NH4+

This study revealed that the preferential assimilation of NO3 by P. globosa is influenced by the ambient concentration of NH4+. In groups 1 and 2, as the concentration of NH4+ decreased, the assimilation rate of NO3 gradually increased (Figure 3a,b). However, the assimilation of NO3 at 0~4 h was influenced by the ambient concentration of NH4+ in group 3. After 6 h, the maximum assimilation rate of NO3 increased to 1.05 × 10⁻⁵ μmol·L−1·h−1·cell−1, and the concentration of NO3 increased to 6.22 μmol·L−1 (Figure 2c and Figure 3c). These findings indicated that when both NO3 and NH4+ were present in the environment and the concentration of NH4+ exceeded a certain threshold, the preferential assimilation of NO3 by P. globosa was modulated by the concentration of NH4+. When the threshold was reached, the maximum assimilation rate of NO3 was greater than that of NH4+, and the assimilation of NO3 was preferred at the later stage of the experiment.
When the concentration of NH4+ in the environment was reduced to a certain extent, P. globosa notably exhibited NO3 uptake. For example, in group 3, when the concentration of NH4+ was reduced to 3.51 μmol·L−1, the concentration of NO3 decreased rapidly from 14.10 to 1.17 μmol·L−1 at 10 h, while the concentration of NH4+ decreased by only 1.61 μmol·L−1 during the same period (Figure 2c). The uptake rate of NO3 began to increase at 4~6 h and rapidly increased to 1.05 × 10⁻⁵ μmol·L−1·h−1·cell−1 at 6~8 h (Figure 3c). Compared with the previous experimental data of the other two groups, the uptake rate of NO3 in group 3 was lower. In group 2, when the concentration of NH4+ was reduced to 2.09 μmol·L−1 within 2 h, it remained in the range below 1.60 μmol·L−1, while the concentration of NO3 decreased from 20.11 μmol·L−1 to 0.67 μmol·L−1 during this period (Figure 2b). The uptake rate of NO3 increased to 1.70 × 10⁻⁶ μmol·L−1·h−1·cell−1 at 2~4 h, which was consistent with the change in nutrients (Figure 3b). Through further verification by design group 1, it was found that the concentration of NH4+ decreased by only 4.05 μmol·L−1 during the entire experiment, while the concentration of NO3 continued to decrease rapidly and was mostly consumed at 8 h (Figure 2a). The study showed that the uptake rate of NO3 reached a maximum of 5.28 × 10⁻⁶ μmol·L−1·h−1·cell−1 at 4~6 h (Figure 3a). This result is related to the preferential uptake of NO3 by P. globosa reported in many previous studies [20,23]. Malone’s research revealed that the uptake rate of NO3 by Chaetoceros sp. was 0.20~4.00 × 10⁻⁹ μmol·L−1·h−1·cell−1 [26]. The rate of NO3 uptake by Pseudo-Nitzschia delicatissima cultured in artificial seawater is 1.48~1.77 × 10⁻⁹ μmol·L−1·h−1·cell−1 [27]. The uptake rate of NO3 by Trichodesmium sp. is less than 1.75 × 10⁻⁹ μmol·L−1·h−1·cell−1 [28]. Additionally, a study revealed higher uptake rates of NO3 in Nitzschia sp., and the uptake rate ranged from 2.64~5.71 × 10⁻⁹ μmol·L−1·h−1·cell−1 [29]. The assimilation rate of nitrate in P. globosa was greater than that in other algae.

4.1.2. The Inhibitory Effect of Ambient Concentrations of NH4+ on the Assimilation of NO3

According to the above results, it is speculated that when the concentration of NH4+ in the environment is lower than approximately 3.5 μmol·L−1, P. globosa will begin to assimilate and utilize NO3, which is considered delayed uptake. In this study, the inhibitory effect of NH4+ on the uptake or assimilation of NO3 ranged from 3.51~22.18 μmol·L−1. Increased concentrations of NH4+ have been found in experiments in Central Bay to lead to delayed uptake of NO3 [30]. Some scholars believe that NH4+ may hinder the utilization of NO3 by decreasing the availability of ATP, which is crucial for the active transport of NO3 [31]. The process by which NH4+ inhibits the utilization of NO3 has been shown to be highly unpredictable [32]. Indeed, the extent to which NH4+ inhibits NO3 metabolism, along with its threshold concentration, varies significantly based on species of algae, physiological state, and specific environmental conditions [20]. In Eppley’s study, N was assimilated by Phaeocystis sp. only when the concentration of NH4+ was lower than 1 μmol·L−1 [15]. When the concentration of NH4+ exceeds 1~2 μmol·L−1, the uptake of NO3 by microalgae in Chesapeake Bay never exceeds 1% of the total N [14]. The concentration of NH4+ in San Francisco Bay must be reduced to 1~4 μmol·L−1 for NO3 to be rapidly assimilated by phytoplankton [30]. In this study, P. globosa changed from NH4+ to NO3 when the concentration of NH4+ was 1~3.5 μmol·L−1, which may be conducive to the production of colonies and may aid in the survival and competition of P. globosa.
Notably, although it is inferred above that the prophase P. globosa in group 2 and group 3 preferentially assimilated and used NH4+, the relatively high concentration of NH4+ in the environment did not completely repress the assimilation of NO3. On the one hand, the concentration of NO3 still slightly decreased in these groups in the early stage of these experiments; on the other hand, the 15N-PON value increased significantly. According to the fractionation effect of stable isotopes, when there is a natural abundance of N without the addition of a tracer, lighter 14N will have priority in the PON pool in the process of microalgal assimilation [33], resulting in a decrease in the δ15N-PON value. However, when a certain N in the environment is added with a high abundance of 15N, the assimilation of N by algae will cause highly labeled 15N signals to enter the PON pool, resulting in an increase in the δ15N-PON value [34]. There are two possible reasons for this persistent assimilation of NO3. On the one hand, Glibert reported that the assimilation of N and C is connected through a variety of biochemical pathways; there is an interaction between their assimilations, and the cellular energy balance acts as the coordinator of the two [12]. When NO3 and NH4+ act as substrates for N growth, NO3 has a stronger affinity for carbon dioxide, and the addition of NO3 can change the electron distribution between different chloroplasts and mitochondrial pathways. The process of balancing the generation and utilization of energy in the survival mechanism of algae may be better coordinated by changing the N to achieve optimal selection [12]. On the other hand, this phenomenon may be determined by the evolutionary history of P. globosa. When NO3 is present in the medium, P. globosa promotes the formation of colonies, and few colonies are formed when NH4+ is enriched alone [17,19,35,36]. Liang et al. (2021) reported that colonies have strong photosynthetic activity, which indicates that they have stronger carbon fixation functions and can produce more energy and organic matter [37]. Moreover, colonies also utilize N to secrete exopolysaccharide (EPS).

4.2. Regulation of Nitrogen-Metabolizing Enzymes

Nitrogen (N) metabolism is one of the basic physiological metabolic processes in plants and is completed by the catalysis of enzymes. Phytoplankton can reduce NO3 and NH4+ to amino acids through the action of nitrogen-metabolizing enzymes and utilize these amino acids (Figure 9) [38]. Since the uptake and assimilation of NO3 require a two-step reductase process, NO3 requires much more energy than NH4+, so most algae may preferentially use NH4+ as N to conserve energy [17]. Algal cells can utilize different forms of nutrients by regulating the activities of GS, NR, and other enzymes. The presence of NH4+ stimulates the GS gene and the activities of glutamine synthetase so that algal cells can assimilate and utilize NH4+. NO3 is also an environmental signal that regulates many processes, such as gene expression [39]. Cells can sense and respond to environmental concentrations of NO3 through nitrate (NO3) transporters. For example, Arabidopsis thaliana acts as an ion sensor through the parental and receptor capacity of the nitrate (NO3) transporter AtNRT1.1 and a phosphorylation switch at H101, thereby mediating downstream gene expression through downstream kinase phosphorylation [40].
In fact, the transport and assimilation of NO3 are usually inhibited by NH4+ [12], and the provision of NH4+ can inhibit the uptake of NO3 by altering the activity of NR or preventing NR synthesis [41]. Moreover, NH4+ can also affect NO3 metabolism by downregulating the transmembrane transport of NO3 [12]. Studies have shown that the presence of NH4+ in media exerts an inhibitory effect on the expression of the NR gene and the activity of NR [42]. A similar phenomenon was observed in the present study. First, in group 2, both the GS and NR genes were expressed at 0 h, and the GS gene levels were downregulated at 2 h. In group 3, both genes were expressed at 4 h, and the NR gene expression was upregulated at 10 h (Figure 8). Furthermore, the presence of NH4+ affects the activity of other enzymes, such as NR. In the three groups of experiments, NR was inhibited by NH4+, and the activity of NR did not increase. In group 2, the concentration of NH4+ decreased to 2.09 μmol·L−1 after 2 h, and the activity of GS also showed a downward trend. At this time, NR was weakened by NH4+ inhibition, and the related activity of NR increased. At 4 h in group 3, NO3 began to be assimilated and utilized. The activity of GS decreased at 4 h, and the activity of NR continued to increase after 4 h (Figure 7). When the glutamine level is low, the activity of NR is upregulated when NO3 is available. In addition, when the glutamine level is high, the activity of NR is inhibited [12]. The nutrient preference of phytoplankton for NO3or NH4+ has been extensively studied in various environments, such as cultures or oceans, and the mechanism of preferential uptake is complex and regulated at multiple levels, including the uptake rate, gene expression control, and enzyme activity [42].

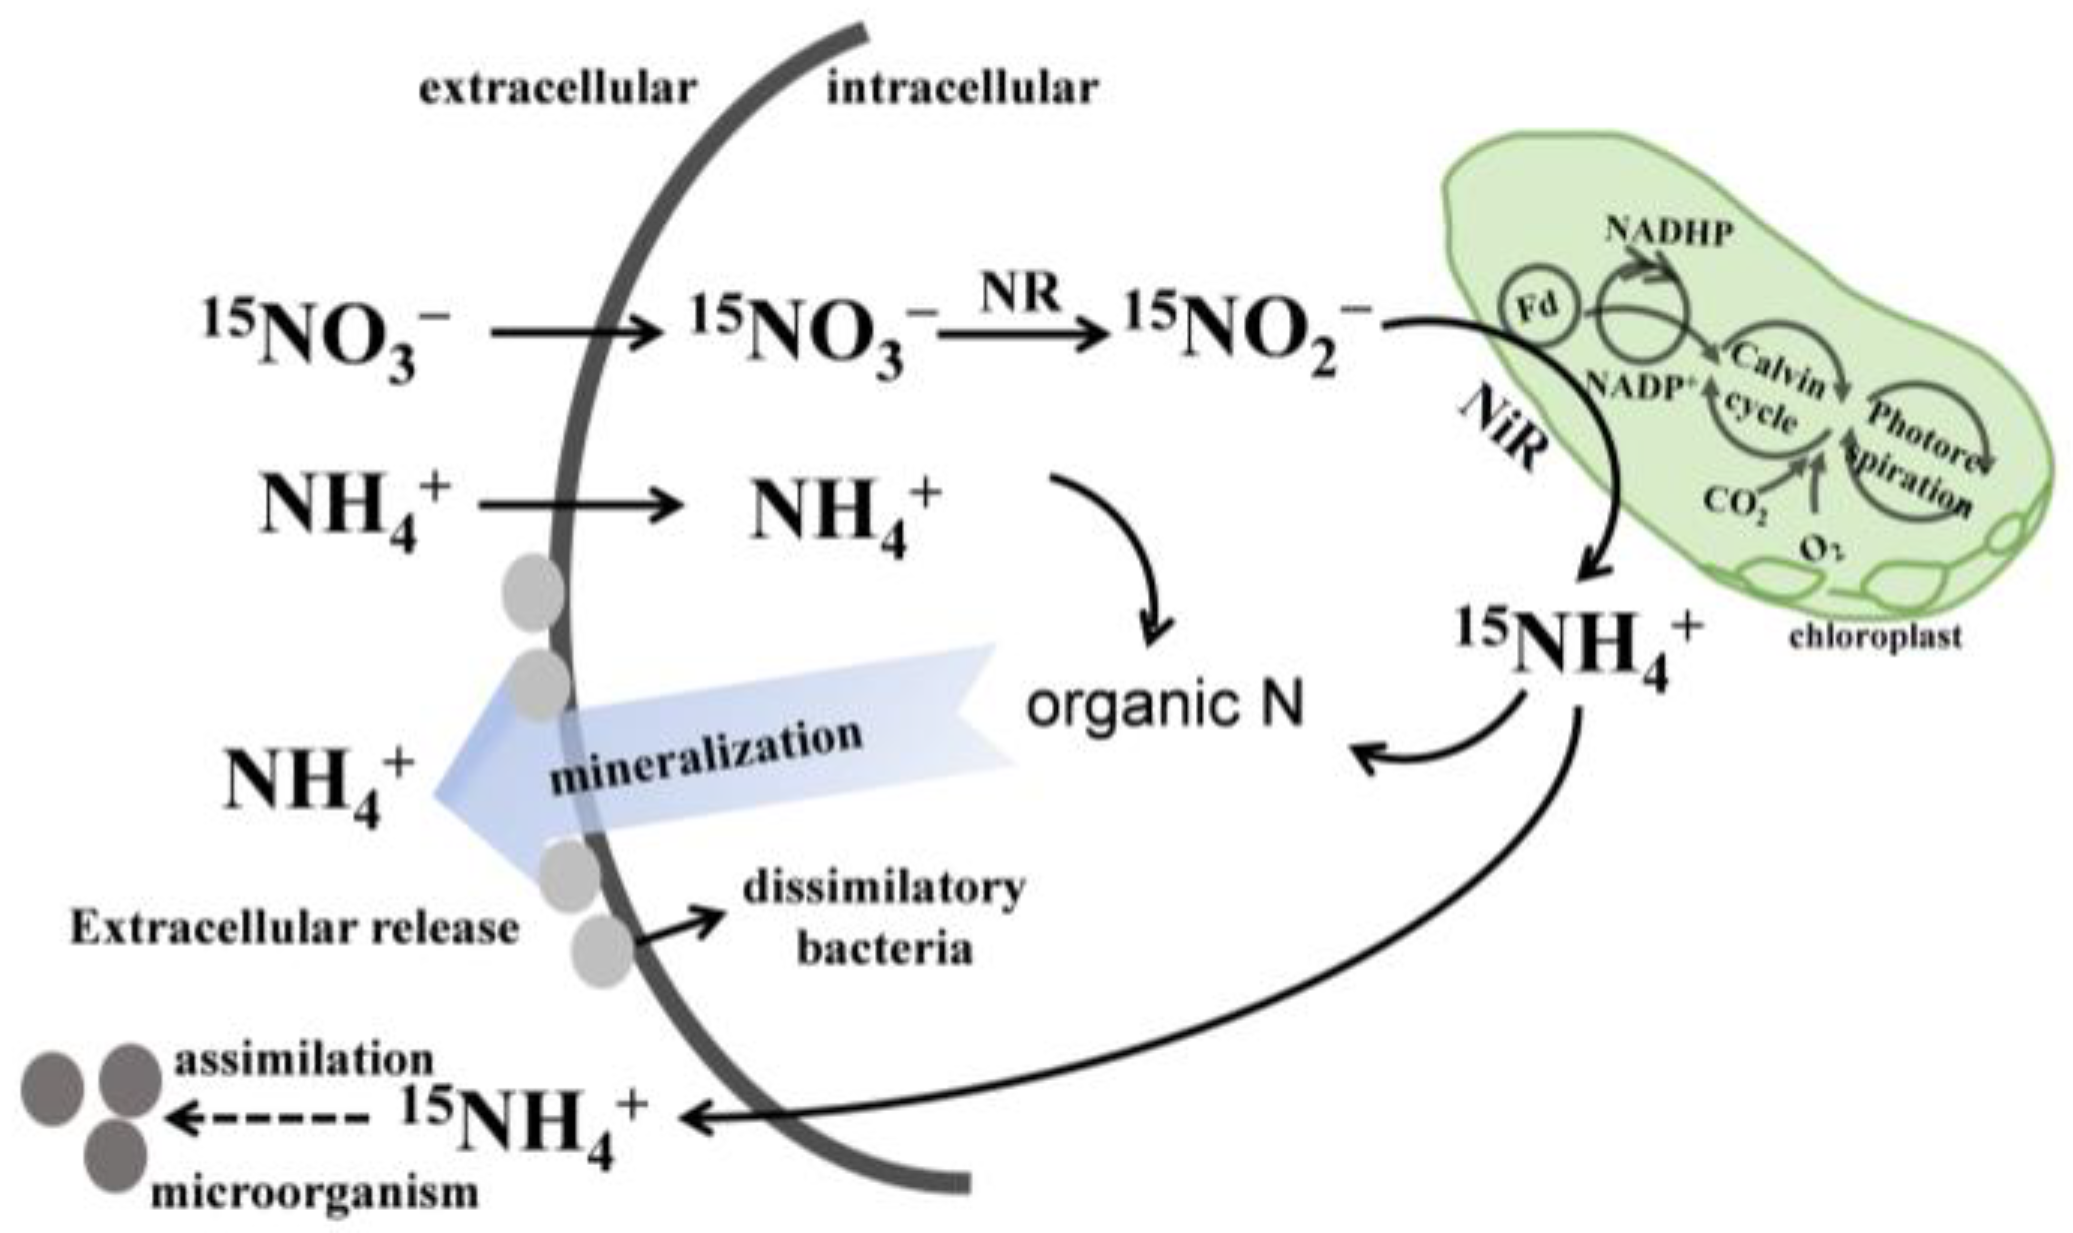
4.3. Mechanism of NH4+ Production in P. globosa

The concentration of NH4+ in fluid inside colonies in previous studies was significantly greater than that in the external environment. However, the underlying cause for this disparity remains uncertain [23]. We speculate that the difference in concentration may be related to the excess reduction of NO3 by algae and the release of excess NH4+. To confirm this conclusion, NO3 with a high abundance of 15N was added to monitor the change in δ15N abundance in the NH4+ pool to determine the transformation of 15N atoms from the NO3 pool to the NH4+ pool. The results showed that the δ15N-NH4+ value in all the experimental groups increased with time to varying degrees. For example, in group 3, group 2, and group 1, the δ15N-NH4+ value increased to the highest value at 2 h, 4 h, and 6 h, respectively, with a correlation greater than 260‰, indicating a rapidly increasing ratio of 15N vs. 14N atoms (Figure 5). This variation may be attributed to the rapid removal of 14N and/or the rapid introduction of 15N. The former mainly refers to the assimilation and utilization of NH4+ by P. globosa, which causes the 14N atom of the substrate to be utilized by P. globosa more quickly than the 15N atom, resulting in an increase in the δ15N-NH4+ abundance of the substrate. Therefore, it is necessary to discuss whether the influence of the assimilation and utilization process is obvious. Taking the highest δ15N-NH4+ value in each group as the reaction cutoff, the isotopic fractionation of assimilation and utilization was approximately 163~2094‰ (Figure 6), which was much greater than the normal level. It can be concluded that the increase in the abundance of the substrate δ15N-NH4+ was not mainly caused by the assimilation of NH4+ by P. globosa.
Notably, the increase in δ15N-NH4+ abundance in each experimental group was consistent with the moment when the concentration of NO3 decreased, and the δ15N-NH4+ value was positively correlated with the assimilation rate of nitrate. The isotopic fractionation of NH4+ calculated for the high uptake rate of NO3 in group 1 reached 2094‰, and the isotopic fractionation of NH4+ obtained for the relatively low uptake rate of NO3 in group 3 reached 163‰ (Figure 6). Therefore, it is concluded that the increase in δ15N-NH4+ may be mainly due to the reduction of 15NO3, which introduces 15N atoms into the NH4+ pool. The above transformation is thought to be driven by the dissipation/output of excess reducing agent energy under the action of cellular energy imbalance. The excess presence of reducing agents is usually caused by an imbalance between photochemistry and the assimilation of C and N, involving the lutein cycle, the Calvin cycle, etc. When photochemistry exceeds assimilation capacity, excess reducing agents may be produced [12]. Pressure causes the uptake rate of C and N to be slower than that of light, resulting in an energy imbalance. As a means of energy dissipation, algae are capable of taking up NO3 and subsequently releasing NH4+ as a product [43]. When NO3 is reduced to NH4+ by phytoplankton, substantial energy expenditure occurs. This reduction can be seen as a strategy to address excessive photosynthetic energy. Therefore, the combined action of reduction and release is an optimal method for dissipating that energy [44]. Kamp et al. (2011) used stable isotope labeling experiments to confirm that under anoxic or dark conditions, the utilization of 15NO3 was coupled with the generation and liberation of 15NH4+ [45]. This study confirmed that the NH4+ leakage process is synchronized with the uptake and assimilation of NO3 by P. globosa under light conditions.
Furthermore, there was a rapid decrease in δ15N-NH4+ during the later stages of the experiment, raising speculation about the potential existence of dynamic equilibrium within the culture. Initially, it was observed in three experiments that the δ15N-NH4+ value began to decrease after 6 h. Therefore, it was inferred that the decrease in δ15N-NH4+ might be attributed to the weakened production of 15N or/and the introduction of 14N (Figure 10). Based on the observed changes in concentration, NO3 underwent consumption during this period, leading to a diminished generation of 15N. However, NO3 was not completely consumed after 6 h, especially in group 3. This result indicated that there might be an increase in mineralization in group 3 during this period, leading to an increase in 14N. Some evidence has suggested that the internal fluid of colonies is enriched in DON, which is vulnerable to degradation by heterotrophic bacteria [46]. Heterotrophic bacteria (such as Candidatus actinomarina minuta) have been observed to exist in the outer fluid and internal fluid of colonies and can act on organic nitrogen within algal cells, promoting mineralization and thereby generating new 14N [23]. Consequently, the weakened introduction of 15N and the production of new 14N may lead to a decrease in the δ15N-NH4+ value.

5. Conclusions

Compared with other algae, P. globosa exhibited superior assimilation rates of NO3, reaching a maximum of 1.05 × 10⁻⁵ μmol·L−1·h−1·cell−1. The inhibitory effect of ambient concentrations of NH4+ on the assimilation of NO3 has also been observed in other algae. Similarly, this study revealed that the assimilation of nitrate is suppressed by NH4+. However, when the ambient concentration of NH4+ was below a certain threshold, the inhibitory effect diminished. Additionally, the presence of NH4+ in the culture suppressed nitrate reductase activity and the expression of the NR gene. However, based on the δ15N-PON results, NO3 was still assimilated during the early stages of the experiment. Therefore, the assimilation of nitrate was incompletely suppressed by NH4+. P. globosa releases NH4+ into the environment during its growth phase, potentially utilizing this mechanism to release excess energy and address intracellular energy imbalances. The results accurately captured the process of NH4+ release by P. globosa, contributing significantly to the understanding of the assimilation of inorganic nitrogen. Based on this study, further research can be conducted to investigate the nitrogen cycling processes related to NH4+ released from P. globosa. It is hoped that this study can provide scientific data on the mechanism of algal blooms.

Author Contributions

Conceptualization, H.G. and W.W.; methodology, H.G., W.W. and J.Z.; formal analysis, H.G. and W.W.; investigation, H.G. and J.Z.; resources, H.G., W.W., X.S., Z.Y. and J.Z.; data curation, H.G.; writing—original draft preparation, H.G.; writing—review and editing, H.G., W.W., J.H., J.Z., Z.W. and L.H.; funding acquisition, W.W., X.S., Z.Y. and L.H. All authors have read and agreed to the published version of the manuscript.

Funding

This research was funded by the Shandong Provincial Natural Science Foundation of China (Grant No. ZR2019QD014), the Intergovernmental Innovation Cooperation Project of the Ministry of Science and Technology (Grant No. 2022YFE0136400), the Laoshan Laboratory (Grant No. LSKJ202203700), and the National Natural Science Foundation of China (Grant No. 42306150).

Institutional Review Board Statement

Not applicable.

Informed Consent Statement

Not applicable.

Data Availability Statement

The data presented in this study are available on request from the corresponding author.

Acknowledgments

We thank Yue Zhang (QMSTC), Xin Feng (IOCAS), and Hao Feng (IOCAS) for their help with the algae culture and experiments.

Conflicts of Interest

The authors declare no conflicts of interest.

References

  1. Schoemann, V.; Becquevort, S.; Stefels, J.; Rousseau, V.; Lancelot, C. Phaeocystis blooms in the global ocean and their controlling mechanisms: A review. J. Sea Res. 2005, 53, 43–66. [Google Scholar] [CrossRef]
  2. Qi, Y.; Chen, J.; Wang, Z.; Xu, N.; Wang, Y.; Shen, P.; Lu, S.; Hodgkiss, I.J. Some observations on harmful algal bloom (HAB) events along the coast of Guangdong, southern China in 1998. Hydrobiologia 2004, 512, 209–214. [Google Scholar] [CrossRef]
  3. Mars Brisbin, M.; Mitarai, S. Differential Gene Expression Supports a Resource-Intensive, Defensive Role for Colony Production in the Bloom-Forming Haptophyte, Phaeocystis globosa. J. Eukaryot. Microbiol. 2019, 66, 788–801. [Google Scholar] [CrossRef] [PubMed]
  4. Brussaard, C.P.D.; Mari, X.; Bleijswijk, J.D.L.V.; Veldhuis, M.J.W. A mesocosm study of Phaeocystis globosa (Prymnesiophyceae) population dynamics: II. Significance for the microbial community. Harmful Algae 2005, 4, 875–893. [Google Scholar] [CrossRef]
  5. Tang, D.L.; Kawamura, H.; Doan-Nhu, H.; Takahashi, W. Remote sensing oceanography of a harmful algal bloom off the coast of southeastern Vietnam. J. Geophys. Res.-Ocean. 2004, 109, C03014. [Google Scholar] [CrossRef]
  6. Larsen, A.; Flaten, G.A.F.; Sandaa, R.-A.; Castberg, T.; Thyrhaug, R.; Erga, S.R.; Jacquet, S.; Bratbak, G. Spring phytoplankton bloom dynamics in Norwegian coastal waters: Microbial community succession and diversity. Limnol. Oceanogr. 2004, 49, 180–190. [Google Scholar] [CrossRef]
  7. Spilmont, N.; Denis, L.; Artigas, L.F.; Caloin, F.; Courcot, L.; Créach, A.; Desroy, N.; Gevaert, F.; Hacquebart, P.; Hubas, C.; et al. Impact of the Phaeocystis globosa spring bloom on the intertidal benthic compartment in the eastern English Channel: A synthesis. Mar. Pollut. Bull. 2009, 58, 55–63. [Google Scholar] [CrossRef] [PubMed]
  8. Lancelot, C. Factors affecting phytoplankton extracellular release in the Southern Bight of the North Sea. Mar. Ecol. Prog. Ser. 1983, 12, 115–121. [Google Scholar] [CrossRef]
  9. He, L.; Song, X.; Yu, F.; Wang, K.; Song, S.Q.; Yu, Z. Potential risk and prevention of phytoplankton outbreak to water-cooling system in nuclear power plant in Fangchenggang, Guangxi. J. Oceanol. Limnol. 2019, 50, 700–706. [Google Scholar] [CrossRef]
  10. Raven, J.A.; Wollenweber, B.; Handley, L.L. A comparison of ammonium and nitrate as nitrogen sources for photolithotrophs. New. Phytol. 1992, 121, 19–32. [Google Scholar] [CrossRef]
  11. MacIsaac, J.J.; Dugdale, R.C. The kinetics of nitrate and ammonia uptake by natural populations of marine phytoplankton. Deep. Sea Res. Oceanogr. Abstr. 1969, 16, 45–57. [Google Scholar] [CrossRef]
  12. Glibert, P.M.; Wilkerson, F.P.; Dugdale, R.C.; Raven, J.A.; Dupont, C.L.; Leavitt, P.R.; Parker, A.E.; Burkholder, J.M.; Kana, T.M. Pluses and minuses of ammonium and nitrate uptake and assimilation by phytoplankton and implications for productivity and community composition, with emphasis on nitrogen-enriched conditions. Limnol. Oceanogr. 2016, 61, 165–197. [Google Scholar] [CrossRef]
  13. Ludwig, C.A. The availability of different forms of nitrogen to a green alga. Am. J. Bot. 1938, 25, 448–458. [Google Scholar] [CrossRef]
  14. McCarthy, J.J.; Taylor, W.R.; Taft, J.L. Nitrogenous nutrition of the plankton in the Chesapeake Bay. 1. Nutrient availability and phytoplankton preferences. Limnol. Oceanogr. 1977, 22, 996–1011. [Google Scholar] [CrossRef]
  15. Eppley, R.W.; Coatsworth, J.L.; Solórzano, L. Studies of Nitrate Reductase In Marine Phytoplankton1. Limnol. Oceanogr. 1969, 14, 194–205. [Google Scholar] [CrossRef]
  16. Wheeler, P.A.; Kokkinakis, S.A. Ammonium recycling limits nitrate use in the oceanic subarctic Pacific. Limnol. Oceanogr. 1990, 35, 1267–1278. [Google Scholar] [CrossRef]
  17. Wang, X.; Wang, Y.; Smith, W.O., Jr. The role of nitrogen on the growth and colony development of Phaeocystis globosa (Prymnesiophyceae). Eur. J. Phycol. 2011, 46, 305–314. [Google Scholar] [CrossRef]
  18. Wang, Y.; Qi, Y.; Li, S. Nutritional requirements for the growth of Phaeocystis globosa scherffel. Acta Hydrobiol. Sin. 2007, 31, 24–29. [Google Scholar] [CrossRef]
  19. Lancelot, C.; Gypens, N.; Billen, G.; Garnier, J.; Roubeix, V. Testing an integrated river–ocean mathematical tool for linking marine eutrophication to land use: The Phaeocystis-dominated Belgian coastal zone (Southern North Sea) over the past 50 years. J. Mar. Syst. 2007, 64, 216–228. [Google Scholar] [CrossRef]
  20. Tungaraza, C.; Rousseau, V.; Brion, N.; Lancelot, C.; Gichuki, J.; Baeyens, W.; Goeyens, L. Contrasting nitrogen uptake by diatom and Phaeocystis-dominated phytoplankton assemblages in the North Sea. J. Exp. Mar. Biol. Ecol. 2003, 292, 19–41. [Google Scholar] [CrossRef]
  21. Smith, W.O.; Carlson, C.A.; Ducklow, H.W.; Hansell, D.A. Growth dynamics of Phaeocystis antarctica-dominated plankton assemblages from the Ross Sea. Mar. Ecol. Prog. Ser. 1998, 168, 229–244. [Google Scholar] [CrossRef]
  22. Arrigo, K.R.; Robinson, D.H.; Worthen, D.L.; Dunbar, R.B.; DiTullio, G.R.; VanWoert, M.; Lizotte, M.P. Phytoplankton Community Structure and the Drawdown of Nutrients and CO2 in the Southern Ocean. Science 1999, 283, 365–367. [Google Scholar] [CrossRef]
  23. Lv, X.; Wu, Z.; Song, X.; Yuan, Y.; Cao, X.; Yu, Z. Nutritional strategy for the preferential uptake of NO3--N by Phaeocystis globosa. Hydrobiologia 2019, 846, 109–122. [Google Scholar] [CrossRef]
  24. Berges, J.A.; Franklin, D.J.; Harrison, P.J. Evolution of an artificial seawater medium: Improvements in enriched seawater, artificial water over the last two decades. J. Phycol. 2001, 37, 1138–1145. [Google Scholar] [CrossRef]
  25. Mulholland, M.R.; Bernhardt, P.W.; Heil, C.A.; Bronk, D.A.; O’Neil, J.M. Nitrogen fixation and release of fixed nitrogen by Trichodesmium spp. in the Gulf of Mexico. Limnol. Oceanogr. 2006, 51. [Google Scholar] [CrossRef]
  26. Malone, T.C.; Garside, C.; Haines, K.C.; Roels, O.A. Nitrate uptake and growth of Chaetoceros sp. in large outdoor continuous cultures1. Limnol. Oceanogr. 1975, 20, 9–19. [Google Scholar] [CrossRef]
  27. Auro, M.E.; Cochlan, W.P. Nitrogen Utilization and Toxin Production by Two Diatoms of the Pseudo-nitzschia pseudodelicatissima Complex: P. cuspidata and P. fryxelliana. J. Phycol. 2013, 49, 156–169. [Google Scholar] [CrossRef]
  28. Goering, J.J.; Dugdale, R.C.; Menzel, D.W. Estimates of In Situ Rates of Nitrogen Uptake by Trichodesmium sp. in the Tropical Atlantic Ocean1. Limnol. Oceanogr. 1966, 11, 614–620. [Google Scholar] [CrossRef]
  29. Kwon, H.K.; Oh, S.J.; Yang, H.S. Growth and uptake kinetics of nitrate and phosphate by benthic microalgae for phytoremediation of eutrophic coastal sediments. Bioresour. Technol. 2013, 129, 387–395. [Google Scholar] [CrossRef]
  30. Dugdale, R.C.; Wilkerson, F.P.; Hogue, V.E.; Marchi, A. The role of ammonium and nitrate in spring bloom development in San Francisco Bay. Estuar. Coast. Shelf Sci. 2007, 73, 17–29. [Google Scholar] [CrossRef]
  31. Ohmori, M.; Ohmori, K.; Strotmann, H. Inhibition of nitrate uptake by ammonia in a blue-green alga, Anabaena cylindrica. Arch. Microbiol. 1977, 114, 225–229. [Google Scholar] [CrossRef]
  32. L’Helguen, S.; Maguer, J.-F.; Caradec, J. Inhibition kinetics of nitrate uptake by ammonium in size-fractionated oceanic phytoplankton communities: Implications for new production and f-ratio estimates. J. Plankton Res. 2008, 30, 1179–1188. [Google Scholar] [CrossRef]
  33. Karsh, K.L.; Granger, J.; Kritee, K.; Sigman, D.M. Eukaryotic Assimilatory Nitrate Reductase Fractionates N and O Isotopes with a Ratio near Unity. Environ. Sci. Technol. 2012, 46, 5727–5735. [Google Scholar] [CrossRef] [PubMed]
  34. Liu, Y.; Li, N.; Lou, Y.; Liu, Y.; Zhao, X.; Wang, G. Effect of water accommodated fractions of fuel oil on fixed carbon and nitrogen by microalgae: Implication by stable isotope analysis. Ecotoxicol. Environ. Saf. 2020, 195, 110488. [Google Scholar] [CrossRef] [PubMed]
  35. Lancelot, C.; Spitz, Y.; Gypens, N.; Ruddick, K.G.; Becquevort, S.; Rousseau, V.; Lacroix, G.; Billen, G. Modelling diatom and Phaeocystis blooms and nutrient cycles in the Southern Bight of the North Sea: The MIRO model. Mar. Ecol. Prog. Ser. 2005, 289, 63–78. [Google Scholar] [CrossRef]
  36. Riegman, R.; Noordeloos, A.A.M.; Cadée, G.C. Phaeocystis blooms and eutrophication of the continental coastal zones of the North Sea. Mar. Biol. 1992, 112, 479–484. [Google Scholar] [CrossRef]
  37. Liang, D.Y.; Wang, X.D.; Huo, Y.P.; Wang, Y.; Li, S.S. Differences Between Solitary Cells and Colonial Cells in the Heteromorphic Life Cycle of Phaeocystis globosa: Morphology, Physiology, and Transcriptome. J. Ocean. Univ. China 2021, 20, 939–948. [Google Scholar] [CrossRef]
  38. Muro-Pastor, M.I.; Reyes, J.C.; Florencio, F.J. Ammonium assimilation in cyanobacteria. Photosynth. Res. 2005, 83, 135–150. [Google Scholar] [CrossRef] [PubMed]
  39. Wang, Y.Y.; Cheng, Y.H.; Chen, K.E.; Tsay, Y.F. Nitrate Transport, Signaling, and Use Efficiency. Annu. Rev. Plant. Biol. 2018, 69, 85–122. [Google Scholar] [CrossRef]
  40. Ho, C.H.; Lin, S.H.; Hu, H.C.; Tsay, Y.F. CHL1 Functions as a Nitrate Sensor in Plants. Cell 2009, 138, 1184–1194. [Google Scholar] [CrossRef]
  41. Malerba, M.E.; Connolly, S.R.; Heimann, K. An experimentally validated nitrate–ammonium–phytoplankton model including effects of starvation length and ammonium inhibition on nitrate uptake. Ecol. Model. 2015, 317, 30–40. [Google Scholar] [CrossRef]
  42. Wang, D.S.; Xu, D.; Wang, Y.T.; Fan, X.; Ye, N.H.; Wang, W.Q.; Zhang, X.W.; Mou, S.L.; Guan, Z. Adaptation involved in nitrogen metabolism in sea ice alga Chlamydomonas sp. ICE-L to Antarctic extreme environments. J. Appl. Phycol. 2015, 27, 787–796. [Google Scholar] [CrossRef]
  43. Lomas, M.W.; Glibert, P.M. Temperature regulation of nitrate uptake: A novel hypothesis about nitrate uptake and reduction in cool-water diatoms. Limnol. Oceanogr. 1999, 44, 556–572. [Google Scholar] [CrossRef]
  44. Lomas, M.; Rumbley, C.J.; Glibert, P. Ammonium release by nitrogen sufficient diatoms in response to rapid increases in irradiance. J. Plankton. Res. 2000, 22, 2351–2366. [Google Scholar] [CrossRef]
  45. Kamp, A.; de Beer, D.; Nitsch, J.L.; Lavik, G.; Stief, P. Diatoms respire nitrate to survive dark and anoxic conditions. Proc. Natl. Acad. Sci. USA 2011, 108, 5649–5654. [Google Scholar] [CrossRef]
  46. Alderkamp, A.-C.; Buma, A.G.J.; van Rijssel, M. The Carbohydrates of Phaeocystis and Their Degradation in the Microbial Food Web. Biogeochemistry 2007, 83, 99–118. [Google Scholar] [CrossRef]
Figure 1. Growth curves (a) and growth rates (b) of P. globosa in the three groups. NO3:NH4+ = 20:5 in group 1, NO3:NH4+ = 20:10 in group 2, and NO3:NH4+ = 20:20 in group 3.
Jmse 12 00989 g001
Figure 2. This variation in the NO3, NH4+, and NO2 concentrations (μmol·L−1) over time. (a) NO3:NH4+ = 20:5, (b) NO3:NH4+ = 20:10, and (c) NO3:NH4+ = 20:20.
Jmse 12 00989 g002
Figure 3. Changes in uptake rates in three groups of experiments (a) NO3:NH4+ = 20:5, (b) NO3:NH4+ = 20:10, and (c) NO3:NH4+ = 20:20.
Jmse 12 00989 g003
Figure 4. The tendency of δ15N-PON in the three groups. (a) NO3:NH4+ = 20:5, (b) NO3:NH4+ = 20:10, and (c) NO3:NH4+ = 20:20.
Jmse 12 00989 g004
Figure 5. The tendency of δ15N-NH4+ in the three groups. (a) NO3:NH4+ = 20:5, (b) NO3:NH4+ = 20:10, and (c) NO3:NH4+ = 20:20.
Jmse 12 00989 g005
Figure 6. Variation in the isotopic fractionation (ε) of δ15N-NH4+.
Jmse 12 00989 g006
Figure 7. Changes in enzyme activity in the three groups over time. (a) NO3:NH4+ = 20:5, (b) NO3:NH4+ = 20:10, and (c) NO3:NH4+ = 20:20.
Jmse 12 00989 g007
Figure 8. Effects of N media on NR gene-mRNA expression and GS gene-mRNA expression. (a) NO3:NH4+ = 20:5, (b) NO3:NH4+ = 20:10, and (c) NO3:NH4+ = 20:20.
Jmse 12 00989 g008
Figure 9. Response diagram of enzyme activity and gene changes in Phaeocystis globosa; NRA: the activity of nitrate reductase; GSA: the activity of glutamine synthetase; red and green solid arrows indicate increasing and decreasing activity, respectively. Green indicates downregulated genes, red indicates upregulated genes; enzyme activity and gene changes of NR (a) and GS (b) in P. globosa.
Jmse 12 00989 g009
Figure 10. Hypothesized nitrogen metabolism in algal cells includes the process of NO3 reduction (NO3 → NO2 → NH4+), release and mineralization of NH4+ in algae.
Jmse 12 00989 g010
Disclaimer/Publisher’s Note: The statements, opinions and data contained in all publications are solely those of the individual author(s) and contributor(s) and not of MDPI and/or the editor(s). MDPI and/or the editor(s) disclaim responsibility for any injury to people or property resulting from any ideas, methods, instructions or products referred to in the content.

