Article

Fully Buried Pipeline Floatation in Poro-Elastoplastic Seabed under Combined Wave and Current Loadings

1
CCCC Third Harbor Engineering Co., Ltd., Shanghai 200030, China
2
State Key Laboratory of Ocean Engineering, Department of Civil Engineering, Shanghai Jiao Tong University, Shanghai 200240, China
*
Author to whom correspondence should be addressed.
J. Mar. Sci. Eng. 2024, 12(6), 995; https://doi.org/10.3390/jmse12060995
Submission received: 24 April 2024 / Revised: 11 June 2024 / Accepted: 11 June 2024 / Published: 14 June 2024
(This article belongs to the Special Issue Advanced Analysis of Marine Structures—Edition II)

Abstract

:
The floatation capacity of seabed pipelines has long been considered a key risk element during design, especially with the combined loading of waves and currents. This paper presents a two-dimensional coupled approach with a poro-elastoplastic theory to study the floatation of pipelines with the combined loading of waves and currents. The findings suggest that the proposed method is able to capture the mechanical performance of pipeline floatation. Pipeline floatation occurs in two distinct phases. In the initial phases, the pipelines float slowly with the cyclic loadings. In the second stage, when the backfill soil in the middle position of the pipelines begins to liquefy, the floating displacement increases obviously. The boundary constraints provided by the pipelines strengthen the backfill soil as well as accelerate the release of excessive pore water pressure. Meanwhile, a nonliquefiable region is formed under the pipelines. The floating displacement of the pipelines increases as well as current velocity, wave height, and wave period, and reduces with increased backfill soil permeability. Increasing the permeability coefficient of backfill soil can obviously restrain the floatation of pipelines.

1. Introduction

Seabed pipelines have a common application in oil and gas transportation. Seabed pipelines are usually fully buried offshore while partially buried deep in sea. However, wave and current loadings induce an increase in excess pore water pressure within the seabed soil, thereby reducing its effective stress. The shallow seabed will even liquefy. In the liquefied seabed, it will float up without weighting measures. The floatation of the pipeline will destroy the overall stability and ultimately affect the safety of the pipelines. The floatation capacity of seabed pipelines has long been considered a key risk element, and studying pipeline floatation is crucial for the checking procedures of subsea pipelines [1,2]. Therefore, to ensure seabed pipeline safety, it is essential to assess the dynamic reaction of the seabed pipeline to combined wave and current loadings, particularly when the pipeline floats.
The use of coupled models that incorporate poro-elastoplastic theory has greatly increased the understanding of seabed pipelines floatation [3,4,5]. For instance, Qi and Gao [6] and Liang et al. [7] developed models that account for fluid–seabed–pipeline interactions, capturing the effects of cyclic wave loading and soil liquefaction. Numerous researchers have employed numerical modeling techniques to examine the soil–structure interaction of marine constructions [8,9,10]. Based on the literature review above, studies treating the sandy seabed as an elastoplastic material remain very limited at present, because the oscillatory response can be described accurately, while the residual pore pressure cannot be captured. In addition to numerical analysis, both oscillatory mechanism and residual liquefaction have been observed in laboratory experiments [11,12,13]. The wave flume test is a common method that can intuitively simulate wave conditions. The seabed reaction to wave action was reported by Zhang et al. [14], Wang et al. [15], and Smith et al. [16], respectively, using wave flume testing. In addition to wave flume test, Smith et al. [17], Jones et al. [18], and Wang et al. [19] elucidated the dynamic behavior of seabed particles under flow conditions through centrifuge experiments and numerical simulations. Due to the limitations of the laboratory equipment, only the pressure of pore water can be determined due to equipment restrictions in the laboratory. However, numerical approximations can effectively compensate for these deficiencies.
The situation becomes more complex when the fluid–seabed interaction takes a pipeline into account. However, since the 1980s, the interaction between waves, the seabed, and pipelines has been the subject of numerous investigations [20,21]. In recent years, Zhang et al. [22] introduced a 3D buried seabed pipelines simulation using the existing DYNE3WAC system as a basis. Building upon the assumption of poro-elastic soil material and the suggested numerical model, the implications of soil and wave features on the seabed reaction around the seabed pipelines induced by waves were examined. Zhao et al. [23] considered the preconsolidation caused by the pipeline’s weight and proposed one model that included a new definition of residual pore pressure generations. Zhao’s study investigated the impacts of the backfill depth on the soil dynamic reaction surrounding the pipeline, but the effects of current loadings were still ignored. Zhao et al. [24] used a two-dimensional numerical framework to explore how cross-anisotropic soil properties influence the dynamic seabed reaction and presented a simpler approximation for determining max liquefied depth based on comprehensive parametric studies. It is worth noting that the earlier research exclusively examined the impact of wave loading on the dynamic response of the seabed. In recent years, although there have been many excellent studies on floatation of seabed pipelines exposed to complicated wave and current loadings [25,26], the majority of soil constitutive models employed are static, with relatively few studies focusing on dynamic soil models.
This paper presents a two-dimensional coupled approach with a poro-elastoplastic theory to study the floatation of pipelines with the combined loading of waves and currents. The cyclic constitutive model [27,28] incorporates the structural, overconsolidation, and anisotropic characteristics of soil, facilitating an accurate portrayal of the static and dynamic behaviors of both sandy and clayey soils, rendering it more comprehensive compared to the elastoplastic model. It can more accurately simulate the dynamic response of pipelines under wave and current loadings, particularly when the pipeline floats. A comprehensive discussion of the results is presented, involving those on the mechanism of pipeline floatation and the impacts of current and wave characteristics, and particular attention is paid to the impact of soil permeability.

2. Materials and Methods

2.1. Wave Module

To accurately simulate the dynamic response of the seabed, this paper employed the third-level approximation wave–current interaction model widely used in ocean engineering research. This model could better capture the complex interactions between waves and currents. By integrating the dispersion relation, it enhances the ability to forecast wave behavior across diverse water depth scenarios, thereby ensuring versatility in its practical application, and it can comprehensively calculate the dynamic pressure on the seabed. Below is a detailed introduction about the model.
Hsu et al. [29] assumed that sea water is an in-viscous and incompressible fluid and proposed a third-level estimate for the interaction between waves and currents. The corresponding relationship is outlined as follows:
ϕ ( x , z , t ) = U 0 x + H g cosh κ 2 ( U 0 κ ω 0 ) cosh κ d sin ( κ x ω t ) + 3 H 2 cosh 2 κ ( z h ) 32 ( sinh κ d ) 4 ( U 0 ω 0 ) sin 2 ( κ x ω t ) + 3 κ 3 H 3 512 ( 9 4 ( sinh κ d ) 2 ) cosh ( κ d ) ( sinh k d ) 3 ( U 0 ω 0 ) sin 3 ( κ x ω t )
η ( x , t ) = H 2 cos ( κ x ω t ) + κ H 2 16 [ 3 + 2 ( sinh κ d ) 2 ] cosh ( κ d ) ( sinh κ d ) 3 cos 2 ( κ x ω t ) + K 2 H 3 512 [ 3 + 14 ( sinh κ d ) 2 + 2 ( sinh κ d ) 4 ] ( sinh κ d ) 4 cos ( κ x ω t ) + K 2 H 3 512 3 [ 9 + 24 ( sinh κ d ) 2 + 24 ( sinh κ d ) 4 + 8 ( sinh κ d ) 6 ] ( sinh κ d ) 4 cos 3 ( κ x ω t )
C ( t ) = U 0 2 2 H 2 16 ( ω 0 U 0 κ ) 2 ( sinh κ d ) 2
where Φ is the velocity potential, g represents the gravitational acceleration of the earth, k signifies the wave vector, U0 denotes the flow velocity, H stands for the first-order wave height, C(t) represents Bernoulli’s constant, d indicates the water depth, and η refers to the free surface elevation relative to the static water level.
The dispersion relationship can be stated as
ω = ω 0 + ( κ H ) 2 ω 2
ω 0 = U 0 κ + g κ tanh κ d
ω 2 = [ 9 + 8 ( sinh κ d ) 2 + 8 ( sinh κ d ) 4 ] 64 ( sinh κ d ) 4 ( ω 0 U 0 κ )
It can be seen that when U0 = 0, the above formula represents the traditional solution with no currents. Further, Ye and Jeng [30] proposed the dynamic pressure that is applied to the seabed when it is paired with current and wave loadings:
P b ( x , t ) = ρ f g H 2 cosh κ d [ 1 ω 2 κ 2 H 2 2 ( U 0 κ ω 0 ) ] cos ( κ x ω t ) + 3 ρ f κ H 2 8 [ ω 0 ( ω 0 U 0 κ ) 2 ( sinh κ d ) 4 g κ 3 sinh 2 κ d ] cos 2 ( κ x ω t ) + 3 ρ f κ H 3 ω 0 ( ω 0 U 0 κ ) 512 ( 9 4 ( sinh κ d ) 2 ) ( sinh κ d ) 7 cos 3 ( κ x ω t ) = P 1 cos ( κ x ω t ) + P 2 cos 2 ( κ x ω t ) + P 3 cos 3 ( κ x ω t )

2.2. Seabed Module

Particle shape, density, stress and strain history, structure, and overconsolidation all significantly affect the mechanical properties of sandy seabeds. In addition, with different loading and drained conditions, the mechanical performance of sand is completely different. For example, loose sand is going to liquefy under cyclic loadings in undrained situations. In contrast, dense sand will not liquefy. Under drained conditions, loose sand will be compacted and not liquefied. Zhang et al. [27,28] and Ye et al. [31] suggested a cyclic mobility constitutive model based on notions of subloading [32] and superloading [33]. The suggested model is able to represent the physical properties of drained and undrained sand and clay under monotonic and dynamic loadings, as well as medium-density sand and clay cyclic mobility.
This cyclic mobility constitutive model contains eight parameters, with br, a, and m regulating the development rate of anisotropy, the structural loss rate, and the decay rate for overconsolidation, respectively. The remaining five parameters are identical to those in the Cam–Clay model. The physical interpretation of the three parameters is evident, so they can be determined easily by laboratory experiments [27,28,31,34,35]. The model was used in numerical assessments of various dynamic reactions [28,31,34,35,36,37,38,39].

2.3. Numerical Formulation

A two-phase theory fully coupled with u-p formulation [40,41] is applied in dynamical finite element valuation of sandy seabeds. In saturated soil, pore water pressure is denoted as p and soil deformation as u. The u-p model assumes infinitesimal strain, minor temporal and spatial variations in void ratio relative to other variables, negligible relative acceleration between soil and pore water compared to within the soil, and incompressible soil particles. Equations (8) and (9), respectively, represent the continuity equation and the equilibrium equation.
ρ u ¨ i s = σ i j x j + ρ b i
ρ f ε ¨ i i s 2 p d x i x i γ w k ( ε ˙ i i s n 1 K f p ˙ d ) = 0
where ρ represents the soil density, us denotes the soil displacement, ρf stands for fluid density, εsii is the volumetric strain of soil skeleton, pd denotes the pore water pressure, γw represents the unit weight of the pore fluid, k stands for the permeability coefficient, Kf stands for the volumetric compressibility of the fluid, and n denotes the volumetric compressibility of the soil porosity.
Based on the above u-p fully coupled dynamic analysis theory, in this paper, a hybrid scheme of finite element and finite difference (FE-FD) is employed for discretizing Equations (8) and (9) in space. Under the (FE–FD) hybrid scheme, the displacements of solids are discretized using the finite element approach, and the excess pore pressures of liquids are calculated using the finite difference approach. Specific formulation and the validation of accuracy can be obtained in Jeng and Ou [42]. On the basis of the FE-FD hybrid scheme, Ye et al. [35] created a program called DBLEAVES, which conducts finite element analysis in both 2D and 3D for static and dynamic scenarios. Subsequently, numerous studies have confirmed the program’s precision and usefulness [34,37,38,39,43].

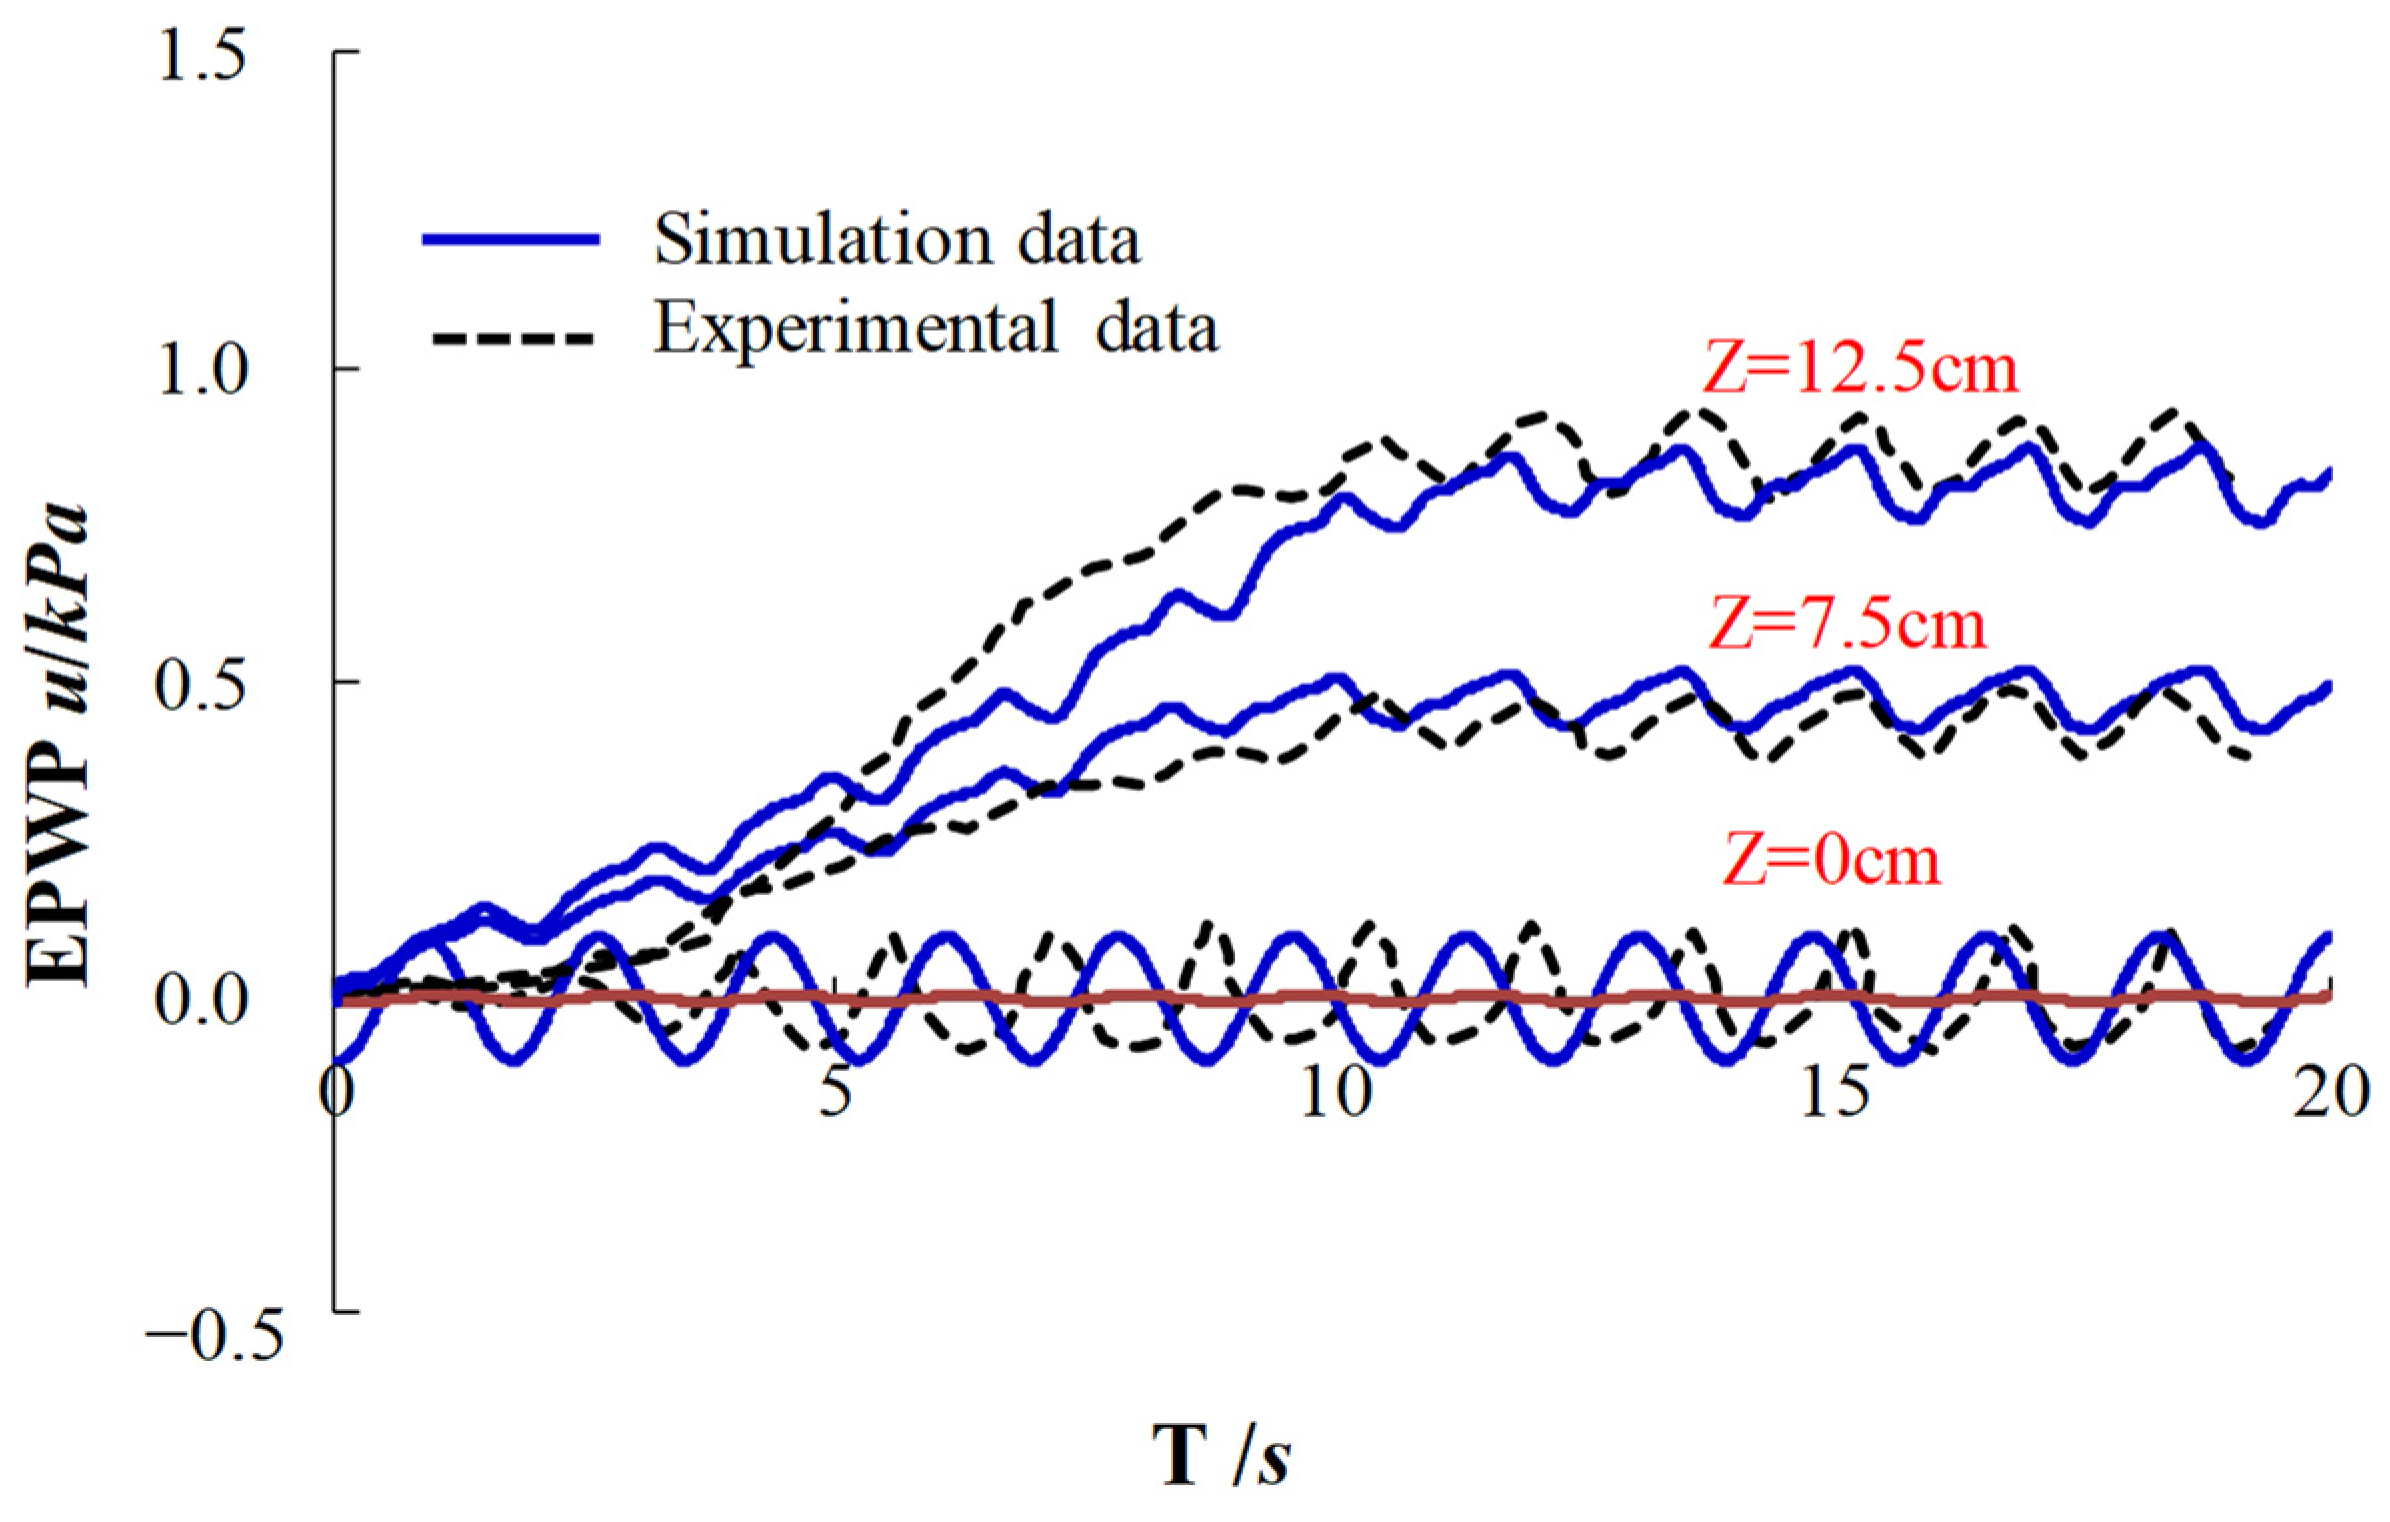
2.4. Model Validation

In this part, the experimental findings of Sumer et al.’s reservoir trial [12] are used to validate the model’s accuracy and numerical analytic methodologies. Figure 1 depicts the modeling and experimental results of EPWP (excessive pore water pressure at three depths, Z = 0 cm, 7.5 cm, and 12.5 cm). It can be shown that the mathematical findings match the tests in terms of EPWP buildup at various depths as well as EPWP vibration following liquefaction. From a holistic perspective, this model effectively simulates the trends and magnitudes of experimental data, exhibiting high accuracy. The differences between simulated results and experimental data, particularly at depths of 7.5 cm and 12.5 cm, are shown in Figure 1. The main reasons include the following: The wave generator cannot produce ideal regular waves. Model experiments are subject to boundary effects, and currently, these effects cannot be completely eliminated. Boundary effects are also difficult to quantify. In this finite element study, the model size reaches 100 m with the aim of minimizing the influence of boundary effects as much as possible.

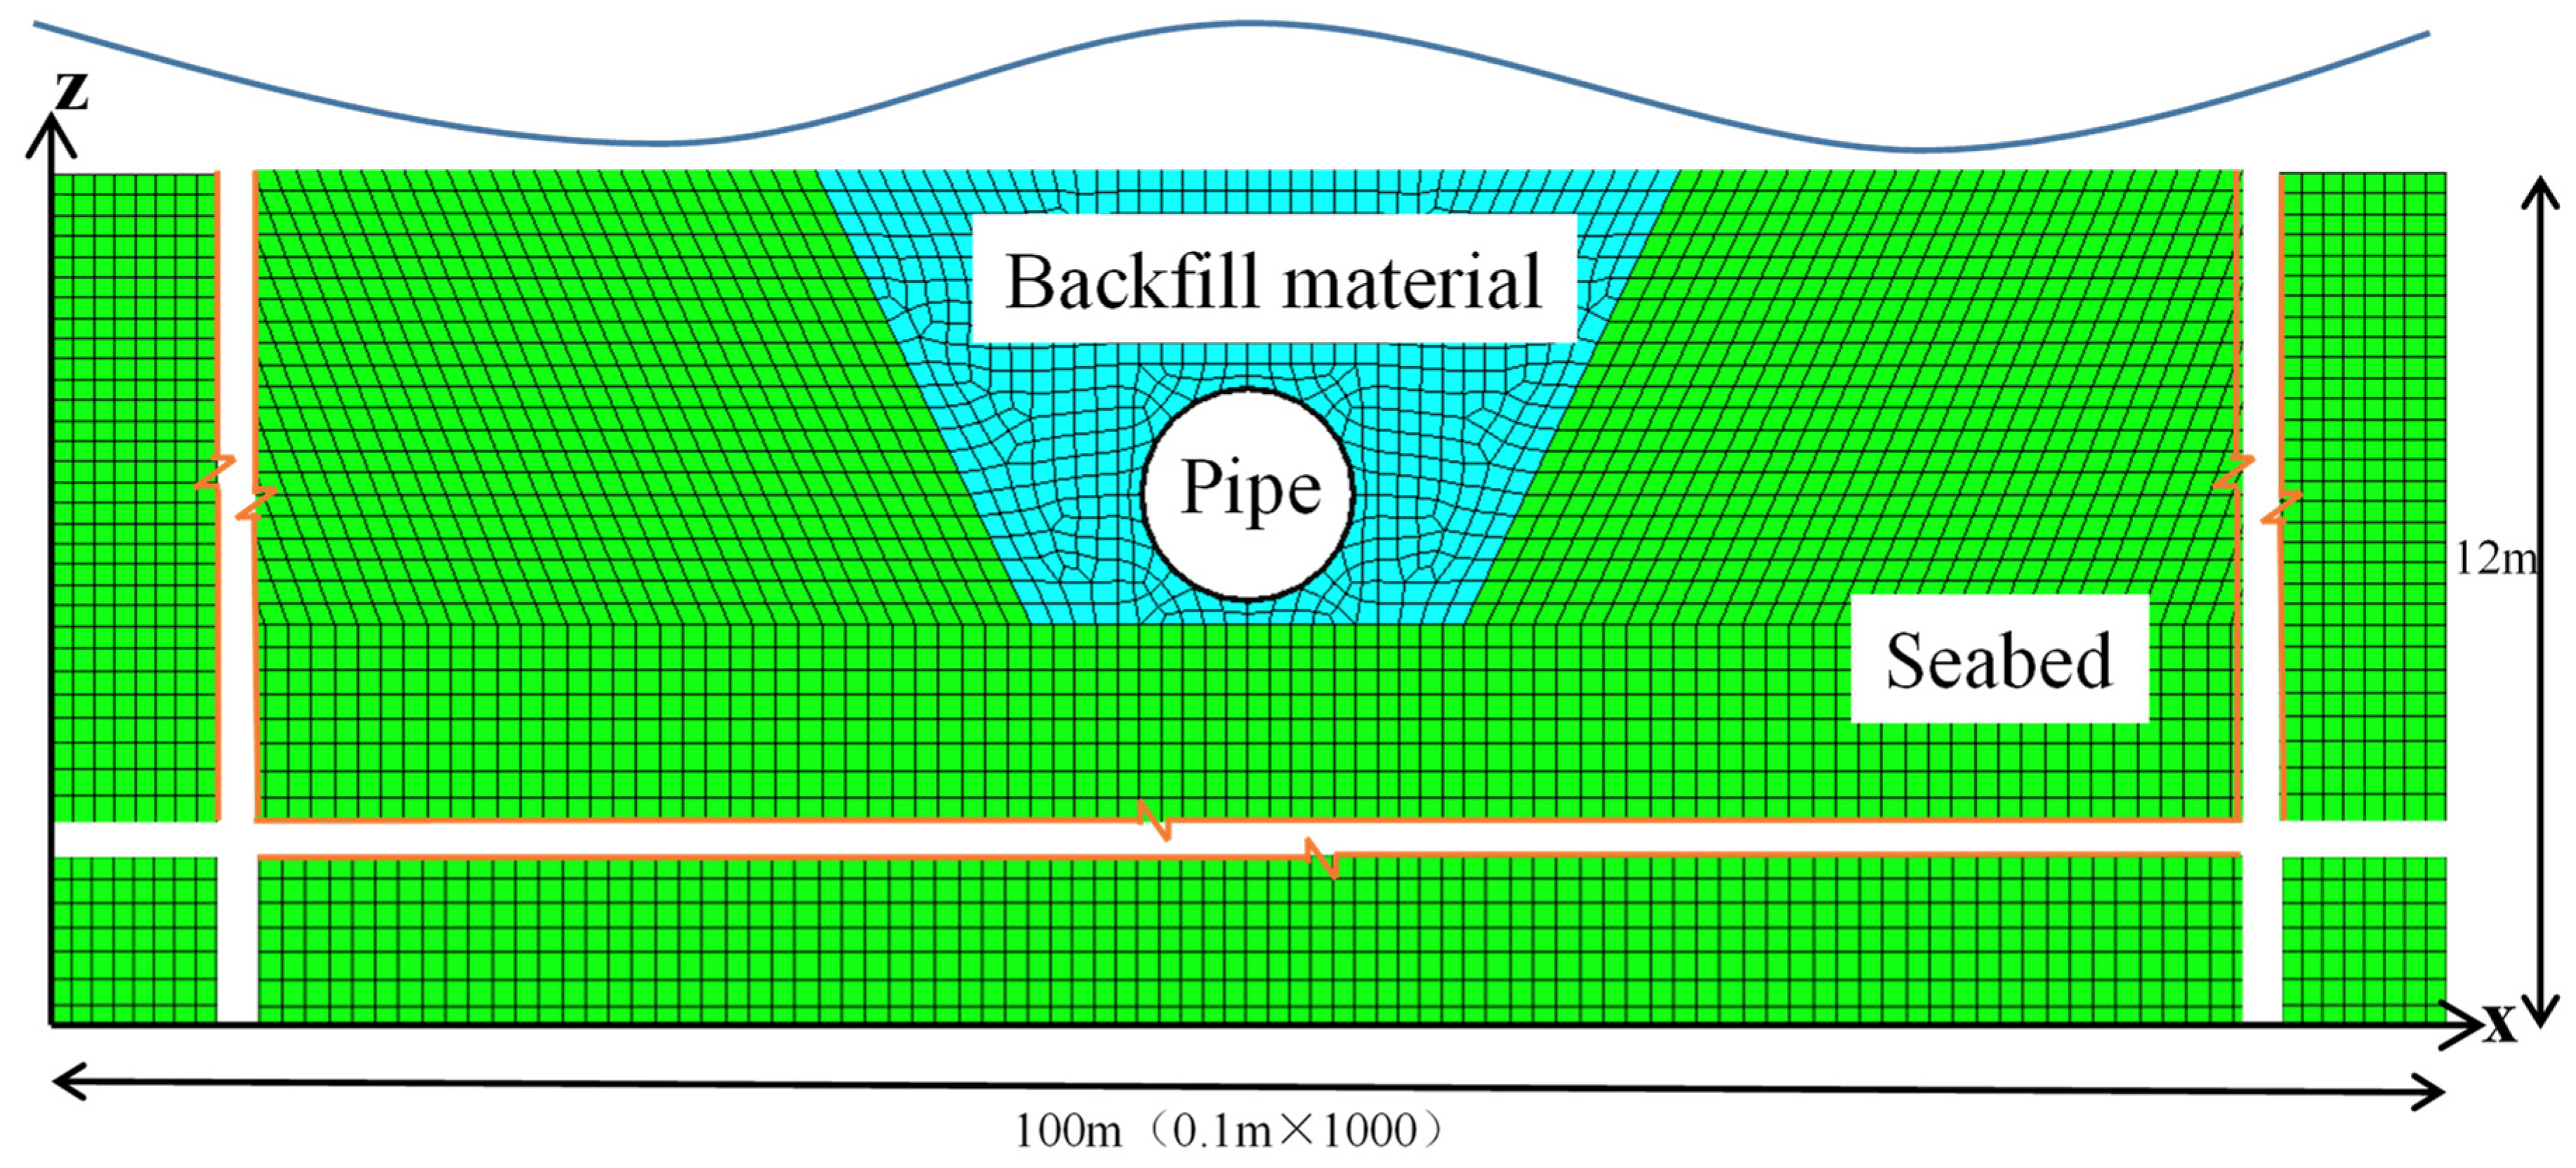
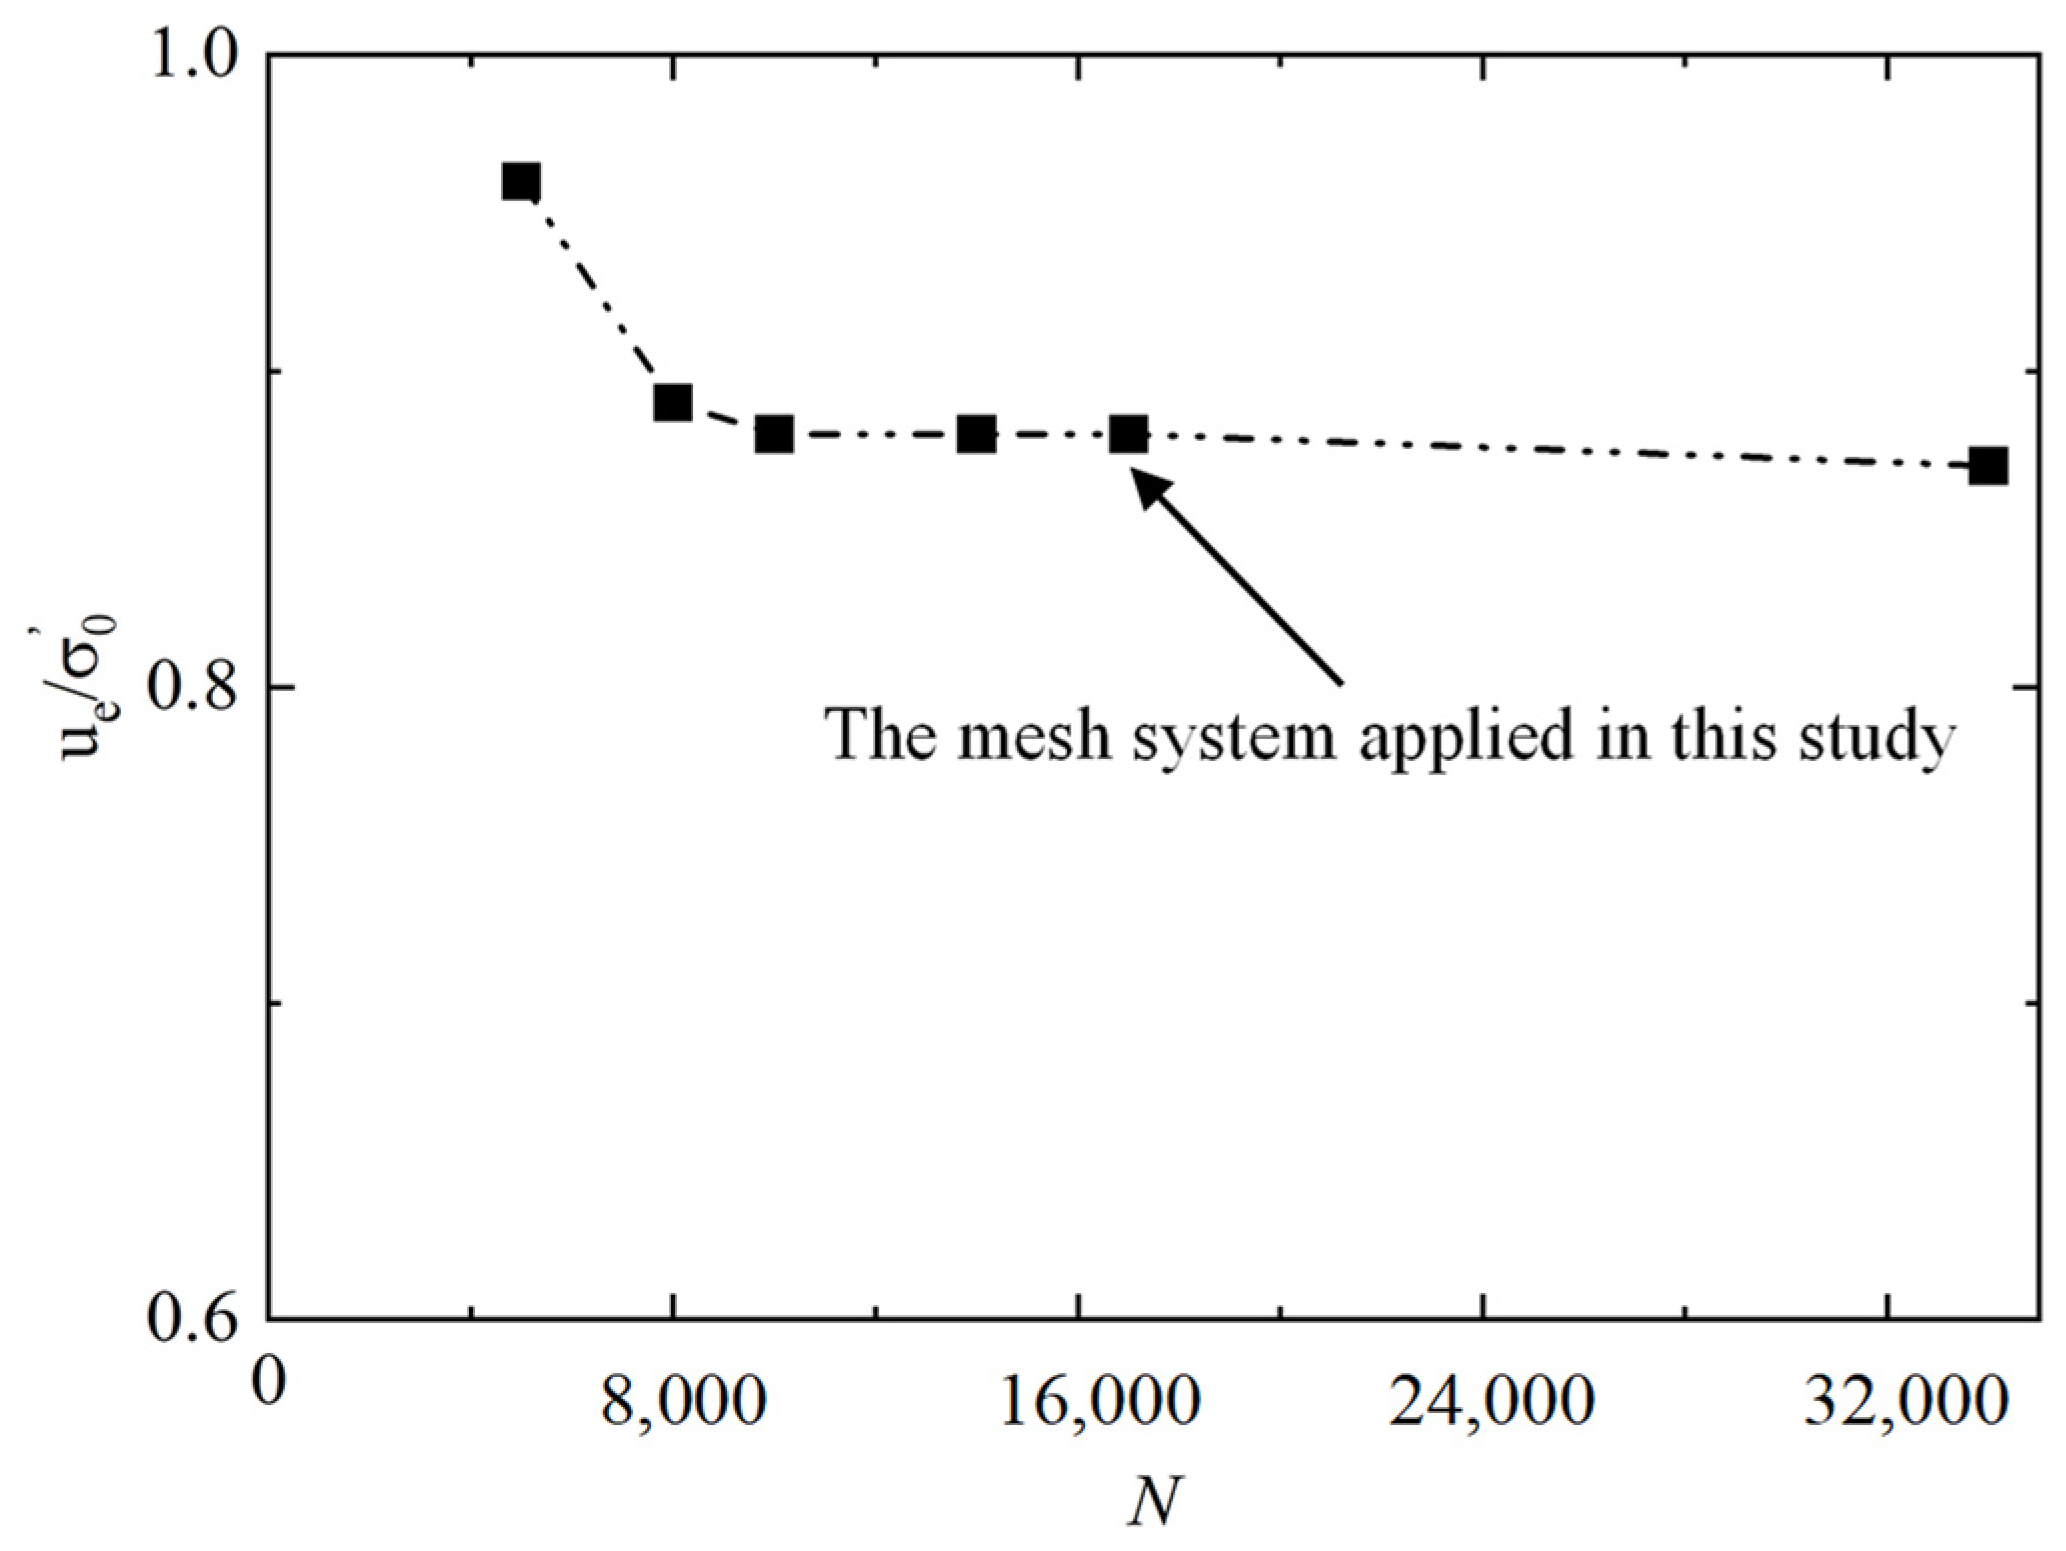
2.5. FEM Model and Boundary Assumptions

Figure 2 illustrates the seabed-pipeline model with a single layer of sandy seabed. The 2D model presents dimensions of 12 m in height and 100 m in width. The boundaries on the right and left are constrained in the X-axis direction and are limitless along the Z-axis. The lower boundary is secured in both the X and Z directions. Figure 3 depicts the maximum excess pore pressures induced by waves as well as currents on the seabed element positioned at the pipeline base, analyzed across various mesh mechanisms denoted by the entire amount of elements N, in which ue represents maximum excess pore pressure and σ’0 signifies beginning effective stress. The outcomes depicted in Figure 3 showcase that the mesh system attains a commendable level of computational precision.
Fully buried pipelines are typically distributed along the coast. Therefore, this study employed actual observed wave data characteristic of ocean stations. The specific load parameters are as follows: wave height H = 1 m; water depth d = 10 m; wave period T = 5 s; the velocity of the current u = 1 m/s. As obtaining soil samples offshore is very challenging, the soil parameters in this study were chosen from widely cited standard sand parameters in the literature [28]. The Toyoura sand, which is widely applied to the liquefaction related model and element tests, simulates the sandy seabed. The parameters of the backfill soil have the same properties as the original seabed soil, except for the permeability coefficient. Table 1 displays the input parameters for numerical modeling, unless otherwise indicated. The pipeline parameters were selected based on actual engineering cases. The density of the steel pipeline is ρ = 7.85 × 10³ kg/m3 and the pipeline is assumed to be filled with water (ρ = 1.0 × 10³ kg/m3). The specific gravity of pipes included in the contents (the ratio of the gravity of pipes to the gravity of water) is 1.51, while the specific gravity of the seabed is 1.9.

3. Results and Discussion

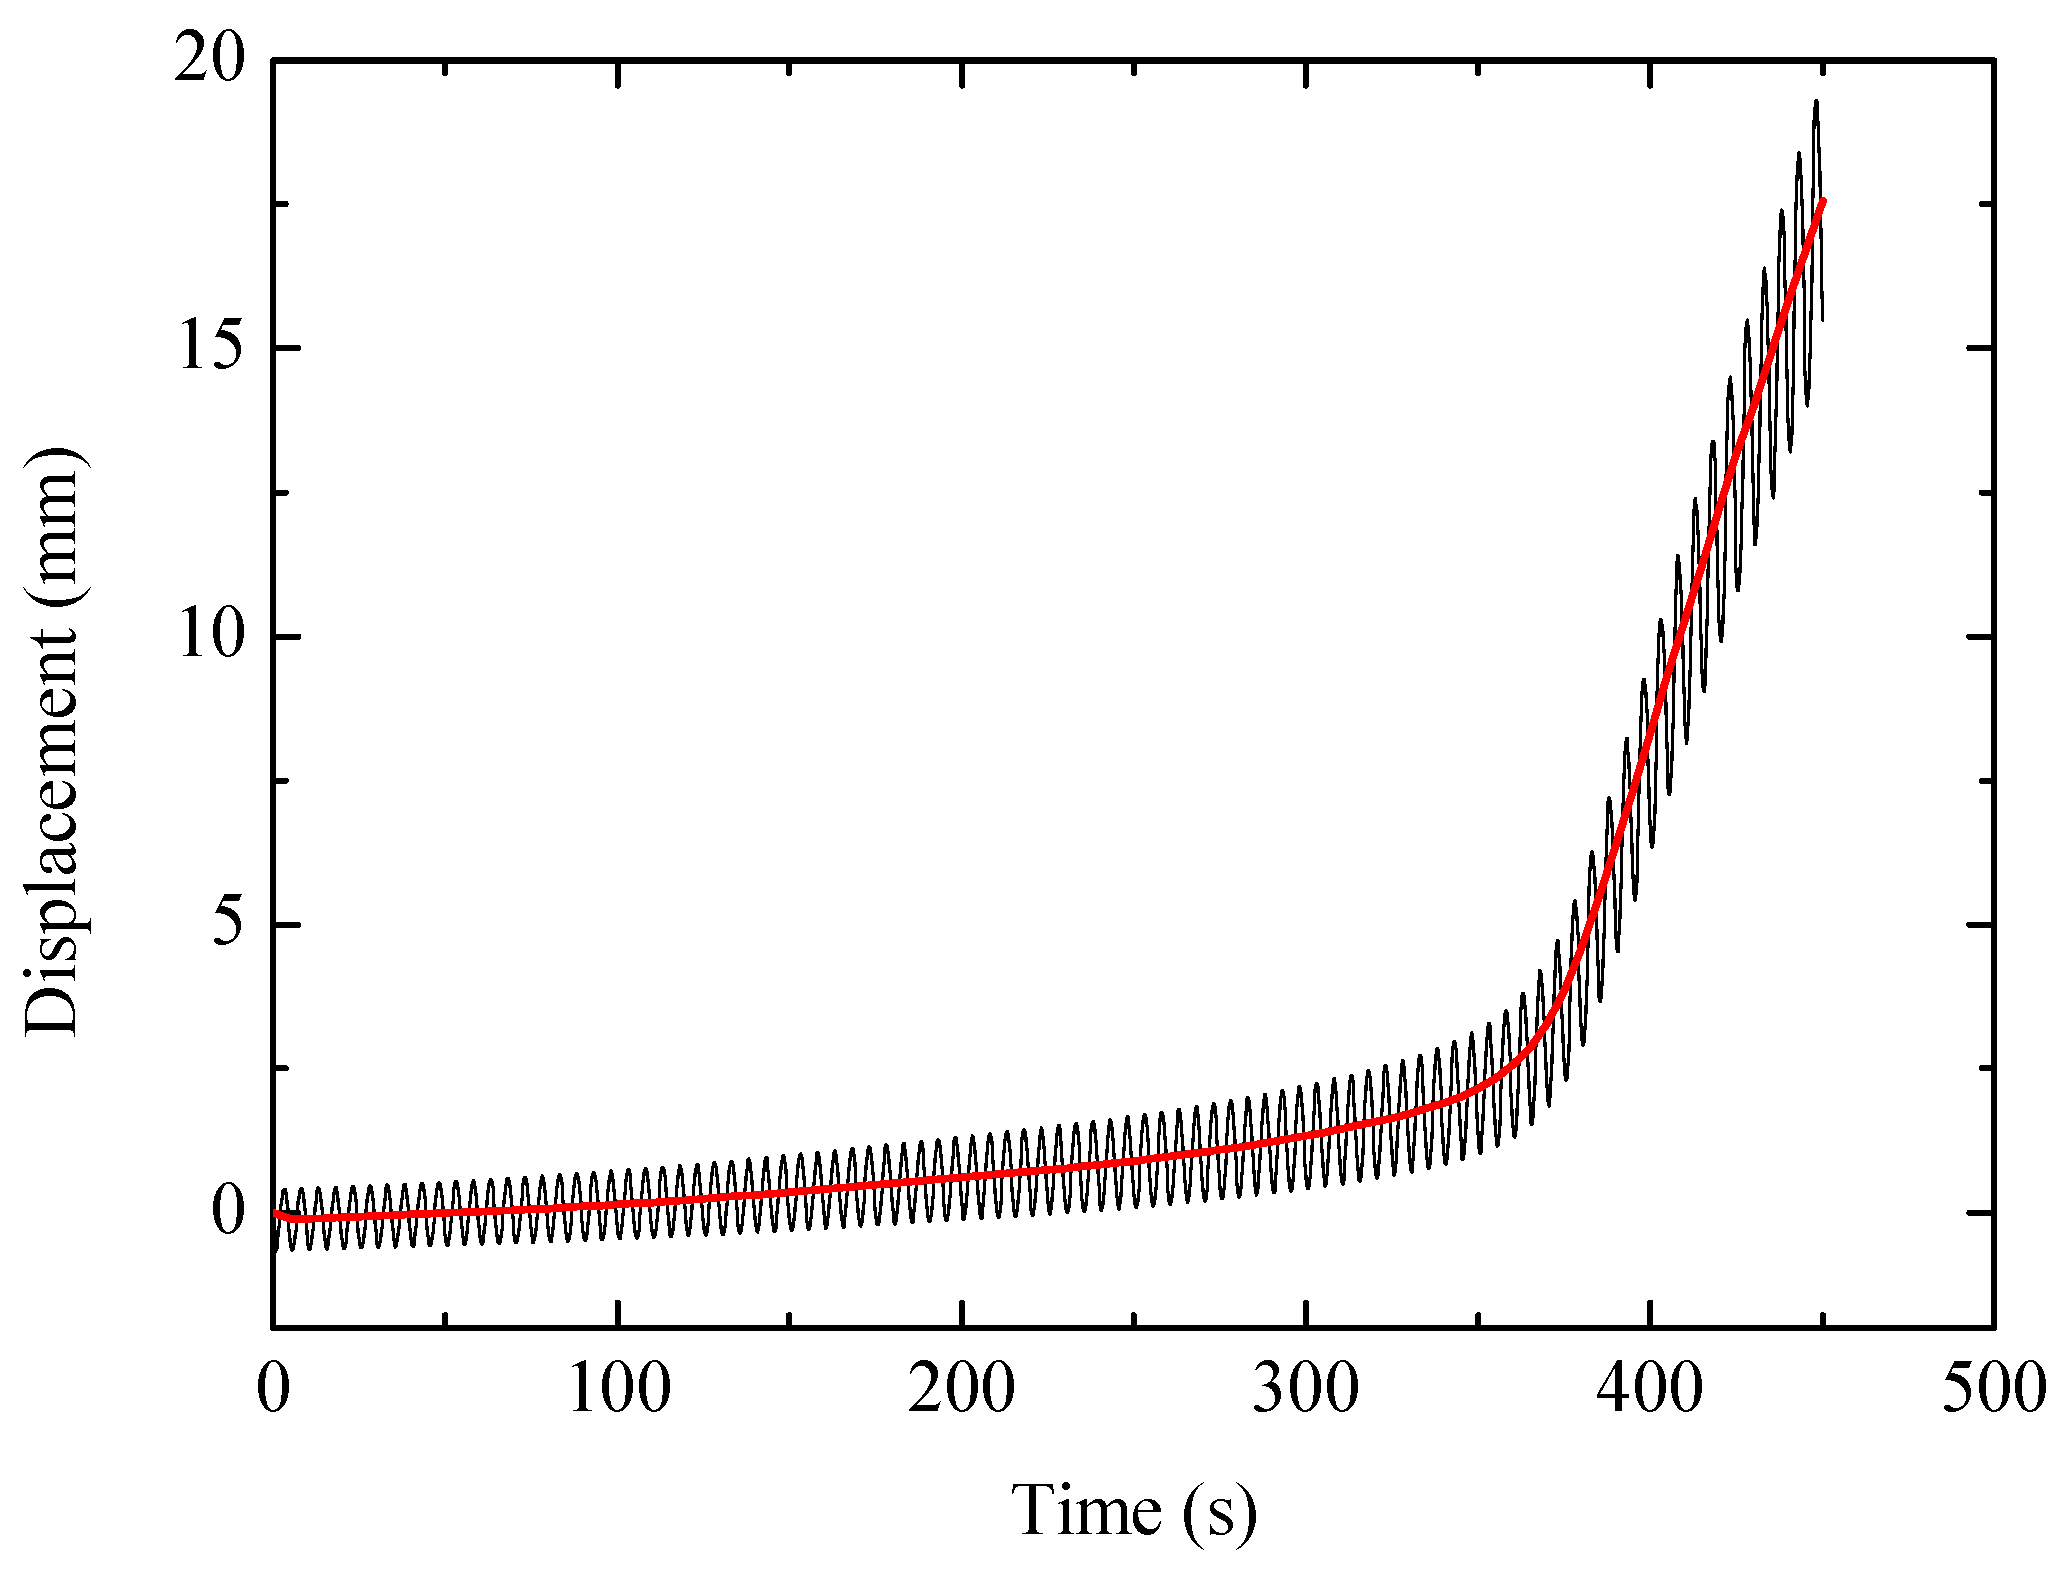
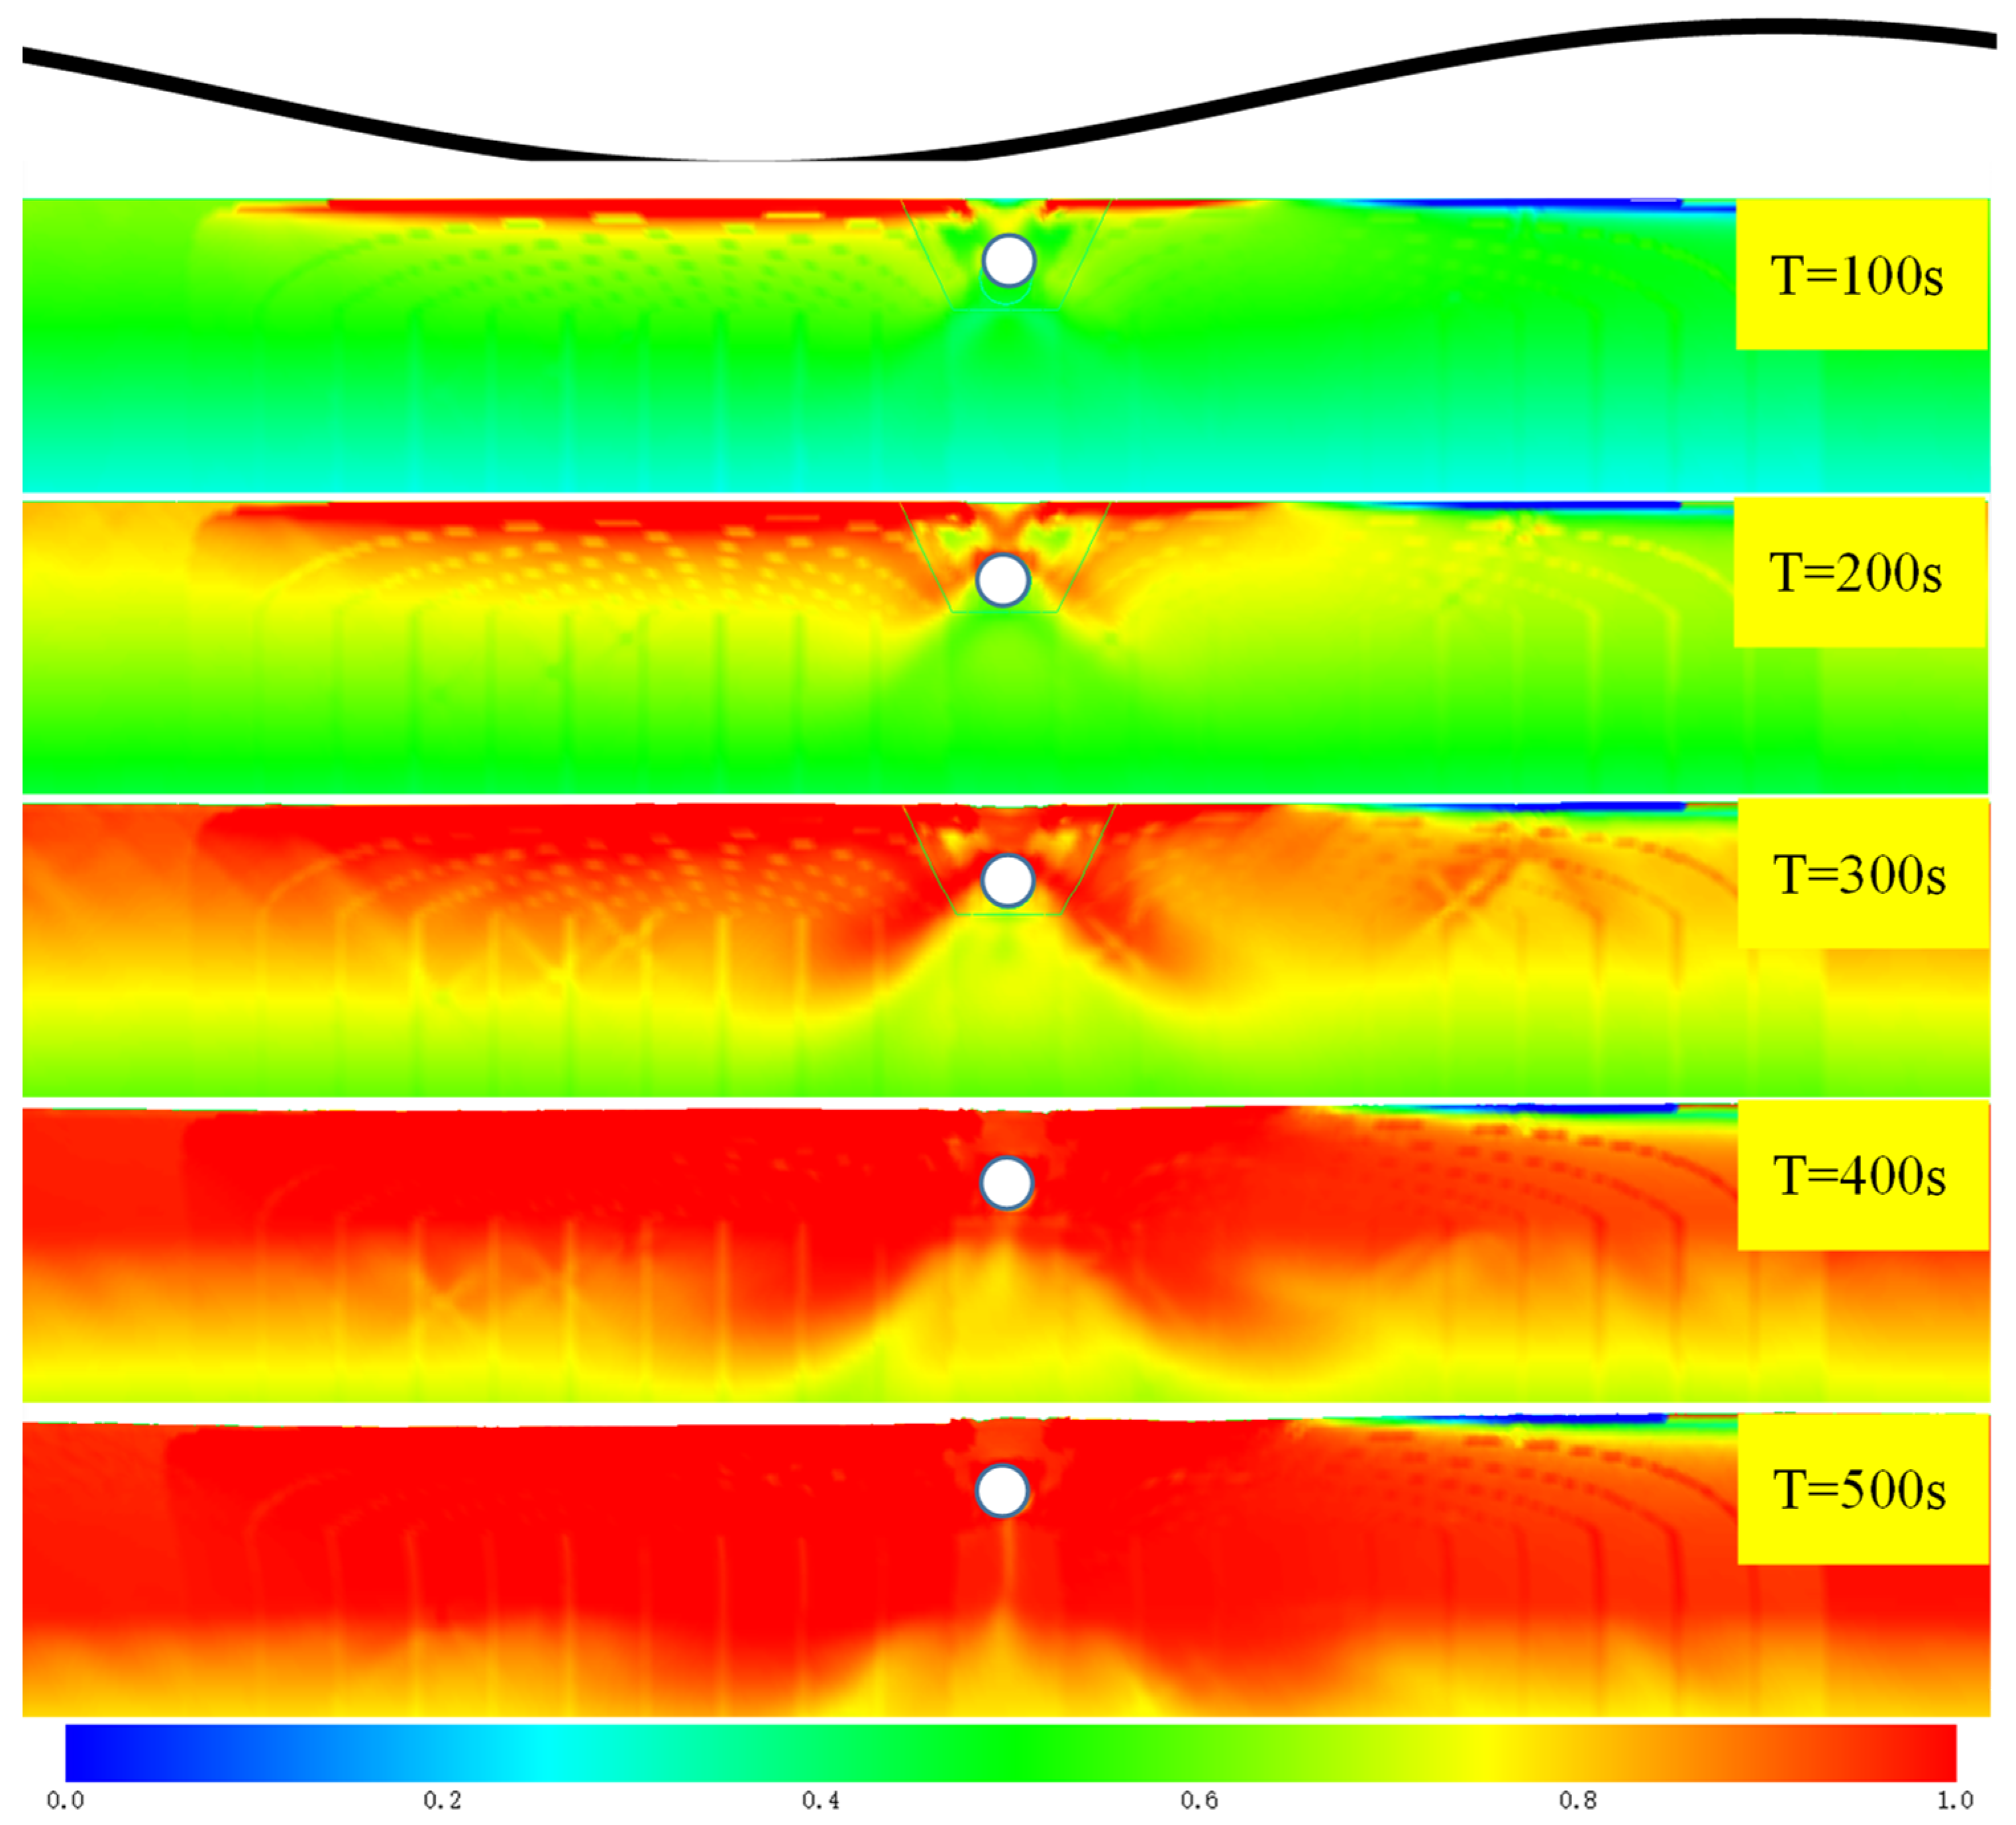
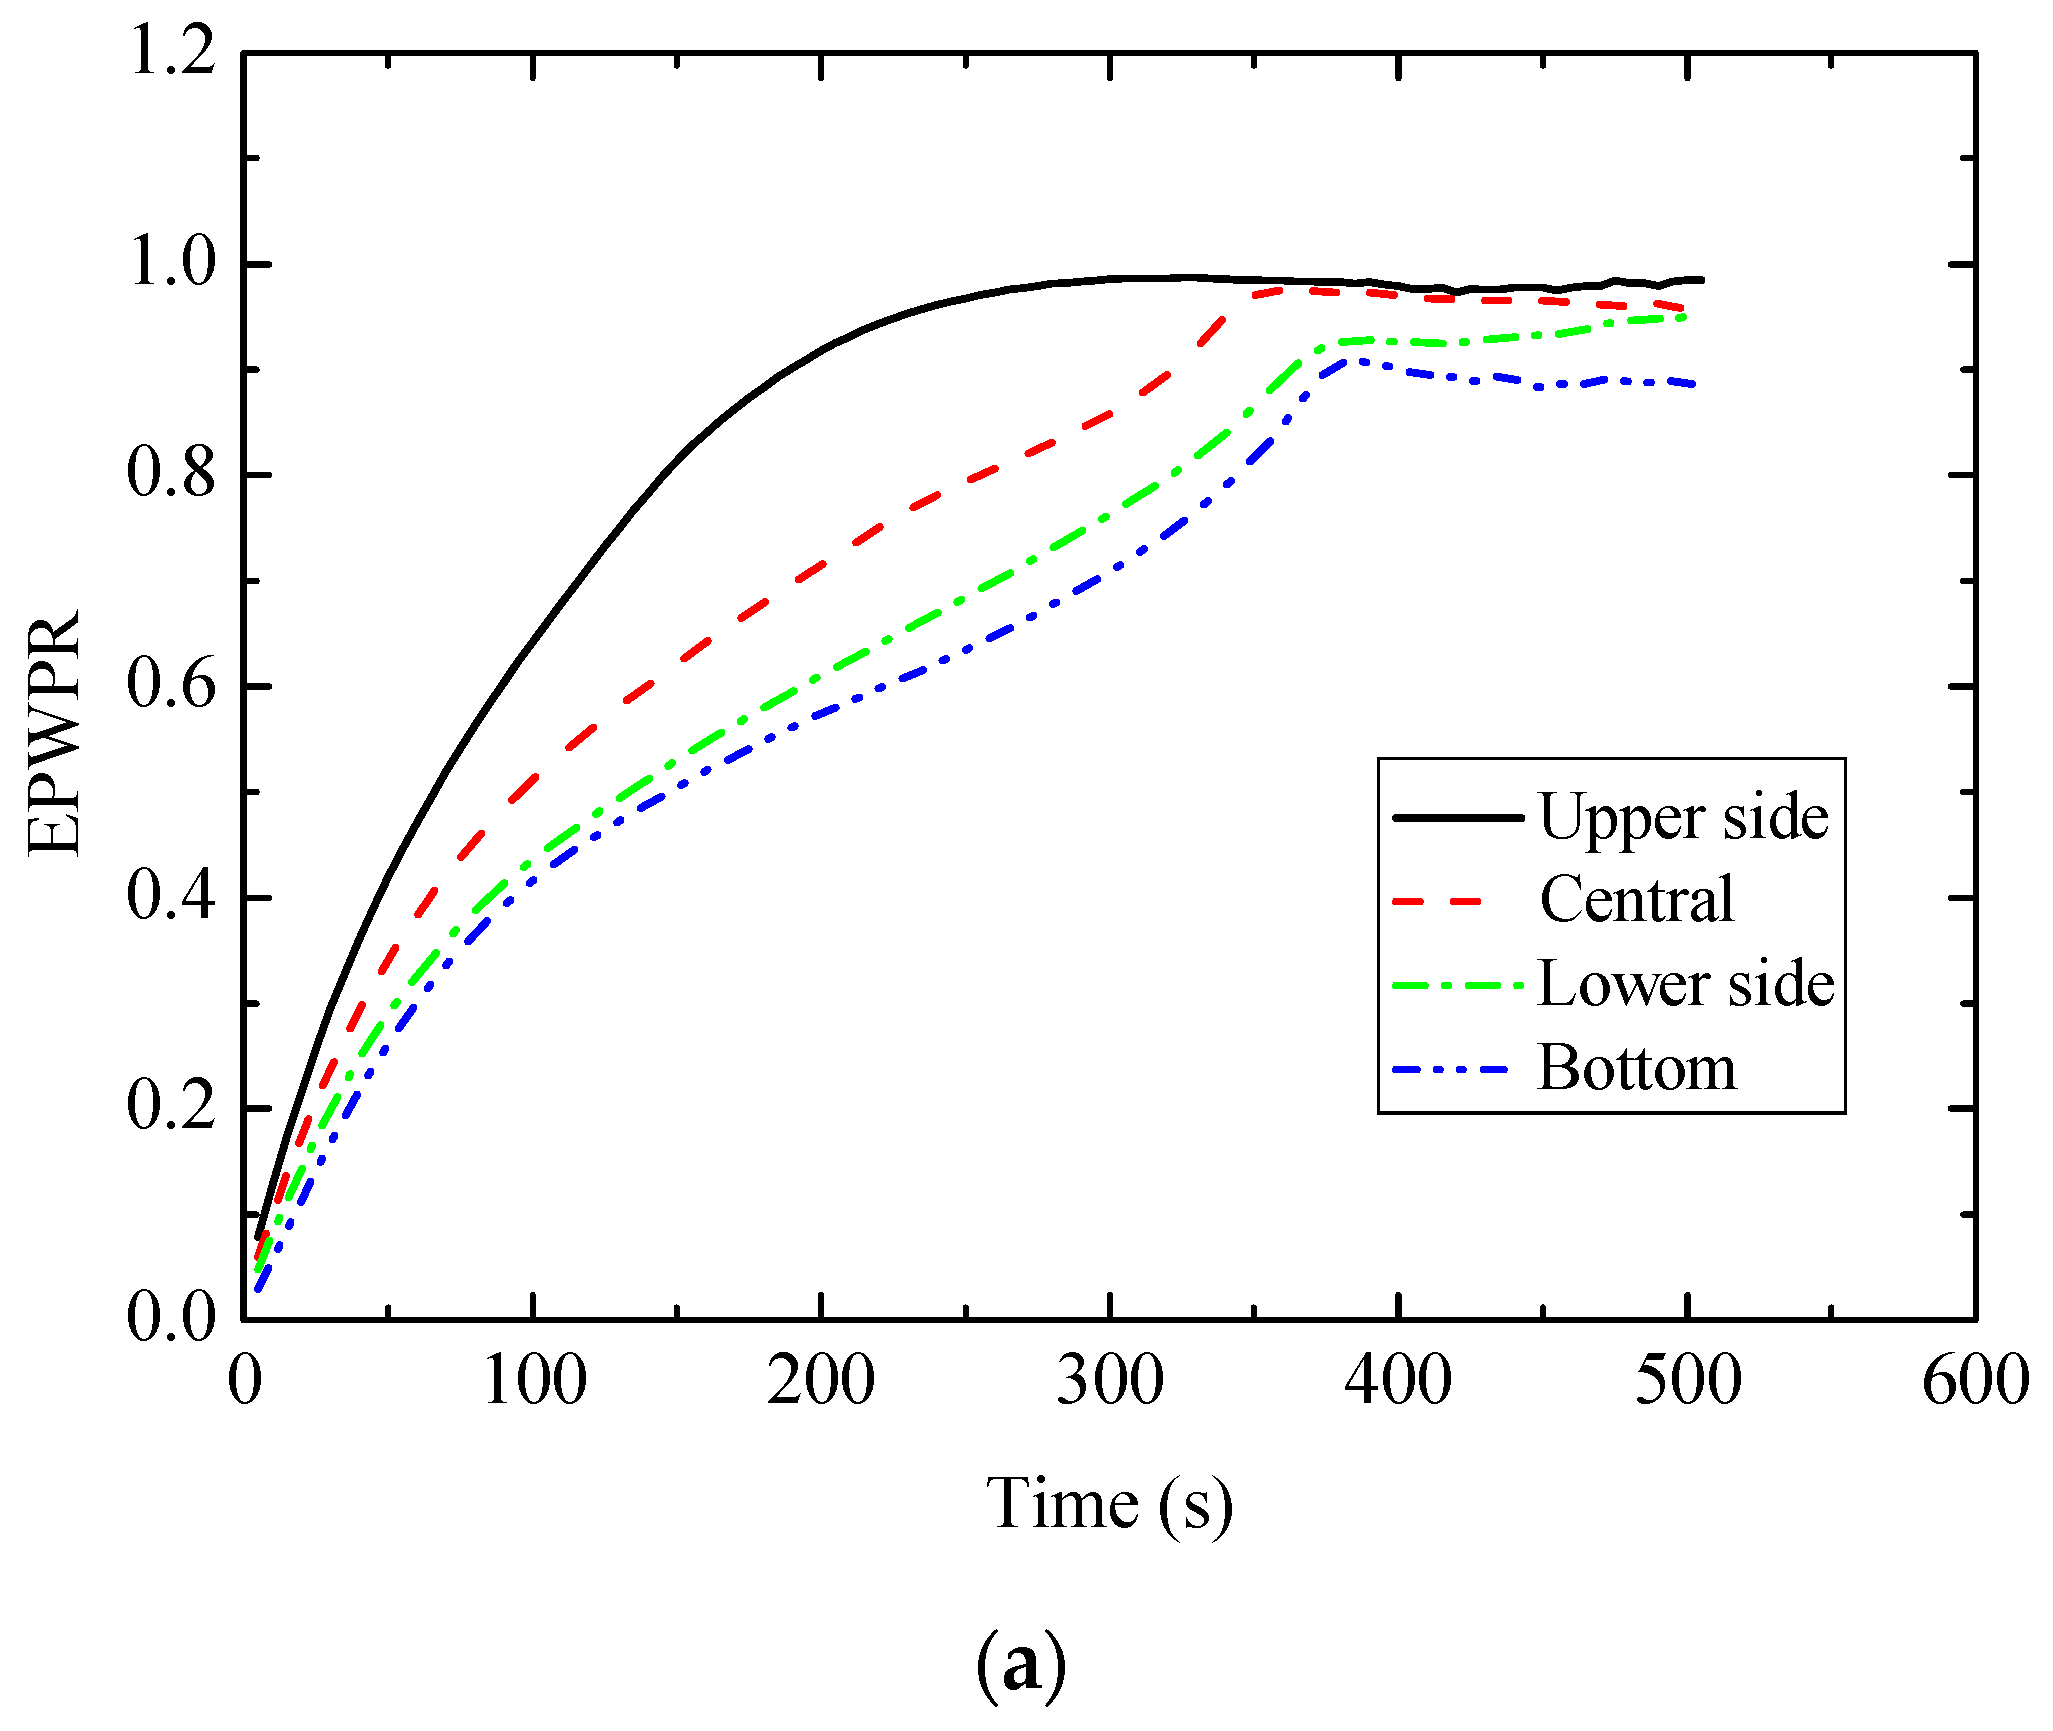
3.1. Floatation of Pipeline and Development of EPWPR in Seabed

The node displacement at the bottom of the simulated pipeline is used as the analysis object to analyze the floatation of pipelines, as pipelines could be treated as rigid bodies compared with seabed soil. Figure 4 depicts the pipeline’s floating displacement over time. It is evident that when combined wave and current loadings are applied, the pipeline floats and oscillates. For the convenience of subsequent analysis, the midpoint of the displacement of each oscillation cycle is taken as the pipe displacement in one cycle. There are two stages to pipeline floatation. During the initial stage, the pipeline floats slowly with the cyclic loading. When the loading time reaches 350 s, the pipeline floating displacement reaches the inflection point and enters the second stage, and the floating displacement increases rapidly. This agrees with results of wave flume experiments by Sumer et al. [44], and existing experiments show that pipelines will eventually float to the seabed surface. According to Figure 5, the displacement vectors of the seabed are changed by the pipeline. The displacement vectors of the soil above the seabed pipeline exhibit significant undulations, which indicates substantial influence by wave-induced dynamic loads. The soil located in front of and beneath the pipeline exerts an upward-angled thrust on the pipeline. The overall horizontal displacement direction aligns with the water flow direction.
By analyzing the mechanical equilibrium conditions of fully buried pipelines, it is determined that the buoyant force acting on the pipeline is equal to the sum of the pipeline’s weight and the downward restraining force exerted by the soil. Since the buoyant force and the weight remain constant, when the soil’s restraining force on the pipeline decreases, the pipeline will undergo buoyancy. Under cyclic dynamic loading, the seabed undergoes liquefaction, resulting in a decrease in its density and shear strength, thereby causing a reduction in the restraining force exerted by the seabed on the pipeline. To analyze the reason for the floatation inflection, it is necessary to conduct research on the liquefaction around the pipeline. In this paper, EPWPR (excess pore water pressure ratio) is utilized to denote liquefaction levels. In general, considering both numerical stability and generality, EPWPR ≥ 0.95 is applied as the liquefaction standard.
Figure 6 depicts the evolution of the liquefaction area. It is evident that the direction of soil liquefaction around the seabed pipeline is predominantly downward. The liquefaction rate of the soil above the seabed pipeline is greater than that of the soil below it. Furthermore, for loading times less than 300 s, the soil beneath the seabed pipeline does not exhibit liquefaction. This conclusion is consistent with the observations shown in Figure 4. Since the permeability coefficient of the soil used for backfill in the trench is larger than that of the seabed, the degree of liquefaction of the trench at the same depth is smaller than that of the seabed. The degree of liquefaction above the pipeline surpasses that observed on its sides, primarily attributed to the impermeable and rigid characteristics of the pipeline. At the same time, a hard-to-liquefy area is formed under the pipeline. The area is approximately 45 degrees around the midpoint of the pipeline. The EPWPR of the soil under the pipeline is notably lower compared to that of the seabed at equivalent depths and under the same period. With the further action of the wave and current loadings, all the soil around the pipeline finally liquefies.
Figure 7a summarizes the temporal progression of the EPWPR for soil elements at various positions encircling the pipeline. Positions of these elements are shown in Figure 7b. It can be observed that the upper EPWPR develops the fastest, followed by the central, lower, and bottom sections. As the loading time progresses, the difference in EPWPR between the upper section and other areas gradually increases. This indicates that the buoyant force exerted on the pipeline continues to increase. At 350 s, the soil in the middle begins to liquefy, and the pressure of the soil on the upper part of the pipeline drops to 0, which causes the pipeline to rise faster. Meanwhile, an inflection point appears on the floating displacement curve of the pipeline. This is because after the pipeline floats, there is a redistribution of stress in the surrounding soil, leading to subsequent stabilization.
Figure 8 illustrates the effective stress path of seabed elements 10 m from the pipeline and soil elements at different positions around the pipeline. The effective stress path of soil is an important tool in the field of geotechnical engineering for studying the mechanical properties and behavior of soil. By analyzing the effective stress path, engineers can better understand and predict the performance of soil under different stress conditions, thereby guiding the design and construction of actual engineering projects.
The effective stress path of seabed element shows that shear stress σxy oscillates under cyclic wave–current loadings, and the mean effective stress σm reduces. The effective stress path finally attains a stable state called cyclic mobility, which is a characteristic mechanical feature of liquefied soil. Compared with the seabed element, the effective stress path of upper side soil element surrounding the pipe slopes to the right, which means that the mean effective stress σm raises the shear stress σxy under the wave and current loadings. This is caused by boundary constraints provided by the pipeline, which strengthen soil around the pipeline, accelerate the dissipation of excess pore water pressure, and increase σm. The effective stress path of the soil element in the lower part of the pipeline is similar to that of the remote seabed element, except for the shape at failure. From the perspective of shear stiffness, the rightward inclination of the effective stress path in the upper soil element indicates a reduction in shear stiffness. This suggests that the pore water pressure in the upper soil accumulates more rapidly than in the lower soil. Based on the final area and shape of the hysteresis loops in various sections, the inclined and thinner final hysteresis loop area in the upper soil element indicates a greater degree of softening compared to the lower soil. The analysis of the effective stress path, when combined with this study, corroborates the accuracy of the soil dynamic constitutive model selected.

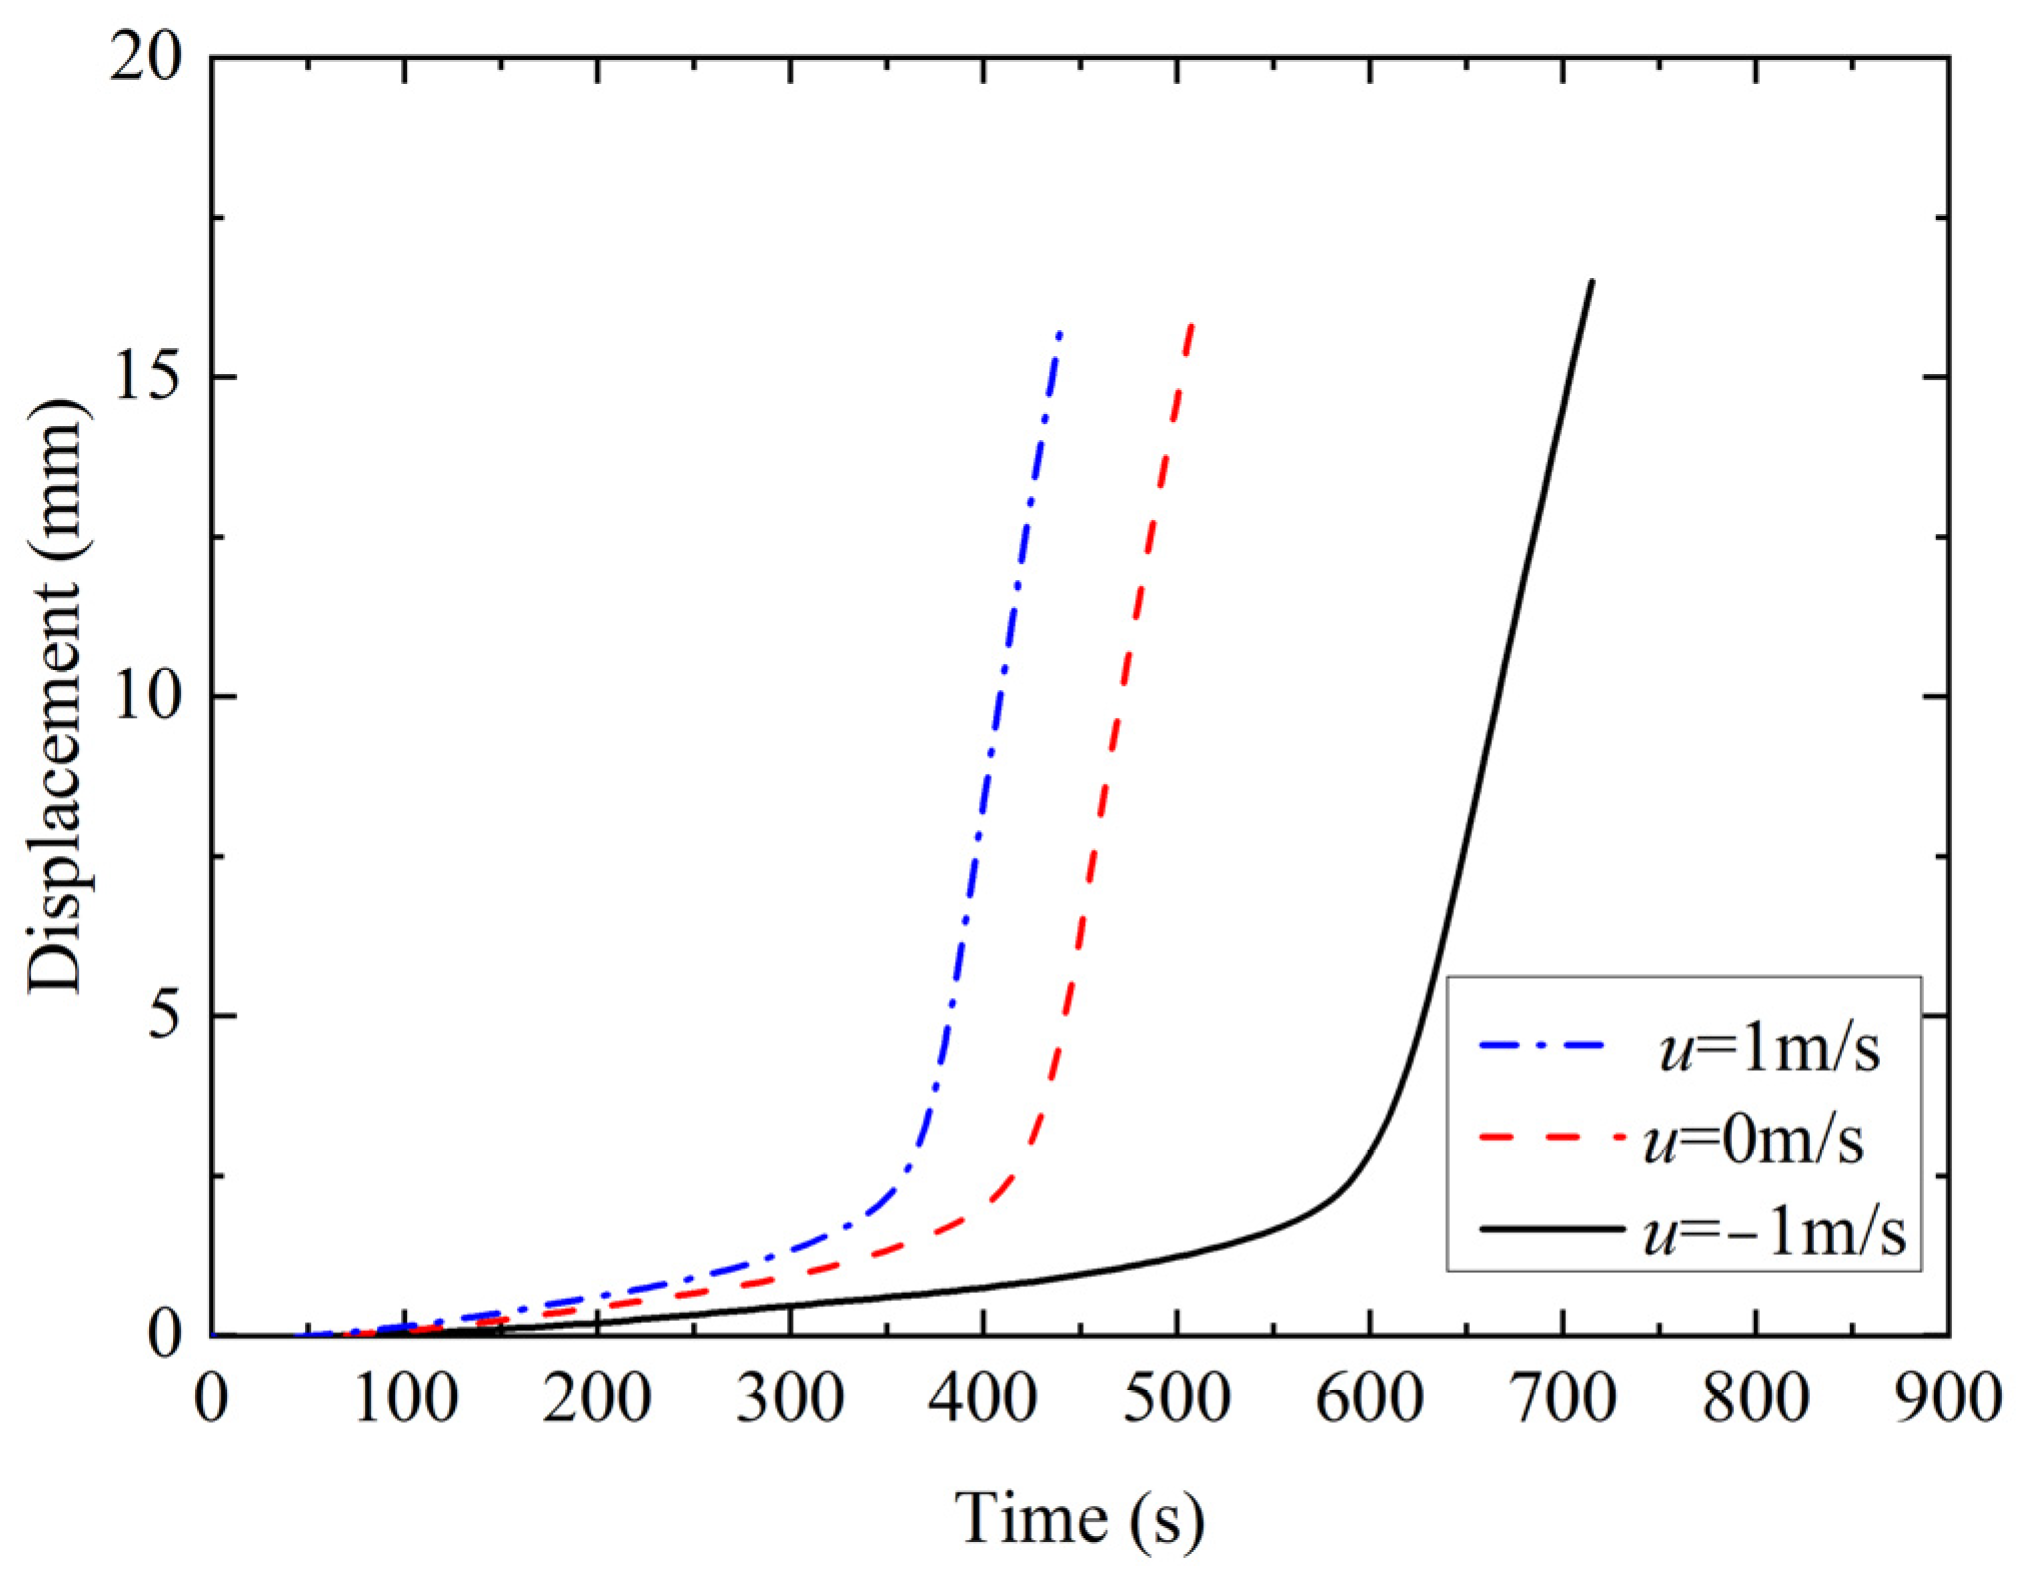
3.2. Influence of Current and Wave Characteristics

Existing research [5] indicates that a current is crucial to the dynamic response when subjected to the effects of waves and currents. Thereby, three velocities of current (u = +1 m/s, 0 m/s, −1 m/s) are picked out to explore the effect of currents on the pipeline’s floatation. In the case where u = 0, there is no current; for u < 0, the current opposes the direction of the wave; and for u > 0, the current aligns with the wave’s direction. The temporal records of the pipeline’s floating displacement at varying current velocities are presented in Figure 9. All the floatation of the pipeline goes through two stages, the steady rise stage and the accelerated rise stage. According to fluid mechanics theory, the buoyant force exerted by fluid flow on the pipeline is directly proportional to the square of the flow velocity. The higher the fluid flow velocity, the greater the propensity for pipeline buoyancy to occur. The results show that the floating displacement for u = +1 m/s is larger than that for u = −1 m/s, because the current velocity travelled in the wave’s direction increases the wave pressure transmitted to the seabed, accelerating the liquefaction of the soil surrounding the pipeline. As a result, the buoyant force acting on the pipeline increases, leading to flotation. The distributions of the maximum EPWPR below the pipeline (specifically along the vertical line across the center of the pipeline) under various current velocities are shown in Figure 10. The maximum EPWPR of the soil continues to decrease as the depth increases. As the depth of the soil layer increases, the energy transmitted by wave and currents continuously attenuates, consequently diminishing its effect on pore pressure. In addition, the increase in current velocity leads to higher EPWPR, which indicates deeper liquefaction range.
Generally, wave characteristics have a considerable influence on seabed dynamic response. Wave period (T) can influence the effective stress and excess pore water pressure in the seabed by affecting wave length (L), and wave height (H) is able to directly affect the wave pressures on the seabed. Parametric research is performed to examine the impact of wave period (T) on the floatation of pipeline with wave period (T) ranging from 3 s to 6 s with a 1 s gap. Figure 11 shows a visual representation of the pipeline’s floating displacement over time and distributions of the maximum EPWPR below the pipeline with different wave periods (T). The findings indicate that an increase in the wave period leads to a rise in the pipeline’s floating displacement and, consequently, an increase in the wave pressures exerted on the seabed. As the wave period grows, so too does its influence on the maximum EPWPR. However, as the wave period increases, its effect on the seabed does not proportionally increase. Instead, it undergoes a continuous weakening process. Figure 11b also demonstrates that the maximum EPWPR of the trench soil is lower than that of the natural seabed below the trench with a wave period of three seconds. This is because the permeability of the trench is higher than that of the seabed, indicating that increasing permeability coefficient of the trench can slow down the liquefaction of the soil around the pipelines.
Figure 12 depicts the temporal history of the pipeline floating displacement and distributions of the maximum EPWPR below the pipeline with different wave height (H = 2.0 m, 1.5 m, 1.0 m, 0.5 m). As the wave height increases, both the floating displacement of the pipeline and the maximum EPWPR in the seabed increase. And there is not a significant change in pipeline displacement and the maximum EPWPR when the wave height is 1.5 m compared to when it is 2 m. As the wave height continues to increase, its impact on the seabed does not proportionally increase but, rather, undergoes a diminishing effect. When wave height H = 0.5 m, which means the wave pressure is the smallest, the highest EPWPR in the trench soil is, likewise, lower than that of the natural seabed below the trench.

3.3. The Effect of the Backfill Soil’s Permeability
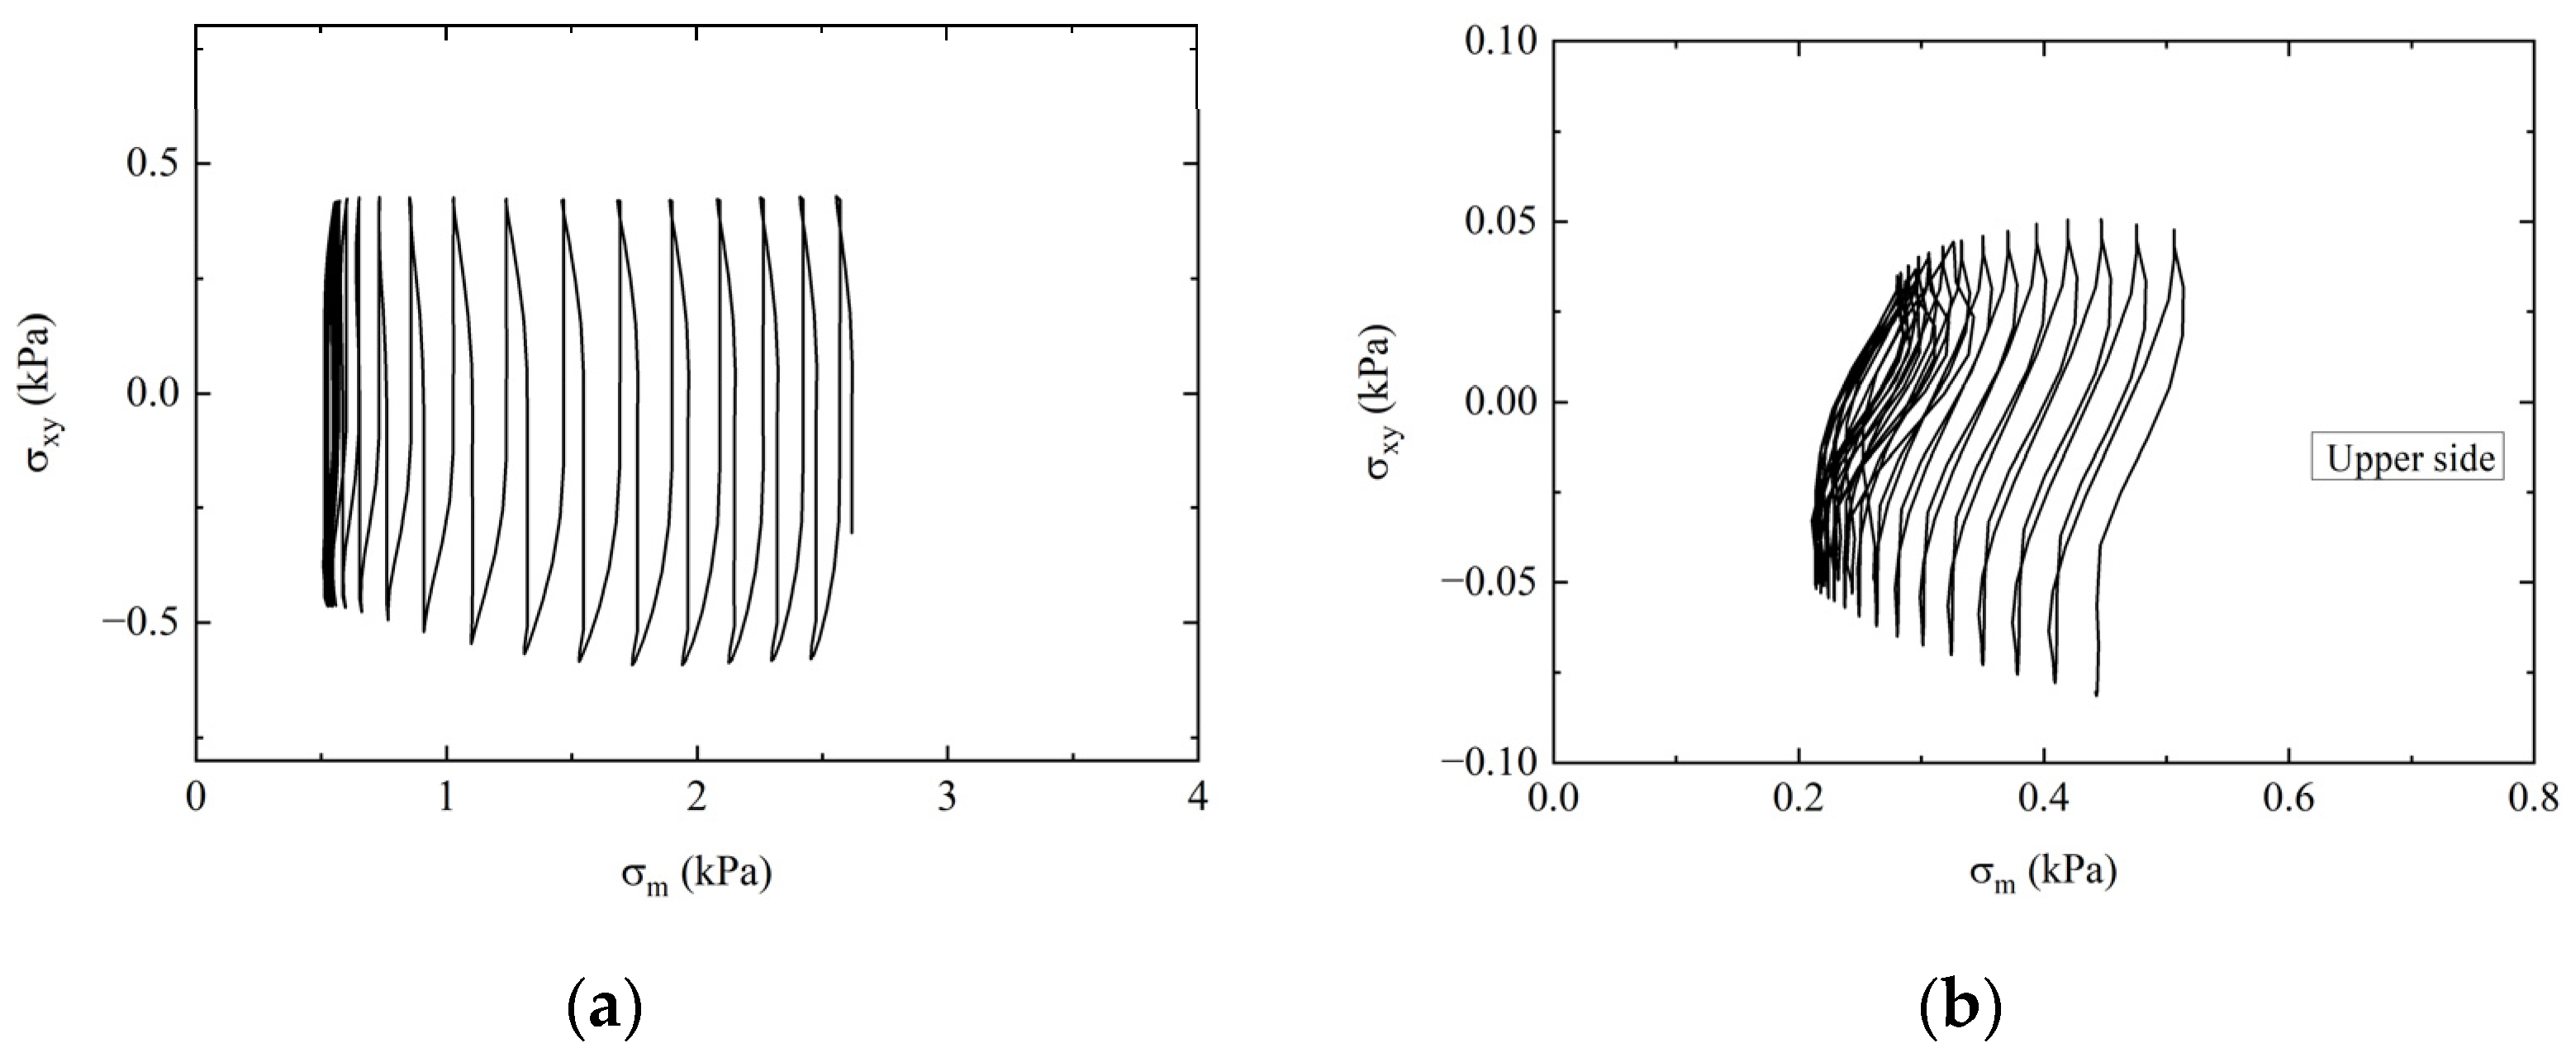
Permeability coefficient stands out as a crucial soil parameter in the seabed dynamic reaction analysis. It is critical to the development of EPWPR, with an important effect on seabed liquefaction. In theory, the higher the permeability coefficient of soil, the faster the dissipation of pore water pressure within the soil, resulting in a slower accumulation of EPWPR and making liquefaction less likely to occur. To explore the impact of permeability coefficient on the floatation of pipelines, various permeability coefficients of the trench soil (ks =1 × 10⁻⁴ m/s, 1 × 10⁻⁵ m/s, 1 × 10⁻⁶ m/s, 1 × 10⁻⁷ m/s) are examined.
Figure 13a demonstrates how the permeability coefficient impacts the pipeline’s buoyancy and the distribution of the highest EPWPR levels below the pipeline. Figure 13b shows, when the permeability coefficient ks =1 × 10⁻⁶ m/s and 1 × 10⁻⁷ m/s, that the time histories of floatation develop similarly, with a steady increase in the early stage. When the backfill soil in the middle position of the pipeline begins to liquefy, the floating displacement increases rapidly. When the permeability coefficient ks =1 × 10⁻⁴ m/s and 1 × 10⁻⁵ m/s, due to the large permeability coefficient of the backfill soil in the trench, the excess pore water pressure dissipates quickly, and the pipeline does not float. In particular, when the permeability coefficient ks =1 × 10⁻⁴ m/s, the trench settles down relative to the neighboring seabed, leading in sinking of the pipeline, owing to the large difference in permeability coefficient between the trench soil and seabed. With the cyclic action of the wave and current loadings, the pipe floats rapidly when the natural seabed under the trench liquefies. Figure 13b indicates that the maximum EPWPR decreases, which means liquefaction depth decreasing, with increasing permeability coefficient of the trench soil. The trench soil will not liquefy when the permeability coefficient ks =1 × 10⁻⁴ m/s and 1 × 10⁻⁵ m/s. Therefore, increasing the permeability coefficient of the backfill soil in the trench can obviously restrain the floatation of the pipeline. If necessary, the depth of the backfill trench can be deepened in order to further control the floatation of the pipeline.

3.4. Discussion

This paper makes a significant contribution to understanding the behavior of fully buried pipelines under combined wave and current loadings using a poro-elastoplastic approach. It addresses a critical aspect of marine pipeline engineering with a robust theoretical framework and practical insights. It provides valuable references for the construction of practical marine engineering projects.
Typically, the finite deformation is considered in the simulation of sand liquefaction. In this study, small strain elements were used to simulate the liquefaction and deformation of the sandy seabed, resulting in accurate simulation results. A comparative analysis with traditional finite deformation will be conducted subsequently. The used model cannot consider the noncoaxial behavior of the sand. Taking the influence of the noncoaxial property into account in the model is ongoing, and the wave in the real case can be high-order and nonlinear. The liquefaction mechanism of high-order and nonlinear waves is our future work.

4. Conclusions

This study presents a two-dimensional coupled approach with a poro-elastoplastic theory to study the floatation of pipelines with the combined loading of waves and currents. The cyclic constitutive model incorporates the structural, overconsolidation, and anisotropic characteristics of soil, facilitating an accurate portrayal of the static and dynamic behaviors of both sandy and clayey soils, rendering it more comprehensive compared to the elastoplastic model. Based on the data, the following conclusions can be drawn, which provide references for practical engineering design, construction, and risk protection.
(1) Pipeline floatation is broken into two phases. In the initial phase, the pipeline floats slowly under the cyclic loading. In the subsequent phase, when the backfill soil in the middle position of the pipeline begins to liquefy, the floating displacement increases obviously. The pipeline acts as a boundary restriction, strengthening the backfill soil surrounding it and hastening the dissipation of excess pore water pressure. Meanwhile, a hard-to-liquefy area is formed under the seabed pipeline. In the construction of submarine seabed pipeline engineering, particular attention should be paid to the risk of liquefaction of the overlying soil above the seabed pipeline. Measures such as reinforcing the upper soil layer or increasing the permeability coefficient could be adopted to reduce the risk of liquefaction.
(2) The pipeline’s floating displacement rises as the current velocity (u), wave period (T), and wave height (H) increase. As current velocity (u), wave period (T), and wave height (H) increase, so too does the liquefaction depth at the pipeline’s bottom. In real engineering applications, wave blocking or dissipation methods could be implemented to limit the risk of the seabed pipeline floatation.
(3) The floating displacement of the pipeline and the depth of the liquefaction at the bottom diminish as the permeability of the backfill trench increases. Increasing the permeability of the trench’s backfill soil can significantly restrain the floatation of the pipeline.
This study explains the mechanism of fully buried pipeline flotation in practical engineering and analyzes the effects of wave height, wave period, current velocity, and the permeability coefficient of the overlying soil. Based on the conclusions of this study, measures to control the flotation of fully buried pipelines in engineering include increasing the pipeline’s weight with concrete coatings or weight blocks, embedding the pipeline in the seabed, securing it with suction or pile anchors, using chains or cables to fix it to anchor points, adjusting buoyancy with control modules or heavy materials, preventing gas accumulation, constructing breakwaters, installing wave energy absorbers, and replacing the surrounding soil with more permeable materials to enhance stability.

Author Contributions

Conceptualization, J.L. and C.L.; Methodology, J.L. and G.Y.; Software, J.L. and G.Y.; Formal analysis, J.L. and C.L.; Investigation, J.L., L.L. and C.L.; Writing—original draft, J.L. and C.L.; Writing—review & editing, J.L. and C.L.; Supervision, L.L. and G.Y. All authors have read and agreed to the published version of the manuscript.

Funding

This research received no external funding.

Institutional Review Board Statement

Not applicable.

Informed Consent Statement

Not applicable.

Data Availability Statement

Data are contained within the article.

Conflicts of Interest

Authors Jian Leng and Libin Liu were employed by the company CCCC Third Harbor Engineering Co., Ltd. The remaining authors declare that the research was conducted in the absence of any commercial or financial relationships that could be construed as a potential conflict of interest.

References

  1. Meniconi, S.; Brunone, B.; Tirello, L.; Rubin, A.; Cifrodeli, M.; Capponi, C. Transient tests for checking the Trieste subsea pipeline: Towards the field tests. J. Mar. Sci. Eng. 2024, 12, 374. [Google Scholar] [CrossRef]
  2. Meniconi, S.; Brunone, B.; Tirello, L.; Rubin, A.; Cifrodelli, M.; Capponi, C. Transient tests for checking the Trieste subsea pipeline: Diving into fault detection. J. Mar. Sci. Eng. 2024, 12, 391. [Google Scholar] [CrossRef]
  3. Zhang, J.; Wang, Y.; Luo, X. Influence of wave parameters on subsea pipeline stability. Ocean Eng. 2017, 136, 10–20. [Google Scholar]
  4. Wang, P.; Feng, S.; Liu, X. Combined wave-current effects on pipeline flotation. Mar. Struct. 2019, 65, 110–123. [Google Scholar]
  5. Liang, W.; Zhang, H. Stability analysis of submarine pipelines under combined wave and current loading. Ocean Eng. 2020, 209, 107508. [Google Scholar]
  6. Qi, W.; Gao, P. Cyclic loading effects on the stability of subsea pipelines. J. Offshore Mech. Arct. Eng. 2014, 136, 021303. [Google Scholar]
  7. Liang, W.; Jeng, D.S.; Zhang, H. Numerical study on the interaction between waves, currents, and seabed around subsea pipelines. Appl. Ocean Res. 2020, 94, 101941. [Google Scholar]
  8. Liu, H.; Chen, Y.; Zhang, L. Numerical simulation of pipeline flotation in liquefied soils. J. Geotech. Geoenviron. Eng. 2016, 142, 04016013. [Google Scholar] [CrossRef]
  9. Feng, S.; Liu, X.; Zhang, Y. Numerical study of wave-induced seabed response around submarine pipelines. Mar. Georesour. Geotechnol. 2018, 36, 601–612. [Google Scholar]
  10. Liu, Y.; Ye, J.; Jeng, D.S. Numerical modeling of wave-induced seabed response around marine structures. J. Waterw. Port Coast. Ocean Eng. 2018, 144, 04018015. [Google Scholar]
  11. Chen, H.; Zhang, J.; Tong, L.; Sun, K.; Guo, Y.; Wei, C. Experimental study of soil responses around a pipeline in a sandy seabed under wave-current load. Appl. Ocean Res. 2023, 130, 103409. [Google Scholar] [CrossRef]
  12. Sumer, B.M.; Hatipoglu, F.; Fredsøe, J.; Sumer, S.K. The sequence of sediment behavior during wave-induced liquefaction. Sedimentology 2006, 53, 611–629. [Google Scholar] [CrossRef]
  13. Liang, W.; Yang, K. Two-way coupling model for dynamic seabed response around twin pipelines under combined wave and current loading. Mar. Georesources Geotechnol. 2018, 36, 832–846. [Google Scholar]
  14. Zhang, Y.; Ma, G. Experimental study on the response of sandy seabed to regular waves. Ocean Eng. 2023, 150, 108789. [Google Scholar]
  15. Wang, J.; Liu, Q.; Li, X. Investigation of wave-induced seabed response using physical model tests. Coast. Eng. 2023, 185, 103809. [Google Scholar]
  16. Smith, A.; Johnson, B. Wave-induced sediment transport and bed morphology changes in laboratory wave tank experiments. J. Geophys. Res. Ocean. 2023, 128, 982–996. [Google Scholar]
  17. Liu, H.; Shan, H.; Jia, Y. Dynamic Response of Seabed Sediments under Flow Conditions: Insights from Centrifuge Experiments and Numerical Simulation. J. Ocean Eng. 2023, 35, 245–258. [Google Scholar]
  18. Xu, F.; Mu, X.; Zhen, W. Deformation Characteristics of Seabed Soils under Different Flow Velocities: A Centrifuge Experiment Study. Mar. Geotech. 2024, 28, 112–125. [Google Scholar]
  19. Zhao, J.; Wang, X.; Zhang, M. Simulation of Seabed Response under Storm Surge and Wave Action using Centrifuge Experiments. Coast. Eng. 2024, 45, 321–335. [Google Scholar]
  20. Cheng, A.H.D.; Liu, P.L.F. Seepage force on a pipeline buried in a poroelastic seabed under wave loading. Appl. Ocean Res. 1986, 8, 22–32. [Google Scholar] [CrossRef]
  21. McDougal, W.G.; Davidson, S.H.; Monkmeyer, P.L.; Sollitt, C.K. Wave-induced forces on buried pipeline. J. Waterw. Port Coast. Ocean. Eng.-ASCE 1988, 114, 220–236. [Google Scholar] [CrossRef]
  22. Zhang, X.L.; Jeng, D.S.; Luan, M.T. Dynamic response of a porous seabed around pipeline under three-dimensional wave loading. Soil Dyn. Earthq. Eng. 2011, 31, 785–791. [Google Scholar] [CrossRef]
  23. Zhao, H.Y.; Jeng, D.S.; Guo, Z.; Zhang, J.S. Two-dimensional model for pore pressure accumulations in the vicinity of a buried pipeline. J. Offshore Mech. Arct. Eng. 2014, 136, 042001. [Google Scholar] [CrossRef]
  24. Zhao, H.Y.; Jeng, D.S.; Liao, C.C. Effects of cross-anisotropic soil behavior on the wave-induced residual liquefaction in the vicinity of pipeline buried in elasto-plastic seabed foundations. Soil Dyn. Earthq. Eng. 2016, 80, 40–55. [Google Scholar] [CrossRef]
  25. Ye, J.H.; He, K.P. Dynamics of a pipeline buried in loosely deposited seabed to nonlinear wave & current. Ocean Eng. 2021, 232, 109127. [Google Scholar]
  26. Ye, J.H.; Lu, Q.Y. Seismic dynamics of a pipeline shallowly buried in loosely deposited seabed foundation. Ocean Eng. 2022, 243, 110194. [Google Scholar] [CrossRef]
  27. Zhang, F.; Ye, B.; Noda, T.; Nakano, M.; Nakai, K. Explanation of cyclic mobility of soils: Approach by stress-induced anisotropy. Soils Found. 2007, 47, 635–648. [Google Scholar] [CrossRef]
  28. Zhang, F.; Ye, B.; Ye, G.L. Unified description of sand behavior. Front. Archit. Civ. Eng. China 2011, 5, 121–150. [Google Scholar] [CrossRef]
  29. Hsu, H.C.; Chen, Y.Y.; Hsu, J.R.C. Non-linear water waves on uniform current in lagrangian coordinates. J. Nonlinear Math. Phys. 2009, 16, 47–61. [Google Scholar] [CrossRef]
  30. Ye, J.H.; Jeng, D.S. Response of porous seabed to nature loadings: Waves and currents. J. Eng. Mech. 2012, 138, 601–613. [Google Scholar] [CrossRef]
  31. Ye, B.; Muramatsu, D.; Ye, G.L.; Zhang, F. Numerical assessment of vibration damping effect of soilbags. Geosynth. Int. 2011, 18, 159–168. [Google Scholar] [CrossRef]
  32. Hashiguchi, K. Elasto-plastic constitutive laws of granular materials, Constitutive Equations of Soils. In Proceedings of the 9th ICFSME, Session 9, Tokyo, Japan, 10–15 July 1977; pp. 73–82. [Google Scholar]
  33. Asaoka, A.; Nakano, M.; Noda, T. Super loading yield surface concept for the saturated structured soils. In Proceedings of the 4th European Conference on Numerical Methods in Geotechnical Engineering, Udine, Italy, 14–16 October 1998; Volume 98, pp. 232–243. [Google Scholar]
  34. Ye, B.; Ye, G.L.; Zhang, F.; Yashima, A. Experiment and numerical simulation of repeated liquefaction-consolidation of sand. Soils Found. 2007, 47, 547–558. [Google Scholar] [CrossRef]
  35. Ye, B.; Ye, G.L.; Zhang, F. Numerical modeling of changes in anisotropy during liquefaction using a generalized constitutive model. Comput. Geotech. 2012, 42, 62–72. [Google Scholar] [CrossRef]
  36. Bao, Y.F.; Ye, G.L.; Ye, B.; Zhang, F. Seismic evaluation of soil-foundation-superstructure system considering geometry and material nonlinearities of both soils and structures. Soils Found. 2012, 52, 257–278. [Google Scholar] [CrossRef]
  37. Bao, X.H.; Morikawa, Y.; Kondo, Y.; Nakamura, K. Shaking table test on reinforcement effect of partial ground improvement for group-pile foundation and its numerical simulation. Soils Found. 2012, 52, 1043–1061. [Google Scholar] [CrossRef]
  38. Bao, X.H.; Ye, G.L.; Ye, B.; Sago, Y.; Zhang, F. Seismic performance of SSPQ retaining wall-Centrifuge model tests and numerical evaluation. Soil Dyn. Earthq. Eng. 2014, 61, 63–82. [Google Scholar] [CrossRef]
  39. Xia, Z.F.; Ye, G.L.; Wang, J.H.; Ye, B.; Zhang, F. Fully coupled numerical analysis of repeated shake-consolidation process of earth embankment on liquefiable foundation. Soil Dyn. Earthq. Eng. 2010, 30, 1309–1318. [Google Scholar] [CrossRef]
  40. Zienkiewicz, O.C.; Shiomi, T. Dynamic Behavior of Saturated Porous Media: The Generalized Biot Formulation and Its Numerical Solution. Int. J. Numer. Anal. Methods Geomech. 1984, 8, 71–96. [Google Scholar] [CrossRef]
  41. Oka, F.; Yashima, A.; Shibata, T.; Kato, M.; Uzuoka, R. FEM-FDM coupled liquefaction analysis of a porous soil using an elasto-plastic model. Appl. Sci. Res. 1994, 52, 209–245. [Google Scholar] [CrossRef]
  42. Jeng, D.S.; Ou, J. 3D models for wave-induced pore pressure near breakwater heads. Acta Mech. 2010, 215, 85–104. [Google Scholar] [CrossRef]
  43. Jin, Y.; Bao, X.; Kondo, Y.; Zhang, F. Numerical evaluation of group-pile foundation subjected to cyclic horizontal load. Front. Archit. Civ. Eng. China 2010, 4, 196–207. [Google Scholar] [CrossRef]
  44. Sumer, B.M.; Fredsøe, J.; Christensen, S.; Lind, M.T. Sinking/floatation of pipelines and other objects in liquefied soil under waves. Coast. Eng. 1999, 38, 53–90. [Google Scholar] [CrossRef]
Figure 1. Comparison of experimental data from Sumer et al. [10] with FEM simulated outcomes.
Jmse 12 00995 g001
Figure 2. Mesh domain for the seabed-pipeline FEM model.
Jmse 12 00995 g002
Figure 3. The ratio (ue/σ’0) of maximum excess pore pressure generated by waves and currents at the pipeline’s underside for diverse mesh frameworks.
Jmse 12 00995 g003
Figure 4. Time history of floating displacement of the pipeline.
Jmse 12 00995 g004
Figure 5. Displacement vectors of the seabed.
Jmse 12 00995 g005
Figure 6. Evolution of soil liquefaction and pipeline flotation over time. 100 s: Surface layer of trench soil begins to liquefy. 200 s: Liquefaction extends deeper. 300 s: Significant liquefaction around pipeline, extends beneath. 400 s: Soil beneath pipeline liquefies, increasing buoyancy. 500 s: Further liquefaction beneath trench, pronounced pipeline flotation.
Jmse 12 00995 g006
Figure 7. Time histories of EPWPR of soil elements around the pipeline and the position of the elements analyzed. (a) Time histories of EPWPR. (b) The position of the elements analyzed.
Jmse 12 00995 g007aJmse 12 00995 g007b
Figure 8. Effective stress path of seabed element 10 m from the pipeline and soil elements at different positions around the pipeline. (a) Effective stress path of seabed element 10 m from the pipeline; (b) Effective stress path of upper side soil element; (c) Effective stress path of central element; (d) Effective stress path of lower side soil element; (e) Effective stress path of bottom soil element.
Jmse 12 00995 g008aJmse 12 00995 g008b
Figure 9. Time histories of floating displacement of pipeline under various current velocities.
Jmse 12 00995 g009
Figure 10. Distributions of the MAX EPWPR along pipeline centerline under current velocities.
Jmse 12 00995 g010
Figure 11. Floating displacement and MAX EPWPR time series for pipelines under various water period. (a) Time histories of floating displacement; (b) Distributions of the MAX EPEPR.
Jmse 12 00995 g011
Figure 12. Floating displacement and MAX EPWPR time series for pipelines under various water height. (a) Time histories of floating displacement; (b) Distributions of the MAX EPWPR.
Jmse 12 00995 g012
Figure 13. Floating displacement and MAX EPWPR time series for the pipeline, by backfill soil permeability. (a) Time histories of floating displacement; (b) Distributions of the MAX EPWPR.
Jmse 12 00995 g013
Table 1. Parameters for numerical simulation.
ParameterValueUnit
Seabed Parameters
Compression   index   λ 0.05
Swelling   index   k 0.0064
Relative density Dr62%
Permeability coefficient ks10−7m/s
Poisson’s ratio ν0.30
Critical state parameter Μ1.2
Void ratio N (p’ = 98 kPa on N.C.L)0.74
Evolution parameter of anisotropy br1.5
Degradation parameter of overconsolidation state mR0.1
Degradation of structure mR*2.2
Initial degree of structure R0*0.8
Initial consolidation ratio 1/R025
Initial anisotropy ζ00.0
Backfill Parameters
Permeability coefficient ks10−6m/s
Bottom of the trench width W12m
Top of the trench width W24m
Trench height h2.1m
Distance between seabed pipeline and bottom of trench d0.1m
Wave and Current Parameters
Current velocity u+1m/s
Wave period T5s
Water depth D10m
Water height H1m
Pipeline Parameters
Pipeline thickness t0.2m
Outer diameter D0.5m
Young’s modulus EP2.09 × 1011N/m2
Disclaimer/Publisher’s Note: The statements, opinions and data contained in all publications are solely those of the individual author(s) and contributor(s) and not of MDPI and/or the editor(s). MDPI and/or the editor(s) disclaim responsibility for any injury to people or property resulting from any ideas, methods, instructions or products referred to in the content.

