1. Introduction
The maritime and international shipping industries are major users of fuel and emitters of carbon dioxide (CO2) and other pollutants such as nitrogen (NOx) and sulfur oxides (SOx). In 2012, the International Maritime Organization (IMO) provided a document outlining the third GHG study in 2014 showing that, from 2007 to 2012, the international shipping industry increased its participation in the estimation of global greenhouse gas (GHG) emissions from 2.7 to 2.9%. This increase in emissions is mainly due to an increase in total shipments of 5.6%, as a consequence of the increase in international trade in the analysis period, and demonstrates both the nature and importance of the inherent connection between GHG emissions and global commercial movements.
In recent decades, the release of GHGs into the atmosphere has increased significantly, primarily due to the increasing use of fossil fuels and increased industrial activities. While emissions temporarily decreased in 2020 due to the restrictions imposed by the COVID-19 pandemic, they have risen again to an all-time high.
The current level of GHG emissions in the maritime industry is alarmingly high. The maritime industry is one of the largest sources of GHG emissions contributing to global warming and climate change. According to recent studies, the maritime sector emits large amounts of CO2, NOx, and sulfur dioxide (SO2) into the atmosphere. The operation of ships causes these emissions through the use of fossil fuels, the thermal treatment of cargo, and exhaust fumes in harbors. It can be assumed that GHG emissions in the maritime industry will continue to increase as long as no concrete measures are taken to reduce them. Immediate action and implementing various strategies are key to mitigating the negative impact of the maritime sector on the environment.
The formation and emission of nitrogen dioxide (NO2), CO2, and particulate matter (PM) is caused by various processes, primarily related to combustion and industrial activities. NO2 is mainly formed from nitrogen monoxide (NO), which is produced during combustion processes at high temperatures. NO2 is emitted from various sources such as vehicles, power plants, and industrial processes. It is an important air pollutant and a precursor to other pollutants such as ozone (O3) and particulate matter.
CO
2 is produced during the complete combustion of carbon-containing fuels (e.g., fossil fuels, biomass). CO
2 is emitted from sources such as vehicle exhausts, industrial activities, electricity generation, and domestic heating. It is an important greenhouse gas that contributes significantly to global warming and climate change [
1].
PM consists of a mixture of solid particles and liquid droplets suspended in the air. Its formation mechanisms include (1) primary particles (emitted directly from sources such as construction sites, unpaved roads, fields, chimneys, or fires) and (2) secondary particles (formed in the atmosphere by chemical reactions with gasses such as SO
2, NO
x, ammonia (NH
3), and volatile organic compounds (VOCs)). PM is emitted from a variety of sources, including: 1. Combustion (vehicles, industrial processes, domestic, and power plant combustion); 2. mechanical processes (construction, mining, agriculture, and road dust); and 3. natural sources (forest fires, volcanic eruptions, sea spray, and wind-blown dust) [
2,
3].
In 2021, global GHG emissions reached 54.6 billion tons of carbon dioxide equivalent (GtCO2eq—gigatons of carbon dioxide equivalent). Transport-related CO2 emissions have risen sharply worldwide due to the growing world population and economy, from 2.84 billion GtCO2 in 1970 to 7.64 billion GtCO2 in 2021.
The main source of these emissions is the combustion of petroleum-based fuels (coal, oil, diesel, natural gas, petrol, etc.), especially by vehicles with internal combustion engines (ICEVs). The transport sector is responsible for 20.2 percent of the world’s total CO
2 emissions, making it the second-largest source of carbon pollution worldwide [
4,
5]. Within the transport sector, shipping is the third-largest source of CO
2 emissions with 11% of total emissions, after passenger cars with 39% and medium and heavy goods vehicles with 23%. Due to the increase in global trade and demand for maritime transport, the sector’s carbon footprint, mainly due to CO
2, may increase by 50% to 250% by 2050 if no proactive measures are taken [
6].
CO2 emissions are therefore the main cause of global climate change. It is widely recognized that the world must urgently reduce its emissions to avoid the worst effects of climate change. Even though this responsibility is shared between regions, countries, and individuals, all possible steps to reduce CO2 emissions must be taken as a matter of urgency.
Note: tCO
2 and tCO
2eq are two important terms for understanding and monitoring climate impacts and developing emission reduction strategies. tCO
2 refers to actual CO
2 emissions expressed in tons. At the same time, tCO
2eq considers other GHGs expressed in tons such as methane (CH
4) and nitrous oxide (N
2O) by converting them into equivalent CO
2 emissions based on their global warming potential [
7].
Having identified the problem, this study aims to compare CO2 emissions, consumption, and fuel cost reduction based on the performance of two suction hopper dredger ships with standard diesel and hybrid propulsion. The aim is to determine whether, how much, and how a hybrid propulsion can contribute to reductions in CO2 emissions and fuel costs compared to standard diesel propulsion. By analyzing the technical characteristics, CO2 emissions, and fuel costs, concrete and accurate information will be provided on the differences between these two propulsion systems. In this way, this research will provide relevant data that can help with decisions on the choice of marine equipment and impact the environmental sustainability of maritime transport and economic profitability at the one-ship and maritime company levels.
Environmental sustainability refers to the responsible management of the environment to avoid the depletion or degradation of natural resources and to enable long-term environmental quality. It is about managing resources in a way that ensures their availability for future generations while maintaining the health and function of the ecosystem. The key principles of environmental sustainability include 1. resource efficiency; 2. biodiversity conservation; 3. pollution prevention; 4. use of renewable resources; 5. sustainable development; and 6. climate change mitigation.
The introductory part of this work defines the problem, subject, and aim of the research and lays the foundation for the further analysis of CO
2 emissions. The second chapter summarizes the most important contributions of previous research on this problem and topic.
Section 3—Materials and Methods—presents the importance of CO
2 reduction, measures, and technological solutions as well as the economic aspects of reducing greenhouse gas emissions in the maritime industry, the basic operating principles of diesel and hybrid propulsion systems in shipping, which are important for calculating and comparing the advantages and disadvantages of one type of propulsion system over the other.
In the case study, the fourth chapter describes the data set and explains the procedure for the mathematical evaluation of the most important elements of CO2 emissions, fuel consumption, and costs of diesel and hybrid propulsion complexes using the example of two ships of a European shipping company. In the last two chapters, the results obtained are presented and explained. The conclusion summarizes the results and makes recommendations for the reduction in CO2 emissions in the shipping industry.
2. Background
With advances in technology, GHG emissions from ships have become a major issue in international maritime transport. Research to reduce CO2 emissions and fuel consumption of diesel- and hybrid-powered ships is a very interesting topic in scientific circles, considering the importance of sustainability and protection of the environment, especially the sea. Various hybrid ship systems and energy management strategies have been developed to optimize energy management and reduce fuel consumption and carbon emissions. These studies highlight the potential of hybrid energy sources for ship propulsion, such as fuel cells, batteries, and generators, all of which aim to significantly reduce fuel consumption and emissions.
The authors of [
1,
2] describe CO
2 emissions and the oxidation mechanisms of nitrogen and NO
x formation, while the author of [
3] describes the formation and emissions of NO
x, hydrocarbons (HCs), CO
2, and particulate matter (PM).
Most studies [
8,
9,
10,
11] deal with energy efficiency or the reduction in CO
2 emissions and focus primarily on the final energy requirements of large cargo ships. They analyze the impact of technology on hybrid ships, propulsion, and energy management systems by comparing fossil fuel main engines with battery hybrid propulsion systems. In addition, they investigate GHG reduction strategies related to improved propulsion, cargo ship re-optimization, Emission Control Areas (ECAs), and ISO standard 28005-compliant [
12] supply chain management through a retrospective and transdisciplinary study conducted between 2008 and 2018, and identify and compare CO
2 emissions for specific shipping case studies.
In the study [
13], the authors investigate the effects of biodiesel as a dispersant to improve the stability of asphaltenes in marine fuels with very low sulfur content; the study [
14] deals with numerical methods for predicting emissions from biodiesel fuel blends in the diesel engines of inland vessels; the study [
15] investigates the effects of biofuels on the ecological and economic efficiency of marine diesel engines; and the study [
16] examines the methods for the multiple optimization of the energy efficiency of ships considering carbon tax.
In the study [
17], models are presented for the fuel consumption and CO
2 emissions of two-stroke main engines and four-stroke auxiliary diesel engines in hybrid ships. This study investigates the effects of a ship’s emission profile, propulsion type, and the effects of different fuels on the ship’s fuel consumption and CO
2 emissions during the entire voyage, including transit on the high seas and maneuvering near port areas. The results show that propulsion management and power generation methods have a significant impact on a ship’s fuel consumption and CO
2 emissions during the voyage. When maneuvering near ports, NO
x and CO
2 emissions can be significantly reduced if the ship is supplied with electricity and the auxiliary engines generate electricity instead of the main engine. Research also shows that by operating an LNG (liquefied natural gas) ship, fuel consumption, CO
2, and NO
x emissions can be significantly reduced, while hydrocarbon emissions are higher than with conventional fuels. Certainly, the hybridization of ship propulsion and the use of LNG can significantly reduce fuel consumption and thus fuel costs and CO
2 emissions by optimizing the voyage and ship operations.
The research [
18] comprehensively provides an overview of various decarbonization technologies, navigation systems, configurations of hull structures, propulsion, energy systems, and alternative types of fuel. By comparing a wide range of technologies in terms of their emission reduction potential and economic feasibility, this study points to alternative methods of future “green” transport, fuel, and hybrid energy systems that have great potential in reducing carbon emissions. The type of ship, its structural configuration, and operating parameters affect the performance of optimal weather routing systems. With the current maritime policy and technological development, the transition from traditional marine fuel to LNG, hybrid, and more flexible energy management and propulsion systems, significant decarbonization in the field of maritime transport can be achieved.
The study [
19] analyzes three propulsion systems for container ships, comparing two mechanical propulsion systems using fuel oil (system 1), a dual-fuel propulsion system (system 2), and a hybrid propulsion system (system 3) from an ecological and economic perspective. This study identifies the most efficient and cost-effective propulsion system as a step towards “green” transport in container shipping. The environmental results show that the hybrid propulsion system is the best option, with the lowest CO
2 emission rate of 5926 t/TEU (twenty-foot equivalent unit) and reductions in NO
x, SO
x, and CO
2 emissions of 52%, 63.7%, and 30.4%, respectively, compared to a conventional system. In economic terms, the dual-fuel system is currently the most cost-effective system proposed for container ships in terms of upcoming regulations, with energy costs and a return on investment of 0.07 USD/kWh (kilowatt-hour) or 21.9 USD/t.
In the study [
20], the researchers tested and compared an electric propulsion method that uses hydrogen as a fuel with existing energy sources. One such hybrid energy source consists of a fuel cell with molten carbonate, a battery, and a diesel generator. The authors based their experiments on analyzing the power consumption in different operating modes for different types of commercial ships. This study analyses fuel consumption and the reduction in CO
2 emissions when ships use a hybrid fuel cell-based energy source instead of a conventional commercial diesel energy source. The experimental results of the application with five load scenarios show that it is possible to reduce CO
2 emissions by up to 61% if a hybrid energy source with the same capacity is used to power the ship. The study uses actual values from the electrical load analysis of a 5500 TEU reefer ship, a 13 k TEU container, a 40 kwdt (kilo deadweight tonnage) bulk carrier, a 130 kdwt LNG ship, and a 300 kdwt crude oil tanker. As the power characteristics and operating time of the diesel generator are reduced compared to the hybrid system power source depending on the load variations of the ship and the ship type, the CO
2 emissions of the hybrid system are on average 70 to 74% lower compared to the diesel generator for each load scenario. The results showed that the conventional diesel generator consumed 43.5 kgoe/h (kilograms of oil equivalent per hour) and emitted 148.5 kg/h (kilograms per hour) of CO
2, while the hybrid system based on fuel cells consumed 35.6 kgoe/h and emitted 57.7 kg/h of CO
2. This study confirmed that the hybrid energy source reduces fuel consumption by 18% and CO
2 emissions by 61% at partial load in harbor operations.
To reduce CO2 emissions, the IMO has called for the adoption of measures to continuously reduce pollutant emissions in international maritime transport. The measures adopted since 2003 favor the cooperation of ships in reducing the GHG emissions caused by this sector. However, the contribution of the maritime transport sector has so far been limited.
As maritime transport faces a major challenge in reducing its environmental impact, alternative fuels and non-conventional propulsion systems represent a promising option for reducing CO2 emissions.
In contrast to previous studies focusing on large commercial container ships and other larger ships, this study aims to compare the potential to reduce CO2 emissions and fuel costs when operating ships based on the performance of two suction hopper dredger ships, one equipped with a standard diesel engine and the other with a hybrid propulsion system. The aim is to determine to what extent and in what way a ship’s hybrid propulsion system can contribute to a reduction in CO2 emissions and fuel costs at the ship and company levels compared to standard diesel propulsion.
3. Materials and Methods
3.1. Methodology and Research Plan
This research was conducted through a combination of theoretical analysis of diesel and hybrid ships and experimental research, i.e., case studies. In the theoretical analysis part, the importance of CO2 reduction, measures, and technological solutions, as well as the economic aspects of reducing GHGs in the maritime industry, are briefly analyzed. Subsequently, the basics of diesel and hybrid drives are briefly presented, the advantages and disadvantages of the individual drive systems are shown and their effects on CO2 emissions and fuel consumption costs are analyzed.
The case study consists of several phases. In the first part, the basic data of two ships with similar technical and technological characteristics but different propulsion systems (diesel and hybrid) of the European shipping company are presented, focusing on the environmental impact of maritime transport, the reduction of CO2 emissions and fuel consumption, and thus the economic justification of the propulsion to decarbonize ships by switching from diesel to hybrid technology.
In the second part, the collected daily, monthly, and annual data on working days, excavation volume, fuel consumption, and CO2 emissions for two selected ships are analyzed and compared. For the results of the calculation and comparison of CO2 emissions, fuel consumption, and costs to be relevant and accurate, various factors that can affect CO2 emissions were taken into account, i.e., engine type, fuel type, and engine operating time.
Based on the data and its analysis in the same period (from 1 January 2023 to 31 December 2023), the average daily, monthly, and annual data on greenhouse gas, CO2, CH4, and N2O emissions, expressed in tCO2eq and tCO2, were calculated for both ships with different ship propulsion systems, along with the average daily, monthly, and annual amounts of fuel consumed; the excavated material; the costs; the average monthly fuel consumption per m3 of excavated material; and the average energy generated by engine operation. The data were analyzed and compared to enable a more efficient evaluation and comparison of the ship propulsion systems (diesel or hybrid) in terms of CO2 emissions, consumption, and fuel costs.
3.2. Significance and Analysis of CO2 Emission Reductions in the Maritime Industry
Although cleaner and “greener” fuels are increasingly being used, shipping companies are still forced to use fossil fuels. This is because the companies usually own ships with a high economic value of several million euros, on which propulsion systems are installed that, at the time the ship was built, envisaged a diesel engine or another type of internal combustion engine. On the other hand, converting a propulsion system from a diesel engine to a hybrid engine requires large financial investments, so it is sometimes more profitable for companies to build a new ship instead of converting the existing diesel engine to a hybrid engine.
The combustion of marine diesel and other heavy fuel oils (HFOs) used by ships depends on several factors: size, type of ship, cargo capacity and energy efficiency, type of fuel used, distance traveled, and type of ship operation, resulting in the release of harmful gasses such as CO
2, CH
4, N
2O, and SO
x, which pose a significant risk to the environment and health. By way of illustration, according to CarbonChain [
21], a carbon calculation platform for global supply chains that provides an overview of the annual efficiency (AER*) of cargo ships depending on their cargo capacity, it is estimated that a ship with less than 5000 GT (gross tonnage) emits 15.4 gCO
2/dwt.nm (deadweight tons. nautical mile); a ship with 5000 to 9,999 GT emits 14.7 gCO
2/dwt.nm; and a ship with 10,000 GT emits 11.2 gCO
2/dwt.nm.
*AER quantifies the CO2 emissions from shipping per unit of nominal transport labor. This figure is calculated by multiplying the deadweight tonnage of the ship by the total distance in nautical miles, expressed in grams of CO2 per ton deadweight per nautical mile (gCO2/dwt.nm).
Recognizing the need to reduce the environmental impact of ocean freight transport, the IMO has revised its forecast for achieving net zero emissions for the sector by 2050. Originally, the IMO had set itself the target of reducing emissions by 40% by 2030 and 70% by 2050 compared to 2008 levels. To achieve this ambitious target, the member states agreed on “reference values”, i.e., a reduction of 20% by 2030 (with a target of 30%) and a reduction of 70% by 2040 (with a target of 80%).
From January 2023, the IMO introduced a series of new mandatory measures to amend the provisions of Annex VI of MARPOL (International Convention for the Prevention of Pollution from Ships). They were adopted by the Marine Environment Protection Committee (MEPC) in July 2011 to reduce GHG emissions from international shipping, while the Clean Cargo Working Group (CCWG) developed a standard methodology for calculating emissions and for comparative analyses in maritime transport. Ships built from 1 January 2013 must use the Energy Efficiency Design Index (EEDI) to estimate and reduce emission intensity and report their CII (Carbon Intensity Indicator). Existing ships must monitor their energy consumption through the implementation of a Ship Energy Efficiency Management Plan (SEEMP), which is integrated into their overall management plan. This requirement goes beyond the environmental interest as it also affects shipping companies, which are faced with rising costs, especially for fuel, and need to take well-thought-out, sustainable initiatives that can significantly increase their profitability now and in the long term and allow them to stay ahead of new and increasingly stringent regulations. The first step to reducing emissions is to track emissions throughout the supply chain. This helps to set measurable decarbonization targets and opportunities to reduce emissions, select and implement low-carbon alternatives, and monitor progress.
3.3. Measures and Technical Solutions to Reduce GHG Emissions in the Maritime Industry
The IMO strategy for the reduction in GHG emissions [
22] in maritime shipping provides for a range of technological and innovative measures and solutions for the introduction of energy-efficient technologies on ships, such as the installation of systems to reduce NOx emissions; the use of low-sulfur fuels; investment in the research and development of alternative fuels such as hydrogen or biofuels; the introduction of energy-efficient technologies, i.e., hybrid and electric propulsion systems; the use of hydrogen and biofuels and the introduction of energy-saving technologies; the introduction of gas-powered systems; the use of renewable energy sources such as solar panels and wind turbines on ships; the use of intelligent systems to monitor and control energy consumption; improving the energy efficiency of ships through aerodynamic design; the use of intelligent energy management systems and route optimization; raising awareness of sustainable practices and the training of employees in the maritime industry, etc. Although some of the technologies mentioned are still in the experimental phase, they are expected to become ubiquitous in the maritime industry in the future.
3.4. Economic Aspects of Reducing GHG Emissions in the Maritime Economy
The economic aspects of reducing GHG emissions in the maritime industry [
23] play an important role in the sustainable development of the sector. Reducing emissions not only has a positive impact on the environment but can also bring economic benefits. The introduction of innovative technologies to reduce emissions requires some investment but can lead to lower fuel and energy costs in the long term, and can open up new business opportunities, such as the development and sale of environmentally friendly technologies and services. Implementing measures to reduce emissions can help to increase energy efficiency and reduce operating costs. At the same time, cooperation between governments, industry, and academia can foster the creation of new economic models that enable the transition to a more sustainable maritime economy.
When considering the economic aspects of reducing greenhouse gas emissions in the maritime industry, the issue of battery aging must also be taken into account. It should be noted that batteries will hold less charge over time and require longer charging times. This will be reflected, among other things, in lower fuel consumption, as the ship will be more dependent on the gas engine. The ship will also take longer to recharge and discharge more quickly.
Reducing GHG emissions and fuel costs in the maritime economy plays a key role in developing sustainable strategies. The analysis of the costs of reducing GHG emissions includes an assessment of the costs of introducing new technological solutions, modernizing existing infrastructure, and implementing mandatory regulations, as well as an examination of the economic benefits such as reduced fuel consumption, increased energy efficiency, and greater competitiveness in the market.
3.5. Marine Diesel Engines
Diesel engines are key elements in shipping, as they enable the efficient conversion of the chemical energy of the fuel into the mechanical energy required to propel the ship. The development of marine diesel engines began at the end of the 19th century with the patenting of the first successful diesel engine by the German engineer Rudolph Diesel. The first marine diesel engine was manufactured at the MAN AG plant in 1903 and was used to power the cargo ship “Vandal”. In the following decades, diesel engines for ships became increasingly popular due to their reliability, efficiency, and economy. Marine diesel engines work on the principle of internal combustion. These engines utilize air compression to ignite the fuel and generate energy.
Marine diesel engines have several advantages over other types of propulsion. Firstly, diesel engines are extremely fuel-efficient, making them an ideal engine for ships that require continuous and efficient power. In addition, diesel engines have a high thermal efficiency, which means that less energy is lost as waste heat, which is important given the limited space and resources on board. Other advantages of diesel engines are their durability and reliability. Diesel engines are often designed to last longer and be more durable than other engine types, which is crucial for the safety and operability of a ship. Finally, diesel engines are suitable for use in a variety of conditions and can withstand high loads without losing power, which is an advantage in the marine industry. All these advantages make diesel engines a popular choice for marine propulsion.
There are different types of marine diesel engines. Marine diesel engines can work on the principle of compression ignition. Depending on the number of cylinders, diesel engines can be equipped with one or more cylinders that are arranged horizontally or vertically. Depending on the type of fuel, diesel engines can be fueled with diesel fuel, or gas (natural gas, liquid–gas, or crude oil). Each type of engine has its advantages and disadvantages, so the choice of engine depends on the specific needs and requirements of the shipping sector.
The CO
2 emissions of diesel engines are directly related to the combustion of diesel fuel. Diesel engines burn diesel fuel more efficiently than petrol engines, resulting in lower CO
2 emissions. However, the CO
2 and particulate emissions of diesel engines are higher than those of petrol engines. As emissions can hurt air quality and human health, certain technologies such as selective catalytic reduction (SCR) and diesel particulate filters (DPFs) can be used to reduce them when operating diesel engines. These technologies help to reduce pollutant emissions and improve the environmental performance of diesel engines [
24].
The future of marine diesel engines brings with it many changes and new trends. As these engines have long dominated the shipping industry, further development of the technology is expected to increase energy efficiency and reduce pollutant emissions. One of the most important goals is to reduce CO2 emissions in light of the growing awareness of climate change. It is therefore expected that future marine diesel engines will be equipped with advanced emission control systems and improved combustion technology to reduce fuel consumption. It is also expected that future engines will be more integrated with electric and hybrid systems, which can lead to greater economy and lower environmental impact. In addition, digitalization and the use of artificial intelligence may enable a new level of control and monitoring of engines, which will improve their reliability and maintenance. All these changes point to a promising future for marine diesel engines that will enable safer, more economical, and environmentally friendly maritime transport.
3.6. Hybrid Marine Engines
The transfer of voltage-controlled engines and the concept of improved efficiency seem to be the future direction in the development of marine diesel engines. The development of energy-efficient engines is of utmost importance due to the reduction in pollutant emissions and the improvement of economic efficiency. New trends include the use of advanced fuel injection technology, the development of new materials to reduce engine mass, and the optimization of engine design [
25]. In addition, the possibility of utilizing renewable energy sources to supplement the starting of marine diesel engines is being investigated. The industry is also increasingly turning to the electrification of shipping and the development of hybrid propulsion systems to achieve greater energy efficiency and reduce environmental impact. These trends in the development of marine diesel propulsion systems emphasize the need for innovative and sustainable solutions in the maritime industry.
Alternative propulsion systems for ships are innovative technologies and concepts that are used to power ships instead of conventional diesel engines. These systems include a variety of energy sources such as electricity, hydrogen, natural gas-based fuels, solar energy, and wind [
25]. Electric propulsion systems are among the most widely used alternative systems and utilize batteries or fuel cells to power electric motors. Hydrogen and natural gas-based fuels are a more environmentally friendly option than diesel fuel as they produce less harmful gas emissions. Solar energy and wind can also be used as alternative energy sources for ship propulsion. These alternative propulsion systems have the potential to reduce CO
2 emissions and other pollutants and contribute to the sustainability of the maritime sector.
Hybrid propulsion systems [
4], especially electric hybrid systems, are the most direct and effective way to fundamentally reduce GHG emissions, improve the thermal and fuel efficiency of internal combustion engines, and reduce operating costs. Although they were originally used primarily in vehicles, they are increasingly being used in marine engines, mainly due to their lower power output compared to marine engines. The hybrid engine was introduced as a new technology with the expectation that it would solve the major emissions problems of diesel engines without sacrificing efficiency. The most common application of hybrid marine engines is diesel–electric propulsion as well as series and parallel hybrid propulsion. In addition to new and cleaner propulsion systems, ships with hybrid propulsion often require new hull designs.
Other options for reducing emissions include the use of methanol or cleaner combustion. Low-mass combustion is the most promising, although there are obvious challenges to its realization.
With NOx, the most harmful colorless and odorless gas emission, it is more difficult to influence gas emissions. The main problem with hybrid engines is that ignition starts with combustion and the entire combustion chamber burns almost simultaneously.
Hybrid engines are becoming increasingly popular as they have higher efficiency and lower CO
2 emissions compared to diesel engines and combine combustion with electric motors, which reduces fuel consumption and CO
2 emissions. When the ship is steered, the hybrid engine uses an electric motor for starting, and when a higher load or faster acceleration is required, an internal combustion engine is also used [
25]. This combination makes hybrid engines more efficient under optimal driving conditions, which reduces overall CO
2 emissions. In addition, hybrid engines work with regenerative braking and an energy recovery system, which further reduces fuel consumption and CO
2 emissions. Ship operators and crew favor marine engines that are easy and safe to operate, offer a high level of operating comfort, and deliver good performance without increasing CO
2 emissions and fuel consumption. These important facts are taken into account in all necessary steps of the transition from diesel to hybrid marine engines, and as emission regulations are becoming stricter every day, different types of technologies are being improved and combined to fulfill the new regulations.
3.7. Comparative Presentation of the Advantages and Disadvantages of Diesel and Hybrid Ship Propulsion Engines
Hybrid ships combine two propulsion methods: a conventional combustion engine and a rechargeable battery. Among other things, this reduces fuel consumption and increases operating efficiency. Ships with hybrid propulsion can save money in various ways and will increasingly prove their cost-effectiveness and advantages, as shown shortly.
In addition, hybrid ships save fuel, reduce the risk of fines related to CO2 emissions, and increase the profitability of the shipping company.
The main reasons why ships with hybrid propulsion save fuel are:
They can be operated fully electrically and work quietly and smoke-free in and out of the port. The energy in the ship’s batteries can be obtained either by recharging on land or by utilizing the surplus energy on board when the engine is running at optimum load.
The battery of a hybrid ship can balance out peaks and troughs in energy demand so that the engine can run at optimum load. A ship’s engine is most efficient when running at optimal load, which increases fuel efficiency and extends engine maintenance intervals.
Instead of running multiple engines at a sub-optimal load, the battery can take on the role of a spinning, redundant reserve that can step in when needed. This is particularly important for ships with dynamic positioning requirements, such as offshore service ships. The battery has the added benefit of enabling faster start times and better maneuverability. Without a hybrid system, engine power plants must be designed for peak loads, which can result in sub-optimal loads for most operations. Since the battery can provide an instant boost when needed, the available power can exceed the installed engine power for short periods. To reduce peak loads, hybrid drive systems allow the engine to always operate at the optimum point of the specific fuel oil consumption (SFOC) curve for marine diesel oil (MDO), meaning the engine does not have to “hunt” for the load. By eliminating these dynamic load fluctuations, operating costs are reduced through lower maintenance and fuel costs. As a result, hybrid-powered ships can save 15–25% fuel compared to an equivalent diesel-powered ship.
Another important feature of hybrid-powered ships is that they reduce the risk of emission-related fines. Hybrid ships make it easier to comply with increasingly stringent emissions regulations and reduce the risk of fines, e.g., under the EU Emissions Trading Scheme (ETS), as less fuel is burnt.
4. Case Study—Comparative Analysis of the Reduction in CO2 Emissions and Fuel Consumption of Ships with Diesel and Hybrid Engines
4.1. Data Set
The case study in this article concerns two ships (suction hopper dredgers) with different propulsion systems of a European shipping company which, with its long tradition and professional team, has become a leading company in the field of subsea works (cleaning and construction of marine infrastructures, repairs to subsea structures, installation, maintenance of subsea cables, etc.).
Over the years, the company has achieved numerous successes by providing high-quality services and solutions to various industries such as the oil and gas industry, renewable energy sources, and maritime infrastructures. The company has a diverse fleet of ships of different categories.
This fleet enables the company to successfully carry out various types of maritime activities, as the fleet is an important resource that enables it to carry out underwater operations and transport cargo professionally and efficiently. The fleet of ships deployed for underwater operations ensures a high level of performance and safety in these demanding maritime activities. The ships are equipped with the latest technologies and materials to ensure high efficiency and safety. The performance and propulsion of the company’s ships are the most important technical features.
Environmental responsibility is a fundamental principle of the company’s philosophy, which is why the ships are equipped with numerous technical and operational measures that ensure the protection of the environment during operation. The fleet is equipped with advanced systems for the management and reduction of polluting emissions, and high standards are applied in the processing and disposal of waste to minimize the negative impact on the environment. The company also strictly adheres to and implements all relevant international regulations and guidelines on environmental protection, is committed to a responsible environmental policy through various initiatives and measures, and strives to reduce its impact on the environment and promote nature conservation by investing in modern technologies and innovative approaches to minimize the emission of harmful gasses and waste into the environment. Through partnerships with leading experts, the company is committed to researching and developing sustainable and environmentally friendly methods of underwater work. The company’s goal is to become an industry leader in sustainability and set an example for other marine technology companies to protect nature and the environment.
The performance of the standard diesel ship (ship A) and the hybrid ship (ship B) are briefly described below. The reason why these two ships were selected for the case study (comparative presentation of CO2 emission reduction, fuel consumption, and costs) is that they are representative examples of ships that were in operation for approximately the same number of days in 2023 and have similar technical and technological characteristics, except for the propulsion engine with a different type.
The technical characteristics of the two ships are listed in
Table 1.
The diesel-powered suction hopper dredger (ship A) is a highly efficient and versatile dredging ship that pushes the limits of its size. The ship can dredge to impressive depths and is equipped with a powerful dredge pump system. Its positioning accuracy is ensured by the installation of twin propellers and a bow thruster. The shallow draught and powerful dredge pump combined with excellent positioning capability make ship A the first choice when it comes to pumping ashore through a pipeline, be it for land reclamation work, coastal protection, or simply sand extraction.
The pumping distance for both ships is around 2500 m. The ship is equipped with two Wärtsilä 8L20 four-stroke eight-cylinder diesel engines (liquid fuel) with a maximum total mechanical power of 2880 kW and a speed of up to 1000 rpm (revolutions per minute). Although the Wärtsilä 8L20 [
26,
27] primarily runs on diesel, it can also be fueled with LNG or other liquid marine fuels such as light fuel oil (LFO), HFO, or biofuel. This dual-fuel option offers flexibility in choosing the most cost-effective and environmentally friendly fuel.
Ship A fulfills the Tier II emission standards. IMO Stage II (NOx Emission Compliance) refers to the regulations for NOx emissions in maritime transport. According to the MARPOL Convention, there are three levels of NOx emission limits for ships: IMO Tier I, Tier II, and Tier III. The Tier III standards apply to engines of ships whose keel was laid after 1 January 2016. Ship A is also very well suited for maintenance and capital dredging.
To enhance Ship A’s capabilities, it is equipped with innovative technology for the automation of dredging and navigation, including RESON PDS 2000 [
28], and the latest environmental technology of the ship’s propulsion system ensures that the ship meets and exceeds the latest environmental requirements, reducing emissions and fuel consumption.
By integrating a Wärtsilä NOx reducer, the Tier III standard can also be met in diesel operation. The engine runs efficiently on low-sulfur fuels (<0.1% S) and is therefore suitable for emission-controlled areas. It also has a certificate from the US Environmental Protection Agency (EPA) for compliance with emission standards.
The WÄRTSILÄ 20 diesel engine [
26] has several operating modes that enable adaptability and efficiency. The operating mode in which the engine reaches its maximum power is at 1000 rpm. This engine also makes it possible to change the speed and power according to the needs of the ship. In full load mode, the engine consumes 234 kg/h of fuel. In economy mode, fuel consumption is reduced to 180 kg/h. These operating modes make it possible to optimize fuel consumption and adapt the propulsion power to the needs of the ship.
Ship B is also a suction hopper dredger with a hybrid drive. This ship is equipped with a diesel–electric hybrid engine with a hydrodynamic design in combination with the latest environmental technology. The overall length (LOA) of the ship is 85.4 m, the width is 17.4 m, the maximum draught is 5.41 m, and the hopper volume is 2507 m3.
The engine has a high degree of efficiency and low emissions of greenhouse gasses and CO2. The propulsion engine is a diesel–electric drive system with three main engines and an output of 2350 kW. The three diesel generators operate at their most economical speed and are automatically switched on and off depending on the power requirement.
The hybrid concept (Caterpillar 3516C) [
29,
30] combines a diesel engine as the power source for the ship’s movement, which is often used in shipping due to its power and performance, with electric power, which enables higher efficiency and lower environmental impact, and a battery system, which contributes to energy savings during operation. In addition, each dredger is equipped with a 600 kW battery. The electrical system is a Blue Diesel Propulsion Plus C system, with a full LED lighting system, selective catalyst reduction (SCR) with a diesel particulate filter (DPF), and engines running on low emission and environmentally friendly fuels for sustainable operation. The fuels comply with the latest regulatory standards such as the European Stage V emissions standard. The ship can run entirely on second-generation biofuel, reducing CO
2 emissions by up to 90% over the entire fuel life cycle. This indicates a potential capability, but it is important to understand the limitations and requirements for certain engine types, such as Caterpillar diesel engines. Caterpillar engines are typically designed to run on a blend of biofuel and conventional diesel. To achieve 100 percent use of biofuel, the engine must be modified and it must be ensured that the biofuel meets strict quality standards. To ensure safe and efficient operation, the manufacturer’s guidelines must always be followed and the necessary engine settings must be made.
The propulsion system includes the modern Siemens BlueDrive PlusC power distribution system, which increases energy efficiency. The incredibly shallow draught combined with an advanced dynamic positioning system (DP2) makes this ship ideal for carrying out demanding tasks, both in very shallow waters and on the high seas. When ship B is underway, the generator switches on and off automatically, depending on the power requirement. In good weather, one or two generators normally run. In bad weather, two or three generators work together with the battery pack. When the ship is alongside, the battery is normally fully activated. This means that the battery is activated for up to two hours before the generator starts to recharge the battery.
The Caterpillar 3516C engine is a diesel generator that produces reliable power from 1825 to 2500 ekW (electric kilowatts) at 60 Hz (Hertz). These generators are designed for critical, backup, and main applications. Each engine meets the ISO Standards [
12] requirements for load behavior and can handle a load of 100% of rated power in one step. They are also certified by the US EPA for stationary emergency operation (Tier IIIA Nonroad Equivalent Emission Standards (Max Limits—G/BKW-HR (grams per brake horsepower-hour) CO: 5.0 NO
x + HC (hydrocarbons): 7.2 PM: 0.20)) and have a low fuel consumption [
30]. In addition, the 3516C marine engine meets IMO II regulations without additional after-treatment and is characterized by efficient operation with electronic control, a cold start strategy, and programmable low speeds for minimum fuel consumption.
Both ships are refueled with marine gas oil by the IMO regulations ISO 8217 2017 DMA (Distillate Marine Fuel) [
31]. Although the maximum permissible sulfur content is 1000 ppm (parts per million or max 0.1%), 50 ppm (or max 0.005%) is common in the country in which both ships sail.
Table 2 shows the working days (W.Ds.), the total monthly excavation (m
3), and the fuel consumption in t and m
3 for both ships. The ratio of marine diesel is such that 1 ton of fuel corresponds to 0.85 m
3 of fuel.
The SFOC is a measure of the efficiency of a diesel engine, especially in marine applications. It indicates how much fuel the engine consumes to deliver a certain power in a certain time. SFOC is defined as the amount of fuel oil consumed per unit of power produced by the engine per hour. It is normally expressed in grams per kilowatt hour (g/kWh). MDO is a type of fuel oil used in marine diesel engines. It is a blend of gas oil and heavy fuel oil, making it lighter and cleaner-burning than heavy fuel oil.
Factors that influence the SFOC are 1. engine design and condition; 2. load conditions; 3. fuel quality; 4. engine operating parameters; and 5. environmental conditions.
Table 2 (columns 4 and 5 for diesel engines, and columns 8 and 9 for hybrid propulsion) contains fuel consumption data for each diesel engine.
4.2. Mathematical Evaluation of CO2 Emissions, Fuel Consumption, and Costs
The mathematical assessment of a ship’s CO2 emissions and fuel costs is based on the main characteristics on which the emissions depend, namely the type of fuel, the type of propulsion engine, and the operating time of the ship.
The observation time for the operation of the two ships in this case study is the same and covers the period from 1 January 2023 to 31 December 2023.
The data were collected, processed, analyzed, and interpreted using the Excel program Microsoft Office LTSC Professional Plus 2024 for the comparison and graphical representation of the average daily, monthly, and annual values of CO2 emissions, fuel consumption, fuel costs, monthly working days, and average daily, monthly, and annual uaryquantities of material extracted for both ships, i.e., engines.
The calculation aims to provide a concrete and specific analysis of the CO2 emissions released during the operation of marine engines. The study provides insight into the calculation methods, the parameters used, and the steps taken to obtain the final CO2 emission results.
By comparing the CO2 emissions of marine diesel and hybrid engines, the potential differences and advantages of one (hybrid) versus the other (diesel) ship propulsion system are highlighted. Following the analysis, a comparative performance analysis was carried out and a conclusion was drawn regarding the efficiency and cost-effectiveness of hybrid propulsion systems compared to standard diesel propulsion systems.
The methods used to calculate the CO
2 emissions of marine diesel and hybrid engines are based on the determination of parameters such as engine power, fuel consumption, engine efficiency, and engine operating time. The calculation of CO
2 emissions is carried out in several steps, which include the determination of fuel consumption and the calculation of CO
2 emissions [
32].
This article deals with the calculation of CO2 emissions from marine diesel engines and hybrid marine engines using formulas based on engine parameters.
The IMO Guidelines [
33] provide detailed instructions for estimating GHG intensity based on the fuel life label (FLL) cycle for all fuels and other energy sources (e.g., electricity) used on ships.
These guidelines are intended to cover (with certain limitations) the entire life cycle of the fuel, from extraction to on-board use. The guidelines contain information on the type of fuel, the feedstock (type of feedstock and carbon source), the conversion process (type of process and energy used), greenhouse gas emission factors, information on fuel blends, and other aspects of sustainability. In addition, the guidelines define the elements that are subject to certification and describe the general procedure for setting certification standards.
The calculation of CO2 emissions for both diesel and hybrid propulsion systems for ships includes the determination of fuel consumption and the calculation of CO2 emissions based on engine parameters.
In step 1, the fuel consumption is determined, which can be calculated based on engine power and engine efficiency.
In step 2, the CO2 emissions are then calculated, which results from the fuel consumption and the specific CO2 emission per unit of fuel consumed. This calculation makes it possible to estimate the CO2 emissions caused by the ship’s engine and provides important data for analyzing the impact of emissions on the environment.
Engine running time is an important parameter for calculating CO2 emissions from marine diesel and hybrid engines. This time is important because it influences the overall fuel consumption and CO2 emissions. The longer the engine runs, the higher the fuel consumption and CO2 emissions. When calculating CO2 emissions, the average engine running time is taken into account to determine the total CO2 emissions.
An important factor in calculating the CO2 emissions of marine diesel and hybrid engines is the CO2 emissions per unit of fuel consumed. This value indicates how much CO2 is emitted during the combustion of a certain amount of fuel. The CO2 emissions per unit of fuel consumed are calculated as the ratio between CO2 emissions and fuel consumption.
Since the daily fuel consumption is known for each ship in this case study, the total monthly fuel quantities are calculated. The CO
2eq and CO
2 emission factors for marine diesel and hybrid engines are defined in [
33,
34] and are 3.2499 tCO
2eq/t and 3.206 tCO
2/t respectively.
5. Results
Both ships (diesel propulsion ship A and hybrid propulsion ship B) have similar GHG emission factors due to their size and purpose and the use of the WÄRTSILÄ 20 and Caterpillar 3516C diesel engines.
In 2023, ship A worked a total of 323 days, and ship B a total of 360 days (
Figure 1). The number of working days per month for each ship is shown in
Figure 1. Ship A worked the least in February and September, at 15 and 18 days, respectively, and both ships worked the most (all 31 days of the months) in July and August 2023 (
Figure 2).
During the year, ship A extracted a total of 1,796,506 m
3, while ship B extracted a larger quantity totaling 1,884,262 m
3, although ship B worked more days per year (
Figure 3).
Ship A excavated the most material in May with 232,918 m
3 and the least in February with 67,795 m
3, while ship B excavated the most material in March with 249,132 m
3, and the least in August with 101,768 m
3 (see
Figure 4).
The total amount of CO
2eq and CO
2 emissions in tons for both ships is shown in
Figure 5. The total emissions of CO
2eq and CO
2 are lower for ship B than for ship A.
The sum of tCO
2eq emissions (represented by bars) and tCO
2 emissions (represented by lines) per month for both ships are shown in
Figure 6. Ship B has lower tCO
2eq and tCO
2 emissions throughout the year.
The total emissions of CO
2eq and CO
2 per month (tCO
2eq and tCO
2) and the average monthly emissions of CO
2eq and CO
2 per working day (tCO
2eq/W.D. and tCO
2/W.D.) for both ships are shown in
Table 3.
The mean monthly CO
2eq and CO
2 emissions per m
3 of excavated material (kgCO
2eq/m
3 and kgCO
2/m
3) as well as the CH
4 and N
2O emissions (in tons) for both ships are listed in
Table 4.
The total monthly/annual amounts of CH
4 and N
2O emissions in tons for both ships were calculated by multiplying the total monthly/annual amount of fuel consumed in tons by the emission factor for CH
4 of 0.00005 gCO
2/g fuel and N
2O of 0.00018 gCO
2/g fuel, which is defined on page 50 of the IMO guidelines [
33].
The average emissions of CO
2eq and CO
2 in tons per working day in the individual months are shown in
Figure 7. The figure clearly shows that CO
2 emissions are lower for all months and throughout the year for ship B, which has a hybrid propulsion.
Figure 8 shows that ship A (with standard diesel propulsion) consumed more fuel oil per year, but also per month (
Figure 9) throughout the year, even though it worked fewer days per year.
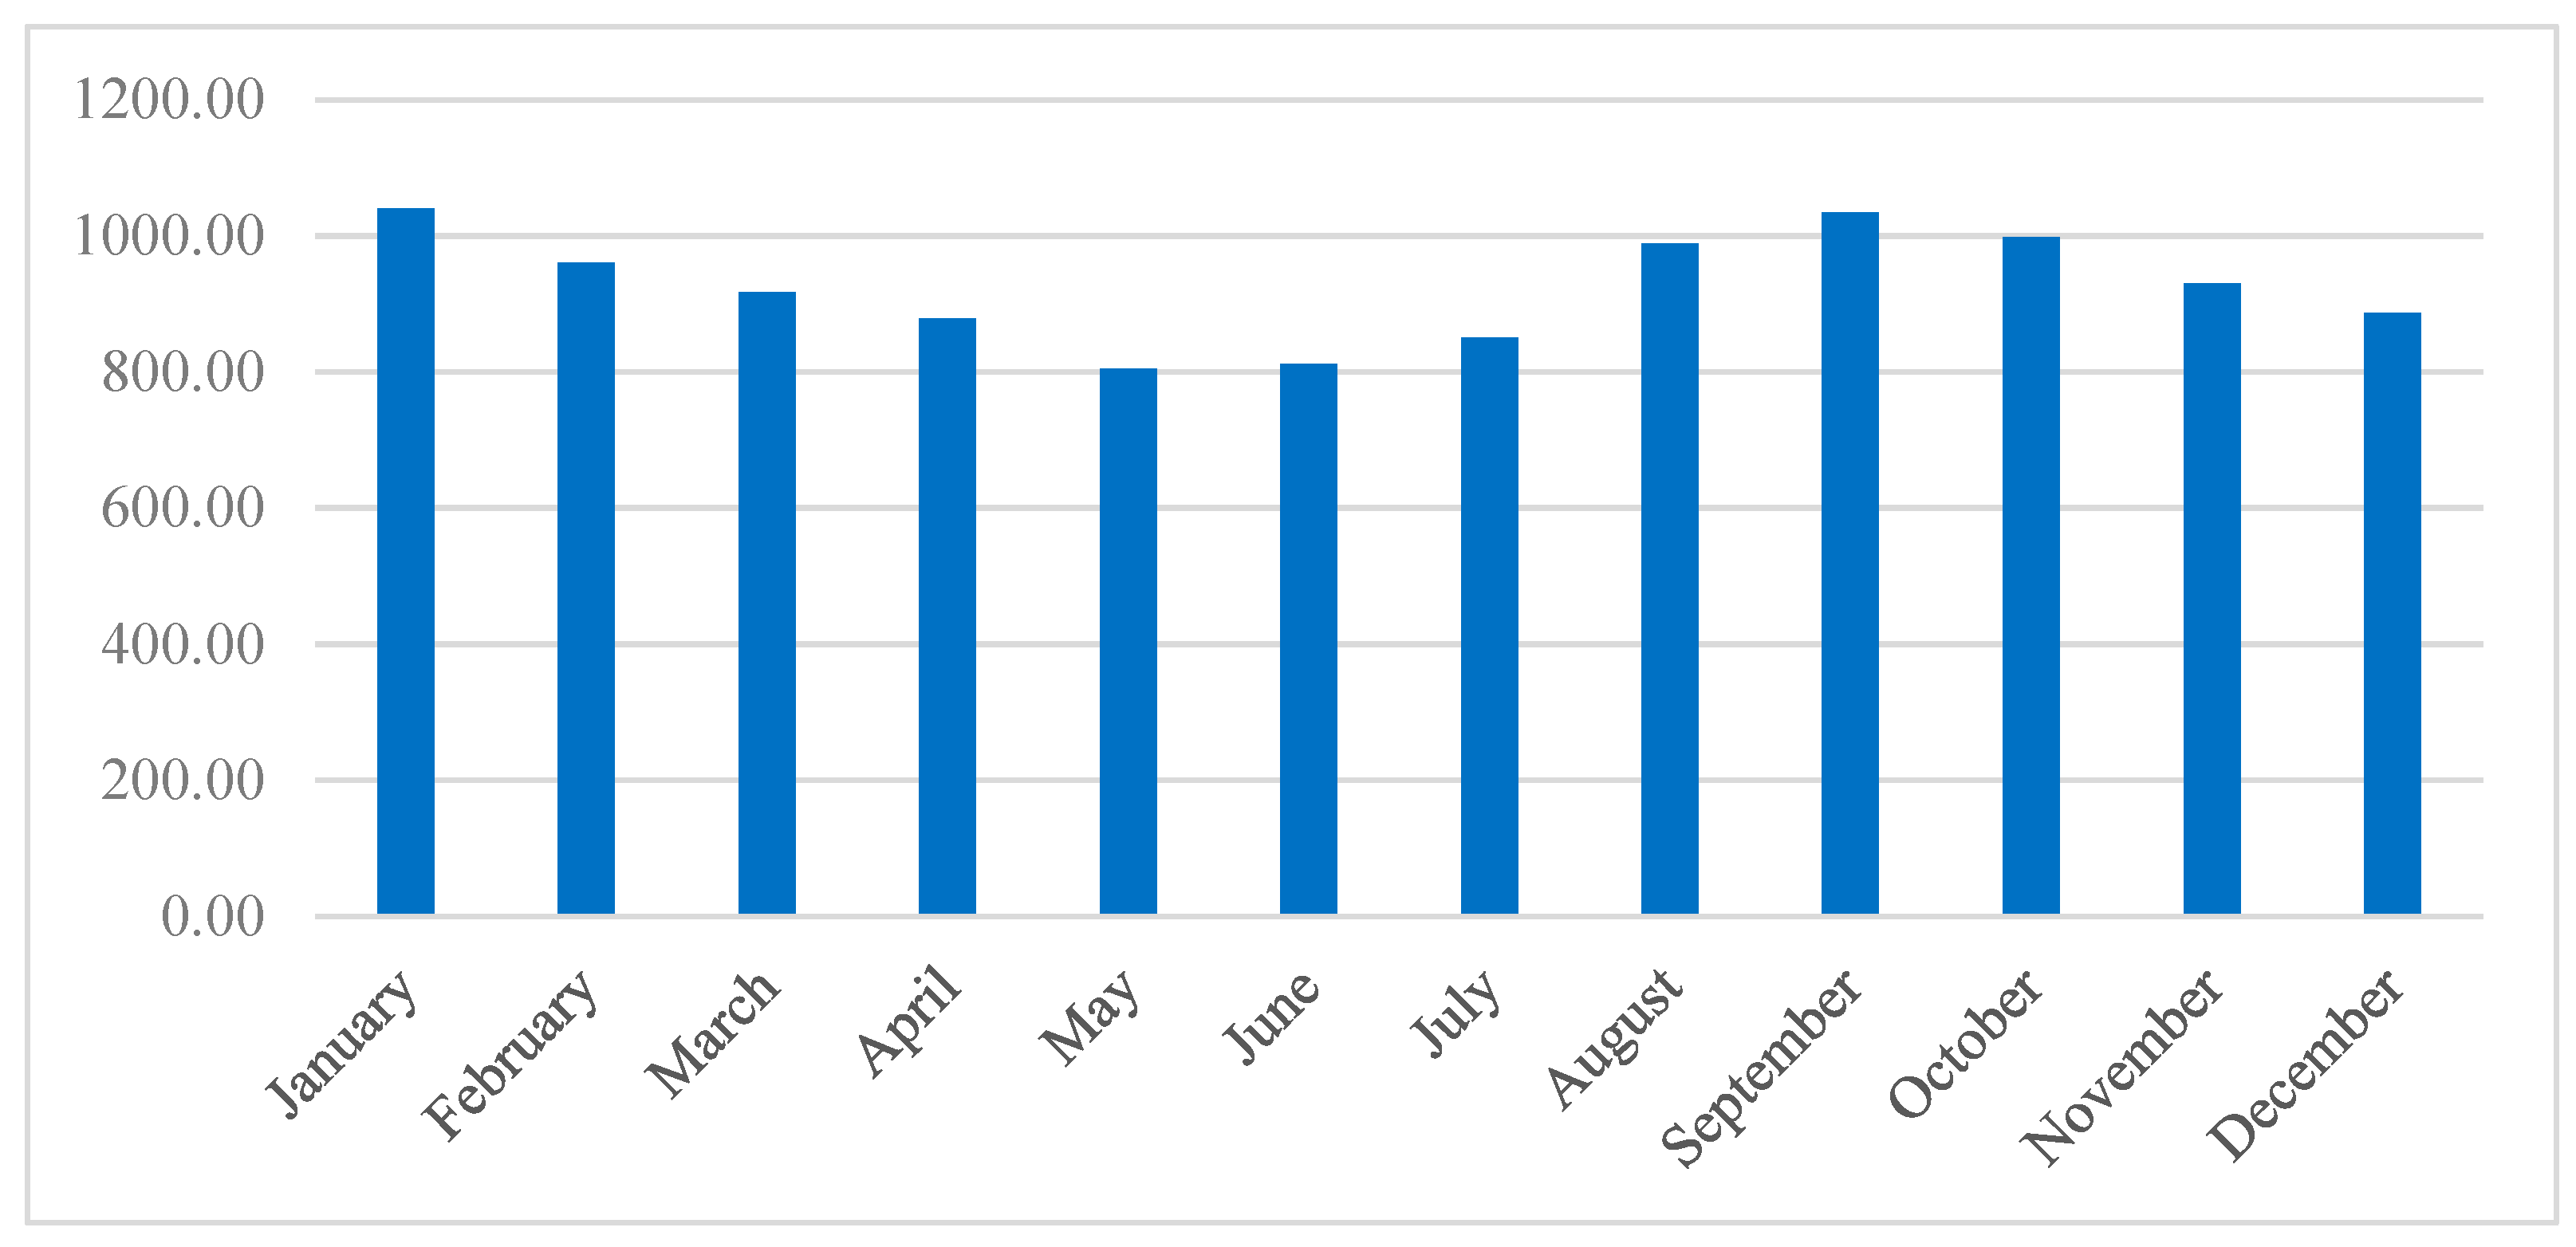
As the purchase price for marine diesel, expressed in USD, changes daily, the monthly average price was taken into account and shown in
Figure 10. The lowest average price was recorded in May 2023 at USD 804.69 and the highest in January at USD 1040.25.
The total annual cost of the ship’s diesel consumption is shown in
Figure 11. The total fuel consumption of ship A was 2510.96 t, and that of ship B was 2135.58 t. This means that Ship A consumed 375.38 t (17.58%) more marine diesel than Ship B (with hybrid propulsion).
The total fuel cost for Ship A was USD 2,310,858.05, while for Ship B it was USD 1,975,883.62. This means that Ship A’s fuel costs are USD 334,974,426 (16.95%) higher than Ship B’s. Ship B’s emissions (6940.64 tCO2eq) are reduced by 1433.95 tCO2eq and Ship B’s emissions (6846.67 tCO2) are reduced by 1203.47 tCO2 compared to Ship A’s 8160.62 CO2).
The lower CO2 emissions (almost 18%) and the annual fuel cost savings of almost USD 335,000 for a single hybrid-powered ship are therefore obvious reasons why shipping companies should try to convert their ships from pure diesel ships to hybrid-powered ships.
The total annual energy (GJ) for both ships was calculated by multiplying the total amount of fuel consumed (in tons) by the lover calorific value of marine diesel, which is also listed on page 50 of the IMO guidelines [
33] and is 0.0427 MJ/g.
The total annual amount of energy produced (kWh) for both ships was calculated by converting the GJ produced into kWh. The conversion factor for 1 GJ is 277.78 kWh. Therefore, the total amount of energy produced in GJ was multiplied by the value of 277.78 to obtain the energy consumed in kWh, which was obtained by burning the fuel for both ships.
The monthly amount of energy generated in GJ and kWh for both ships is listed in
Table 5. By burning more fuel, ship A produced more energy, but also higher CO
2eq and CO
2 emissions, even though it did not excavate more material than ship B.
6. Discussion
By comparing the performance of diesel and hybrid ships, the advantages and disadvantages of both types of propulsion can be determined. The aim is to analyze their impact on the reduction of CO2eq and CO2 emissions, fuel consumption, and fuel costs so that an informed decision can be made on the choice of ship propulsion.
Ship B, with hybrid propulsion, shows a significant reduction in CO2eq and CO2 emissions compared to ship A with standard diesel propulsion. Ship B’s electric motor reduces CO2eq and CO2 emissions at lower speeds and lighter loads. Ship B’s hybrid propulsion enables optimal management between electric and diesel propulsion, resulting in lower CO2eq and CO2 emissions overall. This is particularly useful when it comes to reducing harmful gas emissions and complying with environmental regulations.
The comparison of ship A with standard diesel propulsion and ship B with hybrid propulsion makes it possible to evaluate their contribution to the reduction of CO2eq and CO2 emissions.
Based on specific measurements, it was found that the CO2eq and CO2 emissions of ship B are significantly lower than those of ship A. This difference results from a combination of the use of electricity and a lower load on ship B’s propulsion engine.
Ship B’s hybrid propulsion represents a sustainable alternative to conventional diesel propulsion and thus contributes to the reduction of overall greenhouse gas emissions in the maritime transport sector. When comparing the CO2eq and CO2 emissions of marine diesel and hybrid engines, the amount of carbon dioxide emitted during engine operation is measured.
The comparison of CO2eq and CO2 emissions between these two engines is important as it provides a better understanding of the environmental impact of each engine and contributes to the development of more sustainable modes of transport.
The CO
2 emission factor is the CO
2 emission factor expressed in tons per ton of fuel consumed. This factor indicates how many tons of CO
2eq and CO
2 are emitted during the combustion of one ton of fuel. The emission factor of CO
2eq is 3.2499 tCO
2eq [
34], while the emission factor for CO
2 is 3.206 tCO
2 [
33] of marine diesel/gas oil (ISO 8217 Grades DMX, DMA, DMZ, and DMB maximum 0.10% S). One ton of fuel consumed emits 3.2499 tCO
2eq or 3.206 tCO
2,
Ship A worked a total of 323 days in 2023, excavated a total of 1,796,506.00 m3 of material, and consumed a total of 2510.96 tons or 2954.07 m3 of marine diesel.
Ship B worked a total of 360 days (i.e., 37 or 10.28% more days than ship A), excavated a total of 1,884,262.00 m3 (i.e., 87,756 m3 or 4.66% more than ship A) of material and consumed a total of 2135.58 tons (i.e., 375.38 tons or 17.58% less than ship A) and 2512.45 m3 (i.e., 441.62 m3 or 17.58% less than ship A) of marine diesel respectively.
In terms of CO2eq2 and CO2 emissions, ship A has total annual emissions of 8160.62 tCO2eq and 8,050,142 tCO2 respectively, average total emissions of 25.26 tCO2eq/day, 24.92 tCO2/day; average annual emissions per m3 of excavated material of 4.54 kgCO2eq/m3, 4.48kgCO2/m3; total annual emissions of CH4 of 0.126t and N2O of 0.452t.
Ship B has total annual emissions of 6940.64 tCO2eq (or 1219.946 tCO2eq or 17.58% less than ship A), 6846.67 tCO2 (or 1203.47 tCO2 or 17.58% less than ship A); average total emissions of 19.28 tCO2eq/day (or 5.985 tCO2eq/day or 31.05% less); 19.02 tCO2/day (i.e., 5.90 tCO2/day or 31.05% less than ship A); average annual emissions per m3 of excavated material of 3.68 kgCO2eq/m3 (i.e., 0.859 kgCO2eq/m3 or 23.32% less than ship A); total annual quantities of CH4 0.107 t (or 0.019 t or 17.58% less than ship A) and N2O 0.384t (or 0.068 t or 17.58% less than ship A).
The total energy produced by the operation of the propulsion engine of ship A was 107,218.04 GJ or 29,782,789.79 kWh, and the total fuel cost was USD 2,310,858.05.
Ship B produced a total of 91,189.34 GJ (or 16,028.71 GJ or 17.5 less than ship A) by operating its engines, i.e., 25,330,370.24 kWh (i.e., 4452,418.55 kWh or 17.58% less than ship A) and total fuel costs of USD 1,975,883.62 (i.e., USD 334,974.43 or 16.95% less than ship A).
Since the objective is to reduce CO2eq and CO2 emissions, it can be concluded based on the above elements that ship B has a lower environmental impact on all parameters.
Total working days (W.Ds.), total fuel consumption (F.C. in tons and m
3), total emissions of CO
2eq and CO
2 (tCO
2eq and tCO
2), average annual emissions of CO
2eq and CO
2 per working day (tCO
2eq/W.D. and tCO
2/W.D.), the average annual CO
2eq and CO
2 emissions per m
3 of excavated material (kgCO
2eq/m
3 and kgCO
2/m
3), the total annual emissions of CH
4 and N
2O (tCH
4 and tN
2O), the total annual energy generated (GJ and kWh) and the total annual fuel consumption (USD) for both ships are shown in
Table 6.
The results obtained show that the hybrid propulsion system of ship B achieves considerable savings in fuel consumption compared to the diesel propulsion system of ship A. The introduction of hybrid propulsion on ships has the potential to reduce fuel costs, thereby saving financial resources and contributing to the sustainability of the ship, the company, and maritime transport.
7. Conclusions
Technological progress plays a key role in reducing GHG emissions in the maritime economy and forms the basis for the future of this process. Advanced technologies such as smart ships, electric and hybrid propulsion systems, energy-efficient engines and fuels, and the reduction in exhaust gasses enable a significant reduction in GHG emissions. The future of reducing GHG emissions lies in the development of new technologies such as the use of hydrogen and fuels from renewable energy sources and the use of carbon capture and storage technologies.
Through continued technological progress, the maritime industry will be able to achieve its GHG emission reduction targets and become a more sustainable and environmentally friendly industry in the future. The decarbonization of the maritime industry is a complex and multi-faceted challenge that requires the combined efforts of shippers, governments, international organizations, and technological innovators.
The industry is moving towards a more sustainable future, driven by a combination of regulatory pressure, market forces, and environmental awareness. Given the growing awareness of environmental protection and the need to reduce GHG emissions, hybrid marine engines represent a promising technology for reducing CO2eq and CO2 emissions in the maritime sector.
After a comparative analysis of the performance of standard diesel ship A and ship B with hybrid propulsion, it can be concluded that ship B with hybrid propulsion has significant advantages in reducing CO2eq and CO2 emissions, fuel consumption, and fuel costs. The hybrid propulsion on board ship B utilizes a combination of diesel and electric engines, which enables lower fuel consumption (almost 18%) and a reduction in CO2eq and CO2 emissions (almost 18%) during operation. According to the research results, the ship with hybrid propulsion, B, achieves a reduction in CO2eq and CO2 emissions of almost 18% compared to ship A with standard diesel propulsion. The fuel costs for the ship with hybrid propulsion, B, are also 17% lower. These results show that the hybrid propulsion of ship B is a more energy-efficient and environmentally sustainable option compared to the standard diesel propulsion of ship A. Based on the analyses carried out, several conclusions can be drawn. Firstly, diesel and hybrid engines have significantly different CO2eq and CO2 emissions. Diesel engines produce a higher amount of CO2eq and CO2 than hybrid engines. Secondly, CO2eq and CO2 emissions from diesel engines contribute to the greenhouse effect and climate change. Thirdly, hybrid engines are more environmentally friendly in terms of CO2eq and CO2 emissions than conventional drive energy, which reduces overall CO2eq and CO2 emissions.
The numerically expressed (in %) total savings for ship B with hybrid propulsion by item are the annual total emissions of tCO2eq (17.58%); the annual total emissions of tCO2 (17.58%); the annual mean tCO2eq/day (31.05%); the annual mean tCO2/day (31.05%); the annual mean CO2eq/m3 excavated (kgCO2eq/m3) (23.32%); the annual mean value of CO2/m3 excavated (kgCO2/m3) (23.32%); the total annual emissions of CH4 (t) (23.32%) and total annual emissions of N2O (t) (23.32%); and the total annual fuel cost (16.95%).
The analysis carried out has shown that hybrid engines are a more cost-effective and preferable choice for ship propulsion to make the business of shipping companies more profitable while reducing CO2eq and CO2 emissions and protecting the environment. The results obtained have far-reaching implications for the global fight against climate change, as reducing CO2eq and CO2 emissions from marine engines helps to protect the environment.
Further research should focus on the development and introduction of hybrid engines as a viable alternative for maritime transport, and also utilize machine learning algorithms (such as classification, regression, and time prediction methods).


