Article

A Proposed Methodology for the Dynamic Standard Evaluation of Water Quality in Estuaries: A Case Study of the Pearl River Estuary

1
South China Sea Environment Monitoring Center, State Oceanic Administration, Guangzhou 510300, China
2
Key Laboratory of Marine Environmental Survey Technology and Application, Ministry of Natural Resources, Guangzhou 510300, China
3
Key Laboratory of Marine Ecosystem Dynamics, Second Institute of Oceanography, Ministry of Natural Resources, Hangzhou 310012, China
4
College of Light Industry and Food, Zhongkai University of Agriculture and Engineering, Guangzhou 510225, China
*
Author to whom correspondence should be addressed.
J. Mar. Sci. Eng. 2024, 12(7), 1039; https://doi.org/10.3390/jmse12071039
Submission received: 23 April 2024 / Revised: 16 June 2024 / Accepted: 17 June 2024 / Published: 21 June 2024
(This article belongs to the Section Chemical Oceanography)

Abstract

:
Currently, China’s river water quality evaluation adopts the “Environmental Quality Standards for Surface Water”, while the seawater quality evaluation uses the “Seawater Quality Standard”. However, estuarine areas, where rivers meet the sea, do not have evaluation standards, and most often, the “Seawater Quality Standard” is applied. At present, the water quality in the estuary area sometimes exceeds the corresponding seawater quality standards, even though the quality of the surface water does not exceed surface water environmental quality standards and the quality of the seawater before mixing also meets the seawater quality standards. This paper proposes a dynamic evaluation standard based on the salinity of estuarine water and uses this standard to evaluate the water quality in estuaries, thus solving the abovementioned issue. The implementation of this method is simple and effective. Taking the Pearl River Estuary as an example, this paper introduces the dynamic standard evaluation method for water quality in the Pearl River Estuary. Compared to the existing seawater quality standards implemented in estuaries, this dynamic evaluation standard can assess the water quality in estuaries more accurately and provide a reference for water quality evaluation methods in estuaries.

1. Introduction

The estuary is a transition water between river and marine ecosystems, where marine processes and estuarine processes intersect complexly under the combined influence of freshwater input, tides, and tidal currents. Different water masses undergo lateral and vertical mixing and have salinity gradients. The salinity at the upstream starting point of the estuary is close to upstream incoming water, while the salinity at the downstream terminal of the estuary is close to seawater [1]. There are very few estuarine systems in the world unaffected by upstream manipulation of their freshwater inflow [2]. Therefore, the estuary is a special area distinct from rivers and oceans, with unique objective natural attributes and characteristics. Due to its special geographical location, the estuary plays a crucial role in national socio-economic development and water environment management and also has a significant impact on the water quality of coastal waters [3,4,5]. So far, there is no universally agreed-upon targeted evaluation method for the ecological health of estuaries globally [6].
Currently, China lacks water quality evaluation standards for estuaries [7]. There is the “Seawater Quality Standard” (GB3097-1997) [8] for seawater quality evaluation and the “Environmental Quality Standards for Surface Water” (GB3838-2002) [9] for surface water quality evaluation. However, the corresponding assessment method of the “Seawater Quality Standards” is used directly for the environmental quality assessment of the estuary area and its surrounding waters. The evaluation results often do not align with reality, which is unfavorable for the development, construction, management, and protection of estuaries.
Quan et al. [10] used the Class II seawater quality standards in the “Seawater Quality Standard” (GB3097-1997) to analyze and evaluate the estuarine areas entering the sea in Qinhuangdao. The results showed that the primary pollutants in the estuaries entering the sea in Qinhuangdao are soluble inorganic nitrogen and soluble inorganic phosphorus. The organic pollution in the Dapu River estuary, Tanghe River estuary, and Xinkai River estuary is more serious; the Dapu River estuary, Tanghe River estuary, and Yanghe River estuary are in a state of severe eutrophication, followed by the Daihe River estuary, Xinkai River estuary, and Shihe River estuary. When evaluating the estuaries entering the sea in Qinhuangdao according to the “Seawater Quality Standard” (GB3097-1997), the result was moderate pollution in most areas [10].
Li et al. [1] delimited the estuarine mixing zone and established standard nutrient limits. They divided the nutrient concentration at the estuarine mixing zone into two parts: nutrients sourced from seawater and those sourced from surface water, with the “Seawater Quality Standard” being used for the former and the “Environmental Quality Standards for Surface Water” (multiplied by the conversion coefficient K) for the latter. Then, the evaluation results of the two parts were combined into a formula, which represents the standard nutrient formula for the estuarine mixing zone [1]. However, the steps and formulas are relatively complex, and they are specifically designed for nutrient salts.
The water area of the estuary is completely different from the sea area. At present, the international evaluation methods for estuarine water environment are primarily grouped into five categories [11]: the “nutrient status evaluation method based on the load–response relationship conceptual model” [12,13,14,15], the “pressure–state–response (PSR) indicator structure model” [16,17], the “biological evaluation method based on community level” [14,18,19,20], the “water quality–aquatic organism joint evaluation method based on ecosystem health” [18,21], and the “comprehensive ecological condition evaluation method” [22]. Many countries have set up agencies running monitoring programs for surface water quality based on standards that include safety limits for parameters that can pose a threat to aquatic ecosystems. Such parameters include nutrients, organics, inorganics, and micropollutants [23]. Other factors impacting water quality are variations in specific environmental indicators such as an increase in biomass, potentially toxic element concentrations, loss of corals, limited biodiversity, nutrient pollution, toxins produced from harmful algal blooms, and microplastics [24]. The limits defined in each standard vary from country to country as determined by their reality. Among the globally recognized standards are the Australian and New Zealand Guidelines for Fresh and Marine Water Quality (2000) supported by the Australian and New Zealand Environment and Conservation Council (ANZECC). The lack of integrated assessment methods for the translation of individual measurements into an overall assessment of water quality is still an issue in low- and middle-income countries, which revert to foreign standards as a reference to assess their water quality [25].
Some countries do not yet possess surface water quality standards. As part of the Pacific Islands, Fiji has yet to complete its own, robust surface water quality baseline standards and mainly uses its national liquid waste standard from the Environmental Management (waste disposal and recycling) Regulations (Government of Fiji 2007), which characterize the quality of water meant for discharge only [26]. Lal et al. [26] assessed the water quality of the Suva foreshore for the establishment of estuary and marine recreational water guidelines in the Fiji Islands. Li et al. [27] constructed a water quality index (WQI) to evaluate water quality in an estuary region. Tri et al. [28] used a few 1D and 2D models to simulate and calculate the water level and water quality regarding four state variable (DO, NH4, NO3, and BOD5) observations in the main rivers and coastal estuaries on the Ca Mau peninsula.
No matter which method is used to establish a separate water quality standard for estuaries, it will take a considerable amount of time, as will revising the “Environmental Quality Standards for Surface Water” (GB3838-2002) and the “Seawater Quality Standard” (GB3097-1997).
Therefore, there is an urgent need for a simple, globally applicable, and practical dynamic evaluation method for water quality in estuaries. Taking the Pearl River Estuary (PRE) as an example, this paper formulates a dynamic standard for water quality evaluation in estuaries based on the current “Environmental Quality Standards for Surface Water” and “Seawater Quality Standard”. The newly established standard is applied to evaluate the water quality of the PRE, aiming to provide an effective reference for scientifically and reasonably evaluating the water environment quality of estuaries and offshore areas and improving the quality of environmental management.

2. Method Construction

2.1. Classification of Seawater Quality in the Seawater Quality Standards

The seawater quality standard divides seawater quality into four categories based on the use, function, and protection objectives of the sea area, covering 39 water quality indicators and 33 pollutants, including sensory parameters, basic environmental parameters, nutrients, and oxygen-consuming substances, as well as potentially toxic elements, some toxic and harmful organic pollutants, and radionuclides. The specific parameters are as follows: floating substances, color and odor, coliform bacteria, fecal coliform bacteria, pathogens, water temperature, pH, DO, COD (if using the alkaline permanganate method, this should be PI), BOD5, inorganic nitrogen (calculated as N), non-ionic ammonia (calculated as N), active phosphate (calculated as P), Hg, Cd, Pb, Cr6+, As, Cu, Zn, Se, Ni, cyanide, sulfide (calculated as S), volatile phenol, petroleum, BHC, DDT, malathion, methyl parathion, Benzo (a) pyrene, anionic surfactant (calculated as LAS), and radionuclides (60Co, 90Sr, 106Rn, 134Cs, and 137Cs). This provides a strong guarantee for the safety of China’s seawater quality and its marine ecosystem [8].
Based on the different usage functions and protection objectives of sea areas, seawater quality is divided into four classifications:
Class I: Suitable for marine fishery waters, marine nature reserves, and protected areas for rare and endangered marine organisms.
Class II: Suitable for aquaculture areas, seawater bathing beaches, sea sports or entertainment areas where humans have direct contact with seawater, and industrial water areas directly related to human consumption.
Class III: Suitable for general industrial water areas and coastal scenic areas.
Class IV: Suitable for marine port waters and marine development operation areas [8].

2.2. Surface Water Function and Standard Classification in Surface Water Environmental Quality Standards

The surface water environmental quality standards categorize surface water bodies into five classes based on their environmental functions and protection objectives, specifying the parameters, limits, and analytical methods that should be adhered to for maintaining water quality. There are 24 basic items involved, with specific parameters as follows: water temperature, pH, DO, PI, COD, BOD5, NH3-N, total phosphorus (calculated as P), total nitrogen (for lakes and reservoirs, calculated as N), Cu, Zn, fluoride (calculated as F), Se, As, Hg, Cd, Cr6+, Pb, cyanide, volatile phenol, petroleum, anionic surfactant, sulfide, and the fecal coliform group [9].
Based on the environmental function and protection objectives of surface water, surface water is classified into five classifications in order of function:
Class I: Mainly applicable to source water and national nature reserves;
Class II: Mainly applicable to first-level protected areas of concentrated drinking water sources for surface water, habitats of rare aquatic organisms, spawning grounds for fish and shrimp, feeding grounds for young and larval fish, etc.;
Class III: Mainly applicable to second-level protected areas of concentrated drinking water sources for surface water, overwintering grounds for fish and shrimp, migration channels, fishery waters such as aquaculture areas, and swimming areas;
Class IV: Mainly applicable to general industrial water areas and entertainment water areas without direct human contact;
Class V: Mainly applicable to agricultural water areas and water areas with general landscape requirements.
Corresponding to the above five types of water area functions of surface water, the standard values of the basic items of the surface water environmental quality standards are divided into five categories and different functional categories implement the corresponding category’s standard values. The standard value of a higher water area function category is stricter than that of a lower water area function category. If a water area has multiple usage functions, the standard value corresponding to the highest functional category shall be implemented. Achieving water area functions and meeting functional category standards have the same meaning [9].

2.3. Construction of Dynamic Standard Methods for Water Quality in Estuarine Areas

In comparison, Class I of surface water can be listed separately. The protection objectives and use function scopes of Class I seawater and Class II surface water are similar, which can be roughly considered as corresponding relationships. Class III surface water and Class II seawater can also be roughly corresponded. Similarly, Class IV surface water corresponds to Class III seawater, and Class V surface water corresponds to Class IV seawater, as shown in Table 1.
According to the “Seawater Quality Standard” and the “Environmental Quality Standards for Surface Water”, the following steps are taken to formulate dynamic water quality standards for estuaries based on salinity monitoring data at estuarine monitoring points:
(1) The Class I standard for seawater corresponds to the Class II standard for surface water. Assuming that the salinity of the water quality in the estuary area is S, AI represents the Class I standard for a certain element in seawater, and BII represents the Class II standard for the same element in surface water. The dynamic standard value CI for the water quality monitoring element in the estuary area of Class I can be calculated using the formulae below.
When AI < BII, the formula is: CI = AI + (BII − AI) × (35-S)/35;
When AI > BII, the formula is: CI = BII + (AI − BII) × S/35;
When AI = BII, it is not necessary to calculate the dynamic standard value, and direct evaluation is sufficient.
The unit of S is ‰, 0 < S < 35; the dynamic standard values CII, CIII, and CIV for class II, III, and IV are calculated accordingly.
(2) Suppose the actual value of a water quality element measured in the estuary area is Cd.
(3) Compare the actual measured value Cd of water quality monitoring elements with the dynamic standard value in Step (1). Compare the values of Cd with those of CI, CII, CIII, and CIV.
When Cd ≤ CI, the water quality in the estuary area is classified as Class I;
When CI < Cd ≤ CII, the water quality in the estuary area is classified as Class II;
When CII < Cd ≤ CIII, the water quality in the estuary area is classified as Class III;
When CIII < Cd ≤ CIV, the water quality in the estuary area is classified as Class IV;
When the water quality meets the standards of Class I, II, III, and IV at the same time, it shall be defined as Class I (because when the water quality meets the standards of Class I, it certainly meets the standards of Class II, III, and IV as well); when it meets the standards of Class II, III, and IV at the same time, it shall be defined as Class II; and so on. DO is a special case, the above ≤ and < need to be changed to ≥ and >.
At present, the dynamic water quality standards for estuaries can encompass the following parameters: pH, dissolved oxygen (DO), permanganate index (PI), 5-day biochemical oxygen demand (BOD5), lead (Pb), copper (Cu), zinc (Zn), arsenic, cadmium (Cd), hexavalent chromium, cyanide, anionic surfactants, sulfides, selenium, mercury (Hg), volatile phenols, and fecal coliforms. These monitoring factors are the same in the “Seawater Quality Standard” and the “Environmental Quality Standards for Surface Water”. These factors can all be evaluated using this method, but this article selects eight representative factors (Pb, pH, PI, DO, Cu, Zn, Cd, and Hg) for evaluation. This is because the evaluation methods used are similar.
When the monitoring factor is pH, the upper limit dynamic standard value and lower limit dynamic standard value are calculated according to the formula, and the resulting dynamic standard value is the interval dynamic standard value. When the actual measured pH value falls within the interval dynamic standard value, the water quality pH is classified as this class.

3. Application Example: Evaluation of Water Quality in the PRE (Pb, pH, PI, DO, Cu, Zn, Cd, and Hg)

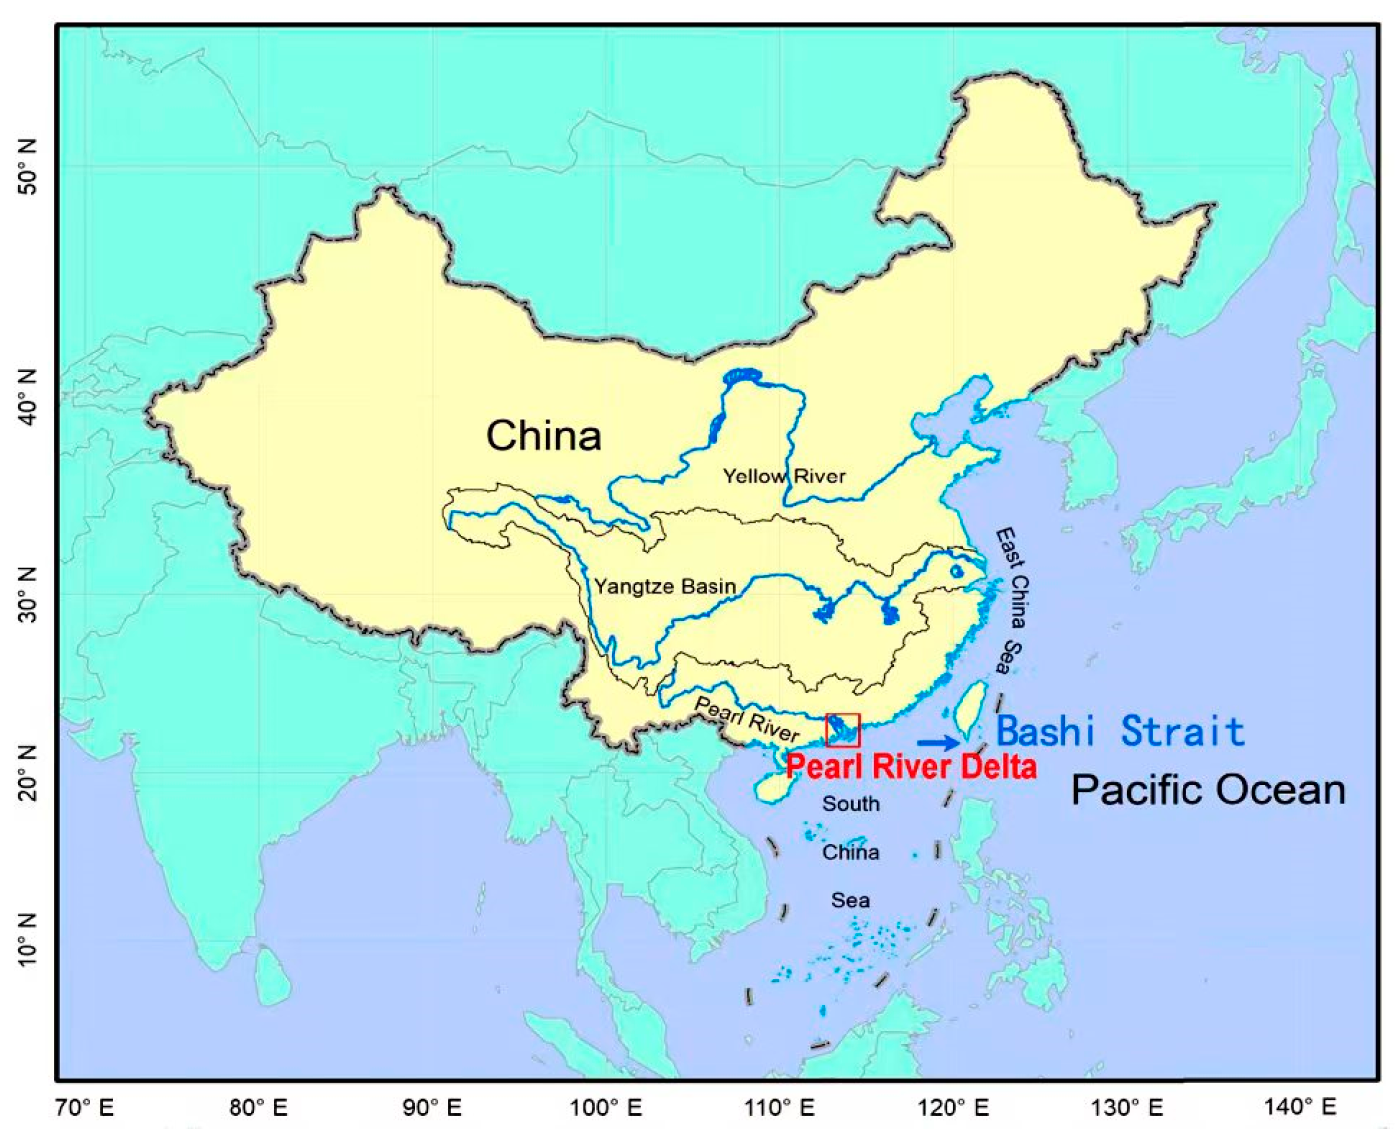
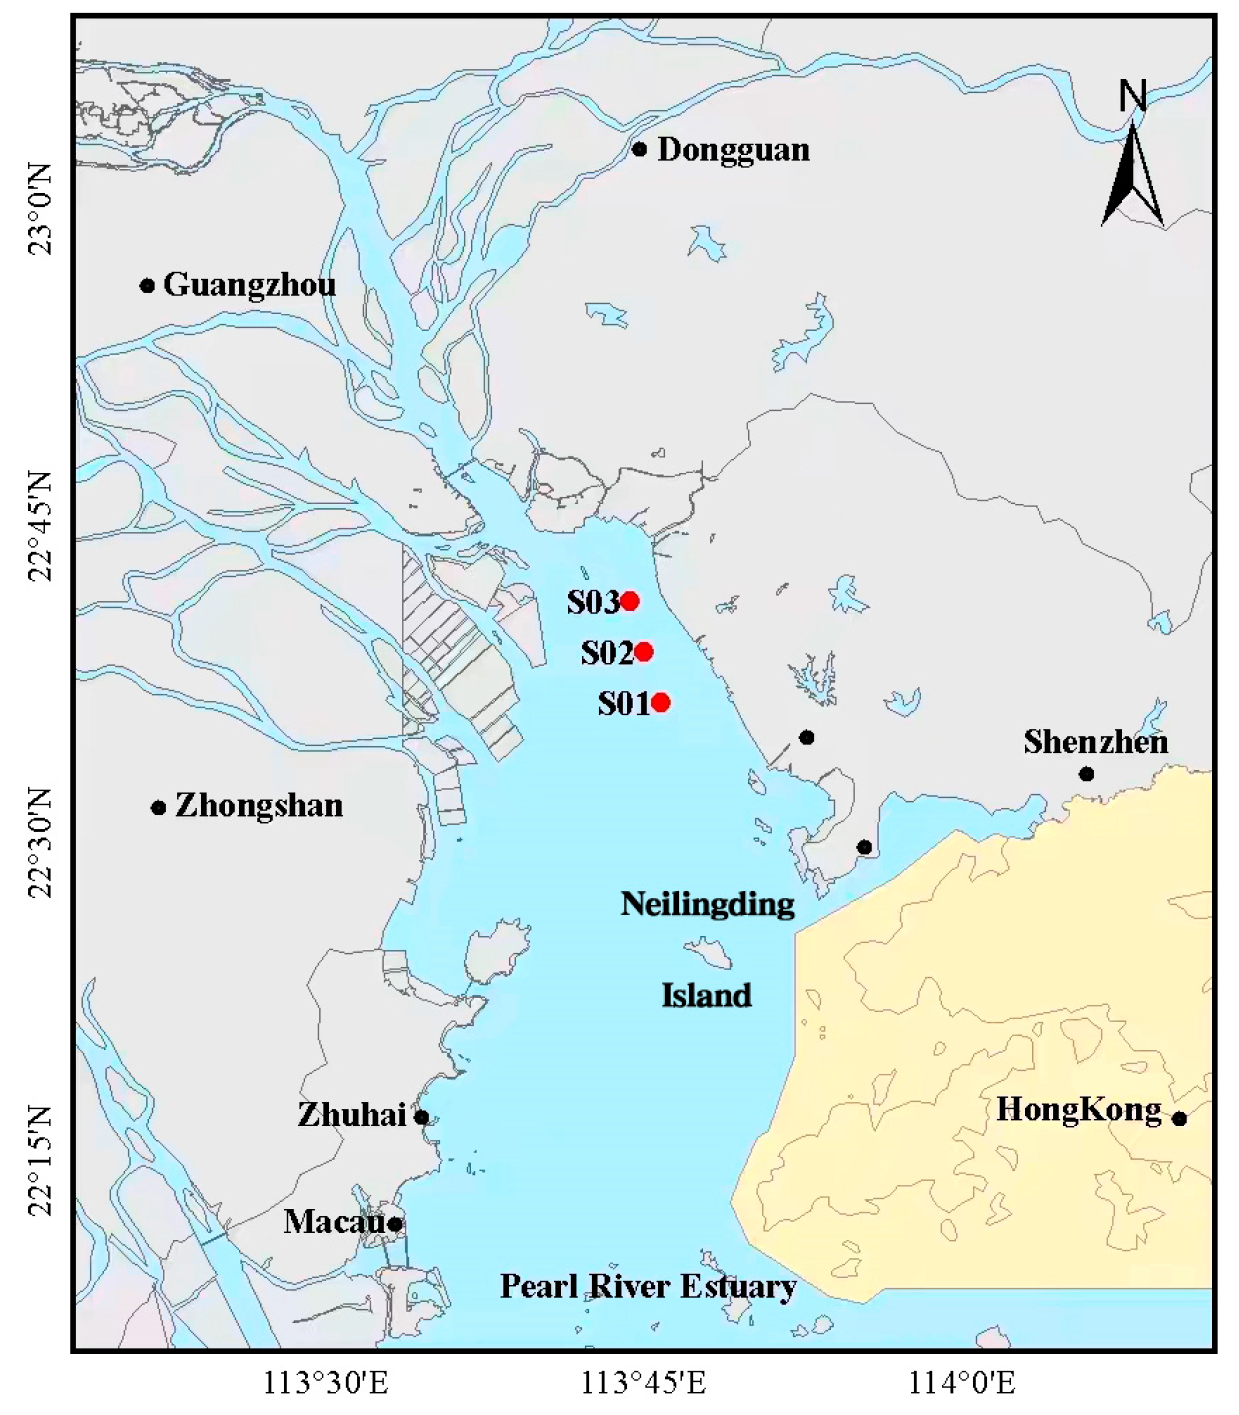
3.1. Description of the Monitoring Area

This study is carried out in the PRE (as shown in Figure 1 and Figure 2). The PRE is located in the northern part of the South China Sea, which is a typical subtropical estuary. The Pearl River Basin is the largest water system in southern China, originating in Yunnan and flowing through Guangxi and Guangdong with a total length of 2.2 × 10³ km. It converges into the South China Sea in the vast delta region to the south of Guangzhou and west of Hong Kong. The Pearl River Basin covers an area of 4.5 × 10⁵ km2, with an annual runoff of 3.5 × 10¹¹ m3, 80% of which occurs during the flood season (April to September). It is the second-largest river in China in terms of runoff. The annual runoff sediment is 8.5 × 10¹⁰ kg. The freshwater flows into the South China Sea via eight outlets at Humen (HUM), Jiaomen (JIM), Hongqimen (HQM), Hengmen, (HEM), Modaomen (MDM), Jitimen (JTM), Hutiaomen (HTM), and Yamen (YAM). The Hong Kong and Macao Special Administrative Regions are located on the east and west sides of the Pearl River Estuary, respectively. The tide of the Pearl River Estuary is formed by the Pacific Ocean tide wave, which enters the Pearl River Estuary through the Bashi Strait and crosses the South China Sea and is influenced by factors such as topography, runoff, and meteorology. The ratio of (HK1 + H01)/HM2, which reflects the nature of the tide, ranges from 0.94 to 1.77, indicating that the tide in the estuary area is an irregular semidiurnal tide. The tidal coefficient ranges from 0.53 to 1.41. The movement of the tidal current is greatly influenced by the topography. The tidal current in the waterway between the north islands of Neilingding and near the eight estuaries flows northward during the flood tide and southward during the ebb tide. The tidal current movement in other sea areas is greatly influenced by the tidal wave, with the flood tide tending to the west and the ebb tide tending to the east. The vertical exchange of water layers is better in winter than in summer, and there is a more obvious stratification phenomenon in summer. Even if stratification occurs, this standard is still applicable because it is a dynamic standard. The salinity and other factors of the collected water samples are tested using real-time dynamic detection. The salinity and other factors are closely related to the degree of mixing of river water and seawater [29].

3.2. Sample Collection and Analysis

The survey was conducted in the PRE in 2004-10. The investigation is divided into ebb tide and flood tide. The sampling sites (S01, S02, and S03) in this estuary are presented in Figure 2. Station S01 is located at 113.763° E longitude and 22.610° N latitude. Station S02 is located at 113.750° E longitude and 22.650° N latitude. Station S03 is located at 113.739° E longitude and 22.690° N latitude. S1 appears downstream and S3 appears upstream during the flood tide. Water samples at different water layers (surface and bottom) were collected in Niskin bottles. Parameters included water depth, salinity, Pb, pH, PI, DO, Cu, Zn, Cd, and Hg. Depth was measured in situ using a leading beacon [30]. Salinity was analyzed in the laboratory by a salinity meter (SYA2-2 Salinity Meter, Tianjin Xinhanyang Precision Instrument Technology Co., Ltd., Tianjin, China) [30]. pH was determined on-site using the pH electrode method [31] (PHS-3C Precision pH Meter, Shanghai INESA Scientific Instrument Co., Ltd., Shanghai, China). PI concentration was determined on-site using the alkaline permanganate (sodium thiosulfate titration) method [31]. DO concentration was determined on-site using the iodometry (sodium thiosulfate titration) method [31]. To measure the dissolved potentially toxic elements, 500 mL water samples were filtered through a pretreatment fiberglass membrane (pore size = 0.45 μm) in the field using a Thermo Scientific Nalgene 300-4100 Polysulfone Filter Holder with a Receiver (Waltham, MA, USA). Next, 100 mL aliquots of the filtrates were immediately acidified with dilute nitric acid to pH < 2 and then stored at 4 °C. Meanwhile, 500 mL water samples were collected for sub-samples [32]. The Pb, Cu, Zn, and Cd concentrations were determined by anodic stripping voltammetry [33] (HY-1E Polarograph, Qingdao Jipu Instrument Co., Ltd., Qingdao, China). Hg was determined using the atomic fluorescence method [34] (AFS-8130 Dual Channel Atomic Fluorescence Spectrophotometer, Beijing Jitian Instrument Co., Ltd., Beijing, China).

3.3. Analytical Quality Assurance

The reagents used for analytical purposes were of analytical grade or higher. Blank samples and replicates were used for quality assurance and quality control. The analytical detection limits were 0.3 μg/L for Pb, 0.8 μg/L for Cu, 1.8 μg/L for Zn, 0.20 μg/L for Cd, and 0.008 μg/L for Hg. The accuracy of determining potentially toxic elements was checked using a certified reference material (GSB 04-1767-2004, National Analysis and Testing Center for Nonferrous Metals and Electronic Materials, Beijing, China). Multiple measurements with relative standard deviations within 10% were accepted, and other samples were reanalyzed. The variance of the standard curve in this study was greater than 0.9999. The recovery of dissolved potentially toxic elements was >90% [33].

3.4. Results

Table 2 shows the seawater quality standard (GB3097-1997) values of Pb, pH, PI, DO, Cu, Zn, Cd, and Hg, ranging from Class I to Class IV.
Table 3 presents the surface water environmental quality standards (GB3838-2002) values of the aforementioned eight parameters, from Class II to Class V.
The results of on-site monitoring of the aforementioned eight parameters and salinity at the PRE are shown in Table 4.
When S = 16.453, the AI of Pb is 0.001 mg/L, the BII of Pb is 0.01 mg/L, and the CI of Pb is AI + (BII − AI) × (35 − 16.453)/35. The calculation methods for CII, CIII, and CIV of Pb are analogous.
Water quality assessment results in the PRE according to the Seawater Quality Standards are shown in Table 5.
As shown in Table 5, the values of Cu, Zn, Cd, and Hg all meet the Class I standard for seawater. As the Class II standard for surface water is higher than that for seawater, there is no need to calculate the dynamic standard value. It can be directly evaluated as Class I. As the values of Pb, pH, PI, and DO exceed the values of the Class I standard, the dynamic standard value needs to be calculated. The calculation results are shown in Table 6, Table 7, Table 8 and Table 9.
According to the new method in this paper, the water quality evaluation results of Pb, pH, PI, and DO in the PRE are shown in Table 10.
From the above results, it can be seen that the Pb, pH, and PI evaluation results of water quality in the PRE are different based on whether the seawater quality standards or the water quality dynamic standards were used as the evaluation method. An evaluation method based on the water quality dynamic standards in estuarine areas is more scientific, reasonable, and in line with the actual situation of marine environmental monitoring. The salinity of water in the estuarine area reflects the degree of mixing between river water and seawater. The new method effectively connects the surface water quality evaluation standards with the seawater quality standards.

4. Discussion

(1) The dynamic water quality standard for the Estuary District is based on the Environmental Quality Standards for Surface Water, the Sea Water Quality Standards, and the dynamic salinity of the water quality in the Estuary District. The prerequisite is that the monitoring elements involved in the two standards are the same. The Sea Water Quality Standards involve a total of 39 water quality indicators, while the Environmental Quality Standards for Surface Water involve 24 basic items. Seventeen monitoring elements are the same in the two standards: pH, DO, PI, BOD5, Cu, Zn, Se, As, Hg, Cd, Cr6+, Pb, cyanide, volatile phenol, anionic surfactants, sulfide, and the fecal coliform group. Therefore, for now, the dynamic standard of water quality in the Estuary District can only evaluate these 17 parameters.
(2) The analysis method for petroleum in the Environmental Quality Standards for Surface Water is infrared spectrophotometry, while the analysis method for petroleum in the Sea Water Quality Standards is cyclohexane extraction fluorescence spectrophotometry, ultraviolet spectrophotometry, or the gravimetric method. The analysis methods of the two standards determine the final test results of petroleum represented by different components of the petroleum mixture in the sample, which inevitably results in the “petroleum” referred to in the two standards not being the same substance or mixture. Therefore, petroleum cannot be evaluated using the water quality dynamic standards for estuary areas.
(3) The Environmental Quality Standards for Surface Water involve PI and COD, while the Sea Water Quality Standards only involve COD, and the analysis method for COD is the alkaline permanganate method. The oxidation rate of potassium dichromate for organic matter in water samples is generally around 90%, while for the alkaline permanganate method, it is only around 40%. Therefore, the COD in the Sea Water Quality Standards using the alkaline permanganate method can correspond to the PI in the Environmental Quality Standards for Surface Water. The PI referred to in this paper is the COD alkaline permanganate method in the Sea Water Quality Standards.
(4) According to the Sea Water Quality Standard and the Estuary Water Quality Dynamic Standard, the evaluation results are different as follows: Pb has changed from the original Class II water quality at the bottom of the ebb tide at Station S2 to Class I water quality. pH has remained at Class III water quality, but has now changed to Class I water quality. PI has changed from Class II, Class II, Class III, Class III, Class III, and Class III at the surface and bottom layers of the rising tide at Station S01, S02, and S03, respectively, to Class I, Class I, Class I, Class II, Class II and Class I. The evaluation results of DO obtained by using two standard methods are identical. Therefore, it can be seen that the evaluation of Pb, pH, and PI in the PRE using the Estuary Water Quality Dynamic Standard has improved water quality compared to the traditional direct evaluation method using the Sea Water Quality Standard. Cu, Zn, Cd, and Hg have been evaluated using both the Sea Water Quality Standard and the Estuary Water Quality Dynamic Standard, and the results are consistent, with all elements being Class I. These four potentially toxic elements have extremely low pollution levels in the three stations in the PRE. The comparison of the two evaluation methods shows that using the Estuary Water Quality Dynamic Standard to evaluate the water quality in the estuary area is more reflective of the actual environmental quality than directly evaluating water quality using the Sea Water Quality Standard (GB3097-1997).
(5) Although this study only focused on three sites, the results are highly valid and can be extended to evaluate more sites in the PRE, establishing a broader evaluation scope that represents the entire estuary region.

5. Conclusions

(1) This article resolved the following issue: sometimes the water quality in the estuary area exceeds the corresponding seawater quality standards when the surface water flows into the sea, despite the surface water quality not exceeding the surface water environmental quality standards and the seawater quality not exceeding the seawater quality standards. The results obtained are reasonable and can more accurately reflect the water quality and environmental quality of estuaries, which are in line with the actual water quality of estuaries. The results can provide a reference method for water quality evaluation in estuaries, and the evaluation results of estuaries will not conflict with the Environmental Quality Standards for Surface Water and the Seawater Quality Standard. The method is simple and applicable to both rising and falling tides and can solve practical problems.
(2) This standard can be applied to countries around the world, with some prerequisite conditions. For example, corresponding “Environmental Quality Standards for Surface Water” and “Seawater Quality Standards” are needed. There is a need for corresponding “Environmental Quality Standards for Surface Water” and “Seawater Quality Standards”. Moreover, the water quality levels and monitoring elements of the two standards need to be unified.
(3) For countries that do not have corresponding Surface Water Environmental Quality Standards or Seawater Quality Standards, priority should be given to developing Surface Water Environmental Quality Standards or Seawater Quality Standards.
(4) Based on the analysis of the current environmental situation in China, the most prominent marine environmental problem is eutrophication, so the monitoring of nutrient salt indicators is crucial. Among them, total nitrogen and total phosphorus, as important indicators characterizing the degree of eutrophication in water bodies, have been maturely applied in environmental standards abroad. The current “Sea Water Quality Standards” in China lack two key control standard indicators: total nitrogen and total phosphorus, while the “Environmental Quality Standards for Surface Water” only include ammonia nitrogen and total phosphorus indicators. The total nitrogen indicator is only for lakes and reservoirs. Therefore, the dynamic water quality standards for estuary areas do not include nutrient salt indicators. It is important to revise the existing “Environmental Quality Standards for Surface Water” and “Sea Water Quality Standards” and unify the water quality grades, monitoring elements, and analysis methods involved in the two standards, especially nutrient salt indicators such as total phosphorus and total nitrogen indicators. In this way, together with dynamic standards for water quality in the estuary area, the evaluation requirements for surface water, estuaries, and seawater can be satisfied.

Author Contributions

Conceptualization, Z.W. and H.Z.; methodology, Z.W.; software, H.Z.; validation, Z.W. and H.Z.; formal analysis, H.Z.; investigation, Z.W.; resources, Z.W.; data curation, Z.W.; writing—original draft preparation, Z.W.; writing—review and editing, H.Z.; visualization, H.Z.; supervision, H.Z.; project administration, Z.W.; funding acquisition, H.Z. All authors have read and agreed to the published version of the manuscript.

Funding

This work was supported by the Guangdong Basic and Applied Basic Research Foundation (2021A1515011386); Guangzhou Basic and Applied Basic Research Project (202201011620); National Natural Science Foundation of China Youth Fund (41406093); Project independently established by the Key Laboratory of Marine Environment Detection Technology and Application of the Ministry of Natural Resources (MESTA-2020-C005); Open Research Fund of the Key Laboratory of Marine Ecosystem Dynamics of the Ministry of Natural Resources (MED202012).

Institutional Review Board Statement

Not applicable.

Informed Consent Statement

Not applicable.

Data Availability Statement

The original contributions presented in the study are included in the article, further inquiries can be directed to the authors.

Acknowledgments

The authors would like to thank the editors and the reviewers for their valuable comments and suggestions on this paper, and also thank Jiang, Z.C. for drawing Figures for this article.

Conflicts of Interest

The authors declare no conflicts of interest.

Correction Statement

This article has been republished with a minor correction to resolve spelling and grammatical errors. This change does not affect the scientific content of the article.

References

  1. Li, M.; Pang, B.; Lan, W.; Fu, J. Delineation of estuarine mixed zone and establishment of nutrient standard limits. China Environ. Monit. 2020, 36, 74–82. [Google Scholar] [CrossRef]
  2. Alber, M. A conceptual model of estuarine freshwater inflow management. Estuaries 2002, 25, 1246–1261. [Google Scholar] [CrossRef]
  3. Guo, H.; Wang, X.; Wang, Y.; Bao, M.; Li, X. Analysis of water quality evaluation standards for estuaries. Jiangsu Water Resour. 2022, 4, 62–65. [Google Scholar] [CrossRef]
  4. Wang, J.; Han, G.; Zhang, Z. The Latest Progress in International Marine Environmental Monitoring and Evaluation; Ocean Press: Beijing, China, 2010. [Google Scholar]
  5. Meng, W. Research on China’s Ocean Engineering and Technology Development Strategy: Ocean Environment and Ecology Volume; Ocean Press: Beijing, China, 2014. [Google Scholar]
  6. Chen, J. Estuarine Water Eco-Health Assessment Technical Method and Application; Ocean University of China: Qingdao, China, 2013. [Google Scholar]
  7. Yang, F.; Lin, Z.; Zhang, Z.; Wang, L.; Yu, L.; Wang, J. Analysis on the problems of environmental quality standards for surface water and seawater in China. Mar. Dev. Manag. 2018, 35, 36–41. [Google Scholar]
  8. GB3097-1997; National Seawater Quality Standard of the People’s Republic of China. National Environmental Protection Administration: Beijing, China, 1997.
  9. GB3838-2002; General Administration of Quality Supervision of Inspection and Quarantine of China. National Standard of the People’s Republic of China Environmental Quality Standard for Surface Water. State Environmental Protection Administration: Beijing, China, 2002.
  10. Quan, Y.; Ji, X.; Wang, L.; Shi, B. Water quality analysis and evaluation of main estuaries in Qinhuangdao. Bull. Oceanol. Limnol. 2016, 38, 24–28. [Google Scholar] [CrossRef]
  11. Liu, J.; Liu, L.; Zheng, B. Problems and countermeasures of water environmental management in estuaries. Res. Environ. Sci. 2017, 30, 645–653. [Google Scholar] [CrossRef]
  12. Bricker, S.B.; Ferreira, J.G.; Simas, T. An integrated methodology for assessment of estuarine trophic status. Ecol. Model. 2003, 169, 39–60. [Google Scholar] [CrossRef]
  13. Ireland Environmental Protection Agency. Water Quality in Ireland 2001–2003; Environmental Protection Agency: Wexford, Ireland, 2005. [Google Scholar]
  14. OSPAR Commission. OSPAR Integrated Report 2003 on the Eutrophication Status of the OSPAR Maritime Area Based upon the First Application of the Comprehensive Procedure; The Convention for the Protection of the Marine Environment of the North-East Atlantic: Paris, France, 2003. [Google Scholar]
  15. Office of Environment and Heritage. Assessing Estuary Ecosystem Health: Sampling, Data Analysis and Reporting Protocols; State of NSW and Office of Environment and Heritage: Parramatta, NSW, Australia, 2013. [Google Scholar]
  16. Peng, T.; Wang, Z.; Zhao, Q. Ecosystem health assessment for Huangbai river based on PSR model. Water Resour. Prot. 2016, 32, 141–153. [Google Scholar]
  17. Ye, S.F.; Liu, X.; Ding, D.W. Ecosystem health assessment of the Changjiang river estuary: Indicator system and its primarily assessment. Acta Oceanol. Sin. 2007, 29, 128–136. [Google Scholar]
  18. Australian and New Zealand Environment and Conservation Council, Agriculture and Resource Management Council of Australia and New Zealand. Australia and New Zealand Guidelines for Fresh and Marine Water Quality; Australian and New Zealand Environment and Conberra Council: Canberra, ACT, Australia, 2000. [Google Scholar]
  19. European Commission. Guidance on Typology, Reference Conditions and Classification Systems for Transitional and Coastal Water; European Commission: Copenhagen, Denmark, 2002. [Google Scholar]
  20. US Environmental Protection Agency. Estuarine and Coastal Marine Waters: Bioassessment and Biocriteria Technical Guidance; Office of Water: Washington, DC, USA, 2000. [Google Scholar]
  21. European Commission. Common Implementation Stategy for the Water Framework Directive (2000/30/EC-Technical Guidance for Deriving Environmental Quality Standards; European Commission: Copenhagen, Denmark, 2000. [Google Scholar]
  22. US Environmental Protection Agency. National Estuary Program Coastal Condition Report. Chapter 5: Gulf of Mexico National Estuary Program Coastal Condition, Sarasota Bay Estuary Program; US Environmental Protection Agency: Washington, DC, USA, 2007. [Google Scholar]
  23. Schuwirth, N. Towards an integrated surface water quality assessment: Aggregation over multiple pollutants and time. Water Res. 2020, 186, 761–774. [Google Scholar] [CrossRef]
  24. Reichert, J.; Schellenberg, J.; Schubert, P.; Wilke, T. Responses of reef building corals to microplastic exposure. Environ. Pollut. 2018, 237, 955–960. [Google Scholar] [CrossRef]
  25. Bawiec, A.; Paweska, K.; Jarzab, A. Changes in the Microbial Composition of Municipal Wastewater Treated in Biological Processes. J. Eco. Eng. 2016, 17, 41–46. [Google Scholar] [CrossRef]
  26. Lal, P.P.; Juste-Poinapen Ms, N.; Poinapen, J. Assessing the water quality of Suva foreshore for the establishment of estuary and marine recreational water guidelines in the Fiji Islands. Water Sci. Technol. 2021, 84, 3040–3054. [Google Scholar] [CrossRef] [PubMed]
  27. Li, S.; Chen, X.; Singh, V.P.; He, Y.; Bai, X. An improved index for water quality evaluation in an estuary region: A case study in the Eastern Pearl River Delta, China. Water Policy 2019, 21, 310–325. [Google Scholar] [CrossRef]
  28. Tri, D.Q.; Linh, N.T.M.; Thai, T.H.; Kandasamy, J. Application of 1D–2D coupled modeling in water quality assessment: A case study in Ca Mau Peninsula, Vietnam. Phys. Chem. Earth Parts A/B/C 2019, 113, 83–99. [Google Scholar]
  29. Tao, W.; Niu, L.; Dong, Y.; Fu, T.; Lou, Q. Nutrient pollution and its dynamic source-sink pattern in the Pearl River Estuary (South China). Front. Mar. Sci. 2021, 8, 713907. [Google Scholar] [CrossRef]
  30. Li, X.Q.; Lu, C.Q.; Zhang, Y.F.; Zhao, H.D.; Wang, J.Y.; Liu, H.B. Low dissolved oxygen in the Pearl River estuary in summer: Long-term spatio-temporal patterns, trends, and regulating factors. J. Mar. Sci. Eng. 2020, 151, 110814. [Google Scholar] [CrossRef]
  31. Tao, W.; Niu, L.X.; Liu, F.; Cai, H.Y.; Ou, S.Y.; Zeng, D.N.; Lou, Q.S.; Yang, Q.S. Influence of river-tide dynamics on phytoplankton variability and their ecological implications in two Chinese tropical estuaries. Ecol. Indic. 2020, 115, 106458. [Google Scholar] [CrossRef]
  32. Niu, L.X.; Cai, H.Y.; Jia, L.W.; Luo, X.X.; Tao, W.; Dong, Y.H.; Yang, Q.S. Metal pollution in the Pearl River Estuary and implications for estuary management: The influence of hydrological connectivity associated with estuarine mixing. EES 2021, 225, 112747. [Google Scholar]
  33. Tian, F.G.; Ni, Z.X.; Huang, B.B.; Lou, Q.S.; Zhong, Y.H.; Deng, W. Distribution characters of heavy metals in seawater and surface sediments in Daya Bay. J. Appl. Oceanogr. 2022, 41, 462–474. [Google Scholar]
  34. Tao, W.; Li, H.D.; Zhang, W.P.; Lou, Q.S.; Gong, J.; Ye, J.J. Characteristics of Heavy Metals in Seawater and Sediments from Daya Bay (South China): Environmental Fates, Source Apportionment and Ecological Risks. Sustainability 2021, 13, 10237. [Google Scholar] [CrossRef]
Figure 1. Location of the Pearl River Delta in China.
Jmse 12 01039 g001
Figure 2. Sketch map of sampling sites in the PRE.
Jmse 12 01039 g002
Table 1. Summary of similarities and differences in water function categories [8,9].
Similarities and DifferencesEnvironmental Quality Standards for Surface Water
(GB3838-2002)
Seawater Quality Standard
(GB3097-1997)
Functional Categories
Correspondence Relationship
Class ISource water and nature reservesN/A
Class IIFirst-grade protection area of centralized surface drinking water sources, habitat of rare aquatic organisms, and feeding ground for young fishMarine nature reserves, rare and endangered marine life reserves, and marine fishery watersClass I
Class IIIClass II protection zone of centralized surface water sources for drinking water, fishery waters such as aquaculture, and swimming areasAquaculture areas, bathing beaches, and industrial water areas directly related to human consumptionClass II
Class IVGeneral industrial water areas and entertainment water areas where the human body is not directly in contactGeneral industrial water area, coastal scenic tourist areaClass III
Class VAgricultural water use areas and general landscape requirements for water areasMarine port waters and marine development operation areasClass IV
Table 2. Seawater quality standards for Pb, pH, PI, DO, Cu, Zn, Cd, and Hg (GB3097-1997) AI~AIV [8].
ElementAIAIIAIIIAIV
Pb (mg/L)≤0.001≤0.005≤0.010≤0.050
pH7.8~8.56.8~8.8
PI (mg/LO2)≤2≤3≤4≤5
DO (mg/L)>6>5>4>3
Cu (mg/L)≤0.005≤0.010≤0.050
Zn (mg/L)≤0.020≤0.050≤0.10≤0.50
Cd (mg/L)≤0.001≤0.005≤0.010
Hg (mg/L)≤0.00005≤0.0002≤0.0005
Table 3. Surface water environmental quality standards for Pb, pH, PI, DO, Cu, Zn, Cd, and Hg (GB3838-2002) BII~BV [9].
ElementBIIBIIIBIVBV
Pb (mg/L)≤0.01≤0.05≤0.05≤0.1
pH6~9
PI (mg/LO2)≤4≤6≤10≤15
DO (mg/L)≥6≥5≥3≥2
Cu (mg/L)≤1.0≤1.0≤1.0≤1.0
Zn (mg/L)≤1.0≤1.0≤2.0≤2.0
Cd (mg/L)≤0.005≤0.005≤0.005≤0.01
Hg (mg/L)≤0.00005≤0.0001≤0.001≤0.001
Remarks: The PI in the surface water environmental quality standard corresponds to the COD in the seawater quality standard.
Table 4. On-site monitoring results of salinity, Pb, pH, PI, DO, Cu, Zn, Cd, and Hg in the PRE.
SitesS01S02S03
Ebb tideWater depth (m)0.58.00.58.00.57.0
Salinity (S)16.45317.64117.56517.64315.40516.439
Pb (mg/L)0.00060.00060.00100.00130.00070.0006
pH7.627.627.647.627.577.58
PI (mg/LO2)1.611.901.422.001.531.92
DO (mg/L)5.385.325.825.425.275.33
Cu (mg/L)0.00200.00160.00200.00220.00260.0022
Zn (mg/L)0.00690.00720.01090.00760.00710.0071
Cd (mg/L)0.000370.000380.000440.000420.00040.00043
Hg (mg/L)0.0000280.0000420.0000300.0000380.0000280.000042
Rising tideWater depth (m)0.57.00.57.00.58.0
Salinity (S)15.66015.66315.43515.74313.55114.529
Pb (mg/L)0.00080.00060.00050.00060.00050.0005
pH7.587.437.517.517.387.38
PI (mg/LO2)2.562.153.023.153.493.12
DO (mg/L)5.245.244.934.764.394.58
Cu (mg/L)0.00160.00180.00170.00150.00150.0015
Zn (mg/L)0.00790.00790.00780.00660.00730.0068
Cd (mg/L)0.000370.00040.000330.000330.00040.0004
Hg (mg/L)0.0000240.0000340.0000310.0000340.0000280.000037
Table 5. Water quality evaluation results of Pb, pH, PI, DO, Cu, Zn, Cd, and Hg in the PRE (according to the Seawater Quality Standards).
SitesS01S02S03
Ebb tideDepth (m)0.58.00.58.00.57.0
PbClass IClass IClass IClass IIClass IClass I
pHClass IIIClass IIIClass IIIClass IIIClass IIIClass III
PIClass IClass IClass IClass IClass IClass I
DOClass IIClass IIClass IIClass IIClass IIClass II
CuClass IClass IClass IClass IClass IClass I
ZnClass IClass IClass IClass IClass IClass I
CdClass IClass IClass IClass IClass IClass I
HgClass IClass IClass IClass IClass IClass I
Rising tideDepth (m)0.57.00.57.00.58.0
PbClass IClass IClass IClass IClass IClass I
pHClass IIIClass IIIClass IIIClass IIIClass IIIClass III
PIClass IIClass IIClass IIIClass IIIClass IIIClass III
DOClass IIClass IIClass IIIClass IIIClass IIIClass III
CuClass IClass IClass IClass IClass IClass I
ZnClass IClass IClass IClass IClass IClass I
CdClass IClass IClass IClass IClass IClass I
HgClass IClass IClass IClass IClass IClass I
Table 6. CI~CIV of Pb with different salinities obtained by the new method.
SitesDepth (m)Salinity (S)CI (mg/L)CII (mg/L)CIII (mg/L)CIV (mg/L)
Ebb tideS010.516.4530.0058 0.0288 0.0312 0.0765
8.017.6410.0055 0.0273 0.0298 0.0748
S020.517.5650.0055 0.0274 0.0299 0.0749
8.017.6430.0055 0.0273 0.0298 0.0748
S030.515.4050.0060 0.0302 0.0324 0.0780
7.016.4390.0058 0.0289 0.0312 0.0765
Rising tideS010.515.6600.0060 0.0299 0.0321 0.0776
7.015.6630.0060 0.0299 0.0321 0.0776
S020.515.4350.0060 0.0302 0.0324 0.0780
7.015.7430.0060 0.0298 0.0320 0.0775
S030.513.5510.0065 0.0326 0.0345 0.0806
8.014.5290.0063 0.0313 0.0334 0.0792
Table 7. CI~CIV of pH with different salinities obtained by the new method.
SitesDepth (m)Salinity (S)CICIICIIICIV
Ebb tideS010.516.4536.85~8.766.85~8.766.38~8.916.38~8.91
8.017.6416.91~8.756.91~8.756.40~8.906.40~8.90
S020.517.5656.90~8.756.90~8.756.40~8.906.40~8.90
8.017.6436.91~8.756.91~8.756.40~8.906.40~8.90
S030.515.4056.79~8.786.79~8.786.35~8.916.35~8.91
7.016.4396.85~8.776.85~8.776.38~8.916.38~8.91
Rising tideS010.515.6606.81~8.786.81~8.786.36~8.916.36~8.91
7.015.6636.81~8.786.81~8.786.36~8.916.36~8.91
S020.515.4356.79~8.786.79~8.786.35~8.916.35~8.91
7.015.7436.81~8.786.81~8.786.36~8.916.36~8.91
S030.513.5516.70~8.816.70~8.816.31~8.926.31~8.92
8.014.5296.75~8.796.75~8.796.33~8.926.33~8.92
Table 8. CI~CIV of PI with different salinities obtained by the new method.
SitesDepth (m)Salinity (S)CI (mg/LO2)CII (mg/LO2)CIII (mg/LO2)CIV (mg/LO2)
Ebb tideS010.516.4533.060 4.590 7.180 10.299
8.017.6412.992 4.488 6.976 9.960
S020.517.5652.996 4.494 6.989 9.981
8.017.6432.992 4.488 6.976 9.959
S030.515.4053.120 4.680 7.359 10.599
7.016.4393.061 4.591 7.182 10.303
Rising tideS010.515.6603.105 4.658 7.315 10.526
7.015.6633.105 4.658 7.315 10.525
S020.515.4353.118 4.677 7.354 10.590
7.015.7433.100 4.651 7.301 10.502
S030.513.5513.226 4.839 7.677 11.128
8.014.5293.170 4.755 7.509 10.849
Table 9. CI~CIV of DO with different salinities obtained by the new method.
SitesDepth (m)Salinity (S)CI (mg/L)CII (mg/L)CIII (mg/L)CIV (mg/L)
Ebb tideS010.516.4536.0005.0003.4702.470
8.017.6416.0005.0003.5042.504
S020.517.5656.0005.0003.5022.502
8.017.6436.0005.0003.5042.504
S030.515.4056.0005.0003.4402.440
7.016.4396.0005.0003.4702.470
Rising tideS010.515.6606.0005.0003.4472.447
7.015.6636.0005.0003.4482.448
S020.515.4356.0005.0003.4412.441
7.015.7436.0005.0003.4502.450
S030.513.5516.0005.0003.3872.387
8.014.5296.0005.0003.4152.415
Table 10. Water quality dynamic evaluation results of Pb, pH, PI, and DO in the PRE (dynamic standards for water quality evaluation).
SitesS01S02S03
Ebb tideDepth (m)0.58.00.58.00.57.0
salinity16.45317.64117.56517.64315.40516.439
PbClass IClass IClass IClass IClass IClass I
pHClass IClass IClass IClass IClass IClass I
PIClass IClass IClass IClass IClass IClass I
DOClass IIClass IIClass IIClass IIClass IIClass II
Rising tideDepth (m)0.57.00.57.00.58.0
Salinity15.66015.66315.43515.74313.55114.529
PbClass IClass IClass IClass IClassIClass I
pHClass IClass IClass IClass IClass IClass I
PIClass IClass IClass IClass IIClass IIClass I
DOClass IIClass IIClass IIIClass IIIClass IIIClass III
Disclaimer/Publisher’s Note: The statements, opinions and data contained in all publications are solely those of the individual author(s) and contributor(s) and not of MDPI and/or the editor(s). MDPI and/or the editor(s) disclaim responsibility for any injury to people or property resulting from any ideas, methods, instructions or products referred to in the content.

