Review

Innovations in Offshore Wind: Reviewing Current Status and Future Prospects with a Parametric Analysis of Helical Pile Performance for Anchoring Mooring Lines

Department of Structural and Geotechnical Engineering, Széchenyi István University, 9026 Győr, Hungary
*
Author to whom correspondence should be addressed.
J. Mar. Sci. Eng. 2024, 12(7), 1040; https://doi.org/10.3390/jmse12071040
Submission received: 18 May 2024 / Revised: 13 June 2024 / Accepted: 18 June 2024 / Published: 21 June 2024
(This article belongs to the Special Issue Advance in Marine Geotechnical Engineering)

Abstract

:
This study examines the current status and future potential of the offshore wind sector. Offshore wind is pivotal in transitioning to a low-carbon society and meeting rising energy demands, despite being capital-intensive. The industry aims to develop larger-scale wind farms in deeper ocean locations, with projections indicating significant cost reductions. To explore deeper ocean areas, specialized foundations like floating platforms moored to the seabed are required. This study proposes helical piles anchored in the seabed as a method to secure mooring lines. Using Plaxis 3D, a parametric examination was conducted on helical piles with two plates: one fixed at the pile’s toe and the other varying in position between 0.5 and 13 m from the seabed surface. Load inclination angles (0, 20, 40, and 60 degrees) were used to simulate mooring line loads. Results indicate the optimal Zh/Z ratios for maintaining load-bearing capacity and stability: 0.12 (10 mm movements), 0.22 (25 mm), and 0.26 (50 mm) for small shaft diameters; and 0.34 (10 mm), 0.38 (25 mm), and 0.46 (50 mm) for large shaft diameters. These findings highlight the importance of specific load inclination angles based on shaft diameter and allowable movement for effective performance.

1. Introduction

Growing worries about climate change brought on by the detrimental effects of fossil fuel consumption on the environment and human health have made the shift to renewable energy sources imperative. Since the Industrial Revolution, fossil fuels (coal, oil, and natural gas) have dominated the world’s energy mix, providing most of energy for electricity, transportation, and heating. This has led to a significant increase in greenhouse gas (GHG) emissions, which are the primary cause of the ongoing climate change crisis. To achieve climate neutrality in the future, the world must decarbonize its energy mix by increasing the share of renewable energy sources.
Fossil fuels account for 81.79% of the world’s energy output, with low-carbon sources, including nuclear (3.99%) and renewables (14.21%), making up the remaining sources [1]. In terms of cost and capacity, solar and wind power are viable options [2]. Regulations influencing the development of renewable energy are shaped by international accords like the Kyoto Protocol and the Paris Climate Change Agreement [3]. It is expected that these top-down tactics would spearhead international efforts, particularly in Europe, to fulfill aggressive policy-driven targets in the fight against global warming [4].
Since ancient times, wind has been used for a variety of reasons. Wind is a natural phenomenon that is caused by the sun’s uneven heating and the Earth’s rotation [5]. According to Poudineh et al. [6], it has been used for pumping water, grinding grain, and powering sails. Today, the main method of producing power from wind energy is through onshore or offshore turbines. Due to its resurgence as a viable electrical source in the late 20th century, onshore and offshore wind energy systems have seen substantial technological breakthroughs [5].
Compared to onshore turbines, offshore wind offers enormous resource potential as it expands into open-water areas [6,7]. The concept’s potential was demonstrated by Germany’s early trials in the 1930s and by the first practical installation in Sweden in 1990 [7]. A significant advancement in the production of renewable electricity was made by Denmark’s 4.95 MW commercial offshore wind farm [7].
Due to restrictions on onshore locations and land use concerns, the offshore wind business has flourished [7,8,9,10]. Stronger and more consistent winds assist offshore sites, resulting in higher power output [3,11]. Although offshore projects have similar functionality, the hostile maritime environment makes them more difficult technologically, requiring larger capital investments [12,13,14]. The offshore wind industry’s expansion has been hampered by its complexity, as well as by the small number of investors and large capital required [9,13].
In general, the convergence of significant cost reductions, continuous technological progress, and appealing subsidy programs provided by national authorities has established offshore wind energy as a reliable and economically feasible electricity source [15]. While originating in Europe, offshore wind is progressively gaining significance in global electricity decarbonization initiatives, both in the immediate and long-term perspectives [3].
Europe has emerged as the leader in offshore wind, showing a wealth of knowledge and advanced technology. The region has 25 GW of installed offshore wind power with 116 wind farms and 5402 turbines spread over 12 nations, mostly in the northwest [16]. The capacity allocation among these countries is shown in Table 1.
Table 1 shows how different countries have developed offshore wind to different degrees. This diversity is not just attributable to the abundance of wind resources at sea as historical factors, supportive structures, solid governmental backing, technological advancement, and grid access all play important roles.
Coastal waters in Europe have a great deal of wind potential, especially because they are shallow even when they are far from the coast. Three decades ago, this benefit propelled Europe to become a leader in offshore wind development [17]. The most-developed basin is the North Sea, which contributes about 20 GW (or 79% of Europe’s total offshore wind capacity). The remaining capacity is split between the Atlantic Ocean (less than 1%), the Baltic Sea (9%), and the Irish Sea (12%), per WindEurope [16]. Table 2 details the expected installations by country from 2024 to 2027 [18].
When viewed in a larger context, offshore wind and Power-to-X (PtX) have the potential to completely transform the way in which ambitious climate objectives are met. PtX is the process of transforming energy into a gas or liquid for storage or immediate use [19,20]. By allowing the synthesis of hydrogen—an effective, clean, and flexible energy carrier—from all or part of the generated electricity, this strategy broadens the potential applications of offshore wind power beyond the production of electricity [21]. Green hydrogen and offshore wind are seeing a rise in popularity. However, their high present costs are preventing them from being widely adopted. IRENA predicts that long-term green hydrogen costs could be reduced, driven by financial and regulatory incentives, by 85% as a result of falling costs for electrolysis facilities and renewable electricity.
This study investigates offshore wind farm infrastructure and future prospects, highlighting the need for creative solutions. With traditional foundation technologies being insufficient to meet the industry’s changing demands, this study proposes using helical piles as mooring line anchors, and their design is also refined to increase bearing capacity. These innovations aim to make offshore wind energy development more sustainable. Despite its high initial cost, offshore wind energy is critical in the transition to a low-carbon society. As businesses expand to larger-scale wind farms in deeper ocean regions, specialized foundations such as floating platforms tethered to the seabed become increasingly important. This study looks into the usage of helical piles anchored to the seabed to secure mooring lines for floating offshore wind turbines. This study uses the Plaxis 3D tool to examine the efficacy of helical piles in sandy soil under varied load situations. The aim of this study is to provide realistic design guidance for optimizing helical pile foundations; hence, improving the efficiency and dependability of offshore wind energy systems.
To comprehensively explore the offshore wind sector’s current status and future trajectories, we employed a mixed review technique coupled with a numerical study. This approach involved several key steps:
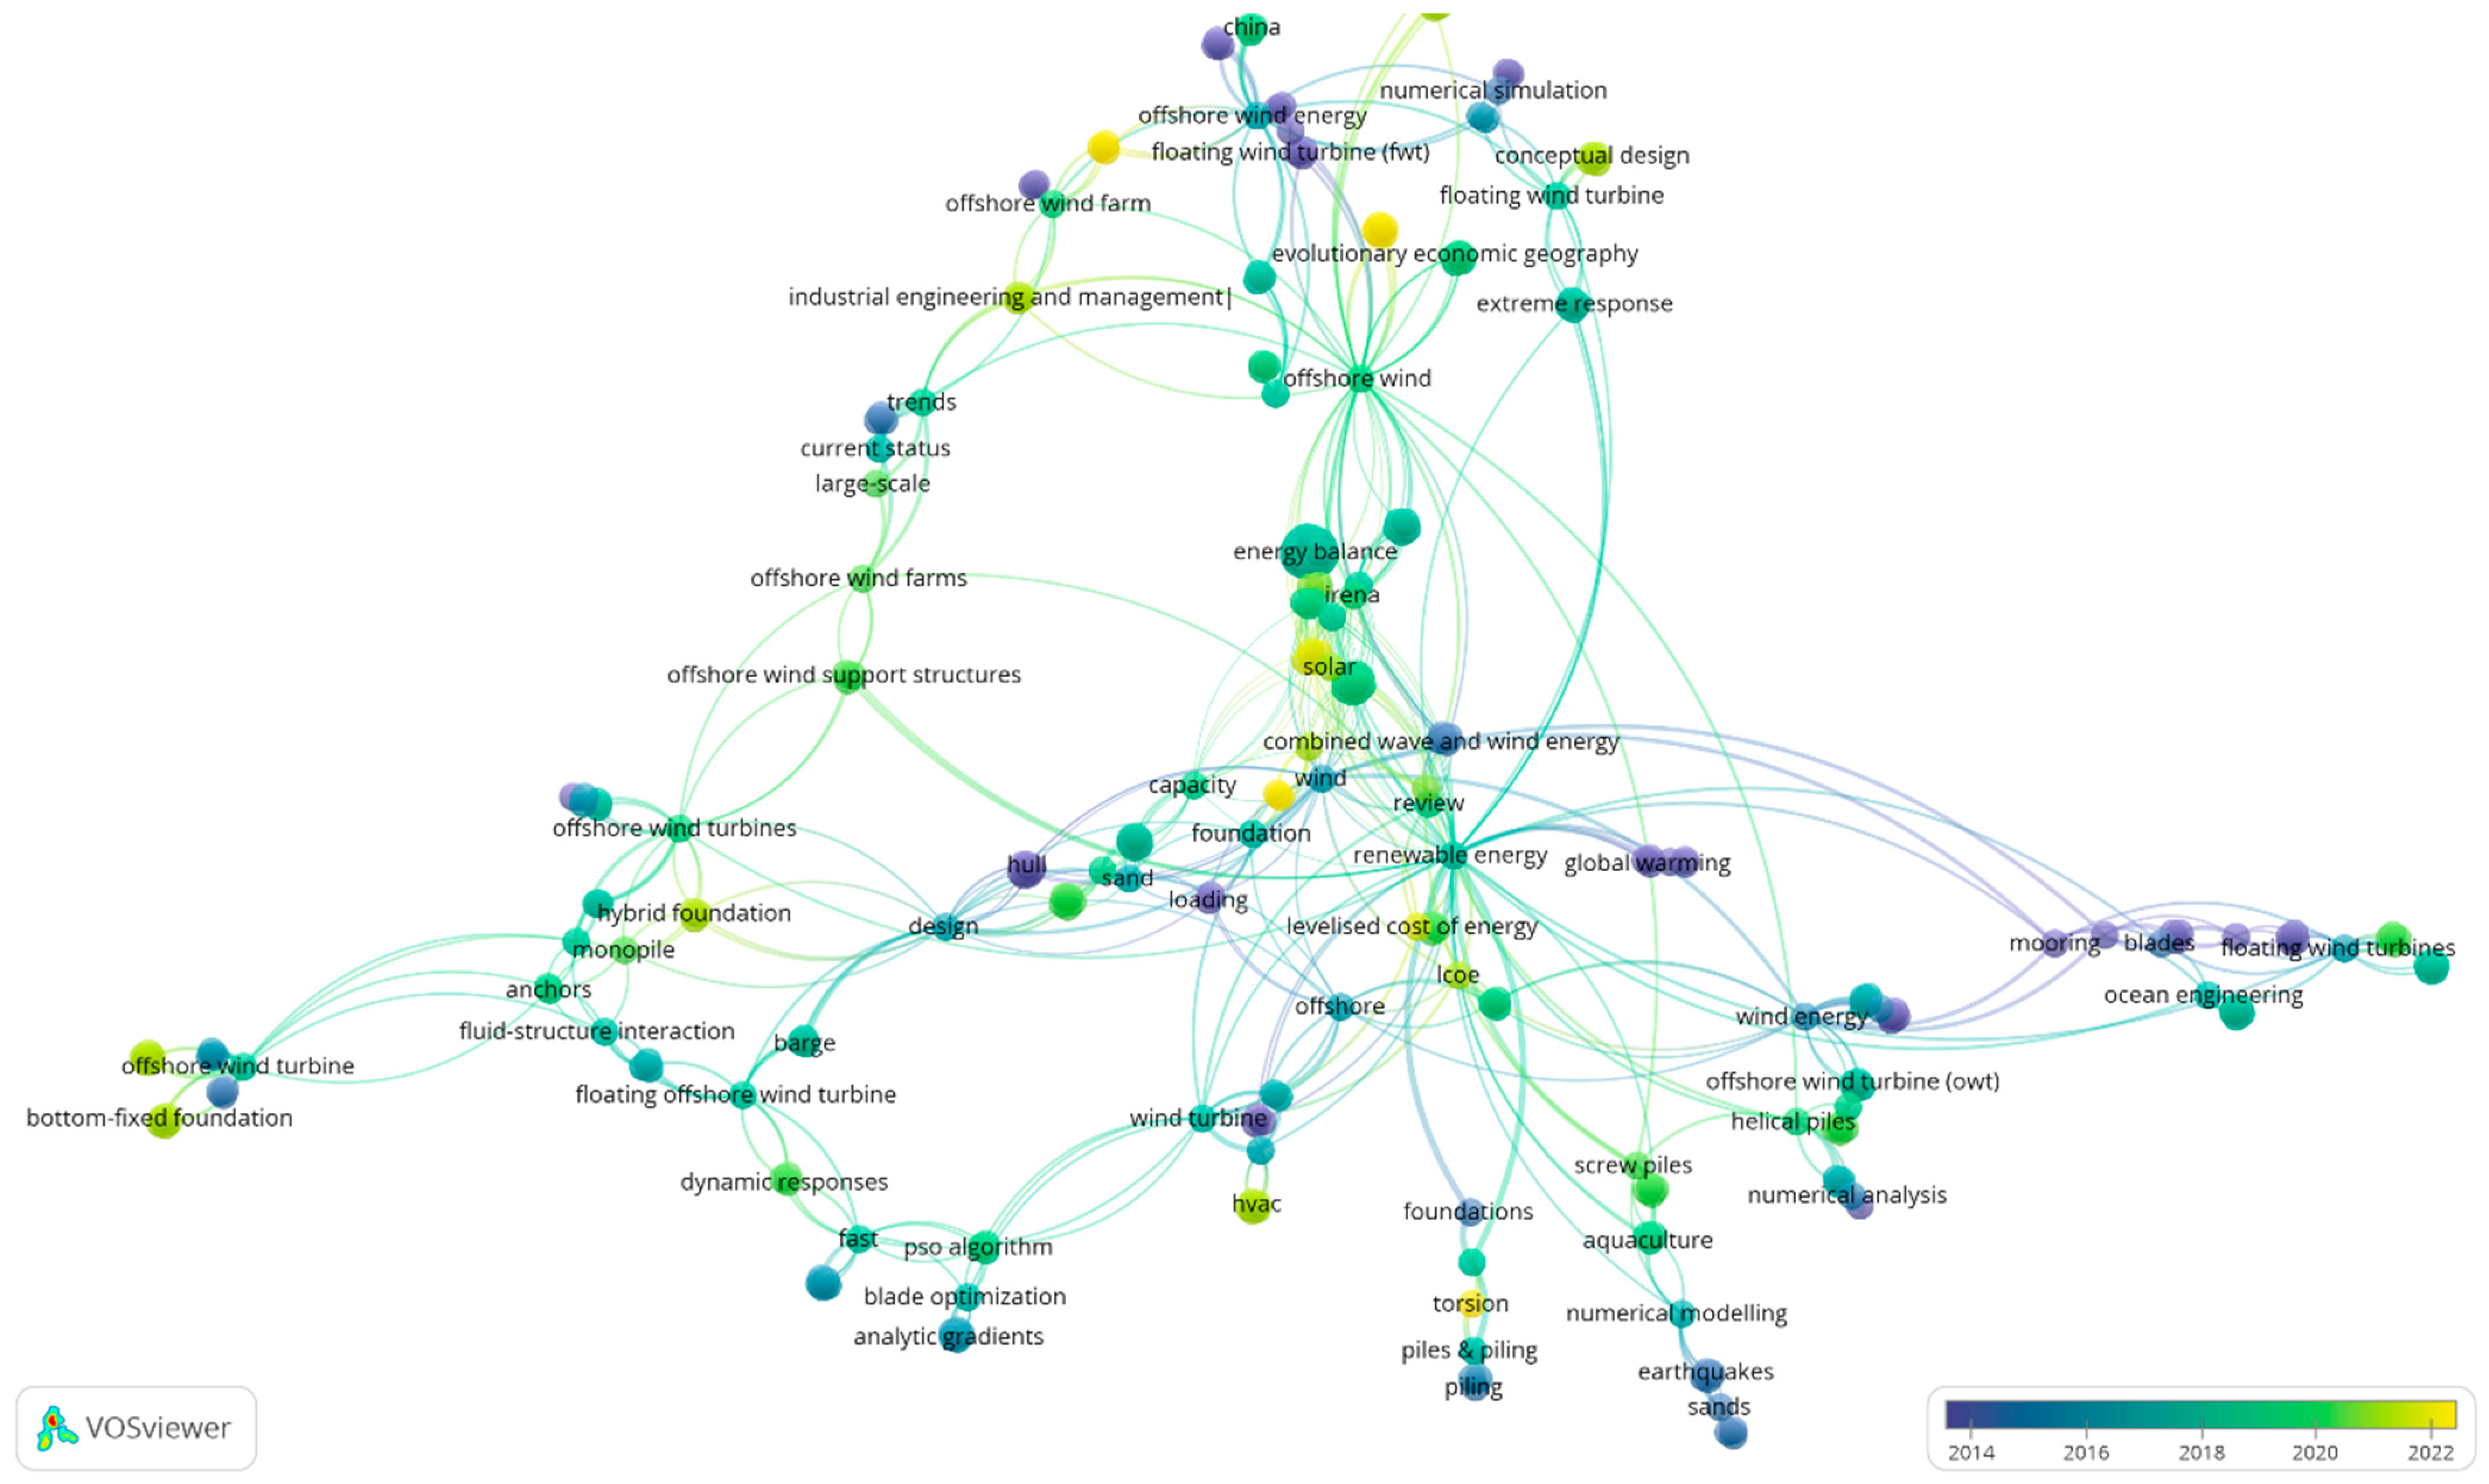
  • Surveying the database and selecting pertinent keywords to ensure a comprehensive coverage of the relevant literature.
  • Assembling and screening research papers to extract valuable insights and identify emerging trends in the offshore wind sector.
  • Comparing various offshore wind foundation types to discern their strengths, weaknesses, potential areas for further research and improvement, as well as determining prospects for offshore wind.
  • Applying numerical modeling techniques to investigate the efficacy of helical piles with two helices at varied loading inclinations as anchors for resisting loads from floating offshore mooring lines. These piles are installed utilizing machine-mounted hydraulic or electrically powered drilling equipment that screws them directly into the ground, thus allowing for easy installation in marine environments.
Section 4 delves into the numerical modeling approach, providing a detailed discussion of the methodology and findings.
The search encompassed a wide array of sources, including journal articles, books, conference papers, websites, and proceedings. Figure 1 illustrates the keyword network within the offshore wind domain, visualized using VOSviewer (version 1.6.20). This tool provides a distance-based representation of keyword relationships, with each node representing a keyword and links denoting connections. The distance between nodes indicates the strength of their relationship: shorter distances signify stronger links, while greater distances indicate weaker connections. The link strength of a node is determined by the sum of all its connection strengths. Additionally, different colors denote different research years, and the node size reflects the number of publications in which the keyword was initially used. Our study findings, discussed in the subsequent sections, cover various aspects of offshore wind farms and their components, the prospects for offshore wind, the recent utilization of machine learning algorithms in turbine design, and the application of helical piles for anchoring mooring lines and tendons in the seabed. Special emphasis will be placed on helical pile behavior, particularly with respect to their resistance to upward movement and pullout load, and this will be analyzed through numerical modeling.

2. Offshore Wind Farms

The offshore wind farm (OWF), which is made up of a group of wind turbines placed in bodies of water (usually seas that are distant from the shoreline), is a crucial structural component of offshore wind energy [22]. An offshore wind farm (OWF) combines onshore wind installation ideas with offshore structures that are derived from the established practices of the oil and gas (O&G) industry [7,23].
There are five steps (Figure 2) involved in creating an OWF [24]. First, it entails deciding on an appropriate offshore location, which is achieved by evaluating the environment and wind resources, creating the OWF, and securing building permits. The manufacturing, installation, and use of maritime equipment in the operation of OWF components are covered in later phases. Over the course of its 25-year existence, routine maintenance seeks to minimize downtime. It is then either updated with new technology or safely decommissioned [24].
The average distance to the shore and water depth, which were compiled by Díaz and Guedes Soares [3], are shown in Table 3. Advances in technology and the availability of offshore places for larger installations have led to a trend where offshore wind farms (OWFs) are relocating farther from the shore in order to obtain superior wind resources [3]. Figure 3 illustrates a distinct shift toward greater depths, as per the IRENA data [25], depicting the trajectory observed between 2000 and 2022 across Europe, China, and other regions worldwide. Notably, offshore wind farms have migrated toward deeper waters and increased distances from the shoreline. The OWF capacity (size) and delivery year (color) are indicated by the spheres on the graph.
Since 2000, offshore wind farms in Europe and China have seen significant growth. In Europe, the average farm size increased from 25 MW to 468 MW in 2022, with depths deepening from 7 to 32 m and distances from the shore extending to 35 km. In China, the average farm size reached 436 MW in 2022, with depths of 35 m and distances from the shore of 27 km (according to IRENA data) [25]. These data are consistent with the current trend of deeper water locations being chosen for offshore wind farms (OWFs). This pattern is expected to continue as water depths and distances from the coast increase.
Foundations, offshore wind turbines, connecting cables, and onshore and offshore substations make up an offshore wind farm’s (OWF’s) main parts, which together make up the transmission system. This OWF component structure was standard, as seen in Figure 4.

2.1. Offshore Wind Turbine

A key component of offshore wind farms (OWFs) is an offshore wind turbine (OWT), which is a contemporary technology that produces electricity from wind in an offshore environment. With an average installed capacity of 8.2 MW in Europe as of 2020, these turbines typically have three blades that are oriented upwind and horizontally [16]. An OWT configured in its typical manner is shown in Figure 5.
Manufacturers are concentrating on bigger and more potent offshore wind turbines (OWTs) in order to increase electricity output while cutting costs; this is demonstrated by the rise in OWTs over the past few decades (see Figure 6) [3,27]. The upcoming generation of offshore wind turbines (OWTs), with capacities ranging between 10 and 14 MW, is expected to be utilized in projects scheduled for commissioning after 2022 [16].
In 2022, a 16 MW turbine was installed offshore in the second phase of China Three Gorges (CTG)’s Zhangpu Liuao wind farm in collaboration with Goldwind. Goldwind’s GWH252-16MW turbine features 123 m-long blades and a 252 m rotor diameter, covering approximately 50,000 square meters. Shortly after, Mingyang Smart Energy commissioned its MySE 16-260 offshore wind turbine in China, surpassing Goldwind’s turbine as the world’s largest. With a 260 m rotor diameter, the MySE 16-260 offers a swept area of 53,902 square meters. In October 2023, Mingyang announced plans for a new offshore wind turbine model with a 22 MW capacity, which is set for development between 2024 and 2025. The MySE 22 MW will have a rotor diameter exceeding 310 m, making it the most powerful globally. It will also be typhoon-resistant and suitable for fixed-bottom and floating applications [28]. Such specifications demand the foundation to be larger, and its load will be bigger. In addition, for floating foundations, the mooring line loads will be bigger and necessitate careful study on its behavior. In this study, the focus will be on studying the behavior of helical piles used as anchors to link the mooring line of floating foundations.

2.2. Foundations

The first offshore wind farm (OWF) that operated close to the coast was the Vindeby OWF in Denmark, which had eleven turbines with a combined 4.95 MW, in 1991. Located in shallow waters (2–6 m) close to the shoreline (1.5–3 km), this innovative OWF has subsequently been abandoned [4,7]. Stronger foundation structures are needed as OWFs travel deeper into windier waters and farther out to sea in order to endure shifting loads from waves, ice, winds, and marine conditions [30]. Figure 7 shows these loads.
Offshore wind farms (OWFs) have an average lifespan of 25 years and must survive a range of aerodynamic, hydrodynamic, and seismic loads in severe marine settings. Due to the tight foundation design specifications imposed, an OWF is generally more expensive than an onshore option [11,31]. Offshore wind foundation designs attempt to tackle these problems by leveraging technologies from the oil and gas (O&G) industry [27,32]. Using specialized vessels, foundations are laid offshore after being manufactured onshore [33]. The state of the seabed, the depth of the water, and the available funds all affect the sort of foundation that is chosen [34].
Most offshore wind turbines (OWTs) in operation today, whether in shallow waters or not, use bottom-fixed foundations—such as monopiles, jackets, and gravity bases—which are firmly fixed to the seafloor. However, bottom-fixed alternatives lose some of their cost-effectiveness after 50 m [31]. Suction bucket jackets (SBJs) are recommended by Ørsted as a practical substitute for diving down to 100 m; however, only a small number of small-scale OWFs have used SBJs in shallow waters [35]. Interestingly, systematic studies on this kind of foundation are still rare.
Gravity base, jacket, and monopile foundations were being used by about 96.1% of offshore wind farms (OWFs) in Europe at the end of 2020, according to WindEurope’s [16] report. This predominance indicates that certain foundation types require more investigation. Figure 8 illustrates the common schematic diagrams and utilization of different foundation types based on water depth. Floating foundation will be discussed in detail in Section 3.
Accounting for 80.5% of all new installations in 2020, monopiles continue to be the most widely used kind of foundation in Europe. In terms of providers, EEW and Sif have offered 423 monopiles in total throughout Germany, Belgium, and the Netherlands. With 19%, or 100 units, jackets are the second most common foundation type, which are provided to Morray East in the UK by Lamprell and Smulders. Kincardine and Windfloat Atlantic received three semi-subs structures (0.5%) from the Navantia-Windar Consortium, as shown in Figure 9 [16].

2.2.1. Monopile

A steel tube pile is placed into the seafloor to form a monopile foundation, which is usually 20–40 m long and 3–8 m in diameter [31]. This kind works well in shallow waters that are between 0 and 30 m deep. By creating side friction with the soil, it efficiently lowers vertical loads. By shifting the weight to the surrounding soil, monopiles effectively manage horizontal stresses without bending or rotating [34,38]. This foundation is commonly utilized for offshore wind turbines (OWTs) due to its ease of installation and appropriateness [39].
The sandy and muddy seabed of the North Sea makes pile construction easier and lowers costs for owners of offshore wind farms. Furthermore, the majority of offshore farms in Europe are situated in shallow waters, where there is a maximum depth of 30 m [3]. An extra transition piece at seabed level is advised between the foundation and the tower to alleviate issues with maintaining vertical monopiles. This part allows access to the turbine and vertically aligns the foundation [11,32].
According to Burton et al. [11], the transition piece makes it easier to put the tower and turbine on top of the foundation. By 2020, 4681 monopile foundations—or 81.2% of the market—had been installed in Europe, according to WindEurope [16]. Monopiles are expected to remain the most popular foundation type in Europe. With the rapid growth in offshore wind activity and increasing turbine sizes, it is crucial to quickly scale up the manufacturing of the largest monopile segments [40].

2.2.2. Gravity Foundations

Burton et al. [11] and Esteban et al. [41] have stated that the gravity base (GBS) foundation is typically built with affordable materials such as reinforced concrete and that it has the shape of a hollow frustum. But, steel or a combination of steel and concrete are also good choices. Heavy lift cranes and huge transport vessels are not needed because these foundations are constructed onshore, frequently in drydocks, which are then transported to the site using a semi-floating technique [38].
Materials such as sand, rock, or iron ore are added as ballast into the hollow interior of the GBS once it is in position. Significant weight is produced by this addition to resist loads that are applied vertically, as well as horizontally [3,41]. Strong sea overturning movements that may cause the structure to topple over are avoided in large part due to the ballast [11,31]. The GBS foundation is a feasible substitute in regions with shallow waters, i.e., those up to 20 m deep, where it is difficult to drive monopiles into the seabed because of semi-hard and uniform conditions (like rocky soil) [3,41].
The weight of a solid concrete, ballast-filled GBS foundation is around 1500–4500 tons, which is significantly more than that of other foundation types [42]. Dredging or soil preparation is necessary to create a flat surface at the installation sites in order to guarantee sufficient support [38,41]. All the same, GBS foundations account for 5% of the European market with 289 units deployed [16].
With its solid concrete construction and ballast-filled weight, the GBS is significantly heavier than other foundation types, weighing between 1500 and 4500 tons [42]. The installation locations need to be leveled out via dredging or soil preparation in order to guarantee sufficient support [38,41]. In spite of this, GBS foundations, of which there are 289 installed units, account for 5% of the European market [16].

2.2.3. Jacket

The jacket foundation is a space frame structure with three or four legs that is anchored into the seafloor by leg piles, as described by Wu et al. [31] and Díaz and Guedes Soares [3]. Its usefulness for offshore areas with water depths ranging from 25 to 50 m has been noted by Díaz and Guedes Soares [3]. Some sites have even been known to accommodate depths of 80 m [37]. The jackets are delivered to the site by flat-top barges or other vessels after being manufactured onshore as a single frame unit. For extra mobility, they occasionally float in a manner akin to gravity bases. The jackets are dropped into the ocean and secured with leg piles after being raised vertically by enormous cranes upon arrival [38].
In deeper waters, jackets with their wide legs provide a lighter option to monopiles for handling stronger overturning motions or principal horizontal loads. Due to their reduced total member cross-sectional area, their design lessens fatigue damage from wave inertia stress. However, the requirement for significant transition sections and their intricate design has led to increased production costs. By 2020, there were 568 jacket foundation units that had been built in Europe, constituting about 9.9% of the market as a whole [16].
The selection of the suitable foundation types for an offshore wind farm is primarily driven by economic factors and is often made during the initial design phase. Hence, it is crucial to be able to generate cost estimates for various foundation designs based on limited information. Fischer [43] offered a simplified cost estimate of 2 EUR/kg for monopiles and 4–6 EUR/kg for jackets, elucidating the preference for monopiles due to their more frequent usage compared to other types. Due to the higher fabrication expenses associated with conical sections, the estimated costs of towers range from 2–3 EUR/kg. In practice, economic comparisons between foundation types necessitate more intricate cost functions. For instance, while the lower mass of jackets is advantageous for the lifting capacities needed during installation, their larger dimensions result in greater storage requirements. Additionally, it is worth considering that fabrication costs for jackets could significantly decrease with large-scale installation, potentially due to the advancement of enhanced assembly strategies. In practical terms, this means that, when estimating the cost of foundations, the actual cost might be 15% to 25% higher or lower than the initial estimate. This acknowledgment of a margin of error is common in various engineering and construction contexts, where early estimates are made based on preliminary information, and the accuracy improves as more detailed designs are developed [44].

3. Prospects for Offshore Wind

In offshore wind, floating foundations are a relatively new development. Most offshore wind resources are located at depths of more than 60 m, making them unsuitable for conventional bottom-fixed foundations. The winds are stronger and more reliable in these deeper, farther offshore locations. Higher capacity factors can be achieved by utilizing these ideal wind resources without being constrained by sea depth thanks to floating foundations [45].
Europe has plenty of wind-producing regions and shallow waters, making it the perfect place to install bottom-fixed foundations to meet the growing demand for offshore wind. However, there is limited space with comparable characteristics in places like Japan and the US West Coast. This has spurred interest in floating solutions, which could accelerate the worldwide shift to green energy by accelerating offshore wind expansion in difficult deepwater regions [46].
A construction intended to float and be supported by an anchoring mechanism is called a floating foundation. According to Xu et al. [47] the oil and gas (O&G) industry is the source of the common designs of floating foundations. An example of one of these ideas is shown in Figure 10. These styles consist of the following:
  • Spar: Spar is a long, thin, and cylindrical buoy that stays above water by using ballast. The significant weight of the structure offers stability in dynamic waters deeper than 120 m, making it easier to construct than alternative floating foundations [37,47].
Numerous experimental and numerical studies have been conducted to evaluate the performance of spar-type offshore wind turbines. These comprehensive investigations span various disciplines, encompassing aerodynamics, hydrodynamics, elastic multi-structure dynamics, and automated control [48,49]. The aerodynamics of floating offshore wind turbines (FOWTs) are commonly simulated using numerical methods such as BEM, GDW, and CFD [50]. Furthermore, coupled dynamics analysis and simulation tools have been developed for FOWTs [51].
The FAST platform, developed by NREL, stands out as the most frequently utilized and recognized numerical simulation software for floating offshore wind turbines (FOWTs) [52]. Moreover, experimental studies have been carried out to assess the performance of spar-type FOWTs.
The DeepCwind project validated offshore wind energy modeling methods through the testing of three prototype floating wind turbines at a 1/50th scale in a wave basin. These prototypes included a semisubmersible, a tension-leg platform, and a spar buoy [53]. Despite using the Froude number to compare wave-induced dynamics between models and prototypes, achieving aerodynamic similarity was challenging due to the Reynolds scale difference. Consequently, in numerous instances, a disk with a comparable drag force was employed to simulate the wind rotor.
The Ocean Basin Laboratory at Martinek conducted a Froude-scaled model test of the Hywind spar-type floating offshore wind turbine (FOWT) at a scale of 1:47, whereby they assessed its performance in various sea states [54]. Additionally, the State Key Laboratory of Ocean Engineering at Shanghai Jiao Tong University developed a 1:40 scale model of the OC3-Hywind spar, which was constructed in the DHI Offshore Wave Basin in Hørsholm, Denmark. A comparative study evaluated the experimental and numerical results that were obtained using the FAST code [55]. Moreover, computational research was conducted to analyze the design of the Hywind spar, which was equipped with a 5 MW turbine, in the time domain, covering aspects such as platform motions, mooring dynamics, tower elastic responses, blade–rotor dynamics, and aeroloading [56].
  • Semi-Submersible Platform (SSP): This platform floats above the water’s surface while remaining partially submerged. Mooring lines are used by both spar and SSP to keep a loose connection to the seafloor. Suitable for water depths up to 120 m, SSP is a flexible sort of floating foundation [37].
As the offshore wind industry expands into deeper waters (50–300 m), the semi-submersible platform is gaining popularity [57]. Compared to spars, semi-submersibles have shallower drafts, enabling quayside assembly and wet towing, which is a significant advantage. Collu [58] enhanced the support structure of the Dutch tri-floater by implementing several improvements. These included dividing the foundation’s columns into three compartments with the addition of two horizontal bulkheads. Furthermore, T-/H-section and radius ring stiffeners were incorporated to augment the foundation’s integrity and stiffness on both local and global scales.
Roddier et al. [59] introduced the WindFloat, another prominent semisub-type floating offshore wind turbine (FOWT). Similar to the Dutch trifloater, the WindFloat features a foundation with three columns. The wind turbine is situated in one of these columns, while the remaining columns are ballasted to uphold their vertical alignment. Each column incorporates a permanent water ballast system at its base to regulate the structure’s draft to the desired level. Additionally, an active water ballast system is situated atop the permanent ballast to facilitate water transfer between columns.
The active mechanism of the floating structure dynamically adjusts the weight of each column to ensure the wind turbine maintains its vertical position amidst fluctuations in wind speed and direction.
Semisubmersible FOWTs require coupled dynamics studies for proper design. A recent study investigated the performance deviations of a floating offshore wind turbine (FOWT) with a broken mooring line, utilizing the OC4 DeepCwind semisubmersible as a benchmark [60]. Another study evaluated the overall performance of the OC4 and WindFloat semisubmersible FOWT hulls under identical environmental and control conditions. This investigation employed a fully coupled simulation program, encompassing the turbine, floater, and mooring system, as well as featuring a 5 MW wind turbine and a catenary mooring configuration [61]. Additionally, a proposal has been made for a semisubmersible floating foundation housing multiple wind turbines, along with a coupled dynamic analytical tool [62,63].
  • Tension Leg Platform (TLP): TLPs are well known in the O&G sector, and they are commonly used as FOWT substructures. TLP wind turbines have significantly lower heave, roll, and pitch motions than other floating foundations. It might drastically reduce manufacturing costs in deep oceans compared to stationary platforms. A seafloor-supported underwater platform is supported vertically by tendons. TLP is a lightweight, highly stable construction that can be used in water up to 120 m deep. But, TLP is not employed much because of its complicated and expensive mooring method [37,47].
Zhao et al. [64] introduced a novel multicolumn Tension Leg Platform (TLP) foundation called Windstar TLP, which was designed specifically for the NREL offshore 5 MW reference turbine. This design mimicked the site-specific environmental conditions of the OC3-Hywind. On the other hand, Bachynski and Moan [65] conducted the design and analysis of five parametric single-column Tension Leg Platform Wind Turbines (TLPWTs) under varying wind and wave conditions. They employed Simo, Reflex, and Aerodyn numerical tools for a comprehensive coupled analysis, and they estimated the platform movements and structural loads on both turbine components and tendons.
Nihei and Fujioka [66] presented tank test findings for a 1:100 scale Tension Leg Platform-type floating offshore wind turbine (TLP-type FOWT) equipped with three revolving blades. These tests were conducted under combined wave and wind conditions. Their results indicate that the interaction between the blades and the wind reduces the pitch motion of the floater and the vibrations in the mooring lines. However, the dynamic coupling effects between the hull or tendon and the turbine necessitate modeling, as they can induce significant shifts in the initial natural frequencies of the TLP motion due to the tower’s elastic behavior. Additionally, a recent study conducted an analysis of the fatigue life of a TLP offshore wind turbine in the time domain, wherein they considered various factors such as blade–rotor dynamics, mooring dynamics, and platform motions [67].
  • Barge: The barge-type FOWT uses wind turbines mounted on a shallow-draft barge frame. The barge type is stable because of its broad waterplane surface. Similar to semisubmersibles, quayside assembly and wet towing are possible. The barge-type foundation has the advantage of being simple to manufacture. Barge-type wind turbines are typically employed in calm seas, such as harbors, due to their sensitivity to wave motions.
There are limited barge-type floating offshore wind turbine (FOWT) systems in existence, including the ITI Energy Barge [68]. Among them, Floatgen, designed by the French company Ideol, stands out. Floatgen employs a concrete, ring-shaped support structure, and it features a moon pool, which is also referred to as a damping pool, to mitigate wave-induced vibrations [57].
Developed in the 1970s, floating foundations for offshore wind were put to the test in real life in 2008 in Italian waters using an 80 kW turbine mounted atop a TLP. Subsequently, a number of pilot projects [69] were undertaken in the US, Europe, and Asia.
By the end of 2020, there was only about 100 MW of floating offshore wind power in the world, mostly in the UK, Portugal, and Japan. However, the Global Wind Energy Council (GWEC [20]) predicts a notable increase, calculating that 6.5 GW might be installed by 2030. This comprises large-scale 1 GW projects in Asia and Europe [20].
The 2023 Global Offshore Wind Report [70] heralds a significant advancement in the worldwide expansion of offshore wind energy. According to their analysis, a staggering 380 GW of offshore wind capacity is forecasted to be installed across 32 markets in the next decade (2023–2032). Notably, nearly half of this growth is anticipated to originate from the APAC region, with Europe contributing 41%, North America 9%, and LATAM 1%. IRENA estimates that, between 2011 and 2024, the total installed costs of floating wind projects could potentially decrease by 70%, i.e., from 14,161 to 4310 USD/kW. Furthermore, as shown in Figure 11, by 2024, these improvements should result in a more appealing Levelized Cost of Energy (LCOE) of roughly 0.13 USD/kWh, a considerable drop from 0.88 USD/kWh in 2011 [71].
The projected development of new offshore wind capacity in the APAC region from 2023 to 2032 is poised to mitigate approximately 650 Mt CO2 emissions annually. However, GWEC Market Intelligence predicts potential bottlenecks in all regions except China by 2026. To overcome these challenges, substantial additional investments and enhanced global cooperation will be imperative. Using floating offshore turbines (FOT) in deeper water will significantly contribute to mitigating CO2 emissions as the stronger winds and fewer environmental constraints allow for higher power output and larger turbine sizes, thus resulting in reduced CO2 emissions. This necessitates further study on linking the mooring lines of floating foundations to the seabed.
Delving into discussions about offshore wind farms and their intricate components, as well as the dynamic trajectory of offshore wind development, highlights the critical need for innovative solutions to meet the sector’s changing demands. Traditional foundation systems are becoming increasingly ineffective as offshore wind farms grow in size, in their distance from shore, and in their water depth. In light of this, this study proposes using helical piles as mooring line anchors and presents an optimization framework that takes into account inclination angle and plate position to improve bearing capacity. These advancements not only address industry challenges, but also pave the way for sustainable and efficient offshore wind energy deployment, which aligns with the overall goals of this research project. The following section will detail this study.

4. Utilizing Helical Piles: A Solution for Anchoring Mooring Lines

4.1. Introduction

Helical piles are primarily utilized to counteract tension forces arising from overturning moments and uplift in different structures. As such, they have been proposed as a viable substitute for driven piles in offshore applications, offering substantial uplift capacity thanks to the anchoring effect of the helix. However, there are currently no established standards for evaluating the suitability of helical piles in offshore settings [72].
The direction and intensity of the load transferred to an anchor depend on the type of mooring, which is typically categorized into three types: (i) catenary, where the load inclination ranges from 75–90 degrees from the vertical line; (ii) taut (or semi-taut), with an inclination of 45–60 degrees from the vertical line; and (iii) tension leg, which has an inclination of 0–20 degrees from the vertical line [73].
Helical piles are a form of composite-type anchors that combine plate- and pile-type elements. These piles typically consist of a steel circular shaft attached to one or more helices. During installation, compressive force and torque are applied at the head to screw them into the ground, resulting in reduced underwater noise compared to traditional hammering methods. Similar to plate anchors, helical piles withstand tensile loading by utilizing the soil bearing resistance above the topmost helix [72,74,75]. When subjected to lateral loading, helical piles exhibit behavior similar to straight shafted piles, as noted by Ding et al. [76], albeit with some improvement due to the rotation of the helices. However, the complete mobilization of plate resistance may transpire if pile rotation aligns the loading direction with the shaft. One of the primary hurdles in employing helical piles offshore is the necessity to scale up from the relatively modest dimensions utilized in onshore applications thus far, as highlighted by Sharif et al. [77] and Davidson et al. [78]. Overcoming this challenge will necessitate installation tools capable of applying large torques of several MN.m. Nonetheless, this obstacle can be addressed by employing groups of smaller helical piles, as suggested by Bradshaw et al. [79].
This study utilized the PLAXIS 3D program to evaluate the efficacy of helical piles with small and large shaft diameters, and this featured two helical plates: one anchored at the base and the other situated at various positions along the shaft. The investigation focused on assessing their ability to withstand uplift loads imposed by mooring lines in sandy soil within the context of floating offshore wind systems. Given the intricacies involved and challenges associated with field and laboratory experiments, numerical analysis emerged as a compelling approach for conducting a comparative parametric study of the specified piles in this research [80].

4.2. Plaxis Validation

The primary aim of this section is to validate the precise simulation capabilities of the Plaxis 3D program in replicating the behavioral characteristics associated with pullout load and the relationship between pullout load and upward movement for piles in sandy soil. This validation process is essential to fulfill the overarching objective of obtaining results within a parametric study, thus facilitating the comparison of reliability and accuracy across the various parameters under investigation.
The numerical modeling assumptions utilized in the 3D Finite Element Method (FEM) were first validated against field case study data and centrifuge test concerning helical piles subjected to pullout loading in sand, as detailed by [79,80]. The parameters required for the HS constitutive model were deduced from the soil parameters provided in the case study. In situations where certain parameters were not directly available, they were estimated based on the in situ relative density derived from the case study, employing the correlations outlined in Table 4 [81].
Plaxis 3D (V20), a specialized finite element analysis software tailored for geotechnical engineering tasks, provides a comprehensive suite of elements, degrees of freedom, and crucial functionalities necessary for effective numerical simulations. The software leverages a variety of element types to precisely depict various aspects of geotechnical models. For instance, 10-node tetrahedral elements are utilized to represent three-dimensional soil structures accurately, while 3-node line beam elements are employed for modeling the shafts of helical and granular anchor piles. In addition to these, 6-node plate elements are adept at simulating helices and laboratory model walls, while 12-node interface elements allow for a realistic representation of the soil–structure interactions along model boundaries. Interfaces are particularly vital in Plaxis 3D as they capture the intricate interplay between helical piles and the surrounding soils. They enable the transfer of loads and deformations, thus facilitating a comprehensive examination of pile–soil interface behavior. In this study, the material model employed for the interfaces aligns with that used for the adjacent soil model. In our analysis, we implemented, for interfaces between the shaft and pile soil, a specific interface reduction factor (Rinter) of 0.7 for the field study of Salem and Hussein [82] and 0.51 for centrifuge test of Davidson et al. [83]. For interfaces between the pile soil and the surrounding site soil around the pile, the Rinter was set at 1. Additionally, we activated gap closure to enhance the accuracy of the interface behavior during numerical simulation.
Plaxis 3D offers a wide array of material models designed to accurately depict the behavior of soil. These models, including Hardening Soil, Hardening Soil Small, Mohr–Coulomb, and Soft Soil, account for elasticity, plasticity, and hardening characteristics. By incorporating these models, the software enables realistic material responses to applied loads, enhancing the fidelity of the analysis.
The Hardening Soil model was chosen for this study owing to its advanced capabilities and reliable performance. Distinguished by its ability to simulate both soft and stiff soils, this model surpasses the Mohr–Coulomb model in several aspects. It incorporates stress-dependent stiffness, accommodates stiffness reduction due to shear strain, and offers a nuanced treatment of dilatancy and yield. With a wide range of defining parameters, which can be derived from laboratory testing or field experience, the Hardening Soil model has proven efficacy in simulating soil behavior across diverse conditions. Its extensive utilization in numerous research studies attests to its effectiveness and versatility [84,85,86,87,88].
In the Hardening Soil model, achieving precise soil deformation modeling necessitates the integration of three distinct stiffness parameters (all of which are applied at a specific reference stress level): Triaxial Loading Stiffness (E50), Triaxial Unloading–Reloading Stiffness (Eur), and Oedometer Loading Modulus (Eoed). This combination of parameters enables users to differentiate between loading and unloading–reloading stiffnesses. Such differentiation significantly enhances the model’s capacity to accurately depict the soil’s response across diverse loading conditions and its intricate behavior under varying stress states [87].
The current numerical analysis comprises four distinct calculation phases. Initially, the first phase involves simulating the initial geo-stress induced solely by the weight of the soil, leading to a K₀ consolidation of the ground, where K₀ is approximated as (1 − sin φ). Moving to the second phase, the simulation focuses on the effect of pile installation. This phase idealizes the process of installing displacement piles as a cavity expansion problem, one that is primarily influenced by penetration resistance in sand [89]. During pile installation, the helical blade, coupled with the closed-end shaft, displaces the soil radially, forming a cavity. This process induces stress changes and densification within the soil mass, particularly in cohesionless soil. Therefore, employing cavity expansion by volumetric strain is an appropriate approach for modeling the installation effect [90]. To replicate the increase in stress around the pile, the pile cavity can be expanded before loading by applying positive volumetric strains [91,92]. In this study, cavity expansion through volumetric strain was executed before activating the pile elements. A collective volumetric strain of 2% for a case study of the Sharkia Governorate, Egypt, as well as 16% for the centrifuge test undertaken at the University of Dundee, was deemed appropriate for the outcomes. Figure 12 illustrates a cross-section of the typical displacement contours following cavity expansion when it is conducted in the second calculation phase. The disturbed soil around the shaft is activated; subsequently, the shaft, plate elements, and interface elements are activated in the third calculation phase. The final stage entails simulating the application of load on the pile head.

4.2.1. The Case Study of Sharkia Governorate, Egypt (According to Salem and Hussein [82])

Salem and Hussein [82] documented the performance of helical piles from field trials conducted in dense sands (site 4) in Sharkia Governorate, Egypt. The helical piles were installed to depths (L) of 1.9 m, with a pile shaft diameter (Dc) of 45 mm, as well as two helical plates with diameters (Dh) of 0.2 m and thicknesses (th) of 10 mm. The spacing between the helical plates measured approximately two and a half times the diameter of the helix, which is denoted as S/Dh = 2.50, where S represents the helix spacing and Dh signifies the helix diameter. A summary of the helical pile configuration is presented in Table 5. The soil at the site was determined to be dense sand for modeling based on the available ground investigation data. The phreatic water level was observed at 2 m below ground level. A summary of the soil properties reported by Salem and Hussein is shown in Table 6.
The average relative densities ( D r ) obtained for Site 4 were approximately 78%. The load application at the pile head was executed through displacement control, thus ensuring the maximum displacement matched that of the field test. The helical pile, composed of steel, was modeled as a linear elastic material with the following properties: Modulus of Elasticity (E) = 2 × 10⁵ MN/m2, Unit Weight (γ) = 78.5 kN/m3, and Poisson’s ratio (ν) = 0.3. A summary of the helical pile configuration is provided in Table 5. To ensure that the boundaries had no effect on the studied problem, the model dimensions were taken as presented in Figure 13.

4.2.2. Centrifuge Test Undertaken at the University of Dundee (According to Davidson et al. [78,83])

The numerical results were also validated against small-scale centrifuge tests conducted at the University of Dundee (UoD), as detailed by Davidson et al. [83]. These tests involved the installation of three screw anchors in very dense sand (referred to as VD, with an average relative density ( D r ) of 84%) and one in medium dense sand (MD, D r = 57%). Conducted in dry sand at 48 g, the experiments replicated the stress field that would be obtained in saturated sand at 80 g, as justified by Li et al. [93]. Specifically, our study focused on validating numerical results against the U2VD test, which featured two helices spaced at two helix diameters in very dense sand, thus closely resembling our study conditions. Table 7 provides an overview of the soil properties. At prototype scale (a scaling factor of 80 g), the helix diameter (Dh) of all model anchors installed in very dense sand was 1.7 m, with a core diameter (Dc) of 0.88 m. A summary of the helical pile configuration is provided in Table 5. The installation process and uplift loading in the centrifuge tests were intentionally slow to simulate the drained installation and loading conditions typical of offshore environments.
Figure 14 illustrates the outcomes of the pullout loading simulation, showing generally favorable agreement with the predictions of behavior for the HS model, albeit with minor discrepancies. These differences were attributed to the simplification of the relative density distribution employed in the simulation.

4.3. Problem Description

The objective of the present study is to investigate the performance of a helical pile with small and large shaft diameters in supporting the mooring line of floating offshore wind systems. To achieve this goal, a helical pile with a length of 15 m, a small shaft diameter of 12 cm, and a large shaft diameter of 0.88 m were considered. The pile was equipped with two helical plates: one at the bottom to support the pull-out load and one at the top, which was positioned between 0.5 and 13 m from the seabed to optimize the best location. The helical plates had a diameter of 0.6 m for a small shaft diameter and 1.7 m for a large shaft diameter, as well as a thickness of 2.54 cm for a small shaft diameter and 11 cm for a large shaft diameter. The sea water depth was assumed to be 150 m. The load was applied at different angles from the vertical line, including 0, 20, 40, and 60 degrees, thus representing various scenarios of mooring line configurations. The soil considered in this study was dense sand. The Hardening Soil (HS) model was employed to simulate the soil behavior, with its parameters presented in Table 6 for a small shaft diameter and Table 7 for a large shaft diameter.

4.4. Methodology

The present study follows a methodology similar to that of Alnmr et al. [94,95]. Figure 15 provides a cross-sectional view of reinforced soil featuring helical piles. The ratio of the model width to the pile diameter was designed to be around 50, as shown in Figure 13, which is considered adequate for minimizing the influence of boundary effects on the results. A 3D model is utilized to calculate the load (F) for different locations of the top plate of the helical pile (Zh) and various inclination angles (i).
The current numerical analysis consisted of four calculation phases. In the first phase, we simulated the initial geo-stress caused by the soil’s weight, leading to a K₀ consolidation of the ground, where K₀ was approximated as 1 − sin φ. The second phase focused on simulating pile installation, which was idealized as a cavity expansion problem influenced by penetration resistance in sand. During this phase, the helical blade and closed-end shaft displaces the soil radially, creating a cavity and inducing stress changes and densification, particularly in cohesionless soil. Cavity expansion through volumetric strain was used to model this effect. Positive volumetric strains were applied to replicate the increased stress around the pile before loading. In this study, we used a volumetric strain of 2% for the Sharkia Governorate, Egypt case study, which represented the small shaft diameter, and 16% for the centrifuge test at the University of Dundee, which represented the large shaft diameter. The disturbed soil around the shaft was activated; subsequently, the shaft with the required diameter, plate elements in the required location, and interface elements were activated in the third calculation phase. The final stage involved simulating the application of load with the required inclination on the pile head. The soil parameters are shown in Table 6 for the small shaft diameter, as well as in Table 7 for the large shaft diameter.

Boundary and Initial Conditions

In the model, the lateral boundaries are considered to have zero horizontal displacements, while the bottom exhibits zero horizontal and vertical displacements. This assumption mirrors the natural soil behavior, where the soil surrounding a structure at a considerable horizontal distance acts as horizontal fixities [96]. After inputting all parameters, the Plaxis 3D program generated a mesh, as shown in Figure 13. A coarse mesh was utilized, with refinement concentrated around the piles. The analysis employed approximately 30,850 elements and 48,176 nodes.
In this study, an initial water depth of 150 m was assumed. The initial stresses were then calculated using Jacky’s formula: K₀ = 1 − sin φ.

4.5. Results and Discussion

This study investigated the impact of load inclination (i) variations on the pullout load behavior of helical piles. Four different load inclinations (i)—0, 20, 40, and 60 degrees—were examined. For each load inclination (i), the location of the top helical plate (Zh) varied from 0.5 to 13 m along the pile, starting from the seabed level.

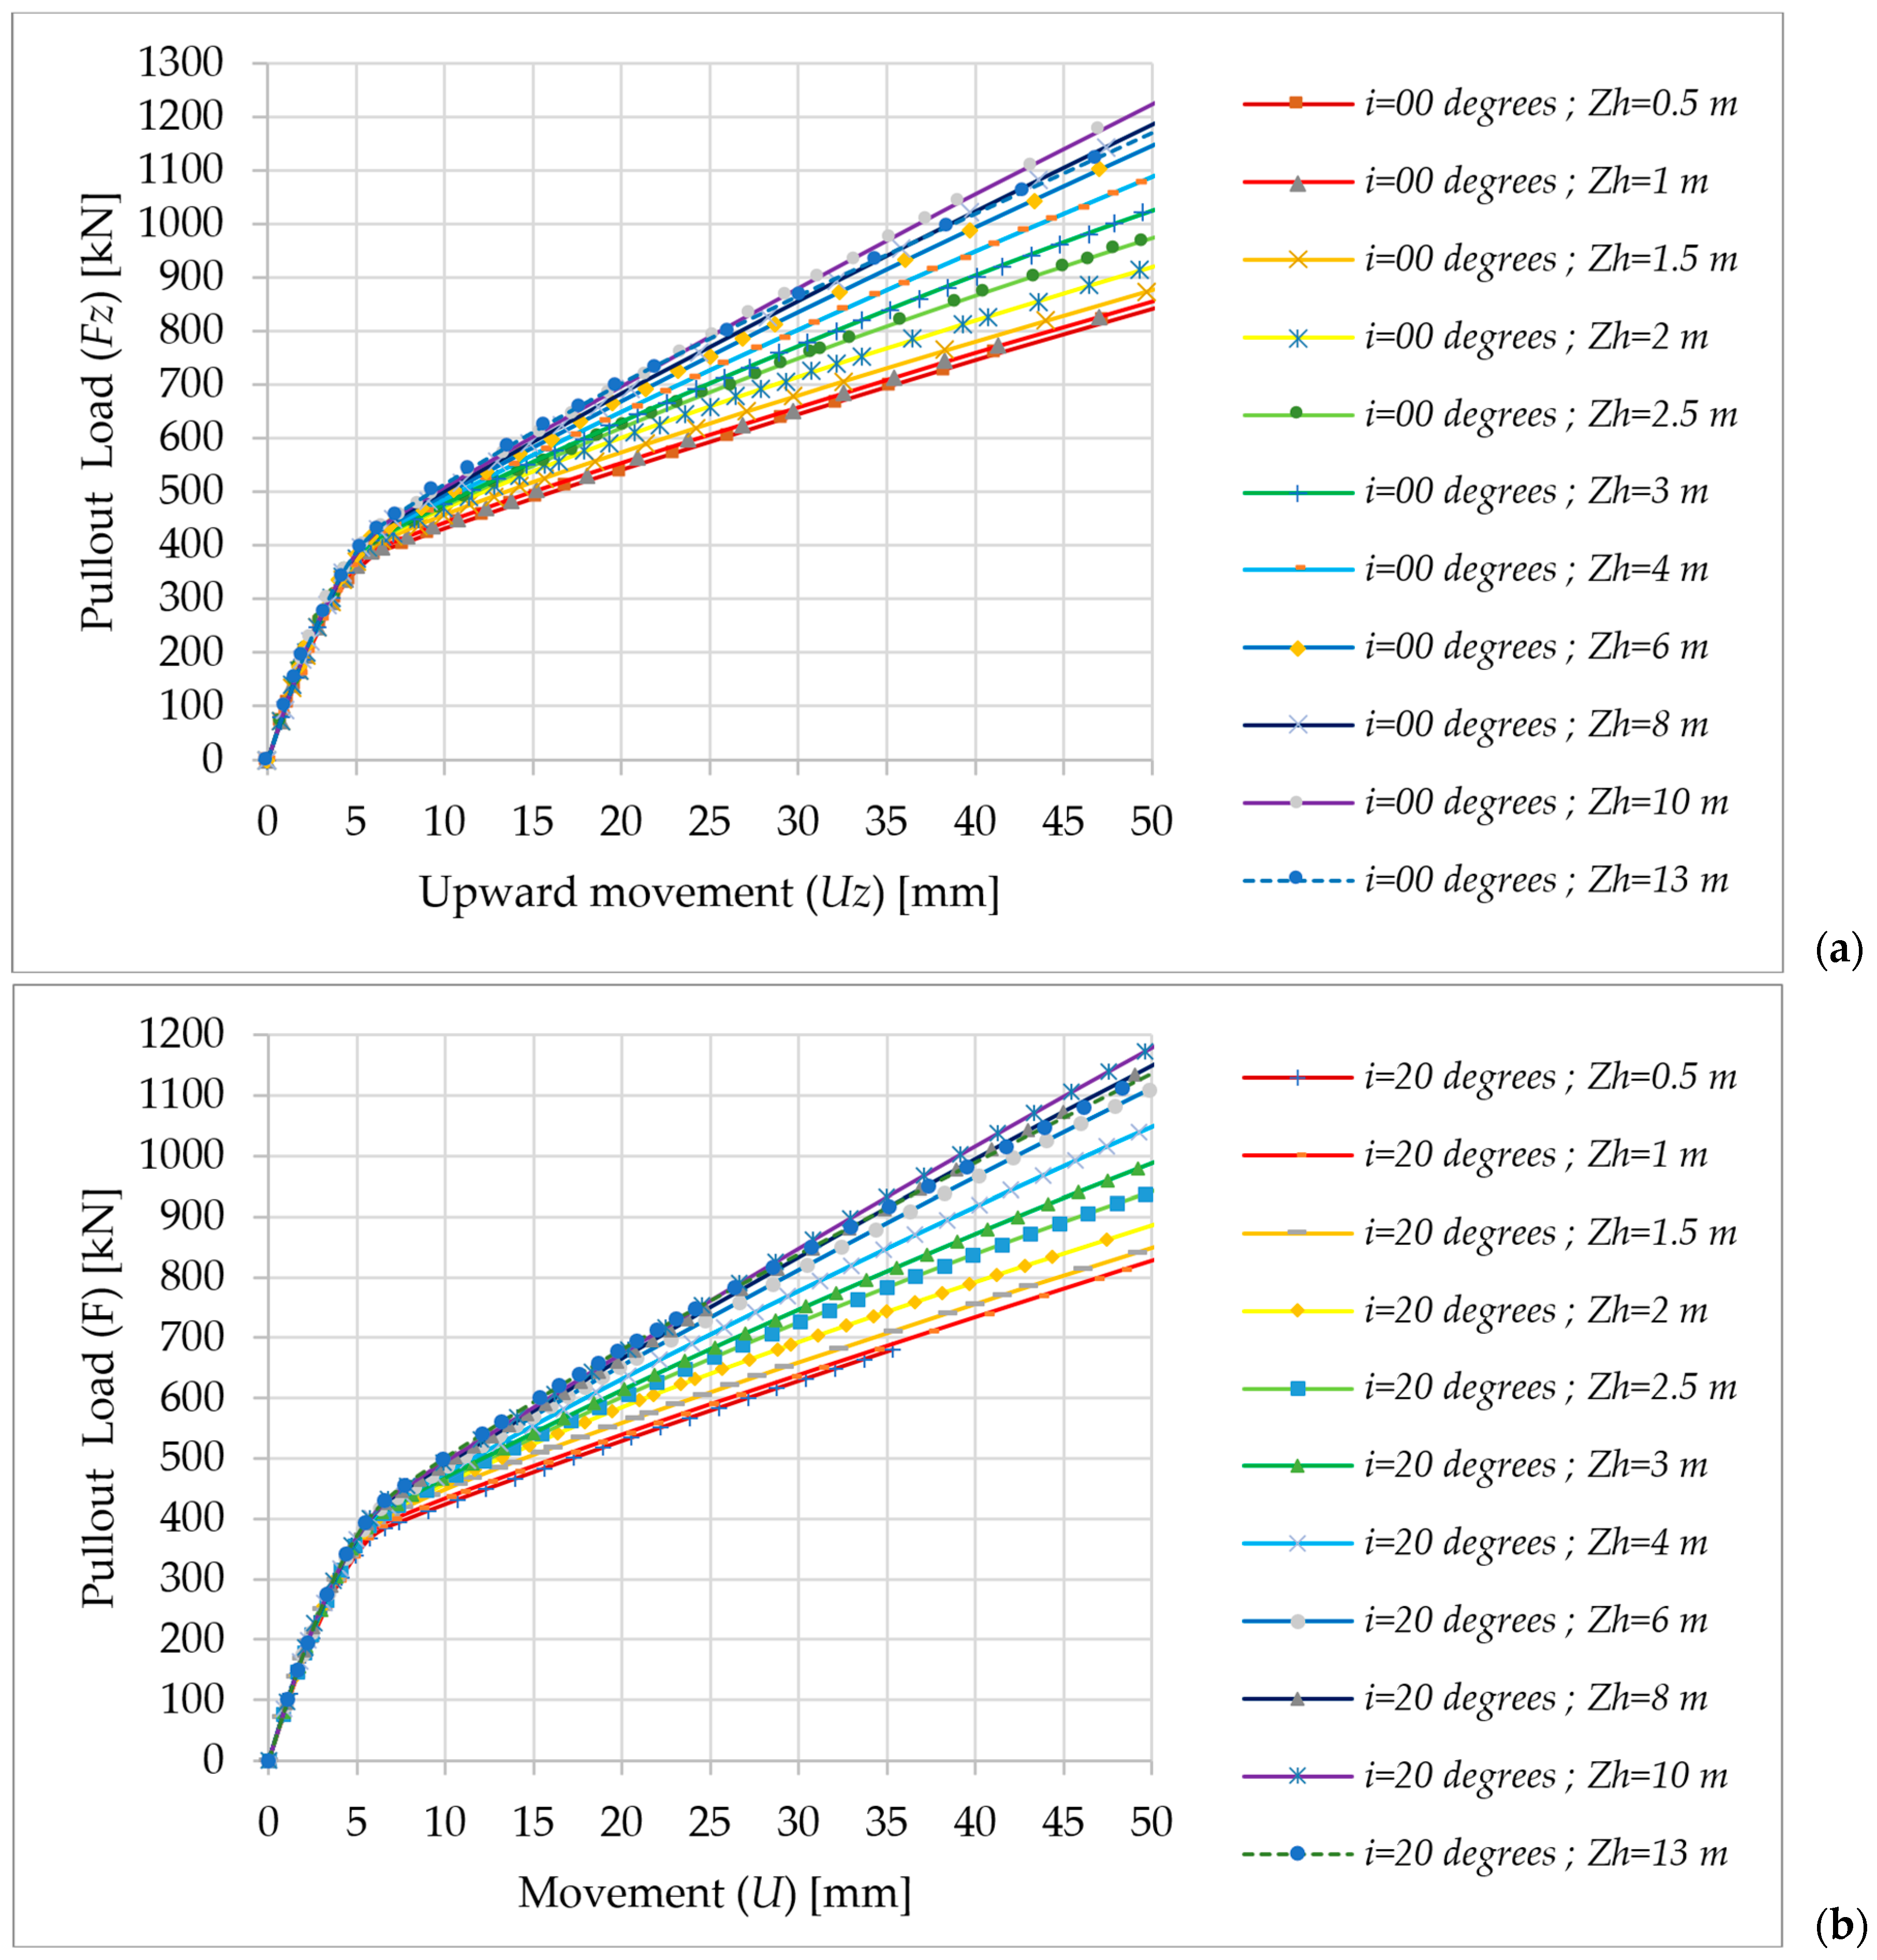
4.5.1. Small-Shaft-Diameter Helical Piles

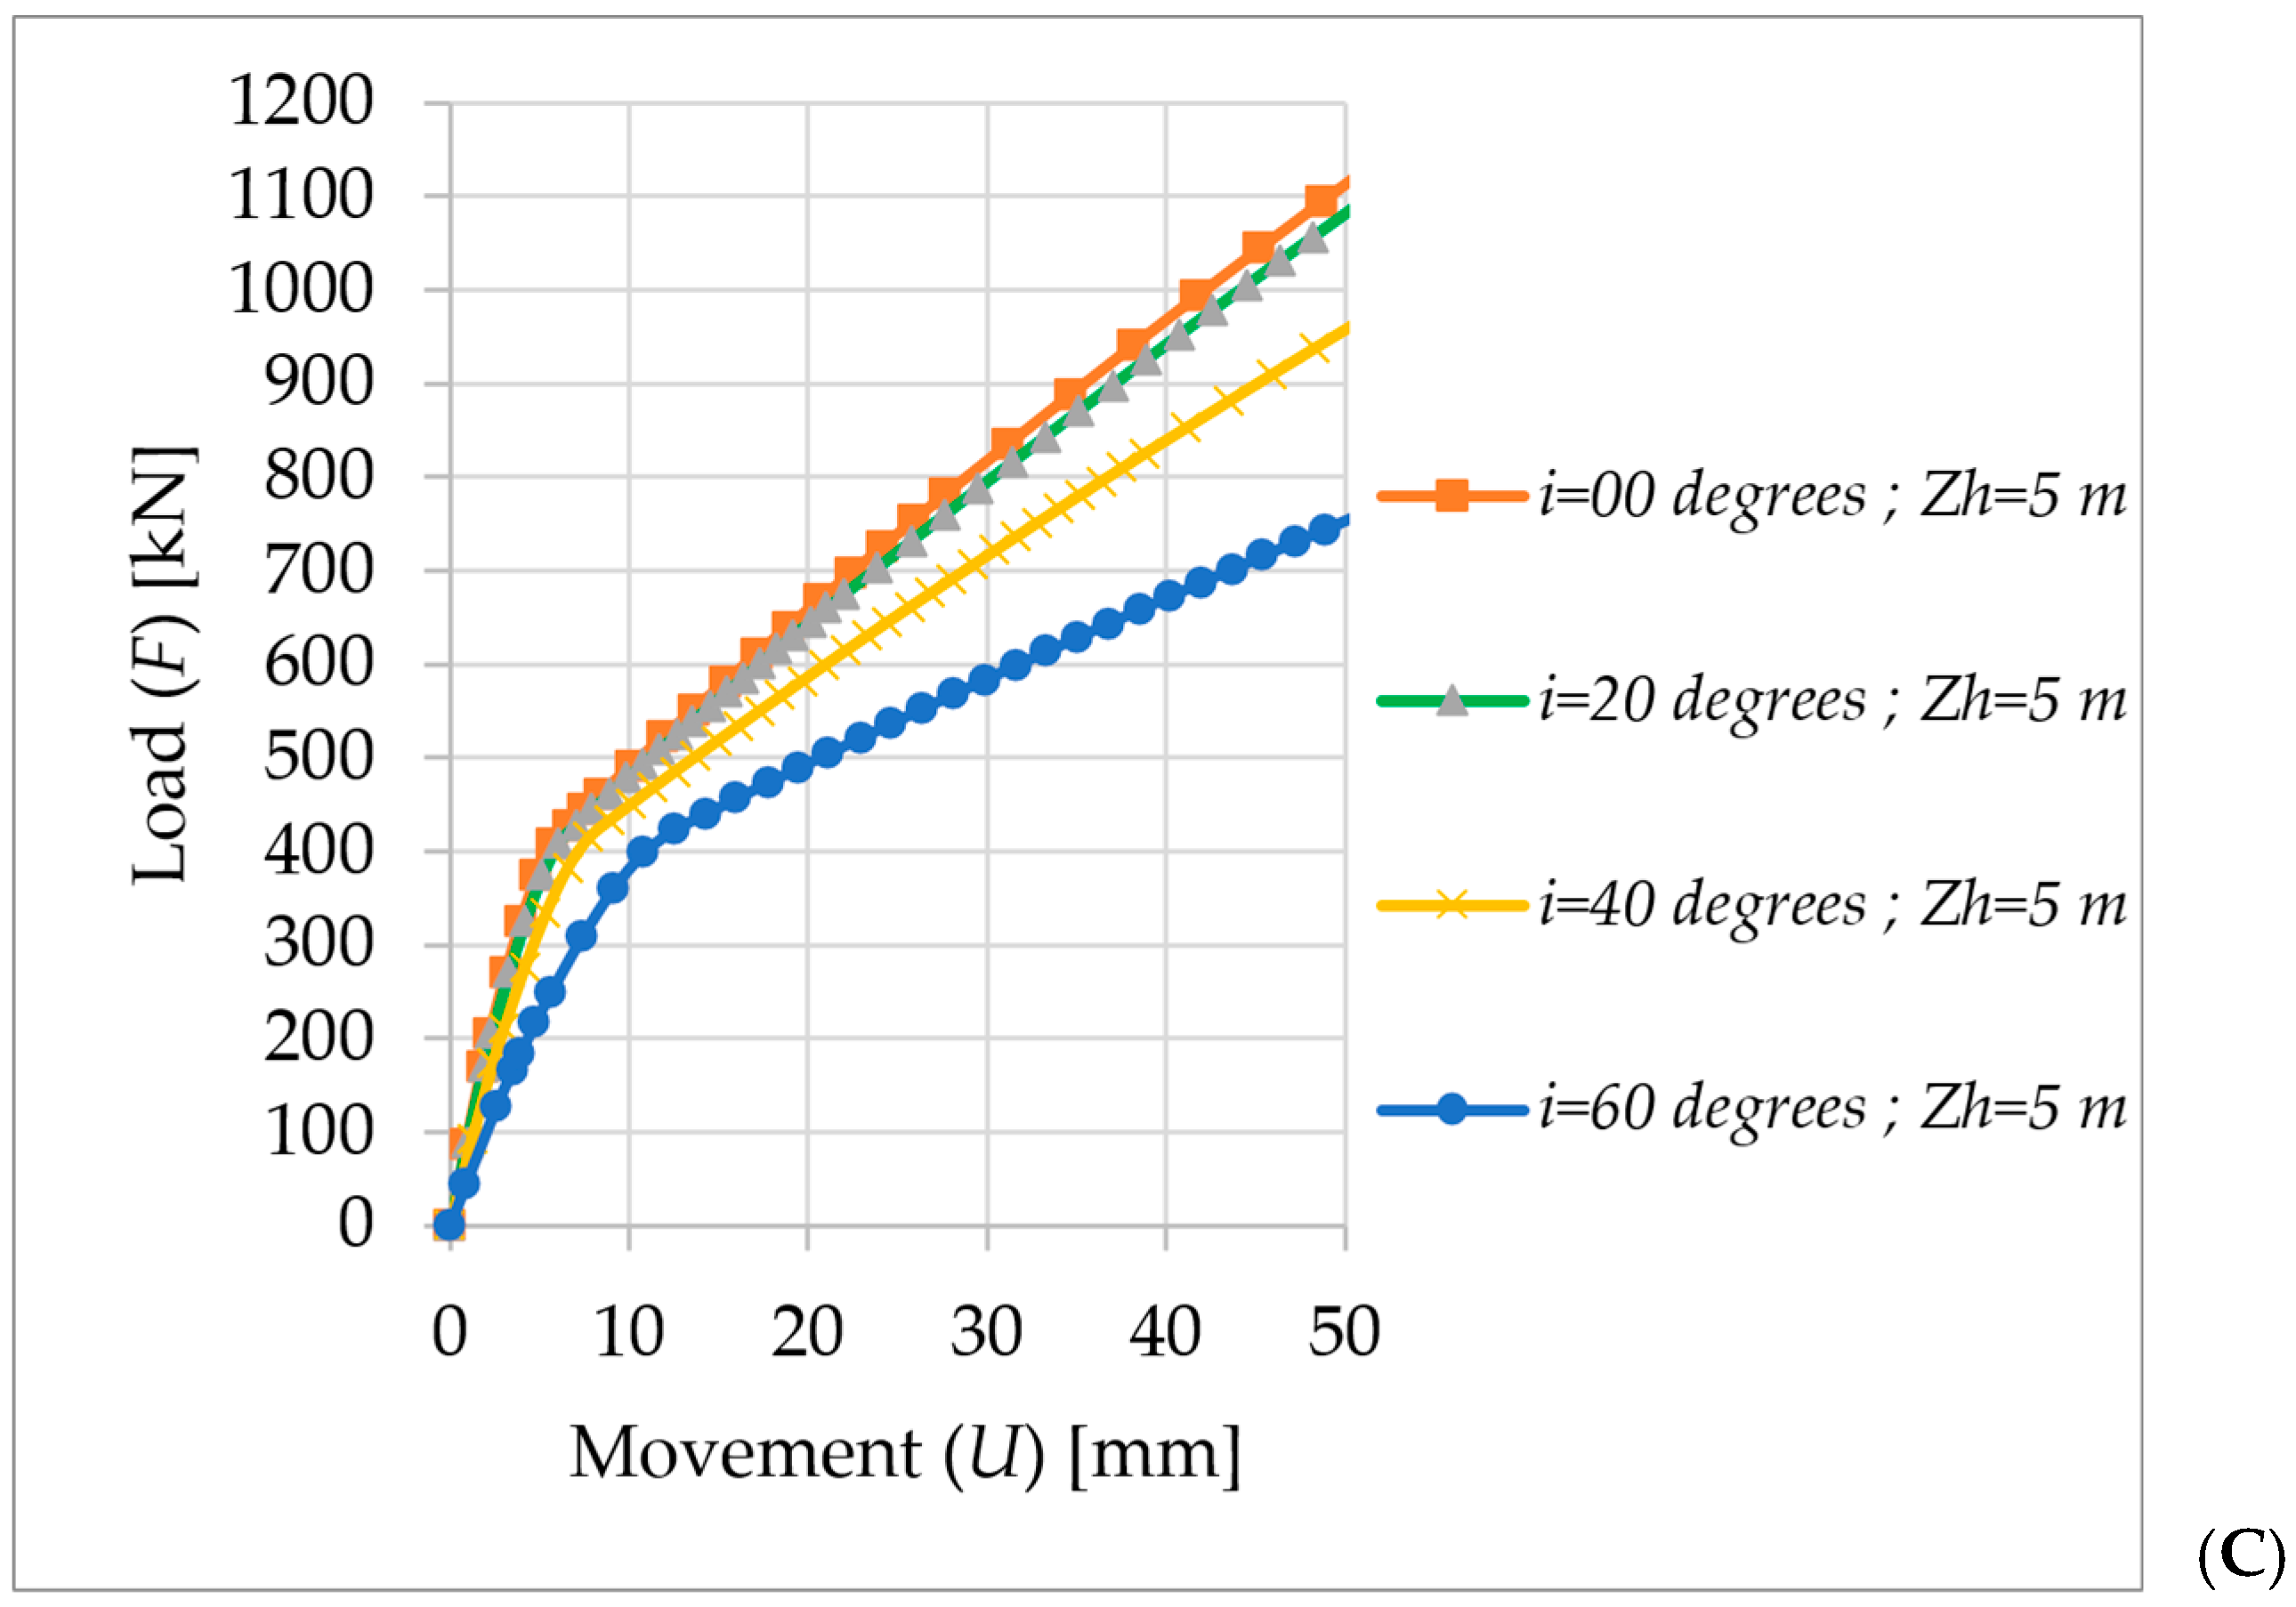
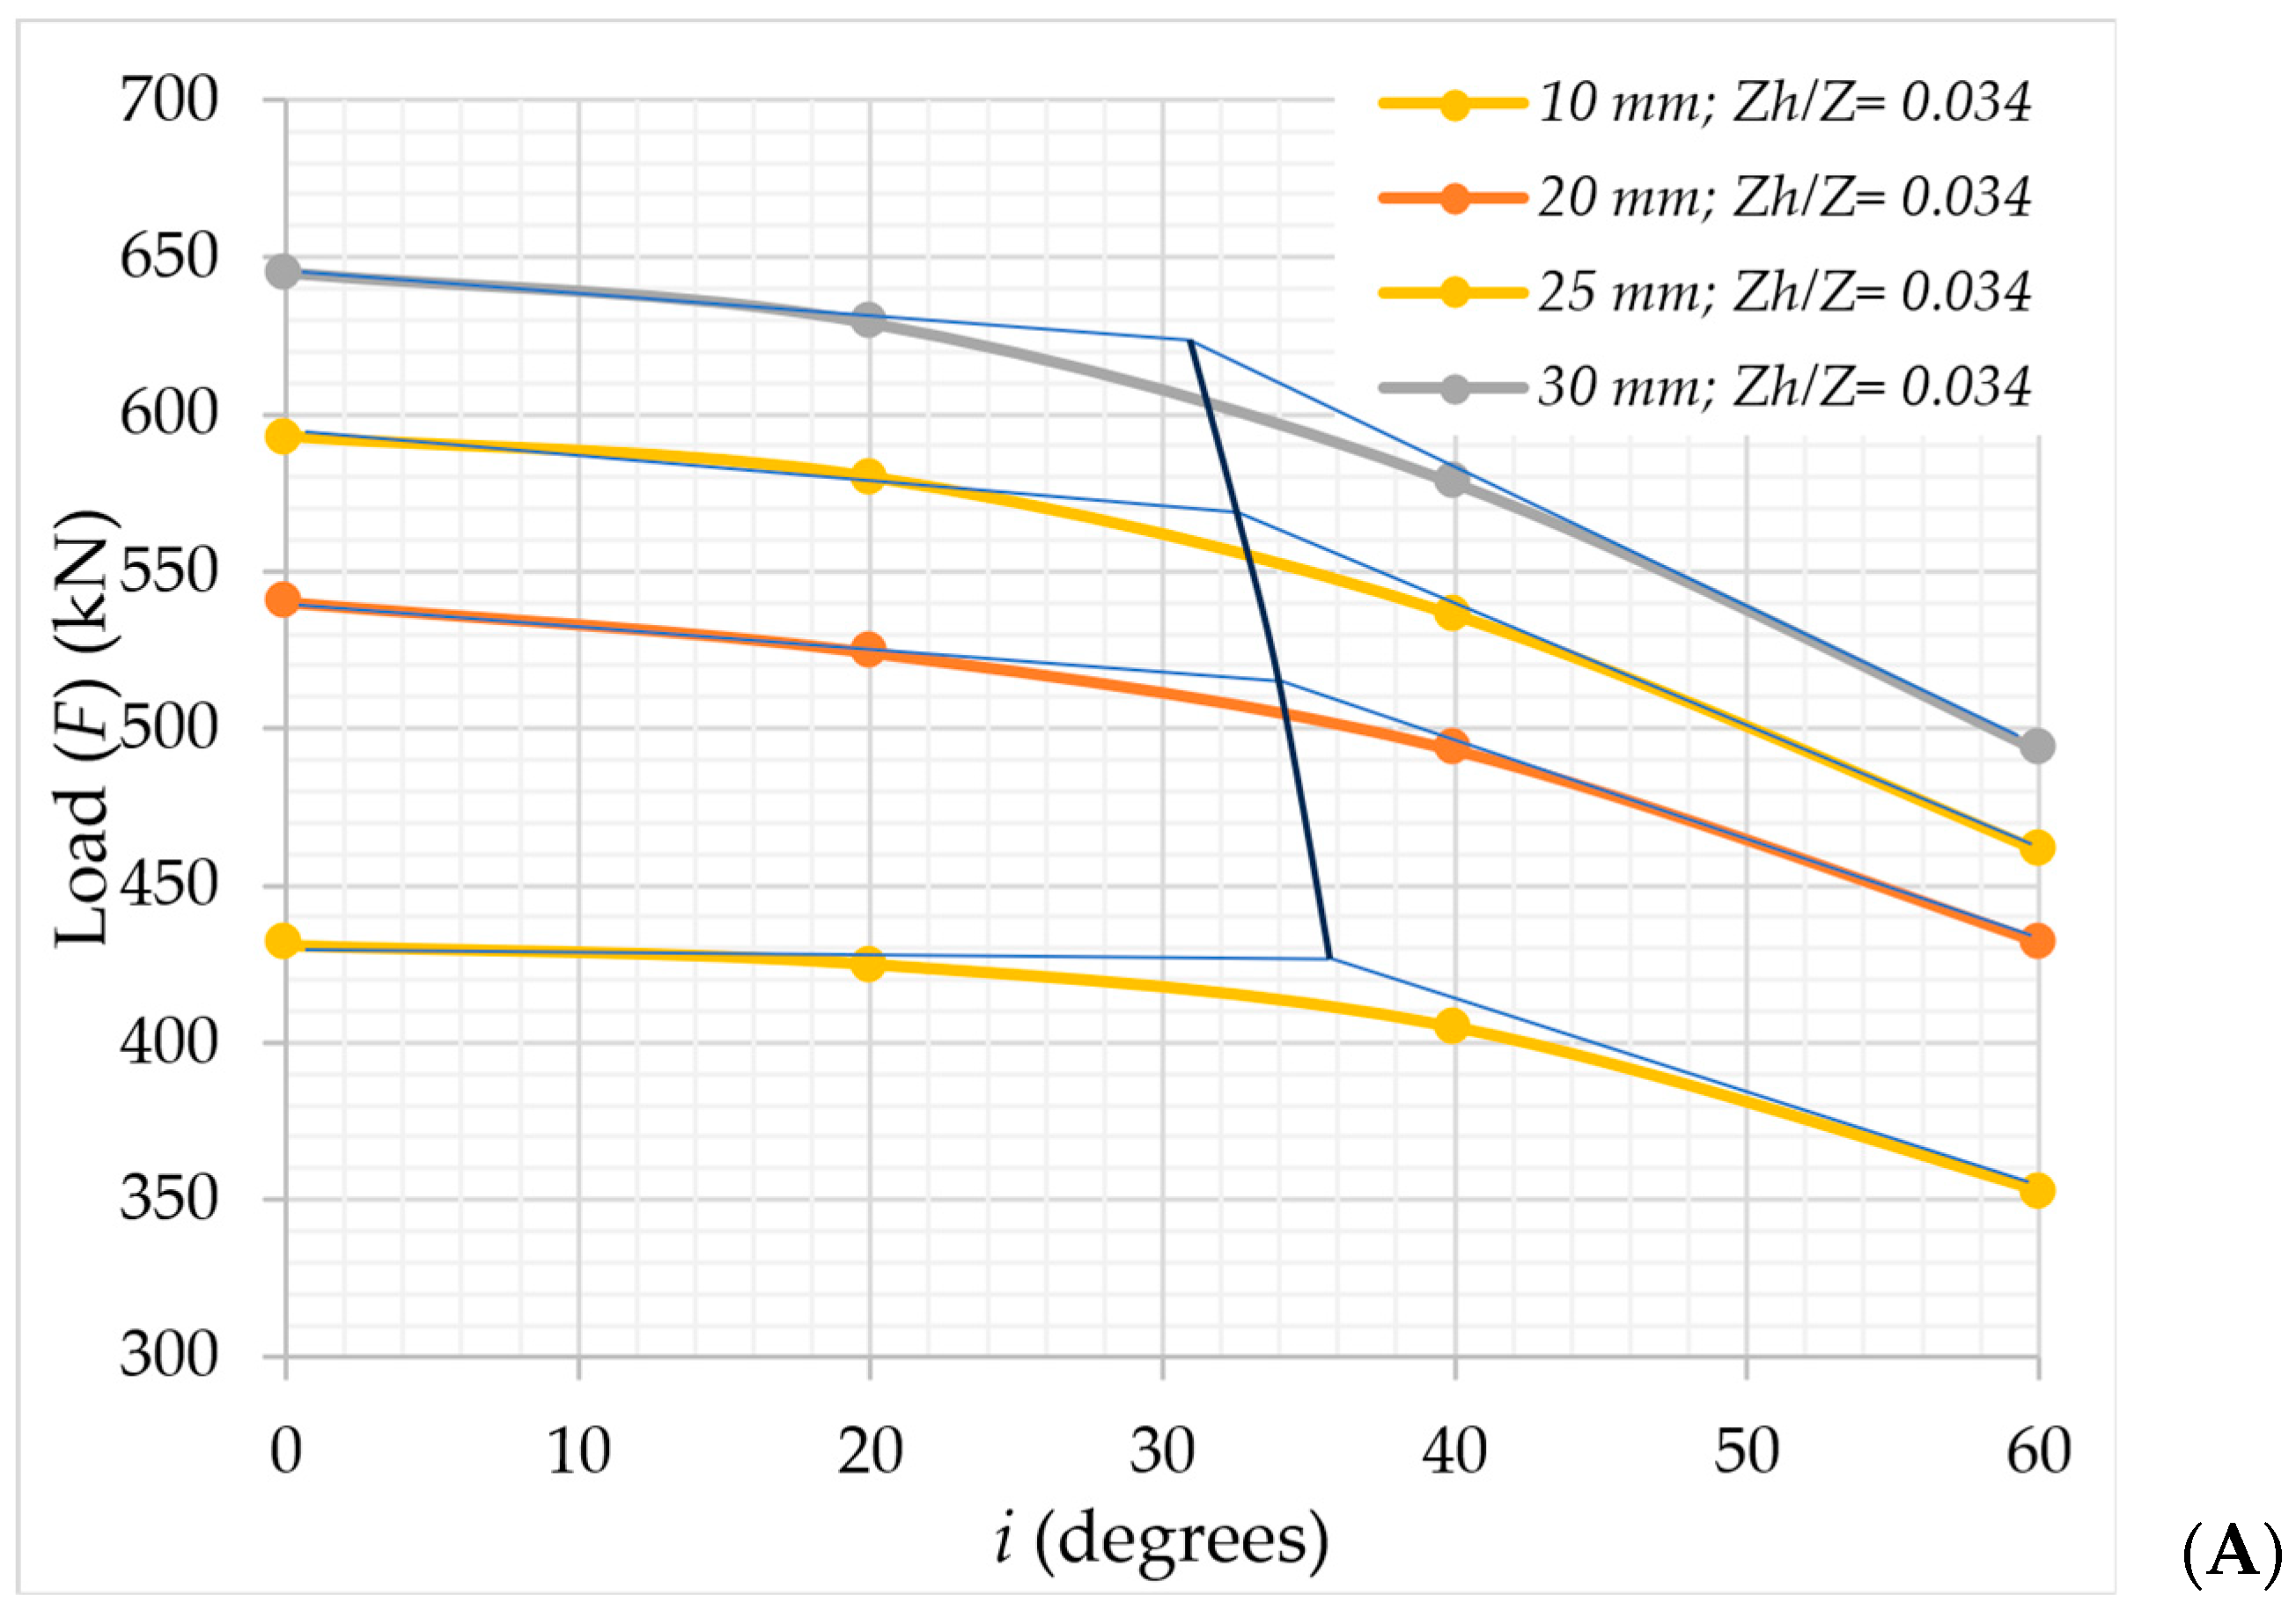
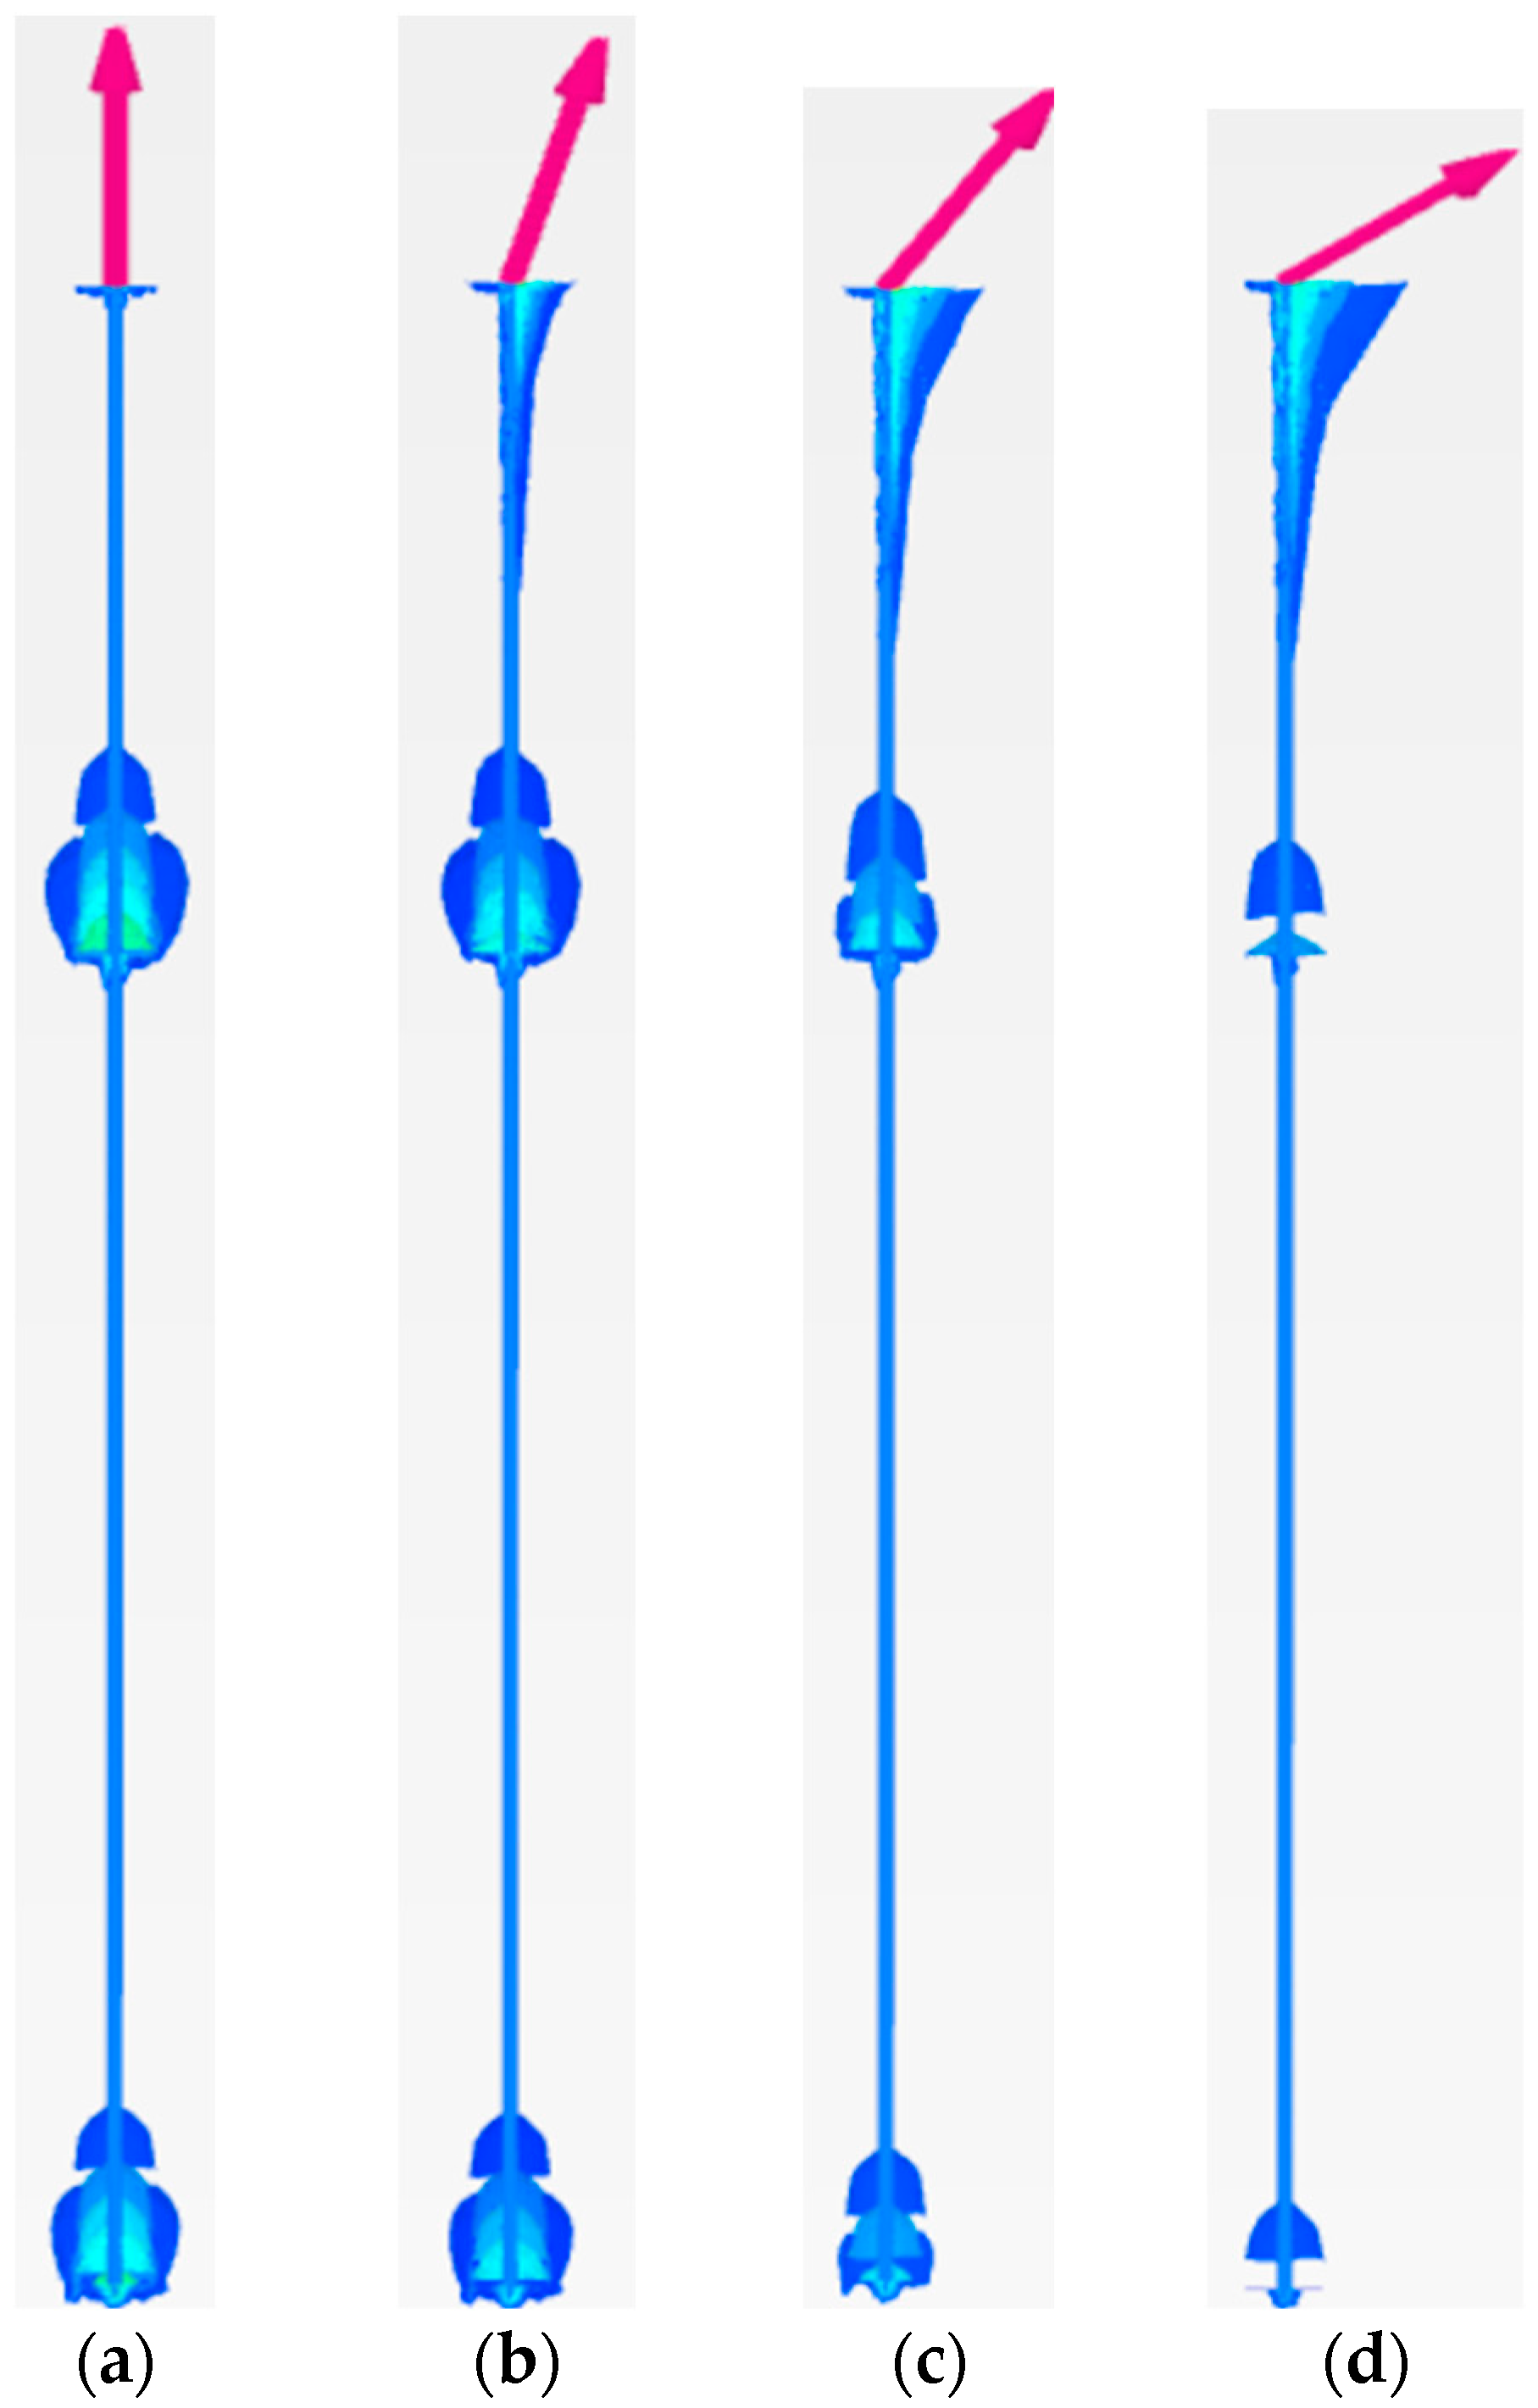
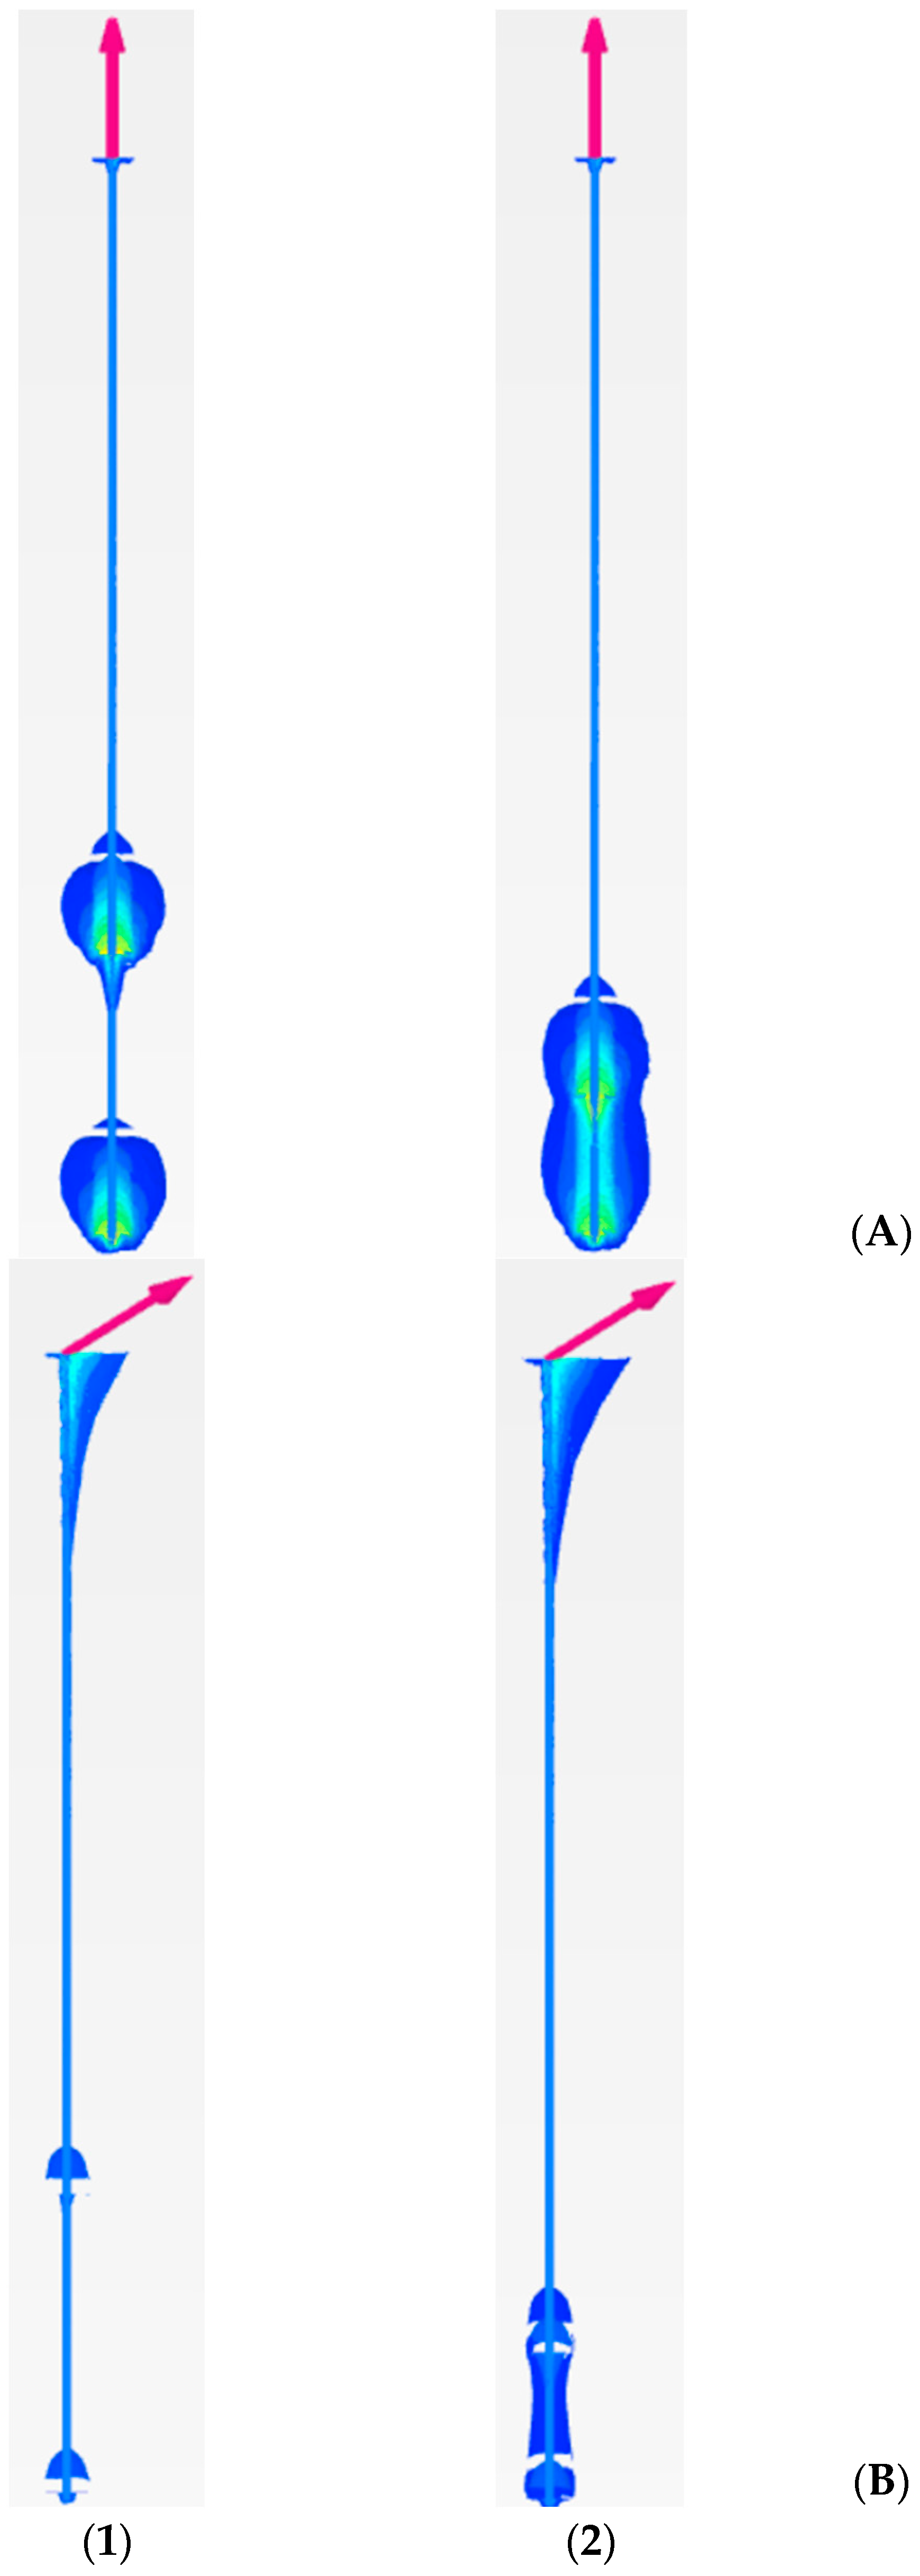
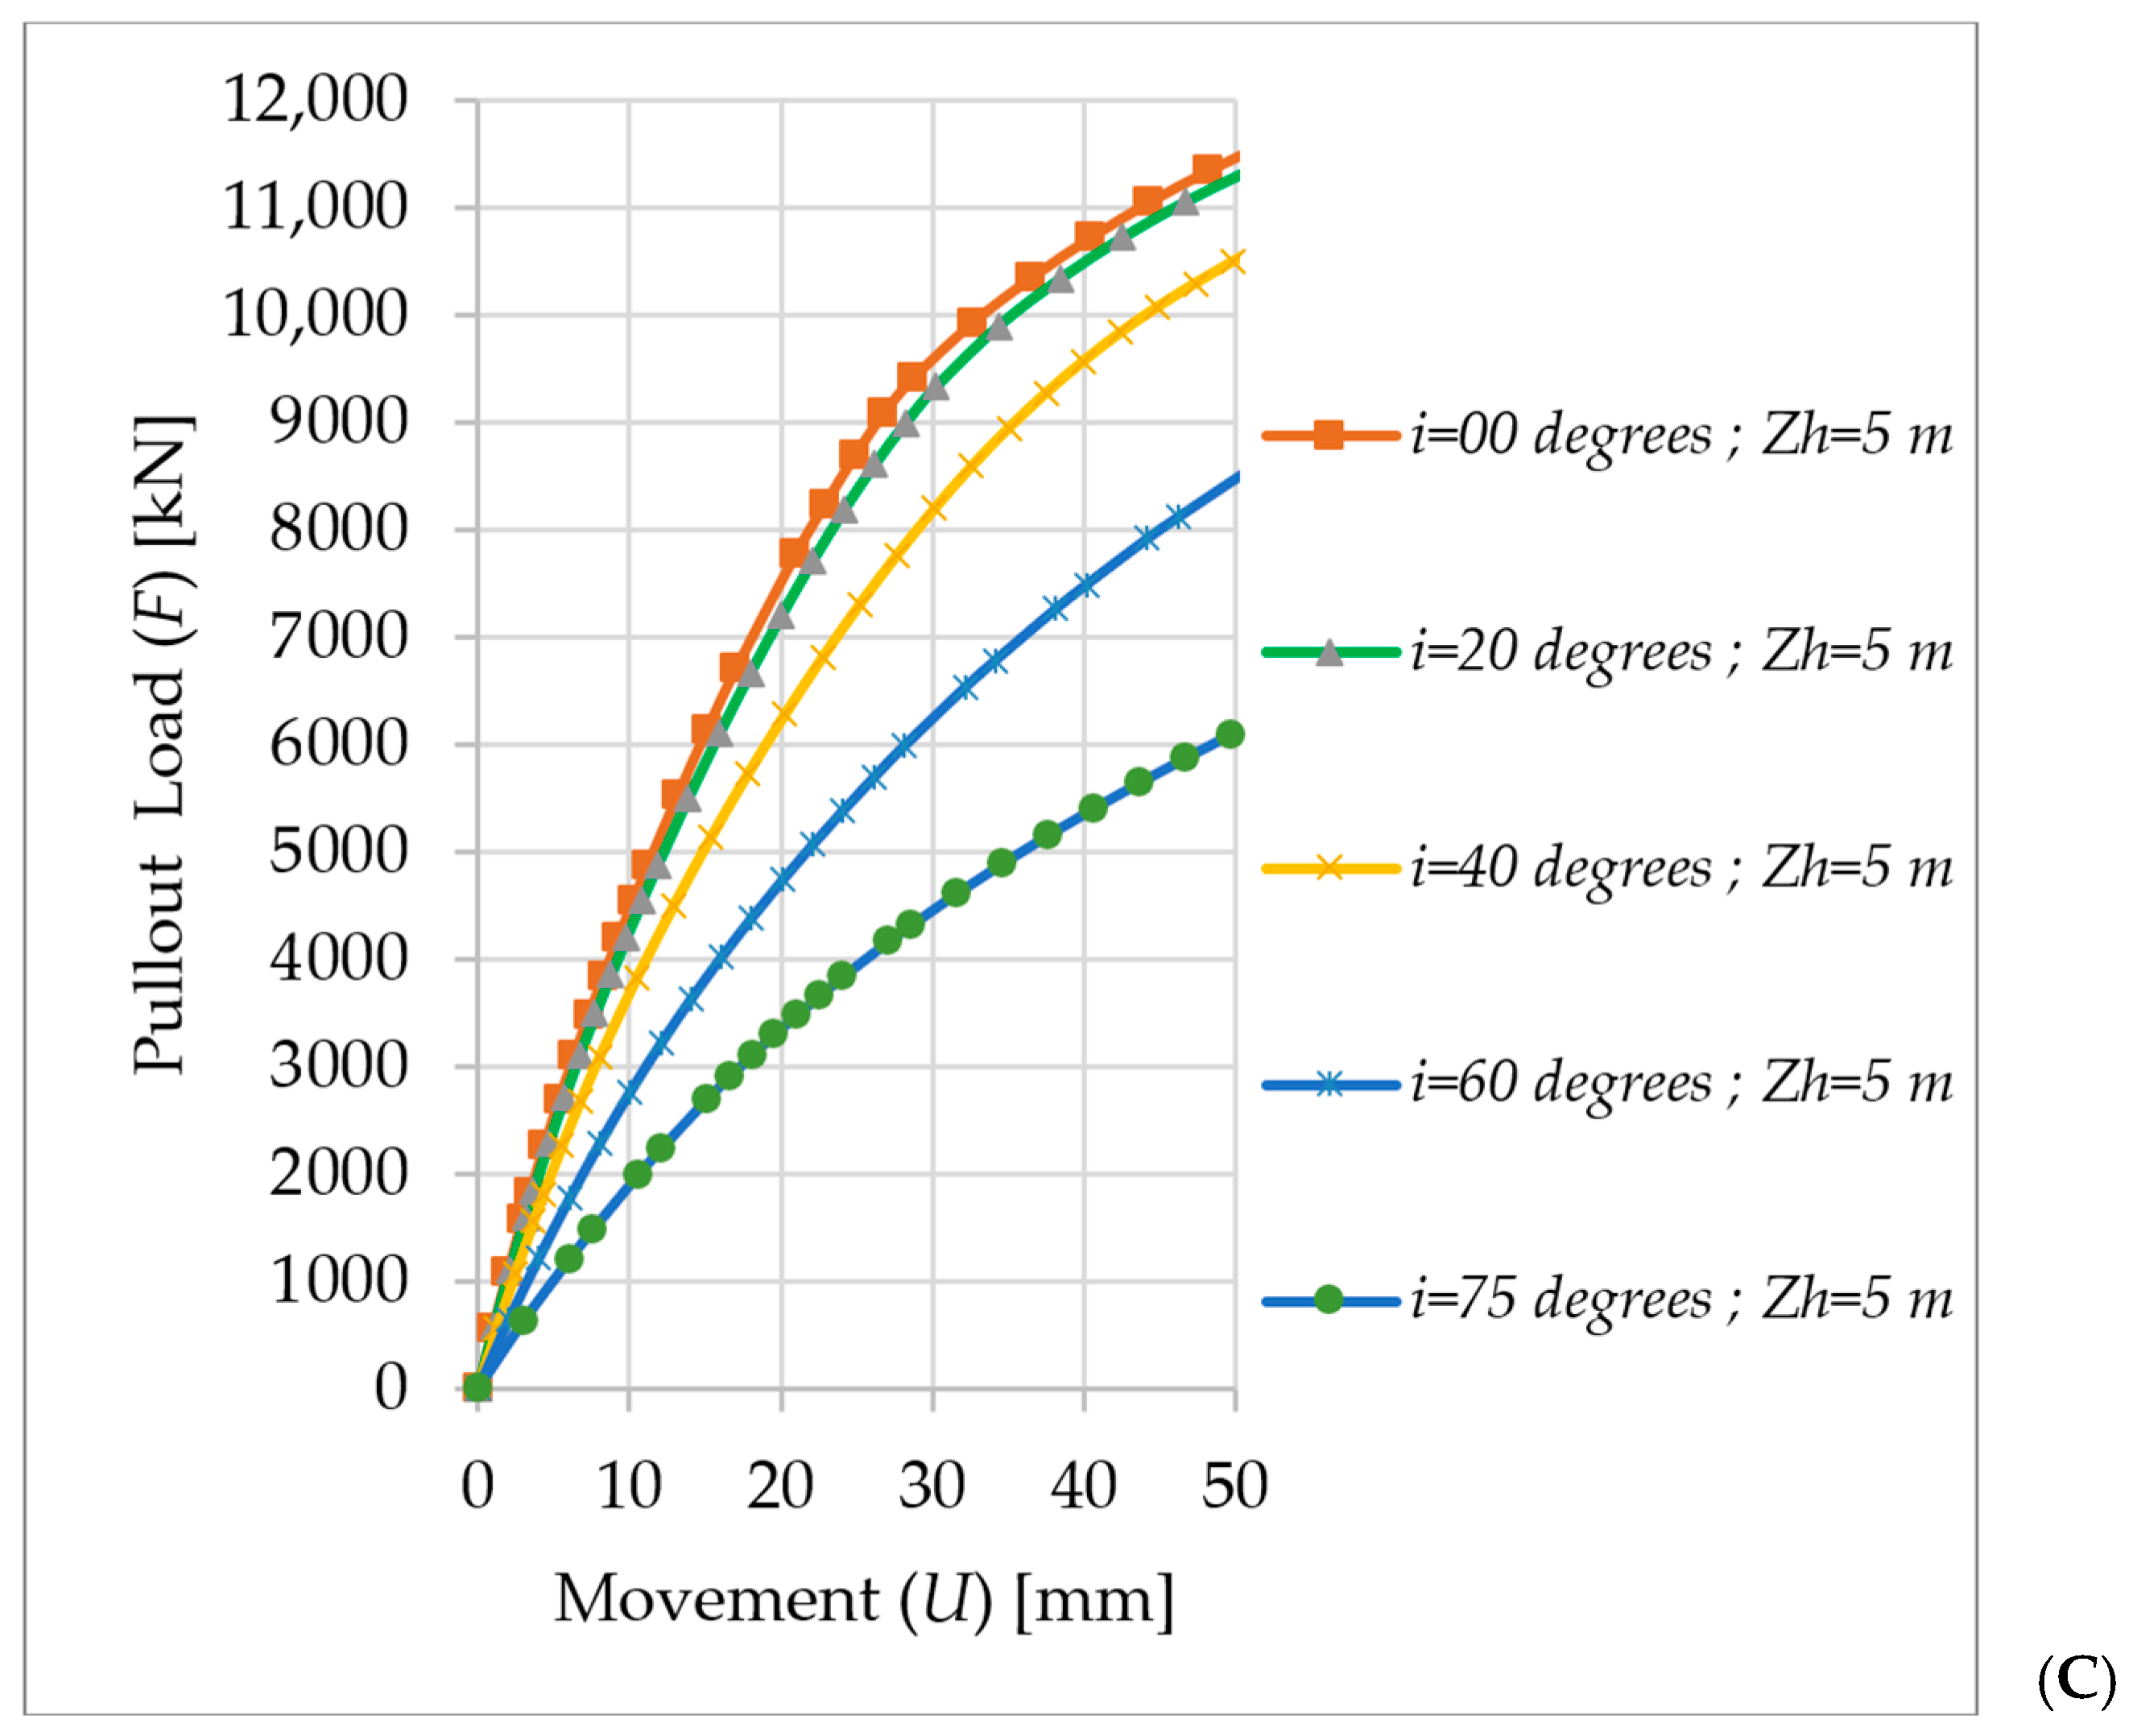
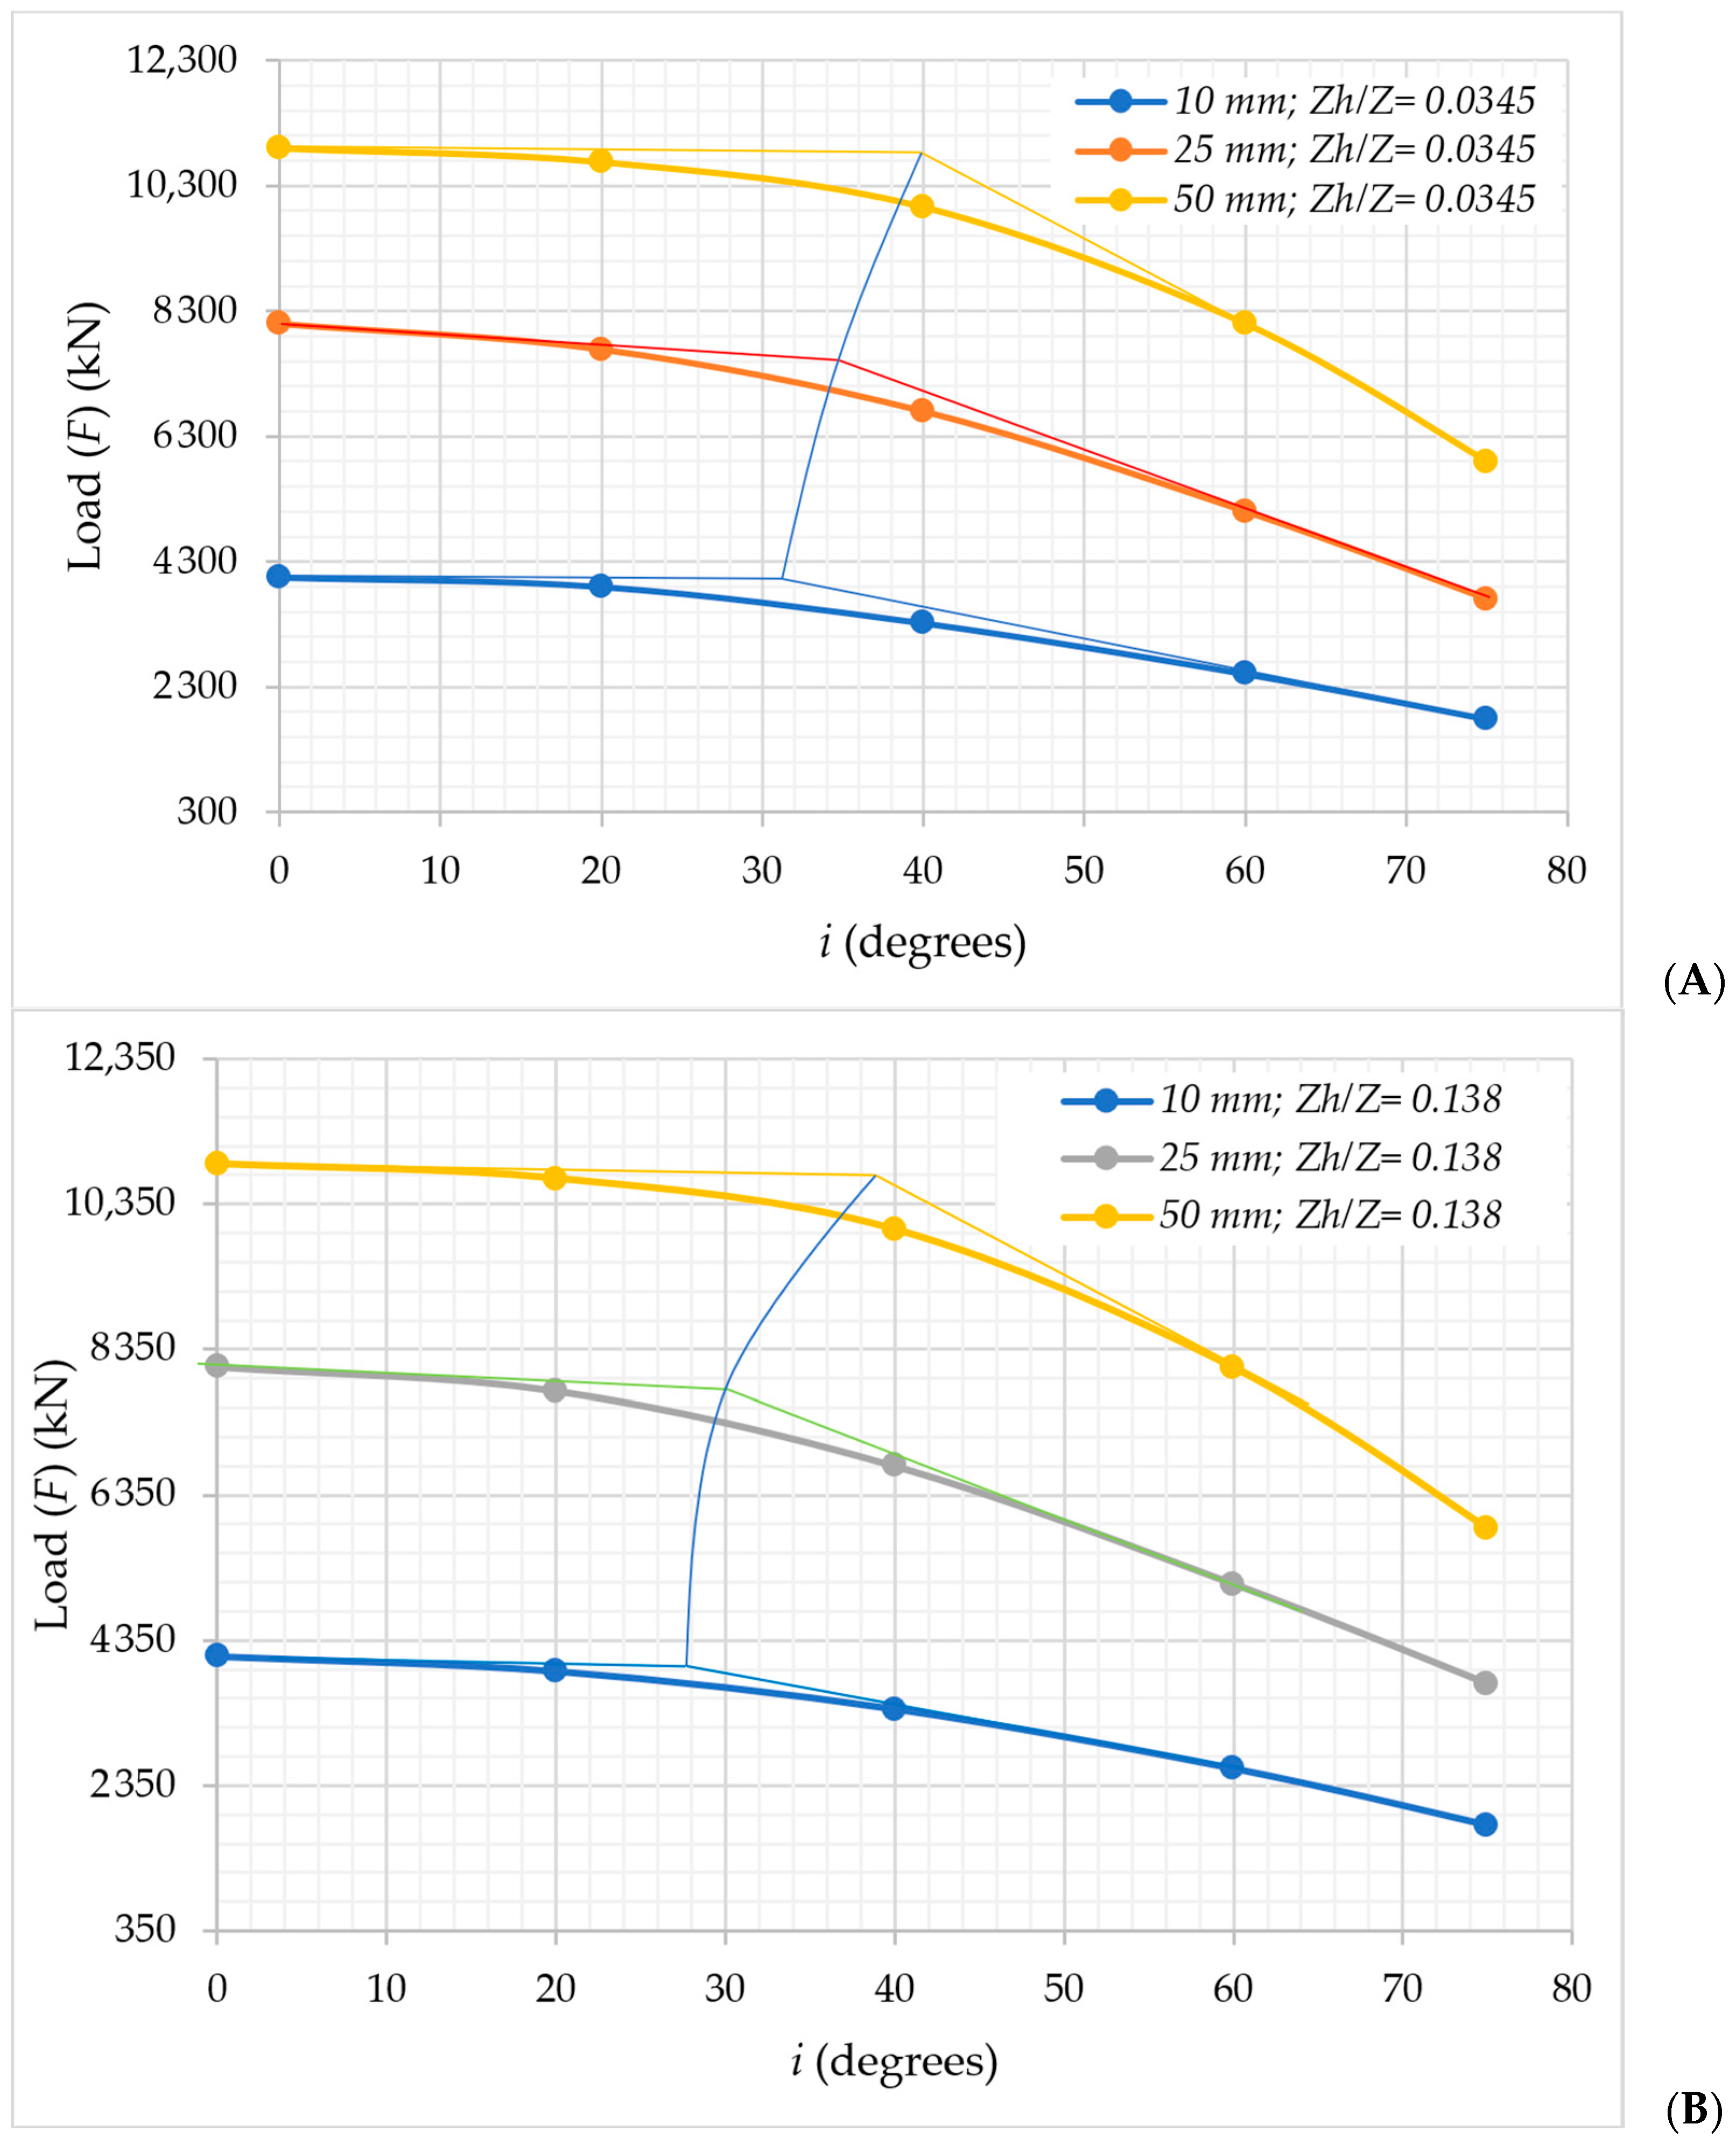
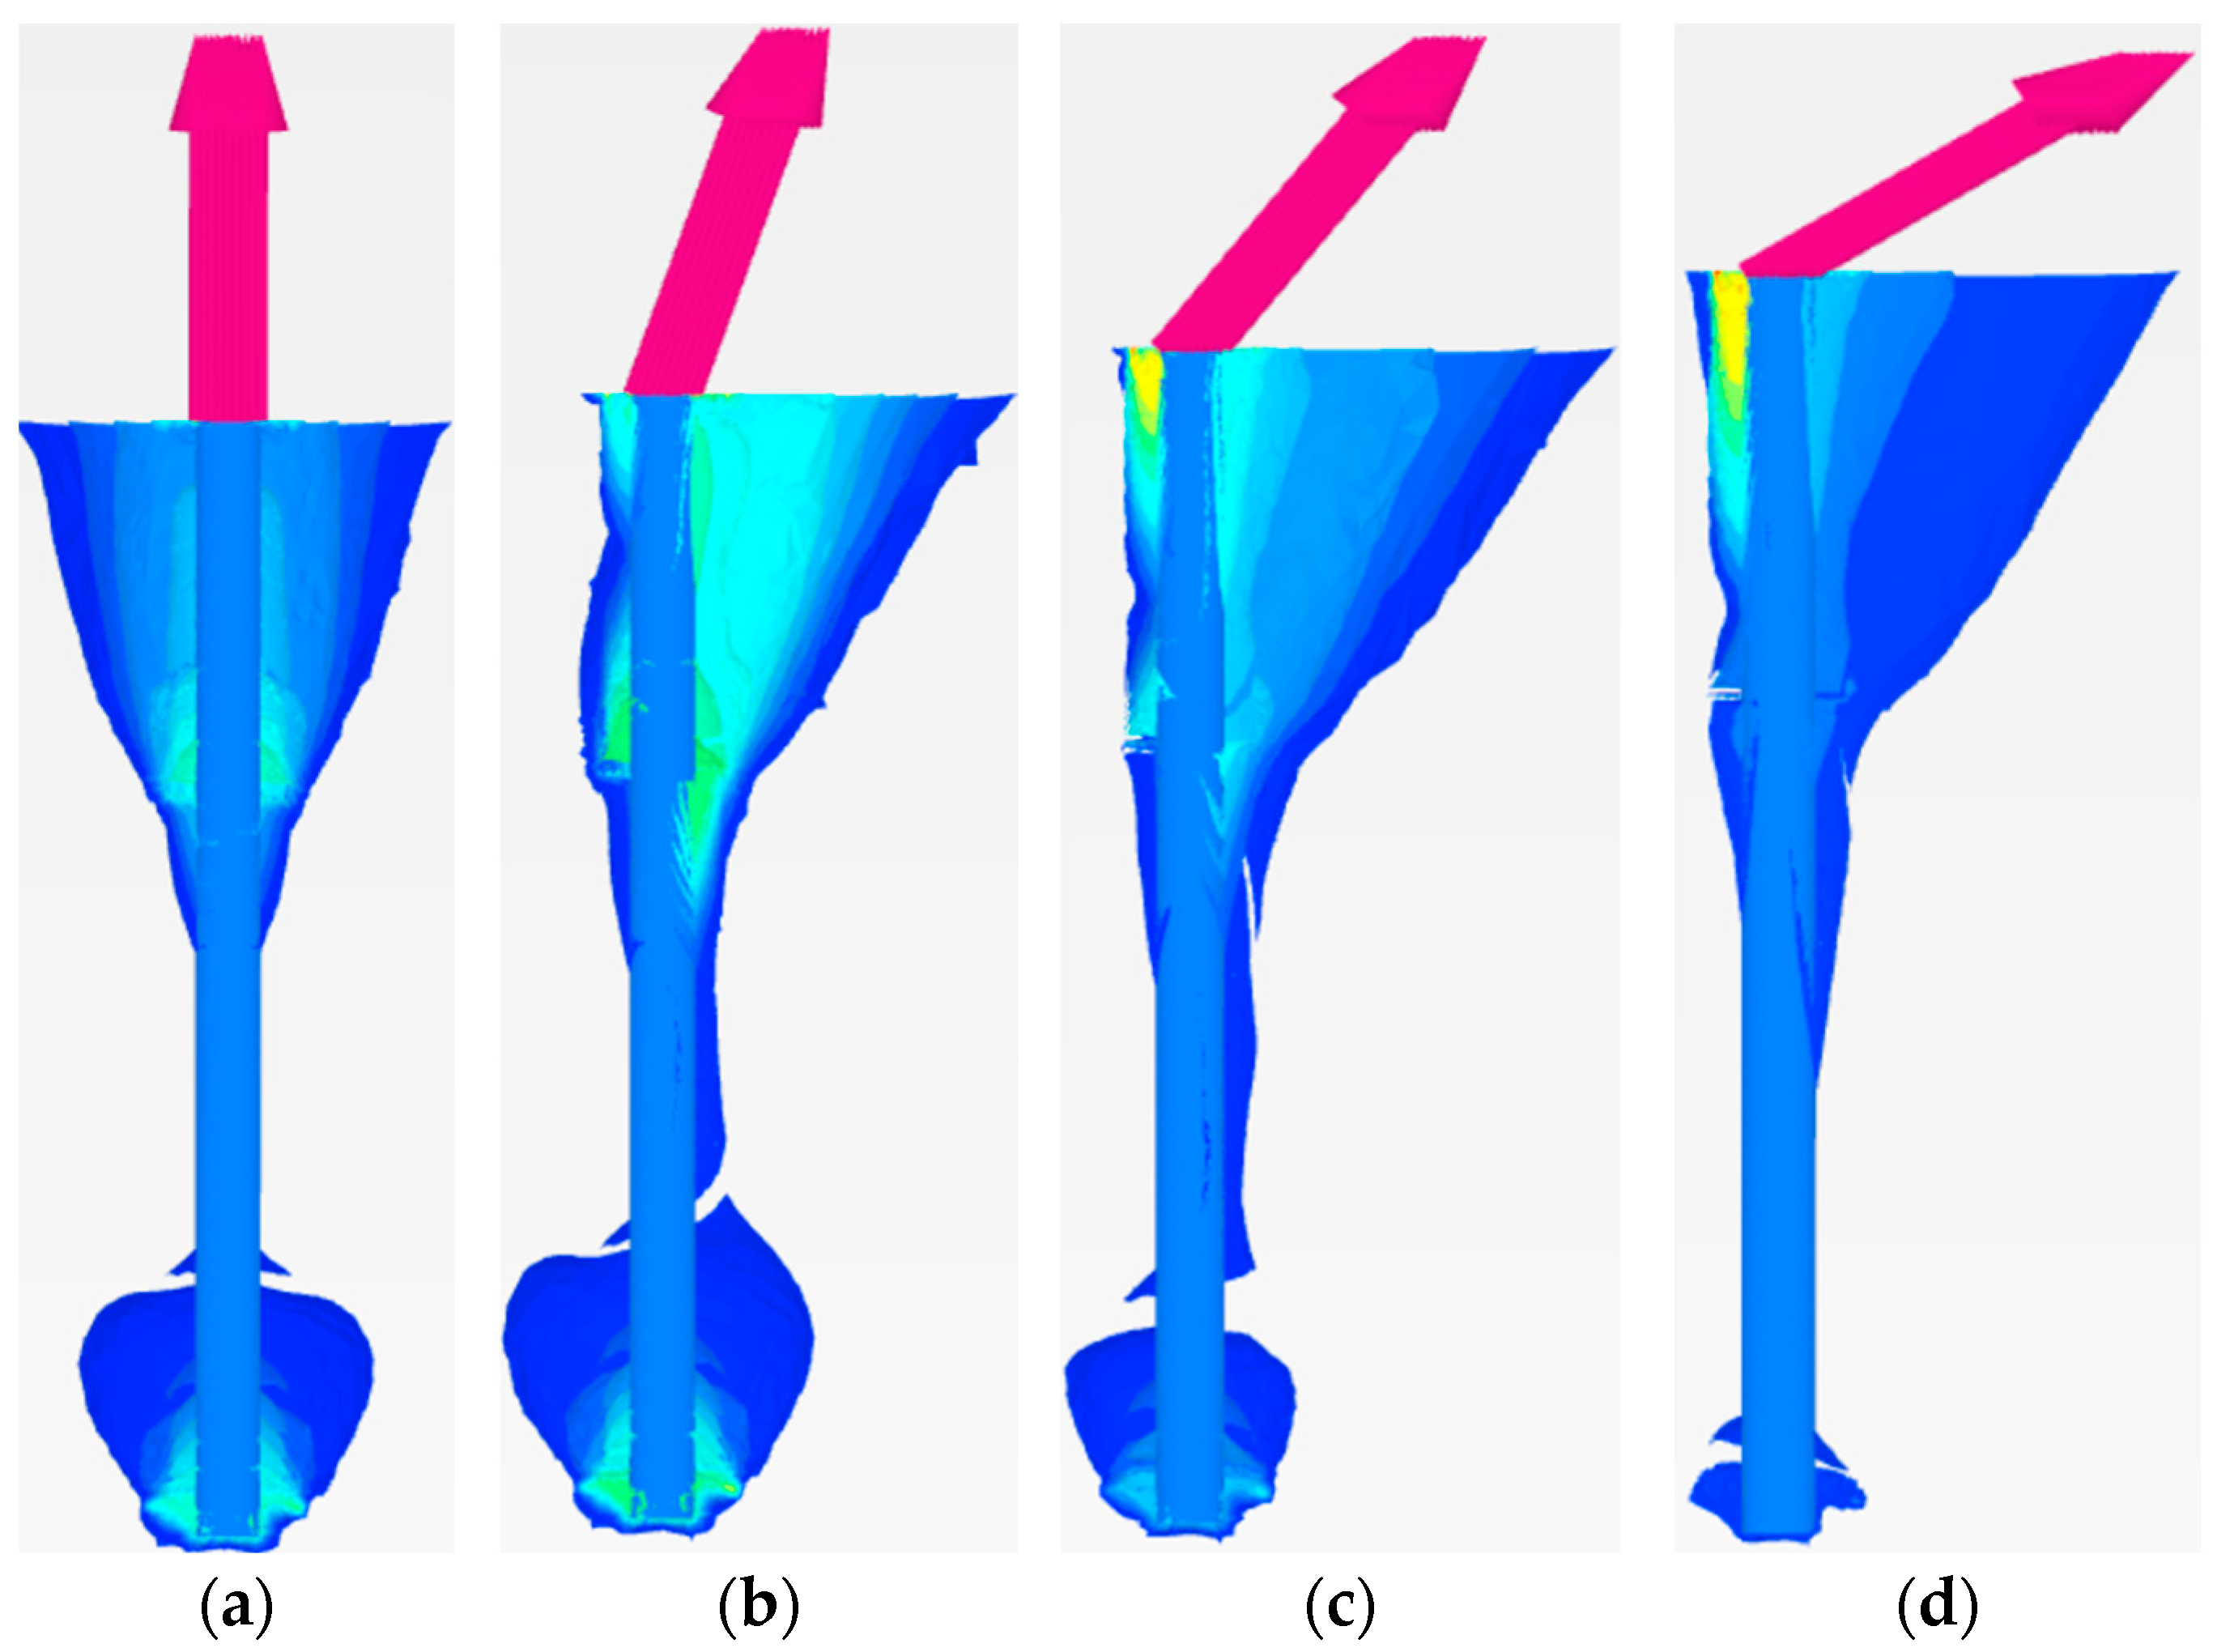
Impact of Load Inclination (i) on Pullout Behavior

Figure 16 presents the load–displacement curves that depict the pullout behavior of different load inclinations (i). These curves offer a visual representation of how the piles react to upward movement and illustrate the variations in pullout loads corresponding to different load inclinations.
The investigation was aimed at assessing how varying the load inclination affects the pullout load required to resist movements of 10, 25, and 50 mm. The findings, illustrated in Figure 16, reveal that increasing the load inclination results in a decrease in the pullout load, irrespective of the helical plate’s position. This suggests that piles subjected to axial forces are more effective in resisting movement. However, it is crucial to note that, beyond a certain angle of load inclination corresponding to the movement value, there was a significant decrease in load capacity. This critical angle diminished as the allowable movement and the ratio of Zh to Z increased. Here, Z represents the distance from the seabed to the helical pile at the toe, which in this study is 14.7 m, as depicted in Figure 17. Table 8 presents, based on movement and the Zh/Z ratio, the critical inclination angles that were present after a substantial decrease in load capacity occurred. Helical piles are particularly useful for tension leg mooring line types, but they can also benefit taut (or semi-taut) mooring line types since their bearing capacity can be optimized at specific inclination degrees. Helical piles are especially advantageous for mooring line types with tension legs, but because their bearing capacity may be optimized at particular inclination degrees, they can also be advantageous for taut or semi-taut mooring line types.
Figure 18 displays the iso-surface displacements along the helical piles. The decrease in capacity with increasing load inclination was due to two primary reasons: (1) the effectiveness of the bottom helical plate decreased as the inclination angle increased, and (2) the helical plates were not designed to resist lateral loads effectively, especially given the relatively small diameter of the helical shaft. As a result, the passive load was insufficient to significantly enhance the pile’s capacity. Figure 17 illustrates that the effectiveness of the helical plates diminished as the load inclination angle increased.
Based on these findings, it is advisable to limit the inclination angle of the mooring line attached to the small-diameter helical pile to the values shown in Table 8. This restriction ensures sufficient load-bearing capacity and stability for the piles. Adhering to this inclination threshold optimizes the balance between frictional resistance, contact area, and pullout load, thereby enhancing the overall performance and reliability of the pile foundation system.

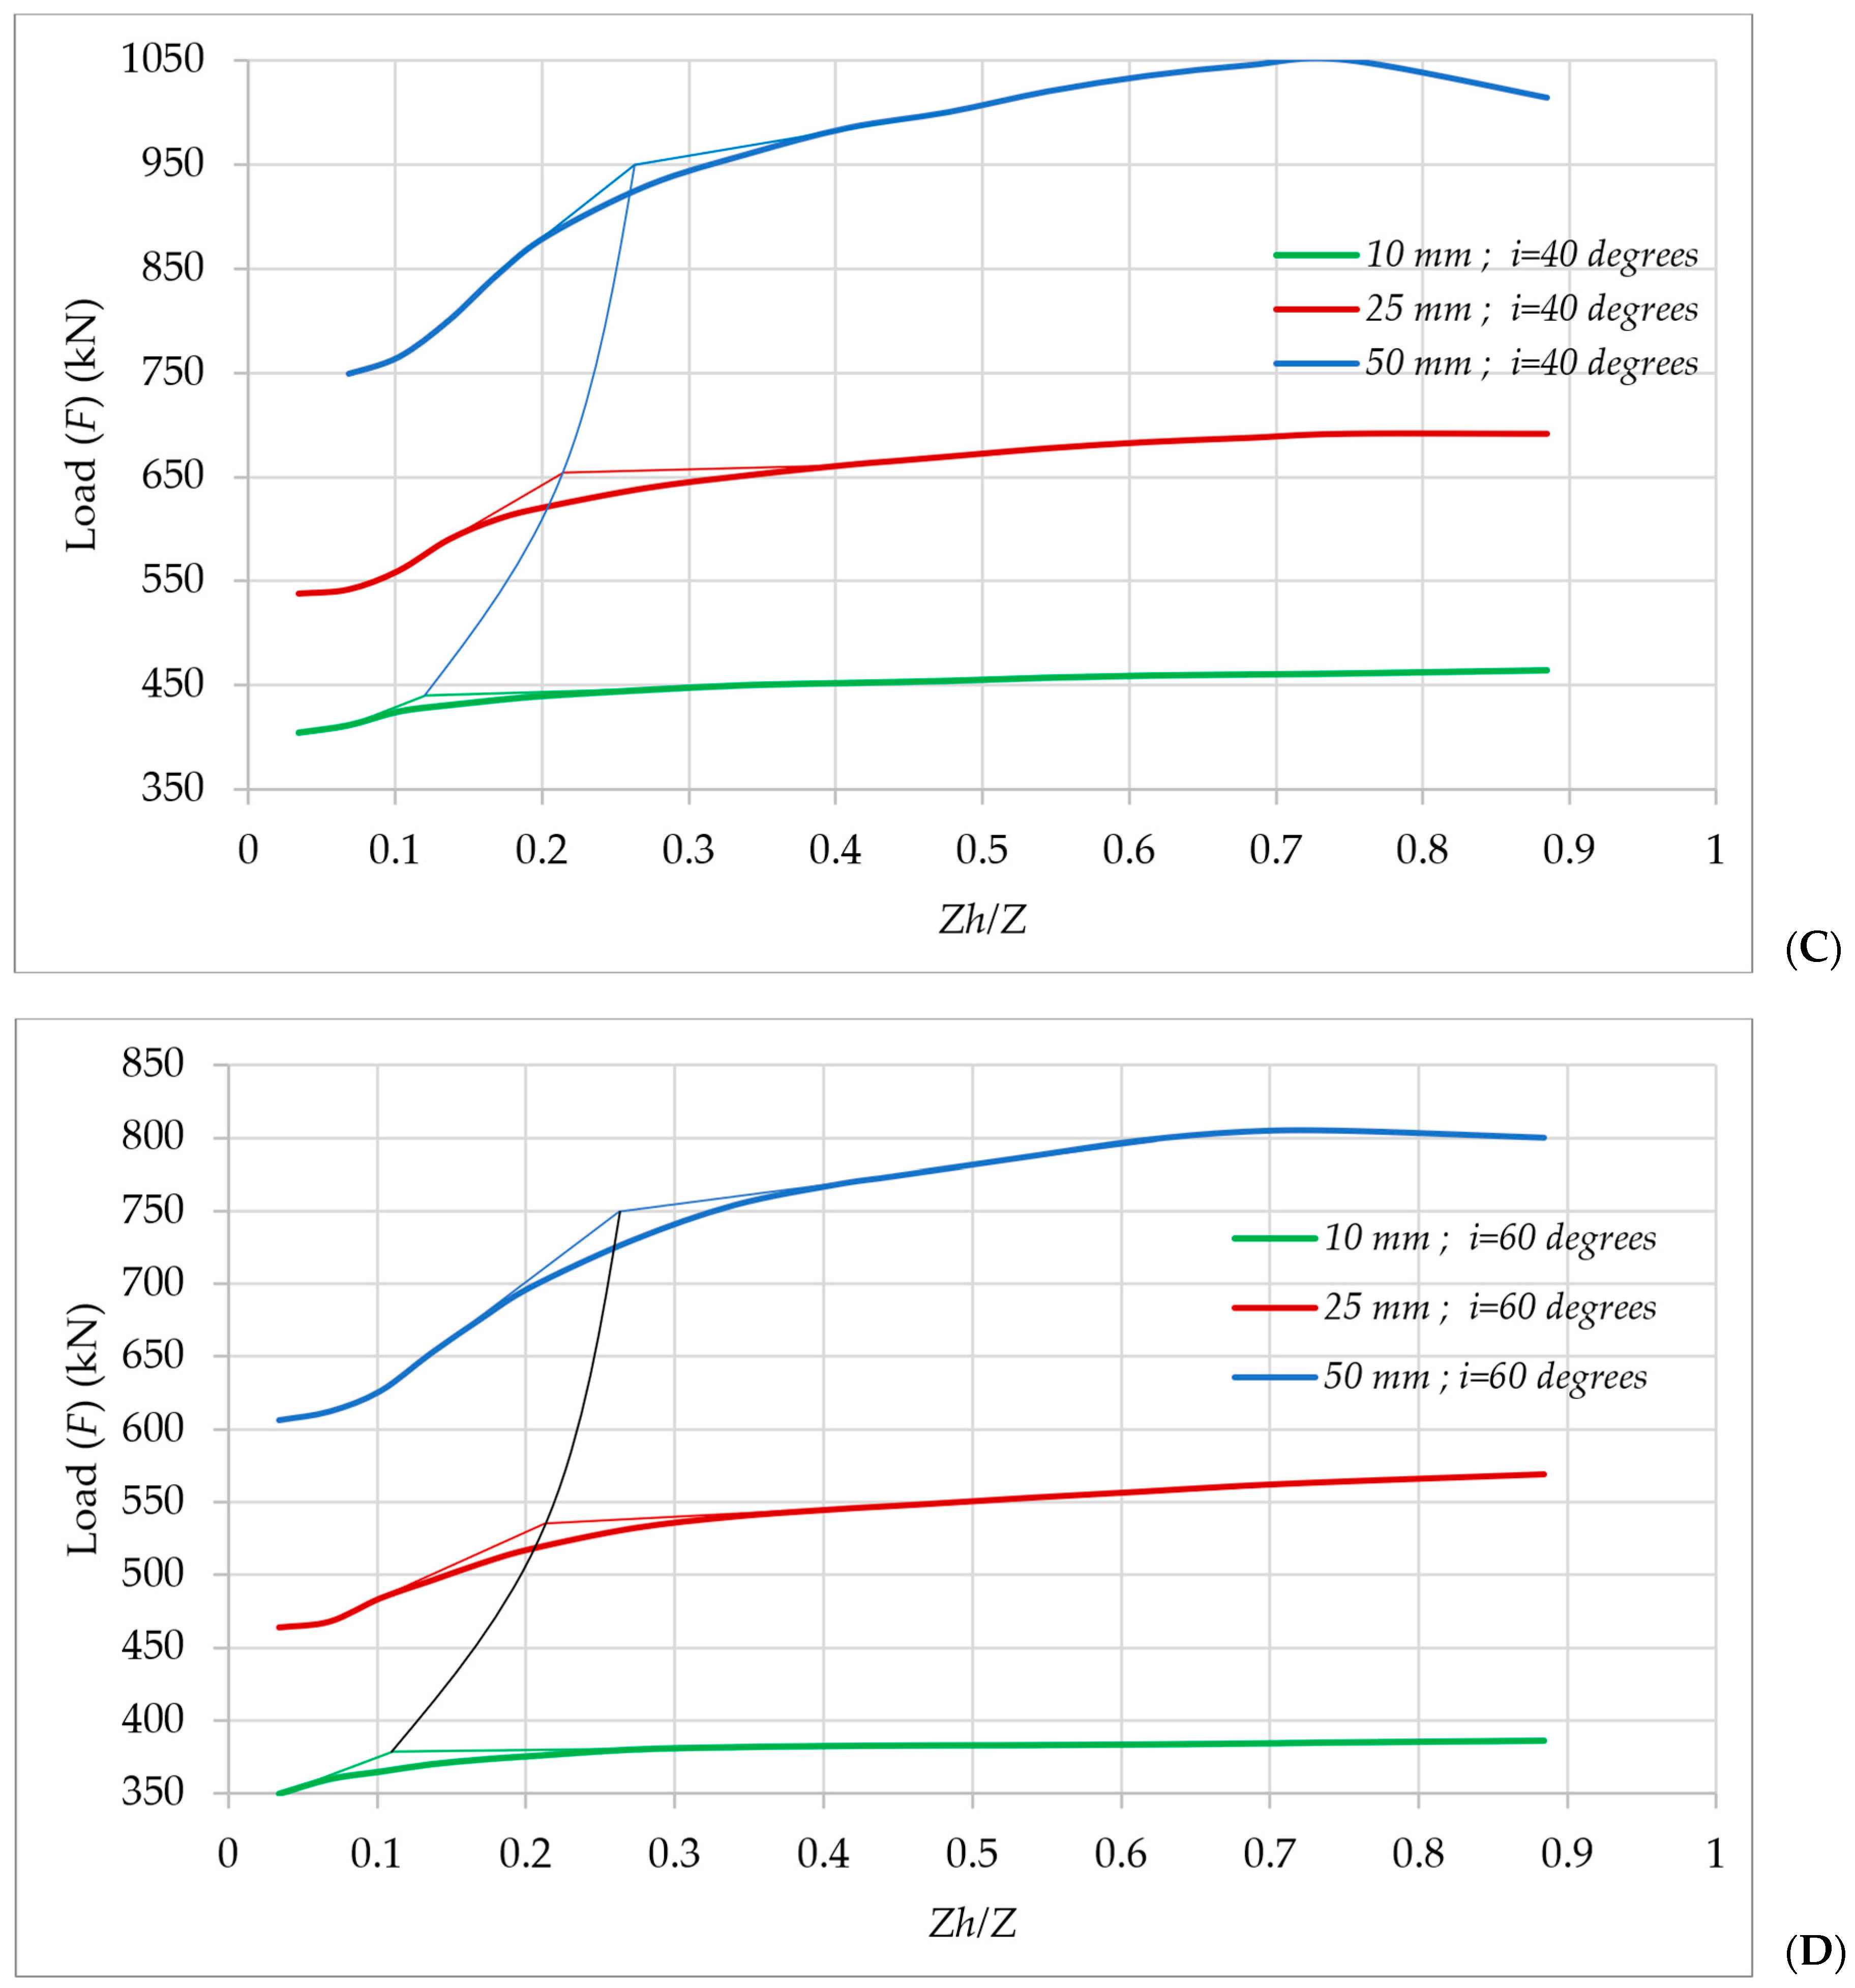
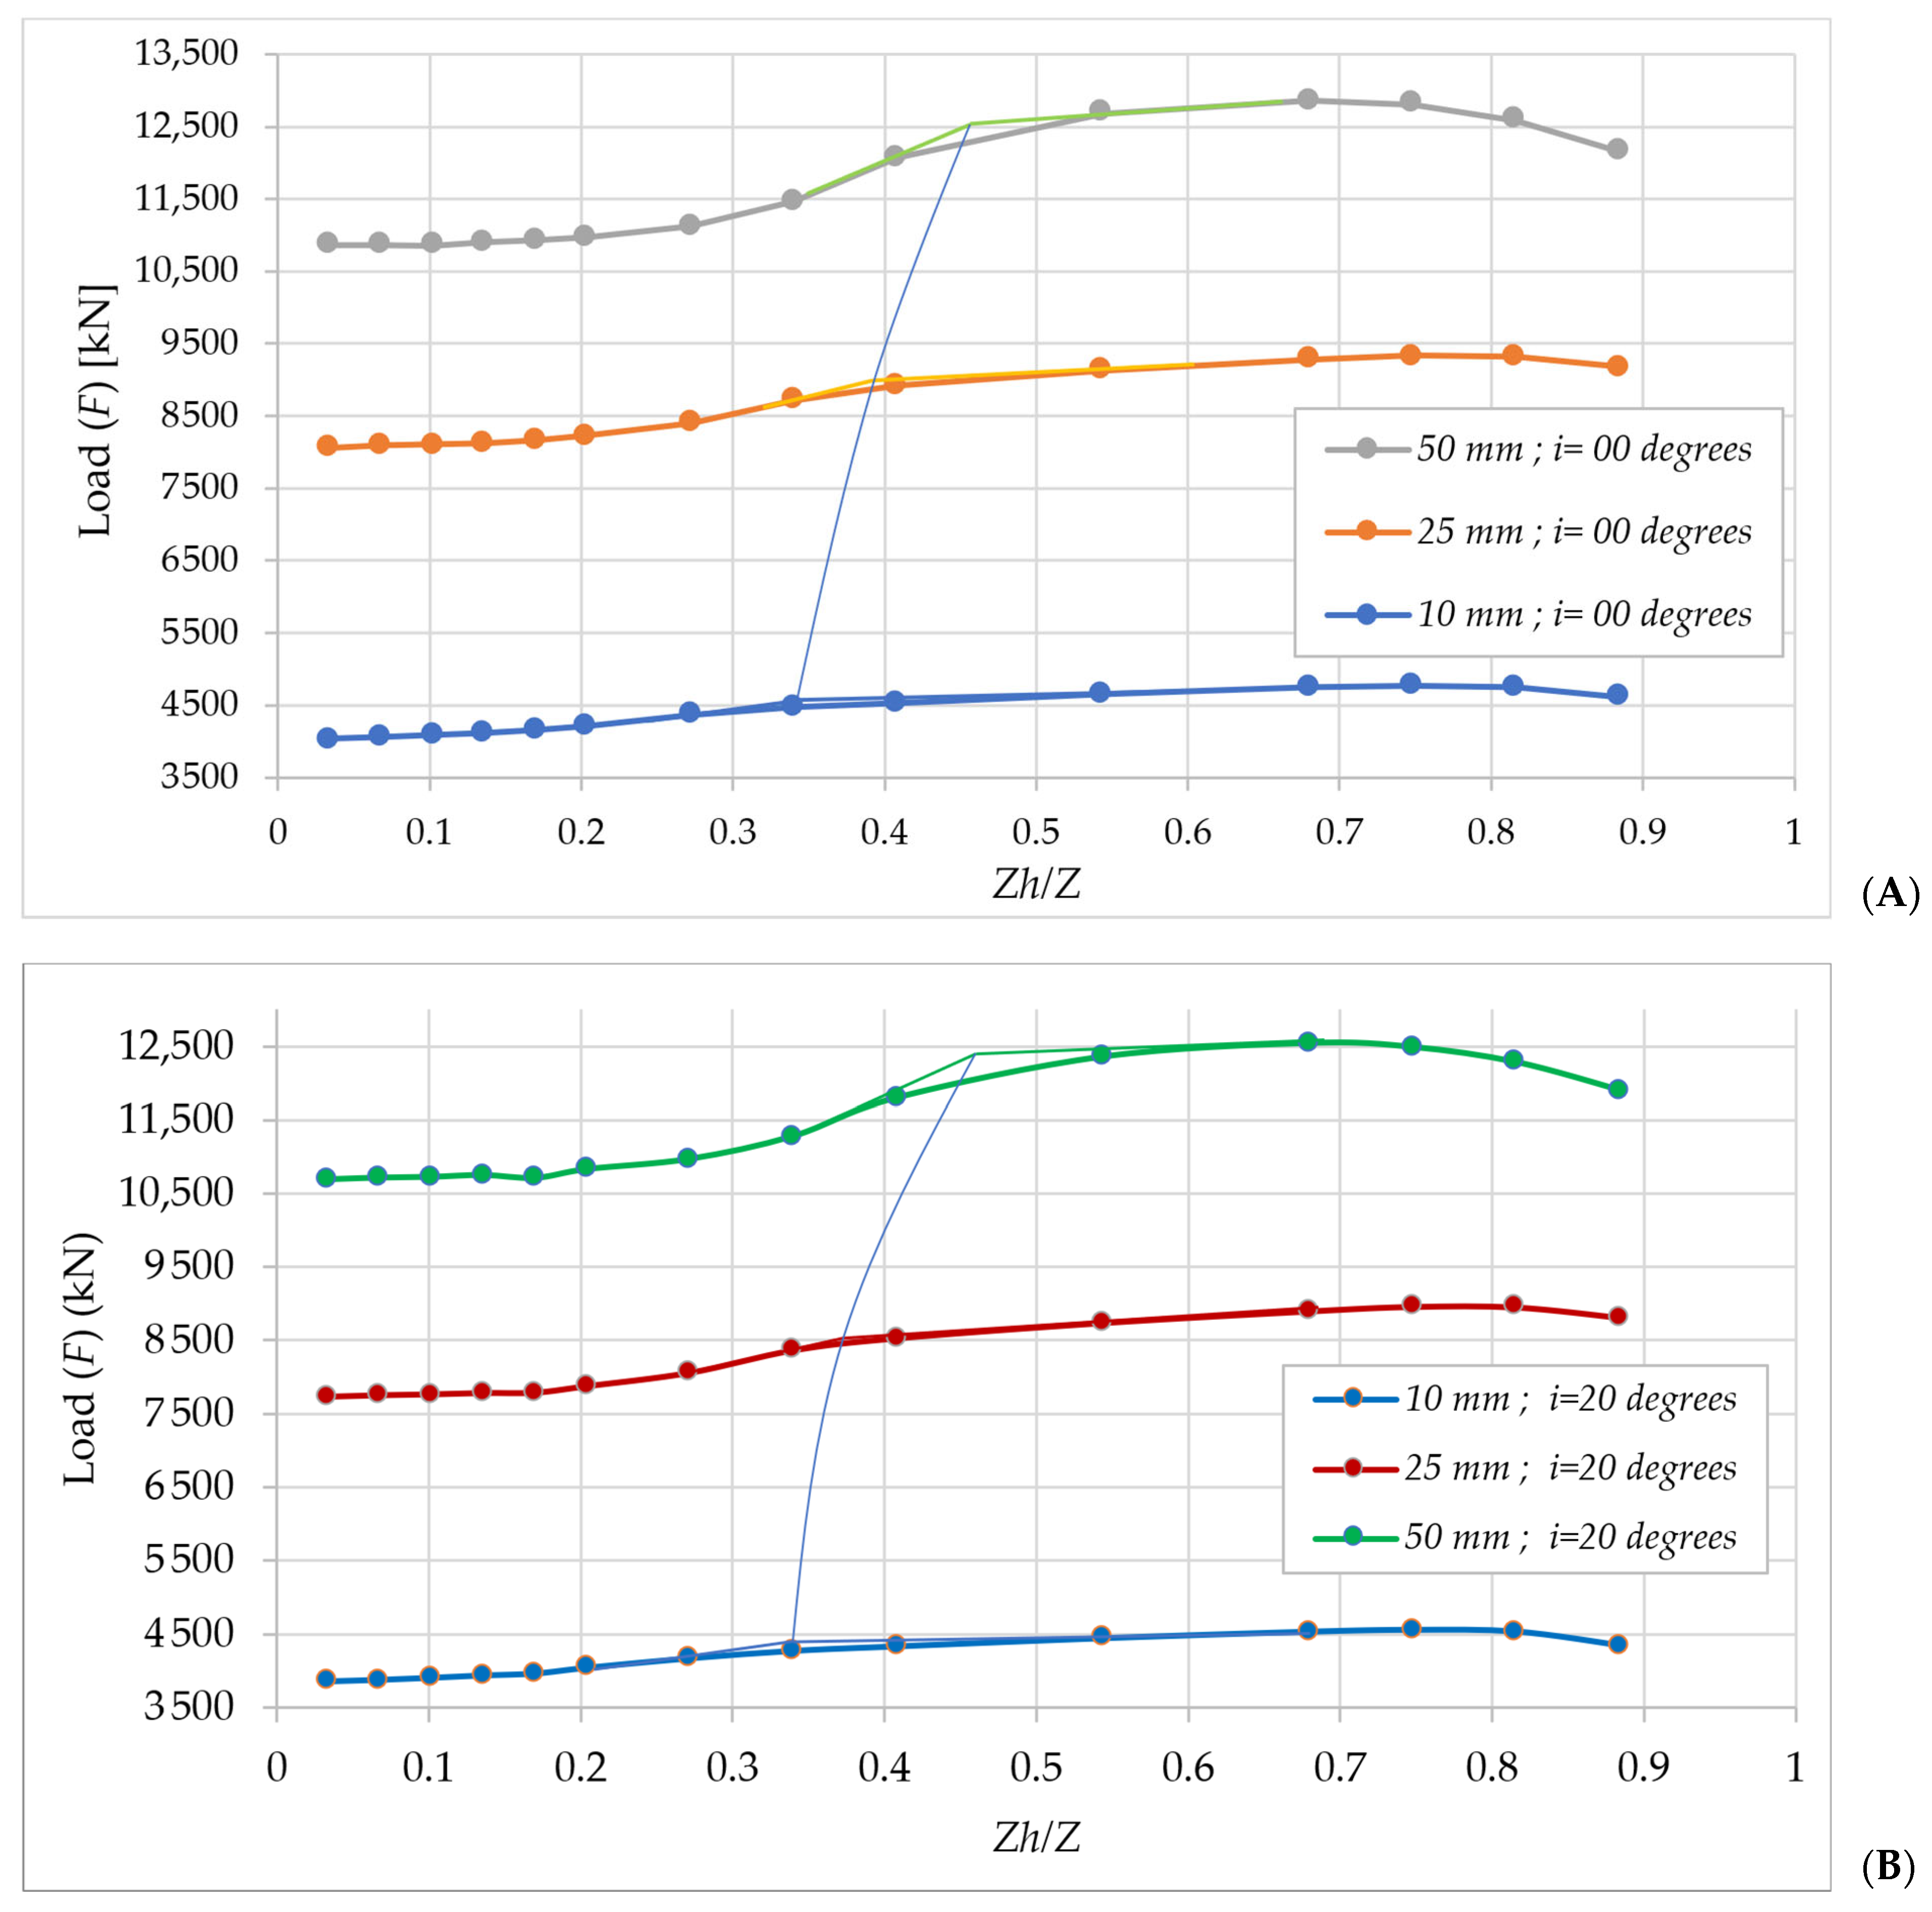
Impact of Top Helical Plate Location (Zh) on the Pullout Load (F) Behavior

The investigation in this section is aimed at assessing the impact of the top helical plate’s position (Zh) on its capacity to withstand pullout loads and resist movement. A detailed examination of the recorded loads is presented in Table 9, while Figure 19 visually illustrates the load behavior across various helical plate locations (Zh). This offers valuable insights into their response under pullout loading conditions and underscores the variations in load resistance linked to different load inclination angles.
The results from Table 9 suggest that increasing Zh enhances the load resistance capabilities irrespective of the load inclination, thus indicating that a deeper top helical plate is more effective in withstanding pullout loads and resisting movement. However, it was observed that the load capacity sharply increased up to a specific Zh/Z ratio, beyond which the rate of increase diminished or became more horizontal, as depicted in Figure 20. It is important to note that, after reaching a Zh/Z ratio of 0.75, there was a decrease in the load capacity, particularly noticeable for high movements, as illustrated in Figure 20. This phenomenon occurred because the helical plates came too close to one another, resulting in stress interactions that lead to a reduction in load capacity, as shown in Figure 21.
Table 10 displays the optimal Zh/Z ratios, which should surpass 0.12 for movements of 10 mm, 0.22 for movements of 25 mm, and 0.26 for movements of 50 mm.

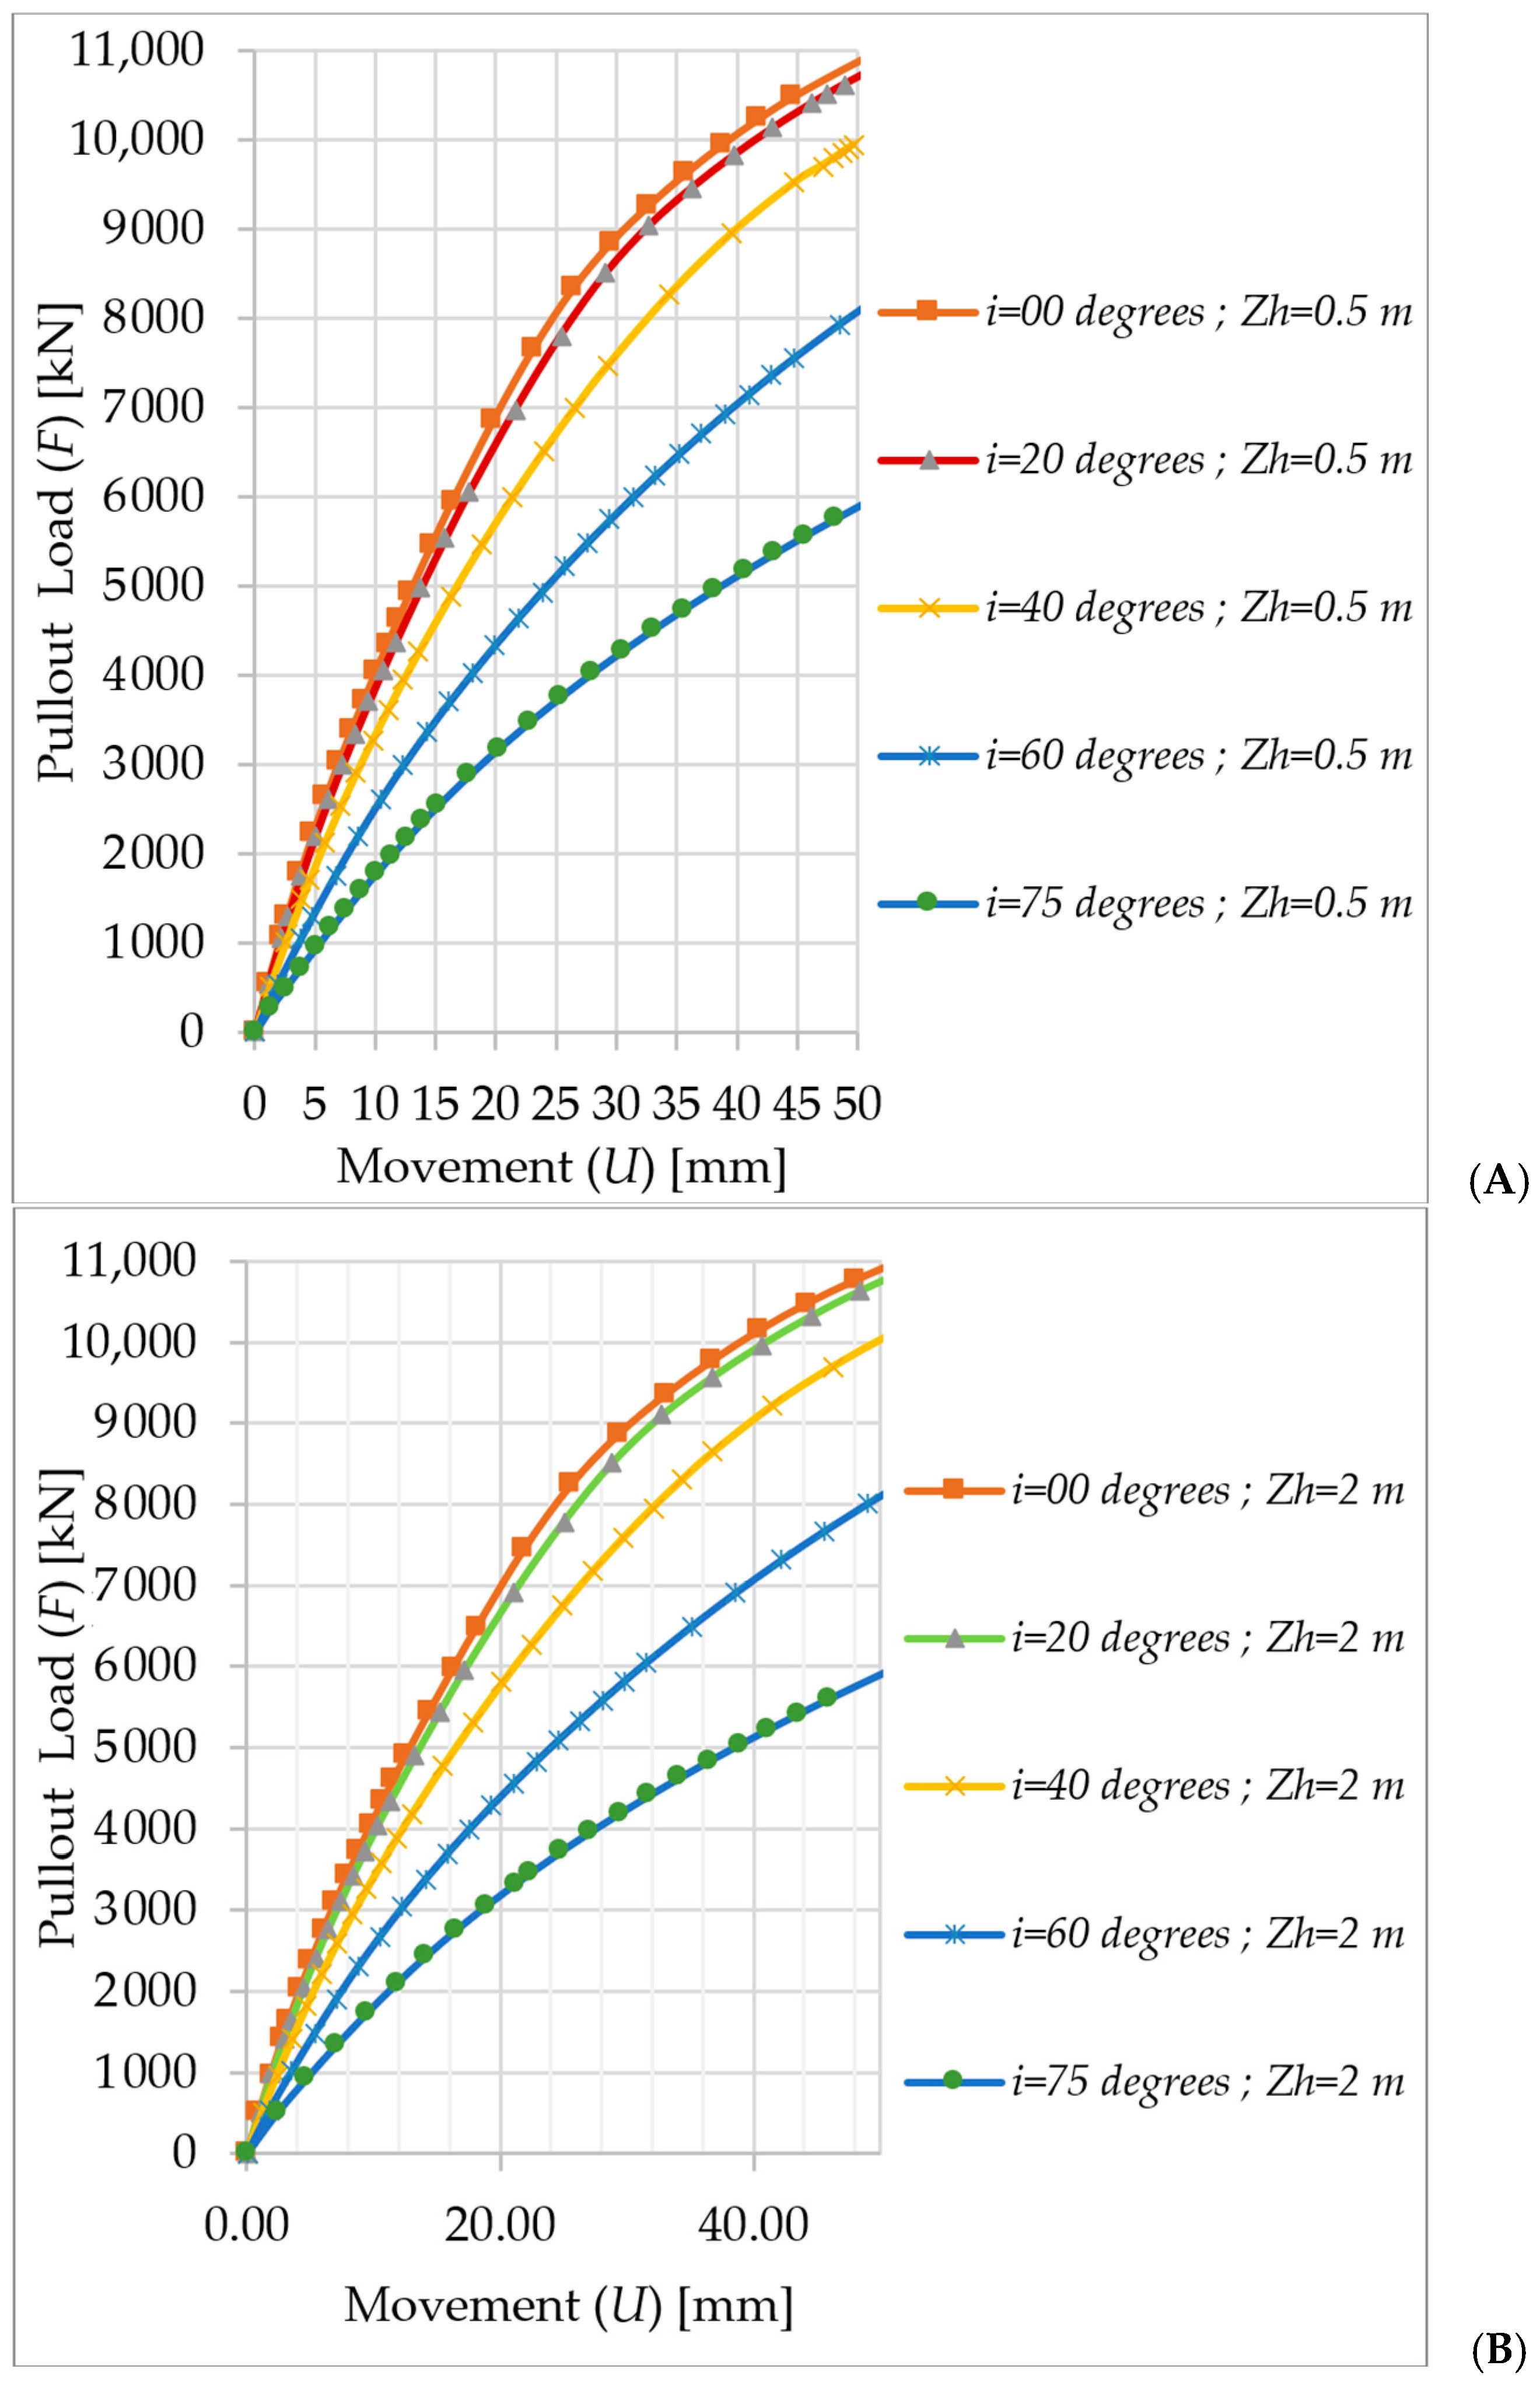
4.5.2. Large-Shaft-Diameter Helical Piles

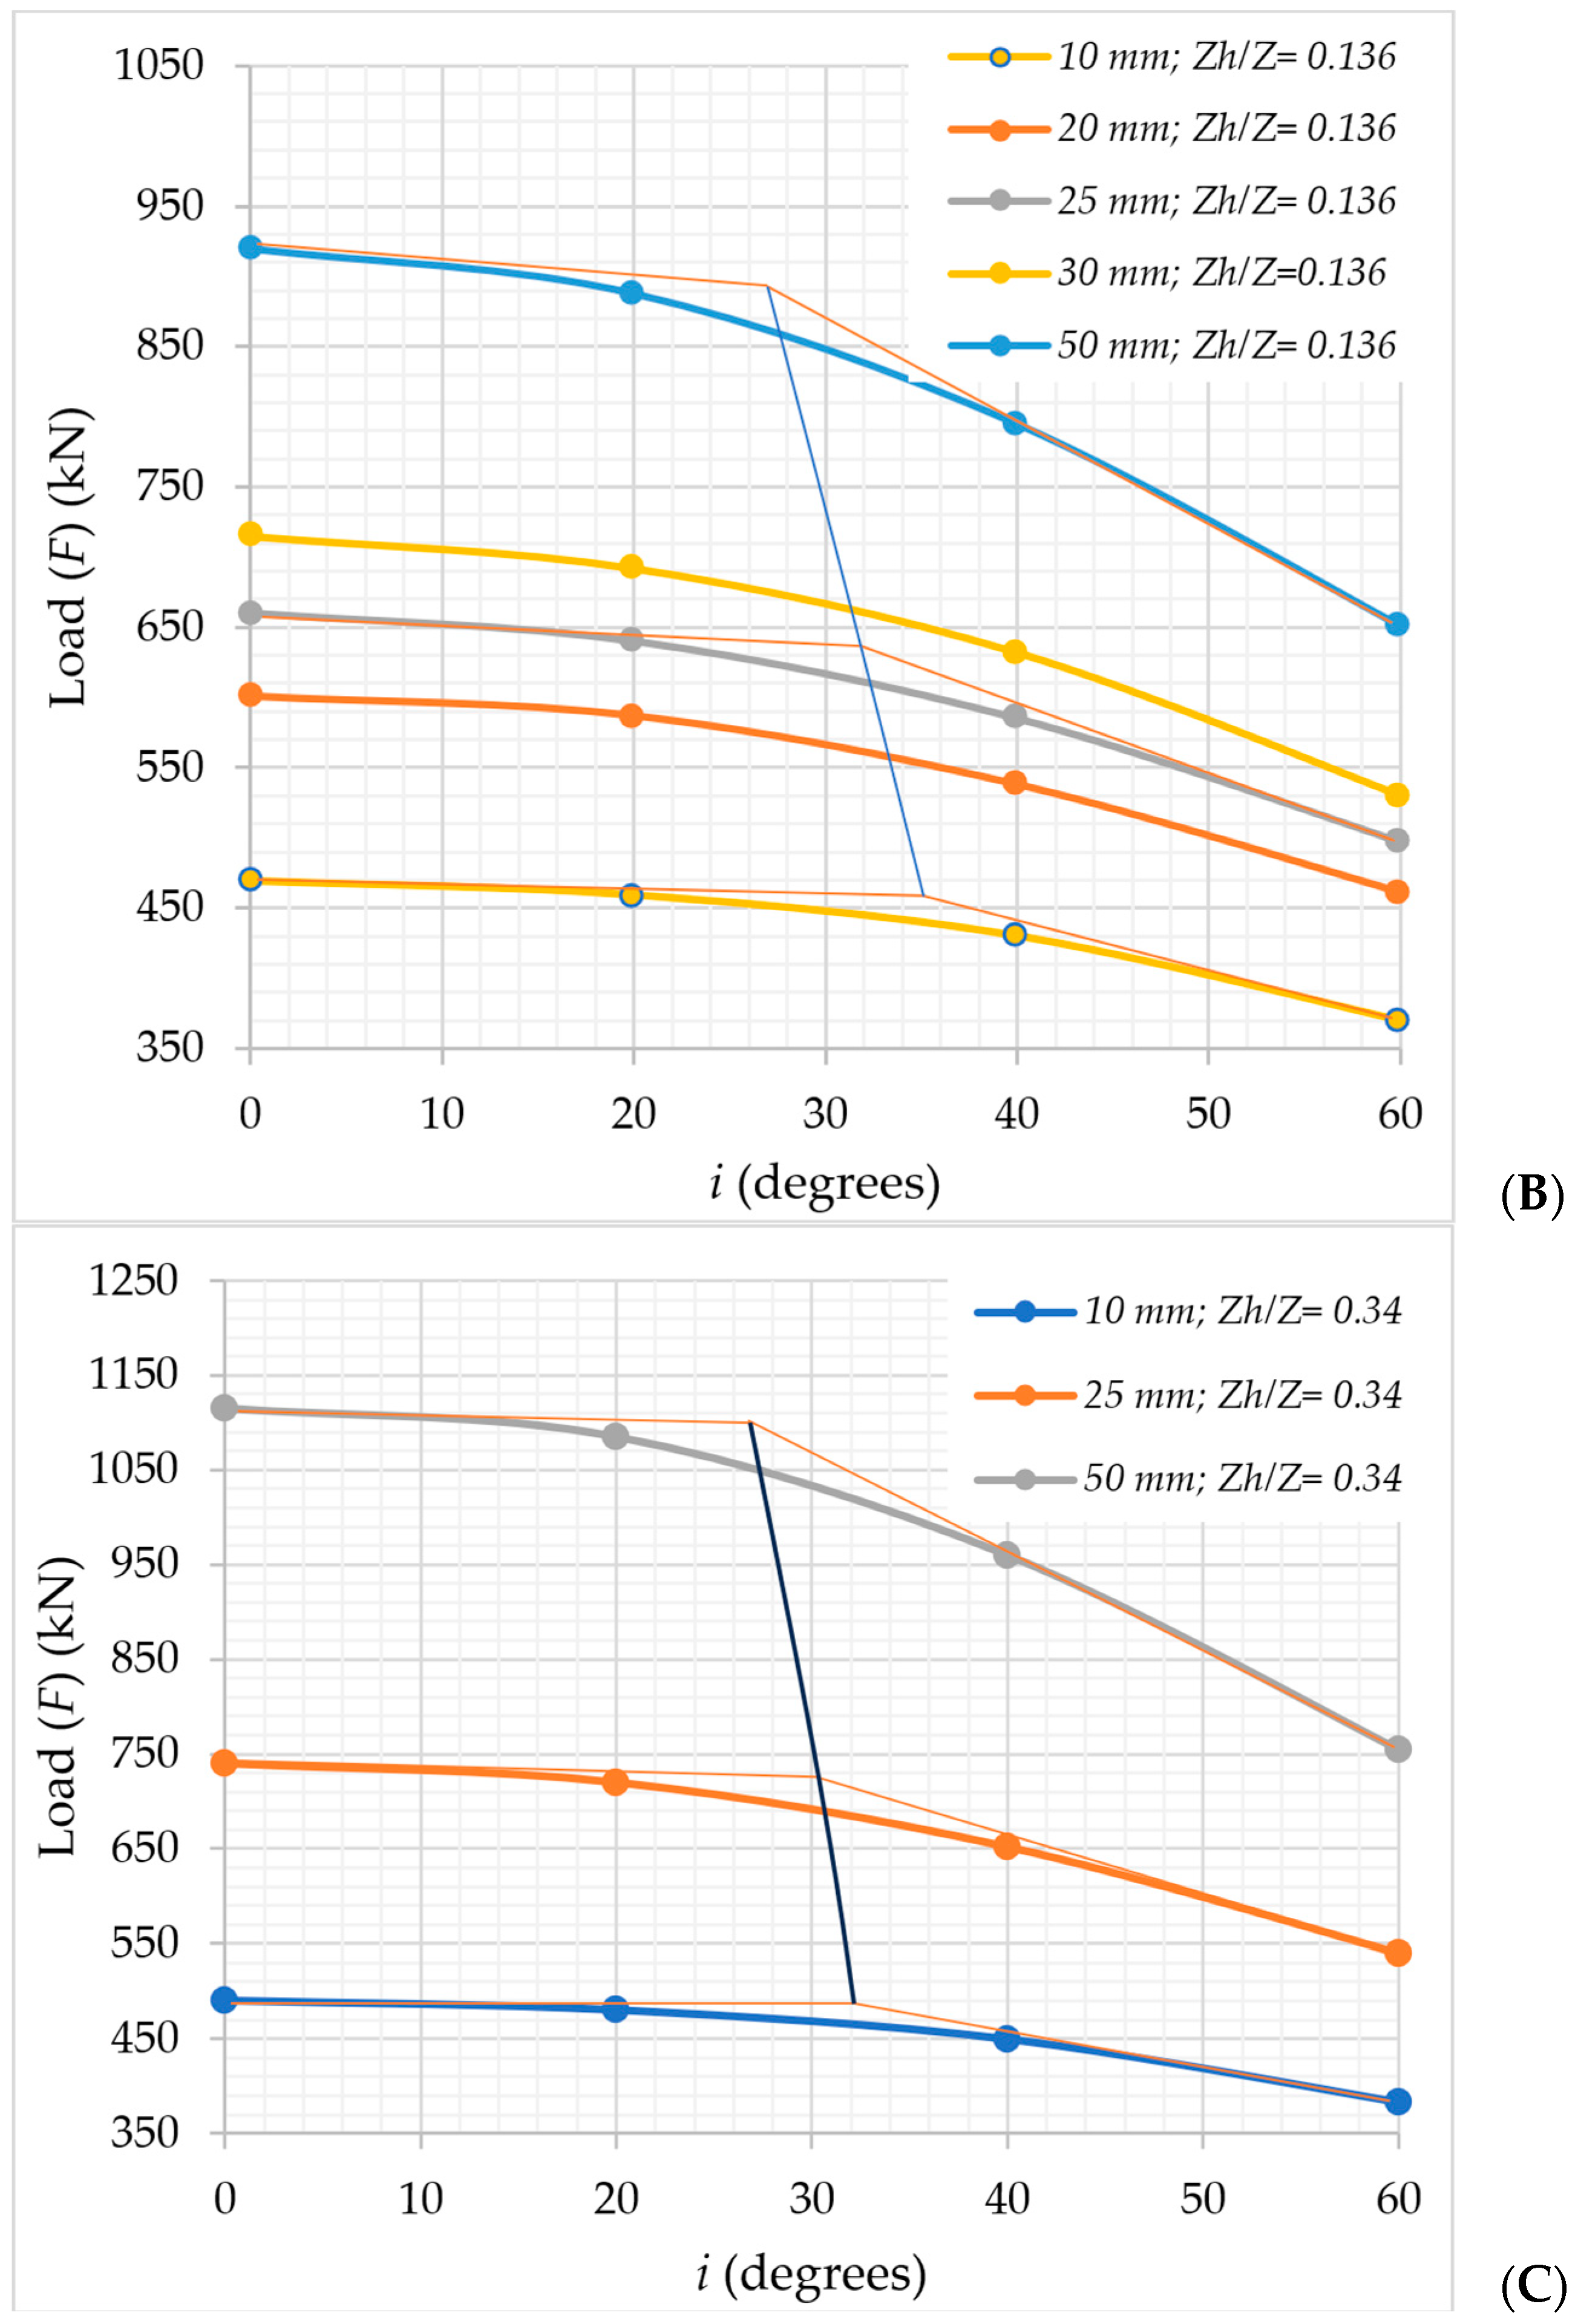
Impact of Load Inclination (i) on the Pullout Behavior of Large Diameter

Figure 22 presents load–displacement curves depicting the pullout behavior of different load inclinations (i). These curves offer a visual representation of how the piles react to upward movement and illustrate the variations in pullout loads corresponding to different load inclinations.
The following investigation was aimed at assessing how varying the load inclination affects the pullout load required to resist movements of 10, 25, and 50 mm for a large-shaft-diameter helical pile. The findings, illustrated in Figure 22, reveal that increasing the load inclination results in a decrease in the pullout load, irrespective of the helical plate’s position. This suggests that piles subjected to axial forces are more effective in resisting movement, and these findings are also similar to helical piles with a small shaft diameter. However, it is crucial to note that, beyond a certain angle of load inclination corresponding to the movement value, there was a significant decrease in the load capacity. This critical angle diminishes as the ratio of Zh to Z increases, while it increases as allowable movement increases, as depicted in Figure 23 (where the Z for a large shaft diameter is 14.5 m). Table 11 presents the critical inclination angles, based on movement and the Zh/Z ratio, after which a substantial decrease in load capacity had occurred. Due to their optimized bearing capacity at specific inclination angles, helical piles are especially beneficial for tension leg mooring line types, and they can also be beneficial for taut or semi-taut mooring line types.
Figure 24 displays the iso-surface displacements along the helical piles. The reasons for the decrease in capacity with increasing load inclination were the same reasons as in the case of the small shaft diameter. However, the relatively large diameter of the helical shaft made the passive load sufficient to significantly enhance the capacity of the pile when compared with the small diameter of the helical shaft. As depicted in Figure 23, the effectiveness of the helical plates diminished as the load inclination angle increased.
Based on these findings, it is advisable to limit the inclination angle from the vertical line of the load or the mooring line attached to the large-diameter helical pile to no more than the values depicted in Table 11 to achieve the best bearing capacity. This restriction ensures sufficient load-bearing capacity and stability for the piles. By adhering to this inclination threshold, an optimized balance between frictional resistance, contact area, and pullout load is achieved, thereby enhancing the overall performance and reliability of the pile foundation system.

Impact of the Top Helical Plate Location (Zh) on the Pullout Load (F) Behavior

The investigation in this section is aimed at assessing the impact of the top helical plate’s position (Zh) on a large-shaft-diameter helical pile’s capacity to withstand pullout loads and resist movement. A detailed examination of the recorded loads is presented in Table 12, while Figure 25 visually illustrates the load behavior across various helical plate locations (Zh). This offers valuable insights into their response under pullout loading conditions, and it also underscores the variations in load resistance linked to different load inclination angles.
The results from Table 12 suggest that increasing Zh enhances the load resistance capabilities irrespective of the load inclination, thus indicating that a deeper top helical plate is more effective in withstanding pullout loads and resisting movement. However, it was observed that the load capacity sharply increased up to a specific Zh/Z ratio, beyond which the rate of increase diminished or became more horizontal, as depicted in Figure 26. It is important to note that, after reaching a Zh/Z ratio of 0.78, there was a decrease in the load capacity, particularly noticeable for high movements, as illustrated in Figure 26. This phenomenon occurred because the helical plates came too close to one another, resulting in stress interactions that lead to a reduction in load capacity, as shown in Figure 27. These findings are almost similar to those of the small-shaft-diameter helical piles. However, the top helical plate in the large shaft diameter should be deeper than the small shaft diameter to achieve the best bearing capacity.
Table 13 displays the optimal Zh/Z ratios, which should surpass 0.34 for movements of 10 mm, 0.38 for movements of 25 mm, and 0.46 for movements of 50 mm. Therefore, in large-shaft-diameter helical piles, the top helical plates should be deeper than the small helical plate to achieve a better bearing capacity.

5. Conclusions

The urgent need to combat climate change has spurred a shift toward renewable energy sources, notably offshore wind power. Europe leads in offshore wind development as it can capitalize on abundant wind resources. Coupled with Power-to-X technologies, offshore wind offers solutions beyond electricity generation, such as green hydrogen production. Despite initial cost barriers, long-term forecasts suggest significant cost reductions, thus paving the way for a sustainable energy future. The rapid progress in floating offshore wind technology, coupled with favorable market trends and cost reductions, positions it as a promising contributor to the global transition toward clean and sustainable energy. The optimization of offshore wind turbine designs involves a diverse array of optimization algorithms, each with its own merits and challenges. Continued research and development in this field are crucial for enhancing the efficiency, reliability, and cost-effectiveness of offshore wind energy systems.
This study has provided valuable insights into the performance of helical piles in supporting mooring lines for floating offshore wind applications. Through a comprehensive investigation of load resistance capabilities and the movement response associated with varying helical plate positions and load inclinations, several important findings have emerged. It was observed that deeper top helical plates generally enhance load resistance, although there exists a critical Zh/Z ratio beyond which the rate of load capacity increase diminishes. Moreover, beyond a Zh/Z ratio of 0.75, there is a notable decrease in load capacity, which is attributed to the stress interactions that are caused by helical plates coming too close. Additionally, optimal Zh/Z ratios were identified for different movement scenarios, providing practical guidelines for design considerations. These findings underscore the importance of the careful positioning of helical plates and load inclination management to ensure optimal performance and reliability in the pile foundation systems in floating offshore wind projects. Helical piles are particularly useful for tension leg mooring line types, but they can also benefit taut (or semi-taut) mooring line types since their bearing capacity can be optimized at specific inclination degrees. For catenary mooring line types, it is critical to optimize the shaft of the helical pile by increasing the diameter of the upper shaft section while decreasing the diameter of the lower shaft. However, more research is needed based on the inclination of the mooring line and the location of the helical plates. By adhering to these recommendations, designers and engineers can enhance the effectiveness and longevity of offshore wind structures, thus contributing to the sustainable development of renewable energy resources. Future research should look into the use of multiple helical plates and pile groups to increase load-bearing capacity and stability. Multiple plates can better distribute loads, while pile groups add support and redundancy, especially in deeper waters and harsher conditions. These configurations will improve helical pile performance, resulting in more reliable and adaptable anchoring solutions for the offshore wind energy sector.

Author Contributions

Conceptualization, A.A.; methodology, A.A. and M.M.; modeling, A.A.; validation, A.A.; formal analysis, A.A. and M.M.; investigation, A.A.; writing—original draft preparation, A.A.; writing—review and editing, A.A. and M.M. All authors have read and agreed to the published version of the manuscript.

Funding

This research received no external funding. Funding for open access was granted by Szechenyi István University (SZE).

Institutional Review Board Statement

Not applicable.

Informed Consent Statement

Not applicable.

Data Availability Statement

All data are available within the text of this manuscript.

Conflicts of Interest

The authors declare no conflicts of interest.

References

  1. Ritchie, H.; Rosado, P.; Roser, M. Energy Mix. Our World in Data. 2024. Available online: https://ourworldindata.org/energy-mix (accessed on 7 April 2024).
  2. De Castro, M.; Salvador, S.; Gómez-Gesteira, M.; Costoya, X.; Carvalho, D.; Sanz-Larruga, F.J.; Gimeno, L. Europe, China and the United States: Three Different Approaches to the Development of Offshore Wind Energy. Renew. Sustain. Energy Rev. 2019, 109, 55–70. [Google Scholar] [CrossRef]
  3. Díaz, H.; Guedes Soares, C. Review of the Current Status, Technology and Future Trends of Offshore Wind Farms. Ocean Eng. 2020, 209, 107381. [Google Scholar] [CrossRef]
  4. Rodrigues, S.; Restrepo, C.; Kontos, E.; Teixeira Pinto, R.; Bauer, P. Trends of Offshore Wind Projects. Renew. Sustain. Energy Rev. 2015, 49, 1114–1135. [Google Scholar] [CrossRef]
  5. Manwell, J.F.; McGowan, J.G.; Rogers, A.L. Wind Energy Explained: Theory, Design and Application. In Wind Energy Explained: Theory, Design and Application; John Wiley & Sons: Hoboken, NJ, USA, 2010. [Google Scholar] [CrossRef]
  6. Poudineh, R.; Brown, C.; Foley, B. Background: Role of the Offshore Wind Industry. In Economics of Offshore Wind Power; Palgrave Macmillan: Cham, Switzerland, 2017; pp. 1–14. [Google Scholar] [CrossRef]
  7. Kaldellis, J.K.; Kapsali, M. Shifting towards Offshore Wind Energy-Recent Activity and Future Development. Energy Policy 2013, 53, 136–148. [Google Scholar] [CrossRef]
  8. Esteban, M.D.; Diez, J.J.; López, J.S.; Negro, V. Why Offshore Wind Energy? Renew. Energy 2011, 36, 444–450. [Google Scholar] [CrossRef]
  9. Hevia-Koch, P.; Klinge Jacobsen, H. Comparing Offshore and Onshore Wind Development Considering Acceptance Costs. Energy Policy 2019, 125, 9–19. [Google Scholar] [CrossRef]
  10. Ren, Z.; Verma, A.S.; Li, Y.; Teuwen, J.J.E.; Jiang, Z. Offshore Wind Turbine Operations and Maintenance: A State-of-the-Art Review. Renew. Sustain. Energy Rev. 2021, 144, 110886. [Google Scholar] [CrossRef]
  11. Burton, T.; Jenkins, N.; Sharpe, D.; Bossanyi, E. Wind Energy Handbook, 2nd ed.; John Wiley & Sons, Ltd.: Chichester, UK; Hoboken, NJ, USA, 2001; p. 780. [Google Scholar]
  12. Sun, X.; Huang, D.; Wu, G. The Current State of Offshore Wind Energy Technology Development. Energy 2012, 41, 298–312. [Google Scholar] [CrossRef]
  13. MacKinnon, D.; Dawley, S.; Steen, M.; Menzel, M.P.; Karlsen, A.; Sommer, P.; Hansen, G.H.; Normann, H.E. Path Creation, Global Production Networks and Regional Development: A Comparative International Analysis of the Offshore Wind Sector. Prog. Plan. 2019, 130, 1–32. [Google Scholar] [CrossRef]
  14. Johnston, B.; Foley, A.; Doran, J.; Littler, T. Levelised Cost of Energy, A Challenge for Offshore Wind. Renew. Energy 2020, 160, 876–885. [Google Scholar] [CrossRef]
  15. Markard, J.; Petersen, R. The Offshore Trend: Structural Changes in the Wind Power Sector. Energy Policy 2009, 37, 3545–3556. [Google Scholar] [CrossRef]
  16. WindEurope. Offshore Wind in Europe—Key Trends and Statistics 2020; WindEurope: Bilbao, Spain, 2021. [Google Scholar]
  17. Commission European. Directorate-General for Energy. Communication from the Commission to the European Parliament, the Council, the European Economic and Social Committee and the Committee of the Regions. An EU Strategy to Harness the Potential of Offshore Renewable Energy for a Climate Neutral Future; Commission European: Brussels, Belgium, 2020. [Google Scholar]
  18. WindEurope. Wind Energy in Europe: 2022 Statistics and the Outlook for 2023–2027; WindEurope: Bilbao, Spain, 2022; 58p. [Google Scholar]
  19. IRENA. Innovation Landscape for a Renewable-Powered Future: Solutions to Integrate Variable Renewables; International Renewable Energy Agency: Abu Dhabi, United Arab Emirates, 2019; 164p. [Google Scholar]
  20. GWEC. Global Offshore Wind Report 2021; Global Wind Energy Council: Brussels, Belgium, 2021; p. 136. [Google Scholar]
  21. Babarit, A.; Gilloteaux, J.C.; Clodic, G.; Duchet, M.; Simoneau, A.; Platzer, M.F. Techno-Economic Feasibility of Fleets of Far Offshore Hydrogen-Producing Wind Energy Converters. Int. J. Hydrogen Energy 2018, 43, 7266–7289. [Google Scholar] [CrossRef]
  22. Kovalchuk, V. Techno-Economic Review of Offshore Wind Power. Master’s Thesis, Lappeenranta-Lahti University of Technology, Lappeenranta, Finland, 2021. [Google Scholar]
  23. Manwell, J.F. Offshore Wind Energy Technology Trends, Challenges, and Risks. In Power Stations Using Locally Available Energy Sources; Springer: New York, NY, USA, 2018; pp. 399–436. [Google Scholar] [CrossRef]
  24. Jiang, Z. Installation of Offshore Wind Turbines: A Technical Review. Renew. Sustain. Energy Rev. 2021, 139, 110576. [Google Scholar] [CrossRef]
  25. IRENA. Renewable Power Generation Costs in 2022; International Renewable Energy Agency: Abu Dhabi, United Arab Emirates, 2023; 208p. [Google Scholar]
  26. IRENA. Renewable Energy Benefits Leveraging Local Capacity for Offshore Wind; International Renewable Energy Agency: Abu Dhabi, United Arab Emirates, 2018; 44p. [Google Scholar]
  27. Wang, X.; Zeng, X.; Li, J.; Yang, X.; Wang, H. A Review on Recent Advancements of Substructures for Offshore Wind Turbines. Energy Convers. Manag. 2018, 158, 103–119. [Google Scholar] [CrossRef]
  28. Buljan, A. Offshore Wind Turbines in 2023: 16 MW Model Installed Offshore, 18 MW WTGs Selected for New Project, 22 MW Turbine Announced. Available online: https://www.offshorewind.biz/2024/01/02/offshore-wind-turbines-in-2023-16-mw-model-installed-offshore-18-mw-wtgs-selected-for-new-project-22-mw-turbine-announced/ (accessed on 12 March 2024).
  29. Trojnar, K. Simplified Design of New Hybrid Monopile Foundations for Offshore Wind Turbines. Ocean Eng. 2021, 219, 108046. [Google Scholar] [CrossRef]
  30. Soares-Ramos, E.P.P.; de Oliveira-Assis, L.; Sarrias-Mena, R.; Fernández-Ramírez, L.M. Current Status and Future Trends of Offshore Wind Power in Europe. Energy 2020, 202, 117787. [Google Scholar] [CrossRef]
  31. Wu, X.; Hu, Y.; Li, Y.; Yang, J.; Duan, L.; Wang, T.; Adcock, T.; Jiang, Z.; Gao, Z.; Lin, Z.; et al. Foundations of Offshore Wind Turbines: A Review. Renew. Sustain. Energy Rev. 2019, 104, 379–393. [Google Scholar] [CrossRef]
  32. Arshad, M.; O’kelly, B.C. Offshore Wind-Turbine Structures: A Review. Proc. Inst. Civ. Eng. Energy 2015, 166, 139–152. [Google Scholar] [CrossRef]
  33. Kaiser, M.J.; Snyder, B.F. Offshore Wind Energy System Components. In Offshore Wind Energy Cost Modeling; Green Energy and Technology; Springer: London, UK, 2012; pp. 13–30. [Google Scholar] [CrossRef]
  34. Igoe, D.; Gavin, K.; O’Kelly, B. An Investigation into the Use of Push-in Pile Foundations by the Offshore Wind Sector. Int. J. Environ. Stud. 2013, 70, 777–791. [Google Scholar] [CrossRef]
  35. Ørsted. Our Experience with Suction Bucket Jacket Foundations. Ørsted’s Experience with Suction Bucket Jacket Foundations. Available online: https://orsted.com/-/media/www/docs/corp/com/our-business/wind-power/bucket-jacket_long-version.ashx?la=en&hash=bb12170bd01a84543af54599146637e5 (accessed on 3 January 2024).
  36. Oh, K.Y.; Nam, W.; Ryu, M.S.; Kim, J.Y.; Epureanu, B.I. A Review of Foundations of Offshore Wind Energy Convertors: Current Status and Future Perspectives. Renew. Sustain. Energy Rev. 2018, 88, 16–36. [Google Scholar] [CrossRef]
  37. Pérez-Collazo, C.; Greaves, D.; Iglesias, G. A Review of Combined Wave and Offshore Wind Energy. Renew. Sustain. Energy Rev. 2015, 42, 141–153. [Google Scholar] [CrossRef]
  38. Horwath, S.; Hassrick, J.; Grismala, R.; Diller, E.; Krebs, J.; Manhard, R. ICF Comparison of Environmental Effects from Different Offshore Wind Turbine Foundations (2021 Revision)|Tethys; OCS Study BOEM 2021-053; U.S. Department of the Interior, Bureau of Ocean Energy Management: Sterling, VA, USA, 2020; p. 48. [Google Scholar]
  39. Fu, F. Design and Analysis of Tall and Complex Structures; Butterworth-Heinemann: Oxford, UK, 2018; ISBN 0081011210. [Google Scholar]
  40. Rystad Energy; WindEurope. The State of the European Wind Energy Supply Chain. A «What-Would-It-Take» Analysis of the European Supply Chain’s Ability to Support Ambitious Capacity Targets towards 2030; A Rystad Energy Report in Cooperation with, WindEurope; Rystad Energy: Oslo, Norway; WindEurope: Bilbao, Spain, 2023. [Google Scholar]
  41. Esteban, M.D.; López-Gutiérrez, J.S.; Negro, V. Gravity-Based Foundations in the Offshore Wind Sector. J. Mar. Sci. Eng. 2019, 7, 64. [Google Scholar] [CrossRef]
  42. Thomsen, K.E. What Is an Offshore Wind Farm? In Offshore Wind; Academic Press: London, UK; pp. 1–7. [CrossRef]
  43. Fischer, T.; De Vries, W.E.; Cordle, A. Executive Summary (WP4: Offshore Foundations and Support Structures). 2011. Available online: http://resolver.tudelft.nl/uuid:7ff42174-70ab-459d-b709-3bab9c2f9c4b (accessed on 14 January 2024).
  44. Passon, P.; Branner, K.; Larsen, S.E.; Hvenekaer Rasmussen, J. Offshore Wind Turbine Foundation Design; DTU Wind Energy PhD, No. 0044(EN); DTU Wind Energy: Roskilde, Denmark, 2015. [Google Scholar]
  45. WindEurope. Floating Offshore Wind Vision Statement; WindEurope: Bilbao, Spain, 2017; 16p. [Google Scholar]
  46. IRENA. Innovation Outlook Offshore Wind; International Renewable Energy Agency: Abu Dhabi, United Arab Emirates, 2016; 160p. [Google Scholar]
  47. Xu, S.; Murai, M.; Wang, X.; Takahashi, K. A Novel Conceptual Design of a Dynamically Positioned Floating Wind Turbine. Ocean Eng. 2021, 221, 108528. [Google Scholar] [CrossRef]
  48. Kopperstad, K.M.; Kumar, R.; Shoele, K. Aerodynamic Characterization of Barge and Spar Type Floating Offshore Wind Turbines at Different Sea States. Wind Energy 2020, 23, 2087–2112. [Google Scholar] [CrossRef]
  49. Meng, L.; He, Y.P.; Zhao, Y.S.; Yang, J.; Yang, H.; Han, Z.L.; Yu, L.; Mao, W.G.; Du, W.K. Dynamic Response of 6MW Spar Type Floating Offshore Wind Turbine by Experiment and Numerical Analyses. China Ocean Eng. 2020, 34, 608–620. [Google Scholar] [CrossRef]
  50. Liu, Y.; Xiao, Q.; Incecik, A.; Peyrard, C.; Wan, D. Establishing a Fully Coupled CFD Analysis Tool for Floating Offshore Wind Turbines. Renew. Energy 2017, 112, 280–301. [Google Scholar] [CrossRef]
  51. Kasyanov, V.N.; Kasyanova, E.V.; Jonkman, J.M.; Jonkman, B.J. FAST Modularization Framework for Wind Turbine Simulation: Full-System Linearization. J. Phys. Conf. Ser. 2016, 753, 082010. [Google Scholar] [CrossRef]
  52. Li, L.; Cheng, Z.; Yuan, Z.; Gao, Y. Short-Term Extreme Response and Fatigue Damage of an Integrated Offshore Renewable Energy System. Renew. Energy 2018, 126, 617–629. [Google Scholar] [CrossRef]
  53. Browning, J.R.; Jonkman, J.; Robertson, A.; Goupee, A.J. Calibration and Validation of a Spar-Type Floating Offshore Wind Turbine Model Using the FAST Dynamic Simulation Tool. J. Phys. Conf. Ser. 2014, 555, 012015. [Google Scholar] [CrossRef]
  54. Ruzzo, C.; Fiamma, V.; Collu, M.; Failla, G.; Nava, V.; Arena, F. On Intermediate-Scale Open-Sea Experiments on Floating Offshore Structures: Feasibility and Application on a Spar Support for Offshore Wind Turbines. Mar. Struct. 2018, 61, 220–237. [Google Scholar] [CrossRef]
  55. Tomasicchio, G.R.; Avossa, A.M.; Riefolo, L.; Ricciardelli, F.; Musci, E.; D’Alessandro, F.; Vicinanza, D. Dynamic Modelling of a Spar Buoy Wind Turbine. In Proceedings of the International Conference on Offshore Mechanics and Arctic Engineering—OMAE, Trondheim, Norway, 25–30 June 2017; Volume 10. [Google Scholar] [CrossRef]
  56. Bae, Y.H.; Kim, M.H.; Im, S.W.; Chang, I.H. Aero-Elastic-Control-Floater-Mooring Coupled Dynamic Analysis of Floating Offshore Wind Turbines; ISOPE: Mountain View, CA, USA, 2011. [Google Scholar]
  57. Liu, Y.; Li, S.; Yi, Q.; Chen, D. Developments in Semi-Submersible Floating Foundations Supporting Wind Turbines: A Comprehensive Review. Renew. Sustain. Energy Rev. 2016, 60, 433–449. [Google Scholar] [CrossRef]
  58. Collu, M.; Borg, M.; Shires, A.; Brennan, F.P. FloVAWT: Progress on the Development of a Coupled Model of Dynamics for Floating Offshore Vertical Axis Wind Turbines. In Proceedings of the International Conference on Offshore Mechanics and Arctic Engineering—OMAE, Nantes, France, 9–14 June 2013; Volume 8. [Google Scholar] [CrossRef]
  59. Roddier, D.; Cermelli, C.; Weinstein, A. WindFloat: A Floating Foundation for Offshore Wind Turbines—Part I: Design Basis and Qualification Process. In Proceedings of the International Conference on Offshore Mechanics and Arctic Engineering—OMAE, Honolulu, HI, USA, 31 May–5 June 2010; Volume 4, pp. 845–853. [Google Scholar] [CrossRef]
  60. Bae, Y.H.; Kim, M.H.; Kim, H.C. Performance Changes of a Floating Offshore Wind Turbine with Broken Mooring Line. Renew. Energy 2017, 101, 364–375. [Google Scholar] [CrossRef]
  61. Kim, H.C.; Kim, M.H.; Lee, J.Y.; Kim, E.S.; Zhang, Z. Global Performance Analysis of 5MW WindFloat and OC4 Semi-Submersible Floating Offshore Wind Turbines (FOWT) by Numerical Simulations 2017. In Proceedings of the 27th International Ocean and Polar Engineering Conference, San Francisco, CA, USA, 25–30 June 2017. [Google Scholar]
  62. Bae, Y.H.; Kim, M.H. Coupled Dynamic Analysis of Multiple Wind Turbines on a Large Single Floater. Ocean Eng. 2014, 92, 175–187. [Google Scholar] [CrossRef]
  63. Jang, H.K.; Park, S.; Kim, M.H.; Kim, K.H.; Hong, K. Effects of Heave Plates on the Global Performance of a Multi-Unit Floating Offshore Wind Turbine. Renew. Energy 2019, 134, 526–537. [Google Scholar] [CrossRef]
  64. Zhao, Y.; Yang, J.; He, Y. Preliminary Design of a Multi-Column TLP Foundation for a 5-MW Offshore Wind Turbine. Energies 2012, 5, 3874–3891. [Google Scholar] [CrossRef]
  65. Bachynski, E.E.; Moan, T. Design Considerations for Tension Leg Platform Wind Turbines. Mar. Struct. 2012, 29, 89–114. [Google Scholar] [CrossRef]
  66. Nihei, Y.; Fujioka, H. Motion Characteristics of TLP Type Offshore Wind Turbine in Waves and Wind. In Proceedings of the International Conference on Offshore Mechanics and Arctic Engineering—OMAE, Shanghai, China, 6–11 June 2010; Volume 3, pp. 283–292. [Google Scholar] [CrossRef]
  67. Bae, Y.H.; Kim, M.H.; Shin, Y.S. Rotor-Floater-Mooring Coupled Dynamic Analysis of Mini TLP-Type Offshore Floating Wind Turbines. In Proceedings of the International Conference on Offshore Mechanics and Arctic Engineering—OMAE, Shanghai, China, 6–11 June 2010; Volume 3, pp. 491–498. [Google Scholar] [CrossRef]
  68. Olondriz, J.; Elorza, I.; Jugo, J.; Alonso-Quesada, S.; Pujana-Arrese, A. An Advanced Control Technique for Floating Offshore Wind Turbines Based on More Compact Barge Platforms. Energies 2018, 11, 1187. [Google Scholar] [CrossRef]
  69. Floating Offshore Wind Farms; Green Energy and Technology; Springer International Publishing: Cham, Switzerland, 2016. [CrossRef]
  70. GWEC. Global Offshore Wind Report 2023; Global Wind Energy Council: Brussels, Belgium, 2023. [Google Scholar]
  71. IRENA. Renewable Power Generation Costs in 2019; International Renewable Energy Agency: Abu Dhabi, United Arab Emirates, 2020; 144p. [Google Scholar]
  72. Spagnoli, G.; de Hollanda Cavalcanti Tsuha, C. A Review on the Behavior of Helical Piles as a Potential Offshore Foundation System. Mar. Georesources Geotechnol. 2020, 38, 1013–1036. [Google Scholar] [CrossRef]
  73. Cerfontaine, B.; White, D.; Kwa, K.; Gourvenec, S.; Knappett, J.; Brown, M. Anchor Geotechnics for Floating Offshore Wind: Current Technologies and Future Innovations. Ocean Eng. 2023, 279, 114327. [Google Scholar] [CrossRef]
  74. Hao, D.; Wang, D.; O’loughlin, C.D.; Gaudin, C. Tensile Monotonic Capacity of Helical Anchors in Sand: Interaction between Helices. Can. Geotech. J. 2018, 56, 1534–1543. [Google Scholar] [CrossRef]
  75. Cerfontaine, B.; Knappett, J.A.; Brown, M.J.; Davidson, C.S.; Al-Baghdadi, T.; Sharif, Y.U.; Brennan, A.; Augarde, C.; Coombs, W.M.; Wang, L.; et al. A Finite Element Approach for Determining the Full Load–Displacement Relationship of Axially Loaded Shallow Screw Anchors, Incorporating Installation Effects. Can. Geotech. J. 2020, 58, 565–582. [Google Scholar] [CrossRef]
  76. Ding, H.; Wang, L.; Zhang, P.; Le, C. Study on the Lateral Bearing Capacity of Single-Helix Pile for Offshore Wind Power. In Proceedings of the International Conference on Offshore Mechanics and Arctic Engineering—OMAE, Madrid, Spain, 17–22 June 2018; Volume 9. [Google Scholar] [CrossRef]
  77. Sharif, Y.U.; Brown, M.J.; Cerfontaine, B.; Davidson, C.; Ciantia, M.O.; Knappett, J.A.; Ball, J.D.; Brennan, A.; Augarde, C.; Coombs, W.; et al. Effects of Screw Pile Installation on Installation Requirements and In-Service Performance Using the Discrete Element Method. Can. Geotech. J. 2020, 58, 1334–1350. [Google Scholar] [CrossRef]
  78. Davidson, C.; Brown, M.J.; Cerfontaine, B.; Al-Baghdadi, T.; Knappett, J.; Brennan, A.; Augarde, C.; Coombs, W.; Wang, L.; Blake, A.; et al. Physical Modelling to Demonstrate the Feasibility of Screw Piles for Offshore Jacket-Supported Wind Energy Structures. Geotechnique 2022, 72, 108–126. [Google Scholar] [CrossRef]
  79. Bradshaw, A.S.; Cullen, L.; Miller, Z. Field Study of Group Effects on the Pullout Capacity of “Deep” Helical Piles in Sand. Can. Geotech. J. 2021, 59, 538–545. [Google Scholar] [CrossRef]
  80. Alsirawan, R.; Alnmr, A. Dynamic Behavior of Gravity Segmental Retaining Walls. Pollack Period. 2022, 18, 94–99. [Google Scholar] [CrossRef]
  81. Brinkgreve, R.B.J.; Engin, E.; Engin, H.K. Validation of Empirical Formulas to Derive Model Parameters for Sands. In Numerical Methods in Geotechnical Engineering—Proceedings of the 7th European Conference on Numerical Methods in Geotechnical Engineering, Trondheim, Norway, 6 September 2006; 2010; pp. 137–142. Available online: https://www.researchgate.net/publication/267638739_Validation_of_empirical_formulas_to_derive_model_parameters_for_sands (accessed on 17 April 2024).
  82. Salem, T.N.; Hussein, M. Axial Tensile Capacity of Helical Piles from Field Tests and Numerical Study. Port-Said Eng. Res. J. 2017, 21, 111–119. [Google Scholar] [CrossRef]
  83. Brown, M.; Davidson, C.; Brennan, A.; Knappett, J.; Cerfontaine, B.; Sharif, Y. Physical Modelling of Screw Piles for Offshore Wind Energy Foundations. In Proceedings of the 1st International Symposium on Screw Piles for Energy Applications, Dundee, UK, 27–28 May 2019; pp. 31–38. [Google Scholar]
  84. Law, K.H.; Geotechnical, K.H.; Bhd, S. 3D Finite Element Analysis of a Deep Excavation Considering the Effect of Anisotropic Wall Stiffness Impact. In Proceedings of the 19th Southeast Asian Geotechnical Conference & 2nd AGSSEA Conference (19SEAGC & 2AGSSEA), Kuala Lumpur, Malaysia, 31 May–3 June 2016; p. 6. [Google Scholar]
  85. Al-Ani, W.; Wanatowski, D.; Chan, S.H. Numerical Analysis of Piled Embankments on Soft Soils. In Proceedings of the Geo-Shanghai 2014 International Conference, Shanghai, China, 26–28 May 2014; American Society of Civil Engineers (ASCE): Reston, VA, USA, 2014; pp. 30–39. [Google Scholar]
  86. Hsiung, B.C.B.; Yang, K.H.; Aila, W.; Ge, L. Evaluation of the Wall Deflections of a Deep Excavation in Central Jakarta Using Three-Dimensional Modeling. Tunn. Undergr. Space Technol. 2018, 72, 84–96. [Google Scholar] [CrossRef]
  87. Alnmr, A. Material Models to Study the Effect of Fines in Sandy Soils Based on Experimental and Numerical Results. Acta Tech. Jaurinensis 2021, 14, 651–680. [Google Scholar] [CrossRef]
  88. Alsirawan, R.; Alnmr, A.; Koch, E. Experimental and Numerical Investigation of Geosynthetic-Reinforced Pile-Supported Embankments for Loose Sandy Soils. Buildings 2023, 13, 2179. [Google Scholar] [CrossRef]
  89. Salgado, R.; Mitchell, J.K.; Jamiolkowski, M. Cavity Expansion and Penetration Resistance in Sand. J. Geotech. Geoenvironmental Eng. 1997, 123, 344–354. [Google Scholar] [CrossRef]
  90. Krasiński, A. Numerical Simulation of Screw Displacement Pile Interaction with Non-Cohesive Soil. Arch. Civ. Mech. Eng. 2014, 14, 122–133. [Google Scholar] [CrossRef]
  91. Thiyyakkandi, S.; McVay, M.; Bloomquist, D.; Lai, P. Experimental Study, Numerical Modeling of and Axial Prediction Approach to Base Grouted Drilled Shafts in Cohesionless Soils. Acta Geotech. 2014, 9, 439–454. [Google Scholar] [CrossRef]
  92. Broere, W.; Van Tol, A.F. Modelling the Bearing Capacity of Displacement Piles in Sand. In Proceedings of the Institution of Civil Engineers-Geotechnical Engineering; Thomas Telford Ltd.: London, UK, 2015; Volume 159, pp. 195–206. [Google Scholar] [CrossRef]
  93. Li, Z.; Haigh, S.K.; Bolton, M.D. Centrifuge Modelling of Mono-Pile under Cyclic Lateral Loads. In Physical Modelling in Geotechnics, Two Volume Set; CRC Press: London, UK, 2010; Volume 2, pp. 965–970. [Google Scholar]
  94. Alnmr, A.; Ray, R.P.; Alsirawan, R. A State-of-the-Art Review and Numerical Study of Reinforced Expansive Soil with Granular Anchor Piles and Helical Piles. Sustainability 2023, 15, 2802. [Google Scholar] [CrossRef]
  95. Alnmr, A.; Ray, R.P.; Alsirawan, R. Comparative Analysis of Helical Piles and Granular Anchor Piles for Foundation Stabilization in Expansive Soil: A 3D Numerical Study. Sustainability 2023, 15, 11975. [Google Scholar] [CrossRef]
  96. Kaufmann, K.L.; Nielsen, B.N.; Augustesen, A.H. Finite Element Investigations on the Interaction between a Pile and Swelling Clay; DCE Technical Reports No. 104; Department of Civil Engineering, Aalborg University: Aalborg, Denmark, 2010. [Google Scholar]
Figure 1. A network of keywords.
Jmse 12 01040 g001
Figure 2. Five life-cycle stages of an OWF ([24], modified by authors).
Jmse 12 01040 g002
Figure 3. Water depth and average distance from shore [25].
Jmse 12 01040 g003
Figure 4. The components and layout of an OWF schematically represented [26].
Jmse 12 01040 g004
Figure 5. A typical arrangement of an OWT ([22], modified by authors).
Jmse 12 01040 g005
Figure 6. OWTs’ increasing power and size (compiled based on [28,29]).
Jmse 12 01040 g006
Figure 7. The impact of different loads on offshore wind turbines (OWTs) ([22], modified by authors).
Jmse 12 01040 g007
Figure 8. A schematic representation and utilization of different offshore foundation types based on water depth (compiled based on [36,37]).
Jmse 12 01040 g008
Figure 9. The manufacturing companies that erected foundations in Europe in 2020 [16].
Jmse 12 01040 g009
Figure 10. Schematic diagram of the barge, spar floating, SSP, and TLP foundations ([24], modified by authors).
Jmse 12 01040 g010
Figure 11. Lifecycle cost of energy (LCOE), installed cost, and capacity factor for floating offshore wind, worldwide trends, 2011–2024 ([71] modified by authors). (A) Total installed cost and (B) levelized cost of electricity.
Jmse 12 01040 g011
Figure 12. Cross-section displaying typical displacement contours subsequent to cavity expansion that is conducted during the second calculation phase.
Jmse 12 01040 g012
Figure 13. Typical mesh generated for helical pile modeling in 3D FEM and dimensions.
Jmse 12 01040 g013
Figure 14. Load–displacement curves of the Calibrated Numerical Model using Plaxis 3D. (A) Field-tested pile in sand [82] and (B) centrifuge test [83].
Jmse 12 01040 g014
Figure 15. Cross-sectional view of reinforced soil with a helical pile.
Jmse 12 01040 g015
Figure 16. Pullout behavior of small-shaft-diameter helical piles at different inclination loads: (A) Zh/Z = 0.034, (B) Zh/Z = 0.136, and (C) Zh/Z = 0.34.
Jmse 12 01040 g016aJmse 12 01040 g016b
Figure 17. The relations between load capacity and load inclination angle of small-shaft-diameter helical piles at different allowable movements: (A) Zh/Z = 0.034, (B) Zh/Z = 0.136, and (C) Zh/Z = 0.34.
Jmse 12 01040 g017aJmse 12 01040 g017b
Figure 18. The iso surface displacements along the small-shaft-diameter helical piles: (a) i = 0°, (b) i = 20°, (c) i = 40°, and (d) i = 60°.
Jmse 12 01040 g018
Figure 19. Load response of small-shaft-diameter helical piles at various top helical plate locations (Zh); (a) i = 0°, (b) i = 20°, (c) i = 40°, and (d) i = 60°.
Jmse 12 01040 g019aJmse 12 01040 g019b
Figure 20. Relation between the load capacity and Zh/Z of small-shaft-diameter helical piles at different allowable movements: (A) i = 0°, (B) i = 20°, (C) i = 40°, and (D) i = 60°.
Jmse 12 01040 g020aJmse 12 01040 g020b
Figure 21. The iso surface displacements along the small-shaft-diameter helical piles: (A) i = 0°, (B) i = 60°, (1) Zh/Z = 0.075, and (2) Zh/Z = 0.884.
Jmse 12 01040 g021
Figure 22. Pullout behavior of large-shaft-diameter helical piles at different inclination loads: (A) Zh/Z = 0.034, (B) Zh/Z = 0.136, and (C) Zh/Z = 0.34.
Jmse 12 01040 g022aJmse 12 01040 g022b
Figure 23. The relations between the load capacity and load inclination angle of large-shaft-diameter helical piles at different allowable movements: (A) Zh/Z = 0.034, (B) Zh/Z = 0.136, and (C) Zh/Z = 0.34.
Jmse 12 01040 g023aJmse 12 01040 g023b
Figure 24. The iso surface displacements along the large-shaft-diameter helical piles: (a) i = 0°, (b) i = 20°, (c) i = 40°, and (d) i = 60°.
Jmse 12 01040 g024
Figure 25. Load response of large-shaft-diameter helical piles at various top helical plate locations (Zh); (a) i = 0°, (b) i = 20°, (c) i = 40°, and (d) i = 60°.
Jmse 12 01040 g025aJmse 12 01040 g025b
Figure 26. The relations between load capacity and Zh/Z of large-shaft-diameter helical piles at different allowable movements: (A) i = 0°, (B) i = 20°, (C) i = 40°, and (D) i = 60°.
Jmse 12 01040 g026aJmse 12 01040 g026b
Figure 27. The iso surface displacements along the large-shaft-diameter helical piles: (A) i = 0°, (B) i = 60°, (1) Zh/Z = 0.55, (2) Zh/Z = 0.69, (3) Zh/Z = 0.76, and (4) Zh/Z = 0.9.
Jmse 12 01040 g027
Table 1. Offshore wind installations in Europe by country, 2020 [16].
CountryNumber of OWFsNumber of Turbines ConnectedCumulated Capacity (MW)
The UK40229410,428
Germany2915017689
Denmark145591703
Belgium113992261
The Netherlands95372611
Sweden580192
Finland31971
Ireland1725
Portugal1325
Spain115
Norway112
France112
Total116540225,014
Table 2. Projected installations by country from 2024 to 2027 [18].
Country (MW)Year
2024202520262027
Belgium--500500
Denmark190210800900
France530990300800
Germany163090014202210
Ireland---560
Italy--250520
The Netherlands3507003501000
Poland--9201090
Spain---160
Norway-10--
The UK1670190038903820
Total43704710843011,560
Table 3. The average water depth and distance to shore for each region until 2019 (compiled based on [3]).
RegionThe Average Water Depth (m)The Average Distance to Shore (km)
America25.54.5
Europe17.423.3
Asia6.76.9
Table 4. The soil material parameters utilized in the Finite Element Method (FEM) study (compiled by authors based on [81]).
Soil ParameterSand Parameters Corresponding to Relative Density ( D r )
Drainage typeDrained
Oedometer stiffness, E o e d r e f   ( kN / m 2 ) , at P r e f = 100 kPa60,000 D r
Secant stiffness, E 50 r e f   ( kN / m 2 ) ,   at   P r e f = 100 kPa60,000 D r
Unload/reload stiffness, E u r r e f   ( kN / m 2 ) ,   at   P r e f = 100 kPa180,000 D r
Shear modulus at very small strains, G o r e f ( kN / m 2 ) 60,000 + 68,000 D r
Reference shear strain ( at   G s = 0.722 G 0 ) ,   γ 0.7 (2 − D r )/10,000
Friction angle, p (degrees)28 + 12.5 D r
Effective cohesion intercept c’ref (kPa)-
Angle of dilation, Ψ (degrees)−2 + 12.5 D r
Failure ratio, R f (−)1 − D r /8
Unload–reload Poisson’s ratio, vur0.2
Power of stress level dependency of stiffness, m (−)0.7 − (100 D r /320)
Saturated unit weight, γ s a t   ( kN / m 3 ) 19 + 1.6 × D r
Unsaturated unit weight, γ u n s a t   ( kN / m 3 ) 15 + 4 D r
Table 5. Helical pile configuration for verification of a field study [82] and centrifuge test [83].
Case StudyLoad TypeShaftHelical PlateHelical Plate Number, NDepth (m)Plate Spacing Ratio (S/Dh)
Dc (mm)Dh (mm)th (mm)
Field study [82]Pullout452001021.92.5
Centrifuge test [83]Pullout88017001102132
Table 6. Soil parameters for verification of the field study of Salem and Hussein [82].
Model ParameterHSHS Small
SymbolSoil ParametersDisturbed Sand around Shaft
(Drained Behavior)
Sand
(Drained Behavior)
Disturbed Sand around Shaft
(Drained Behavior)
Sand
(Drained Behavior)
γ s a t (kN/m3)Saturated unit weight20202020
γ u n s a t (kN/m3)Unsaturated unit weight18181818
E 50 r e f (kN/m2)Reference secant stiffness30,00046,70030,00046,700
E o e d r e f (kN/m2)Reference tangent stiffness30,00046,70030,00046,700
E u r r e f (kN/m2)Reference unloading–reloading stiffness90,000140,00090,000140,000
C′ (kN/m2)Cohesion0.30.30.30.3
(°)Internal friction angle34.253934.2539
Ψ (°)Dilatancy angle612612
v u r (−)Unloading/reloading Poisson’s ratio0.20.20.20.2
m (−)Exponential power0.5440.4570.5440.457
R f (−)Failure ratio0.9380.9030.9380.903
G o r e f (kN/m2)Shear modulus at very small strains 94,000112,900
γ 0.7 (−)Reference shear strain (at G s = 0.722 G 0 ) 0.000150.00012
Table 7. Soil parameters for verification of the centrifuge test of Davidson et al. [83].
Model ParameterHSHS Small
SymbolSoil ParametersDisturbed Sand around Shaft
(Drained Behavior)
Sand
(Drained Behavior)
Disturbed Sand around Shaft
(Drained Behavior)
Sand
(Drained Behavior)
γ s a t (kN/m3)Saturated unit weight19.2420.319.2420.3
γ u n s a t (kN/m3)Unsaturated unit weight1818.41818.4
E 50 r e f (kN/m2)Reference secant stiffness21,00050,40021,00050,400
E o e d r e f (kN/m2)Reference tangent stiffness21,00050,40021,00050,400
E u r r e f (kN/m2)Reference unloading–reloading stiffness63,000151,20063,000151,200
C′ (kN/m2)Cohesion0.30.30.30.3
(°)Internal friction angle3238.53238.5
Ψ (°)Dilatancy angle08.508.5
v u r (−)Unloading/reloading Poisson’s ratio0.20.20.20.2
m (−)Exponential power0.590.4340.590.434
R f (−)Failure ratio0.9380.8950.9380.895
G o r e f (kN/m2)Shear modulus at very small strains 83,800117,120
γ 0.7 (−)Reference shear strain (at G s = 0.722 G 0 ) 0.000170.00012
Table 8. The critical inclination angles of small-shaft-diameter helical piles that were present following a substantial decrease in load capacity based on movement and Zh/Z.
Movement (mm)
Zh/h102550
0.03435.532.5
0.136353227
0.3432.130.226.9
Table 9. Load capacity at 10 and 25 mm movements of small-shaft-diameter helical piles for different Zh/Z and load inclination angles.
U = 10 mmU = 25 mm
i (°)02040600204060
Zh/Z
0.034014430423405350591580538464
0.068027440432412360605590542468
0.102041458450425365628610560484
0.136054469460431370660642590496
0.170068473464436373.2685664610508
0.204082477469440375.6701681622518
0.272109485475445.5380727708640532
0.340136490480450381.6740720652540
0.408163492485452382.4752728662545
0.47619497487454382.8761738670549
0.544218500490457383770750678553.2
0.612245502493459383.4781756684557
0.680272509496460384789762688561
0.748299510499461384.8793770692564
0.884354511500.5464386785760692569
Table 10. Critical Zh/Z values of small-shaft-diameter helical piles where the rate of increase diminishes or becomes more horizontal based on movement and load inclination angles.
Movement (mm)
i°102550
00.120.220.26
200.120.210.26
400.120.2150.26
600.110.2150.26
Table 11. The critical inclination angles of large-shaft-diameter helical piles following a substantial decrease in load capacity based on movement and Zh/Z.
Zh/hMovement (mm)
102550
0.03431.53540
0.136283038.5
0.3426.52836
Table 12. The load capacity at 10 and 25 mm movements of large-shaft-diameter helical piles for different Zh/Z and load inclination angles.
U = 10 mmU = 25 mmU = 50 mm
i (°)020406002040600204060
Zh/Z
0.0344035386033402520806277306710512010,86810,69299708080
0.0694060388033602530809077506722512110,86610,71510,0028080
0.1034090390833802550810577626740514010,85210,72510,0208098
0.1384120394034102575813077806760515010,90710,75010,0358102
0.1724160396534502602816077856800518210,93010,71110,0608122
0.2074220404235052640823078736860524010,96810,83010,0908140
0.2764360417036052705839580587055540211,13010,97010,2308270
0.3454470427036852750872083657265552011,46311,28010,5108470
0.4144530433037402781892585307390558212,07011,79710,8858650
0.5524650444038352842912288357580573012,68212,35511,3228902
0.6904745452839102883928088957745586012,86212,54011,5309110
0.7594770455339202885933589607800590012,81012,48511,5209200
0.8284748453038902860932089537800588012,58812,28011,4029202
0.8974610434537702770918088107650575012,16011,90011,1609080
Table 13. Critical Zh/Z values of large-shaft-diameter helical piles where the rate of increase diminishes or becomes more horizontal based on movement and load inclination angles.
Movement (mm)
i°102550
00.340.380.46
200.340.380.46
400.340.380.46
600.340.380.46
Disclaimer/Publisher’s Note: The statements, opinions and data contained in all publications are solely those of the individual author(s) and contributor(s) and not of MDPI and/or the editor(s). MDPI and/or the editor(s) disclaim responsibility for any injury to people or property resulting from any ideas, methods, instructions or products referred to in the content.

