Abstract
Coastal zones experience increasing climatic and human pressures, which lead to growing risks and tipping points (TPs) under future scenarios and natural resource scarcity. To avoid crossing TPs with irreversible coastal losses, this paper proposes the development of adaptation pathways based on advanced coastal oceanography and engineering knowledge that enables a comprehensive assessment of evolving coastal risks. These pathways feature sequential interventions steered by simulations and observations as a function of available coastal resources (mainly space and sediment) and risks for infrastructure and socioeconomic assets. Such an adaptation has been developed for urban and peri-urban Mediterranean beaches, considering conventional coastal engineering together with nature-based solutions (NbS). Both types of interventions are assessed in terms of key physical variables, which serve to evaluate performance and estimate TPs. This analysis supports the new coastal protection and management plan promoted by the regional government of Catalonia and the coastal adaptation plan of the central government of Spain. The approach and results illustrate the potential of adaptation pathways for beach sustainability, enhancing the compatibility between short-/long-term coastal protection objectives under present/future climate and management scenarios. The development of adaptation pathways underpins increasing stakeholder cooperation to achieve shared decisions for coastal sustainability.
Keywords:
coast; climate; adaptation; risk; tipping-points; Mediterranean; engineering; nature-based solutions 1. Introduction
Coastal zones, particularly those of the Mediterranean, present a notable bio-/geo-diversity and experience high socioeconomic pressures, which make them particularly vulnerable to climatic changes [1,2]. Such a diversity hampers the proposal of unified solutions for coastal vulnerability assessments and adaptation plans [3,4], while the Mediterranean climate change and geo-diversity increase the uncertainties in characterizing metocean extremes [5], delineating coastal segments [6] and analyzing impacts for risk reduction [7,8].
Coastal adaptation [9] offers a flexible and holistic [10] approach to risk reduction in terms of key parameters, mainstreaming resilience into coastal management plans. These plans should, in our case, explicitly consider Mediterranean weather variability [11,12] under future scenarios [12], together with the multiple infrastructures affecting coastal dynamics and supported by GIS and statistical tools depending on site-specific criteria [13,14]. Adaptation plans should be tailored to the features of the analyzed coastal archetype [15], considering its socioeconomic and biophysical features, as well as the limitations imposed by the availability of resources, such as freshwater or sediment [16], commonly affecting coastal Mediterranean archetypes.
These limitations particularly affect deltas [17], small islands [18] and cities [19], where urgent adaptation is required to reduce vulnerability and risk under present and future climates [7,20,21,22]. Urban and peri-urban beaches are the coastal archetype selected in this paper to develop a set of adaptation pathways under climate change conditions in support of the transformative change promoted by the local government of Catalonia (new Coastal Protection and Management Plan (CPM plan for short)). These pathways have been delineated for two coastal profiles, representative of high- and mid-levels of artificialization, aiming to reduce risks on low-lying coasts and illustrating how environmental research can support new coastal policies and lead to actionable adaptation plans.
Adaptation pathways can support decision making [23] under transient climate and management scenarios, eschewing tipping points (TPs) that would make beach recovery unlikely [24] and, therefore, contributing to a more transparent governance for coastal risk reduction [25]. The adaptation pathway framework combines different scales [26] and stakeholders [10] to propose sequenced interventions that look for a transformative socioeconomic consensus in heavily anthropized areas [22,27]. Such consensus and the convergence of stakeholder criteria are based on an explicit assessment of synergies and tradeoffs for the proposed coastal interventions, including estimations of costs, impacts and carbon footprint. Based on the proposed dynamic adaptation plans and risk assessments [28,29,30], the actionable interventions can be assessed and ranked according to risk reduction, estimated as a function of key physical parameters that integrate the complex social–ecological dynamics of the coastal system.
Because NbS take a longer time to develop and deliver ecosystem services, adaptation pathways with NbS should include a monitoring and maintenance plan supported by an early warning system (EWS) based on numerical models [31] or metamodels [32] that underpins proactive decisions. Risk is measured by the distance to TPs, which also determines the urgency to implement the proposed interventions within an adaptation plan that considers uncertainties and proposes limit dates for interventions as a function of co-decided objectives for risk reduction [33] according to stakeholder criteria.
The coastal stretch selected for adaptation presents fine and coarse sand beaches with rigid coastal infrastructure and impulsive storms, which condition adaptation capacity and criteria to rank actionable interventions [34,35]. The resulting adaptation pathways are steering adaptive management decisions according to co-designed objectives that avoid tipping points and mainstream environmental values into coastal policies [36,37]. Adaptation, based on a convergence of criteria for interventions, considers the efficiency of implemented measures under projected climate and management scenarios. Building upon new hybrid protection techniques (conventional and NbS), new funding mechanisms and more supportive governance, the adaptation promotes a convergence of stakeholders’ political and socioeconomic criteria.
Such convergence is leading to a transformation of governance mechanisms, illustrated by the participatory process in the new CPM plan, which considers, from a holistic perspective, key social–ecological interactions [38], aiming to increase the acceptability of the proposed coastal interventions by showing explicitly the achieved risk levels [39]. Such risk assessments require, because of the underlying uncertainties, ethic-based approaches that aggregate different values and socioeconomic criteria, sweeping the full range of actionable interventions for a wider social engagement [8,40].
Based on a combination of observations and modeling, this paper develops and applies the adaptation pathway model for two vulnerable coastal stretches on the Catalan (Spanish Mediterranean) coast, considering the common legal and administrative constraints and their differential social–ecological traits. Both stretches are typical of urban and peri-urban beaches in the Mediterranean, covering the case of coarse and fine sand sediments and two contrasting levels of anthropic pressure. The coarse sand beach, located north of Barcelona, features high first-line buildings and private industries, with limited accommodation space and is located at the downstream end of a littoral cell. The fine sand beach is within a deltaic system, south of the Barcelona harbor (downdrift the harbor according to the average direction of net longshore transport under the present climate), but with some available accommodation space. Both coastal stretches are currently experiencing strong erosion and have been analyzed for the same future climate scenarios and horizons. The paper presents the developed adaptation pathways, analyzing the differences between fully rigidized and partially flexible coasts, represented, respectively, by the coarse and fine sand beaches. This paper ends with a review of the main barriers and enablers to a coastal adaptation that enhances resilience ([8]), suggesting criteria to implement the proposed adaptation pathways by all involved stakeholders.
2. Materials and Methods
The materials considered in this paper are the initial characteristics of the selected coastal archetype [22], the projected evolution rates, the downscaled climate scenarios and, finally, the portfolio of proposed interventions. The main output of the proposed methodology is the set of adaptation pathways [41], the derived risk estimations and the proposal for a more equitable distribution of scarce resources such as sand or coastal accommodation space.
2.1. Coastal Archetype and Profiles
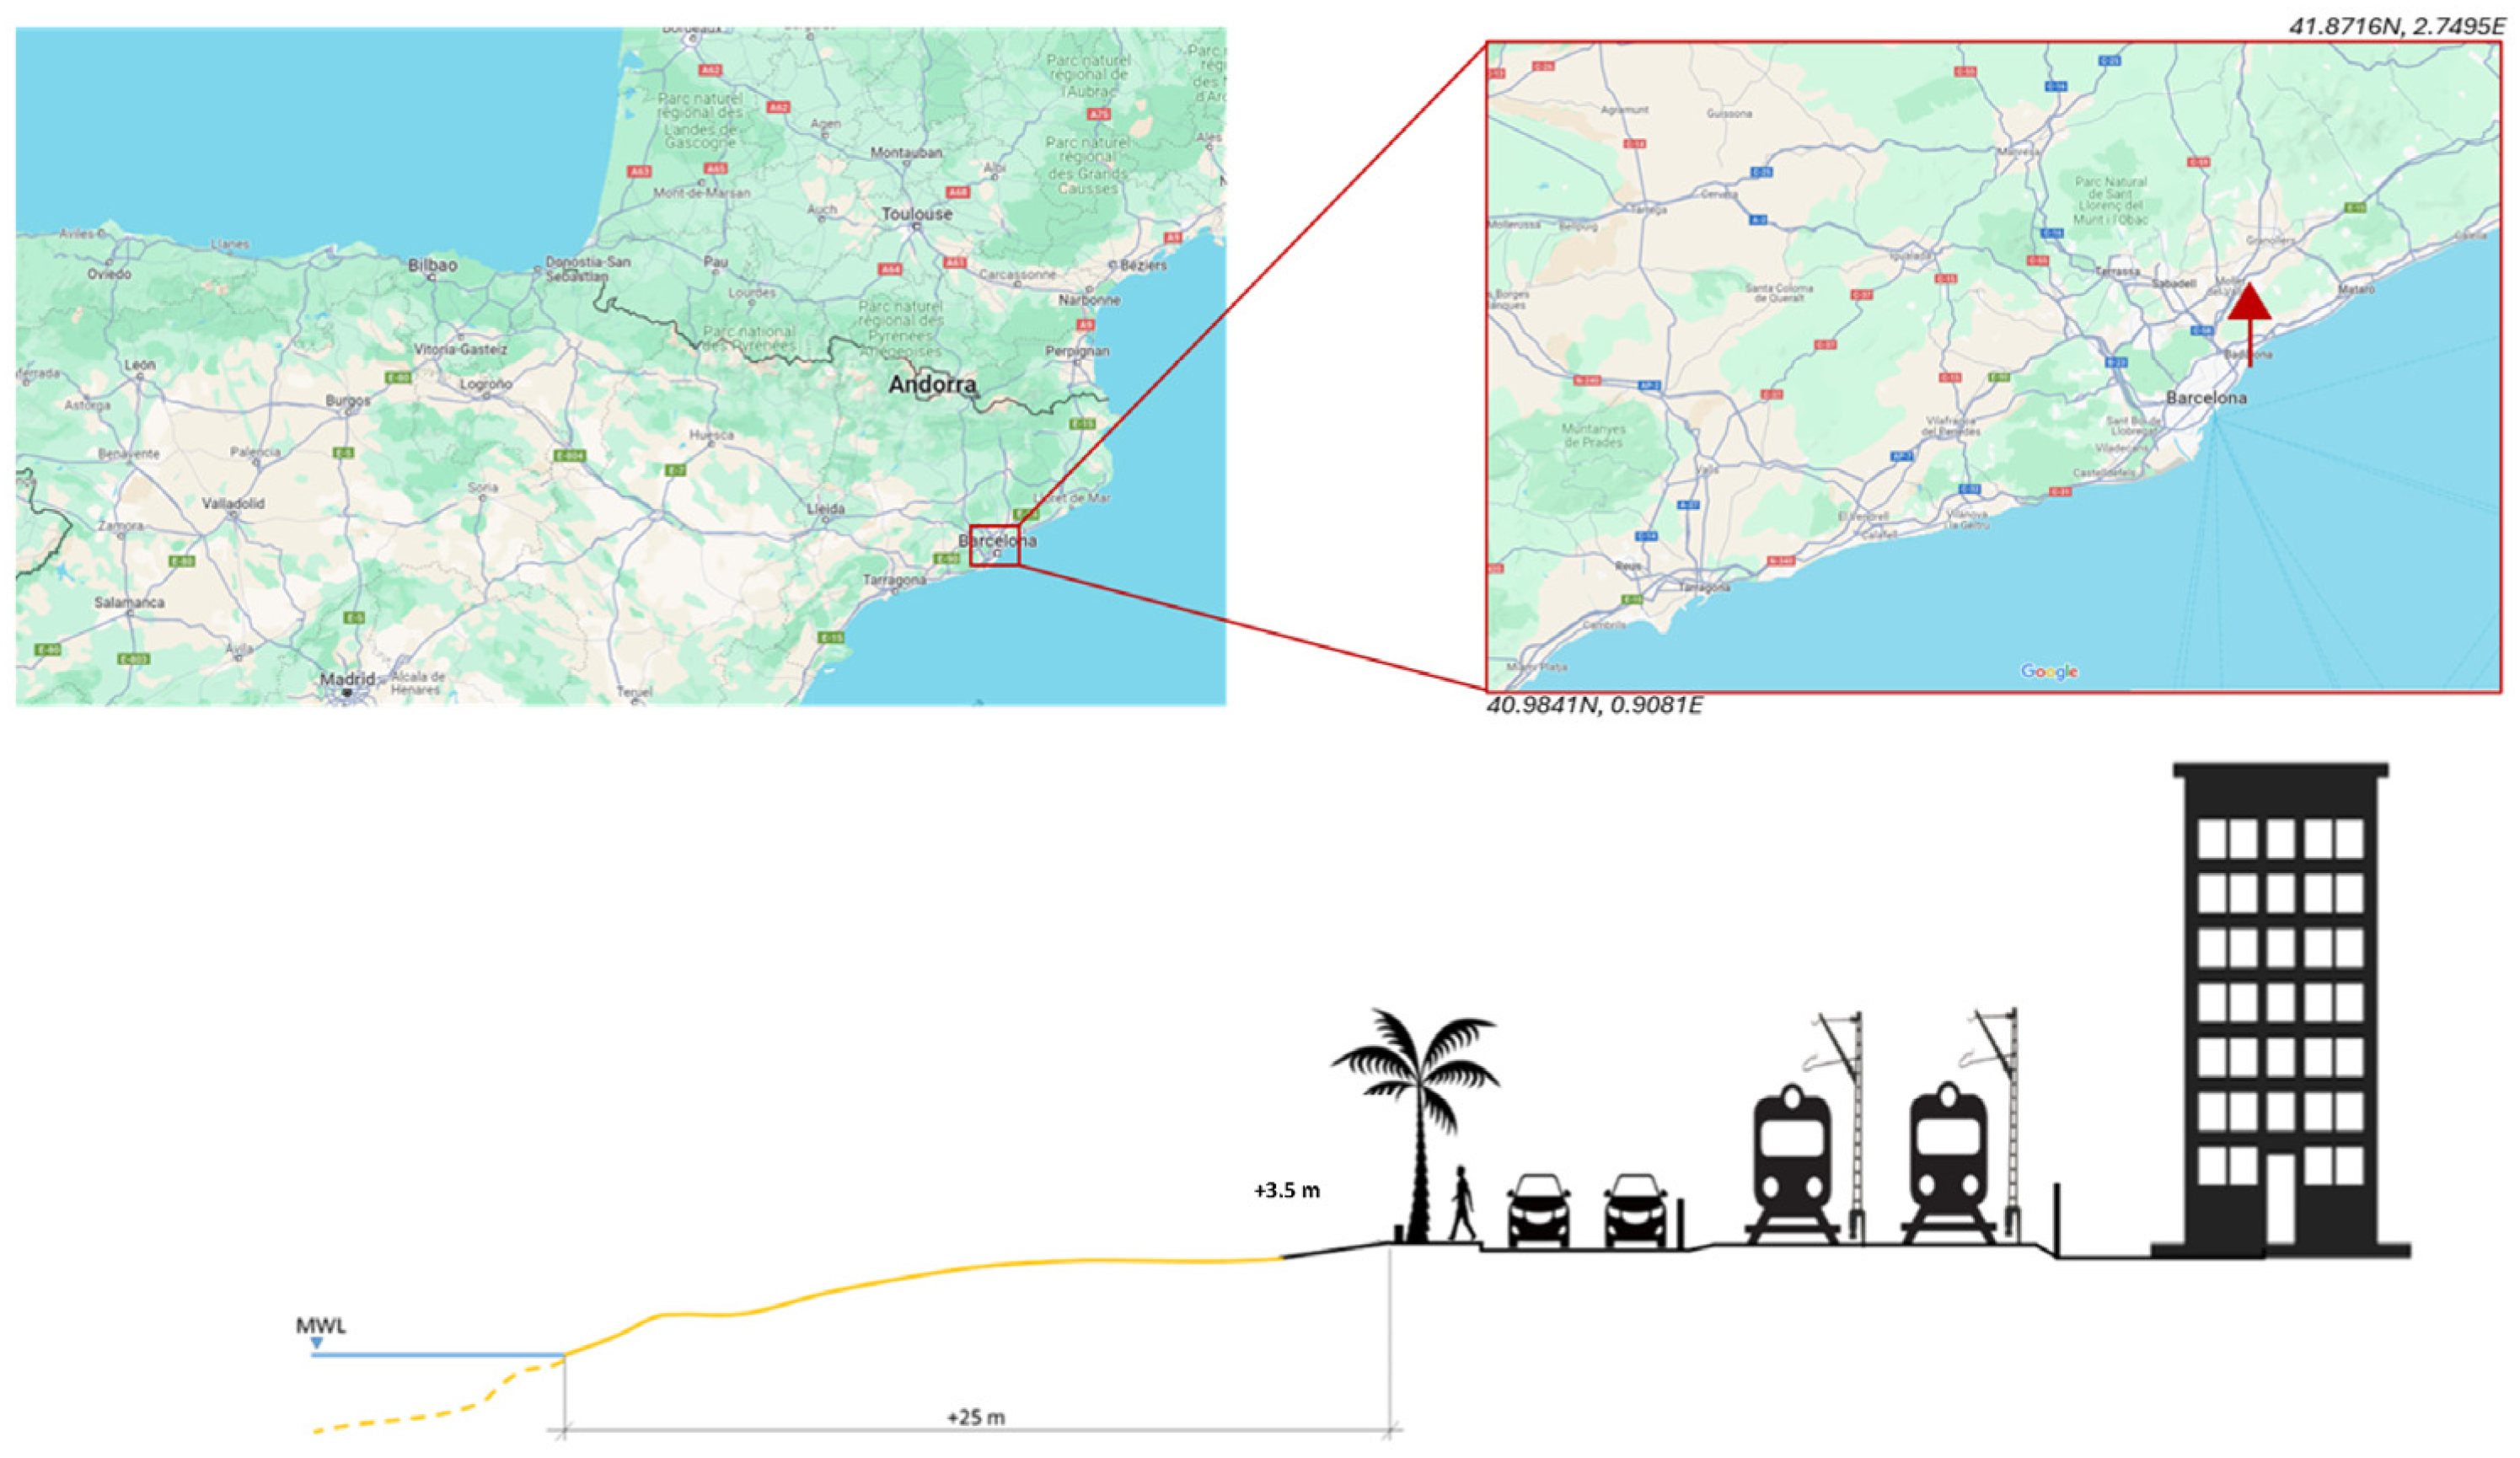
The archetype selected corresponds to urban Mediterranean (anthropized) beaches, which experience erosion under present conditions and, therefore, require an adaptation plan to reduce future risks, combining adaptation with a reduction of the carbon footprint associated with coastal protection to align coastal adaptation with climate mitigation by incorporating NbS. The first coastal profile within this archetype represents beaches without back-beach accommodation space and strong urban development, with high pressures of co-existing and often incompatible uses. This is illustrated by the Badalona beach, located north of Barcelona (NE Mediterranean Spanish coast), featuring coarse sand and a high berm up to 3.5 m (Figure 1). The small available beach width places this coastal stretch close to its maximum tourist carrying capacity in the summer, while the coarse sand (D50 = 0.96 mm) reduces actual sediment transport. This coastal profile is at the downdrift end of a physiographic unit, with multiple harbors, groins and longitudinal revetments. Because of this, there have been no recent artificial nourishments to maintain a beach width of about 15 m, which is the beach area that emerged with the highest occupation density [26]. Longshore transport is responsible for the mid–long-term morphodynamic response, while cross-shore transport dominates beach response under storms, leading to a baseline erosion between 0.5 and 1.0 m/year.
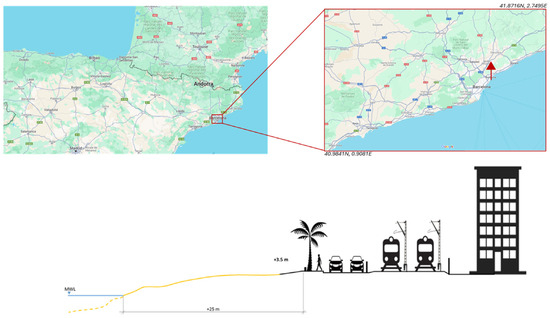
Figure 1.
Representative profile for urban Mediterranean beaches without accommodation space, illustrating (based on the Badalona beach—location is displayed in the upper panel) a heavily rigidized coastal fringe with coarse sand and a high berm level. Coordinates in latitude and longitude are indicated for opposite vertices of the studied coastal stretch.
The second coastal profile within this archetype represents a deltaic Mediterranean beach subject to moderate subsidence and with fine sand (D50 = 0.30 mm), featuring a lower berm of about 1.5 m. The beach profile presents several sub-horizontal berms resulting from wave storm actions, and there is enough accommodation space at the back beach (Figure 2), which is associated with a lower urbanization pressure. The available beach width is, however, too narrow to reduce erosion and flooding risks to acceptable levels under present wave storms, which has required artificial nourishment and periodic revamping of the back-beach promenade. This coastal transect is located within a littoral cell directly exposed to wave action, without breakwater/groin barriers that would lead to complex nearshore circulation patterns. As for the previous case, longshore transport is the main dominant factor for the mid–long-term morphodynamic response, while cross-shore transport dominates cross-shore storm impacts, leading to baseline erosion rates from 1.0 to 1.5 m/year.
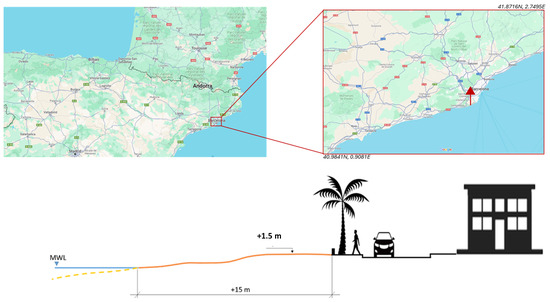
Figure 2.
Representative profile for urban Mediterranean beaches with some accommodation space, illustrating (based on the Gavá beach—location is displayed in the upper panel) a moderately rigidized coastal fringe with fine sand and a low berm level. Coordinates in latitude and longitude are indicated for opposite vertices of the studied coastal stretch.
The profiles analyzed enable an adaptation comparison for (a) rigidized urban beaches (Badalona case) with no accommodation space and coarse sand and (b) peri-urban beaches with partially regulated dynamics (Gava case) with accommodation space and fine sand. The dominant socioeconomic typologies for the considered beaches range from predominantly working class and residential population, associated with socioeconomic inequalities (urban beach), to a more affluent population combined with tourism and presenting smaller socioeconomic inequalities (the peri-urban beach). In both cases, the governance is fragmented, combining municipal, regional and central government stakeholders, as is typical of many Mediterranean beaches. The central government is responsible for the public domain coastal fringe and, therefore, for any protection measures they implement. The regional government tackles land uses and urbanization while managing beach usage and other temporary interventions. Local authorities, represented by involved municipalities, establish local constraints and preferences and act to balance general criteria with place-based interests. However, in both considered municipalities, there is good organization and solidarity, although the social commitment and sense of place are considered to be higher for the urban beach. The urban beach (northern profile) can be considered an illustration for cases without accommodation space and permanent maintenance needs, while the peri-urban beach (southern profile) represents a sediment-starved coastal stretch, offering some natural resilience and being affected by deltaic subsidence.
2.2. Coastal Adaptation Pathways
Adaptation pathways [8,10,41,42] offer a structured approach to develop and implement coastal protection measures as a function of evolving risk levels. The pathways here developed combine (a) risk reduction by means of NbS or hybrid interventions (NbS + conventional coastal engineering solutions), (b) sequences of interventions that provide a smooth transition from short- to long-term interventions (compatibility between short to long-term coastal protection), (c) maintenance plans based on monitoring to assess the distance to tipping points (for proactive decisions) and (d) regular presentation of results for socioeconomic engagement (shared compromise).
The proposed adaptation, steered by monitoring and maintenance, is based on proactive decisions linked to an EWS in support of new regional environmental and territorial policies, illustrated here by the new CPM plan (Pla de Protecció i Ordenació del Litoral a Catalunya) of the local government (Generalitat de Catalunya). The selected adaptation pathways favor (a) preventive actions that reduce costs and impacts and that apply the precautionary principle, (b) consensus decisions that minimize total costs (environmental, social and political) and provide a clear socioeconomic benefit so that there is social acceptance and (c) evidence-based demonstrations from a set of pilot interventions, in particular NbS, that enable fine-tuning the engineering required by NbS.
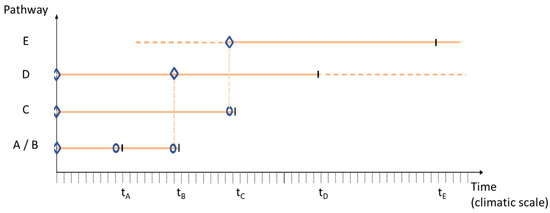
Based on stakeholder requirements and dominant hydro-morphodynamic processes, five alternative pathways have been developed, which represent technical flexibility, economic suitability and social acceptability for the studied archetype. The first pathway (Figure 3) consists of artificial nourishment supplemented by conventional structures (seawalls and groins) to reduce short-term risks, albeit with large impacts and costs. It represents maintaining the present coastal protection approach and is denoted as pathway A, which, based on the recent past experience, has a limited life cycle (tA, estimated in the following sections) linked to an increasing sand scarcity and significant environmental impacts. It presents growing costs and mixed social acceptance based on participative forum results, showing that those more exposed favor rigid short-term interventions, while those with a longer-term view lean toward more sustainable (lower costs, impacts and carbon footprint) interventions.
Pathway B complements pathway A and consists of artificial sand nourishment with combined NbS (limited volume artificial nourishment mimicking natural accretionary forms) and rigid structures (hybrid interventions), representing the expected evolution of pathway A, due to the increasing inefficiency of rigid engineering solutions under decreasing sand and sea level rise (SLR). Because of that, pathway B has a longer life cycle (tB (tB > tA)). Pathways A and B correspond to an increasingly rigidized coastline, with growing risks and maintenance costs under SLR and changes in wave storminess due to the lack of natural resilience for a rigidized coast [43]. The expected increase in the carbon footprint for progressively larger rigid defenses and increasing frequency of shore nourishments make it necessary to introduce pathways with a longer life, such as C or D (Figure 3).
Pathway C corresponds to a totally rigidized coast, with increasing costs and environmental impacts, as well as a progressively more unacceptable carbon footprint, which should be considered technically and socioeconomically from the beginning of this pathway. Such a pathway is possible for the analyzed coastal profiles, although the projected acceleration in SLR and more frequent extreme wave storms will increase risks and costs, and, therefore, the rigidized coastline performance is expected to slump after time tC. Moreover, pathway C would hinder the transition toward decarbonized coastal protection based on either NbS (pathway D) or managed realignment (pathway E). The hurdles for a transition from pathway C toward pathway D or E are linked to the investments required by pathway C, which include high social, economic and environmental costs. The political and image costs associated with the deconstruction of rigid interventions can make such a transition unacceptable.
Pathway D, involving NbS with some remaining rigid structures for areas without any accommodation space, will feature, according to the performed assessments, increasing risk reductions under climate change, with a carbon footprint and costs significantly smaller than for traditional coastal protection. Because of that, pathway D is projected to last longer than C, considering that it also enables a better distribution of interventions and investments, as is typically the case for NbS [43], which leads to an optimization of costs, impacts and carbon footprint.
Pathway E corresponds to managed realignment, considered from the beginning, although this trajectory presents greater difficulties for a wide socioeconomic acceptance until time tC. At that moment in time, present coastal interventions linked to rigid infrastructure or continued nourishment will have shown their increasing limitations under accelerated SLR and wave storminess. Because of socioeconomic acceptability, present governance will more naturally support a late start of pathway E, which can be continued without a clear deadline since this deadline will be linked to available accommodation space and land planning.
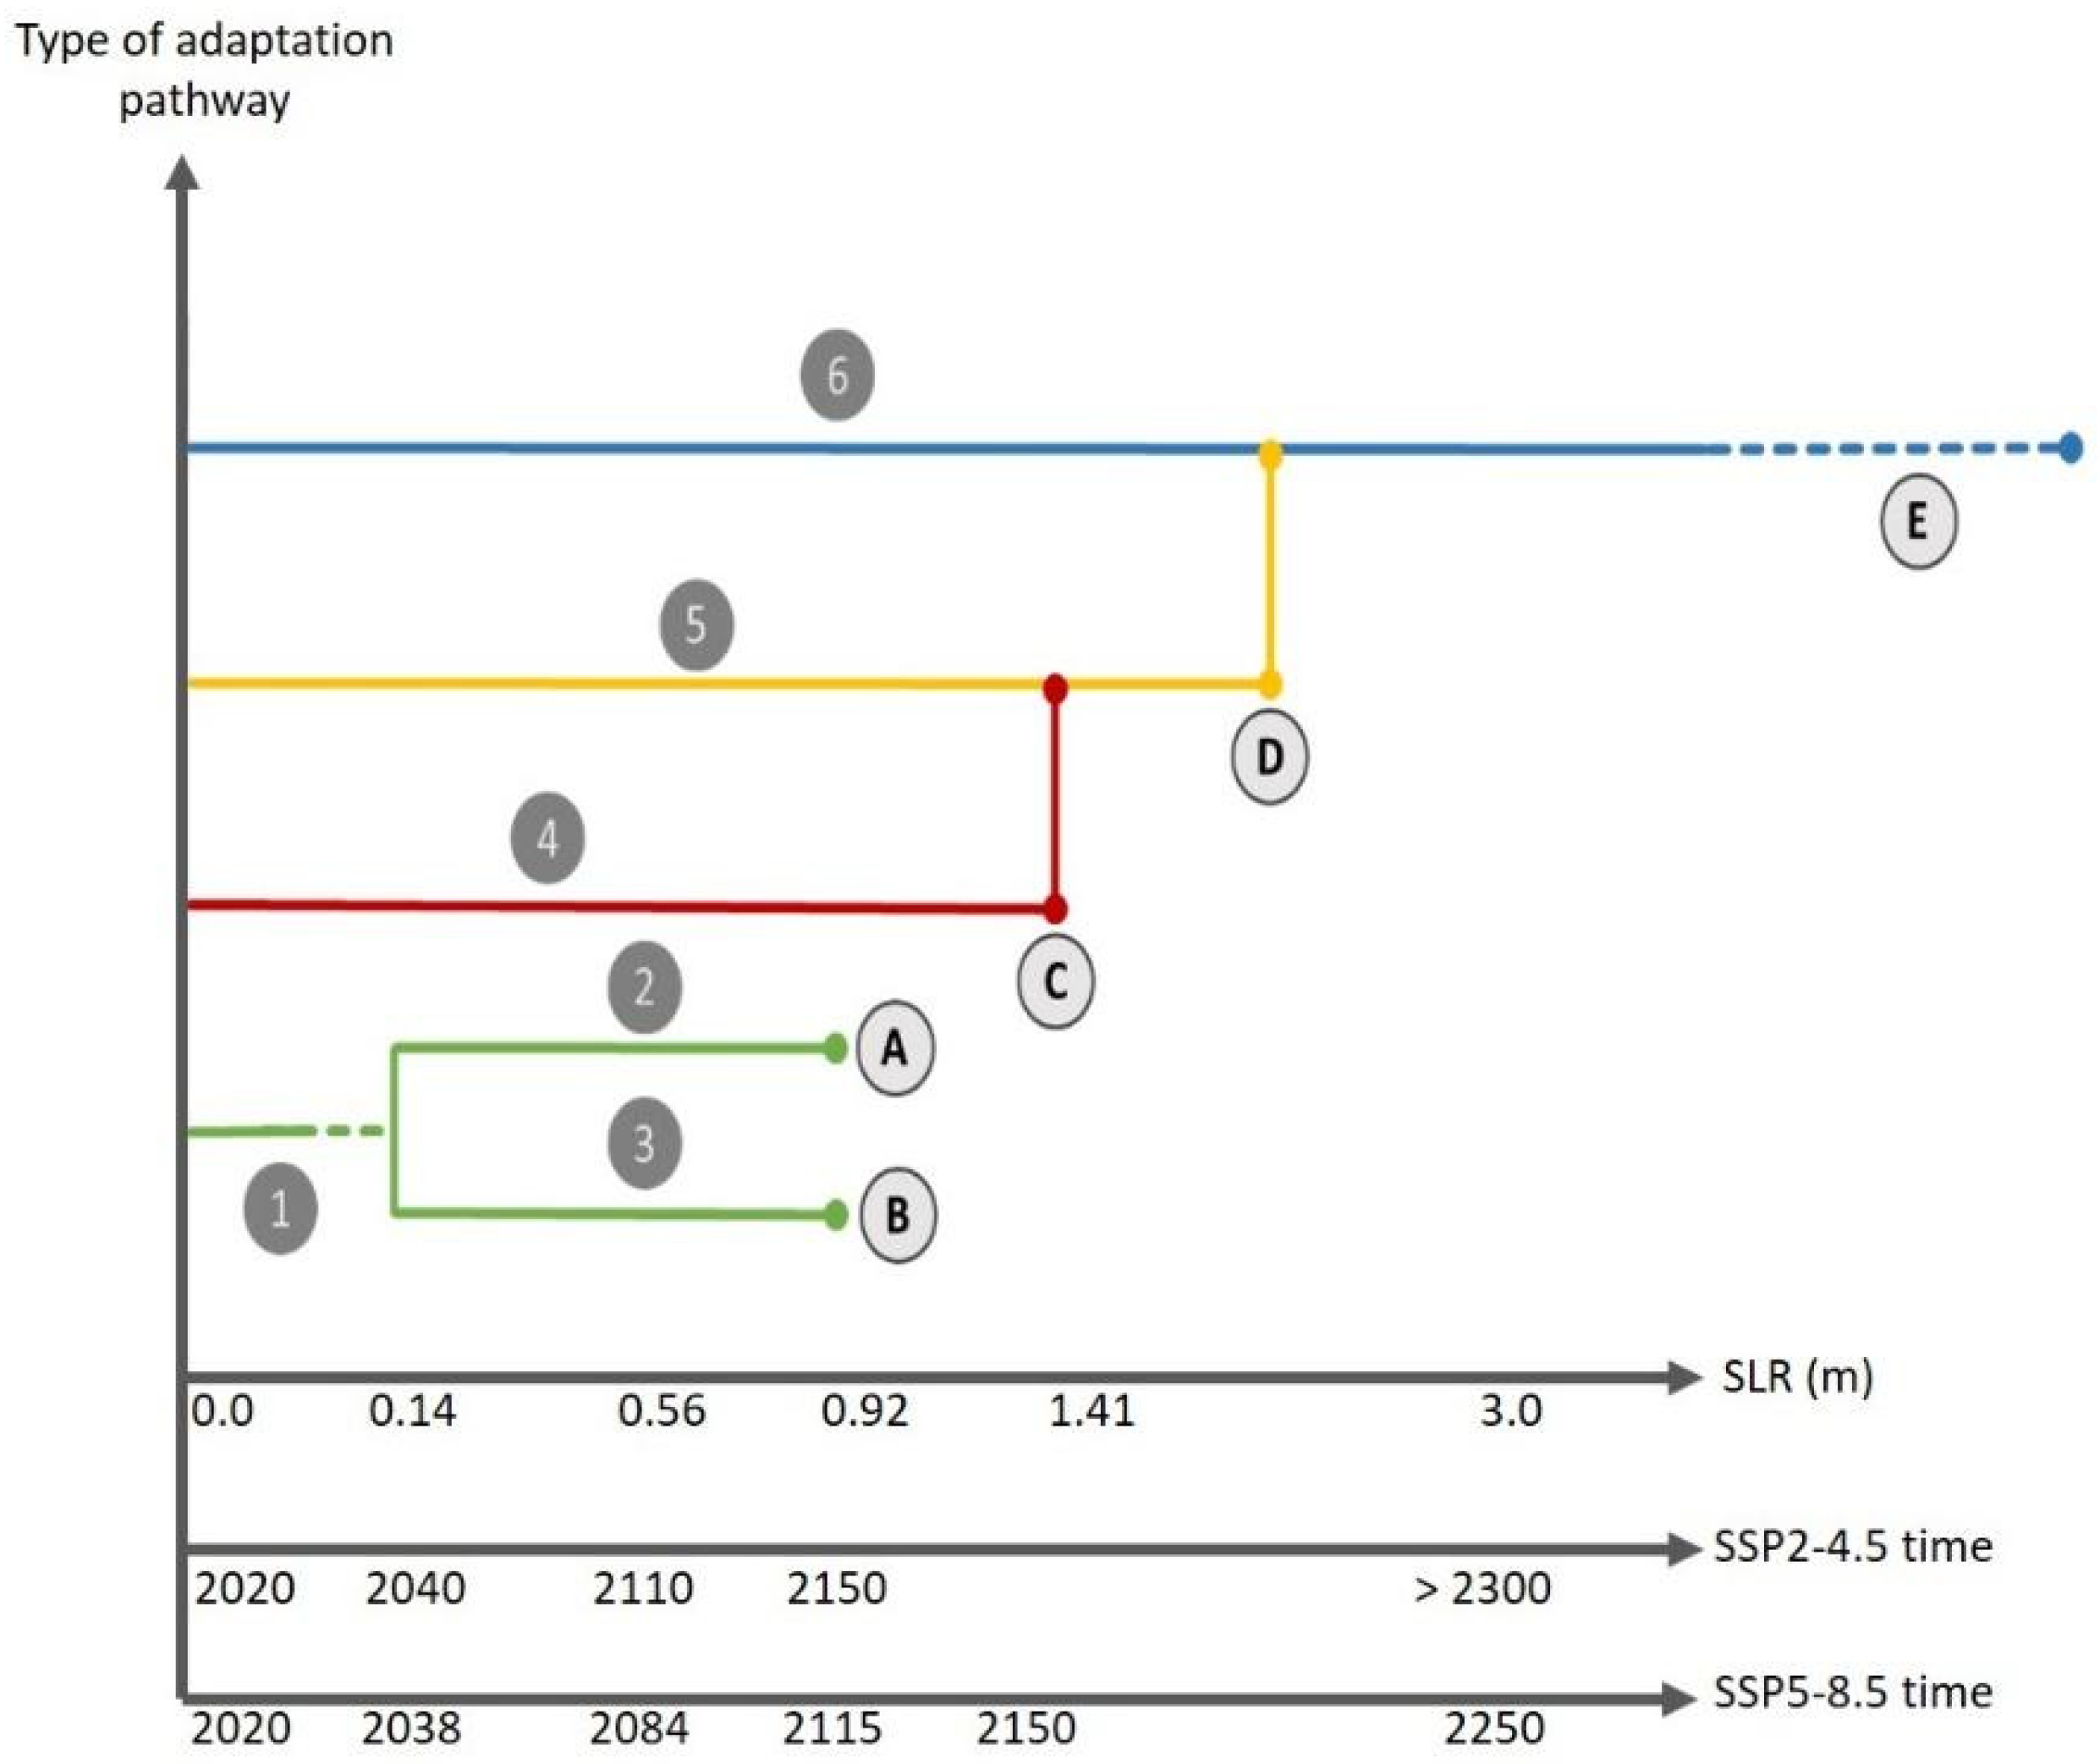
The adaptation pathway map (Figure 4) shows tipping points (TPs) associated with limits in accommodation space, available sand/freshwater volumes or bounded by some irreversible coastal state. The actual times to reach TPs have been estimated using SLR as the basic “pressure” variable, subsequently “translated” into actual times depending on the two co-selected scenarios, SSP2-4.5 and SSP5-8.5 [44], corresponding to an average and pessimistic projection of climate change evolution.
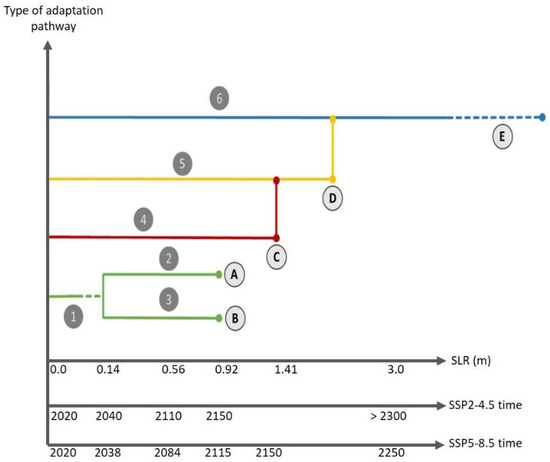
Figure 4.
Illustration of actionable adaptation pathways for the studied coastal Mediterranean profiles, including both conventional coastal engineering and NbS interventions. The horizontal axis indicates SLR as a basic (independent) variable, which is then translated into two different timelines depending on the selected climate change scenario. Tipping points are reached earlier for the pessimistic scenario (SSP5-8.5) than for the medium-level scenario (SSP2-4.5). Pathways 1, 2 and 3 represent small-/mid-scale reactive interventions (with pathway 2 representing conventional nourishment and structures, such as groins/seawalls, and pathway 3 adding some NbS interventions); pathway 4 stands for large-scale rigidization (high enough seawall supplemented by long enough groins and breakwaters); and pathways 5 and 6 are associated with mid-/large-scale restoration (5 with large nourishment volumes supplied with higher frequency) with adaptive maintenance (6 with sequential maintenance and managed realignment that optimizes the total sand volume supplied).
2.3. Climate and Management Scenarios
The proposed adaptation pathways combine the following key climate and management variables: (a) metocean drivers (waves, surges, mean sea level…); (b) geomorphological constraints (sediment volume, diameter, beach width, slope, elevation…); (c) artificial existing or planned barriers (ports, promenades, groins…); (d) present and planned beach uses (protection, tourism, ecosystem services…); and (e) maintenance and monitoring plans, including the application of an EWS. The selected future scenarios combine physical drivers with socioeconomic and policy scenarios [45], considering historical effects that condition risk memory and social adaptation capacities [24]. Management scenarios are projected to evolve from rigid coastal protection, usually preferred for short-term plans, toward more flexible NbS interventions [8,46]. Managed retreat policies will be difficult to implement until the projected tumble of conventional coastal engineering solutions becomes apparent, which will condition future policies and adaptation governance.
Projected coastal morphodynamics, mainly driven by mean sea level (MSL) rise and changes in wave storminess, present large uncertainties due to the errors associated with future sediment transport calculations [47]. Physical projections like those for SLR, based on IPCC AR6 [46] regionally downscaled values, are combined with socioeconomic projections (SSP scenarios), where the stakeholder preferred set of future conditions has been SSP2-4.5 and SSP5-8.5. The former (SSP2-4.5) corresponds to an average scenario for physical conditions and a continuation of shared socioeconomic pathways (SSP2), where social, economic and technological trends do not significantly depart from present patterns [48]. This set of possible futures is characterized by a set of shared socioeconomic pathways, where SSP2 is associated with a middle-of-the-road future in between SSP1, which represents sustainability, and SSP3, which stands for regional rivalry, and SSP4, which represents inequality. SSP2 is associated with an average increase in population in the second half of this century, and where technological challenges to reduce vulnerability persist, it represents “middle of the road” trajectories. SSP5-8.5 (pessimistic future) corresponds to enhanced global warming and accelerated SLR, whereas SSP5 represents a future scenario of innovation and participatory societies with technological progress for sustainable development. Here, social and economic development is projected to be combined with the exploitation of fossil fuels and enhanced consumption of resources and energy, underpinning a rapid increase in the worldwide economy and population, which reaches a peak and then decreases, assuming that local environmental problems are successfully managed.
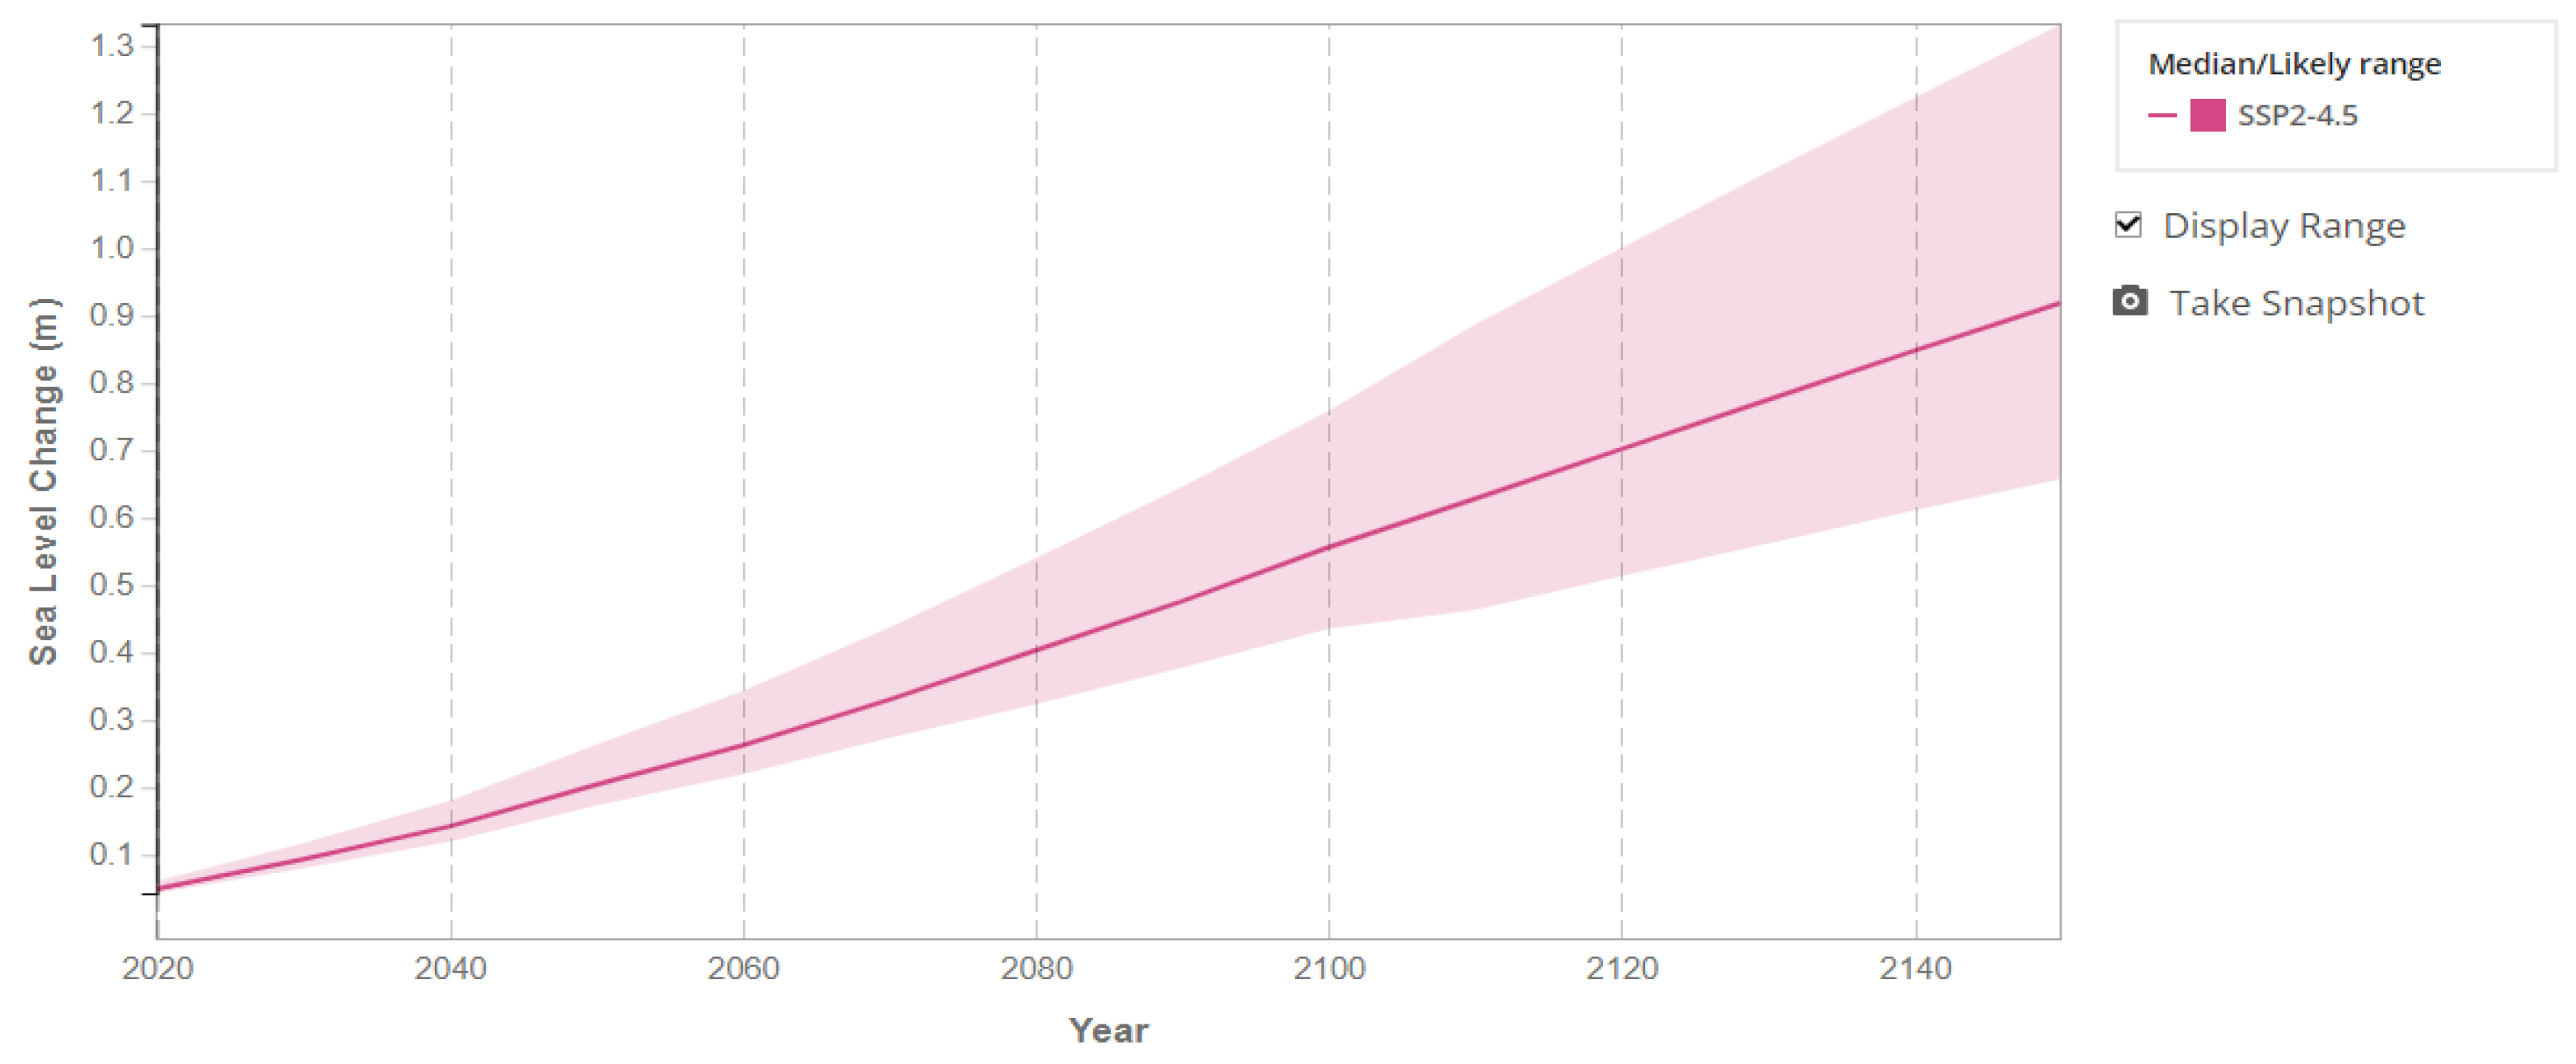
The “average” scenario, SSP2-4.5, approximately corresponds to the upper level of emissions defined for the 2030 Nationally Determined Contributions, with global warming from 2.7 °C to 3.4 °C by 2100, despite the net 0 objectives for 2050 adopted by many countries. SSP2-4.5 is supposed to prepare our coastal systems for a global temperature increase of 2.7 °C by 2100 and a regional SLR below 1.0 m (Figure 5) without considering subsidence [49].
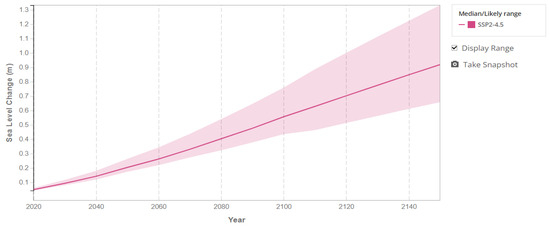
Figure 5.
Sea level rise projections for climate change scenario SSP2-4.5 and the Western Mediterranean region where the analyzed coastal archetype (located on the coast of the Barcelona province in Spain) is situated. The shadowed area, representing the likely variation range and estimated uncertainty, is based on IPCC AR6 (https://sealevel.nasa.gov/ (accessed on 6 May 2024)).
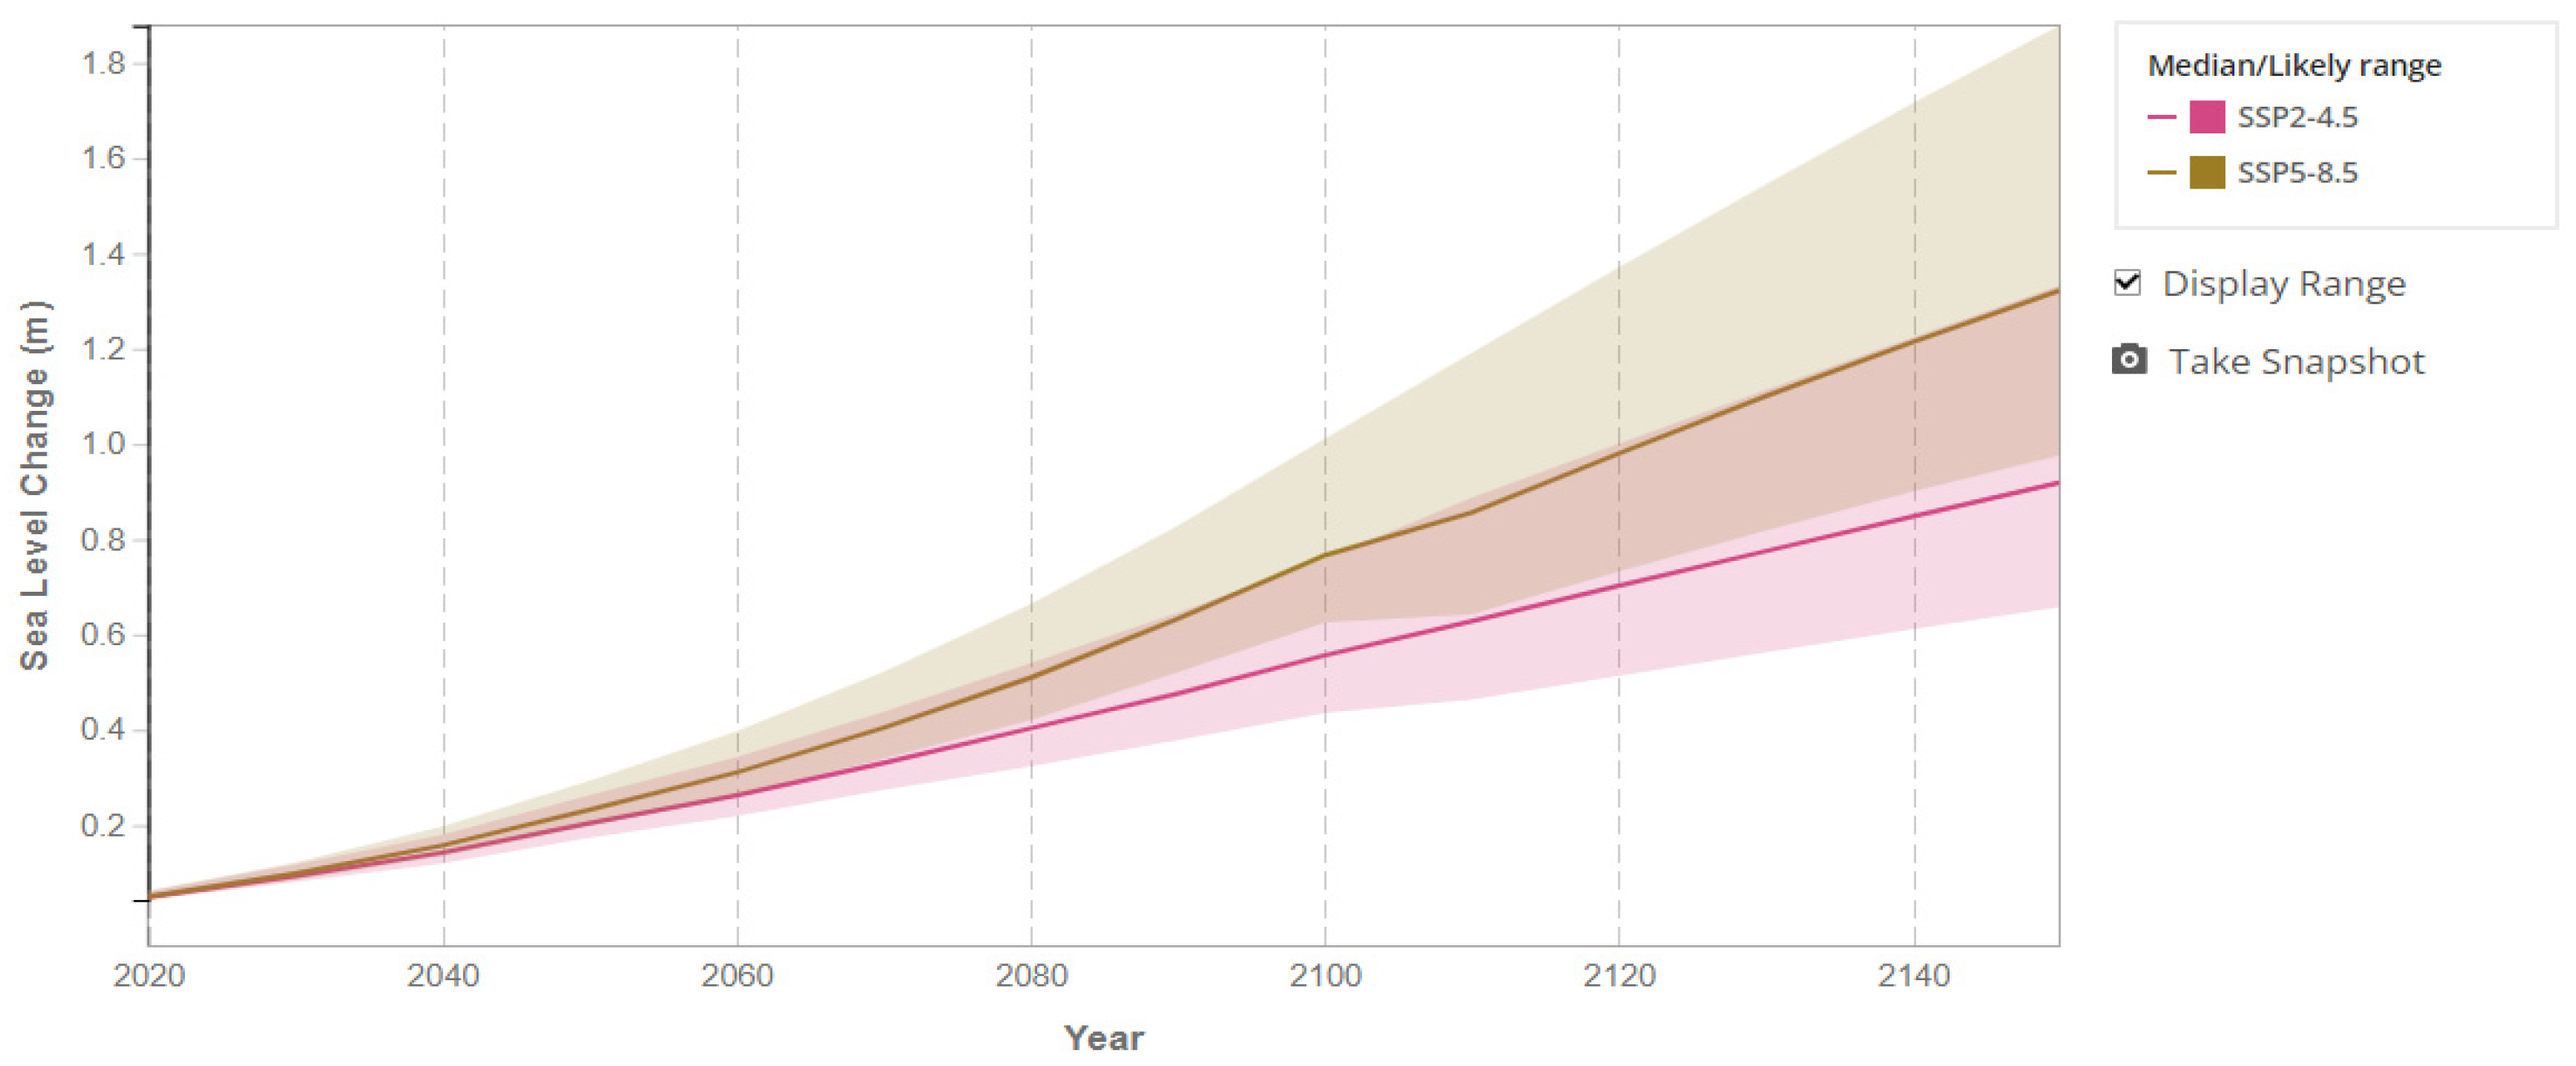
Scenario SSP5-8.5 corresponds to no additional climate policies and global and extensive use of fossil fuels during this century, with high emissions and an unfavorable climatic evolution (IPCC-AR6). This scenario is similar to the previous RCP 8.5, although with increased emissions of CO2 (about 20%) and SLR rates (Figure 6). Demographic increase is low, with a peak in global population by 2050 and a reduction to present levels by 2100. The high economic and technological development will enable a new set of technological solutions for coastal protection.

Figure 6.
Sea level rise projections for climate change scenario SSP5-8.5 and the Western Mediterranean region where the analyzed coastal archetype (located on the coast of the Barcelona province in Spain) is situated. The shadowed area, representing the likely range of variation and estimated uncertainty, is based on IPCC AR6 (https://sealevel.nasa.gov/ (accessed on 6 May 2024)).
These projections, combining biophysical and socioeconomic variables, are used to prepare adaptation pathways under climate change [45], supported by a combination of observations and simulations at different scales [49,50,51].
Future wave storm features have been inferred from data [52,53] coming from the network termed XIOM (Xarxa d’Instrumentació i Observació Marítima de la Generalitat de Catalunya), now discontinued, and from the Puertos del Estado network that combines buoys and forecasts [31]. The selected significant wave height levels are shown in Table 1, where all energetic storms come from NE, which is the dominant direction for large wave storms in this part of the Western Mediterranean. In this table, XIOM represents the locally measured data, PDE represents the data from Puertos del Estado, and PIMA represents the projections recommended by the Ministry for Ecological Transition, where the interval limits and the central estimate have been derived for the co-selected medium and pessimistic scenarios (SSP2-4.5 and SSP5-8.5). The values correspond to medium-term (2026–2045) and long-term horizons (2081–2100), considering six climatic models and 20-year windows to be comparable with other climatic assessments performed in Spain.

Table 1.
Selected significant wave heights for metocean storms with return periods of 50 and 100 years for the studied coastal archetype in front of the Barcelona province (Spanish Mediterranean coast). The values correspond to three different data sources. Based on their associated hazard levels, these values characterize the storms selected in this study to develop adaptation pathways. Wave parameters have been derived from the available data (see text), and when there is enough information, the range of variation for these data is presented within brackets ([]).
The discussion of future climate and management scenarios involving researchers and stakeholders is leading to convergent criteria to sequence coastal interventions and achieve a socioeconomic transformation. Such a transformation considers how future coastal systems will be different from present ones, with different levels of commitment and governance that incorporate new national/EU legislation (e.g., the new EU restoration law).
2.4. Portfolio of Actionable Interventions
Considering the criteria of relevant stakeholders, the two more widely accepted pathways for the studied coastal archetype, valid until 2100 and probably beyond, are (a) traditional coastal protection based on improved coastal engineering solutions that combine sand nourishment with hybrid (conventional plus NbS) interventions and (b) innovative coastal adaptation that promotes NbS from the beginning. The NbS proposed herein combine dunes and wetlands as restoration for the emerged beach (including the narrow intertidal area under the microtidal Mediterranean conditions) and seagrass meadows as replantation for the submerged beach. All three contribute to enhancing natural resilience, with dunes reducing risks for first-line (closest to the sea) infrastructures, while wetlands are designed to increase coastal resilience and facilitate self-adaptation under accelerating SLR, particularly for the deltaic profile where subsidence increases the rate of relative SLR. Seagrass meadows reduce incoming wave energy and trap sediment from upstream coastal sectors, bounding erosion and flooding risks [54]. The set of proposed adaptation pathways frames the actionable interventions for risk reduction in this coastal Mediterranean archetype.
The portfolio of protection interventions prepared includes (a) repeated artificial nourishments, (b) construction of progressively higher/wider seawalls, (c) NbS for the emerged/submerged beach and (d) managed realignment. These interventions have been tuned according to local experience (social and technical memory) and projected climate evolution, with a minimum beach width of 20 m to ensure the protection and touristic functions of the beach. These state-of-the-art interventions [55] consider local constraints and history as manifested by stakeholders and are prioritized according to effectiveness based on local experience and numerical simulations [54]. Their sequencing along adaptation pathways requires monitoring and a maintenance program, where the proposed interventions will be adapted to maintain risk reduction in spite of the uncertainties in future climatic and management conditions. The criteria to select interventions favor (a) interventions that do not lead to irreversible impacts, (b) short-term decisions that do not mortgage medium to long-term targets and (c) interventions that enable the change between adaptation pathways when getting near TPs. The final selection and ranking are based on a multicriteria assessment that combines upfront investment, maintenance costs and impact mitigation costs. Carbon footprints and the resulting shared benefits have been assessed in an aggregated manner based on local expertise, stakeholder preferences and scientific–technological knowledge, always complying with local, national and European legislation. The resulting sequence of interventions includes a plan to keep track of biophysical and socioeconomic impacts as well as carbon footprint. Such a plan incorporates criteria stemming from the risk perception and tolerance of the receiving coastal communities, considering the deep uncertainty in future scenarios, particularly socioeconomic ones. To facilitate consensus, only three horizons (2030, 2050 and 2100) have been considered, which are associated with short-, medium- and long-term protection aims and consider the different times required by rigid structures and NbS to achieve risk reduction, where NbS feature a slower performance since coastal ecosystems take a longer time to deliver their ecosystem services, although they are projected to become more competitive than conventional protection under accelerated SLR.
2.5. Aggregated Risk Estimators
For sequencing and ranking purposes, the set of coastal interventions is assessed in terms of risk, estimated as the product of hazard times the damage (vulnerability), first calculated in hydro-morphodynamics terms. This means that the main hazard probabilities considered in this assessment stem from flooding and erosion, where the key driver variables are SLR, wave storminess and surges. The key response variables are beach width, berm height and available sand volume. The expected risk value is estimated from Equation (1), where ‘A’ indicates the average economic value of the climatic-induced damages and, therefore, a measure of vulnerability. For the sake of comparisons, the A reference value for sandy beaches is taken as 1, while the corresponding one for areas with infrastructures is taken as 100, where the two-orders-of-magnitude difference is based on local values for beach surface and first-line infrastructure.
The difference of values in the denominator ( representing the cross-shore beach coordinate) indicates the remaining beach width at any time horizon with respect to an initial value of 0. This difference is denoted by marge in Equation (2), which represents a compact form of Equation (1) for stakeholder discussion. The variable can also denote berm height and beach volume, depending on the risk assessment performed, and it is projected to evolve according to the key driver variables selected. For the case of beach width, will decrease with time until it reaches a minimum beach width of 20 m (climatic alarm level) and 15 m for the TP. These thresholds are based on available experience [3] and stakeholder criteria to ensure the beach can provide successful protection and touristic functions.
base in risk Equation (1) denotes the baseline erosion derived from the Green Book of the Catalan coast [56], applying an asymptotic trend since the calculated shore retreats in the Green Book correspond to the 1995–2005 decade and, therefore, cannot be indefinitely extrapolated. This asymptotic trend is based on an exponential decrease in erosion rates with time, indicating a trend toward coastal dynamic equilibrium. Given the uncertainty of these projections beyond 2030, the same erosion rates adjusted to dominant sediment sizes have been applied for the two studied profiles to facilitate comparisons between profile evolution as a function of time horizon and interventions.
SLR corresponds to the erosion due to relative SLR, evaluated with a Bruun rule adapted to the littoral Catalan [57], which can be written as in Equation (3), where SLR is the rate of relative sea level rise, and is the dissipation width for incoming waves until the depth of closure (). indicates the berm height derived from field measurements, and is obtained from a combination of field data and calibrated beach equilibrium profile formulations.
storm represents beach erosion due to a sequence of storms characteristic of a typical (average) stormy period in this part of the Mediterranean, corresponding in this work to return periods of 50 years and 100 years. This range of return periods allows for assessing the sensitivity of TPs to different climatic scenarios. Considering available wave time series (up to 30 years length), the risk assessment has been performed with (a) 50-year return period wave storms, projected to happen at horizons 2080 and 2150 and (b) 100-year return period wave storms, projected to happen at horizons 2030 and 2100.
All adaptation pathways have been delineated from “present” conditions (with the year 2022 representing the period from 2017 to 2022) until 2150 as a common final horizon for the comparison that includes some future after 2100. In all pathways, the set of projected impulsive wave storms was the same. The sequence of projected storms to estimate risks, in agreement with stakeholders, features (a) energetic wave year (with 100-year storm) at the beginning of the assessment period (fixed at 2030), (b) medium wave year (with 50-year storm) with increased SLR for the 2080 horizon, (c) new energetic year (with 100-year storm) with high MSL for the 2100 horizon and (d) new medium year (with 50-year storm) and including the cumulative effects of SLR and background erosion.
The sequence of proposed interventions for risk reduction, following the criteria of key stakeholders, has taken into account (a) projected evolution of physical climatic variables (SLR, wave storms and surges), (b) availability of sedimentary material (quality and quantity), (c) evolution of coastal population density (as a measure of coastal rigidization) and (d) past interventions (as a measure of socioeconomic criteria and funding commitment). Risk estimators parameterize the role of NbS for (a) submerged beach (restored seagrass meadows), (b) intertidal beach (reconstructed wetlands) and (c) emerged beach (staggered embryo dunes). The NbS parameterization for wave storm erosion is between 0.4 and 0.6 (modulated by sediment size and availability), while for background erosion, based on past experience, simulations and consensus, it has been estimated between 0.6 and 0.7. The proposed NbS will have a more limited effect under extreme wave events, and because of that, a 0.0 factor has been applied to future energetic storms.
Artificial nourishment has been sequenced as a function of the remaining beach width, aiming for a minimum width of 20 m and a tipping point of 15 m as a limit to urgently start a new sand nourishment operation. The co-selected horizons (2030, 2050 and 2100) for the comparison are to be reviewed depending on future SLR, storms and performance of the executed interventions. The proposed artificial nourishment can be assimilated to small-scale “sand engines” [58,59] that are regularly maintained to ensure durability because of the limited sand volumes available in the studied coastal archetype.
3. Results for Urban and Peri-Urban Beach Adaptation
The analysis for urban beaches, less prone to adaptation due to the lack of accommodation space, starts with a projection of future shorelines considering the proposed sequence of storms supplemented by background and SLR erosion (scenario-dependent). For SSP2-4.5, the urban beach “disappears”, i.e., it reaches the minimum acceptable width by 2075, while for the pessimistic scenario SSP5-8.5, this happens some decades before. This means that the present beach configuration, with a minimum acceptable beach width of 20 meters and an initial beach width oscillating around 50 meters, will “last” until 2070, when hinterland urban areas will start to experience strong impacts, which are not easily acceptable with present socioeconomic criteria. Table 2 and Table 3 show the sequencing of interventions proposed for each adaptation pathway as a function of the remaining beach width and for the two selected scenarios. Critical interventions within pathway A have to start under the two scenarios by 2080, although the transition to pathway B should happen, based on technical and economic criteria, at around 2100 for the pessimistic scenario SSP5-8.5 and at around 2110 for the more optimistic scenario SSP2-4.5. At these horizons, corresponding to the transition from pathway A to pathway B, a possible “change of station” to pathway C or pathway E, representing, respectively, NbS or managed realignment, is also considered.
Table 2.
Estimated coastal evolution (erosion/accretion) rates for the moderately rigidized coastal profile (Figure 2) and medium climate change scenario SSP2-4.5. The left-side column indicates the timeline for coastal evolution under climate change and with the proposed interventions. The rest of columns indicate (from left to right) the key physical variables used as indicators for each pathway. These variables are explained in detail in the main text. The boxes in grey (left column) indicate the occurrence of an energetic storm (sequence described in the text) and the boxes in ochre indicate tipping points associated with the different pathways.
Table 3.
Estimated coastal evolution (erosion/accretion) rates for the moderately rigidized coastal profile (Figure 2) and pessimistic climate change scenario SSP5-8.5. The left-side column indicates the timeline for coastal evolution under climate change and with the proposed interventions. The rest of columns indicate (from left to right) the key physical variables used as indicators for each pathway. These variables are explained in detail in the main text. The boxes in grey (left column) indicate the occurrence of an energetic storm (sequence described in the text) and the boxes in ochre indicate tipping points associated with the different pathways.
The key physical variables used as steering indicators for each pathway can be summarized as follows. For A + B, the key physical variables are as follows: (1) the initial value of the additional beach width generated by maintenance interventions (artificial nourishment); (2) the temporal evolution of the remaining beach width after the interventions, subject to projected wave, surge and sea-level rise conditions; and (3) the hinterland width affected by shoreline retreat, considering the effect of the interventions under climate change. For pathway C, the key physical variables are as follows: (4) the beach advance/retreat associated with coastal rigidization and (5) the remaining beach width for a rigidized coast (progressive rigidization). For pathway D, the key physical variables are as follows: (6) the beach width remaining after the combined effect of background erosion, sea level rise retreat and cumulative storm erosion (see text for a more detailed explanation); (7) the initial value of the additional beach width generated by maintenance interventions; and (8) the temporal evolution of the remaining beach width after the interventions, subject to projected wave, surge and sea-level rise conditions. The boxes marked in grey (left column) indicate the occurrence of an energetic storm according to the sequence described in the text. The boxes marked in ochre indicate the times tA, tB, tC and tD (see Figure 3), which represent tipping points associated with the different pathways considered.
Pathway C, following stakeholder criteria, is suggested to start by 2070 and is projected to last until 2120 for the pessimistic SSP5-8.5 scenario, where the seawall would have to be higher than 1.5 meters to maintain its functionality. Since this height is considered the acceptable limit by stakeholders due to barrier intrusiveness and maintenance costs, a TP has been defined for that barrier level. Pathway E, for the urban coastal profile, consists of seagrass meadows because the lack of back-beach space for accommodation or realignment makes it compulsory to act on the submerged beach. Restored seagrass meadows would suppose a continuation of the submerged seagrass corridor that existed along this coastal stretch, which is still observable in some upstream (NE) sectors. Depending on the meadow type and environmental conditions, a development may result that, under natural conditions, might be too slow for societal coastal protection demands, therefore requiring some artificial transplantation or hydrodynamic protection to speed up development. Emerged beach NbS can only be deployed locally for sub-sectors that provide enough width to construct embryo dunes to enhance natural beach roughness and, thus, resilience under waves and storm surges [8]. Such small-scale dunes can be made more resilient by greening with salt-tolerant vegetation that will make back-beach sediment less prone to erosion.
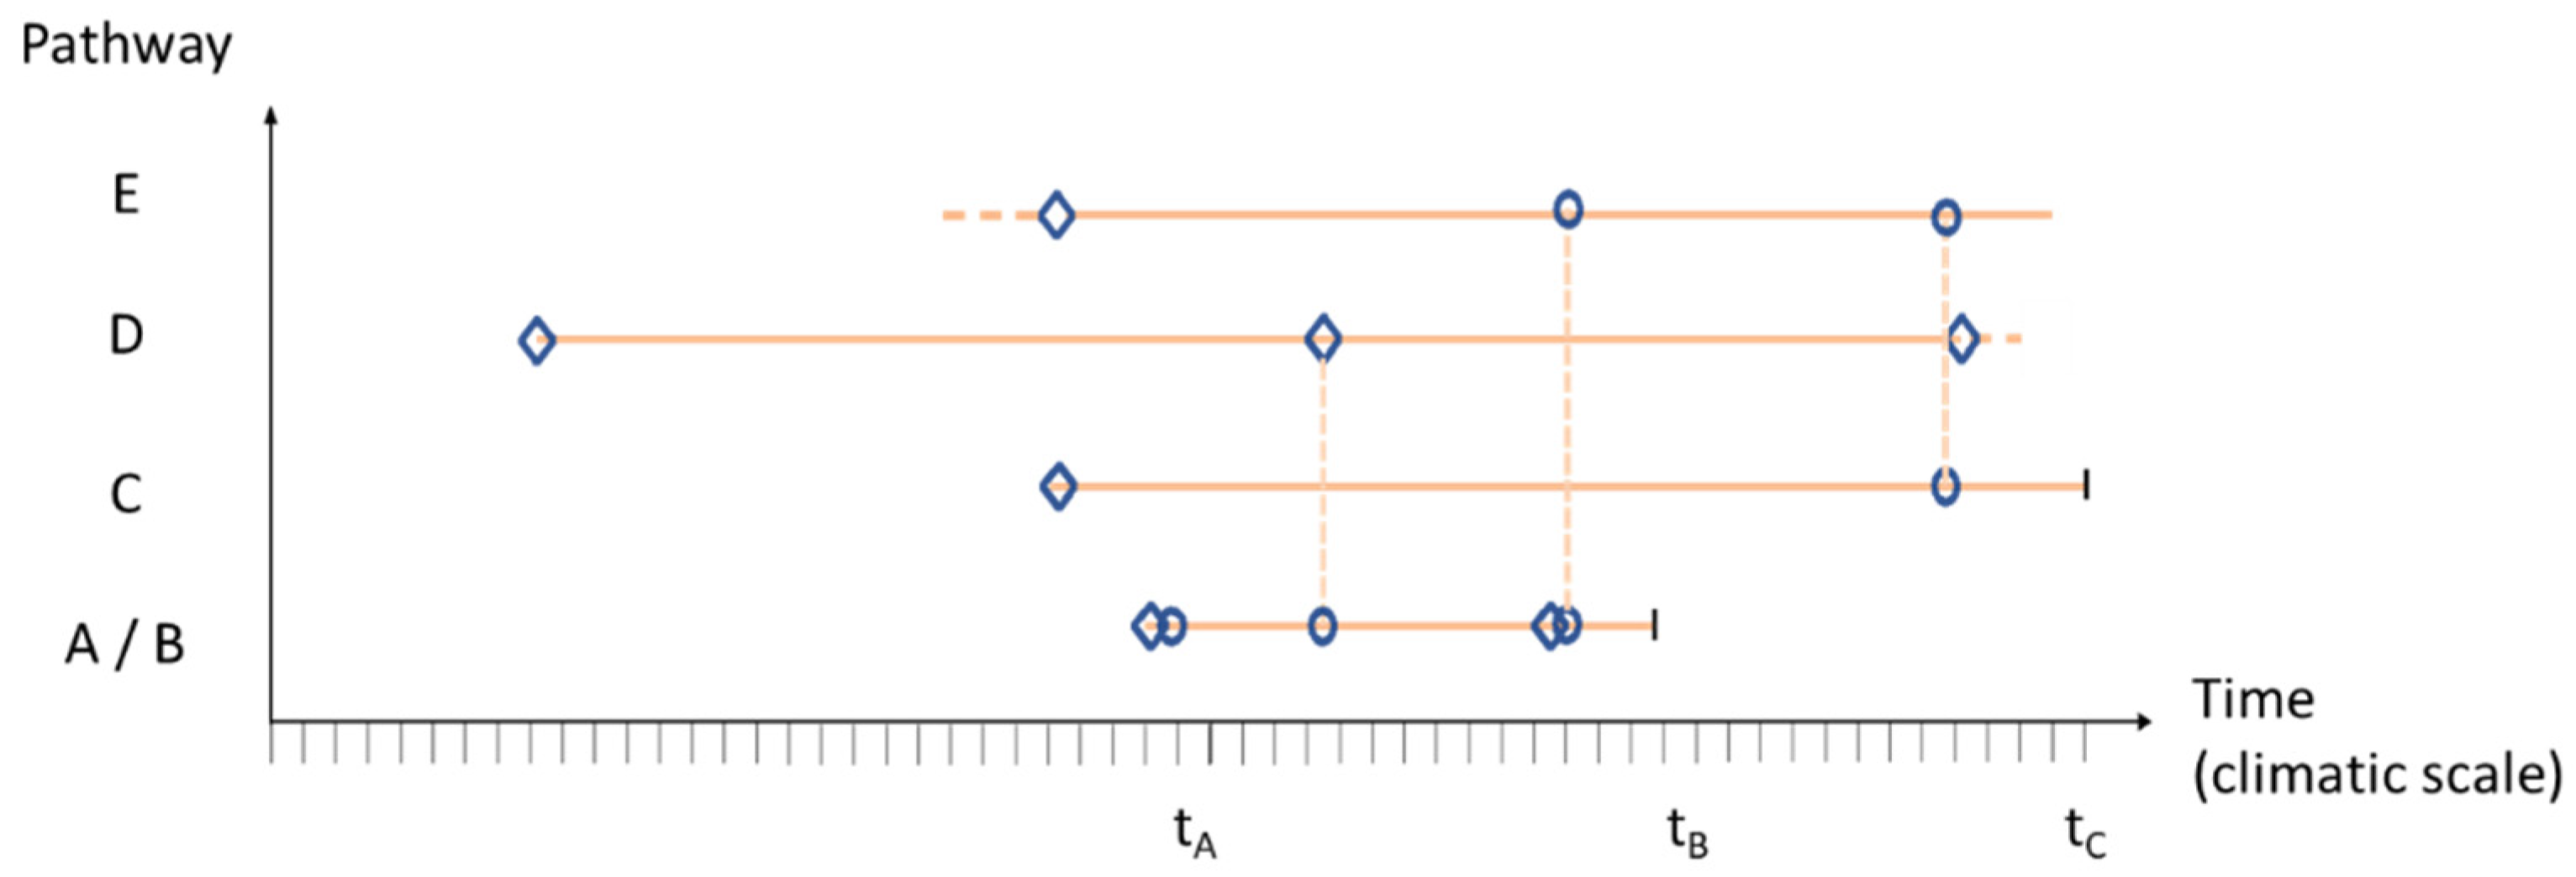
The proposed sequence of interventions, with change stations and TPs, is schematized in Figure 7 and Figure 8, corresponding to scenarios SSP2-4.5 and SSP5-8.5, respectively. Blue diamonds indicate [60] the start of an adaptation pathway, while circles correspond to change stations. The black vertical limits indicate the functional end of an adaptation pathway.

Figure 7.
Adaptation pathways for the analyzed urban coastal profile (Badalona case) and SSP2-4.5. Diamonds indicate the beginning of an adaptation pathway, following the pathways defined in Figure 3 and associated text. Circles indicate change in pathway “stations”, and the vertical black lines indicate the functional end of the pathway, following scientific and socioeconomic criteria.
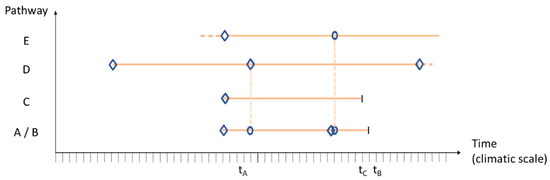
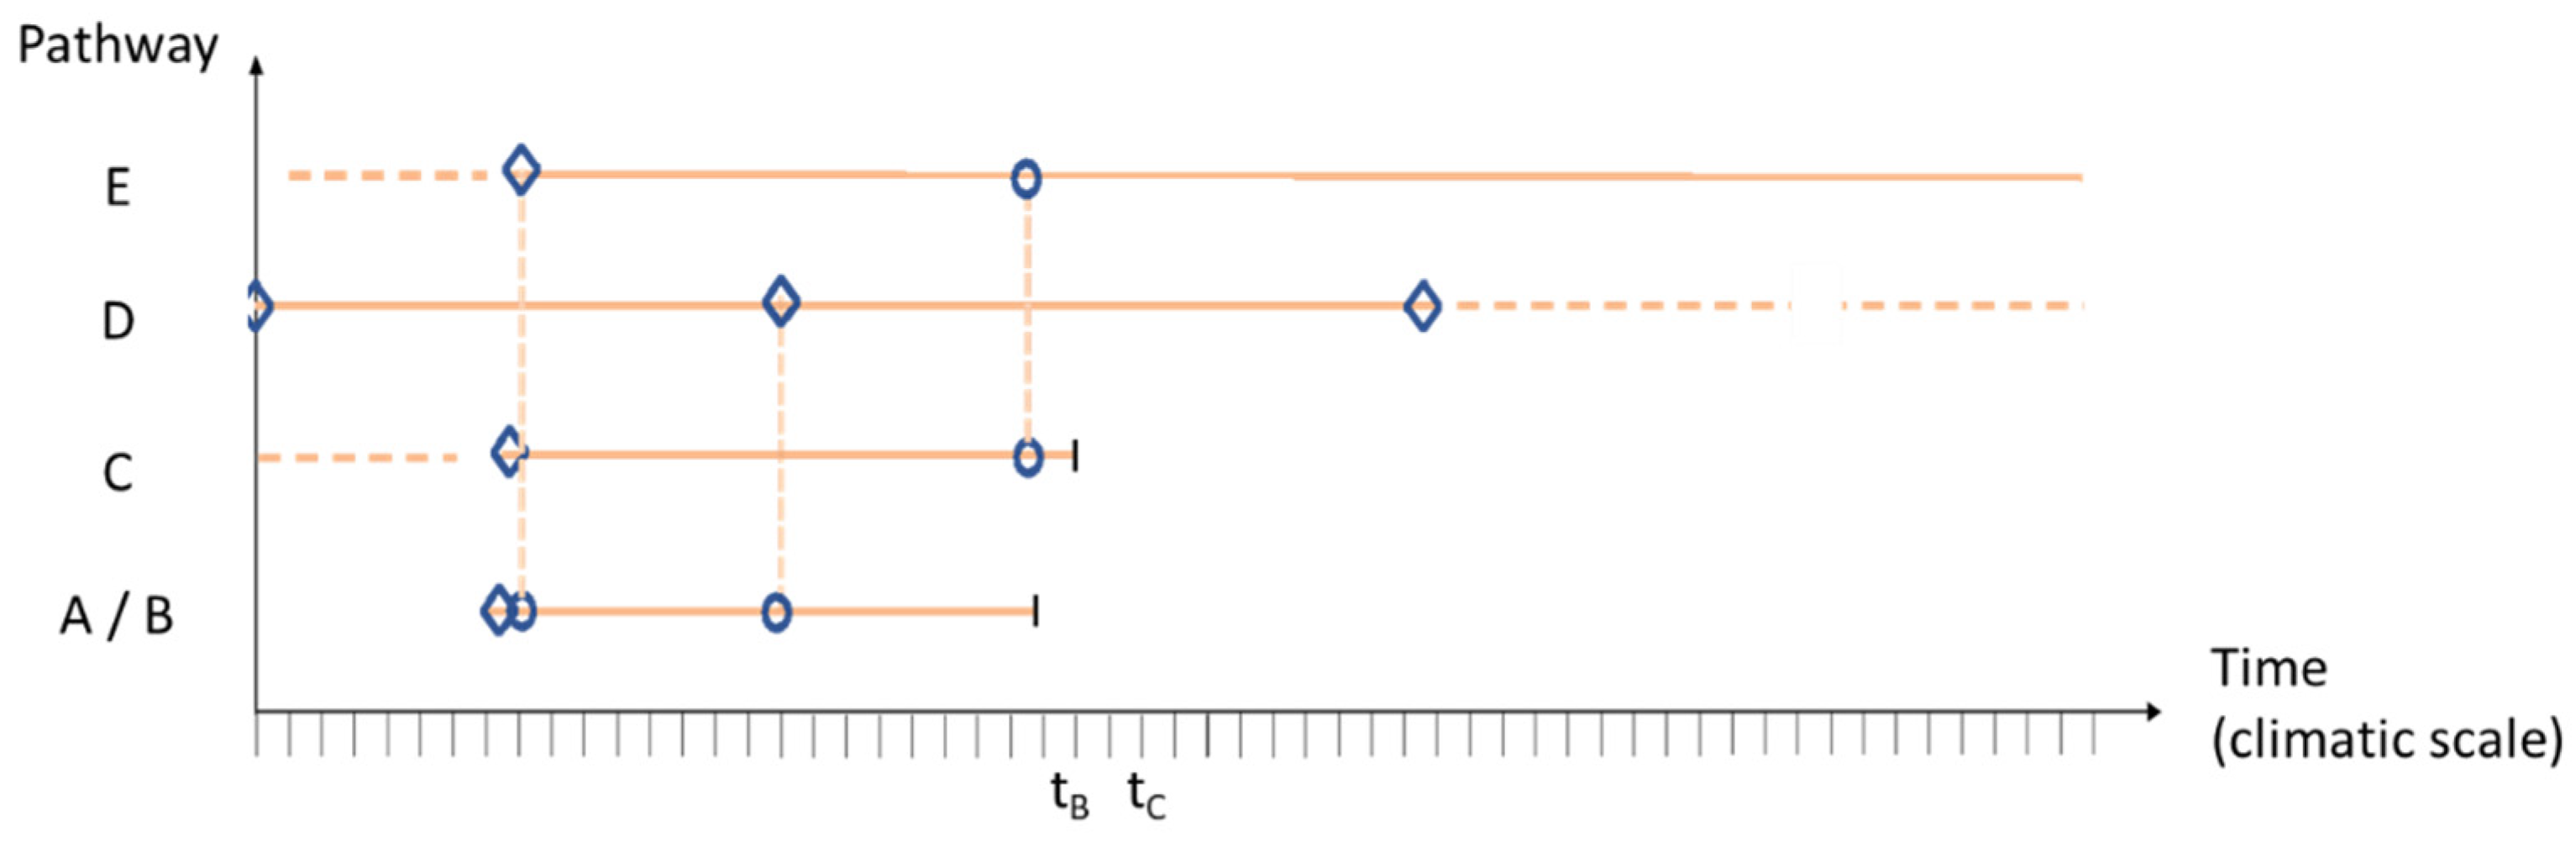
Figure 8.
Adaptation pathways for the analyzed urban coastal profile (Badalona case) and SSP5-8.5. Diamonds indicate the beginning of an adaptation pathway, following the pathways defined in Figure 3 and associated text. Circles indicate change in pathway “stations”, and the vertical black lines indicate the functional end of the pathway, following scientific and socioeconomic criteria.
The peri-urban beach profile, featuring comparatively finer sand and, thus, milder slopes, shows, according to the performed projections, an enhanced loss of emerged beach, which tends to “disappear” (i.e., fall below the acceptability threshold of 20 m with a TP at 15 m) by the 2030 horizon. From this horizon onward, the back beach would progressively experience more severe storm impacts affecting the present public domain boundary, which is located about 80 m landward from the average shoreline. This means that the present beach configuration will last for about 50 years, and after that, hinterland assets will be negatively impacted by waves and surges. Pathway A starts with an artificial nourishment to gain a 15 m beach width by 2030. This intervention provides a transition to pathway B, with a new nourishment 20 years later. The combined gains will not last beyond 2050, based on a projection of erosion rates under SLR, meaning that pathway A + B will have a TP by the middle of this century. As a consequence, conventional nourishment will not comply with the social demand for risk, cost and carbon reduction criteria beyond the 2050 horizon. A similar behavior, although delayed in time, characterizes pathway C, where the seawall is projected to remain functional until the 2070 horizon, where an SLR of 0.5 m above present values will limit the seawall functionality according to stakeholder criteria.
Pathway D, based on NbS, combines dunes for the emerged beach and wetlands for the intertidal beach, with sand dikes as barriers to reduce sediment transport and wetlands (minimum width of about 100 m) providing additional buffer areas for the selected 50- and 100-year storms. Pathway D requires a first nourishment by 2030 to generate a beach width larger than 15 m to provide enough space for the proposed NbS, which consists of reconstructing a wetland area inspired by the old wetland swathe that existed in previous centuries. This artificial beach nourishment is associated with the calculated minimum beach width, which means that monitoring and maintenance will be required during the first years after restoration until the NbS is developed enough to provide self-resilience under SLR and wave/surge storms. The space requirements imply a second small-scale nourishment 20 years later and then another one by 2100. These nourishment interventions involve limited volumes of sand so as to maintain healthy ecosystems in the intertidal and submerged beach. Beyond 2100, it is difficult to project how these interventions will behave, and because of that, the pathway (Figure 9) is represented by a dashed line.
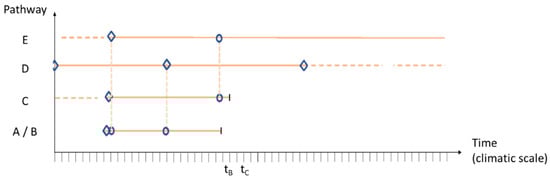
Figure 9.
Adaptation pathways for the analyzed peri-urban coastal profile (Gavá case) and both considered scenarios since the differences in projected behavior are small and within the uncertainty associated with the performed calculations. As in previous figures, diamonds indicate the beginning of an adaptation pathway, following the pathways defined in Figure 3 and associated text. Circles indicate change in pathway “stations”, and the vertical black lines indicate the functional end of the pathway, following scientific and socioeconomic criteria.
Pathway E, corresponding to managed realignment, is also indicated in the figure without a deadline since, for peri-urban beach profiles, there is usually enough accommodation space to enable a backward spreading of land activities and infrastructures to enhance resilience. That is indeed the case for the studied profile, which, thanks to that available space, can use natural beach dynamics for partial self-protection, developing dissipative profiles and landward migration as required by SLR. The proposed interventions and associated projection of beach width for scenarios SSP2-4.5 and SSP5-8.5 appear, respectively, in Table 4 and Table 5.
Table 4.
Estimated coastal evolution (erosion/accretion) rates for the heavily rigidized coastal profile (Figure 1) and climate change scenario SSP5-4.5. The left-side column indicates the timeline for coastal evolution under climate change and with the proposed interventions. The rest of columns indicate the key physical variables used as indicators for each pathway. These variables are explained in detail in the main text. The boxes in grey (left column) indicate the occurrence of an energetic storm (sequence described in the text) and the boxes in ochre indicate tipping points associated with the different pathways.
Table 5.
Estimated coastal evolution (erosion/accretion) rates for the heavily rigidized coastal profile (Figure 1) and climate change scenario SSP5-8.5. The left-side column indicates the timeline for coastal evolution under climate change and with the proposed interventions. The rest of columns indicate the key physical variables used as indicators for each pathway. These variables are explained in detail in the main text. The boxes in grey (left column) indicate the occurrence of an energetic storm (sequence described in the text) and the boxes in ochre indicate tipping points associated with the different pathways.
The key physical variables used as steering indicators for each pathway can be summarized as follows. For pathways A + B, the physical variables are as follows: (1) the initial value of the additional beach width generated by maintenance interventions (artificial nourishment); (2) the temporal evolution of the remaining beach width after the interventions, subject to projected wave, surge and sea-level rise conditions; and (3) the hinterland width affected by shoreline retreat, considering the effect of the interventions under climate change. For pathway C, the physical variables are as follows: (4) the beach advance/retreat associated with coastal rigidization and (5) the remaining beach width for a rigidized coast (progressive rigidization). For pathway D, the physical variables are as follows: (6) the beach width remaining after the combined effect of background erosion, sea level rise retreat and cumulative storm erosion (see text for a more detailed explanation); (7) the initial value of the additional beach width generated by maintenance interventions; and (8) the temporal evolution of the remaining beach width after the interventions, subject to projected wave, surge and sea-level rise conditions. The boxes marked in grey (left column) indicate the occurrence of a storm according to the sequence described in the text. The boxes marked in ochre indicate the times tA, tB, tC and tD (see Figure 3), which represent tipping points associated with the different pathways considered.
4. Discussion
The developed coastal adaptation pathways are based on local expertise, climate projections, hydro-morphodynamic simulations and stakeholder criteria on governance, funding and policies. Such a combination [23] of techniques, finance and governance underpin a transition toward a proactive coastal adaptation that mainstreams NbS into coastal protection, aligning adaptation with climate mitigation efforts. Numerical simulations are proposed to steer a maintenance program supported by an EWS to avoid reaching TPs, where tailored EWS [31,61] will support proactive maintenance of the coast, optimizing interventions before storm impacts. The EWS, working at short time scales (order of 1 week), should be supplemented by a climatic warning system [8], which projects coastal evolution under future scenarios and provides climatic alarms whenever the risk level becomes unacceptable, which would justify a change in pathways [62].
The projections elaborated above assume that present sediment transport formulations and morphodynamic evolution trends, duly modulated for SLR and asymptotically adjusted toward an equilibrium configuration, can be applied. The proposed pathways also assume that Bruun’s rule for profile evolution under SLR remains valid, although such an approach tends to overestimate erosion rates due to the underlying assumption of an equilibrium profile in a longshore uniform coast. These projections should, thus, be periodically reassessed with a systematic observation program, which should also serve to determine the efficiency of NbS and to update the fronting bathymetry so that the pathway development is always based on the most updated characterization of the beach active profile and associated offshore area.
The proposed climatic alarms (Figure 10) are associated with hazard or risk levels, depending on whether the damage valuation is included (risks) or not (hazards), both expressed in terms of co-designed robust indicators, such as, for instance, SLR, remaining beach width, available sand volume or cumulative damages.
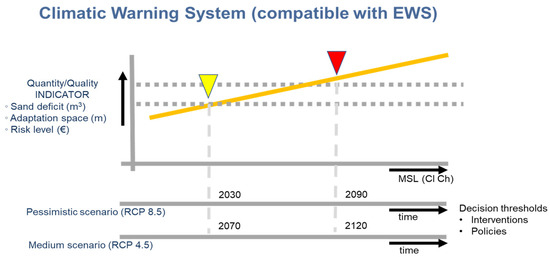
Figure 10.
Representation of alarm thresholds for a climatic warning system, compatible with an EWS and based on co-designed limits for key variables, whose evolution with time (decadal scales) characterizes the quality of the analyzed coastal archetype or the quantity of available adaptation resources. The dependent key variables in this diagram are sand deficit, adaptation space and risk level, and the thresholds correspond to co-defined levels of these variables. The independent variable for establishing the climatic alarm system can be any robust variable characterizing climatic pressures, taken here to be mean sea level (MSL), which is then associated with time in the same x-axis, depending on the selected physical scenario. The pessimistic scenario corresponds to SSP5-8.5, while the medium scenario corresponds to SSP5-4.5, as explained in the text. Decisions on interventions or policies are associated with these thresholds (yellow for initial warning and red for urgent interventions) and are referred to these time axes.
The analyzed coastal archetype is managed by several departments of two different governments (central and regional) and is conditioned by a wide range of applicable plans and legislation from the municipal level to the European Union level. The introduction of coastal maintenance contracts, as promoted within some EU projects linked to the Green Deal [8], will underpin the co-design of new interventions and the maintenance of the already implemented ones within a set of adaptation pathways that benefit from experimental pilot projects. The development of such adaptation pathways is a dynamic and multicriteria process, where the combination of predictions and projections, with explicit metrics to assess risk levels, will favor the convergence of criteria aligned with the new EU restoration law. The ensuing consensus, associated with a progressive build-up of social and governance cohesion for a shared coastal adaptation, will avoid the present overdominance of short-term and reactive interventions, which seldom consider their carbon footprint or internalize all their costs. Changing the scale of analysis, introducing the medium- to long-term view and changing the level of engagement for coastal maintenance should lead to enhanced accountability and socioeconomic co-responsibility, which are both required to maintain risk levels under the projected climate scenarios.
5. Conclusions
Adaptation pathways for urban and peri-urban beach profiles, representative of climatically vulnerable hotspots, such as coastal Mediterranean cities, can help steer new coastal policies, such as the new CPM plan (Pla de Protecció i Ordenació del Litoral a Catalunya). This plan, developed by the Catalan Government (Generalitat de Catalunya), can benefit from the delineated adaptation trajectories. Pathways A, B and C aim to increase the level of coastal protection, with a focus on short-term risk reduction, while pathways D and E propose a transition to a new coastal paradigm. This new paradigm addresses multi-scale coastal zone planning, redefines coastal boundaries, incorporates coastal dynamics for natural resilience and requires the integrated management of scarce coastal resources (such as freshwater and sand volumes). The proposed approach to coastal adaptation combines a new level of multi-disciplinary coastal observations within early and climatic warning systems to steer coastal maintenance and prompt the implementation of pilot tests to mainstream NbS into coastal protection.
Such an approach, based on adaptation pathways, is fully aligned with the PIMA Adapta Costas program of the Spanish Ministry for Ecological Transition and with the new EU nature restoration law, proposing sequenced coastal interventions, promoting NbS, as well as defining change stations and TPs for natural resilience. Such an alignment will pave the way for a wider uptake of NbS based on monitored and progressively refined pilot tests, enabling a robust characterization of delivered ecosystem services, including biodiversity gains. These monitoring plans, associated with consensus metrics for risk reduction that combine hydro-, morpho- and ecologic parameters, will support proactive interventions and avoid crossing tipping points.
The proposed approach to coastal adaptation, although developed for an urban coastal archetype in the Mediterranean, is considered to be applicable to most coastal vulnerability hotspots, particularly those experiencing accelerating climatic and anthropogenic pressures. The combination of simulations (to predict and project shore evolution) and monitoring (to assess the performance of conventional engineering works versus NbS) make the approach generic and exportable to other coastal systems, particularly vulnerability hotspots that will require, under climate change, an additional adaptation over present coastal protection efforts, often associated with a large impact and carbon footprint.
Author Contributions
Conceptualization: A.S.-A. and V.G.; Methodology: V.G. and A.S.-A.; Software: A.S.-A.J.; Validation: A.S.-A.J., V.G. and A.S.-A.; Formal Analysis: A.S.-A.J.; Investigation: A.S.-A.J. and V.G.; Resources and Data Curation: V.G. and A.S.-A.J.; Writing: A.S.-A.J.; Review and Editing: V.G. and A.S.-A.; Visualization: A.S.-A.J.; Supervision: V.G. and A.S.-A.; Project Administration and Funding Acquisition: A.S.-A. All authors have read and agreed to the published version of the manuscript.
Funding
This research was funded by the Rest-Coast EU Horizon 2020 research and innovation project (grant No. 101037097).
Institutional Review Board Statement
Not applicable.
Informed Consent Statement
Not applicable.
Data Availability Statement
The data presented in this study are only available upon request from the corresponding author due to the various sources of origin.
Acknowledgments
The authors want to acknowledge the support from the Pla de protecció i ordenació del litoral (Dept. Territori, Generalitat de Catalunya) and the work within the research projects ECO-BAYS (contract num. PID2020-115924RB-I00) and ECOPLANTS (contract num. PID-2020-119058RB-I00)—both funded by MCIN/AEI/10.13039/501100011033. The support and input of F. Miralles and M. Catasus are especially appreciated.
Conflicts of Interest
The authors declare no conflicts of interest. Funding parties had no role in the writing of the manuscript.
References
- Klein, R.J.; Nicholls, R.J.; Mimura, N. Coastal adaptation to climate change: Can the IPCC Technical Guidelines be applied? Mitig. Adapt. Strateg. Glob. Change 1999, 4, 239–252. [Google Scholar] [CrossRef]
- Cabana, D.; Rölfer, L.; Evadzi, P.; Celliers, L. Enabling climate change adaptation in coastal systems: A systematic literature review. Earth’s Future 2023, 11, e2023EF003713. [Google Scholar] [CrossRef]
- Sanchez-Arcilla, A.; Gracia, V.; Sierra, J.P.; Garcia Leon, M.; Mosso, C. Sistemes costaners i dinàmica litoral. A: “Tercer informe sobre el canvi climàtic a Catalunya”. Inst. D‘Estud. Catalans (IEC) 2016, 189–210. Available online: http://hdl.handle.net/2117/100402 (accessed on 20 May 2024).
- Cruz-Ramírez, C.J.; Chávez, V.; Silva, R.; Muñoz-Perez, J.J.; Rivera-Arriaga, E. Coastal Management: A Review of Key Elements for Vulnerability Assessment. J. Mar. Sci. Eng. 2024, 12, 386. [Google Scholar] [CrossRef]
- Lionello, P.; Giorgi, F.; Rohling, E.; Seager, R. Oceanography of the Mediterranean Sea, Mediterranean Climate: Past, Present and Future; Schroeder, K., Chiggiato, J., Eds.; Elsevier: Amsterdam, The Netherlands, 2023. [Google Scholar] [CrossRef]
- Tsaimou, C.N.; Papadimitriou, A.; Chalastani, V.Ι.; Sartampakos, P.; Chondros, M.; Tsoukala, V.K. Impact of Spatial Segmentation on the Assessment of Coastal Vulnerability—Insights and Practical Recommendations. J. Mar. Sci. Eng. 2023, 11, 1675. [Google Scholar] [CrossRef]
- MEDECC. Summary for Policymakers. In Climate and Environmental Coastal Risks in the Mediterranean; Djoundourian, S., Lionello, P., Llasat, M.C., Cramer, W., Guiot, J., Driouech, F., Gattacceca, J.C., Marini, K., Eds.; MedECC Reports; MedECC Secretariat: Marseille, France, 2024. [Google Scholar]
- Sánchez-Arcilla, A.; Cáceres, I.; Le Roux, X.; Hinkel, J.; Schuerch, M.; Nicholls, R.J.; Otero, M.M.; Staneva, J.; de Vries, M.; Pernice, U.; et al. Barriers and enablers for upscaling coastal restoration. Nat. Based Solut. 2022, 2, 100032. [Google Scholar] [CrossRef]
- Werners, S.; Wise, M.; Butler, J.; Totin, E.; Vincent, K. Adaptation pathways: A review of approaches and a learning framework. Environ. Sci. Policy 2021, 116, 266–275. [Google Scholar] [CrossRef]
- Rocle, N.; Rey-Valette, H.; Bertrand, F.; Becu, N.; Long, N.; Bazart, C.; Vye, D.; Meur-Ferec, C.; Beck, E.; Amalric, M.; et al. Paving the way to coastal adaptation pathways: An interdisciplinary approach based on territorial archetypes. Environ. Sci. Policy 2020, 110, 34–45. [Google Scholar] [CrossRef]
- Eichentopf, S.; Alsina, J.M.; Christou, M.; Kuriyama, Y.; Karunarathna, H. Storm sequencing and beach profile variability at Hasaki, Japan. Mar. Geol. 2020, 424, 106153. [Google Scholar] [CrossRef]
- Lin-Ye, J.; Garcia, M.; Gracia, V.; Ortego, M.I.; Lionello, P.; Conte, D.; Pérez, B.; Sanchez-Arcilla, A. Modelling of future extreme storm surges at the NW Mediterranean coast (Spain). Water 2020, 12, 472. [Google Scholar] [CrossRef]
- Tendero-Peiró, C.; Asensio-Montesinos, F.; Anfuso, G.; Corbí, H. The Coastal Scenery of São Miguel Island, Azores Archipelago: Implications for Coastal Management. J. Mar. Sci. Eng. 2024, 12, 707. [Google Scholar] [CrossRef]
- Falciano, A.; Anzidei, M.; Greco, M.; Trivigno, M.L.; Vecchio, A.; Georgiadis, C.; Patias, P.; Crosetto, M.; Navarro, J.; Serpelloni, E.; et al. The SAVEMEDCOASTS-2 webGIS: The Online Platform for Relative Sea Level Rise and Storm Surge Scenarios up to 2100 for the Mediterranean Coasts. J. Mar. Sci. Eng. 2023, 11, 2071. [Google Scholar] [CrossRef]
- Cradock-Henry, N.A.; Frame, B. Balancing scales: Enhancing local applications of adaptation pathways. Environ. Sci. Policy 2021, 121, 42–48. [Google Scholar] [CrossRef]
- Palaparthi, J.; Briggs, T.R. Regional Sediment Management in US Coastal States: Historical Trends and Future Predictions. J. Mar. Sci. Eng. 2024, 12, 528. [Google Scholar] [CrossRef]
- Nguyen, M.T.; Renaud, F.G.; Sebesvari, Z. Drivers of change and adaptation pathways of agricultural systems facing increased salinity intrusion in coastal areas of the Mekong and Red River deltas in Vietnam. Environ. Sci. Policy 2019, 92, 331–348. [Google Scholar] [CrossRef]
- Magnan, A.K.; Duvat, V.K. Towards adaptation pathways for atoll islands. Insights from the Maldives. Reg. Environ. Change 2020, 20, 1–17. [Google Scholar] [CrossRef]
- Valente, S.; Veloso-Gomes, F. Coastal climate adaptation in port-cities: Adaptation deficits, barriers, and challenges ahead. J. Environ. Plan. Manag. 2020, 63, 389–414. [Google Scholar] [CrossRef]
- Nolet, C.; Riksen, M.J.P.M. Accommodation space indicates dune development potential along an urbanized and frequently nourished coastline. Earth Surf. Dynam. 2019, 7, 129–145. [Google Scholar] [CrossRef]
- Sanchez-Arcilla, A.; Caceres, I. An analysis of nearshore profile and bar development under large scale erosive and accretive waves. J. Hydraul. Res. 2018, 56, 231–244. [Google Scholar] [CrossRef]
- Sánchez-Arcilla, A.; García, M.; Gracia, V.; Devoy, R.; Stanica, A.; Gault, J. Managing coastal environments under climate change: Pathways to adaptation. Sci. Total Environ. 2016, 572, 1336–1352. [Google Scholar] [CrossRef]
- Ramm, T.D.; Watson, C.S.; White, C.J. Strategic adaptation pathway planning to manage sea-level rise and changing coastal flood risk. Environ. Sci. Policy 2018, 87, 92–101. [Google Scholar] [CrossRef]
- Haasnoot, M.; Kwakkel, J.H.; Walker, W.E.; Maat, J.T. Dynamic adaptive policy pathways: A method for crafting robust decisions for a deeply uncertain world. Glob. Environ. Change 2013, 23, 485–498. [Google Scholar] [CrossRef]
- Ryan, E.J.; Owen, S.D.; Lawrence, J.; Glavovic, B.; Robichaux, L.; Dickson, M.; Kench, P.S.; Schneider, P.; Bell, R.; Blackett, P. Formulating a 100-year strategy for managing coastal hazard risk in a changing climate: Lessons learned from Hawke’s Bay, New Zealand. Environ. Sci. Policy 2022, 127, 1–11. [Google Scholar] [CrossRef]
- Rozance, M.A.; Denton, A.; Matsler, A.M.; Grabowski, Z.; Mayhugh, W. Examining the scalar knowledge politics of risk within coastal sea level rise adaptation planning knowledge systems. Environ. Sci. Policy 2019, 99, 105–114. [Google Scholar] [CrossRef]
- Griggs, G.B. The California Coast and Living Shorelines—A Critical Look. J. Mar. Sci. Eng. 2024, 12, 199. [Google Scholar] [CrossRef]
- Pham, H.V.; Dal Barco, M.K.; Pourmohammad Shahvar, M.; Furlan, E.; Critto, A.; Torresan, S. Bayesian Network Analysis for Shoreline Dynamics, Coastal Water Quality, and Their Related Risks in the Venice Littoral Zone, Italy. J. Mar. Sci. Eng. 2024, 12, 139. [Google Scholar] [CrossRef]
- Roy, P.; Pal, S.C.; Chakrabortty, R.; Chowdhuri, I.; Saha, A.; Shit, M. Effects of climate change and sea-level rise on coastal habitat: Vulnerability assessment, adaptation strategies and policy recommendations. J. Environ. Manag. 2023, 330, 117187. [Google Scholar] [CrossRef] [PubMed]
- Allison, A.; Stephens, S.; Blackett, P.; Lawrence, J.; Dickson, M.E.; Matthews, Y. Simulating the Impacts of an Applied Dynamic Adaptive Pathways Plan Using an Agent-Based Model: A Tauranga City, New Zealand, Case Study. J. Mar. Sci. Eng. 2023, 11, 343. [Google Scholar] [CrossRef]
- García Sotillo, M.; Mourre, B.; Mestres, M.; Lorente, P.; Aznar, R.; García-León, M.; Liste, M.; Santana, A.; Espino, M.; Álvarez, E. Evaluation of the operational CMEMS and coastal downstream ocean forecasting services during the storm Gloria (January 2020). Front. Mar. Sci. 2021, 8, 644525. [Google Scholar] [CrossRef]
- Idier, D.; Aurouet, A.; Bachoc, F.; Baills, A.; Betancourt, J.; Gamboa, F.; Klein, T.; López-Lopera, A.F.; Pedreros, R.; Rohmer, J.; et al. A User-Oriented Local Coastal Flooding Early Warning System Using Metamodelling Techniques. J. Mar. Sci. Eng. 2021, 9, 1191. [Google Scholar] [CrossRef]
- D’Alessandro, F.; Tomasicchio, G.R.; Frega, F.; Leone, E.; Francone, A.; Pantusa, D.; Barbaro, G.; Foti, G. Beach–Dune System Morphodynamics. J. Mar. Sci. Eng. 2022, 10, 627. [Google Scholar] [CrossRef]
- Wright, L.D.; Thom, B.G. Coastal Morphodynamics and Climate Change: A Review of Recent Advances. J. Mar. Sci. Eng. 2023, 11, 1997. [Google Scholar] [CrossRef]
- Gorddard, R.; Colloff, M.J.; Wise, R.M.; Ware, D.; Dunlop, M. Values, rules and knowledge: Adaptation as change in the decision context. Environ. Sci. Policy 2016, 57, 60–69. [Google Scholar] [CrossRef]
- Santoso, L.W. Early warning system for academic using data mining. In Proceedings of the Fourth International Conference on Advances in Computing, Communication & Automation (ICACCA), Subang Jaya, Malaysia, 26–28 October 2018; pp. 1–4. [Google Scholar] [CrossRef]
- Bosomworth, K.; Leith, P.; Harwood, A.; Wallis, P.J. What’s the problem in adaptation pathways planning? The potential of a diagnostic problem-structuring approach. Environ. Sci. Policy 2017, 76, 23–28. [Google Scholar] [CrossRef]
- Abel, G.J.; Barakat, B.; Kc, S.; Lutz, W. Meeting the Sustainable Development Goals leads to lower world population growth. Proc. Natl. Acad. Sci. USA 2016, 113, 14294–14299. [Google Scholar] [CrossRef] [PubMed]
- Sovacool, B.K. Hard and soft paths for climate change adaptation. Clim. Policy 2011, 11, 1177–1183. [Google Scholar] [CrossRef]
- Haasnoot, M.; Brown, S.; Scussolini, P.; Jimenez, J.A.; Vafeidis, A.T.; Nicholls, R.J. Generic adaptation pathways for coastal archetypes under uncertain sea-level rise. Environ. Res. Commun. 2019, 1, 071006. [Google Scholar] [CrossRef]
- Cradock-Henry, N.A.; Kirk, N.; Ricasrt, S.; Diprose, G.; Kannemeyer, R. Decisions, options, and actions in the face of uncertainty: A systematic bibliometric and thematic review of climate adaptation pathways. Environ. Res. Lett. 2023, 18, 073002. [Google Scholar] [CrossRef]
- Sanchez-Arcilla, A.; Ibañez, C.; Gracia, V.; Garrote, L.; Caceres, I.; de la Peña Lopez, J.M.; Caiola, N.; Munne, A.; Espanya, A.; Iglesias, A.; et al. Nature based solutions for sediment starved deltas. The Ebro case in the Spanish Mediterranean coast. In Proceedings of the Coastal Sediments, New Orleans, LA, USA, 11–15 April 2023. [Google Scholar] [CrossRef]
- IPCC. Climate Change 2021: The Physical Science Basis. Contribution of Working Group I to the Sixth Assessment Report of the Intergovernmental Panel on Climate Change; Cambridge University Press: Cambridge, UK, 2021. [Google Scholar] [CrossRef]
- Nicholls, R.J.; Hanson, S.E.; Lowe, J.A.; Slangen, A.B.; Wahl, T.; Hinkel, J.; Long, A.J. Integrating new sea-level scenarios into coastal risk and adaptation assessments: An ongoing process. Wiley Interdiscip. Rev. Clim. Change 2021, 12, 706. [Google Scholar] [CrossRef]
- Lawrence, J.; Bell, R.; Blackett, P.; Stephens, S.; Allan, S. National guidance for adapting to coastal hazards and sea-level rise: Anticipating change, when and how to change pathway. Environ. Sci. Policy 2018, 82, 100–107. [Google Scholar] [CrossRef]
- Kroon, A.; de Schipper, M.A.; van Gelder, P.H.; Aarninkhof, S.G.H. Ranking uncertainty: Wave climate change versus model uncertainty in probabilistic assessment of coastline change. Coast. Eng. 2020, 158, 103673. [Google Scholar] [CrossRef]
- Meinshausen, M.; Nicholls, Z.R.; Lewis, J.; Gidden, M.J.; Vogel, E.; Freund, M.; Beyerle, U.; Gessner, C.; Nauels, A.; Bauer, N.; et al. The shared socio-economic pathway (SSP) greenhouse gas concentrations and their extensions to 2500. Geosci. Model Dev. 2020, 13, 3571–3605. [Google Scholar] [CrossRef]
- Brown, S.; Jenkins, K.; Goodwin, P.; Lincke, D.; Vafeidis, A.T.; Tol, R.S.J.; Jenkins, R.; Warren, R.; Nicholls, R.J.; Jevrejeva, S.; et al. Global costs of protecting against sea-level rise at 1.5 to 4.0 °C. Clim. Change 2021, 167, 4. [Google Scholar] [CrossRef]
- Sancho, A.; Guillén, J.; Gracia, V.; Rodriguez-Gómez, A.; Rubio-Nicolas, B. The use of news information published in newspapers to estimate the impact of coastal storms at a regional scale. J. Mar. Sci. Eng. 2021, 9, 497. [Google Scholar] [CrossRef]
- Bernal, J.; Ocampo, J.A. Climate Change: Policies to Manage Its Macroeconomic and Financial Effects; UNDP Human Development Report; The United Nations Development Programme: New York, NY, USA, 2021; pp. 2–2020. [Google Scholar]
- Marco-Méndez, C.; Marbà, N.; Amores, A.; Romero, J.; Minguito-Frutos, M.; García, M.; Pagès, J.F.; Prado, P.; Boada, J.; Luis Sánchez-Lizaso, L.; et al. Evaluating the extent and impact of the extreme Storm Gloria on Posidonia oceanica seagrass meadows. Sci. Total Environ. 2024, 908, 168404. [Google Scholar] [CrossRef]
- Bolaños, R.; Jorda, G.; Cateura, J.; Lopez, J.; Puigdefabregas, J.; Gomez, J.; Espino, M. The XIOM: 20 years of a regional coastal observatory in the Spanish Catalan coast. J. Mar. Syst. 2009, 77, 237–260. [Google Scholar] [CrossRef]
- Sanchez-Artus, X.; Gracia, V.; Espino, M.; Sierra, J.P.; Pinyol, J.; Sanchez-Arcilla, A. Present and future flooding and erosion along the NW Spanish Mediterranean Coast. Front. Mar. Sci. 2023, 10, 1125138. [Google Scholar] [CrossRef]
- Paterson, K. Bio-Morphodynamics of the Choked Passage Seagrass Meadow on Calvert Island, British Columbia, Canada. Ph.D. Dissertation, University of Victoria, Victoria, BC, Canada, 2022. [Google Scholar]
- Rosendahl Appelquist, L.; Balstrøm, T.; Halsnæs, K. Managing Climate Change Hazards in Coastal Areas: The Coastal Hazard Wheel Decision-Support System, in Catalogue of Hazard Management Options; United Nation Environment Programme: Geneva, Switzerland, 2016; p. 48. [Google Scholar]
- CIIRC—Centre Internacional d’Investigació dels Recursos Costaners. Estat de la Zona Costanera a Catalunya. Resum Executiu. Generalitat de Catalunya, Barcelona. 2010. Available online: https://www.igc.cat/web/files/igc_costa_resum_executiu_ca.pdf (accessed on 20 May 2024).
- Sánchez-Arcilla, A.; Jiménez, J.A.; Valdemoro, H.I.; Gracia, V. Implications of climatic change on Spanish Mediterranean low-lying coasts: The Ebro delta case. J. Coast. Res. 2008, 24, 306–316. [Google Scholar] [CrossRef]
- Luijendijk, A.P.; de Schipper, M.A.; Ranasinghe, R. Morphodynamic Acceleration Techniques for Multi-Timescale Predictions of Complex Sandy Interventions. J. Mar. Sci. Eng. 2019, 7, 78. [Google Scholar] [CrossRef]
- Escudero, M.; Mendoza, E.; Silva, R. Micro Sand Engine Beach Stabilization Strategy at Puerto Morelos, Mexico. J. Mar. Sci. Eng. 2020, 8, 247. [Google Scholar] [CrossRef]
- Narayan, S.; Esteban, M.; Albert, S.; Jamero, M.L.; Crichton, R.; Heck, N.; Goby, G.; Jupiter, S. Local adaptation responses to coastal hazards in small island communities: Insights from 4 Pacific nations. Environ. Sci. Policy 2020, 104, 199–207. [Google Scholar] [CrossRef]
- Sanchez-Arcilla, A.; Staneva, J.; Cavaleri, L.; Badger, M.; Bidlot, J.; Sorensen, J.T.; Hansen, L.B.; Martin, A.; Saulter, A.; Espino, M.; et al. Part of the Research Topic: Coastal Extension of CMEMS Products. Models, Data and Applications. Front. Mar. Sci. 2021, 8, 604741. [Google Scholar] [CrossRef]
- Le Nguyen, H.T.; Luong, H.P.V. Erosion and deposition processes from field experiments of hydrodynamics in the coastal mangrove area of Can Gio, Vietnam. Oceanologia 2019, 61, 252–264. [Google Scholar] [CrossRef]


Disclaimer/Publisher’s Note: The statements, opinions and data contained in all publications are solely those of the individual author(s) and contributor(s) and not of MDPI and/or the editor(s). MDPI and/or the editor(s) disclaim responsibility for any injury to people or property resulting from any ideas, methods, instructions or products referred to in the content. |
© 2024 by the authors. Licensee MDPI, Basel, Switzerland. This article is an open access article distributed under the terms and conditions of the Creative Commons Attribution (CC BY) license (https://creativecommons.org/licenses/by/4.0/).