Article

Experimental Study on Cyclic Simple Shear Test of Coastal Tidal Soft Soil

1
School of Civil Engineering, Qingdao University of Technology, Qingdao 266525, China
2
Department of Civil Engineering, Zhejiang University of Technology, Hangzhou 310023, China
*
Author to whom correspondence should be addressed.
J. Mar. Sci. Eng. 2024, 12(7), 1066; https://doi.org/10.3390/jmse12071066
Submission received: 27 May 2024 / Revised: 14 June 2024 / Accepted: 21 June 2024 / Published: 25 June 2024
(This article belongs to the Section Coastal Engineering)

Abstract

:
Based on undrained cyclic simple shear tests conducted on coastal tidal soft soil under various conditions of cyclic stress ratios and moisture contents, this study investigated the influence of these factors on the dynamic properties of the soil. The findings indicated that with increasing moisture content and stress cycle ratio, the stress–strain hysteresis loop gradually expanded, resulting in a higher strain difference and a transition from a dense to a sparse curve pattern. Moreover, the symmetry of the hysteresis loop was lost in the later stages of shearing. With an increase in the number of cycles, the cumulative shear strain gradually increased, and the increase in the cyclic ratio of water content to stress reduced the number of cyclic shear cycles required to achieve failure, thereby accelerating the soil’s failure rate. A predictive formula was developed based on the experimental results to estimate the failure cycles as a function of the cyclic stress ratio and moisture content. Furthermore, the softening index decreased gradually with an increasing number of cycles, and a higher moisture content and cyclic stress ratio accelerated the soil’s softening process. It was observed that under the conditions of optimal moisture content, the soil exhibited a slower softening rate during the initial stage of shearing.

1. Research Status and Significance

The construction of port terminals, wind power, and photovoltaic projects in coastal tidal flat areas has been increasing. Coastal areas in China’s coastal cities show a widespread distribution of soft beach soil, which often exists in a soft plastic state due to its high water content [1]. This unique physical property results in inadequate foundation-bearing capacity. Under the combined effects of complex wind and wave loads, analyzing the dynamic behavior of the foundation and soil becomes challenging [2,3,4]. In some instances, resonance phenomena may occur between the foundation and soil [5,6].
The cyclic simple shear test can effectively simulate the interaction mechanism between the foundation and the surrounding soil under complex cyclic loading in coastal areas and is an important means by which to study the cyclic shear characteristics of soil under cyclic loading. Therefore, an in-depth study of the mechanical behavior of coastal tidal flat soft soil under wind and wave loads can help to understand the engineering characteristics of coastal soil more comprehensively. This is of great significance for improving the constitutive model of clay and enhancing the scientific basis of coastal energy foundation design.
Currently, significant progress has been achieved in investigating the mechanical properties of soft clay. Andersen et al. [7,8] conducted cyclic triaxial tensile, simple shear, and compression tests to explore the dynamic characteristics of soil. They proposed standardized recommendations for the combination of soil elements and stress loads at varying burial depths. Soil is considered to have reached a failure state when the dynamic strain and cumulative deformation exceed 15%. Wang Jun and Liu Feiyu [9,10] studied the relationship between the dynamic softening characteristics of soft clay and the cyclic stress ratio, vibration frequency, and over-consolidation ratio through triaxial tests. They observed that the soil’s stiffness gradually decreased under cyclic loading and highlighted that increasing cyclic stress levels and initial deviatoric stress exacerbated the softening process. Guo L et al. [11] investigated pore water pressure, shear strength, and secant stiffness following monotonic and cyclic triaxial tests, finding that the post-cyclic behavior of marine soft clay samples resembled that of over-consolidated samples, exhibiting noticeable over-consolidated behavior after prolonged cyclic loading. Chen Zheng-yuan et al. [12] conducted undrained cyclic bi-directional simple shear tests on Wenzhou soft clay, discovering that an increase in the phase difference altered the stress path from a straight line to an ellipse and then to a circle, reducing the number of cycles required for damage. Wang Jun et al. [13] performed cyclic simple shear tests on Wenzhou soft clay, using a multi-directional cyclic simple shear apparatus to investigate the impact of the angle between the initial shear stress and cyclic load on the soil’s softening index. They established a softening index and pore pressure model, showing that the shear direction angle and cyclic stress ratio significantly influenced the softening index. Zhang et al. [14] utilized a multi-directional cyclic simple shear device to test saturated soft clay, determining that the stress rotation angle and cyclic stress ratio notably affected the shear strain and pore water pressure, with an increase in the cyclic stress ratio intensifying this effect. Some researchers [15,16,17] examined the impact of shear frequency on shear modulus degradation and found that the softening index decreased with an increasing shear frequency. Zhang Y et al. [18] proposed a shear modulus degradation model for soft clay, considering the number of cycles, cyclic stress ratio, loading frequency, and plasticity index. Through cyclic triaxial testing of Shanghai marine clay, the relationship between the softening index and these factors was elucidated. Huang B et al. [19] assessed the undrained shear strength of various natural, remolded, and artificial clays using a simple shear apparatus, discussing the influence of the pre-consolidation pressure, saturated back pressure, shear rate, and other factors on the undrained shear strength of clay. An undrained strength model for highly plastic clay was developed based on the test data. Jin H et al. [20,21] investigated the effects of the over-consolidation ratio, cyclic stress ratio, and shear direction on the cyclic strength and pore water pressure accumulation of soft clay through uni-directional and bi-directional cyclic simple shear tests. Xiao X et al. [22] treated marine clay as a non-Newtonian fluid, examining its stiffness degradation and flow characteristics under cyclic loading. They identified three stiffness degradation modes and proposed a two-parameter model to predict δ. A unified model was also proposed to link stiffness degradation and flow characteristics, revealing the negative exponential relationship between the average flow coefficient and the stiffness softening index.
In summary, the influence of the shear frequency, shear direction, and consolidation stress on the dynamic characteristics of soft clay during cyclic shear is relatively well understood. However, there is limited research on the effects of the water content and cyclic stress ratio on soil samples through single shear tests. This study conducted undrained cyclic simple shear tests on soft beach soil and analyzed the stress–strain relationship, cyclic cumulative strain, and softening index.

2. Test Introduction
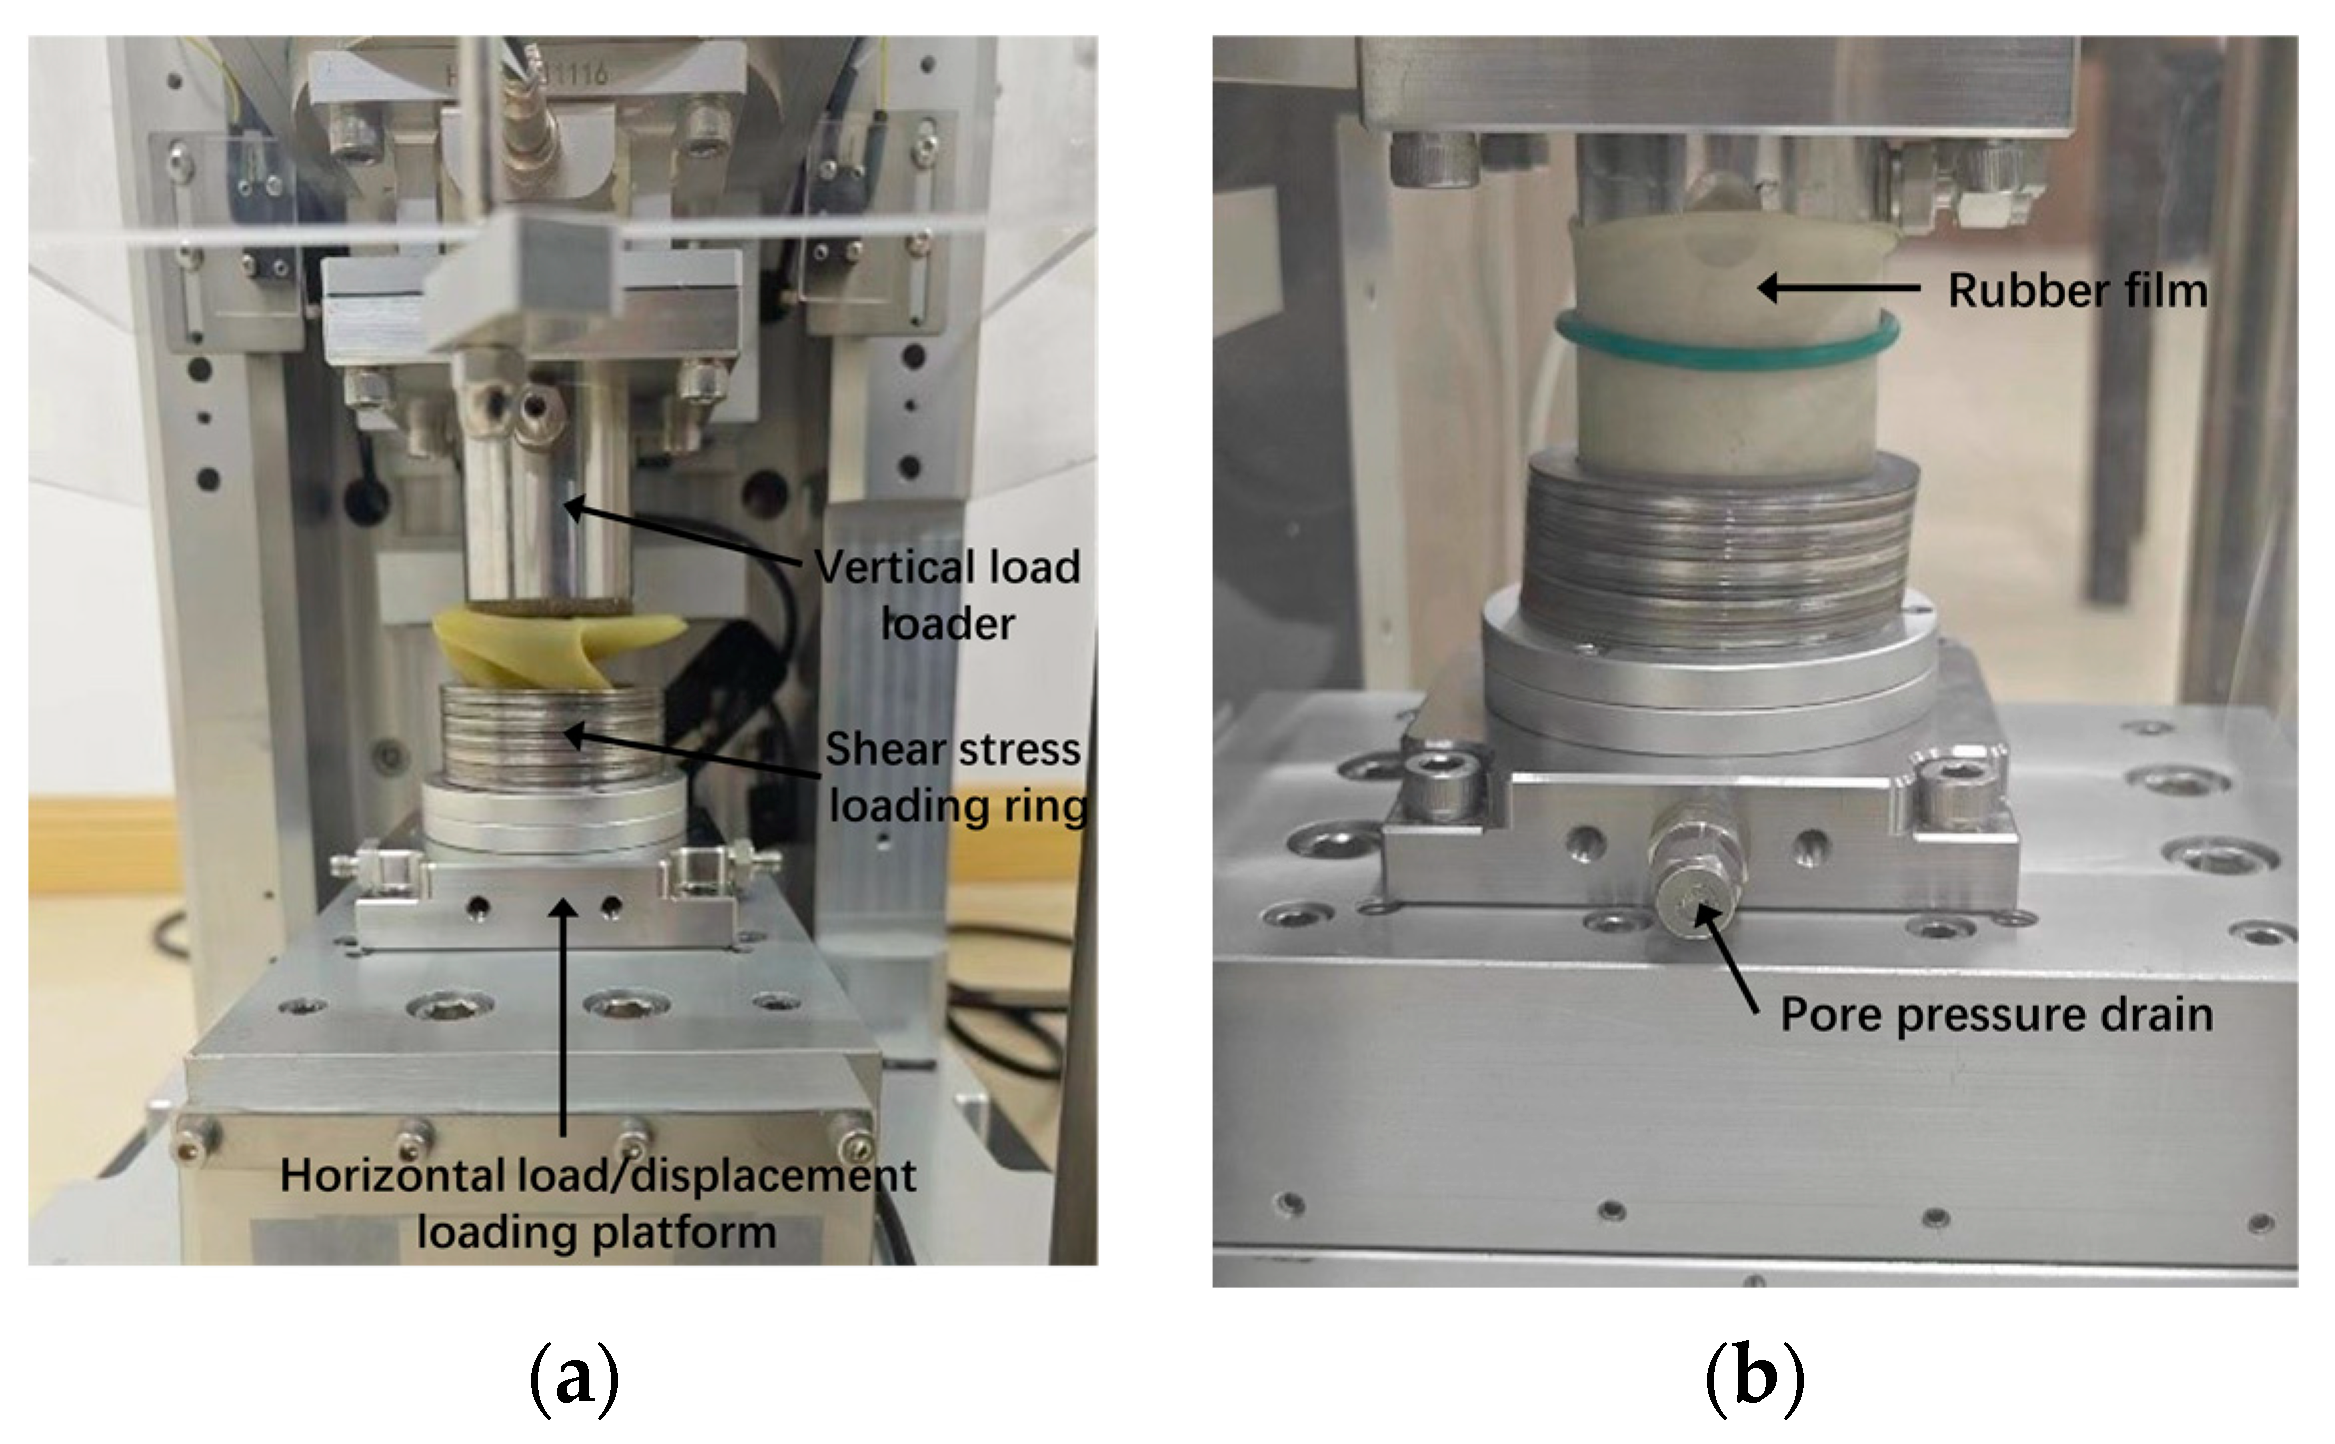
2.1. Test Equipment

A dynamic circular single shear apparatus (EDMCSS) was designed using a laminated shear box for the experiment. The specimen, a cylinder with a diameter of 50 mm and a height of 20 mm, was wrapped in a rubber membrane. Semi-rigid lateral restraints were applied through a low-friction shear ring to ensure effective K0 consolidation, prevent lateral expansion, and maintain a constant shear cross-sectional area. A sealed rubber ring was placed between the upper part of the shear box and the axial actuator indenter to maintain sample integrity. The instrument structure is illustrated in Figure 1. During the test, the vertical displacement remained constant, and constant-volume shear was achieved through the slip of the low-friction shear ring.
The motor-driven shear test equipment system accurately simulates various shear deformations of soil samples in the horizontal direction and is equipped with comprehensive GeoSmartLab software for testing. Table 1 provides details on the accuracy and range parameters of each component. This instrument allows researchers to systematically perform dynamic testing on samples under complex conditions, with the flexibility to adjust parameters such as the cyclic stress ratio, phase difference, loading frequency, and initial shear stress to explore the dynamic response characteristics of the sample.

2.2. Test Soil Samples and Preparation

To ensure testing accuracy and avoid inconsistencies in undisturbed soil, remolded soil was used in this study. Soil samples were collected, sealed in plastic buckets, and subjected to a series of indoor geotechnical tests to determine their physical properties following the ‘Standard for Soil Test Methods’ (GBT 50123-2019) [23]. Table 2 presents the basic physical properties of the soil samples.
The soil sample appeared white after drying, as shown in Figure 2. The specific sample preparation steps included the following: (1) drying, crushing, and sieving the soil sample through a 2 mm sieve before testing; (2) spraying distilled water evenly on the soil material to ensure a uniform moisture distribution, stirring, and sealing for 12 h; (3) preparing the samples using a static pressure method at an initial compaction degree of 95%, compressing for 30 min, and then demolding; (4) vacuuming for 4 h, followed by immersion in water for 12 h using the vacuum saturation method before sealing with a preservative film.

2.3. Test Scheme

To more accurately replicate the wind and wave loads on the surrounding soil during the operational lifespan of a coastal structure foundation, a cyclic shear frequency of 0.1 Hz and an axial consolidation stress of 50 kPa were applied. After completion of the consolidation, the drainage valve was closed to initiate the cyclic shear process under stress control mode. Figure 3 illustrates the stress–strain time history curve during testing, depicting sinusoidal shear stress fluctuations and an increasing shear strain over vibration cycles.
The Consolidation Stress Ratio (CSR) is defined as the ratio of the axial stress (σ) to the maximum shear stress amplitude (τ max) in each cycle. Three moisture content gradients (12.6%, 15.6%, and 18.6%) are tested based on an optimal moisture content of 15.6%, totaling 1000 dynamic cyclic shear tests. Testing halts once the cumulative cyclic shear strain reaches 15%. The specific test parameters are outlined in Table 3.

3. Analysis of Test Results

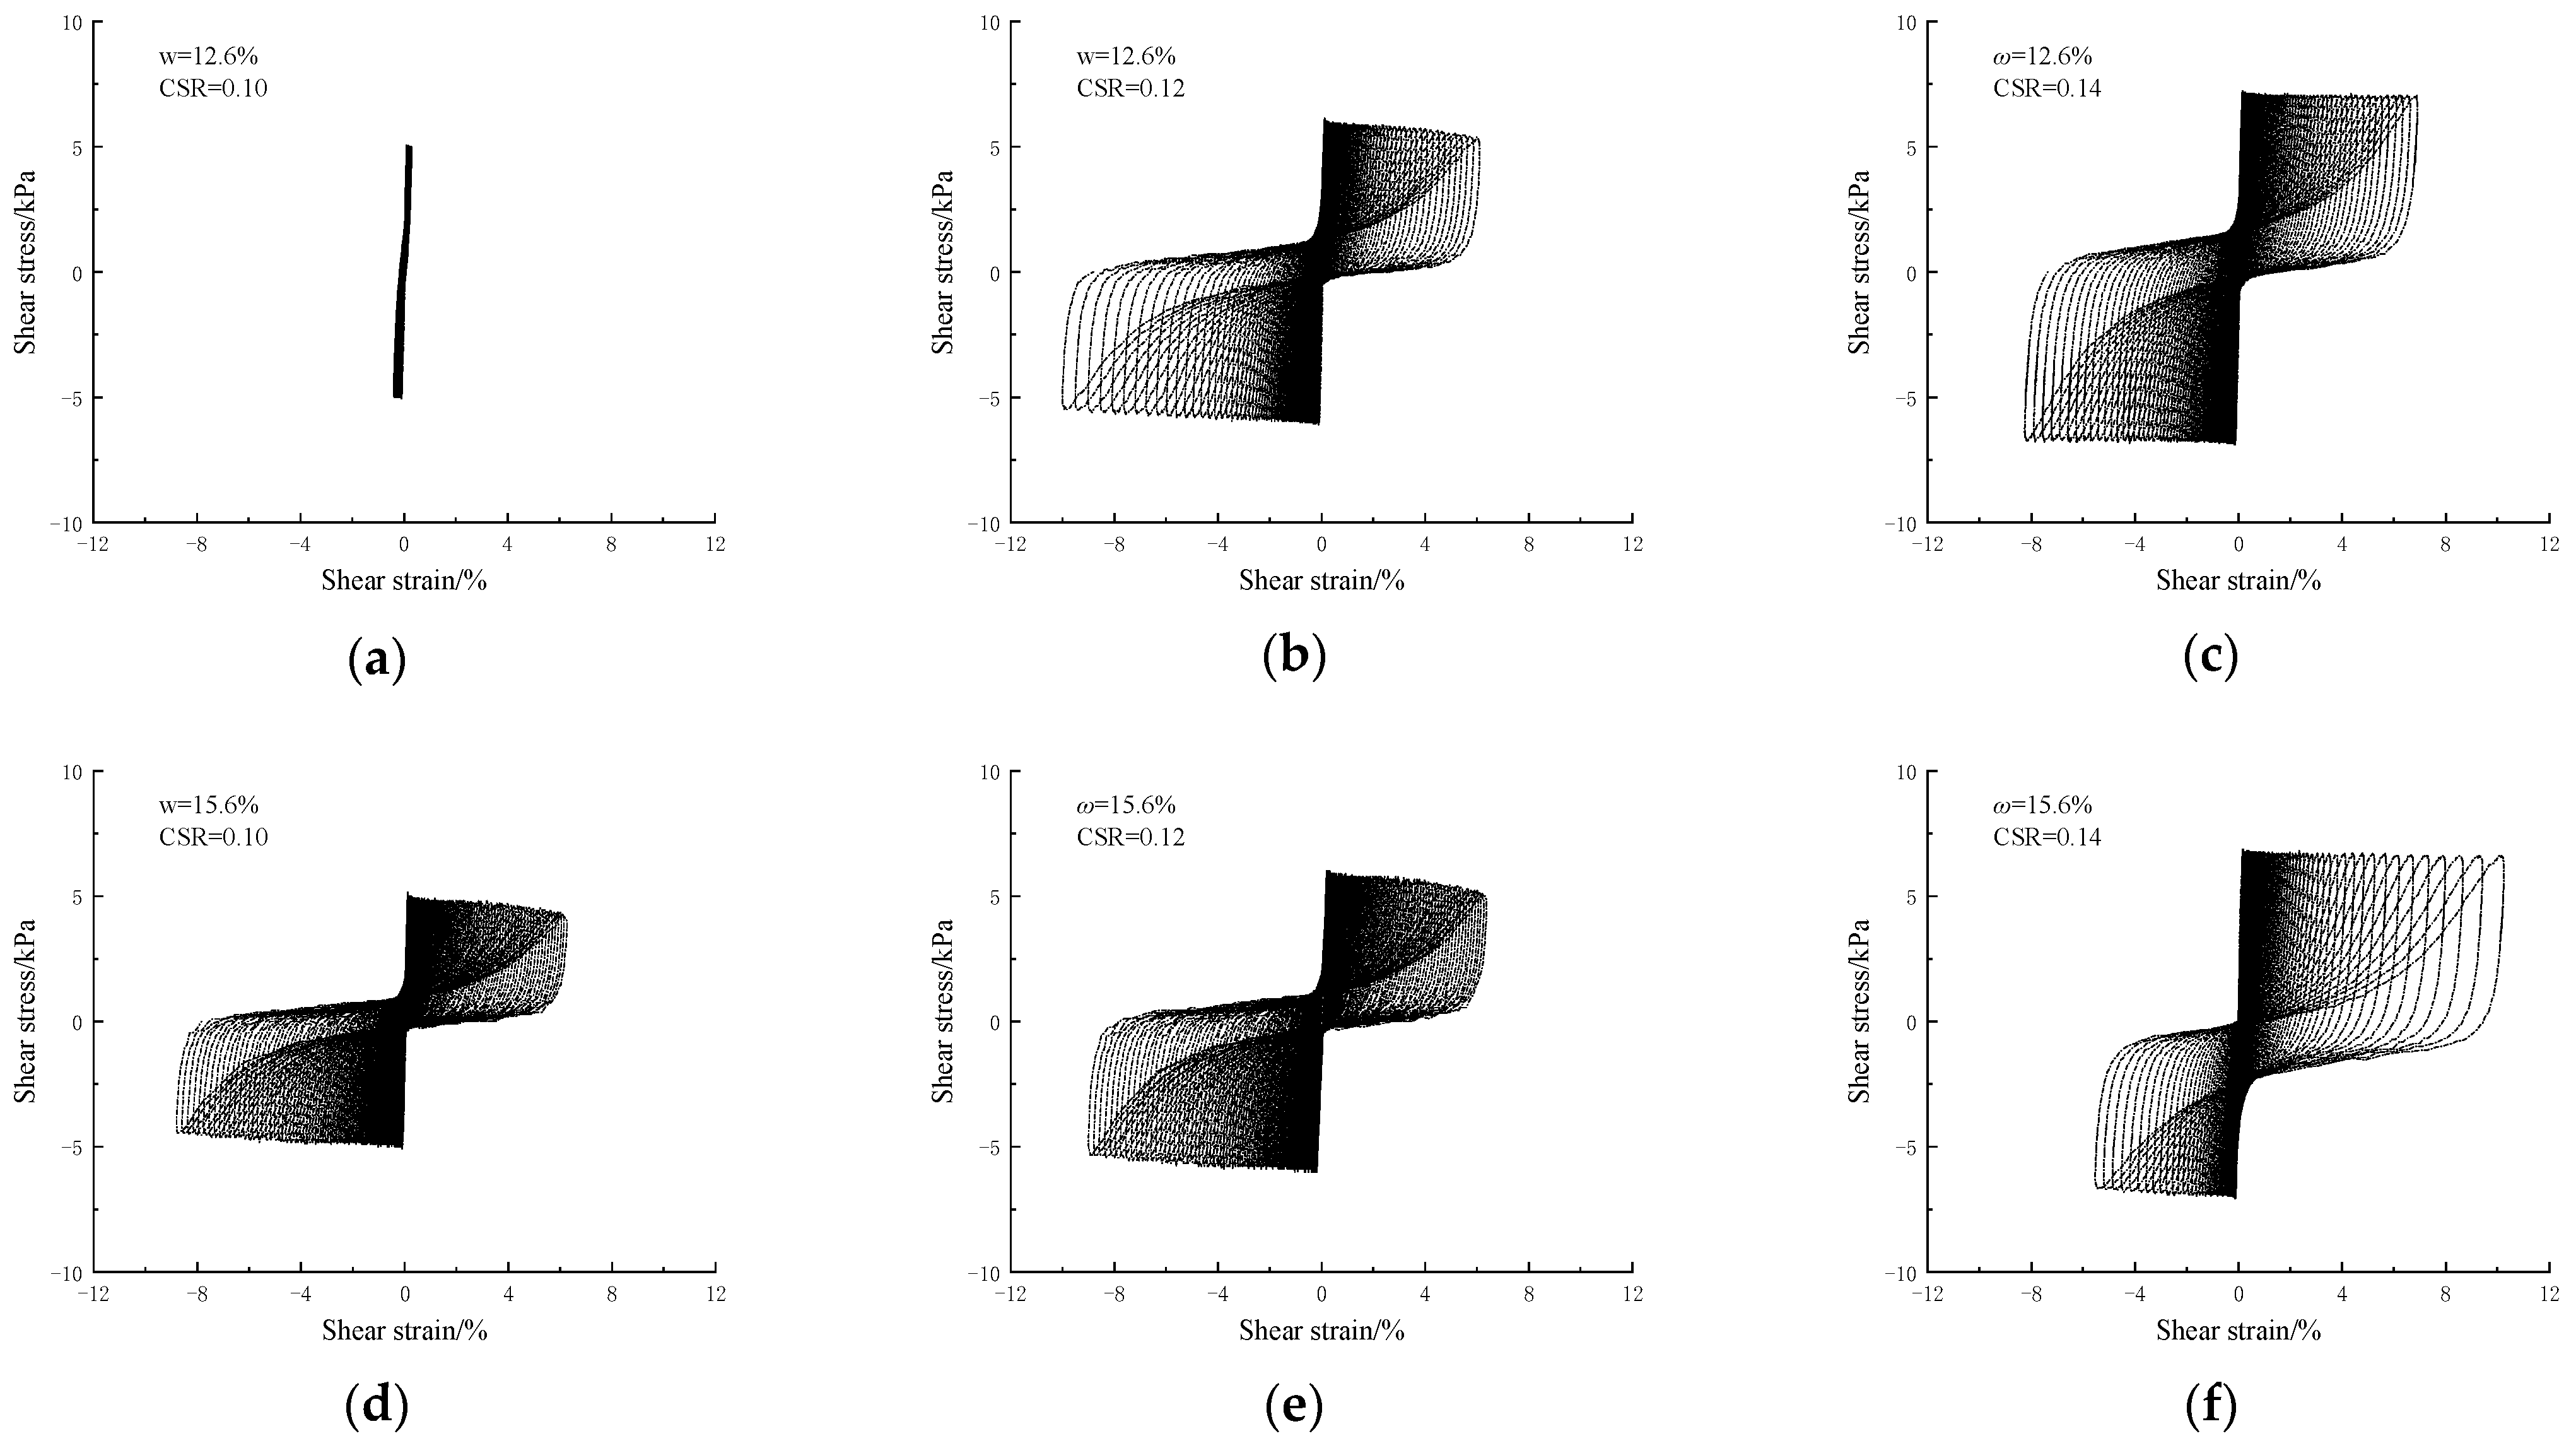
3.1. Stress–Strain Hysteresis Curve

Figure 4 depicts the stress–strain relationships under varying water content and stress cycle ratio conditions. The hysteresis loop near the zero point indicates sample uniformity during fabrication and shearing. At a CSR = 0.10 and a 12.6% moisture content, the maximum single shear strain after 1000 cycles is only 0.4%, with the stress–strain curve being nearly linear, suggesting elastic behavior and minimal cyclic weakening or damage.
Initially, the soil strain growth under cyclic loading is gradual and contained. However, with higher water content and stress cycle ratios, the hysteresis loop broadens, and the differences in strain between cycles increase, leading to a less dense curve pattern. Higher water content and stress cycle ratios accelerate strain differences, resulting in hysteresis curve asymmetry in the later shear stages.

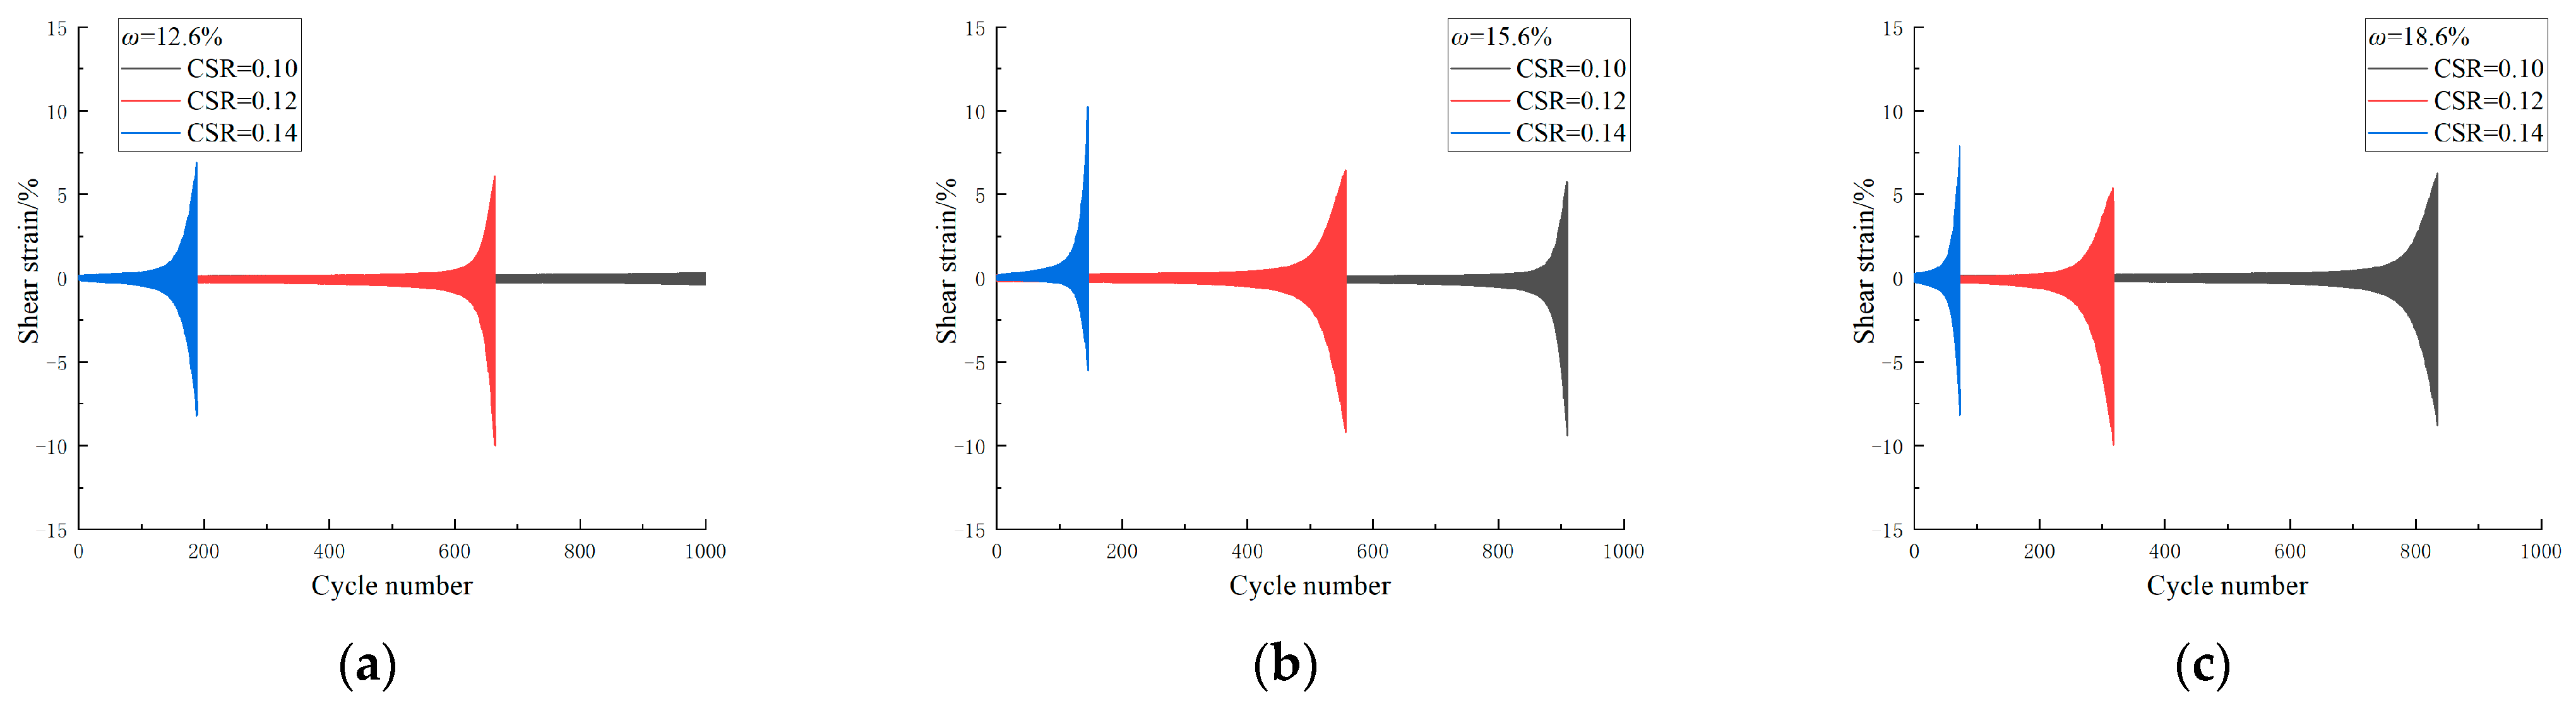
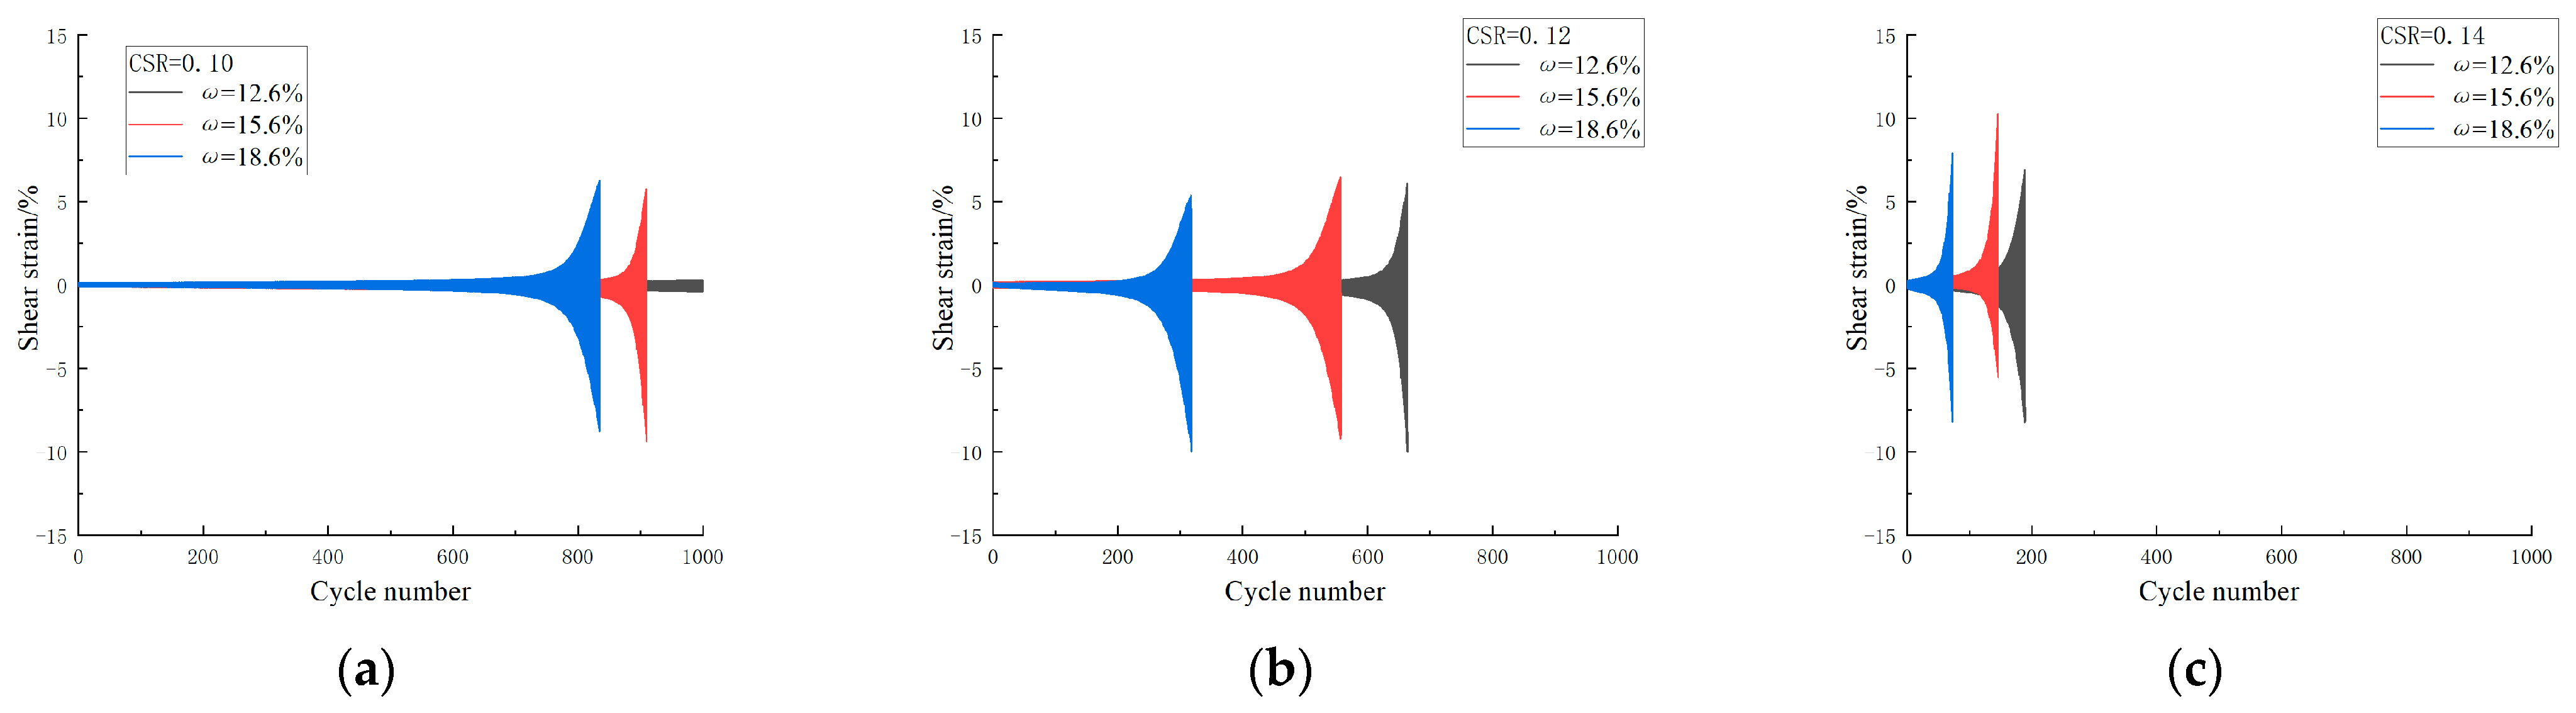
3.2. Cyclic Cumulative Strain

Figure 5 and Figure 6 demonstrate the shear strain versus cycle number under varied water content and stress cycle ratio conditions. The trend shows a gradual strain increase with the number of cycles. Notably, at a CSR = 0.10 and a 12.6% moisture content, a linear curve indicates sample integrity. In other cases, the strain initially rises slowly but sharply accelerates towards failure after an inflection point, signifying sample failure within a few cycles.
Figure 5 illustrates that, at a consistent water content level, the number of cycles needed to reach failure decreases as the stress cycle ratio increases. Moreover, the reduction in the number of failure cycles varies across different stress cycle ratio ranges. Specifically, in Figure 5b, as the CSR increases from 0.10 to 0.12 and from 0.12 to 0.14, the difference in the number of failure cycles decreases by 353 cycles and 441 cycles, respectively. When the moisture content is 18.6%, the difference in CSR within the same interval is 517 cycles and 245 cycles, respectively. This disparity is primarily attributed to the varying rate of damage accumulation in soil under different water content conditions. A higher water content may intensify the impact of water in the material, leading to more severe soil damage at lower stress cycle ratios. Consequently, as the cyclic stress ratio increases, the number of soil damage cycles advances.
Figure 6 shows the relationship between the cumulative strain and the number of cycles under different water content conditions when the CSR is 0.10, 0.12, and 0.14, respectively. It can be clearly seen from the diagram that with the increase in water content, the number of damage cycles shows a decreasing trend, which is especially significant when the CSR is 0.12 and 0.14. As seen in Figure 4a, when the CSR is 0.10, the increase in water content leads to a relatively small decrease in the number of cycles. This is because at a lower stress cycle ratio, the shear stress is relatively small, and the effect of water on the interaction between soil particles is relatively weakened. Therefore, the change in water content has no significant effect on the shear strength. Further observations based on Figure 6b and Figure 4c show that when the CSR is 0.12, the difference between the w = 18.6% curve (blue) and the optimal moisture content curve (red) is greater than the difference between the w = 12.6% curve (black) and the optimal moisture content curve, with specific difference ratios of 42.5% and 19.2%, respectively. Similarly, when the CSR is 0.14, these difference ratios further increase to 50% and 29%, respectively. This shows that above the optimal moisture content, the weakening of soil strength decays faster; under the optimal water content, the attenuation rate is relatively slow. In addition, with the increase in stress cycle ratio, this difference ratio also shows an increasing trend.
In view of the fact that under the condition of 12.6% water content and a CSR = 0.10, the sample did not fail within the first 1000 cycles, additional test data were collected to more accurately explore the relationship between the number of cycles, water content, and stress cycle ratio during failure. The results show that when the double-amplitude cumulative strain reaches 15%, the number of cycles is 1173. Figure 7 shows the relationship between the number of failure cycles, water content, and stress cycle ratio. The number of failure cycles of the soil shows a stepwise downward trend along the x-axis (Water content) and the y-axis (Stress cycle ratio).
By analyzing the strain and cycle number mentioned above, a strong linear correlation is observed between the number of failure cycles, the stress cycle ratio, and the water content. The following equation can be used for fitting purposes:
N = A + B * x,
When subjected to dynamic shear loading, the aforementioned equation can effectively assess the failure vibration cycles corresponding to the varying water content and cyclic stress ratios. The specific fitting parameters A and B can be found in Table 4 and Table 5.
Figure 8 illustrates the fitting correlation between the number of failure cycles, water content, and stress cycle ratio. It is evident that regardless of the water content and stress cycle ratio, the fitting relationship for the number of failure cycles displays a consistent pattern. As the water content and stress cycle ratio increase, the values of fitting curves A and B decrease, causing the curves to collectively shift downward. This indicates that the water content and stress cycle ratio have a significant influence on the cyclic strain failure of soil.

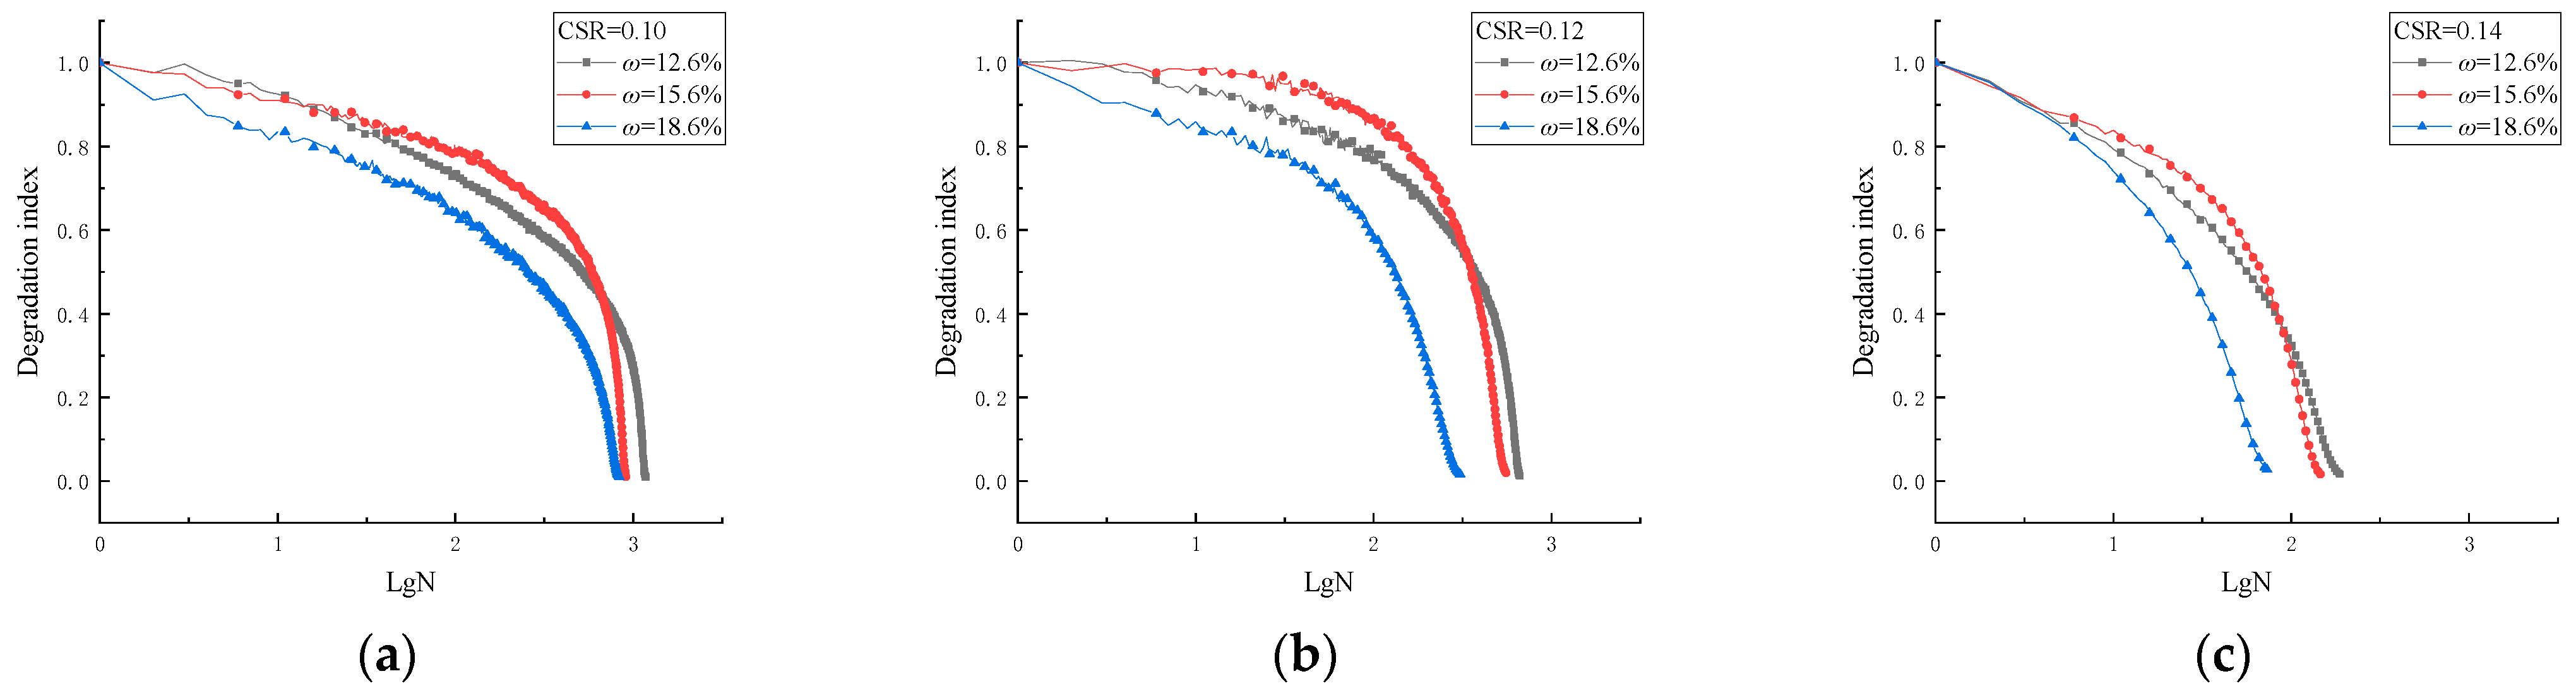
3.3. Softening Index

In accordance with Idriss et al. [24], the softening index of soft clay under cyclic loading is defined, introducing the concept of the ‘Softening index δ’ to evaluate the cyclic softening effect of soft soil. In the formula, G 1 and G N represent the dynamic shear modulus of the first and Nth cyclic soils in cyclic shear; τmax and τmin denote the maximum and minimum shear stress in each cycle, respectively, while γmax and γmin represent the maximum and minimum shear strain, respectively. See Figure 9.
δ = G N G 1 = τ N max τ N min γ N max γ N min τ 1 max τ 1 min γ 1 max γ 1 min = 2 τ d γ N max γ N min 2 τ d γ 1 max γ 1 min = γ 1 max γ 1 min γ N max γ N min
Figure 10 depicts the relationship between the softening index and the number of cycles under varying water content conditions. As the number of cycles increases, the softening index gradually decreases. At the same water content level, the cyclic stress ratio significantly impacts the softening behavior. With an increase in the cyclic stress ratio, the softening index of the soil decreases more rapidly after the same number of cycles, indicating a more pronounced softening degree of the soil. Notably, the softening rate of the soil slows down when the cyclic stress ratio rises from 0.10 to 0.12. However, at a cyclic stress ratio of 0.14, the softening rate experiences a sharp increase. This suggests that under high cyclic stress ratios, more severe damage evolution may occur within the soil, leading to a rapid decline in its softening index. While the softening rate of soil under a 0.12 stress cycle ratio is higher than that under a 0.10 stress cycle ratio, the softening index of the former briefly surpasses that of the latter in the initial stage of the shear process. This phenomenon indicates that in the early stages of shear, the softening rate of the soil subjected to a 0.12 stress cycle ratio is relatively slow. The substantial stress level may result in more significant relative sliding and rearrangement between clay particles, extending the transition period of the soil’s properties from elasticity to plasticity during the initial cyclic shear stage and leading to the soil temporarily exhibiting a certain hardening effect. This hardening effect effectively counteracts or delays the softening trend of the soil initially, leading to a short-term increase in the softening index.
Figure 11 illustrates the correlation between the softening index and the number of cycles under varying stress cycle ratios. A higher water content in the soil at the same stress cycle ratio leads to a more rapid decrease in the softening index after the same number of cycles, resulting in greater soil softening. The rate of soil softening varies across different stress cycle ratios, with faster softening observed at a CSR = 0.14 compared to a CSR = 0.10. Increasing the water content under the same stress cycle ratio causes a downward trend in the softening index curve. This is attributed to the gradual increase in water between the soil particles as the water content rises, altering the interaction between the particles. However, when the stress levels remain constant under the same stress cycle ratio, the relative displacement and rearrangement of soil particles remain relatively stable. In this scenario, the softening index is primarily influenced by the stress levels, with water content changes having a relatively minor impact. Additionally, similar to Figure 9, at a water content of 15.6%, the softening index decreases slowly during the initial shear stages, potentially exceeding that of samples with 12.6% water content. This suggests that the particle arrangement and soil structure within the soil may reach a relatively stable state at an optimal water content, enhancing the soil’s resistance to deformation and its failure during cyclic shear and resulting in strain hardening that slows the softening rate.

4. Conclusions

This study conducted undrained cyclic simple shear tests on soft coastal beach soil under various cyclic stress ratios and water content conditions. Through a detailed examination of the influence of the cyclic stress ratios and water content on soil’s dynamic strength, the following key findings were made:
  • As the water content and stress cycle ratio increase, the stress–strain hysteresis loop widens, the strain differential grows, the curve transitions from dense to sparse, the symmetry of the hysteresis curve is lost in the later stages of shearing, and soil damage intensifies.
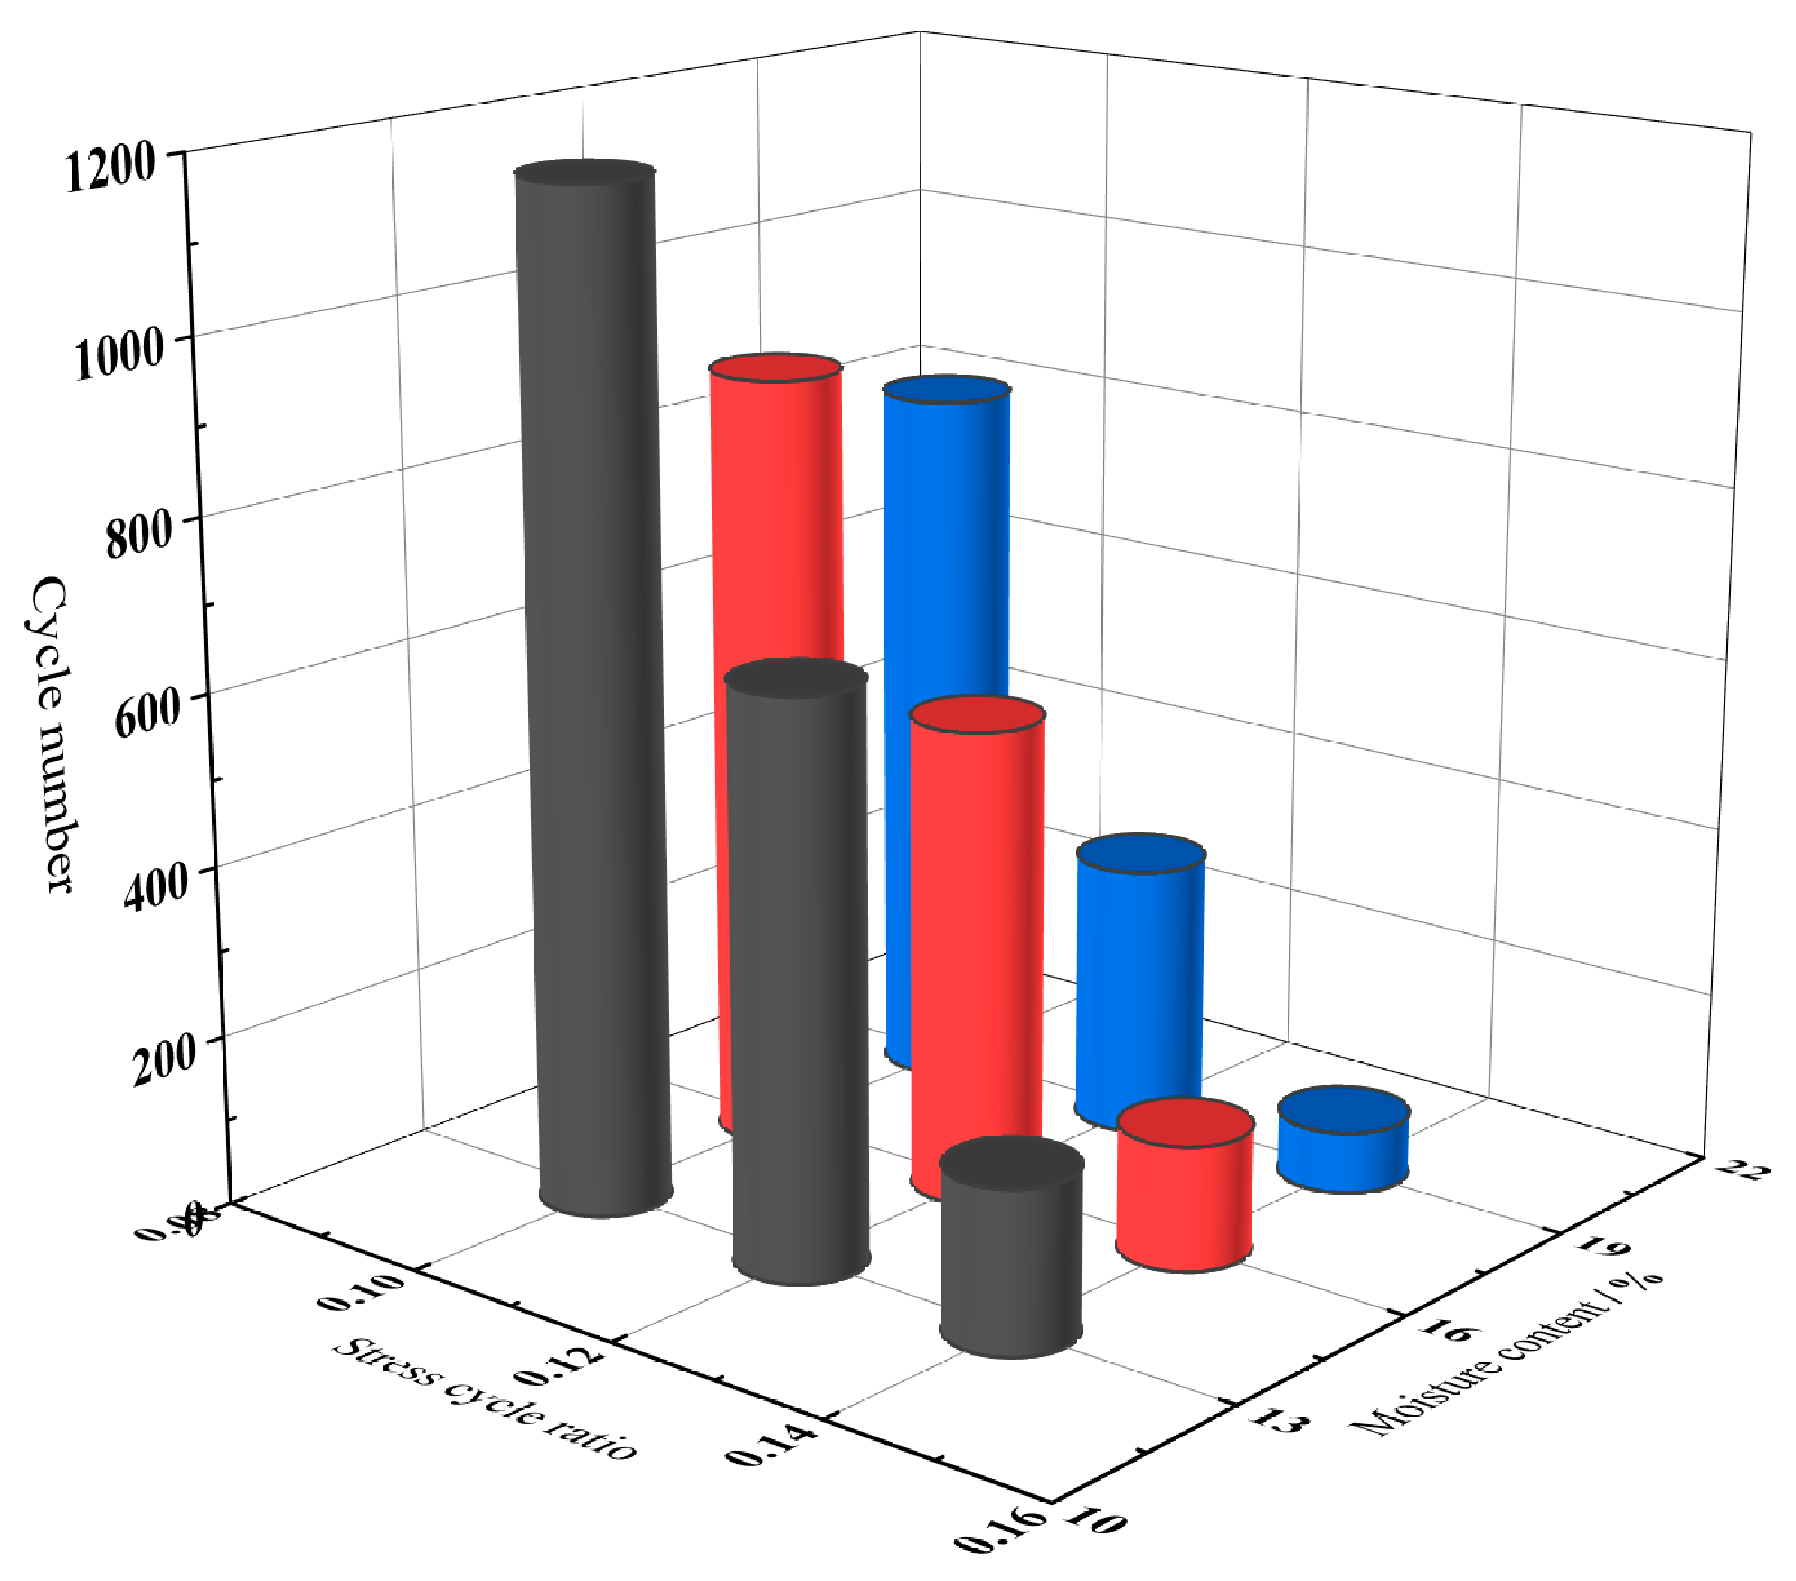
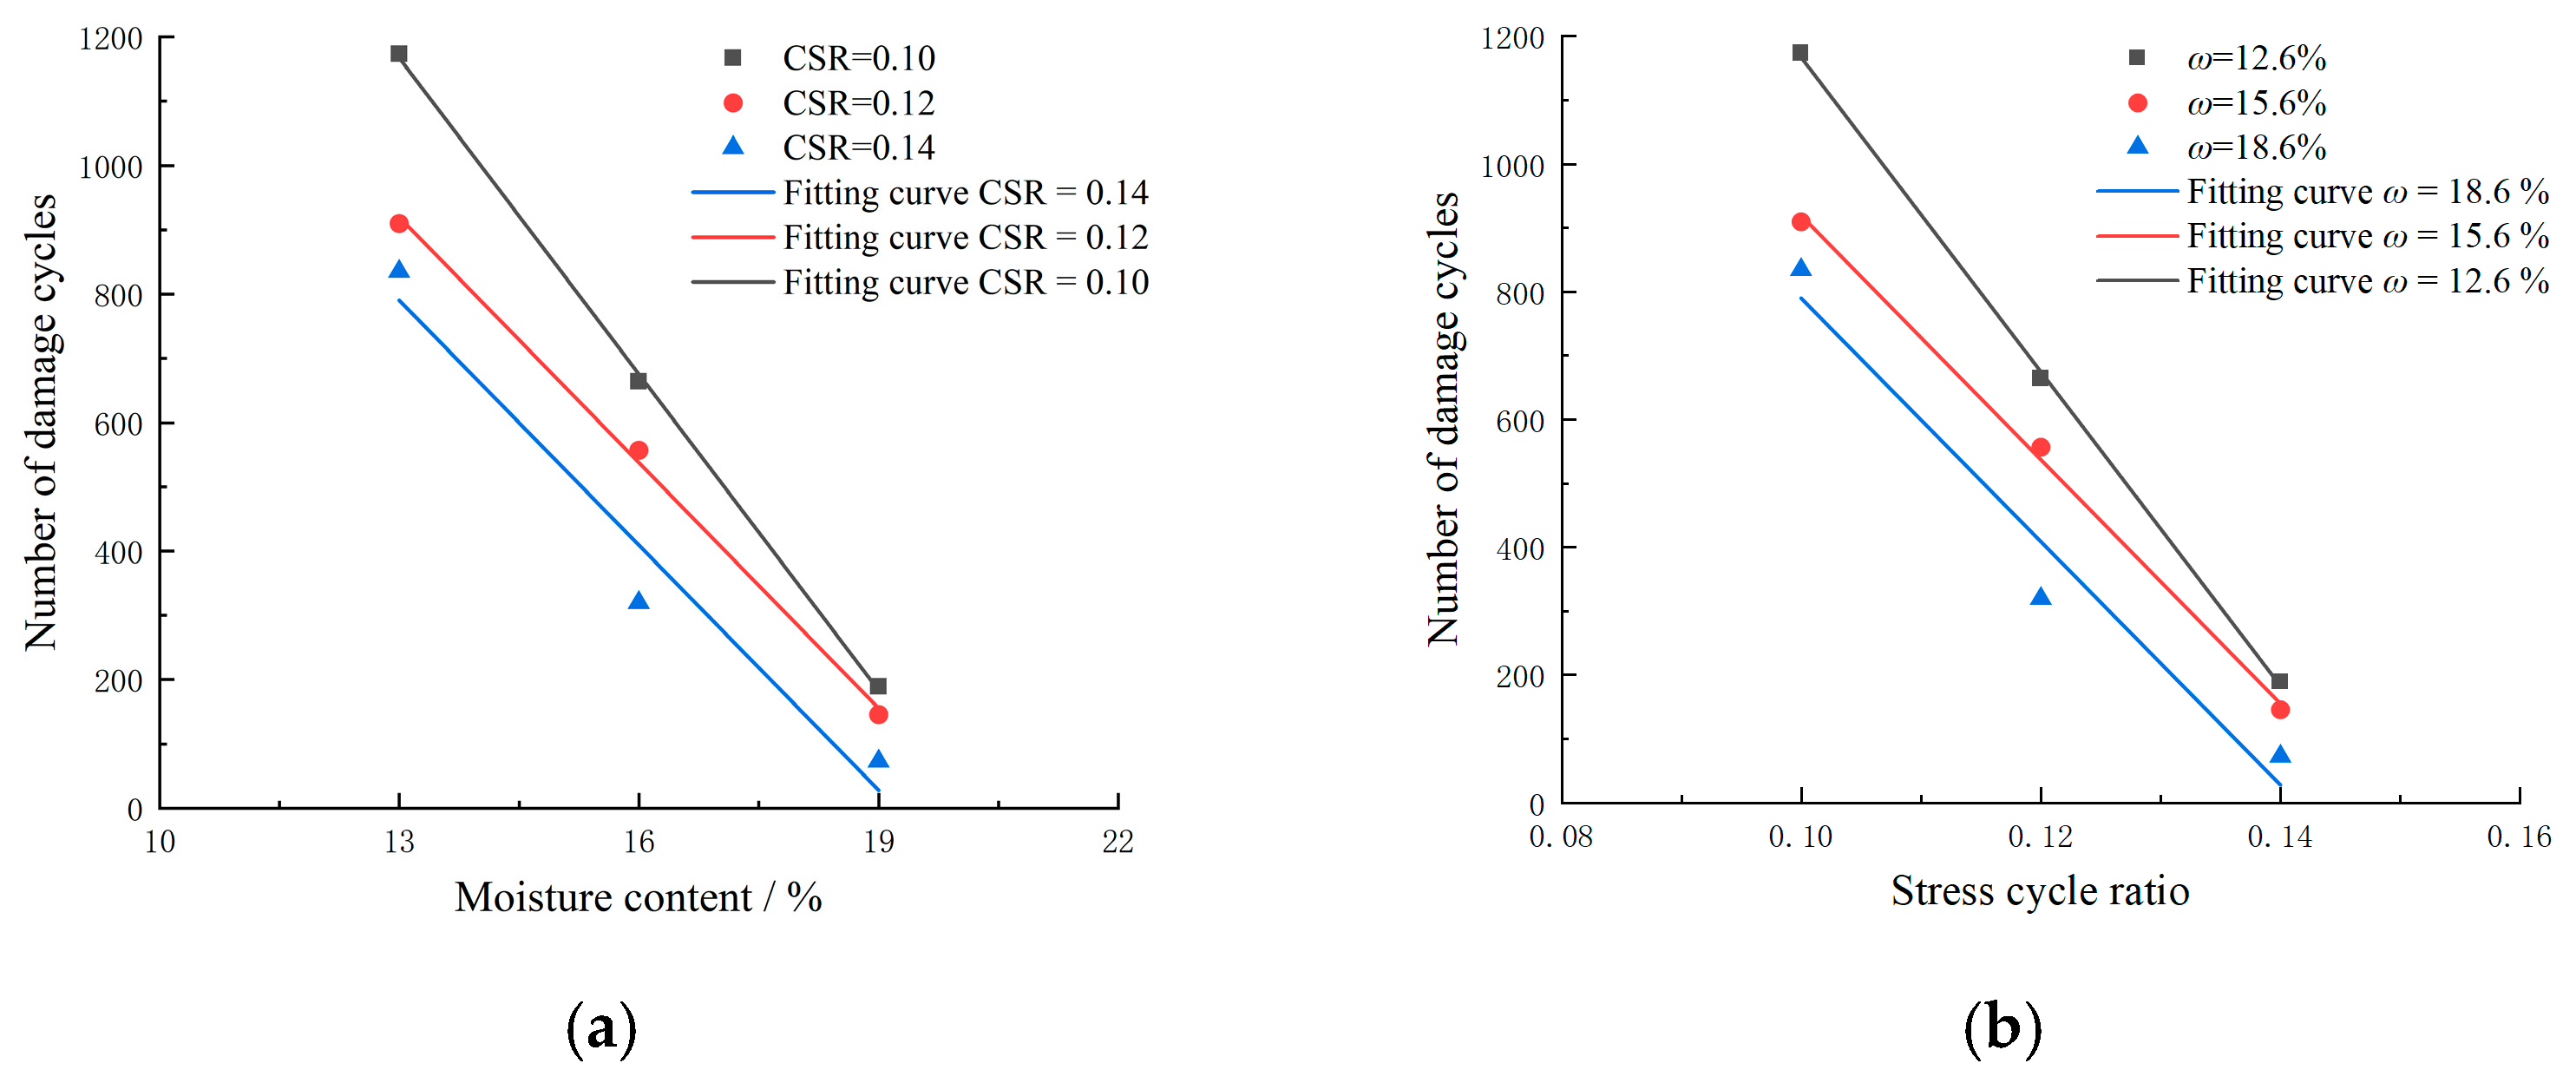
  • This study discusses the impact of different water content conditions and stress cycle ratios on the shear strain and soil failure behavior. The results indicate that the strain increases with cycle number, while higher water contents and stress cycle ratios lead to reduced shear strain and accelerated soil failure. Moreover, soil’s strength deteriorates more rapidly above its optimal water content. A predictive formula for the number of failure cycles, considering varying cyclic stress ratios and water content conditions, was developed based on our test results.
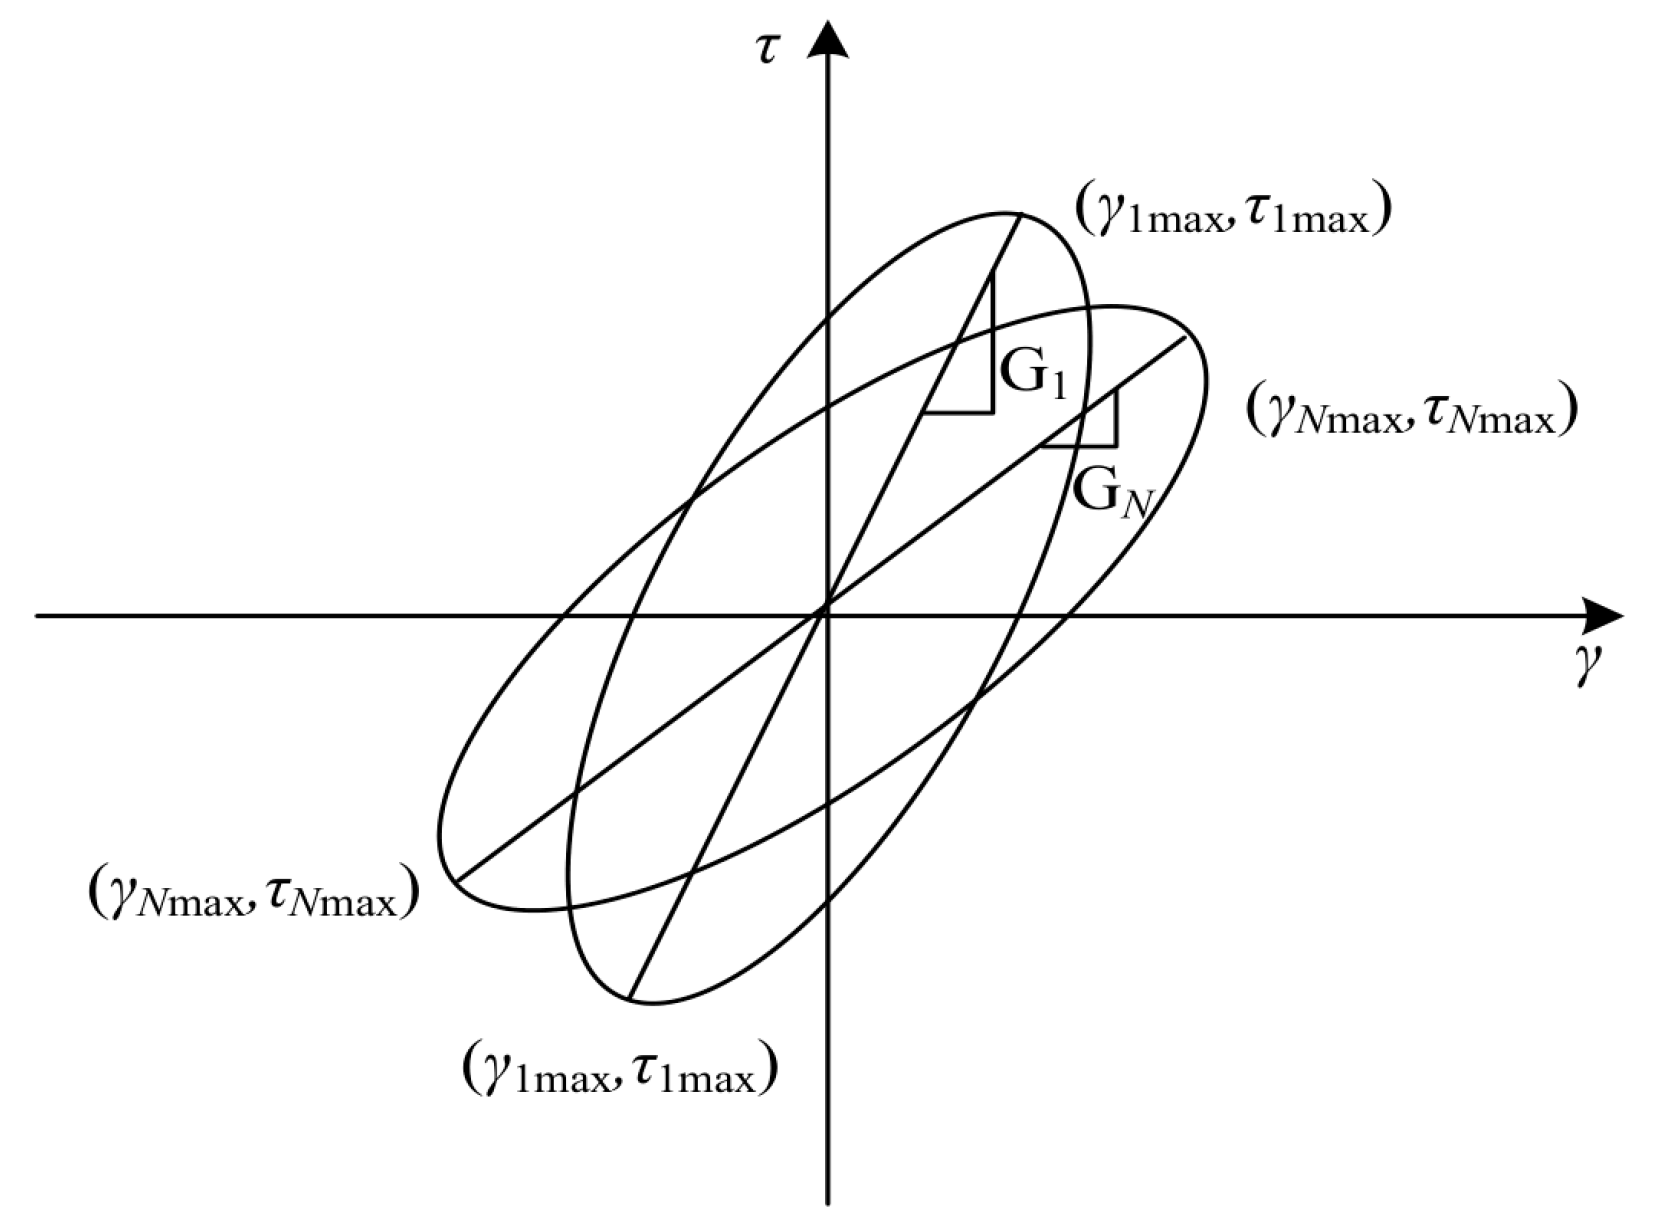
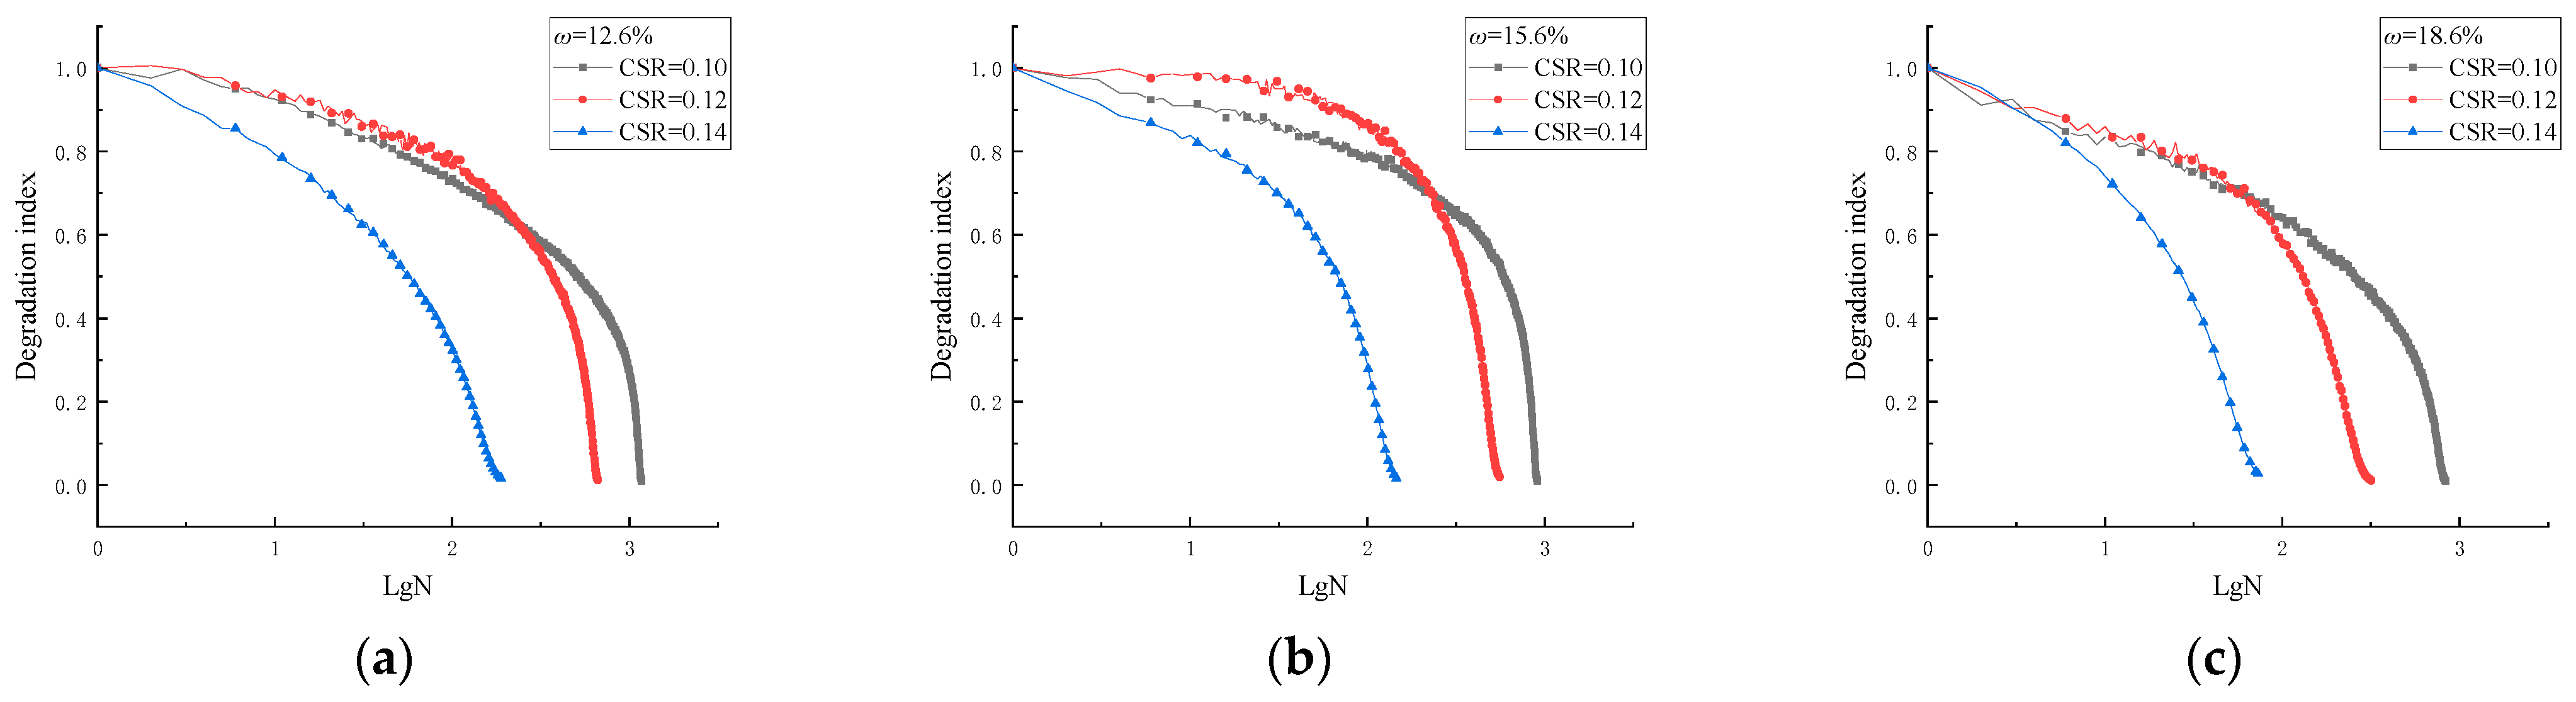
  • This study also explores the effects of water content and cyclic stress ratios on soil softening behavior. The findings reveal a gradual decrease in the softening index with an increasing cycle number, while higher water contents and cyclic stress ratios accelerate the soil softening process. At high cyclic stress ratios, more severe damage evolution may occur within the soil, leading to a rapid decline in its cyclic shear strength. Conversely, under optimal water content conditions, the soil may exhibit strong resistance to deformation due to the relative stability of the particle arrangement and structure, resulting in a slow softening rate during initial shear stages.

Author Contributions

Conceptualization, J.L. and X.Y.; methodology, H.S.; formal analysis, Y.H.; resources, J.L.; data curation, H.S.; writing—original draft preparation, H.Z.; writing—review and editing, Y.H.; visualization, X.Y.; supervision, X.Y.; project administration, J.L. All authors have read and agreed to the published version of the manuscript.

Funding

This study was funded by Joint Funds of the National Natural Science Foundation of China (Grant No. U2006225), Taishan Scholars Program (Grant No. tsqn202211176), National Nature Science Foundation of China (Grant No. 42277135), and Shandong Provincial Natural Science Foundation (Grant No. ZR2021YQ31).

Institutional Review Board Statement

Not applicable.

Informed Consent Statement

Not applicable.

Data Availability Statement

The original contributions presented in the study are included in the article, and further inquiries can be directed to the corresponding authors.

Acknowledgments

The authors would like to thank Yu Xiuxia and Sun Honglei for conceptualization, Liu Junwei for material help, and Han Yu for experimental data.

Conflicts of Interest

The authors declare no conflicts of interest.

References

  1. Xu, Y.; Guo, J. Analysis on the causes of special engineering properties of marine soil. Rock Soil Mech. 1989, 67–74. [Google Scholar] [CrossRef]
  2. Veletsos, A.S.; Meek, J.W. Dynamic Behavior of Building-foundation Systems. Earthq. Eng. Struct. D. 1974, 3, 121–138. [Google Scholar] [CrossRef]
  3. Ahmad, M.; Ray, R. Modeling the Stiffening Behavior of Sand Subjected to Dynamic Loading. Geosciences 2024, 14, 26. [Google Scholar] [CrossRef]
  4. Wang, J.; Yao, S.; Guo, L.; Sun, Y.; Fu, H.; Gao, Z. Cyclic Softening Characteristics of Soft Clay Considering Initial Shear Stress in Same or Perpendicular Direction. Ocean Eng. 2024, 293, 116515. [Google Scholar] [CrossRef]
  5. Nikitas, G.; Arany, L.; Aingaran, S.; Vimalan, J.; Bhattacharya, S. Predicting Long Term Performance of Offshore Wind Turbines Using Cyclic Simple Shear Apparatus. Soil Dyn. Earthq. Eng. 2017, 92, 678–683. [Google Scholar] [CrossRef]
  6. Cui, L.; Aleem, M.; Shivashankar; Bhattacharya, S. Soil–Structure Interactions for the Stability of Offshore Wind Foundations under Varying Weather Conditions. J. Mar. Sci. Eng. 2023, 11, 1222. [Google Scholar] [CrossRef]
  7. Andersen, K.H.; Lauritzsen, R. Bearing Capacity for Foundations with Cyclic Loads. J. Geotech. Eng. 1988, 114, 540–555. [Google Scholar] [CrossRef]
  8. Andersen, K.H.; Kleven, A.; Heien, D. Cyclic Soil Data for Design of Gravity Structures. J. Geotech. Eng. 1988, 114, 517–539. [Google Scholar] [CrossRef]
  9. Wang, J.; Cai, Y.; Xu, C. Experimental study on the stiffness softening characteristics of soft clay under cyclic loading. Rock Soil Mech. 2007, 2138–2144. [Google Scholar] [CrossRef]
  10. Liu, F.; Cai, Y.; Xu, C.; Wang, J. Research on the attenuation law of dynamic elastic modulus of soft soil under cyclic loading. J. Zhejiang Univ. 2008, 1479–1483. [Google Scholar]
  11. Guo, L.; Jin, H.; Wang, J.; Shi, L. Undrained Monotonic Shear Behavior of Marine Soft Clay after Long-Term Cyclic Loading. Mar. Georesour. Geotechnol. 2020, 38, 854–866. [Google Scholar] [CrossRef]
  12. Chen, Z.; Zheng, S.; Qian, C.; Wu, H.; Xu, H.; Tu, D.; Chen, C. Experimental study on the deformation characteristics of soft clay foundation under multi-directional cyclic shear stress path. Archit. Sci. 2023, 39, 114–120. [Google Scholar] [CrossRef]
  13. Wang, J.; Yuan, W.; Yin, X.; Li, W.; Li, X. One-Dimensional Consolidation Properties of Soft Clay under Multi-Stage Loading. Appl. Sci. 2023, 13, 10340. [Google Scholar] [CrossRef]
  14. Zhang, Y.; Jia, M.; Xie, Z. Effect of Stress Rotation Angles on Dynamic Responses of Soft Clay under Multi-Directional Loading. Soil Dyn. Earthq. Eng. 2023, 165, 107711. [Google Scholar] [CrossRef]
  15. Ansal, A.M.; Erken, A. Undrained Behavior of Clay Under Cyclic Shear Stresses. J. Geotech. Eng. 1989, 115, 968–983. [Google Scholar] [CrossRef]
  16. Zhou, J.; Gong, X. Strain Degradation of Saturated Clay under Cyclic Loading. Can. Geotech. J. 2001, 38, 208–212. [Google Scholar] [CrossRef]
  17. Wichtmann, T.; Andersen, K.H.; Sjursen, M.A.; Berre, T. Cyclic Tests on High-Quality Undisturbed Block Samples of Soft Marine Norwegian Clay. Can. Geotech. J. 2013, 50, 400–412. [Google Scholar] [CrossRef]
  18. Leng, J.; Ye, G.; Ye, B.; Jeng, D.-S. Laboratory Test and Empirical Model for Shear Modulus Degradation of Soft Marine Clays. Ocean Eng. 2017, 146, 101–114. [Google Scholar] [CrossRef]
  19. Huang, B.; Cai, S.; Li, J.; Wu, K.; Yang, W. Undrained Strength of Clay Determined from Simple Shear Test. Front. Earth Sci. 2023, 10, 1098846. [Google Scholar] [CrossRef]
  20. Jin, H.; Guo, L.; Sun, H.; Shi, L.; Cai, Y. Undrained Cyclic Shear Strength and Stiffness Degradation of Over consolidated Soft Marine Clay in Simple Shear Tests. Ocean Eng. 2022, 262, 112270. [Google Scholar] [CrossRef]
  21. Jin, H.; Guo, L.; Sun, H.; Wu, T.; Shi, L.; Cai, Y. Energy-Based Evaluation of Undrained Cyclic Behavior of Marine Soft Clay under Multidirectional Simple Shear Stress Paths. Acta Geotech. 2023, 18, 2883–2898. [Google Scholar] [CrossRef]
  22. Xiao, X.; Wang, Z.; Wu, Q.; Zhou, R.; Chen, G. Shear-Thinning Non-Newtonian Fluid-Based Method for Investigating Cyclic Stiffness Degradation of Marine Clay. Ocean Eng. 2024, 300, 117499. [Google Scholar] [CrossRef]
  23. GB/T 50123-2019; Standard for Soil Test Methods. Ministry of Housing and Urban-Rural Development of the People’s Republic of China: Beijing, China, 2019.
  24. Idriss, I.M.; Singh, R.D.; Dobry, R. Nonlinear behavior of soft clay during cyclic loading. J. Geotech. Eng. 1978, 104, 1427–1447. [Google Scholar] [CrossRef]
Figure 1. Schematic diagram of the EDMCSS circular simple shear apparatus: (a) front view of the equipment; (b) side view of the shear box.
Jmse 12 01066 g001
Figure 2. Appearance of soil sample appearance diagram: (a) Soil samples after drying; (b) Sample appearance.
Jmse 12 01066 g002
Figure 3. Stress control loading mode diagram: (a) shear stress time history curve; (b) shear strain time history curve.
Jmse 12 01066 g003
Figure 4. Stress paths under different moisture contents (ω) and stress cycle ratios (CSRs): (a) stress path diagram under ω = 12.6% and CSR = 0.10; (b) stress path diagram under ω = 12.6% and CSR = 0.12; (c) stress path diagram under ω = 12.6% and CSR = 0.14; (d) stress path diagram under ω = 15.6% and CSR = 0.10; (e) stress path diagram under ω = 15.6% and CSR = 0.12; (f) stress path diagram under ω = 15.6% and CSR = 0.14; (g) stress path diagram under ω = 18.6% and CSR = 0.10; (h) stress path diagram under ω = 18.6% and CSR = 0.12; and (i) stress path diagram under ω = 18.6% and CSR = 0.14.
Jmse 12 01066 g004aJmse 12 01066 g004b
Figure 5. The relationship between the shear strain and the cycle number under different water content conditions: (a) ω = 12.6%; (b) ω = 15.6%; and (c) ω = 18.6%.
Jmse 12 01066 g005
Figure 6. The relationship between the shear strain and the cycle number under different stress cycle ratios: (a) CSR = 0.10; (b) CSR = 0.12; and (c) CSR = 0.14.
Jmse 12 01066 g006
Figure 7. Relationship diagram of the number of damage cycles.
Jmse 12 01066 g007
Figure 8. Diagram of fitting correlations of damage circle number: (a) moisture content; (b) stress cycle ratio.
Jmse 12 01066 g008
Figure 9. Diagram of shear modulus G1 and GN.
Jmse 12 01066 g009
Figure 10. The relationship between the softening index and cycle number under different water content conditions: (a) ω = 12.6%; (b) ω = 15.6%; and (c) ω = 18.6%.
Jmse 12 01066 g010
Figure 11. The relationship between the softening index and the cycle number under different stress cycle ratios: (a) CSR = 0.10; (b) CSR = 0.12; and (c) CSR = 0.14.
Jmse 12 01066 g011
Table 1. Instrument parameters and accuracy.
Displacement (mm) Measurement Accuracy (um)Loading Range (kN)Sample Size (mm)
±25 (Axial)
±15 (Shear)
0.3Axial = 5
Shear = 2
50 × 20
Table 2. Basic physical parameters of soil samples.
Moisture Content ω/%Specific Gravity dsVoid Ratio eLiquid Limit wl/%Plastic Limit wp/%Maximum Dry Density ρ/(g/cm3)Optimal Moisture Content %
76.102.691.6568351.6815.6
Table 3. Undrained cyclic shear test scheme.
No.Axial Stress σ/(kPa)Stress Cycle Ratio CSRMoisture Content ω/(%)
T-1500.1012.6
T-2500.1215.6
T-3500.1418.6
T-4500.1012.6
T-5500.1215.6
T-6500.1418.6
T-7500.1012.6
T-8500.1215.6
T-9500.1418.6
Table 4. Parameter values under different water content conditions.
Moisture ContentA (104)B (104)R2
12.6%0.3627−2.460.99
15.6%0.2829−1.910.99
17.6%0.2695−1.9050.92
Table 5. Parameter values under different stress cycle ratios.
Stress Cycle RatioA (104)B (102)R2
0.100.3233−1.640.99
0.120.2524−1.2730.99
0.140.2390−1.270.92
Disclaimer/Publisher’s Note: The statements, opinions and data contained in all publications are solely those of the individual author(s) and contributor(s) and not of MDPI and/or the editor(s). MDPI and/or the editor(s) disclaim responsibility for any injury to people or property resulting from any ideas, methods, instructions or products referred to in the content.

