Article

Interannual Variation of Summer Sea Surface Salinity in the Dotson–Getz Trough, West Antarctica

1
State Key Laboratory of Satellite Ocean Environment Dynamics, Second Institute of Oceanography, Ministry of Natural Resources, Hangzhou 310012, China
2
Southern Marine Science and Engineering Guangdong Laboratory (Zhuhai), Zhuhai 519000, China
3
Guangzhou Institute of Railway Technology, Guangzhou 511300, China
*
Author to whom correspondence should be addressed.
J. Mar. Sci. Eng. 2024, 12(7), 1067; https://doi.org/10.3390/jmse12071067
Submission received: 16 May 2024 / Revised: 15 June 2024 / Accepted: 20 June 2024 / Published: 25 June 2024
(This article belongs to the Section Physical Oceanography)

Abstract

:
In this study, we explore the interannual variability of Sea Surface Salinity (SSS) in the Dotson–Getz Trough located in West Antarctica, focusing on the month of February. Utilizing the oceanic analysis product EN4, we first validate the EN4 SSS with data from a singular ship-based survey, and then delve into potential factors that may influence SSS, with a particular emphasis on surface freshwater flux, sea ice concentration (SIC), and also the surface stress curl, which will induce upwelling via Ekman transport to affect the SSS. Our findings primarily indicate a link between SSS and sea ice concentration, showcasing a negative correlation where the peak (average) coefficient is around −0.6 (−0.4), further affirming the substantial interannual variability of SSS in this region.

1. Introduction

The Dotson–Getz Trough (DGT) is a deep shelf channel that connects the Amundsen Sea Shelf to the West Antarctica slope [1,2,3], as shown in Figure 1. Specifically, the DGT is a region where warm water from the deep ocean comes into contact with the floating ice shelves, which can lead to the melting and destabilization of the ice shelves and ice sheet [4,5,6,7,8,9]. The DGT is also an important region for marine life, including krill, which are a key food source for many species of whales, seals, and birds [10,11].
In recent years, there has been growing interest in studying the Sea Surface Salinity (SSS) variability in this region, as it provides important information about the ocean circulation, the distribution of oceanic heat, freshwater balance, and even global climate patterns [12,13,14,15,16]. SSS variability in the DGT can affect the distribution and abundance of the organisms mentioned above, which can have cascading effects throughout the food web [12]. Therefore, the variations in SSS can have important implications for ocean circulation, ice shelf stability, and marine ecosystems [17,18,19]. SSS variability in the DGT is influenced by a range of factors, including changes in sea ice cover, freshwater input from melting ice shelves and glaciers, and ocean circulation driven by winds and tides [20,21,22]. For example, Shin et al. (2022) used noble gases to delineate the meltwater distribution and found the meltwater up to the surface layer in the DGT [22].
Although critical, our understanding of both SSS and its variation in the DGT remains limited due to the challenges and costs associated with field observations, particularly in the winter, and risks to surface-level equipment from icebergs [8,21,23]. Given the lack of previous analyses, the study aims to investigate the interannual variation in SSS in the DGT. The paper’s primary objective is to investigate these yearly changes and to elucidate the relationship between SSS, surface freshwater flux, sea ice concentration (SIC), and surface stress curl, which will induce upwelling/downwelling via Ekman transport to change the SSS, with the ultimate goal of revealing the underlying drivers behind SSS variations. For this purpose, the EN4 [24] ocean analysis dataset has been chosen. The study begins with validation of the EN4 dataset’s credibility through a one-time in situ observation. Following this, an analysis of SSS’s interannual variation using the EN4 dataset is conducted. Given that high-quality, ship-based surveys are predominantly carried out during the summer months, the month of February is selected as the focal point for this analysis.
The paper is structured as follows: Section 2 introduces the employed data and methodology, Section 3 presents the validation and analysis outcomes using EN4 dataset, and Section 4 concludes with a summary of the primary findings alongside necessary discussions.

2. Data and Methods

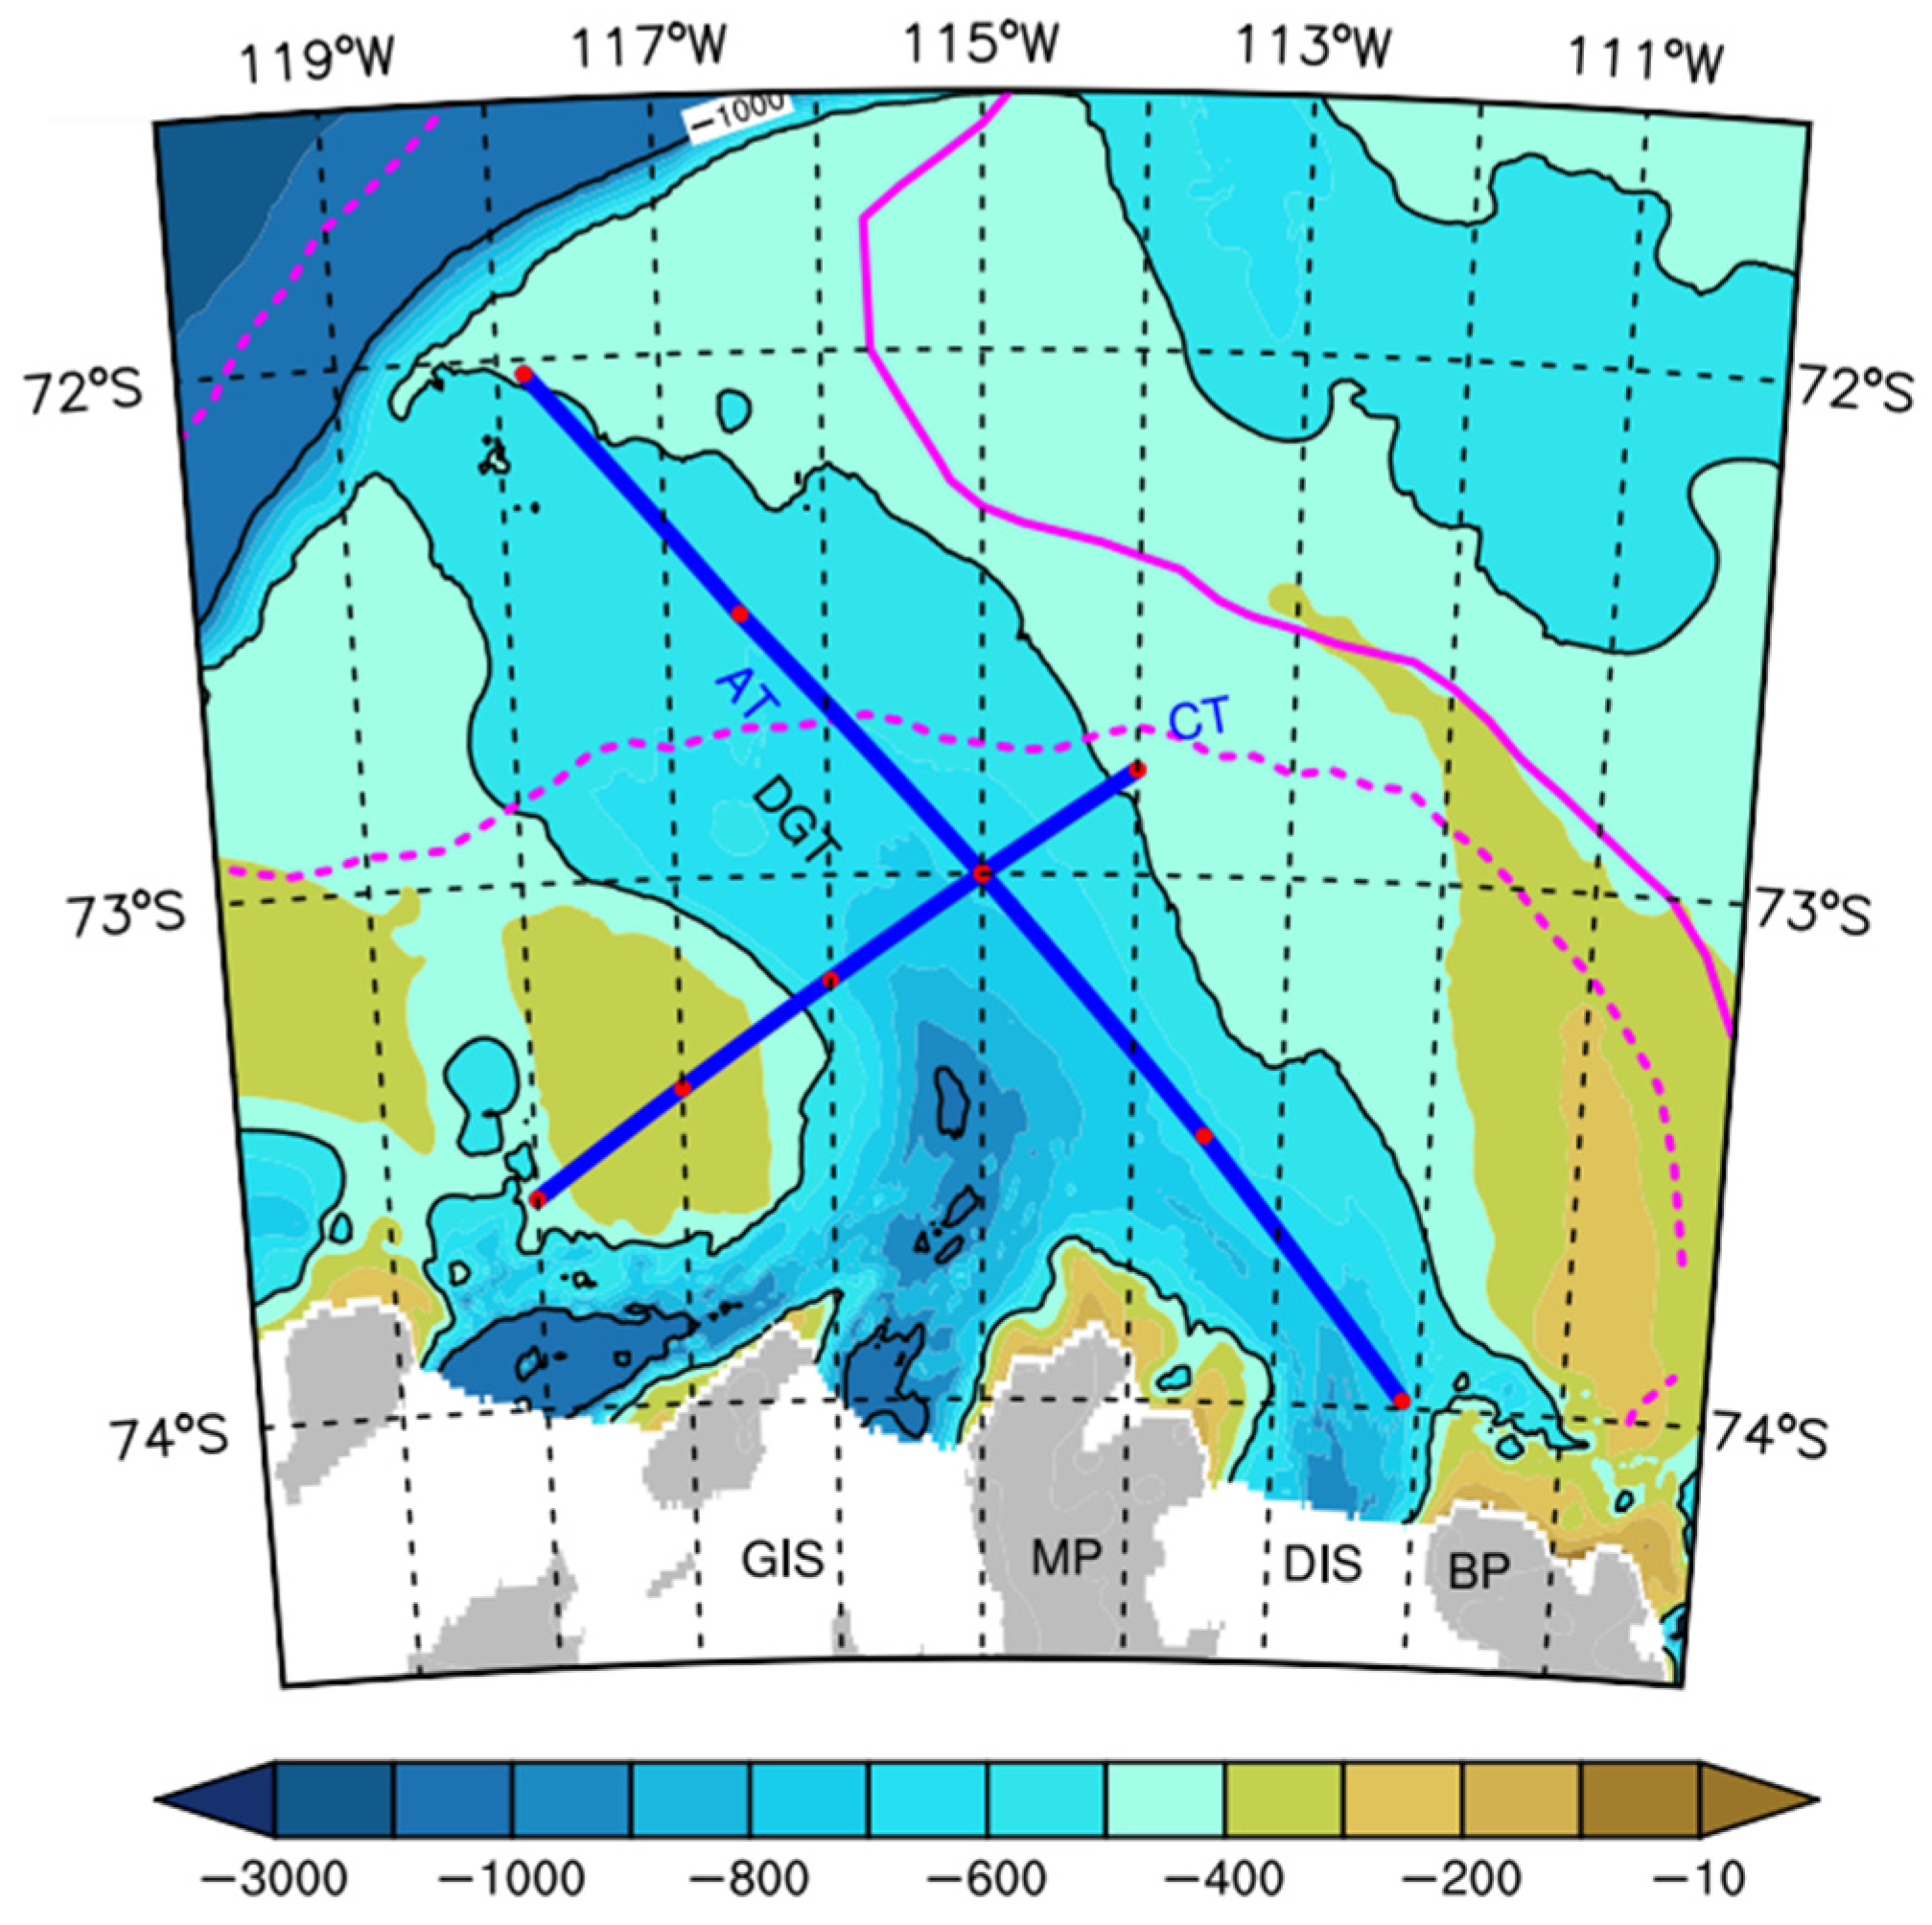
2.1. Collection of Salinity Data

This study utilized the latest version of the Met Office Hadley Centre’s “EN” series of datasets, EN4, which is a monthly objective analyses product of temperature and salinity calculated from global quality controlled ocean data. The dataset covers the period from 1900 to present, with a regular 1° horizontal grid and 42 layers in the vertical, and incorporates observation data from all types of ocean temperature and salinity profiling instruments [24]. Due to its high quality, the EN4 dataset was used as a criterion to evaluate the temperature and salinity in data assimilation, such as in reconstructing temperature profiles.
For the purposes of this investigation, the EN4 dataset corresponding to the month of February for each year between 2009 and 2022 was selected, with an emphasis on the Southern Ocean, specifically the Amundsen Sea region. This selection was informed by the significant uptick in observational data recorded after 2008, predominantly amassed during the austral summer. Furthermore, the selected EN4 dataset was considered credible when the observation weight exceeded 60%. Supplementing the EN4 dataset, in situ conductivity–temperature–depth (CTD) observations were integrated into the study. These in situ observations were gathered from 3 to 7 February 2022 along/across the Dotson–Getz Trough (DGT), as delineated by Section AT/CT shown in Figure 1. Here, we used RTOPO2 data for bathymetry [25].

2.2. Calculation of the Total Ocean Surface Stress

The monthly wind stress τ a i r o c e a n , ice-ocean stress τ i c e o c e a n , total oceanic stress τ and the curl of the total oceanic stress ∇ × τ are calculated. The detailed formula is as follows:
τ = α τ i c e o c e a n + ( 1 α ) τ a i r o c e a n
where
τ a i r o c e a n = ρ a i r C d U a i r U a i r
τ i c e o c e a n = ρ o c e a n C i o U i c e U i c e
α is SIC, ρ a i r = 1.25 kg⁄m3, ρ o c e a n = 1028 kg⁄m3, U a i r and U i c e are the velocity of the wind and the sea ice motion, and C d and C i o are the drag coefficients of the air-ocean and ice-ocean, respectively. According to Tsamados et al. (2014) [26], here we set C d = 1.25 × 10⁻³ and C i o = 5.5 × 10⁻³. Note that all the bold symbols, such as τ and U a i r , represent vectors.
The atmospheric parameters used included the evaporation (E), total precipitation (P), the eastward component of the 10 m wind (U10, unit: m/s), and the northward component of the 10 m wind (V10), and these atmospheric parameters were obtained from the European Center for Medium-Range Weather Forecasts (ECMWF) reanalysis data ERA5, with its spatial resolution of 0.25° × 0.25° [27]. The daily sea ice motion (unit: cm/s) and daily SIC (unit: %) data from 2009 to 2022 were obtained from the National Snow and Ice Data Center (NSIDC). The SIC product used is the latest version (v. 4) published in 2021 as the NOAA/NSIDC SIC CDR [28].

3. Results

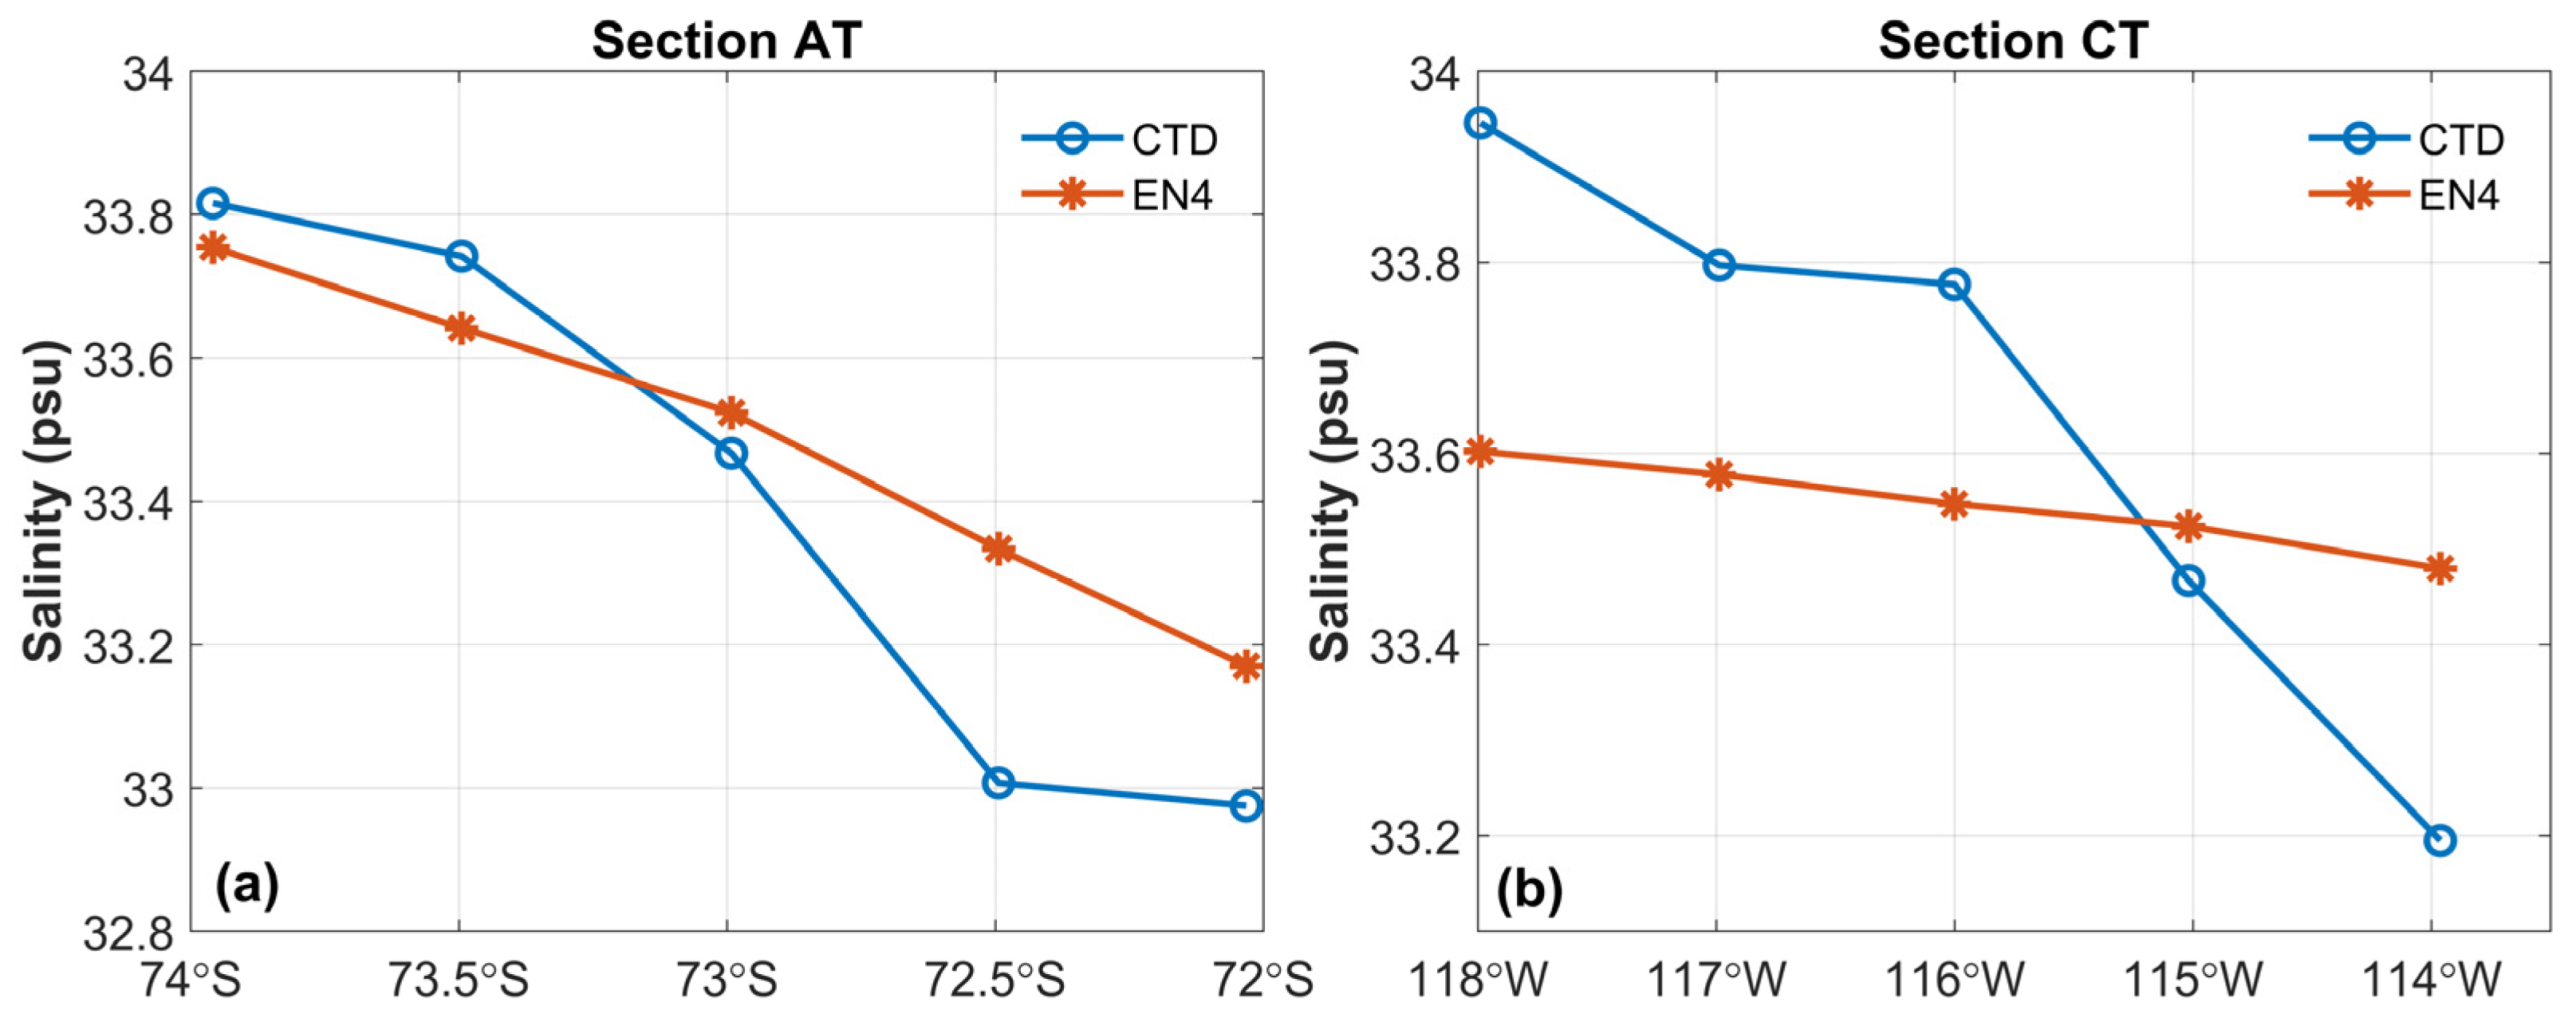
3.1. Assessment of the EN4 Dataset’s Veracity

In this study, two sections, AT and CT, were compared to evaluate the reliability of the EN4 salinity data against in situ CTD observations at a depth of 5 m. As depicted in Figure 2a, the in situ salinity readings on Section AT, which runs along the course of the DGT, reveal pronounced spatial variation characterized by diminished salinity levels in the northern reaches and elevated levels towards the south. The EN4 salinity also shows this latitudinal gradient, although with minor discrepancies in the precise salinity values recorded at individual stations.
In a parallel vein, Section CT unveils a meridional salinity gradient with diminishing salinity towards the east and a notable escalation as one moves westward, as illustrated in Figure 2b. This west–east salinity difference is also reflected in the EN4 salinity data, which show a similar tendency to that in CTD data. Note that for comparison, the salinity from the EN4 data is interpolated according to the observed specific latitude and longitude.

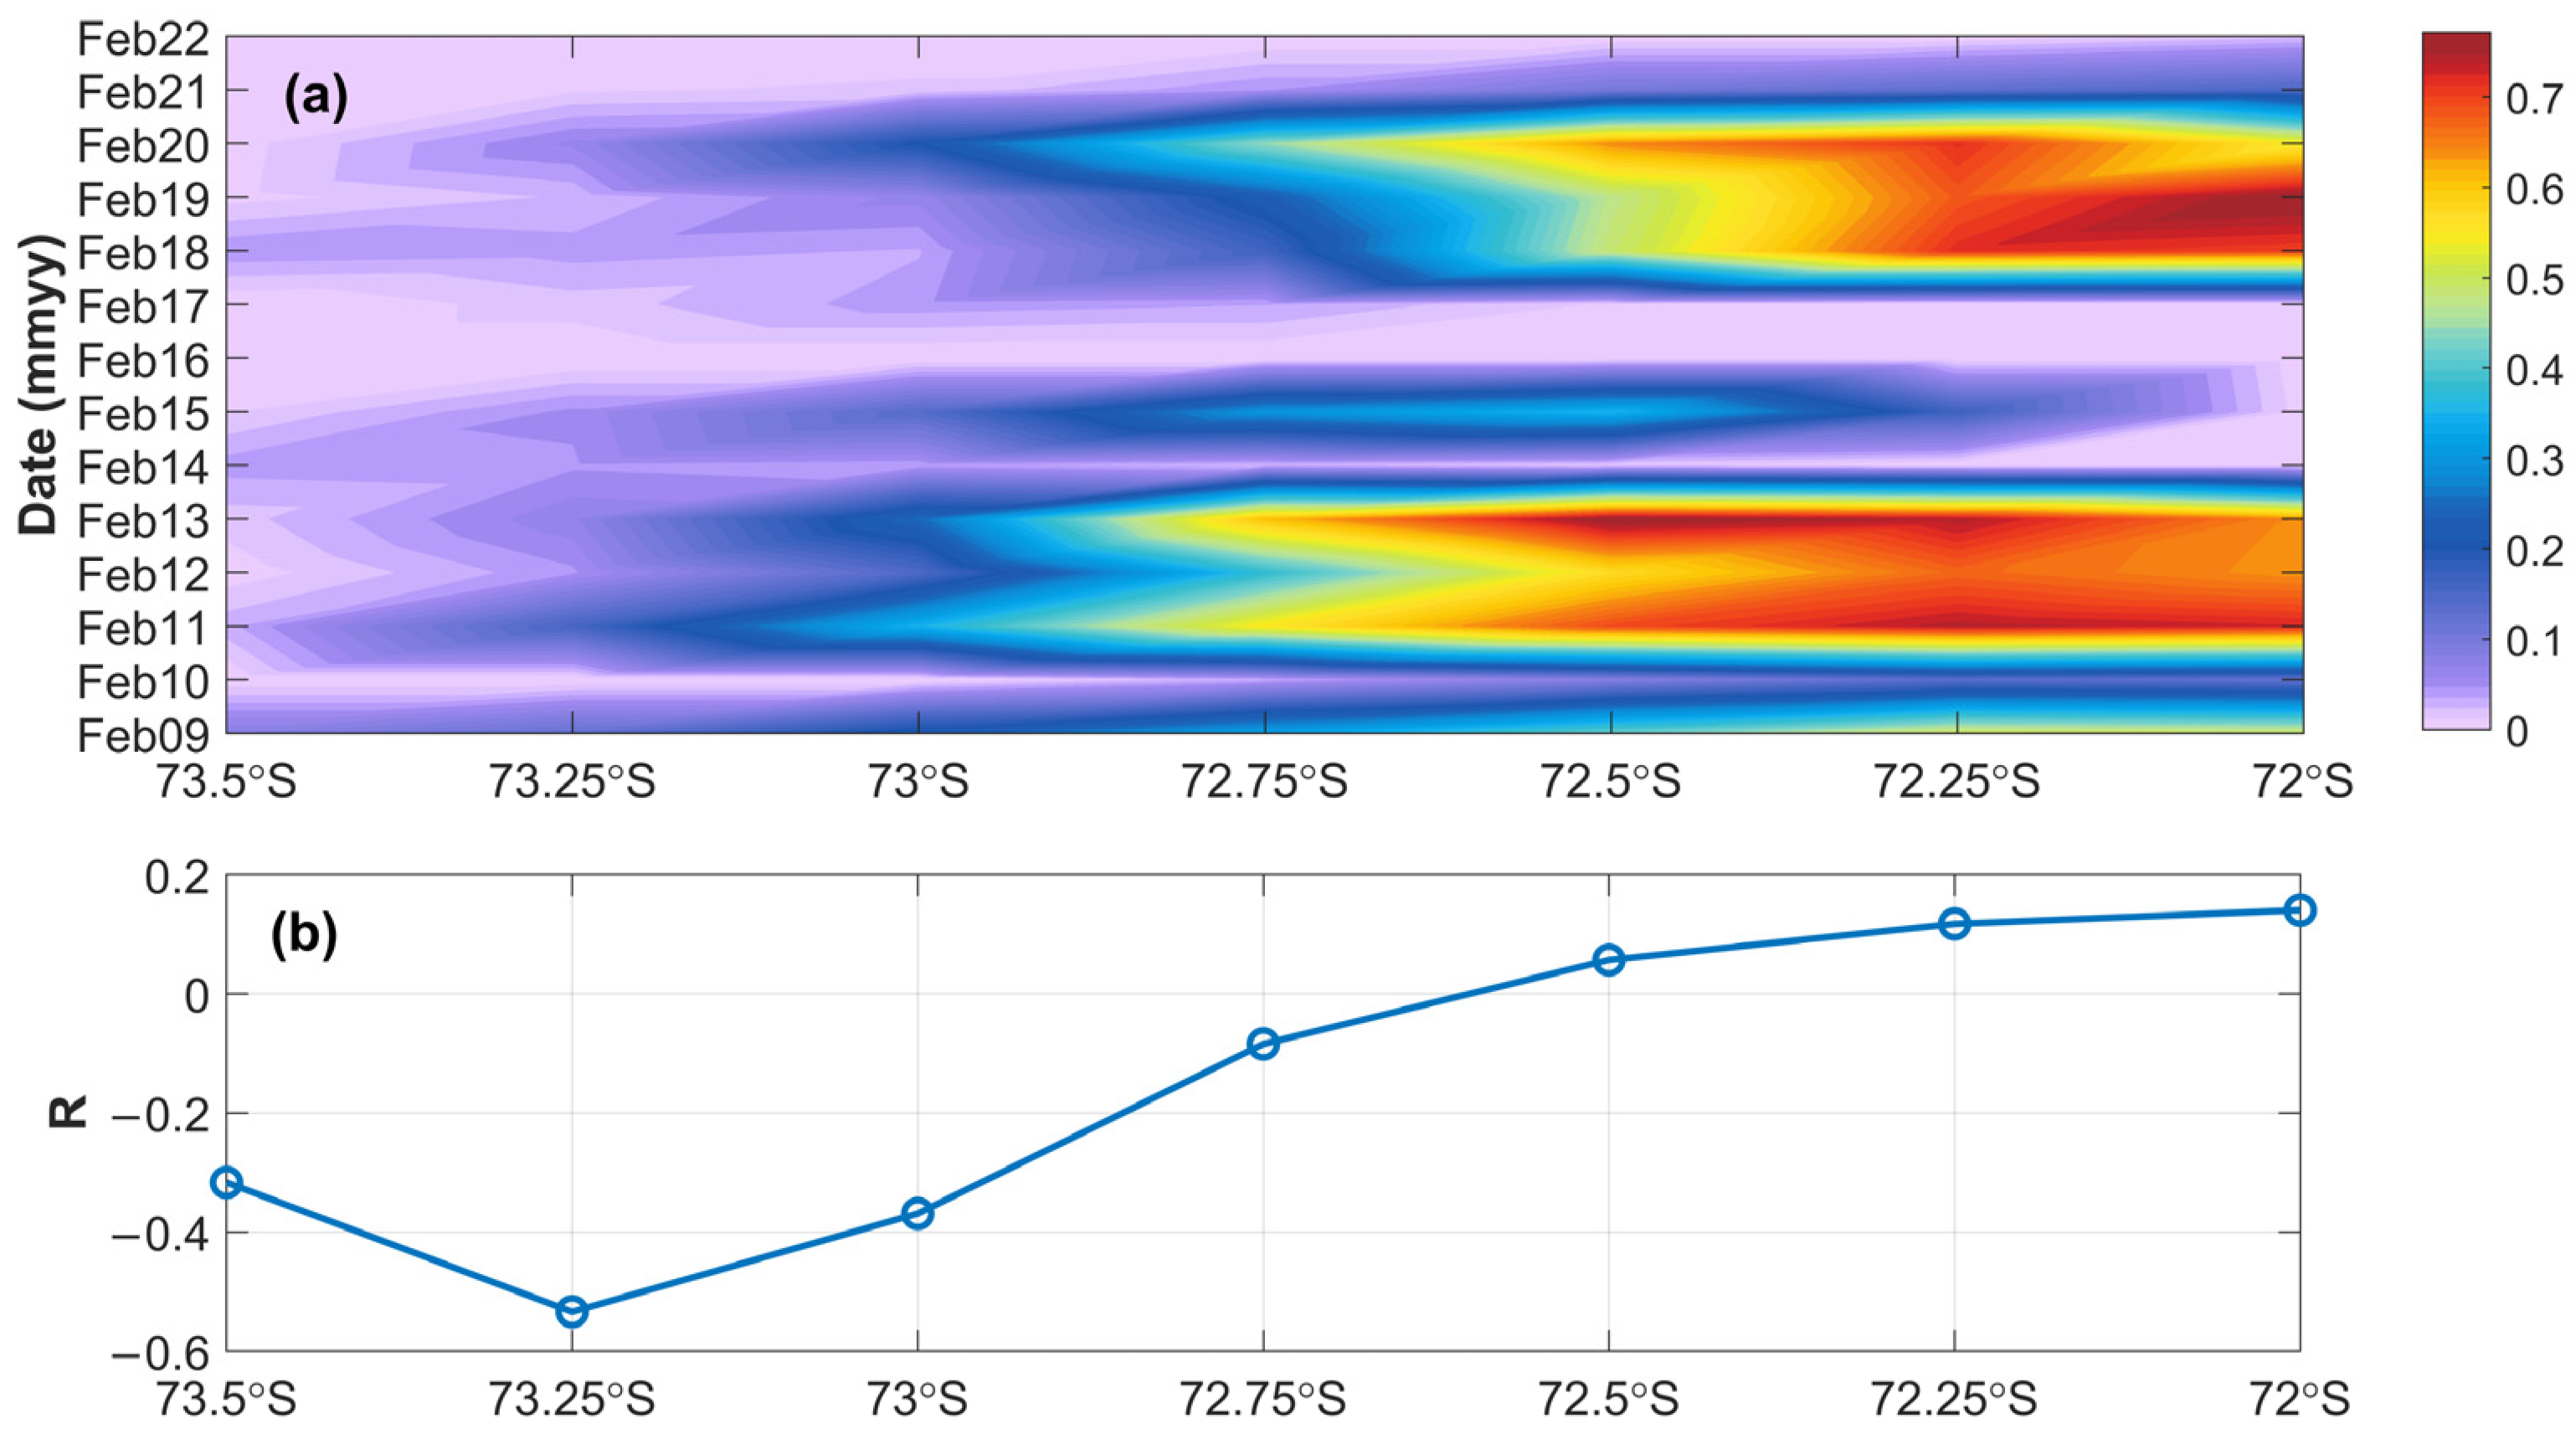
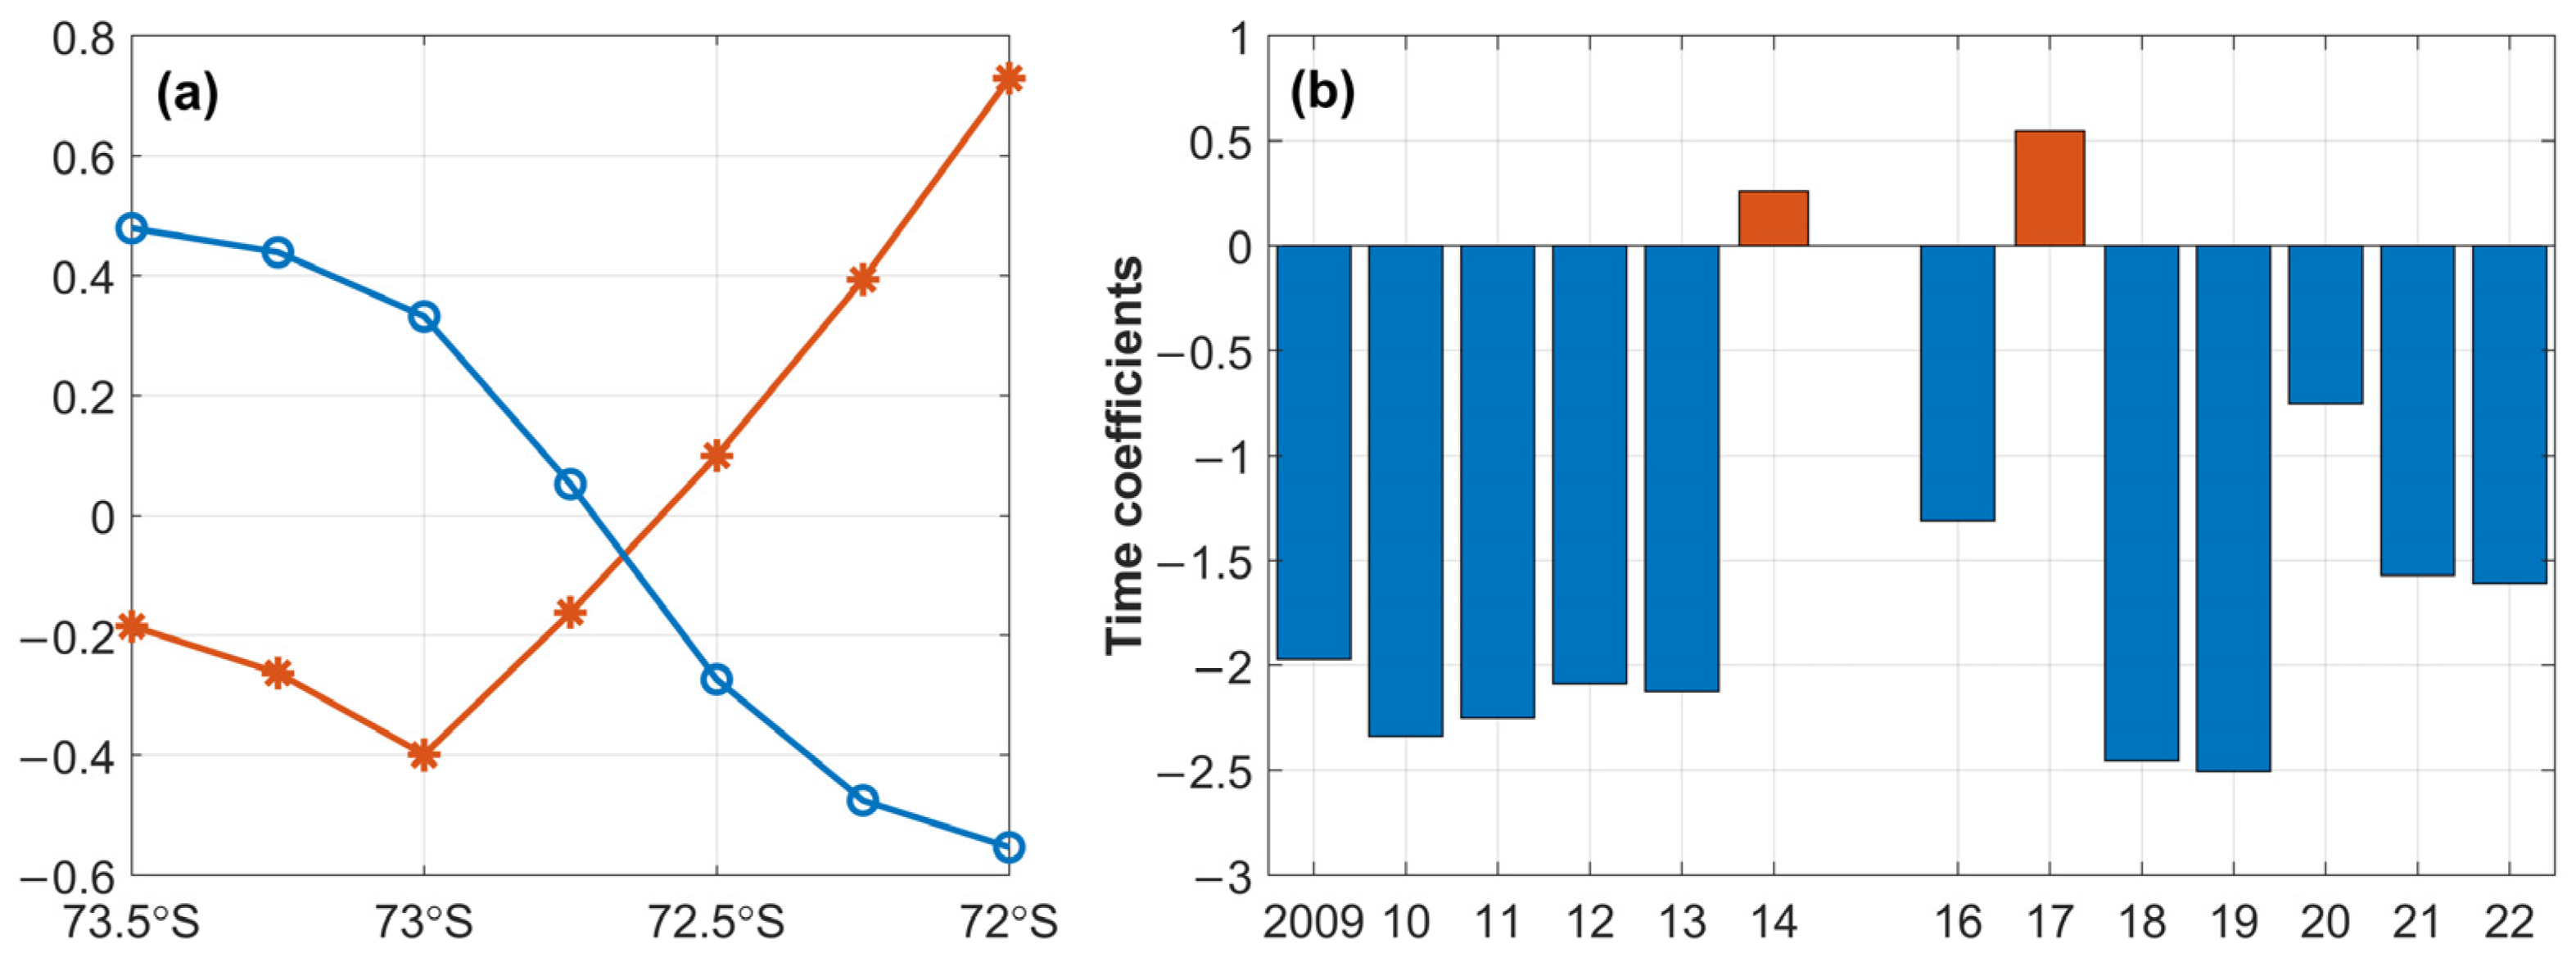
3.2. Interannual Variations in SSS along the DGT

The exploration of salinity along the DGT from 2009 to 2022, utilizing data from EN4, exhibited significant interannual variations, as depicted in Figure 3. In certain years, such as 2016 and 2019, the salinity was relatively higher along the DGT, whereas a lower salinity was observed in 2011 and 2014.
Empirical Orthogonal Function (EOF) analysis was applied to the salinity along the AT section to identify the spatiotemporal variability of salinity. The first mode, accounting for 89.7% of the total salinity variability, is represented in Figure 4a. This dominant mode shows a distinct north-to-south salinity gradient along Section AT, with higher salinity in the northern sector tapering off towards the south.
The corresponding time coefficient series, harvested from the leading EOF mode and illustrated in Figure 4b, provides a temporal lens through which years of higher or lower salinity variability can be identified. Notably, the years 2013, 2016, and 2019 were identified as periods exhibiting heightened salinity, while 2011, 2014, and 2020 were earmarked for their relatively lower salinity levels. Therefore, the salinity in Section AT showed significant interannual variations from 2009 to 2022, corroborating the variations outlined in Figure 3.

3.3. Correlations of Surface Salinity with Surface Freshwater Flux

Figure 5a visualizes the monthly mean freshwater (P-E) field for Section AT, obtained from ERA5 over the span of 2009 to 2022. Regions south of 73° S exhibit a notably higher freshwater flux, particularly distinguishable in 2015 and 2020, accompanied by substantial interannual fluctuations. Conversely, areas north of 73° S display a reduced and more consistent freshwater flux, presumably affected by the presence of sea ice, a topic to be elaborated in Section 3.4. Aligned with this flux distribution, a negative correlation between freshwater flux and surface salinity is observed south of 73° S, where an increase in flux is associated with a decrease in salinity levels. A compelling example of this relationship is the year 2020, where large freshwater fluxes coincide with a lower salinity, as shown in Figure 3. Notably, the inverse correlation presents as relatively weak, peaking at a correlation coefficient of merely −0.3 (not passing the 95% confidence test). Northward of 73° S, the relationship between freshwater flux and surface salinity is tenuous, with instances of positive correlations apparent in Figure 5b. These results imply that although freshwater fluxes have a moderate effect on surface salinity south of 73° S, salinity variations are predominantly driven by other dynamics; whereas to the north of 73° S, freshwater fluxes do not adequately account for salinity variations, possibly due to sea ice effects or other factors. Note that we calculated the Pearson correlation coefficient between the time series of SSS and P-E for the month of February from 2009 to 2022 at each point of latitude, and the correlation is considered significant when the hypothesis test value (p-value) smaller than 0.05. This method is also used to the correlation calculation of SSS with SIC and surface stress curl.

3.4. Correlations of Surface Salinity with SIC

In addition to the freshwater fluxes mentioned above, the formation and melting of sea ice in polar regions can also cause variations in salinity. In this study, we investigate the interconnection between salinity and SIC as depicted in Figure 6. The presence of the Amundsen polynya, and the extent to which it manifests, markedly influences the SIC during February along the AT section, contributing to its pronounced interannual variability. Typically, the southern region beyond 73° S experiences relatively minor SIC, with average concentrations dipping below 15%. Contrastingly, the northern region experiences significant SIC variations; for instance, negligible sea ice cover was observed in 2016, 2021, and 2022, while SIC rose to more than 45% in 2011, 2014, and 2018.
The correlation coefficients mapping the relationship between salinity and SIC at various points along the AT section are illustrated in Figure 6b. Within the polynya zone (shown in Figure 1), there is a discernible negative correlation between salinity and SIC, with the largest (mean) correlation coefficient being approximately −0.6 (−0.4). Note that the coefficient value of −0.6 is significant at the 95% confidence level. Conversely, regions outside the polynya display a rather tenuous correlation between these variables.
In addition, a joint EOF analysis encompassing both surface salinity and SIC along the AT section was conducted, with the findings showcased in Figure 7. The leading component (PC1), which accounts for 63.7% of the total variance, elucidates a stark inverse relationship between salinity and SIC; positive deviations of salinity are consistent with negative anomalies of SIC, and vice versa. A decline in SIC paves the way for the freezing of seawater, prompting an increase in salinity as salt is expelled. The variance time series exhibits a predominantly negative trend, underscoring a consistent correlation between shifts in salinity and SIC, although in certain years (such as 2014 and 2017) there was a weaker consistency.

3.5. Correlations of Surface Salinity with Surface Stress Curl

As previously delineated, wind-driven upwelling holds significant sway over surface salinity dynamics. Figure 8a presents the spatial distribution of surface stress curl along the AT section, spanning the years from 2009 to 2021. Consistently across the annual data, the surface stress curl along the AT section is predominantly negative, indicative of an upward shifting of subsurface waters into the upper ocean layers, save for some instances of weak downwelling occurring within the bounds of the Amundsen polynya during the years 2013 and 2018. The periods of 2015, 2016, and 2020 stand out with notably more vigorous upwelling events, among which the year 2016 was marked by the most pronounced activity.
However, as shown in Figure 8b, the correlation between surface salinity and surface stress curl is weak at best. The calculated absolute value of the correlation coefficient does not exceed 0.15 (not passing the 95% confidence test), indicating that the statistical relationship between these two oceanographic parameters is not very substantial.
A joint EOF analysis was undertaken encompassing both surface salinity and surface stress curl along the AT section. The principal component (PC1), capturing a significant 62.2% of the total variance, unveiled a significant inverse relationship between salinity and stress curl north of 73° S. Specifically, we observe that the positive anomalies in salinity are paired with negative anomalies in stress curl, and the inverse is also true. This correlation can be explained by dynamic ocean processes: a negative stress curl promotes upwelling due to Ekman transport, resulting in increased salinity.
Even though the joint EOF manifestly elucidates a predominantly negative interplay, akin to the pattern illustrated in Figure 7a, the degree of variations is notably weak in certain years, such as 2017 and 2020, as evidenced in Figure 9a.

4. Conclusions

In this research, we examined the interannual variation in salinity within the DGT, using the EN4 dataset for the month of February from 2009 to 2022. Preliminary validation of the EN4 salinity, against the in situ CTD observations at a 5 m depth, confirmed that the variability of SSS along the whole time series (2009–2022) is comparable to the differences in SSS from EN4 and CTD in February 2022.
Utilization of the EN4 series indicated pronounced yearly disparities in salinity along the DGT as captured in Figure 3, with the years 2016 and 2019 registering notably higher salinity levels, while 2011 and 2014 reflected the converse. Furthermore, the findings pointed to a relatively consistent salinity distribution from north to south.
To delve into the complex interactions between SIC, surface stress curl, and salinity, the study employed correlation analyses and joint EOF techniques. The key insights gained revealed the following:
(1) South of 73° S, where SIC is very low or absent, there exists an inverse correlation between the freshwater flux and surface salinity, with a correlation coefficient reaching −0.3. However, north of 73° S, where SIC is larger, the freshwater flux does not account for the variations in surface salinity.
(2) SIC during February along the AT section is marked by extensive yearly variations, influenced by the scope of the Amundsen polynya. Within the polynya region, there exists an inverse correlation between salinity and SIC, with the peak (average) correlation coefficient roughly −0.6 (−0.4), as depicted in Figure 6b. In contrast, areas beyond the polynya exhibit a negligible correlation. Moreover, the leading component (PC1) of the joint EOF mode accounts for 63.7% of the total variance, underscoring a robust negative relationship between salinity and SIC, with positive salinity anomalies accompanying negative SIC anomalies, and vice versa, as depicted in Figure 7.
(3) The correlation between surface salinity and surface stress curl is relatively frail, with a correlation coefficient not surpassing −0.15. The leading component of the joint EOF mode expounds 62.2% of the total variance and highlights a negative relationship between salinity and stress curl north of 73° S (beyond the region of the polynya). This mode presents positive salinity anomalies aligning with negative stress curl anomalies, and vice versa, explicable through the dynamic process where negative stress curl induces upwelling via Ekman transport, resulting in a salinity increase.
In sum, the findings suggest a significant interannual variation in SSS, outlining the underlying phenomena and plausible mechanisms. Through this research, we find that both freshwater fluxes and surface stress curl have small influences on SSS along the DGT. Inside the polynya area, there is a negative correlation between SSS and SIC, with the maximum correlation coefficient of −0.6. Although the relationship between the two is not new, we have quantified it here and given the correlation coefficient between them. This helps us to understand the extent to which polar sea ice melting is affecting SSS, which we consider is also meaningful. Nonetheless, the integrity of the EN4 data warrants further corroboration. Future studies should pivot towards an exhaustive SSS analysis anchored in direct in situ observations. Considering the increased frequency of summer expeditions to the DGT, the acquisition of a comprehensive in situ SSS dataset is within reach, forming an avenue for prospective research exploration.

Author Contributions

Formal analysis, L.-S.Y.; investigation, L.-S.Y.; writing—original draft, L.-S.Y.; writing—review and editing, L.-S.Y., H.H., H.L. and X.C.; visualization, L.-S.Y. and H.H.; supervision, H.H. All authors have read and agreed to the published version of the manuscript.

Funding

This research was funded by the project supported by the Impact and Response of Antarctic Seas to Climate Change Project (Grant No. IRASCC 01-01-01B), the National Natural Science Foundation of China (Grant No. 42227901) and the Scientific Research Fund of the Second Institute of Oceanography, MNR (Grant No. JB2305).

Institutional Review Board Statement

Not applicable.

Informed Consent Statement

Not applicable.

Data Availability Statement

The EN4 dataset is derived from https://www.metoffice.gov.uk/hadobs/en4/download-en4-2-2.html (accessed on 16 April 2024); Atmospheric forcing ERA5 data are obtained from https://cds.climate.copernicus.eu/cdsapp#!/dataset/reanalysis-era5-single-levels-monthly-means?tab=overview (accessed on 15 May 2024); The NSIDC Sea Ice Concentration product is derived from https://nsidc.org/data/G02202/versions/4 (accessed on 30 September 2023); The NSIDC Sea Ice Motion vectors are obtained from https://nsidc.org/data/NSIDC-0116/versions/4 (accessed on 31 December 2022); The ship-based CTD dataset is provided by the National Arctic and Antarctic Data Center (https://www.chinare.org.cn (accessed on 30 June 2023)).

Acknowledgments

This study used in situ observation CTD data were collected by the 38th CHINARE, and we thank all the participants for their hard work. We thank two anonymous reviewers for their useful feedback that improved this manuscript.

Conflicts of Interest

The authors declare no conflict of interest.

References

  1. Nitsche, F.O.; Jacobs, S.S.; Larter, R.D.; Gohl, K. Bathymetry of the Amundsen Sea continental shelf: Implications for geology, oceanography, and glaciology. Geochem. Geophys. Geosyst. 2007, 8, 1–10. [Google Scholar] [CrossRef]
  2. Heywood, K.; Biddle, L.; Boehme, L.; Dutrieux, P.; Fedak, M.; Jenkins, A.; Jones, R.; Kaiser, J.; Mallett, H.; Garabato, A.N.; et al. Between the Devil and the Deep Blue Sea: The role of the Amundsen Sea continental shelf in exchange between ocean and ice shelves. Oceanography 2016, 29, 118–129. [Google Scholar] [CrossRef]
  3. Yu, L.S.; He, H.; Leng, H.; Liu, H.; Lin, P. Interannual variation of summer sea surface temperature in the Amundsen Sea, Antarctica. Front. Mar. Sci. 2023, 10, 1050955. [Google Scholar] [CrossRef]
  4. Arneborg, L.; Wåhlin, A.K.; Björk, G.; Liljebladh, B.; Orsi, A.H. Persistent inflow of warm water onto the central Amundsen shelf. Nat. Geosci. 2012, 5, 876–880. [Google Scholar] [CrossRef]
  5. Ha, H.K.; Wåhlin, A.K.; Kim, T.W.; Lee, S.H.; Lee, J.H.; Lee, H.J.; Hong, C.S.; Arneborg, L.; Björk, G.; Kalén, O. Circulation and modification of warm deep water on the central Amundsen Shelf. J. Phys. Oceanogr. 2014, 44, 1493–1501. [Google Scholar] [CrossRef]
  6. Kim, C.-S.; Kim, T.-W.; Cho, K.-H.; Ha, H.K.; Lee, S.; Kim, H.-C.; Lee, J.-H. Variability of the Antarctic Coastal Current in the Amundsen Sea. Estuar. Coast. Shelf Sci. 2016, 181, 123–133. [Google Scholar] [CrossRef]
  7. Jenkins, A.; Shoosmith, D.; Dutrieux, P.; Jacobs, S.; Kim, T.W.; Lee, S.H.; Ha, H.K.; Stammerjohn, S. West Antarctic ice sheet retreat in the Amundsen Sea driven by decadal oceanic variability. Nat. Geosci. 2018, 11, 733–738. [Google Scholar] [CrossRef]
  8. Min, J.O.; Kim, S.H.; Jung, J.; Jung, U.J.; Yang, E.J.; Lee, S.; Hyun, J.H. Glacial ice melting stimulates heterotrophic prokaryotes production on the Getz Ice Shelf in the Amundsen Sea, Antarctica. Geophys. Res. Lett. 2022, 49, e2021GL097627. [Google Scholar] [CrossRef]
  9. Caillet, J.; Jourdain, N.C.; Mathiot, P.; Hellmer, H.H.; Mouginot, J. Drivers and reversibility of abrupt ocean state transitions in the Amundsen Sea, Antarctica. J. Geophys. Res. Ocean. 2023, 128, e2022JC018929. [Google Scholar] [CrossRef]
  10. Gravalosa, J.M.; Flores, J.-A.; Sierro, F.J.; Gersonde, R. Sea surface distribution of coccolithophores in the eastern Pacific sector of the Southern Ocean (Bellingshausen and Amundsen Seas) during the late austral summer of 2001. Mar. Micropaleontol. 2008, 69, 16–25. [Google Scholar] [CrossRef]
  11. Lee, Y.; Yang, E.J.; Park, J.; Jung, J.; Kim, T.W.; Lee, S. Physical-biological coupling in the Amundsen Sea, Antarctica: Influence of physical factors on phytoplankton community structure and biomass. Deep. Sea Res. Part I Oceanogr. Res. Pap. 2016, 117, 51–60. [Google Scholar] [CrossRef]
  12. Garcia, C.; Comiso, J.C.; Berkelhammer, M.; Stock, L. Interrelationships of Sea Surface Salinity, Chlorophyll-α Concentration, and Sea Surface Temperature near the Antarctic Ice Edge. J. Clim. 2021, 34, 6069–6086. [Google Scholar] [CrossRef]
  13. Helm, K.P.; Bindoff, N.L.; Church, J.A. Changes in the global hydrological-cycle inferred from ocean salinity. Geophys. Res. Lett. 2010, 37, L18701. [Google Scholar] [CrossRef]
  14. Lagerloef, G.S. Introduction to the special section: The role of surface salinity on upper ocean dynamics, air-sea interaction and climate. J. Geophys. Res. Ocean. 2002, 107, SRF-1. [Google Scholar] [CrossRef]
  15. Reul, N.; Fournier, S.; Boutin, J.; Hernandez, O.; Maes, C.; Chapron, B.; Alory, G.; Quilfen, Y.; Tenerelli, J.; Morisset, S.; et al. Sea Surface Salinity Observations from Space with the SMOS Satellite: A New Means to Monitor the Marine Branch of the Water Cycle. Surv. Geophys. 2014, 35, 681–722. [Google Scholar] [CrossRef]
  16. Durack, P.J. Ocean salinity and the global water cycle. Oceanography 2015, 28, 20–31. [Google Scholar] [CrossRef]
  17. Alderkamp, A.C.; Mills, M.M.; van Dijken, G.L.; Laan, P.; Thuroczy, C.E.; Gerringa, L.J.; de Baar, H.J.; Payne, C.D.; Visser, R.J.; Buma, A.G.; et al. Iron from melting glaciers fuels phytoplankton blooms in the Amundsen Sea (Southern Ocean): Phytoplankton characteristics and productivity. Deep. Sea Res. Part II Top. Stud. Oceanogr. 2012, 71, 32–48. [Google Scholar] [CrossRef]
  18. Rintoul, S.R.; Silvano, A.; Pena-Molino, B.; van Wijk, E.; Rosenberg, M.; Greenbaum, J.S.; Blankenship, D.D. Ocean heat drives rapid basal melt of the Totten Ice Shelf. Sci. Adv. 2016, 2, e1601610. [Google Scholar] [CrossRef]
  19. Turner, J.; Lu, H.; White, I.; King, J.C.; Phillips, T.; Hosking, J.S.; Bracegirdle, T.; Marshall, G.J.; Mulvaney, R.; Deb, P. Absence of 21st century warming on Antarctic Peninsula consistent with natural variability. Nature 2016, 535, 411–415. [Google Scholar] [CrossRef]
  20. Randall-Goodwin, E.; Meredith, M.P.; Jenkins, A.; Yager, P.L.; Sherrell, R.M.; Abrahamsen, E.P.; Guerrero, R.; Yuan, X.; Mortlock, R.A.; Gavahan, K.; et al. Freshwater distributions and water mass structure in the Amundsen Sea Polynya region, Antarctica. Elem. Sci. Anthr. 2015, 3, 000065. [Google Scholar] [CrossRef]
  21. Kim, T.-W.; Yang, H.W.; Dutrieux, P.; Wåhlin, A.K.; Jenkins, A.; Kim, Y.G.; Ha, H.K.; Kim, C.-S.; Cho, K.-H.; Park, T.; et al. Interannual variation of modified circumpolar deep water in the Dotson-Getz Trough, West Antarctica. J. Geophys. Res. Ocean. 2021, 126, e2021JC017491. [Google Scholar] [CrossRef]
  22. Shin, D.Y.; Hahm, D.; Kim, T.-W.; Rhee, T.S.; Lee, S.H.; Park, K.; Park, J.; Kwon, Y.S.; Kim, M.S.; Lee, T. Identification of ventilated and submarine glacial meltwaters in the Amundsen Sea, Antarctica, using noble gases. Front. Mar. Sci. 2022, 9, 951471. [Google Scholar] [CrossRef]
  23. He, H.L.; Wu, S.C. Comparison of ship-based CTD measurement of Circumpolar Deep Water in the Amundsen Sea based on World Ocean Database. Adv. Polar Sci. 2022, 33, 145–155. [Google Scholar]
  24. Good, S.A.; Martin, M.J.; Rayner, N.A. EN4: Quality controlled ocean temperature and salinity profiles and monthly objective analyses with uncertainty estimates. J. Geophys. Res. Oceans 2013, 118, 6704–6716. [Google Scholar] [CrossRef]
  25. Schaffer, J.; Timmermann, R.; Arndt, J.E.; Kristensen, S.S.; Mayer, C.; Morlighem, M.; Steinhage, D. A global, high-resolution data set of ice sheet topography, cavity geometry, and ocean bathymetry. Earth Syst. Sci. Data 2016, 8, 543–557. [Google Scholar] [CrossRef]
  26. Tsamados, M.; Feltham, D.L.; Schroeder, D.; Flocco, D.; Farrell, S.L.; Kurtz, N.; Laxon, S.W.; Bacon, S. Impact of Variable Atmospheric and Oceanic Form Drag on Simulations of Arctic Sea Ice. J. Phys. Oceanogr. 2014, 44, 1329–1353. [Google Scholar] [CrossRef]
  27. Hersbach, H.; Bell, B.; Berrisford, P.; Biavati, G.; Horányi, A.; Muñoz Sabater, J.; Nicolas, J.; Peubey, C.; Radu, R.; Rozum, I.; et al. ERA5 Monthly Averaged Data on Single Levels from 1940 to Present. Copernicus Climate Change Service (C3S) Climate Data Store (CDS). 2023. Available online: https://cds.climate.copernicus.eu/cdsapp#!/dataset/reanalysis-era5-single-levels-monthly-means?tab=overview (accessed on 15 May 2024). [CrossRef]
  28. Meier, W.N.; Fetterer, F.; Windnagel, A.K.; Stewart, J.S. NOAA/NSIDC Climate Data Record of Passive Microwave Sea Ice Concentration, Version 4 [Data Set]; National Snow and Ice Data Center: Boulder, CO, USA, 2021. [Google Scholar]
Figure 1. Bathymetry of the Dotson–Getz Trough. AT and CT are the two sections along and cross the Dotson–Getz Trough, respectively. Magenta lines denote a 50% (solid line) and 25% (dashed line) sea ice concentration (mean state for February during 2009–2022). Red dots represent ship-based CTD stations. Color shading shows the bathymetry (RTOPO2), and the black solid lines are 500 m and 1000 m isobath lines.
Jmse 12 01067 g001
Figure 2. SSS comparisons of EN4 dataset with the in situ ship-based conductivity–temperature–depth (CTD) observation on Sections (a) AT and (b) CT.
Jmse 12 01067 g002
Figure 3. Distribution of SSS in February of each year from 2009 to 2022 along Section AT.
Jmse 12 01067 g003
Figure 4. (a) The first mode of EOF of the SSS spatial field along Section AT from 2009 to 2022. (b) The time coefficients corresponding to the first mode of EOF.
Jmse 12 01067 g004
Figure 5. (a) Distribution of freshwater (P-E) in February of each year from 2009 to 2022 along Section AT; (b) Correlation coefficient between freshwater and SSS along Section AT.
Jmse 12 01067 g005
Figure 6. (a) Distribution of sea ice concentration (SIC) in February of each year from 2009 to 2022 along Section AT; (b) Correlation coefficient between SIC and SSS along Section AT.
Jmse 12 01067 g006
Figure 7. (a) The first mode of EOF of spatial salinity (red line) and sea ice concentration (SIC) (blue line) along Section AT from 2009 to 2022; (b) The time coefficients corresponding to the first mode.
Jmse 12 01067 g007
Figure 8. (a) Distribution of total surface stress curl in February of each year from 2009 to 2022 along Section AT; (b) Correlation coefficient between surface stress curl and SSS along Section AT.
Jmse 12 01067 g008
Figure 9. (a) The first mode of EOF of spatial salinity (red line) and surface stress curl (blue line) along Section AT from 2009 to 2022. (b) The time coefficients corresponding to the first mode.
Jmse 12 01067 g009
Disclaimer/Publisher’s Note: The statements, opinions and data contained in all publications are solely those of the individual author(s) and contributor(s) and not of MDPI and/or the editor(s). MDPI and/or the editor(s) disclaim responsibility for any injury to people or property resulting from any ideas, methods, instructions or products referred to in the content.

