Abstract
This study presents a method to support ship trajectory prediction at waterway confluences using historical Automatic Identification System (AIS) data. The method is meant to improve the recognition accuracy of ship behavior trajectory, assist in the proactive avoidance of collisions, and clarify ship collision responsibility, to ensure the safety of waterway transportation systems in the event of ship encounters induced by waterway confluence or channel limitation. In this study, the ship trajectory based on AIS data is considered from five aspects: time, location, heading, speed, and trajectory by using the piecewise cubic Hermite interpolation method and then quickly clustered by regional navigation rules. Then, an improved K-Nearest Neighbor Algorithm considering the sensitivity of data characteristics (SKNN) is proposed to predict the trajectory of ships, which considers the influence weights of various parameters on ship trajectory prediction. The method is trained and verified using the AIS data of the Yangtze River and Han River intersection in Wuhan. The results show that the accuracy of SKNN is better than that of conventional KNN and Naive Bayes (NB) in the same test case. The accuracy of the ship trajectory prediction method is above 99% and the performance metrics of the SKNN surpass those of both the conventional KNN and NB classifiers, which is helpful for early warning of collision encounters to ensure avoidance.
1. Introduction
With the continued growth of the economy, waterway transportation is becoming increasingly congested, and more and more channels are becoming saturated, especially at the confluence of rivers, putting increased demands on waterway navigation management [1]. The popularity of the AIS not only improves the efficiency and safety of navigation but also makes it possible to collect a huge volume of ship motion data for waterway transportation studies. Ship motion data can be extracted to understand the navigation status and they can be applied to many maritime fields, such as ship collision avoidance, maritime monitoring, ship trajectory prediction, and maritime accident investigation. The analysis and application of AIS data are mainly reflected in research on traffic flow [1], ship encounter characteristics analysis [2,3,4,5], ship trajectory prediction [6,7,8], and navigation anomaly identification [9,10]. The following technologies are used as the foundation: data recovery, trajectory clustering, and trajectory prediction modeling.
AIS data cleaning is the basis of ship trajectory data preprocessing, usually based on the ship’s position, speed, and heading data to identify anomalies and repair them [11]. On this basis, clustering methods are often used for ship trajectories, such as DBSCAN, K-means, GMM, EM, and other algorithms. Lee et al. (2007) [12] presented the TRACLUS algorithm, which has been widely used, and many researchers have developed the algorithm to improve the clustering effect. Among them, Rong et al. (2020) [13] achieved trajectory clustering through the improved TRACLUS algorithm. Gudmundsson et al. (2015) [14] proposed a distance-based trajectory clustering algorithm using the Frechet distance to define the similarity between trajectories. Further, trajectory prediction has been based on data preprocessing and trajectory clustering, such as the Markov model, the Naive Bayesian model, SVM, neural networks, the particle swarm algorithm, the Kalman filter, and other algorithms for prediction. Perera (2012) [15] uses the K-means algorithm to classify the historical trajectory of the ship and establishes an ANN model to predict the trajectory of the ship based on the ship’s information and grouping results. Experiments show that the algorithm has an accuracy of more than 70%. Hu et al. (2021) [16] used an artificial neural network to study AIS data and realized the prediction of ship trajectories. The results show that the accuracy of route prediction was 76.15%. Although the above methods are effective, the accuracy of trajectory prediction may not meet requirements due to the lack of in-depth research on ship trajectory changes. Murray et al. (2021) [17] used the Gaussian mixture model to cluster AIS historical data, and then predicted ship trajectory based on this. The results showed that the accuracy of ship trajectory prediction based on clustering was higher than that of un-clustered ships. The effect of clustering directly affects the accuracy of trajectory prediction. Wang (2019) [18] used the improved TRACLUS to cluster the AIS trajectory and adjust the internal parameters, but because the clustering effect was limited by the choice of internal parameters, under the influence of waterway confluence, the final clustering effect did not fully reflect the actual situation.
Artificial Neural Networks (ANNs) are widely used in ship trajectory prediction research. Qian et al. (2022) used a deep Long Short-term Memory Network Framework (LSTM) and Genetic Algorithm (GA) to predict ship trajectories in inland water [19]. But LSTM models have high complexity, long training time, and require a large amount of historical data. Tian et al. (2023) proposed a ship trajectory prediction model using a Difference Long Short-term Memory (D-LSTM) neural network, which more effectively processes differential sequences, improves prediction accuracy, and stability [20], but also requires high computational resources and high-quality logarithmic data. Gan et al. (2016) combined clustering and an ANN to predict ship trajectory, which reduce data complexity and dimensions through clustering to improve the training efficiency of the ANN [21]. However, this method requires adjusting multiple parameters to tune the model and is sensitive to the initial clustering results. Recurrent Neural Networks (RNNs) are suitable for time-series prediction and have dynamic prediction capabilities, but traditional RNNs suffer from gradient vanishing problems, limited ability to predict long time series, and require a large amount of computational resources [22,23]. Zhao et al. (2023) proposed a ship trajectory prediction method based on GAT and LSTM, which has high robustness [24]. Li et al. (2023) analyzed five classical machine learning methods and eight deep learning methods on ship trajectory prediction [25,26]. Zhou et al. (2024) proposed a ship trajectory prediction method based on Optuna–BILSTM [27]. Li et al. (2024) proposed a ship trajectory prediction method based on ACoAtt–LSTM [28]. Jiang et al. (2023) proposed a ship trajectory prediction method based on an attention mechanism model [29].
Due to the large volume of ship traffic and complex interactions in intersecting water areas, machine learning methods such as KNN and Naive Bayes (NB), which have strong adaptability and can quickly respond to environmental changes, are used to predict ship trajectory intentions in intersecting water areas, achieve real-time trajectory category prediction, and improve navigation safety and efficiency.
The confluence area of main and branch waterways is one of the most complicated channel circumstances [30]. Due to waterway confluence, the traffic flow of ships often forms a complex situation of intersection, such as serious traffic conflicts, irregular navigation order, and heavy pressure on the safety of drivers, which increases the risk of collisions between ships in the confluence area [31,32]. It has been shown that more than 80% of ship collision accidents are caused by human error, including misidentification of the ship’s behavior trajectory without correctly perceiving the risk of collision, failing to take appropriate collision avoidance measures, and ultimately causing collision accidents [33].
Therefore, we present a simple method to support ship trajectory prediction using historical AIS data. In our method, a clustering method based on regional navigation rules is used to achieve fast and accurate clustering of trajectories, and an improved K-Nearest Neighbor Algorithm considering the sensitivity (SKNN) of data characteristics is proposed to establish the mapping relationship between ship navigation characteristics and ship trajectory, to then predict the ship trajectory reflecting perceived collision risks while ensuring allocation of avoidance responsibilities. The exploration of the Ship K-Nearest Neighbors (SKNN) algorithm within the realm of maritime trajectory forecasting should support advancements in various pivotal sectors. These include enhancing the efficacy of collision avoidance warning systems, optimizing navigational efficiency, refining energy management strategies for navigation [34], and innovating in the domain of navigational route planning [35].
In this paper, a machine learning approach is proposed to predict ship trajectory at waterway confluences using an improved K-Nearest Neighbor Algorithm considering the sensitivity of data characteristics. Section 2 provides a description of the proposed method for ship trajectory prediction, Section 3 presents a comparison between the proposed method and a conventional KNN, NB, based on the same AIS data of the Yangtze River and the Han River intersection in Wuhan, and Section 4 concludes the article.
2. Proposed Method for Ship Trajectory Prediction
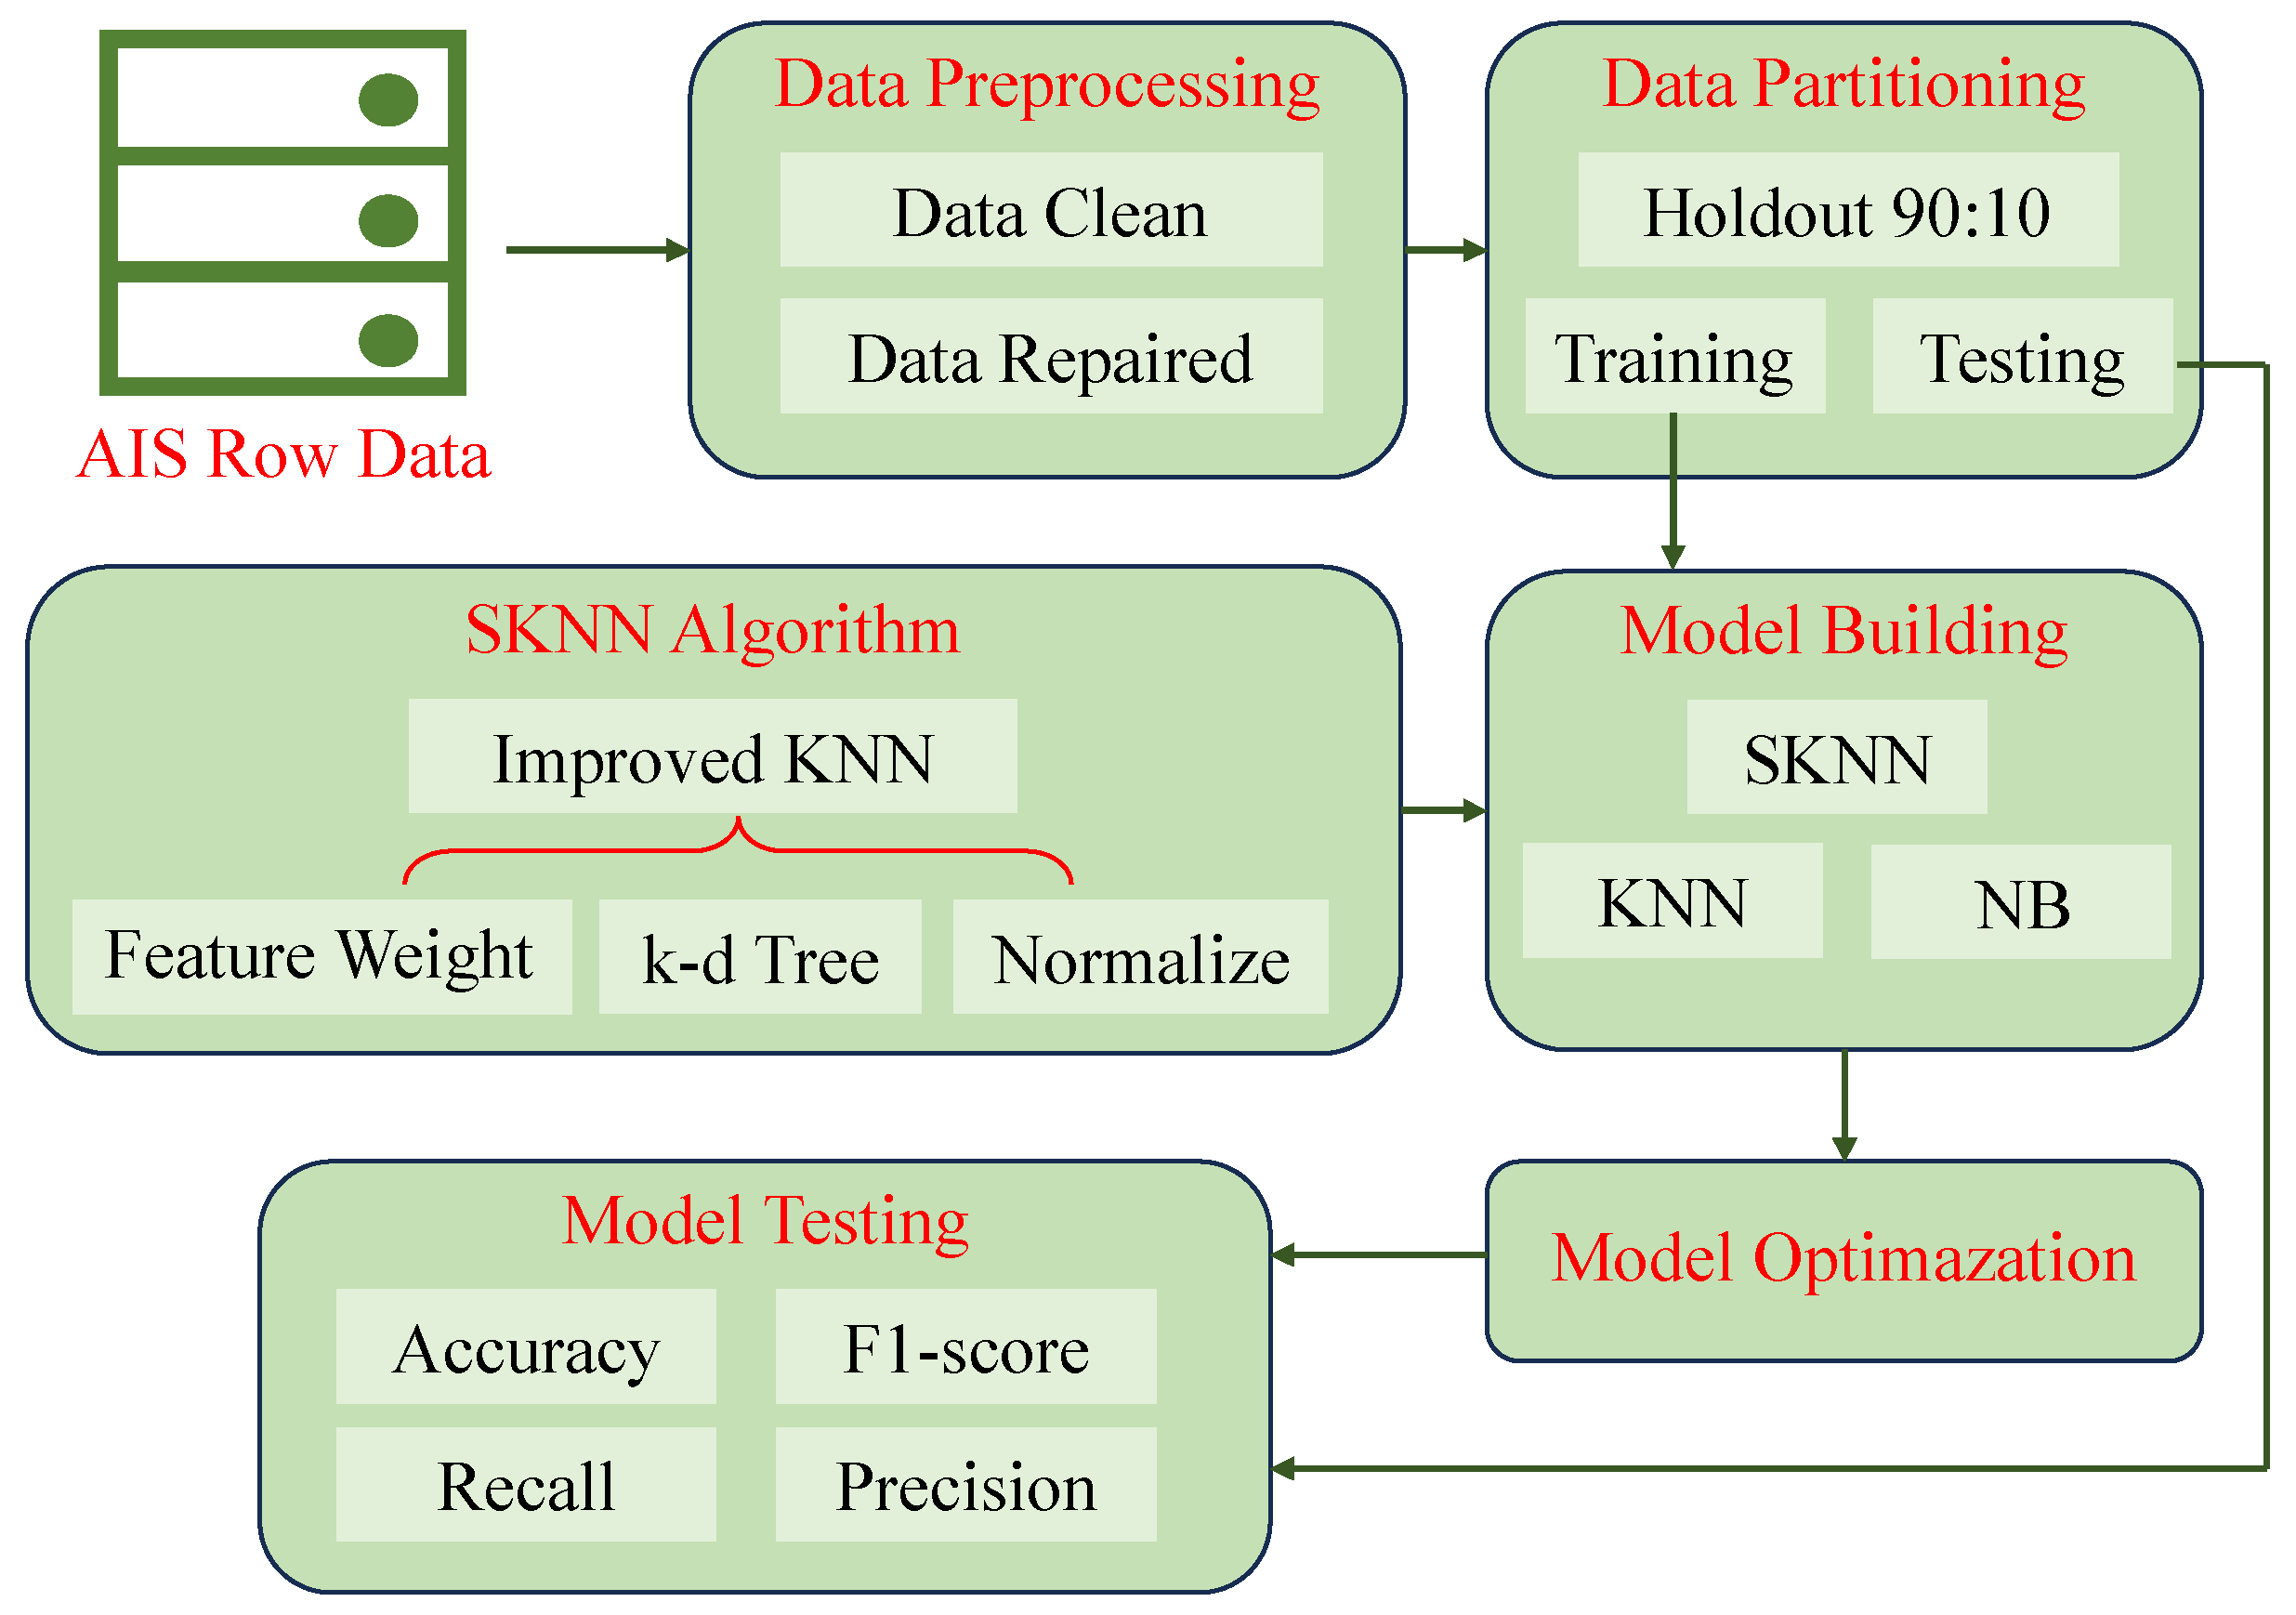
Taking the AIS data of the Wuhan Bridge section in the Yangtze River from October 2020 to November 2020 as an example, a total of 148,325 trajectories, a method for ship trajectory prediction using historical AIS data is established based on the K-Nearest Neighbor Algorithm (KNN). The main scheme of the methods (Figure 1) primarily includes three parts: (1) Ship trajectory data preprocessing; (2) Ship trajectory data clustering; and (3) Ship trajectory prediction.
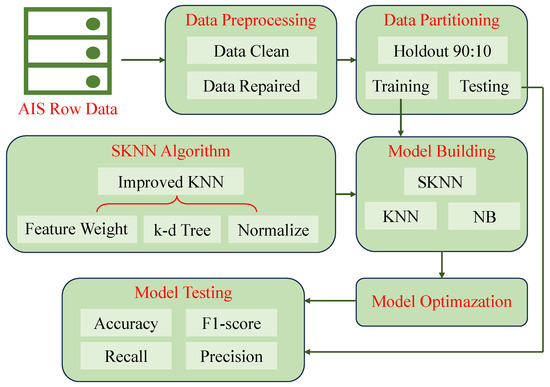
Figure 1.
Flowchart for prediction of ship trajectory based on AIS data.
2.1. Ship Trajectory Data Preprocessing
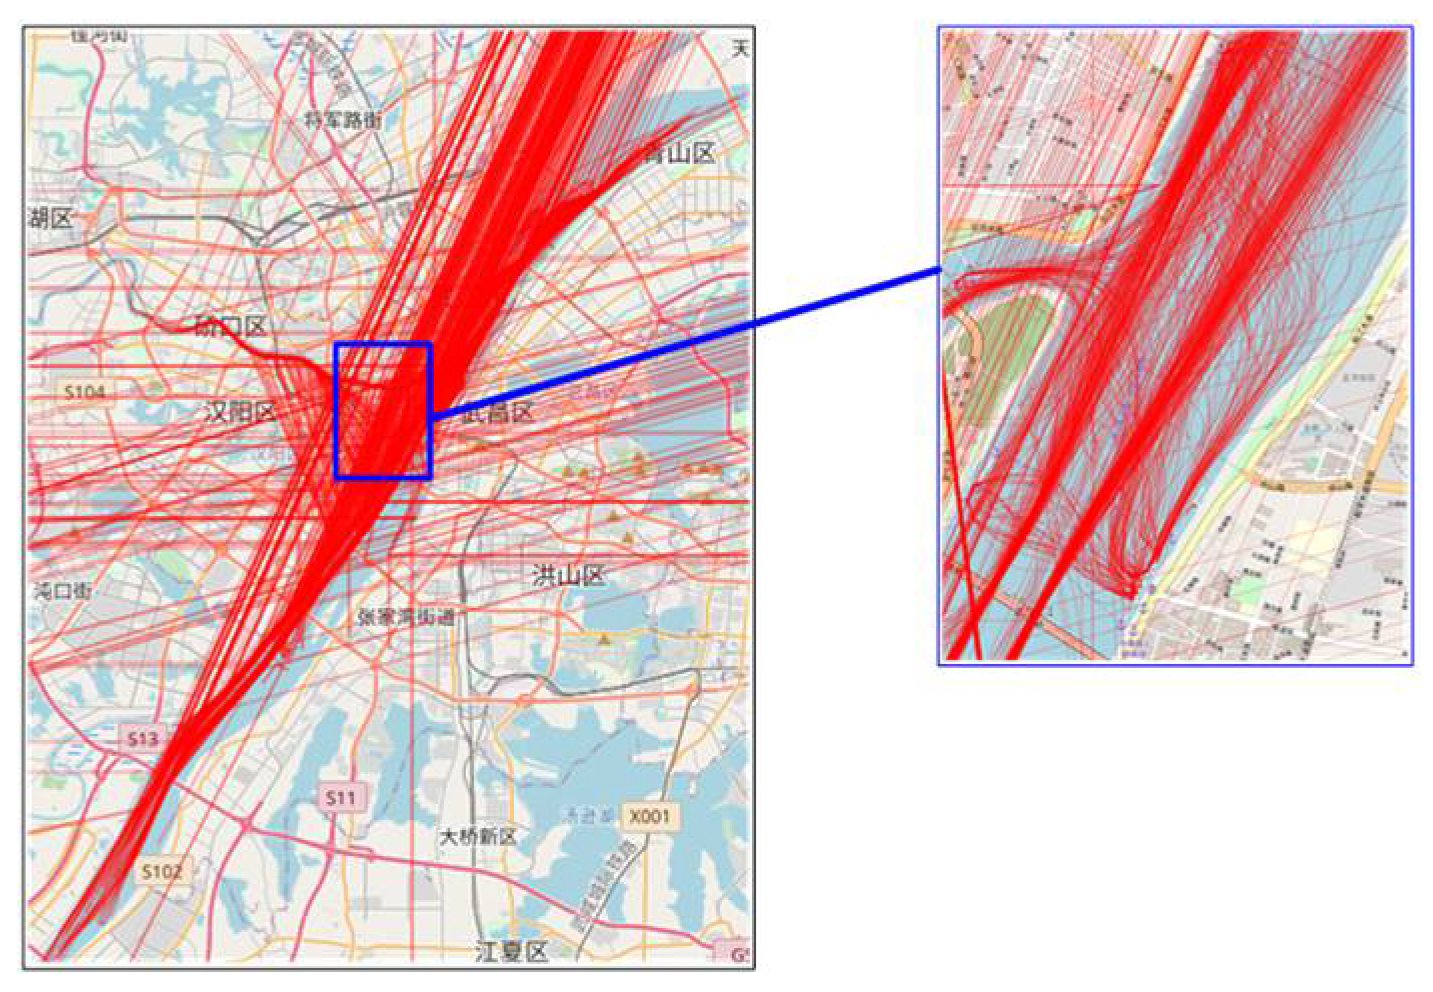
As AIS-based raw data are the research object of ship trajectory, there can be sampling data errors due to the abnormal operation of software or hardware equipment. Hence, these data need to be preprocessed first to clean the wrong AIS data dynamic information and repair the missing information. Figure 1 shows that there are a large number of erroneous data in the AIS-based raw data of the Wuhan Bridge section in the Yangtze River from October 2020 to November 2020, and there are many ferry trajectories to and from Jijiazui Wharf, Qingchuan Wharf, Wuhan Guan Wharf, Zhonghua Road Wharf, etc., which are useless for the study of ship trajectory data on the main routes between the Han River and the Yangtze River. Therefore, the AIS-based raw data need to be cleaned and repaired before studying it, such as with regard to ship latitude and longitude, speed, heading, etc.
2.1.1. AIS Data Cleaning
The parsed dynamic information is sorted according to the ship’s MMSI, and if the ship’s MMSI does not match, it is classified as the sub-trajectories of different ships; for trajectories with the same MMSI, when the time difference between two consecutive ship trajectory points is greater than 900 s, they are divided into sub-trajectories of the ship and data points with MMSI equal to 0 are deleted. In this paper, we mainly use the time, longitude, latitude, speed, and heading characteristics of the AIS data dynamic information, which are denoted t, x, y, v, and θ respectively, as shown in Table 1.

Table 1.
AIS data dynamic information.
According to observation of the AIS data, we find that there are three types of error data: abnormal latitude and longitude, abnormal heading, and abnormal speed. Therefore, the following cleaning rules are formulated for error data types.
(1) Area restriction: Defining the research area and deleting data points outside the area.
(2) Removing the duplicate data: Repeated AIS data are the same AIS data sent by a ship continuously while underway. For this kind of data, set rules are as follows: if the speed of the i-th track point is greater than 2 knots, but the data of this track point i are the same as the data of the next track point, then they are deleted.
(3) Position offsetting: If the coordinates of the trajectory points in the AIS data have changed, it will cause the distance between the two adjacent coordinate points to suddenly become larger, which will lead to the calculated vessel sailing speed being clearly unrealistic. Since the coordinates in the AIS data are from the WGS84 coordinate system in the differential GPS-DGPS, the distance between two track points can be calculated by the following:
where R is the radius of the Earth.
The average speed between the two trajectory points is as follows:
When the average speed is greater than 10 knots, the corresponding track points are deleted as error data.
(4) Processing excessive acceleration: According to the Inland Waterway Navigation Standards, the acceleration distance Lm is 20 times the ship’s length in theoretical conditions, while the distance can be reduced to 10–14 times the ship’s length when the ship is empty. To prevent deleting correct AIS data, the acceleration distance Lm is set to be 10 times the ship’s length in the unloaded case in this paper. According to the equation of uniform acceleration motion, the maximum acceleration of the ship is calculated as follows:
where L is the length of the ship and Vm is the maximum speed of the ship sailing in the Wuhan section.
In the calculation, the value of Vm is taken as the maximum inland vessel speed of 12 knots (6.17 m/s), and the length L is set to 100 m. The maximum acceleration of 0.02 m/s2 is obtained using the above formula and is removed when the acceleration between two trajectory points exceeds 0.02 m/s2.
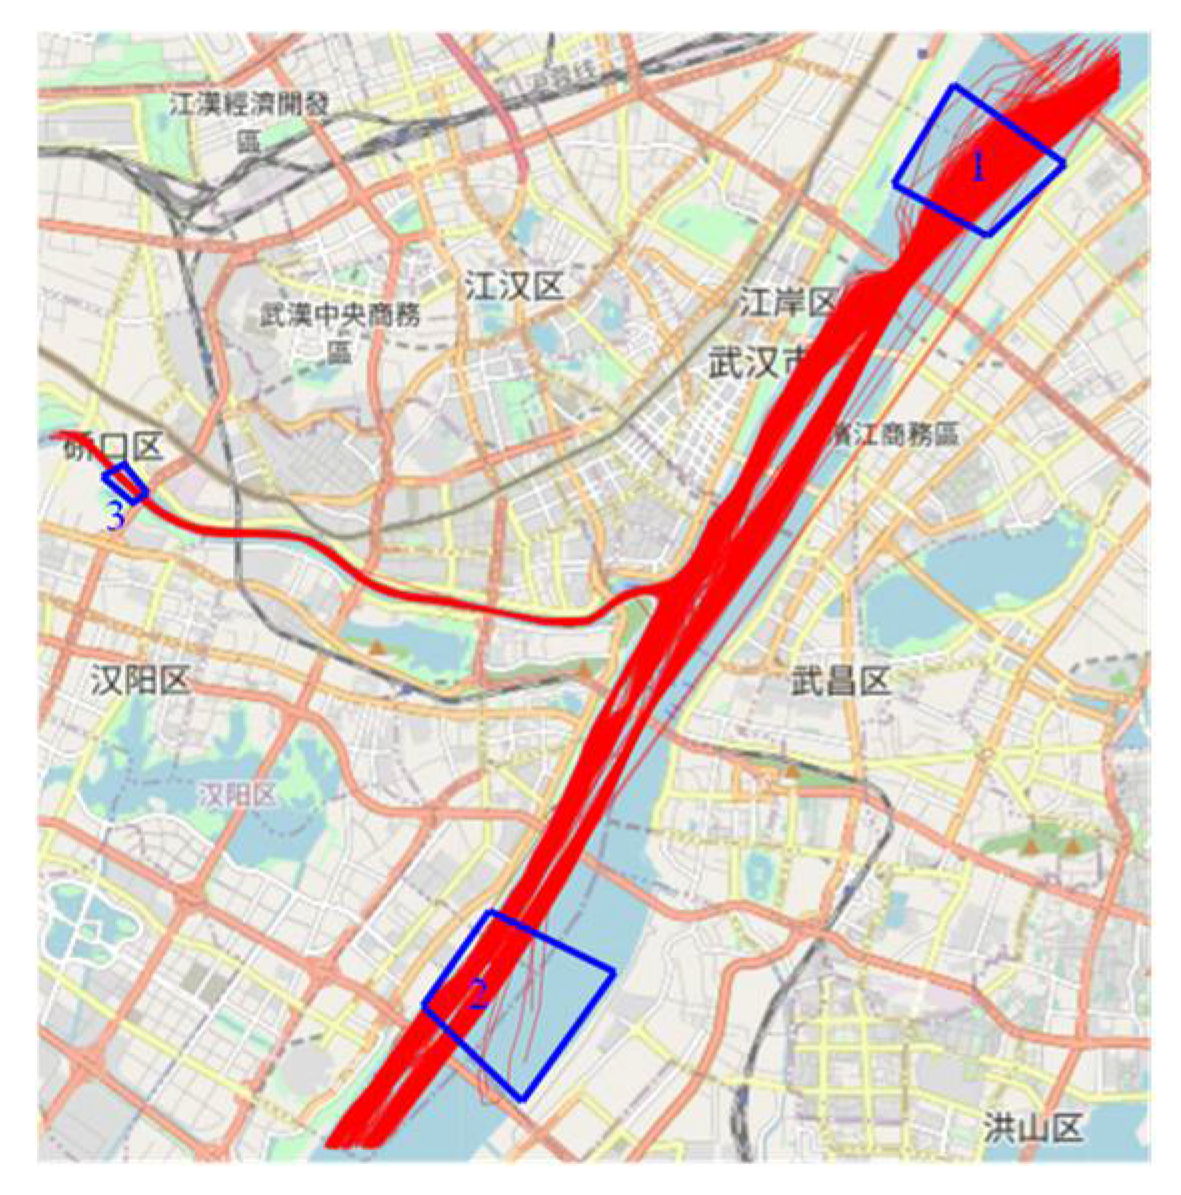
(5) Removing ferry data: To eliminate the ferry data, this paper adopts the following rules: the trajectory passes through Region 1 and Region 2 at the same time, Region 1 and Region 3 at the same time, or Region 2 and Region 3 at the same time, as shown in Figure 2.

Figure 2.
Prediction of ship trajectory process based on AIS-based raw data.
After processing the data as described above, the cleaned trajectories are as shown in Figure 3, and it can be seen that the wrong AIS dynamic data have been removed. However, anomalous data with little position deviation or speed not exceeding the cleaning criteria still exist, and personal judgement may be required if the anomalous data are to be completely cleaned.

Figure 3.
Schematic diagram of AIS trajectory after cleaning.
2.1.2. AIS Data Repairing
After data cleaning, there are some problems such as missing track points and inconsistent data time intervals in the AIS-based ship trajectory. To ensure the subsequent clustering and prediction, the segmented cubic Hermite interpolation is selected to repair the missing trajectory points. Its expression is as follows:
where , .
2.2. Ship Trajectory Data Clustering
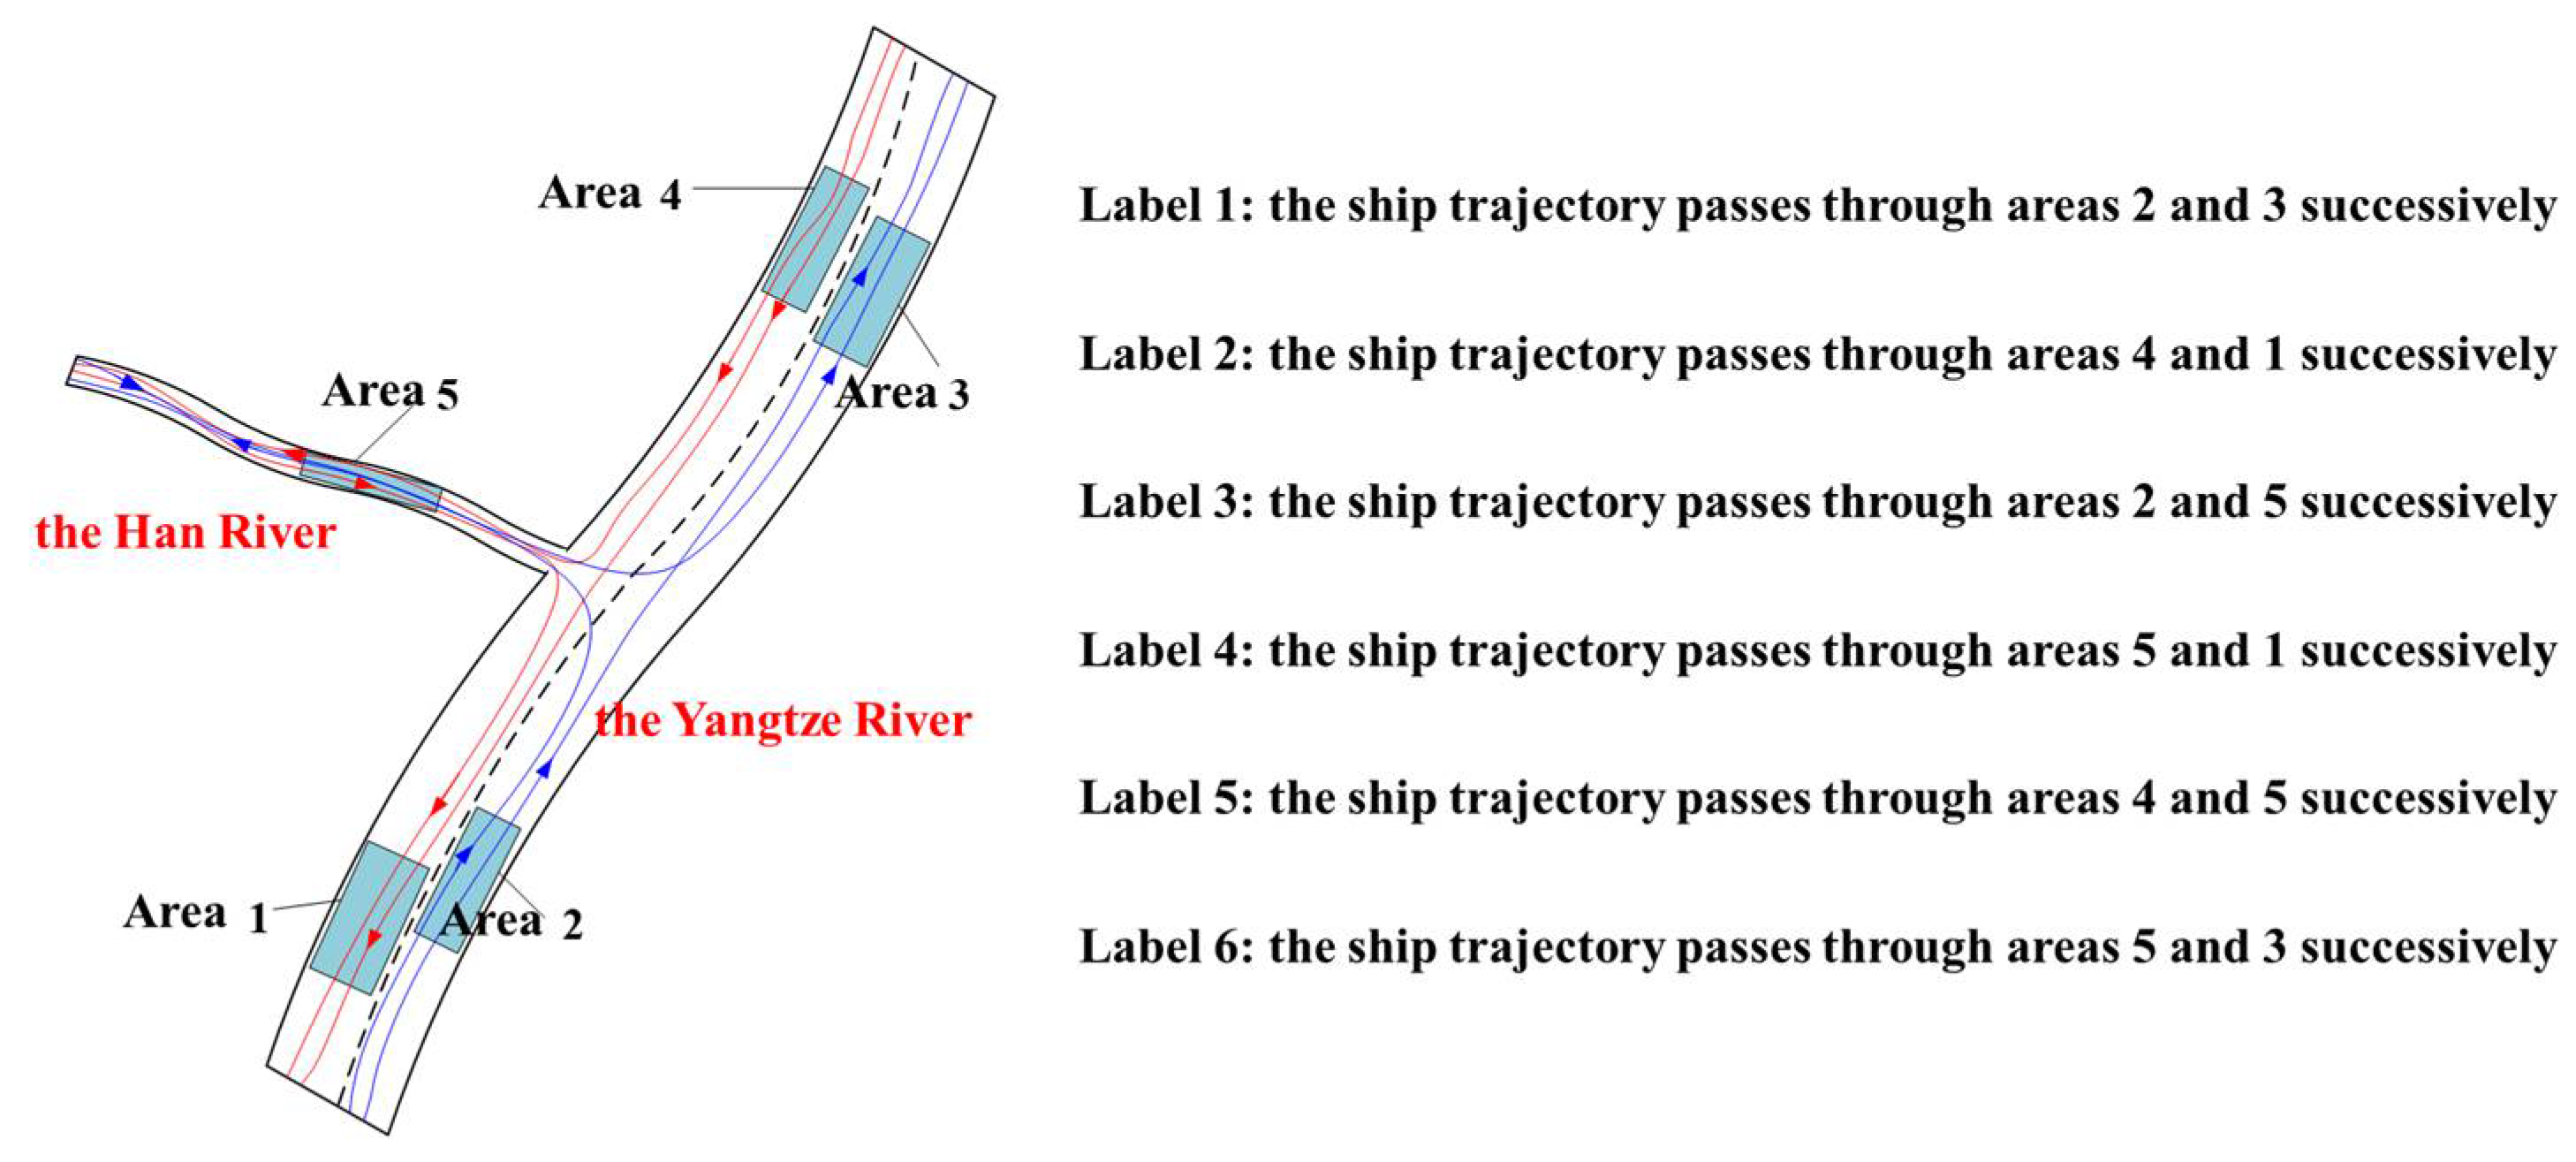
When a ship is navigating in the Yangtze River Channel, its trajectory clusters are obvious due to the constraints of the “Regulations for Navigation in the Middle Reaches of the Yangtze River”. Hence, we set the five sailing areas to quickly obtain each route and mark six training labels, as shown in Figure 4.

Figure 4.
Schematic diagram of sailing area division and route label marking.
2.3. Ship Trajectory Prediction
The proposed method for ship trajectory prediction by SKNN is described in this section to predict which route the ship will sail on according to the current trajectory and determine appropriate collision avoidance measures that can be taken in time to avoid collision accidents. In this method, we improved KNN by considering the sensitivity.
2.3.1. K-Nearest Neighbor Algorithm Considering the Sensitivity (SKNN)
The K-Nearest Neighbor Algorithm is a common classification algorithm whose basic approach is to find the individual that differs the least from the predicted sample and consider the class of the predicted sample to be the same as the class of that individual. The Euclidean distance is often used as a distance metric function in KNN algorithms. The Euclidean distance assigns the same weight to the different characteristic quantities of the sample, as shown in Equation (8).
where x is the test sample, and y is the training sample.
However, different feature quantities have different effects on the accuracy of the classification results in practical situations. For this reason, the sensitivity method is introduced to improve the KNN, and the improved Euclidean distance equation is as follows:
where w is the feature weight. Its calculation process is as follows:
(1) The test samples are classified using the conventional KNN algorithm and counting the number of misclassified samples as n.
(2) The samples are removed i (i = 1, 2, 3, 4, …, l) feature vectors at a time, and then the conventional KNN method is used to classify the test samples and count the number of misclassified samples as ni.
(3) Stipulating when ni = 0 or n = 0, ui = 1; The larger the ni, the greater the error of classification, and the greater the contribution of the i-th feature to classification; The smaller ni is, the smaller the classification error is and the smaller the effect of the i-th feature is.
The weight coefficient of the i eigen weight is defined as:
where the fulfillment of conditions is .
2.3.2. Data Training of Ship Trajectory Prediction
In our method, the labels are regarded as the prediction results, and the sub-trajectories of all ships are taken as samples. Then, the k sub-trajectories with the closest distance to the current ship’s trajectory data are found, and the labels of these k sub-trajectories are counted, and the highest number of labels is the final prediction result. The conventional KNN algorithm assigns equal weights to the labels of all k sub-trajectories, i.e., the weights of all the neighboring points are equal. However, in instances of sample imbalance, where one class has a significantly larger number of samples compared to others, there is a high probability that the classification model will be skewed towards the majority class. This bias can lead to misclassification errors for test samples that belong to the minority classes. For this reason, this paper uses the method of weights to improve this problem. By using the reciprocal of the distance as the weight of the label, the neighbors with a small distance from the sample have large weights, while the neighbors with a large distance from the sample have relatively small weights; thus, the factor of distance is also taken into account to avoid misclassification due to too large a sample.
To avoid the effect of the difference in the data magnitude of longitude, latitude, speed, and heading on the model results, this paper uses Min-Max scaling to normalize the data, as shown in Equation (11).
where, 1 ≤ i ≤ n, 1 ≤ j ≤ n, max{xj} is the maximum value of the sample data, min{xj} is the minimum value of the sample data, and the transformed data are all within [0, 1].
In addition, this paper uses the data structure of the k dimension tree algorithm (kd-tree) to save the training data; using the kd-tree for nearest neighbor search reduces the number of calculation times. The main steps are as follows:
(1) Find the leaf node containing x in the k-d tree.
(2) Take this leaf node as the current nearest point and calculate the distance from the current nearest point to the target point, which is D.
(3) Recursive upward backtracking, with the following operation at each node: If the distance Dcur from the instance point is saved by that node to the target point, and if Dcur < D, the current node is taken as the current nearest point. Check whether the region corresponding to another child node of the parent of this child node intersects the hypersphere with the target point x as the center of the sphere and D as the radius; (i) intersect: there may be a point closer to the target point in the region corresponding to the other child node, move to the other child node and recursively perform the nearest neighbor search; (ii) do not intersect, backtrack upwards.
(4) When it returns to the root node, the search ends, and the current nearest neighbor is the X’ nearest neighbor.
3. Results and Discussion
3.1. Data Preprocessing Results
The trajectories of the ship with MMSI 413210950 are analyzed before and after restoration for a total of 1000 s from 21/10/2020 14:41:00 to 21/10/2020 14:57:50, comparing linear interpolation, quadratic interpolation, and segmented triple Hermite interpolation methods for the cleaned trajectories in five aspects: time, longitude, latitude, speed, and track direction. The restoration effect is considered below. The red circles in Figure 3 are the original trajectory points; it can be seen from the figure that the original AIS trajectory data have a lot of data loss and the data sending period is unstable.
Figure 5 shows the restoration results of longitude (lon), latitude (lat), velocity (SOG), and heading (COG). Figure 5a shows that the three interpolation methods have comparable longitude restoration effects when the data are missing at short distances, while the secondary interpolation and segmented triple Hermite interpolation methods have closer restoration effects when the data are missing at long distances. Figure 5b shows that the latitude restoration results of the three interpolation methods are comparable at both long and short distances. Figure 5c,d show that the speed and heading fixes of the three interpolation methods are comparable in the case of missing data at short distances, while the secondary interpolation is poor in the case of missing data at long distances, and the linear interpolation and segmented three-time Hermite interpolation methods are close to each other. In summary, the three interpolation methods are comparable when the data are missing at short distances, the segmented three-times Hermite interpolation method is better when the data are missing at long distances, while the original trajectory characteristics are well maintained. Therefore, this paper selects the segmented three-times Hermite interpolation method to repair the trajectory.
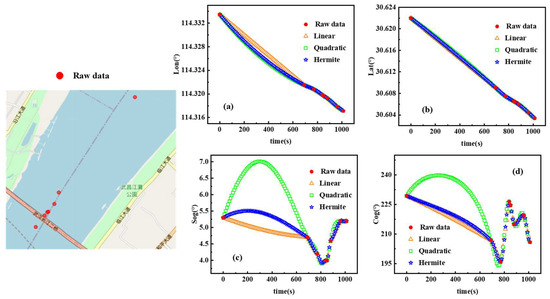
Figure 5.
Schematic diagram of sailing area division and route label marking (a: longitude; b: latitude; c: speed; d: heading).
3.2. Analysis Effect of Clustering
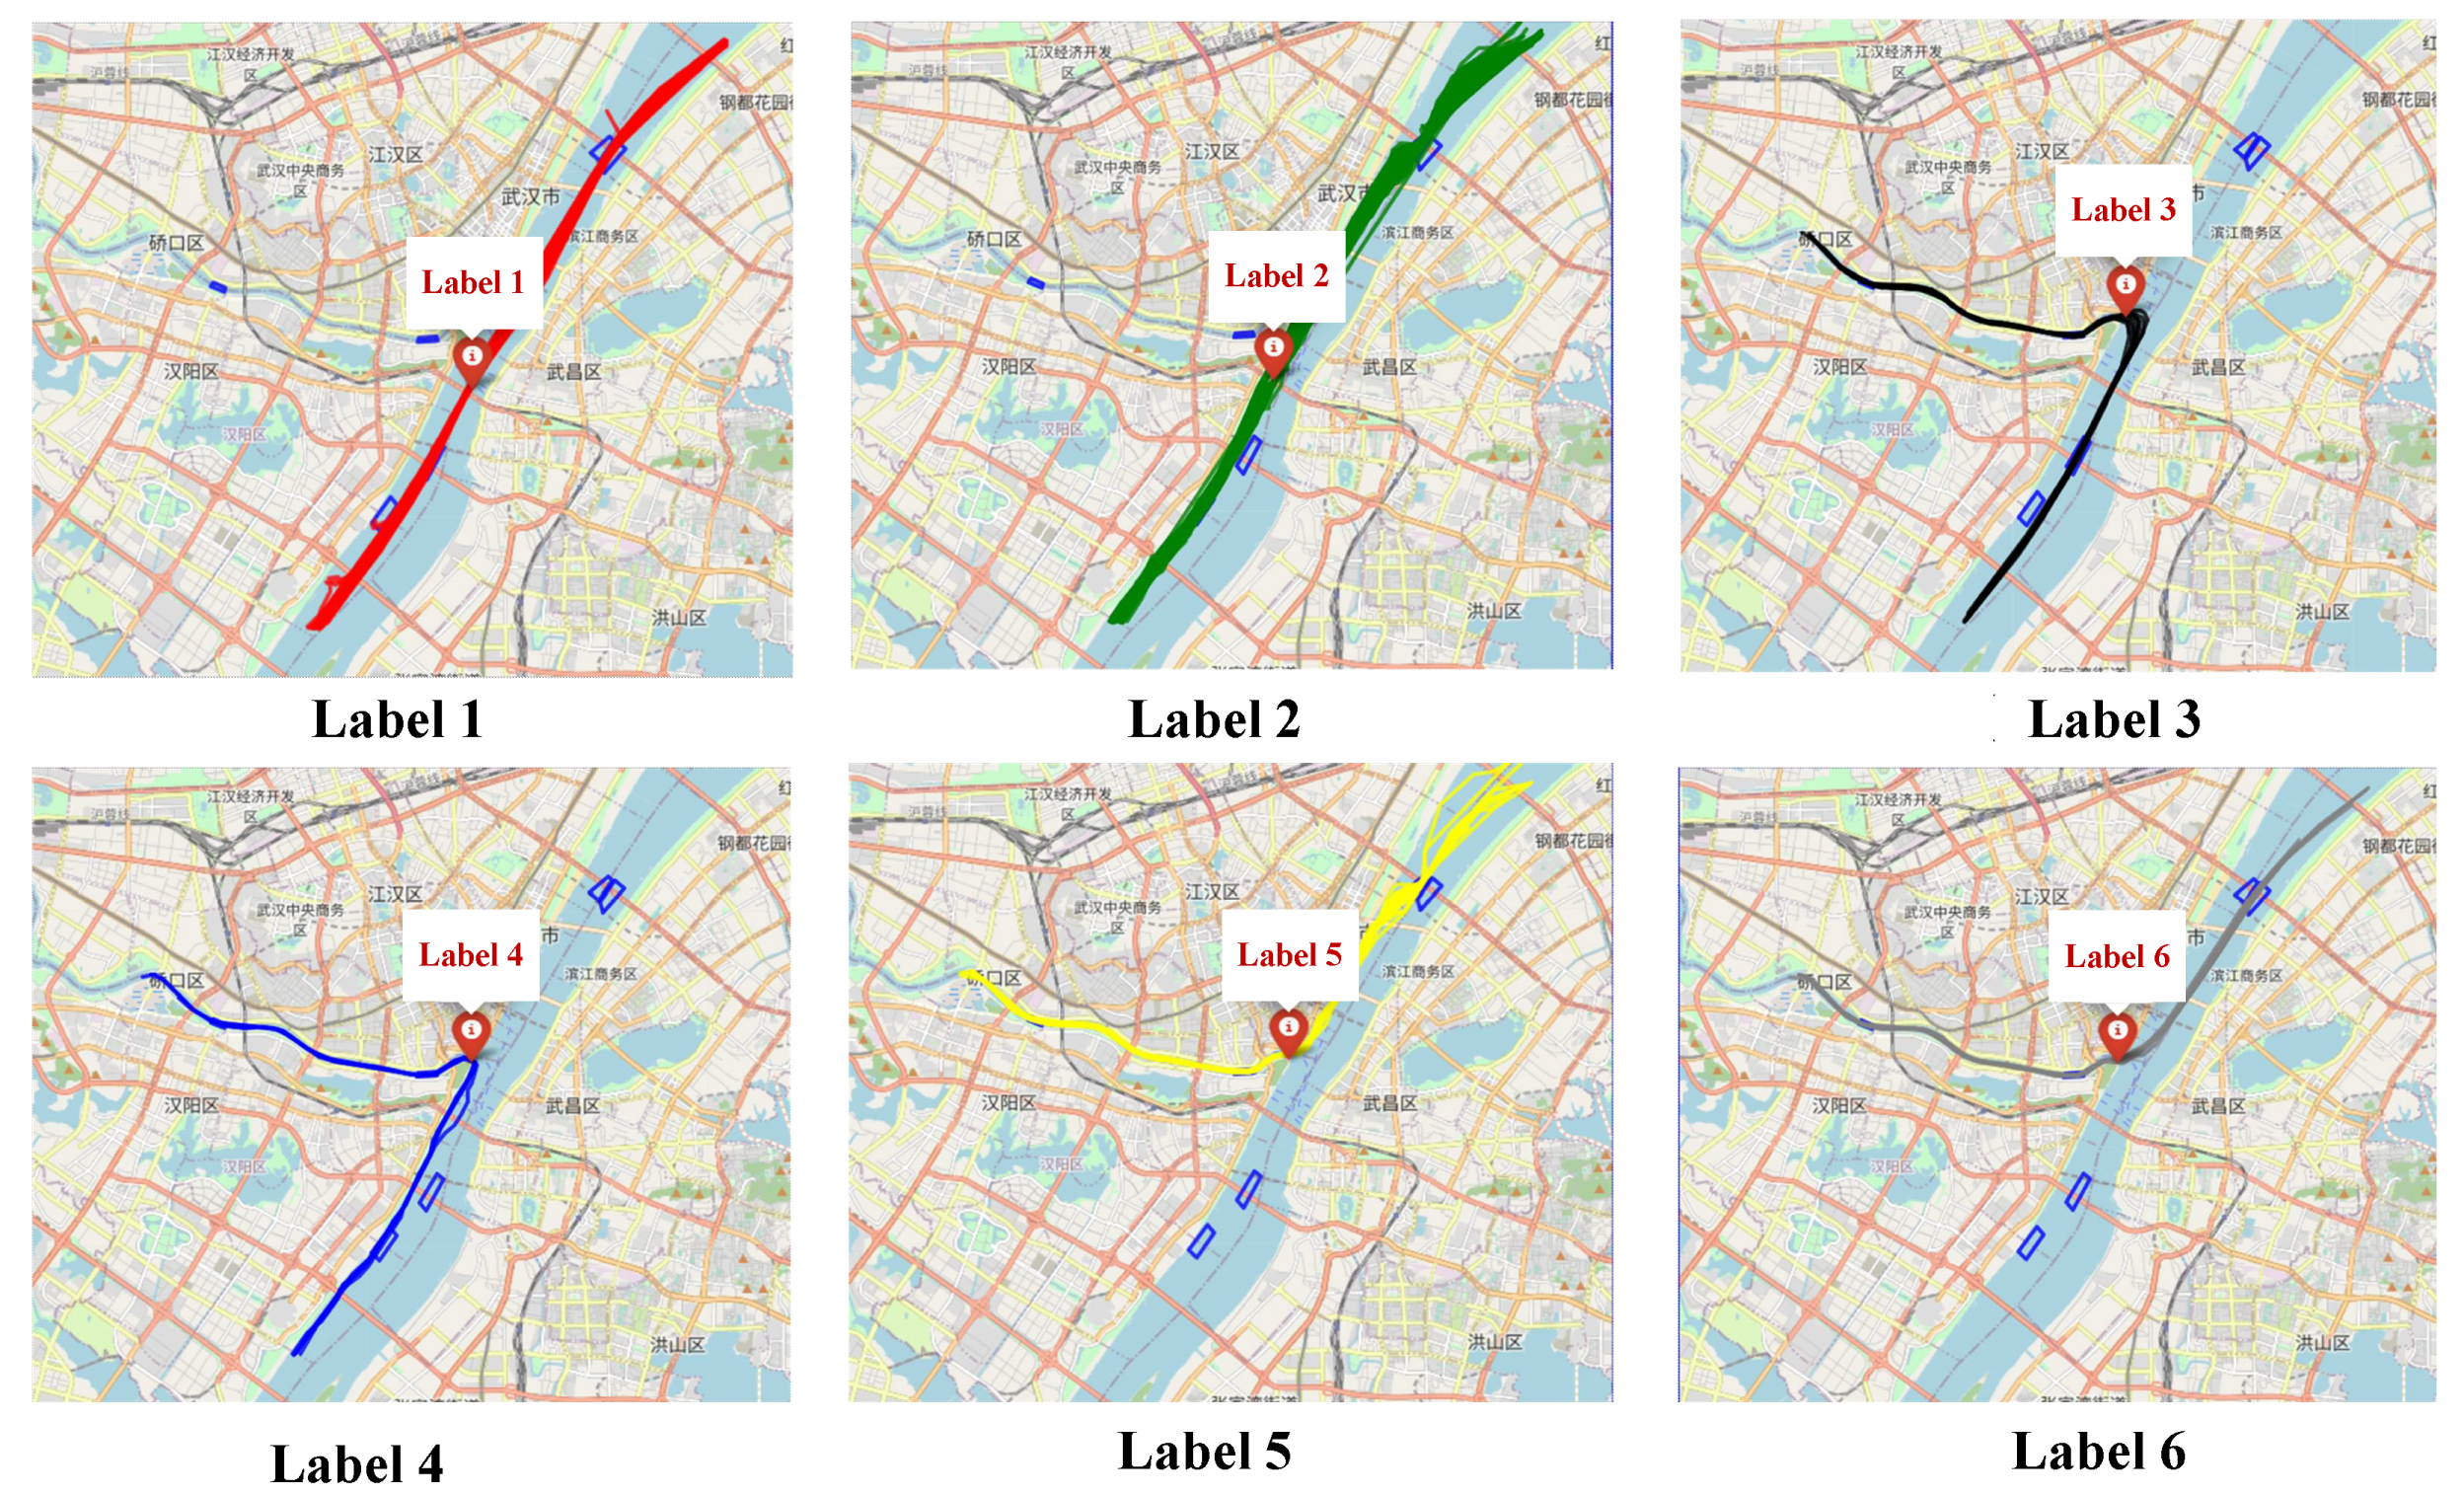
To verify the effectiveness of the above clustering method, this paper clusters the cleaned AIS data. The clustering results are shown in Figure 6. As can be seen from the figure, the clustering method proposed in this paper can cluster the ship routes well.

Figure 6.
The result of ship trajectories clustering based on AIS data.
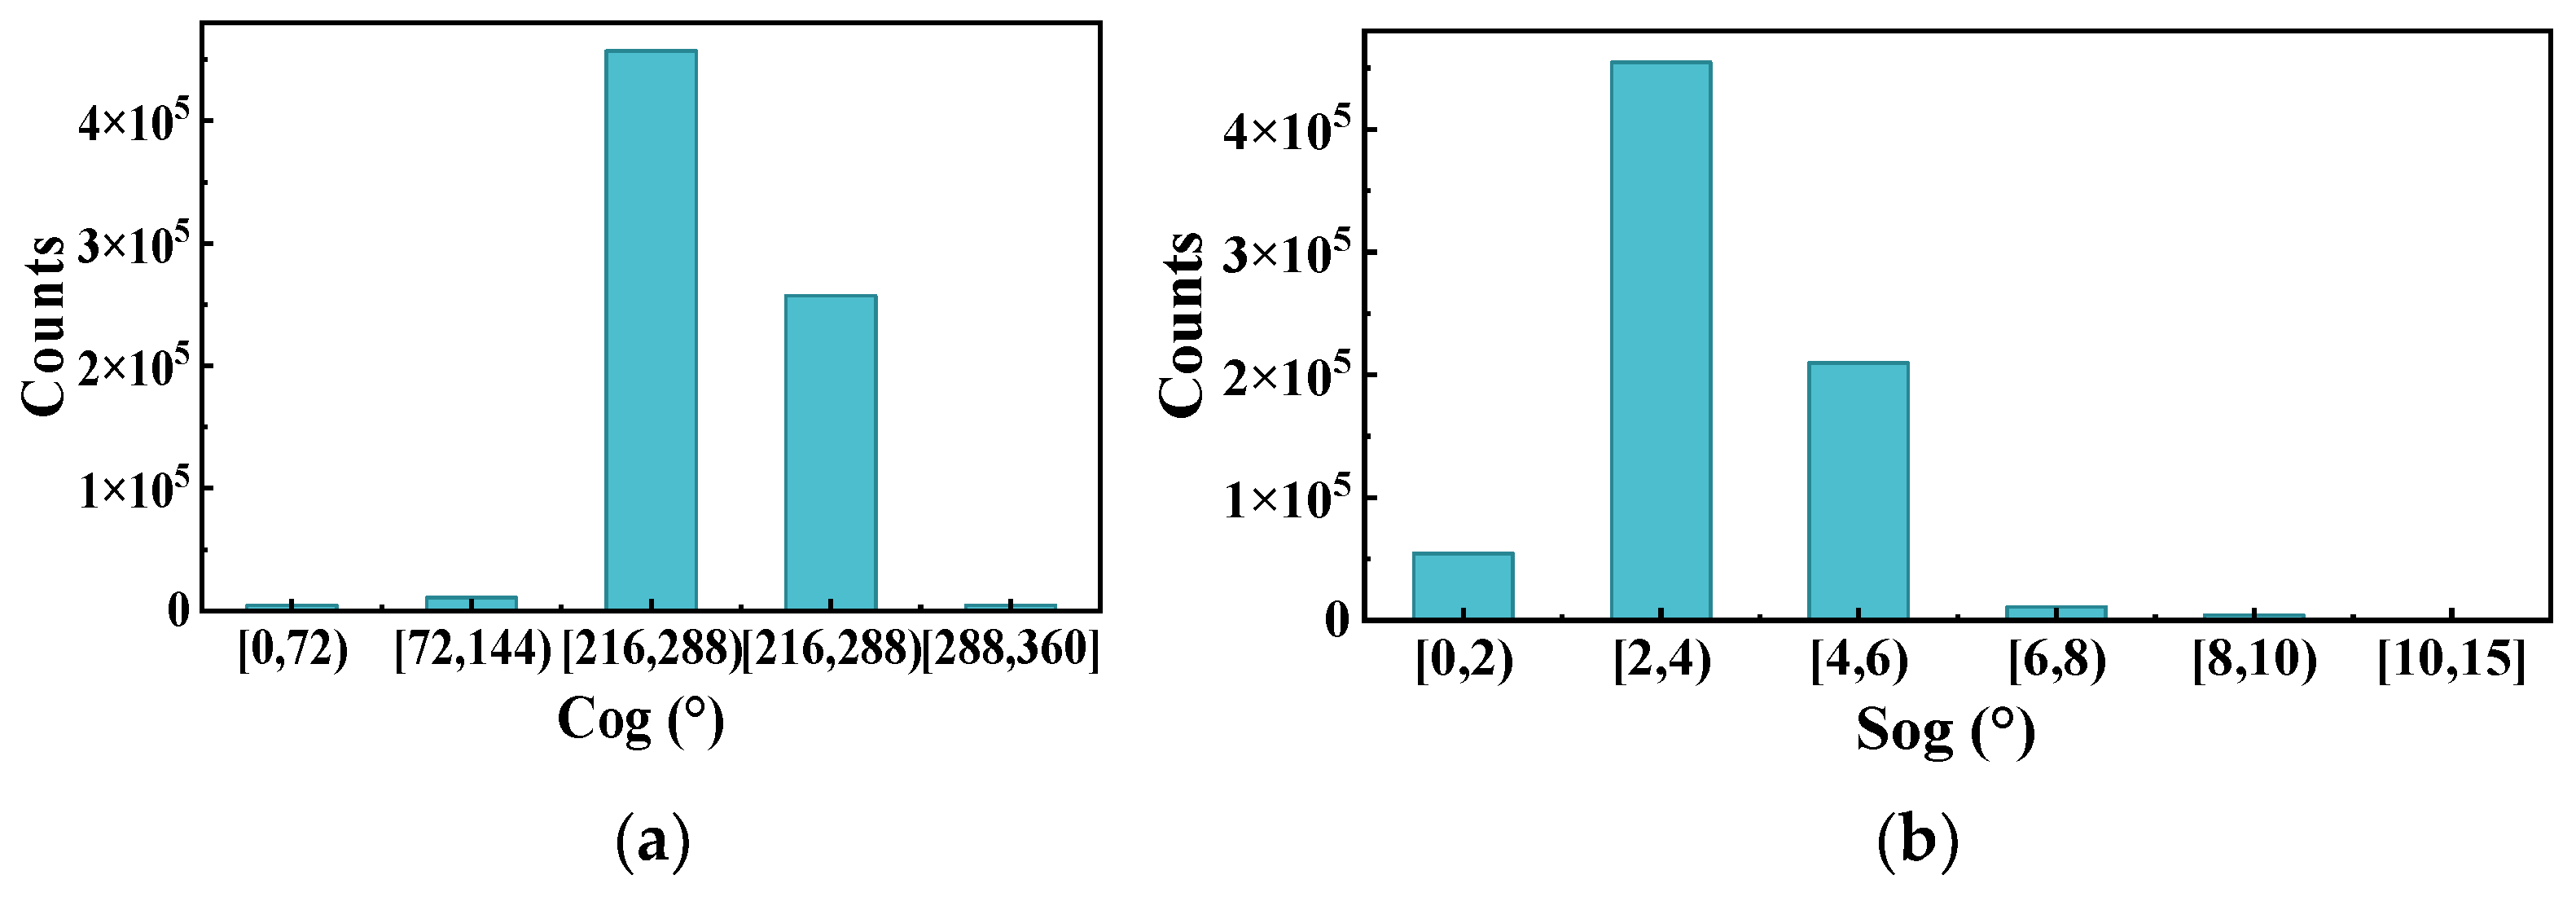
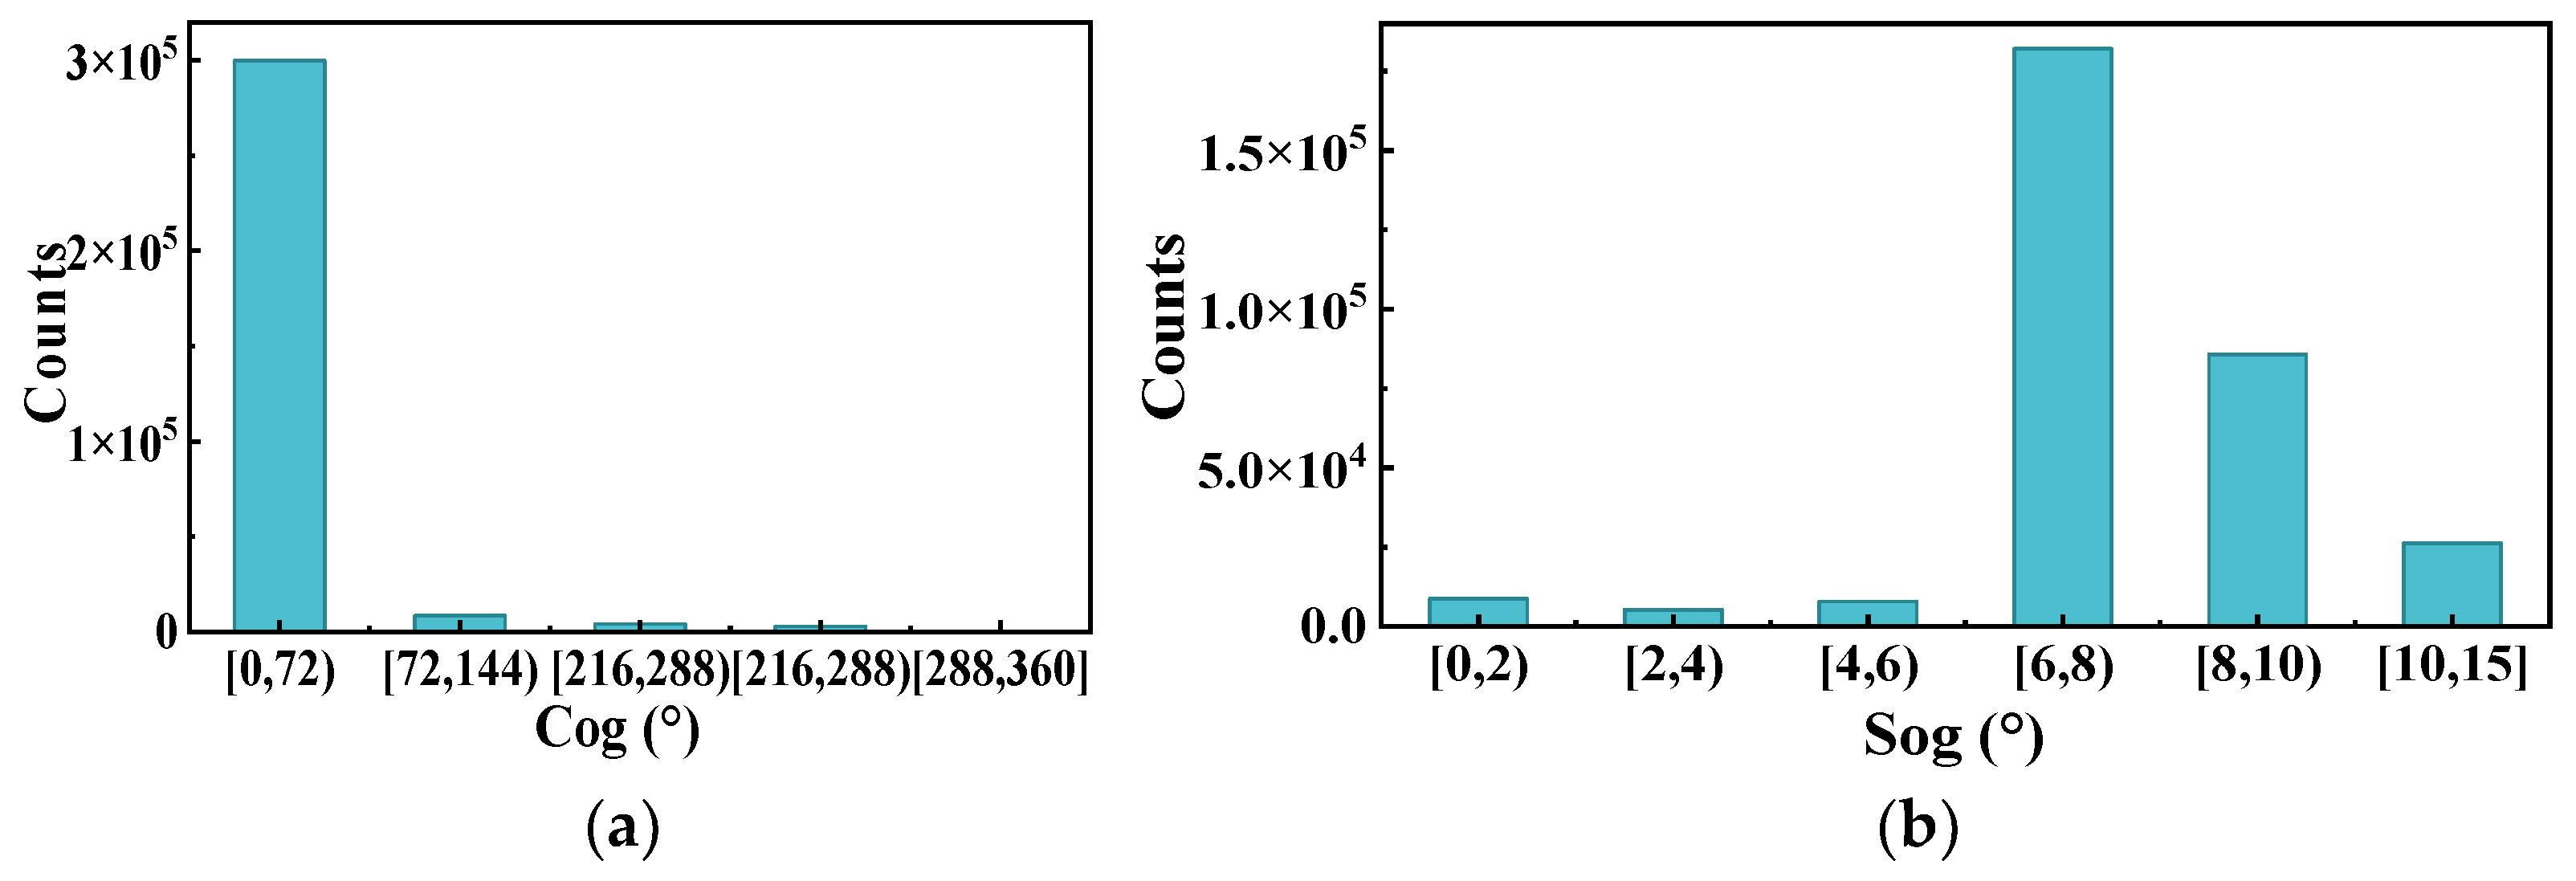
To gain a deeper understanding of the navigational patterns of vessels within inland waters, this study employs the speed and heading information from AIS data corresponding to label-1 and label-2 as indicative features of vessel behavior. This analysis aims to assess the impact of both upstream and downstream conditions on these navigational behaviors.
The Figure 7a and Figure 8a show the ship heading distribution of this trajectory class, and Figure 7b and Figure 8b shows the ship speed distribution of this trajectory class. As can be seen from the graph, the heading of upbound vessels is concentrated between 144°~288° and the speed is concentrated between 2 m/s~6 m/s, while the heading of downbound vessels is concentrated between 0°~72° and the speed is concentrated between 6 m/s~10 m/s. The heading and speed of the two labels have obvious regional characteristics. In addition, the vessel speed of tag 2 is significantly greater than that of tag 1. This is because the inner speed of river vessels is affected by the current; downstream vessels (vessels in tag 2) need to travel against the current and their speed is affected by the current. The impact of the ship is weakened; in contrast, the upstream ship (the ship in label-1) sails with the current, and the speed is equal to the sum of the ship’s speed and the current speed, which is necessarily relatively faster. It can be seen that the behavioral pattern recognition under the trajectory clustering algorithm based on this paper can effectively explore the navigation pattern of ships, thus helping maritime managers to perceive the traffic form in the waterway.
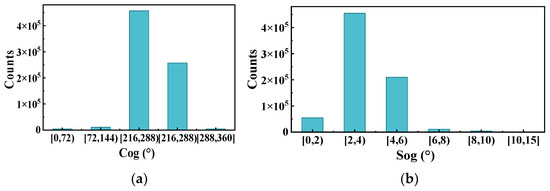
Figure 7.
Frequency distribution of heading (a) and speed (b) of label-1.

Figure 8.
Frequency distribution of heading (a) and speed (b) of label-2.
3.3. Prediction Accuracy
3.3.1. Subtract the Length
In our method, 95% of the ship sub-trajectories from label 1–6 are taken as training sets and 5% as test sets, respectively. The length of the current trajectory of the ship has an important influence on the route prediction. The ship may predict different results at different stages, and if the ship has sailed only a short distance, the route prediction result may be very inaccurate and difficult to predict by the current trajectory; however, if the ship has sailed a relatively long distance, the prediction result is more accurate. For this reason, sub-trajectories with different trajectory lengths are used as input quantities.
Figure 9 shows that the accuracy of the SKNN, the NB (Naive Bayesian algorithm), and the KNN gradually increase with increase in the sub-trajectory length. Under each sub-trajectory segment, the accuracy of the SKNN is the highest, the KNN is the second, and the NB is the worst, which indicates that the SKNN is effective.
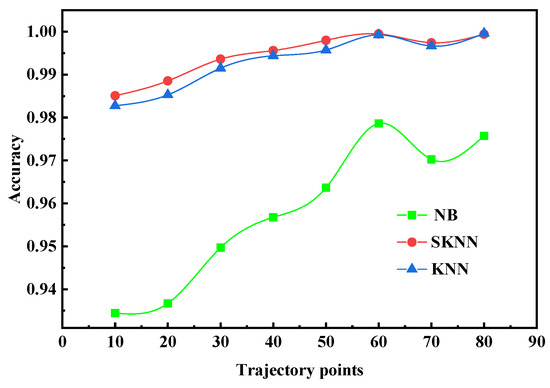
Figure 9.
The effect of trajectory with test sample length.
Figure 10 shows that the three methods can achieve high accuracy when the input trajectory length n is 60 trajectory points. For this reason, 60 trajectory points are selected as the input quantity in this paper, and the feature weights of longitude, latitude, speed, and heading are [0.17, 0.23, 0.3, 0.3].
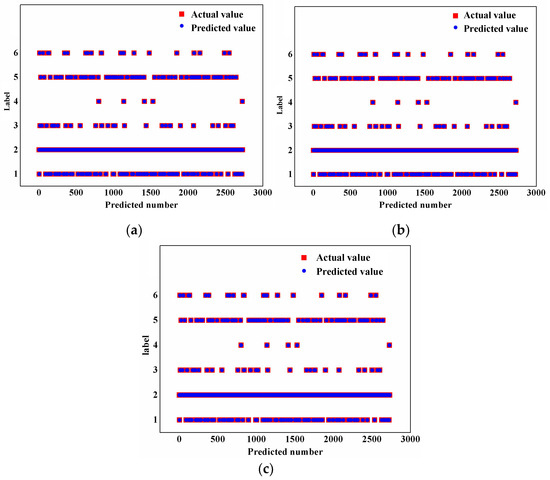
Figure 10.
Comparison of accuracy from different algorithms. (a) Accuracy of NB = 0.9762; (b) accuracy of KNN = 0.9967; (c) accuracy of SKNN = 0.9996.
3.3.2. Optimal k-Value for Comparing SKNN and KNN
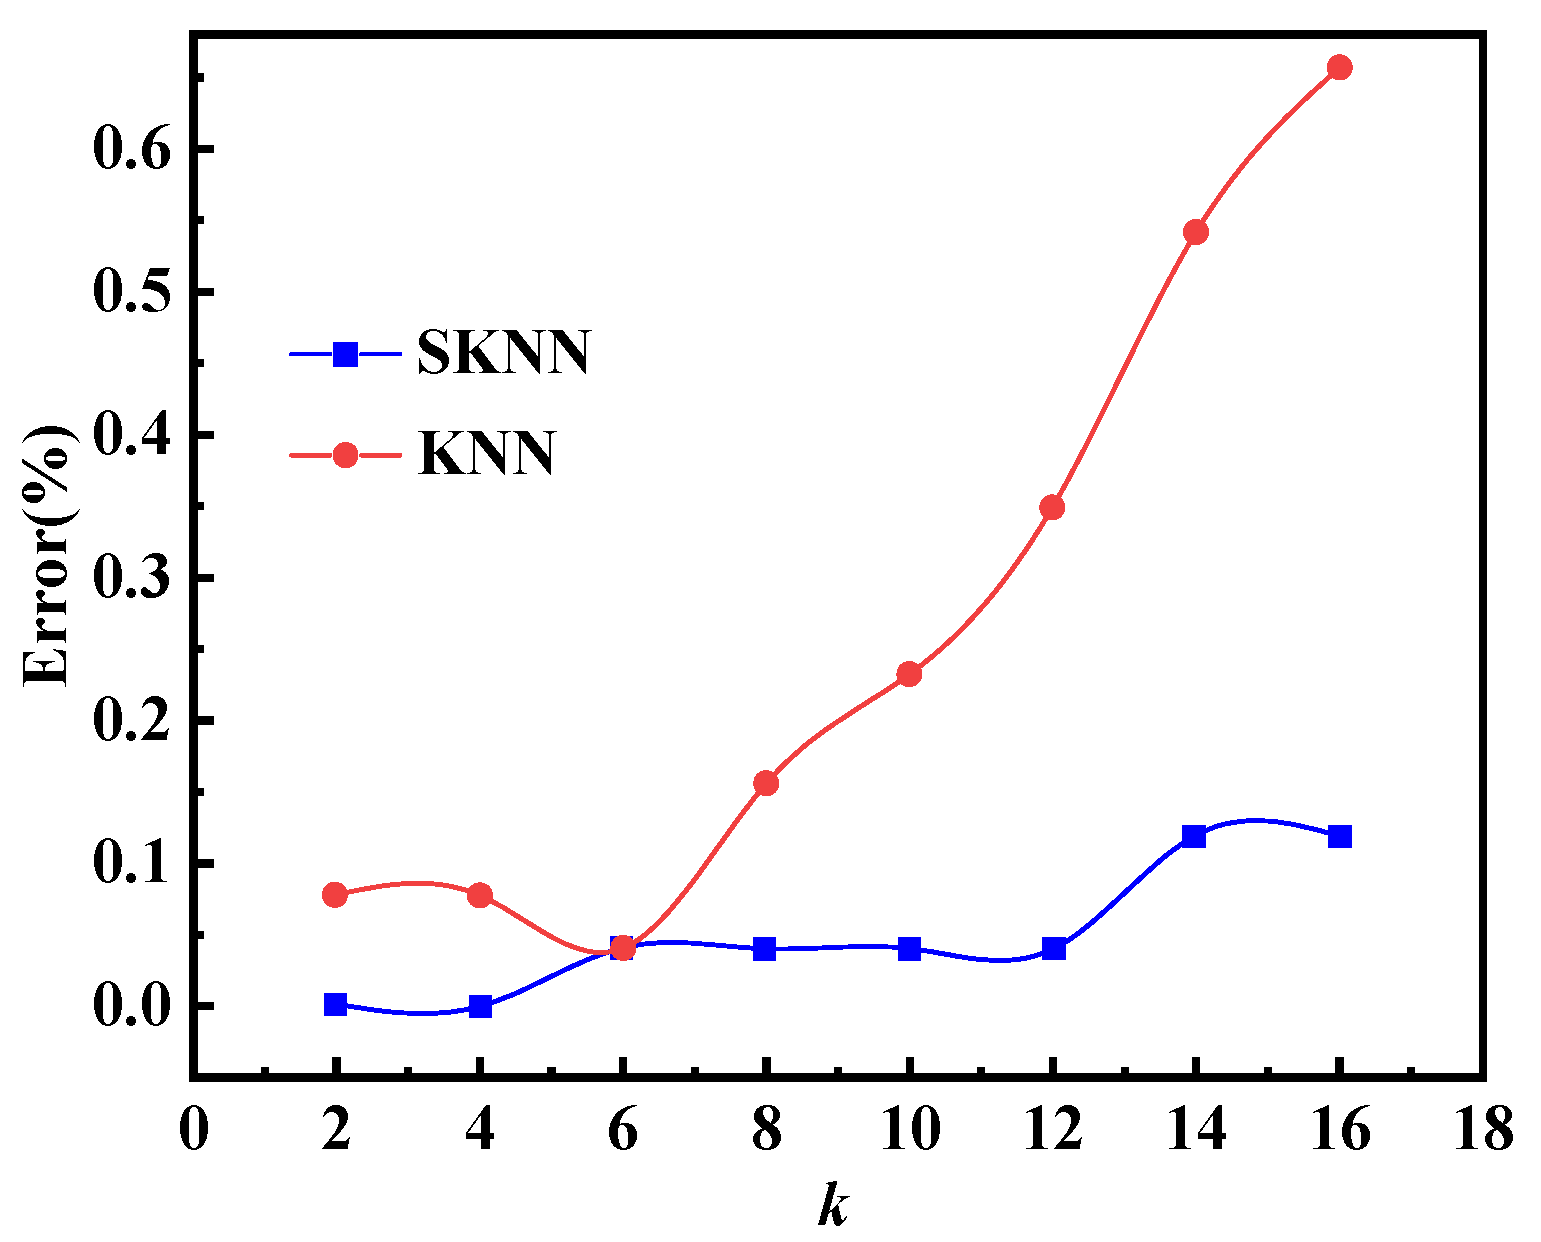
Selecting an appropriate value of k is crucial for the effectiveness of the KNN. If the value of k is too small, the model has a high squared error problem, leading to overfitting; If the value of k is too large, there is a high bias problem in the model, resulting in underfitting. The k-value can be adjusted based on the distribution of data points in the feature space. If the data points are relatively dense in a certain area, a smaller k-value can be used to avoid overfitting; And in areas with sparse data points, larger k-values are used to increase the model’s generalization ability.
Figure 11 shows that when k takes the same value, the accuracy of SKNN is less than or equal to that of KNN, and the accuracy of both SKNN and KNN decreases when k increases. When k equals 6, the accuracy of SKNN and KNN is the same, which provides a reasonable benchmark for evaluating the effectiveness of SKNN relative to KNN. To further compare the accuracy of the two algorithms under different test samples, the value of k was selected as 6 for subsequent calculations. Therefore, choosing a k-value of 6 helps to fairly compare the performance of the two algorithms under different testing conditions.
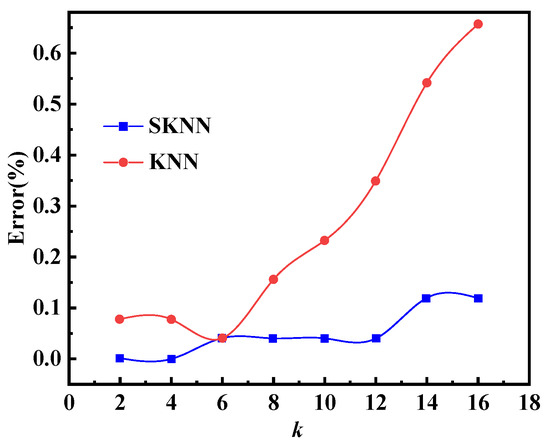
Figure 11.
Influence of k-value selection on accuracy.
3.3.3. Number of Training Samples
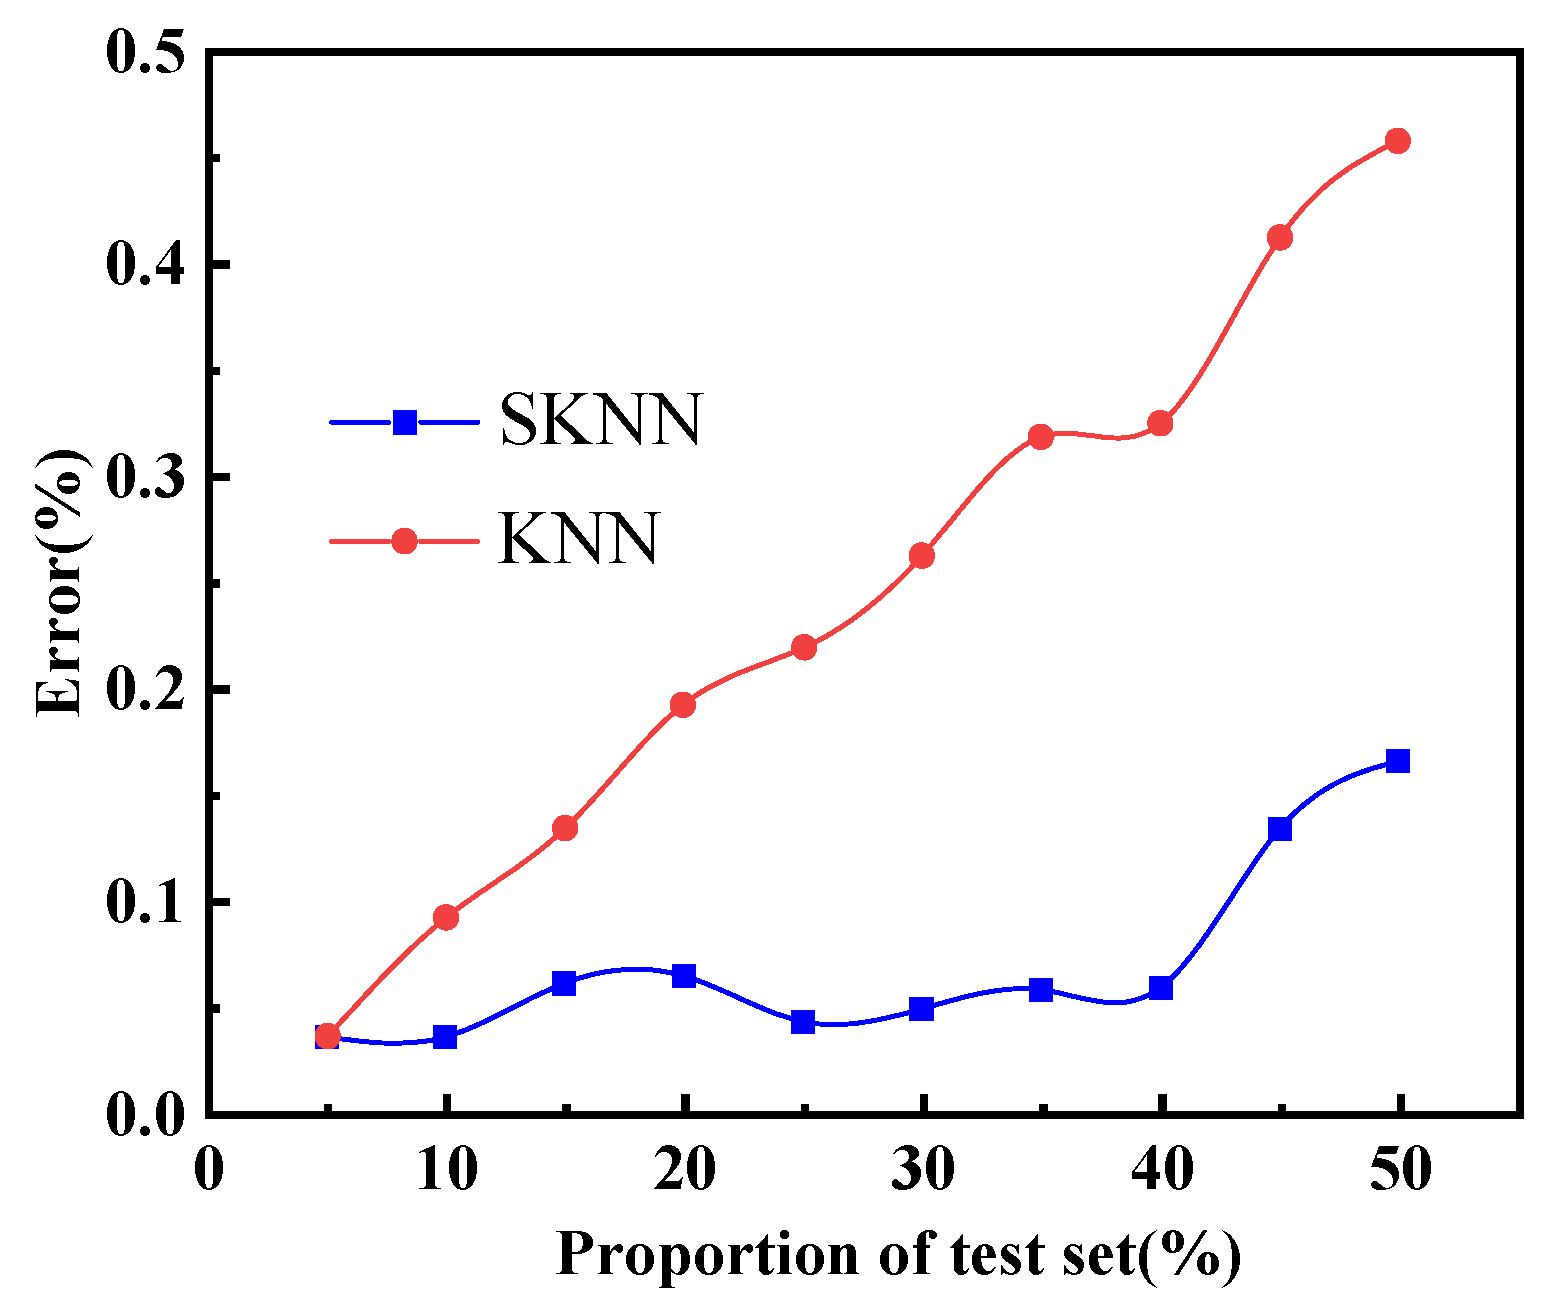
The percentage of test samples is gradually increased from 5% to 30%, with each growth step being 5%. How number of test samples relates to the error rate at the time is shown in the figure below.
Figure 12 shows that the error of both SKNN and KNN gradually increases with increase in the training samples. The error of the SKNN algorithm is smaller than that of the KNN algorithm for different numbers of test samples, and the advantage becomes more obvious as the number of test samples increases. Due to its weighting mechanism, the SKNN can better adapt to this change and maintain a lower error rate. In contrast, the KNN is affected by noise and outliers when the data features change significantly, resulting in an increase in error due to treating all neighbors equally. Therefore, the SKNN is more stable and more accurate than the KNN algorithm with increase in the training sample proportion under the condition that the k-value is determined. The SKNN algorithm can maintain more than 99% accuracy when the percentage of test samples is below 40%.

Figure 12.
Effect of the number of training samples on algorithm accuracy.
Table 2 shows that SKNN performs the best. The macro avg does not consider the number of samples in a category and assigns the same weight to all categories. The performance metric SKNN > KNN > NB using the macro avg indicates that the SKNN has a very balanced performance across various categories, while the NB performs poorly on small categories.
Table 2.
Comparison of performance metrics of SKNN, KNN, and NB.
The weighted avg considers the number of samples in a category, assigning greater weight to categories with larger sample sizes. The performance metric SKNN > NB > KNN using the weighted avg indicates that the SKNN has good adaptability to imbalanced datasets. Using the weighted avg, the precision, recall, and F1-score of all algorithms improved due to the large sample size of certain categories in the dataset, which have better performance and thus improve the overall performance indicators. The weighted avg performance index of the NB significantly improves, indicating that the NB may perform better in categories with a larger sample size.
In short, the SKNN has good adaptability to imbalanced datasets; the KNN performs better when dealing with categories with a larger sample size; the NB algorithm performs better in categories with larger sample sizes.
3.4. Discussion
In general, the length of the navigation trajectory for training has a significant impact on trajectory prediction. Compared to the conventional KNN and NB, the proposed SKNN has better generalization ability on new data, especially when there are smaller lengths of the navigation trajectories in the predicted samples, so, the prediction effect of the ship navigation trajectory is better. Although there is only a slight improvement in accuracy, this reflects the model’s more stable performance on unknown data.
Based on the above research results, the proposed SKNN improves the limitations of conventional KNN on training large datasets by enhancing the sensitivity of close-range points, thereby reducing time complexity. However, the SKNN algorithm still faces challenges in real-time prediction when fast response is required.
The proposed SKNN still has sensitivity to data quality and distribution. If the dataset contains noise or outliers, it may affect the accuracy of the prediction results. Although the training effect of SKNN is better than that of KNN, the influence of the selection of k still exists, and improper selection of k may lead to overfitting or underfitting.
Therefore, further research and improvement are needed in the field of ship trajectory prediction by SKNN and support is needed for research in areas such as ship navigation efficiency, energy management, and navigation path planning.
4. Conclusions
A method to support ship trajectory prediction using historical AIS data is established to address the problem of waterway transportation system safety in the event of ship encounters induced by waterway confluence or channel limitation, which includes three parts: ship trajectory data preprocessing, ship trajectory data rule-based clustering, and ship trajectory prediction by SKNN. The research conclusions for each part are as follows:
(1) For the preprocessing of AIS data, the segmented cubic Hermite interpolation method is more suitable for repairing the AIS data of ships, especially when long-distance data are missing.
(2) Aiming at the characteristics of the waterway confluence, a rule-based clustering method is proposed to cluster the AIS data from the converging waters. The results show that the clustering algorithm in our method can effectively determine the ship’s navigation law and ship heading distribution.
(3) To predict ship trajectory, an improved K-Nearest Neighbor Algorithm considering the sensitivity is proposed. Based on the clustered ship trajectory data, our KKNS, the conventional KNN, and the Naive Bayes algorithm are used to compare the effect of ship trajectory prediction. The results show that under various input trajectory lengths, the accuracy of our SKNN is higher than that of the KNN and the Naive Bayes algorithm. In the case of different k-values and proportion of test set samples, the accuracy of our SKNN algorithm is better, being above 99%. Furthermore, the SKNN has good adaptability to imbalanced datasets.
The research conclusions can assist maritime management departments in formulating traffic management policies and providing technical support for the identification of abnormal ship trajectories and the analysis of ship navigation risks.
Author Contributions
Conceptualization, Z.W.; methodology, Z.W. and J.L. (Jiafen Lan); software, J.L. (Jiafen Lan) and C.Z.; validation, Z.W. and C.Z.; formal analysis, Z.W. and C.Z.; resources, Z.W. and X.L.; data curation, W.H.; writing—original draft preparation, J.L. (Jiafen Lan); writing—review and editing, Z.W. and C.Z.; visualization, J.L. (Jiafen Lan); supervision, J.L. (Jinyu Lei); project administration, W.H. and J.L. (Jinyu Lei); funding acquisition, W.H. and Z.W. All authors have read and agreed to the published version of the manuscript.
Funding
This research was funded by the National Natural Science Foundation of China (No. 52172327); the Fujian Marine Economic Development Special Fund Project (No. FJHJF-L-2022-17); the Fujian Science and Technology Major Special Project (No. 2022NZ033023); the Science and Technology Key Project of Fuzhou (No. 2022-ZD-021) and the Fuzhou Marine Research Institute’s “Talent Recruitment for Project Leaders” Science and Technology Project (No. 2024F04); and the Scientific Research Foundation for the Ph.D., Minjiang University (No. MJY19032).
Institutional Review Board Statement
Not applicable.
Informed Consent Statement
Not applicable.
Data Availability Statement
Data are contained within the article.
Conflicts of Interest
The authors declare no conflicts of interest.
References
- Kim, K.; Lee, D.; Essa, I. Gaussian process regression flow for analysis of motion trajectories. In Proceedings of the IEEE International Conference on Computer Vision, Barcelona, Spain, 6–13 November 2011. [Google Scholar]
- Qi, L. Ship Encounter Intention Identification and Navigation Aid Application in Intersection Waters. Master’s Thesis, Wuhan University of Technology, Wuhan, China, 2020. [Google Scholar]
- Ma, J.; Li, W.K.; Zhang, C.W.; Zhang, Y. Ship encounter situation recognition by processing AIS data from traffic intersection waters. Navig. China 2021, 44, 7. [Google Scholar]
- Cho, Y.; Han, J.; Kim, J. Intent inference of ship maneuvering for automatic ship collision avoidance. IFAC 2018, 51, 384–388. [Google Scholar] [CrossRef]
- Cho, Y.; Kim, J.; Kim, J. Intent Inference of Ship Collision Avoidance Behavior Under Maritime Traffic Rules. IEEE Access 2021, 9, 5598–5608. [Google Scholar] [CrossRef]
- Luo, Y.H. Ship Trajectory Prediction Based on AIS Data. Master’s Thesis, South China University of Technology, Guangzhou, China, 2017. [Google Scholar]
- Gao, D.W.; Zhu, Y.S.; Zhang, J.F.; He, Y.K.; Yan, K.; Yan, B.R. A novel MP-LSTM method for ship trajectory prediction based on AIS data. Ocean Eng. 2021, 228, 108956.1–108956.16. [Google Scholar] [CrossRef]
- Chen, Y.C. Research on Ship Trajectory Prediction Based on Data Mining. Harbin Engineering University, 2020. Master’s Thesis, South China University of Technology, Harbin, China, 2020. [Google Scholar]
- Wang, W.G.; Chu, X.M.; Jiang, Z.L.; Liu, L. Classification of Ship Trajectory Based on the Weighted Naive Bayes Algorithm. Navig. China 2020, 43, 20–25. [Google Scholar]
- Karata, G.B.; Karagoz, P.; Ayran, O. Trajectory pattern extraction and anomaly detection for maritime vessels. Internet Things 2021, 2021, 100436. [Google Scholar] [CrossRef]
- Zhang, L.Y.; Zhu, Y.A.; Lu, W.; Wen, J.; Cui, J.Y. A detection and restoration approach for vessel trajectory anomalies based on AIS. J. Northwestern Polytech. Univ. 2021, 39, 7. [Google Scholar] [CrossRef]
- Lee, J.G.; Han, J.; Whang, K.Y. Trajectory clustering: A partition-and-group framework. In Proceedings of the 2007 ACM SIGOD International Conference on Management of Data, Beijing, China, 20–25 June 2007. [Google Scholar]
- Rong, H.; Teixeira, A.P.; Soares, C.G. Data mining approach to shipping route characterization and anomaly detection based on ais Data. Ocean Eng. 2020, 198, 106936. [Google Scholar] [CrossRef]
- Gudmundsson, J.; Valladares, N. A GPU approach to subtrajectory clustering using the fréchet distance. IEEE Trans. Parallel Distrib. Syst. 2015, 26, 924–937. [Google Scholar] [CrossRef]
- Perera, L.P.; Oliveira, P.; Soares, C.G. Maritime traffic monitoring based on vessel detection, tracking, state estimation, and trajectory prediction. IEEE Trans. Intell. Transp. Syst. 2012, 13, 1188–1200. [Google Scholar] [CrossRef]
- Hu, Y.D.; Gao, C.S.; Li, J.L.; Jing, W.X.; Li, Z. Novel trajectory prediction algorithms for hypersonic gliding vehicles based on maneuver mode on-line identification and intent inference. Meas. Sci. Technol. 2021, 32, 115012. [Google Scholar] [CrossRef]
- Murray, B.; Perera, L.P. Ship behavior prediction via trajectory extraction-based clustering for maritime situation awareness. J. Ocean Eng. Sci. 2021, 7, 1–13. [Google Scholar] [CrossRef]
- Wang, L.X. Research on Ship Adaptive Trajectory Prediction and Application Based on GPR Model. Master’s Thesis, Wuhan University of Technology, Wuhan, China, 2019. [Google Scholar]
- Qian, L.; Zheng, Y.Z.; Li, L.; Ma, Y.; Zhou, C.H.; Zhang, D.F. A new method of inland water ship trajectory prediction based on long short-term memory network optimized by genetic algorithm. Appl. Sci. 2022, 12, 4073. [Google Scholar] [CrossRef]
- Tian, X.; Suo, Y. Research on Ship Trajectory Prediction Method Based on Difference Long Short-Term Memory. J. Mar. Sci. Eng. 2023, 11, 1731. [Google Scholar] [CrossRef]
- Gan, S.J.; Liang, S.; Li, K.; Deng, J. Ship trajectory prediction for intelligent traffic management using clustering and ANN. In Proceedings of the 2016 UKACC 11th International Conference on Control (CONTROL), Belfast, UK, 31 August–2 September 2016; pp. 1–6. [Google Scholar]
- Mehta, N. Ship Trajectory Prediction in Confined Waters. Master’s Thesis, Norwegian University of Science and Technology, Trondheim, Norway, 2023. [Google Scholar]
- Suo, Y.F.; Chen, W.K.; Claramunt, C.; Yang, S.H. A ship trajectory prediction framework based on a recurrent neural network. Sensors 2020, 20, 5133. [Google Scholar] [CrossRef]
- Zhao, J.S.; Yan, Z.W.; Zhou, Z.Z.; Chen, X.Q.; Wu, B.; Wang, S.Z. A ship trajectory prediction method based on GAT and LSTM. Ocean. Eng. 2023, 289, 116159. [Google Scholar] [CrossRef]
- Li, H.H.; Jiao, H.; Yang, Z.L. Ship trajectory prediction based on machine learning and deep learning: A systematic review and methods analysis. Eng. Appl. Artif. Intell. 2023, 126, 107062. [Google Scholar] [CrossRef]
- Li, H.H.; Jiao, H.; Yang, Z.L. AIS data-driven ship trajectory prediction modelling and analysis based on machine learning and deep learning methods. Transp. Res. Part E 2023, 175, 103152. [Google Scholar] [CrossRef]
- Zhou, Y.; Dong, Z.; Bao, X. A Ship Trajectory Prediction Method Based on an Optuna–BILSTM Model. Appl. Sci. 2024, 14, 3719. [Google Scholar] [CrossRef]
- Li, M.; Li, B.; Qi, Z.; Li, J.; Wu, J. Enhancing Maritime Navigational Safety: Ship Trajectory Prediction Using ACoAtt–LSTM and AIS Data. ISPRS Int. J. Geo-Inf. 2024, 13, 85. [Google Scholar] [CrossRef]
- Jiang, J.; Zuo, Y. Prediction of Ship Trajectory in Nearby Port Waters Based on Attention Mechanism Model. Sustainability 2023, 15, 7435. [Google Scholar] [CrossRef]
- Kasyk, L. Intensity of vessel traffic after crossing a waterway intersection. Reliab. Eng. Syst. Saf. 2007, 3, 2705–2708. [Google Scholar]
- Li, B.; Pang, F.W. An approach of vessel collision risk assessment based on the D-S evidence theory. Ocean Eng. 2013, 74, 16–21. [Google Scholar] [CrossRef]
- Maria, R.; Giuliana, P.; Michele, V. Maritime anomaly detection: A review. Wiley Interdiscip. Rev. Data Min. Knowl. Discov. 2018, 8, e1266. [Google Scholar]
- He, Y.X.; Jin, Y.; Huang, L.W.; Xiong, Y.; Chen, P.F.; Mou, J.M. Quantitative analysis of COLREG rules and seamanship for autonomous collision avoidance at open sea. Ocean Eng. 2017, 140, 281–291. [Google Scholar] [CrossRef]
- Chen, X.; Liu, S.; Zhao, J.; Wu, H.; Xian, J.; Montewka, J. Autonomous port management based AGV path planning and optimization via an ensemble reinforcement learning framework. Ocean Coast. Manag. 2024, 251, 107087. [Google Scholar] [CrossRef]
- Chen, X.; Lv, S.; Shang, W.l.; Wu, H.; Xian, J.; Song, C. Ship energy consumption analysis and carbon emission exploitation via spatial-temporal maritime data. Appl. Energy 2024, 360, 122886. [Google Scholar] [CrossRef]


Disclaimer/Publisher’s Note: The statements, opinions and data contained in all publications are solely those of the individual author(s) and contributor(s) and not of MDPI and/or the editor(s). MDPI and/or the editor(s) disclaim responsibility for any injury to people or property resulting from any ideas, methods, instructions or products referred to in the content. |
© 2024 by the authors. Licensee MDPI, Basel, Switzerland. This article is an open access article distributed under the terms and conditions of the Creative Commons Attribution (CC BY) license (https://creativecommons.org/licenses/by/4.0/).