Article

The Proteome Profile of Halimeda macroloba under Elevated Temperature: A Case Study from Thailand

by
Nutwadee Chintakovid
1,
Narumon Phaonakrop
2,
Komwit Surachat
1,3,
Sinjai Phetcharat
4,
Tarawit Wutiruk
4,
Sittiruk Roytrakul
2,* and
Jaruwan Mayakun
4,*
1
Department of Biomedical Sciences and Biomedical Engineering, Faculty of Medicine, Prince of Songkla University, Songkhla 90110, Thailand
2
Functional Proteomics Technology Laboratory, National Center for Genetic Engineering and Biotechnology, National Science and Technology Development Agency, Khlong Luang, Pathum Thani 12120, Thailand
3
Translational Medicine Research Center, Faculty of Medicine, Prince of Songkla University, Songkhla 90110, Thailand
4
Division of Biological Science, Faculty of Science, Prince of Songkla University, Songkhla 90110, Thailand
*
Authors to whom correspondence should be addressed.
J. Mar. Sci. Eng. 2024, 12(7), 1073; https://doi.org/10.3390/jmse12071073
Submission received: 21 May 2024 / Revised: 18 June 2024 / Accepted: 23 June 2024 / Published: 26 June 2024
(This article belongs to the Section Marine Biology)

Abstract

:
An elevated sea temperature is considered a key abiotic stressor causing thermal stress to intertidal macroalgae and influencing their populations. Halimeda macroloba is an important CaCO3 producer that contributes to the carbonate budget in marine ecosystems. The population decline of this intertidal algal species could lead to considerable declines in both regional and global carbonate production. However, the impact of increasing temperature on the molecular mechanisms and protein profile of calcified H. macroloba is unclear and remains to be explored. In this study, H. macroloba was exposed to 30 °C and 35 °C for 7 days. The whole protein was then extracted using 0.5% SDS and digested using trypsin before an analysis using LC-MS. The protein profile of H. macroloba was characterized using the MaxQuant program aligned with the UniProt database. A total of 407 proteins were identified, and 12 proteins were found to be significantly upregulated or downregulated in response to the elevated temperature. Cell division protein, protein kinase domain-containing protein, phospholipid transport protein, and small ribosomal subunit protein were the significant proteins identified in our dataset. The proteins associated with cell division, cellular metabolic processes, localization, oxidoreductase activity, and biosynthetic process pathways were overexpressed with a more than 2-fold change at a high temperature. An interaction map generated using STITCH revealed that the significant protein change altered the other proteins related to abiotic stress, producing energy and inducing calcification. This information could be useful in understanding how H. macroloba responds to an elevated sea temperature.

1. Introduction

The atmospheric CO2 concentration has been increasing due to human activities such as the burning of fossil fuels, deforestation, atmospheric deposition, and the Industrial Revolution [1,2]. The increasing atmospheric CO2 causes an increase in the seawater temperature by approximately 0.18 °C per decade on average, and this is expected to increase to 1–2 °C by the end of 2100 [3]. Currently, the extent of global warming is increasingly concerning and can affect marine organisms such as marine algae at the individual, population, community, and ecosystem levels [4]. The impact of the increasing temperature on marine macroalgae such as Halimeda and Gracilaria has been studied and demonstrated, showing that it can influence the physiological and morphological performances, abundance, and distribution [5,6,7,8].
Halimeda macroloba is a calcareous green macroalga that is commonly and widely distributed across tropical regions [9]. H. macroloba is an important CaCO3 producer and a significant contributor to the carbonate production in marine ecosystems [9,10]. In the Andaman Sea, H. macroloba is a dominant species in the intertidal zone with a high abundance. However, climate change and the increasing seawater temperature have been reported to have negative impacts on this species [11]. In a previous study, in high-temperature treatment at 35 °C, H. macroloba exhibited a reduced calcification rate and carbon uptake rate (Ci uptake rate) [12]. A similar trend was reported in three species of Halimeda, namely H. cylindracea, H. lacunalis, and H. opuntia, suggesting that high temperatures (above 34 °C) have negative effects that limit the photosynthetic maximum quantum yield (Fv/Fm), concentrations of proline and malondialdehyde (MDA), and concentrations of Chl a and carotenoid. In addition, these three Halimeda species were reported to have a high segment shedding rate and experience bleaching at 36 °C [13]. A previous study showed that the increases in CO2 and temperature inhibited the photosynthesis and calcification of two calcifying green Halimeda species (H. cylindracea and H. macroloba) by decreasing the photochemical efficiency (maximum quantum yield) by around 50–70%, O2 production by around 70–80%, and the calcification rate [14]. However, there is a limited understanding of the molecular adaptation in terms of the proteins of the alga, H. macroloba, under unfavorable ocean temperatures. This gap can be addressed by delving into functional proteomics, which can offer a more direct understanding of the biochemical processes and ability to adapt to the increasing temperature in this calcareous macroalga.
Proteomics has been employed to analyze the protein profiles, dynamic changes, and expressed proteins of many organisms such as marine macroalgae under elevated temperatures [13]. Quantitative liquid chromatography–tandem mass spectrometry (LC-MS/MS) is an alternative approach used in proteomics to efficiently assess a large number of proteins within a short timeframe [15,16,17]. When coupled with bioinformatics, this technique enables the identification of proteins, facilitating a comparison of their relative abundance between samples [16]. Therefore, we opted for the proteomics technique to provide a foundation of knowledge for deeper molecular investigations. This study aimed to explore the proteomic profile of H. macroloba cultivated under different temperature conditions (30 °C and 35 °C) and to illustrate the interactions of the identified proteins with other associated proteins, abiotic stress, energy production, and calcification.

2. Materials and Methods

Sample collection
The fresh thalli of Halimeda macroloba were collected from Lidee island (6°46′58″ N, 99°46′10″ E), Mu Ko Phetra National Park, Satun, Thailand, where a high density of H. macroloba (approximately 200 thalli−2) is found [11]. In the field, this alga experienced an average seawater temperature of 30 °C (27–32 °C). The thalli of plants were collected and brought back to the laboratory at the Faculty of Science, Prince of Songkla University. Whole fresh thalli were cleaned and acclimated under 12/12 h of light (approximately 200 μmol photon m−1 s−1) and darkness at 30 °C and 30 ppt salinity for 2 days.
Experimental setup
After acclimation, the experimental design consisted of the use of the individual thalli of H. macroloba and two separate temperature treatments (30 °C and 35 °C). These two temperature treatments simulated the conditions at the study site and future ocean warming. A thallus of H. macroloba was tied onto a plastic stub in an experimental chamber with dimensions of 5 × 10 × 15.2 cm (W × L × H) and placed in a 70 L glass aquarium with dimensions of 30.5 × 71.0 × 30.1 cm (W × L × H). The flow rate of the seawater recirculation system in the aquarium was around 400 L h−1. The experiment was conducted in five replicates for each treatment. The temperature treatments were 30 °C and 35 °C. The irradiance for each treatment was around 200 μmol photon m−1 s−1, provided by light LED lamps on a 12:12 light–dark photoperiod. The temperature and light intensity were monitored using HOBO data loggers (Model: UA-002-64, Onset Computer Corp, Bourne, MA, USA). After 7 days of treatment, samples were collected from the apical segment and mid-growth section of the thallus and stored at −80 °C until further analysis.
Protein extraction and quantitation
The green macroalga samples were ground to a powder in liquid nitrogen, and 100 mg of fine powder was added with 1 volume of 0.5% SDS, vortexed for 1 h, and centrifuged at 10,000× g for 15 min. The supernatant was transferred to a new tube, mixed well with 2 volumes of cold acetone, and incubated overnight at −20 °C. The mixture was centrifuged at 10,000× g for 15 min, and the supernatant was discarded [18]. The pellet was dried and stored at −80 °C prior to use. The total protein concentration was determined using a Lowry assay with bovine serum albumin (BSA) as the protein standard at 750 nm (OD750).
Protein digestion using trypsin
Five micrograms of protein from each sample was reduced with 5 mM DTT in 10 mM ammonium bicarbonate at 60 °C for one hour. Then, 15 mM IAA in 10 mM ammonium bicarbonate was added for alkylation in the dark at 25 °C for 45 min. The samples were digested using trypsin (1:20 enzyme/protein ratio) for 16 h at 37 °C. Finally, the tryptic peptide samples were dissolved in 0.1% formic acid and centrifuged at 10,000 rpm for 5 min to remove any particles that could potentially interfere with the LC-MS analysis using nano-liquid chromatography–tandem mass spectrometry (nanoLC-MS/MS).
Protein identification, data processing, and analysis
The tryptic peptide samples were injected into an Ultimate 3000 Nano/Capillary LC System (Thermo Scientific, CHS, Chelmsford, UK), which was connected to a ZenoTOF 7600 mass spectrometer (SCIEX, Framingham, MA, USA), for a peptide analysis. One microliter of the sample was enriched using a pre-column (300 µm ID, 5 mm) with C18 Pepmap 100 and separated on a 75 µm ID, 15 cm column with Acclaim PepMap RSLC C18 (Thermo Scientific, CHS, UK), set to 60 °C. The column was connected to a nanoViperTM fingertight fitting (Thermo Scientific, CHS, UK). Solvent A (0.1% formic acid in water) was used to equilibrate the column, and a gradient from 5% to 55% of solvent B (0.1% formic acid in 80% acetonitrile) at 0.30 µL/min for 30 min was applied to elute the peptides. For protein quantification and identification, the raw data were analyzed using MaxQuant version 2.1.4.0 with standard parameters [19]. The parameters included allowed for two missed cleavages, 0.6 daltons mass tolerance, trypsin as a digestion enzyme, the carbamidomethylation of cysteine as a fixed modification, and methionine oxidation and protein N-terminus acetylation as variable modifications. The ion intensity was used for quantification. Digested bovine serum albumin was used as an internal standard for normalization. The MS/MS spectra were aligned with the UniProt protein database [20]. For the protein identification, a FASTA file containing the Bryopsidales proteome from UniProt was utilized as a database for alignment (downloaded on 15 December 2023).
Statistical Analysis and function interaction
The MaxQuant “Protein Groups.txt” data file was analyzed using MetaboAnalyst software version 6.0 [21]. The mean-centered method was used for the intensity normalization, and log10 transformation was applied to the intensities. A hierarchical clustering heatmap was generated to visualize the differentially abundant proteins. A Partial Least Squares Discriminant Analysis (PLS-DA) was conducted to visualize the distribution between the samples with 95% confidence. A volcano plot was constructed to select significant features. The proteins identified as demonstrating significant changes in the volcano plot analysis were further analyzed using “Stitch EMBL” (http://stitch.embl.de, accessed on 30 December 2023) to explore the protein–protein and chemical–protein interactions, particularly those related to sugar metabolism, photosynthesis mechanisms, and calcification processes.

3. Results and Discussion

3.1. Comparative Proteomic Analysis and Classification of Temperature-Responsive Proteins in Halimeda macroloba

This investigation involved an analysis of the total proteins of two groups of H. macroloba cultivated at 30 °C and 35 °C. A total of 407 proteins (Supplementary Table S1) were discovered across 18 injections. In the protein list, the following proteins were found with the indicated frequencies but with different IDs: uncharacterized proteins (96 proteins), DNA-directed RNA polymerases (15 proteins), ribosomal proteins (25 proteins), photosystem-related proteins (10 proteins), peptidases (8 proteins), cytochromes (5 proteins), ATP synthase subunits (4 proteins), and cell division proteins (4 proteins). All the other protein names were found only once. Interestingly, one heat shock protein was found, and it was expressed at higher levels in the H. macroloba cultivated at 35 °C than in the control group. In our protein list, the majority of the entries were uncharacterized proteins, reflecting a significant gap in the current protein databases; thus, much more research is needed to address this gap. The high number of uncharacterized proteins highlights the limitations of the existing knowledge and the potential for future discoveries in this field. Additionally, the total number of proteins (407 proteins) in our analysis further emphasizes this concern. Interestingly, one heat shock protein 70 (HSP70) was also found, and it was expressed at higher levels in the H. macroloba cultivated at 35 °C than in the control group (Supplementary Table S1). HSP70 is an important protein in algae, known for its response to temperature stress and environmental changes [22,23,24]. Under heat stress, HSP70 plays roles in protecting cells, the transport of proteins, the repair of misfolded proteins, and the refolding of denatured proteins [25,26]. In a study of Pyropia yezoensis, the mechanisms underlying the stress tolerance in the intertidal zones were investigated. A significant gene expression encoding HSP70 was found [22]. Another study on desiccation stress revealed that high-temperature stress significantly induced the HSP70 gene [27]. The finding of HSP70 implies that H. macroloba responds to high-temperature stress.
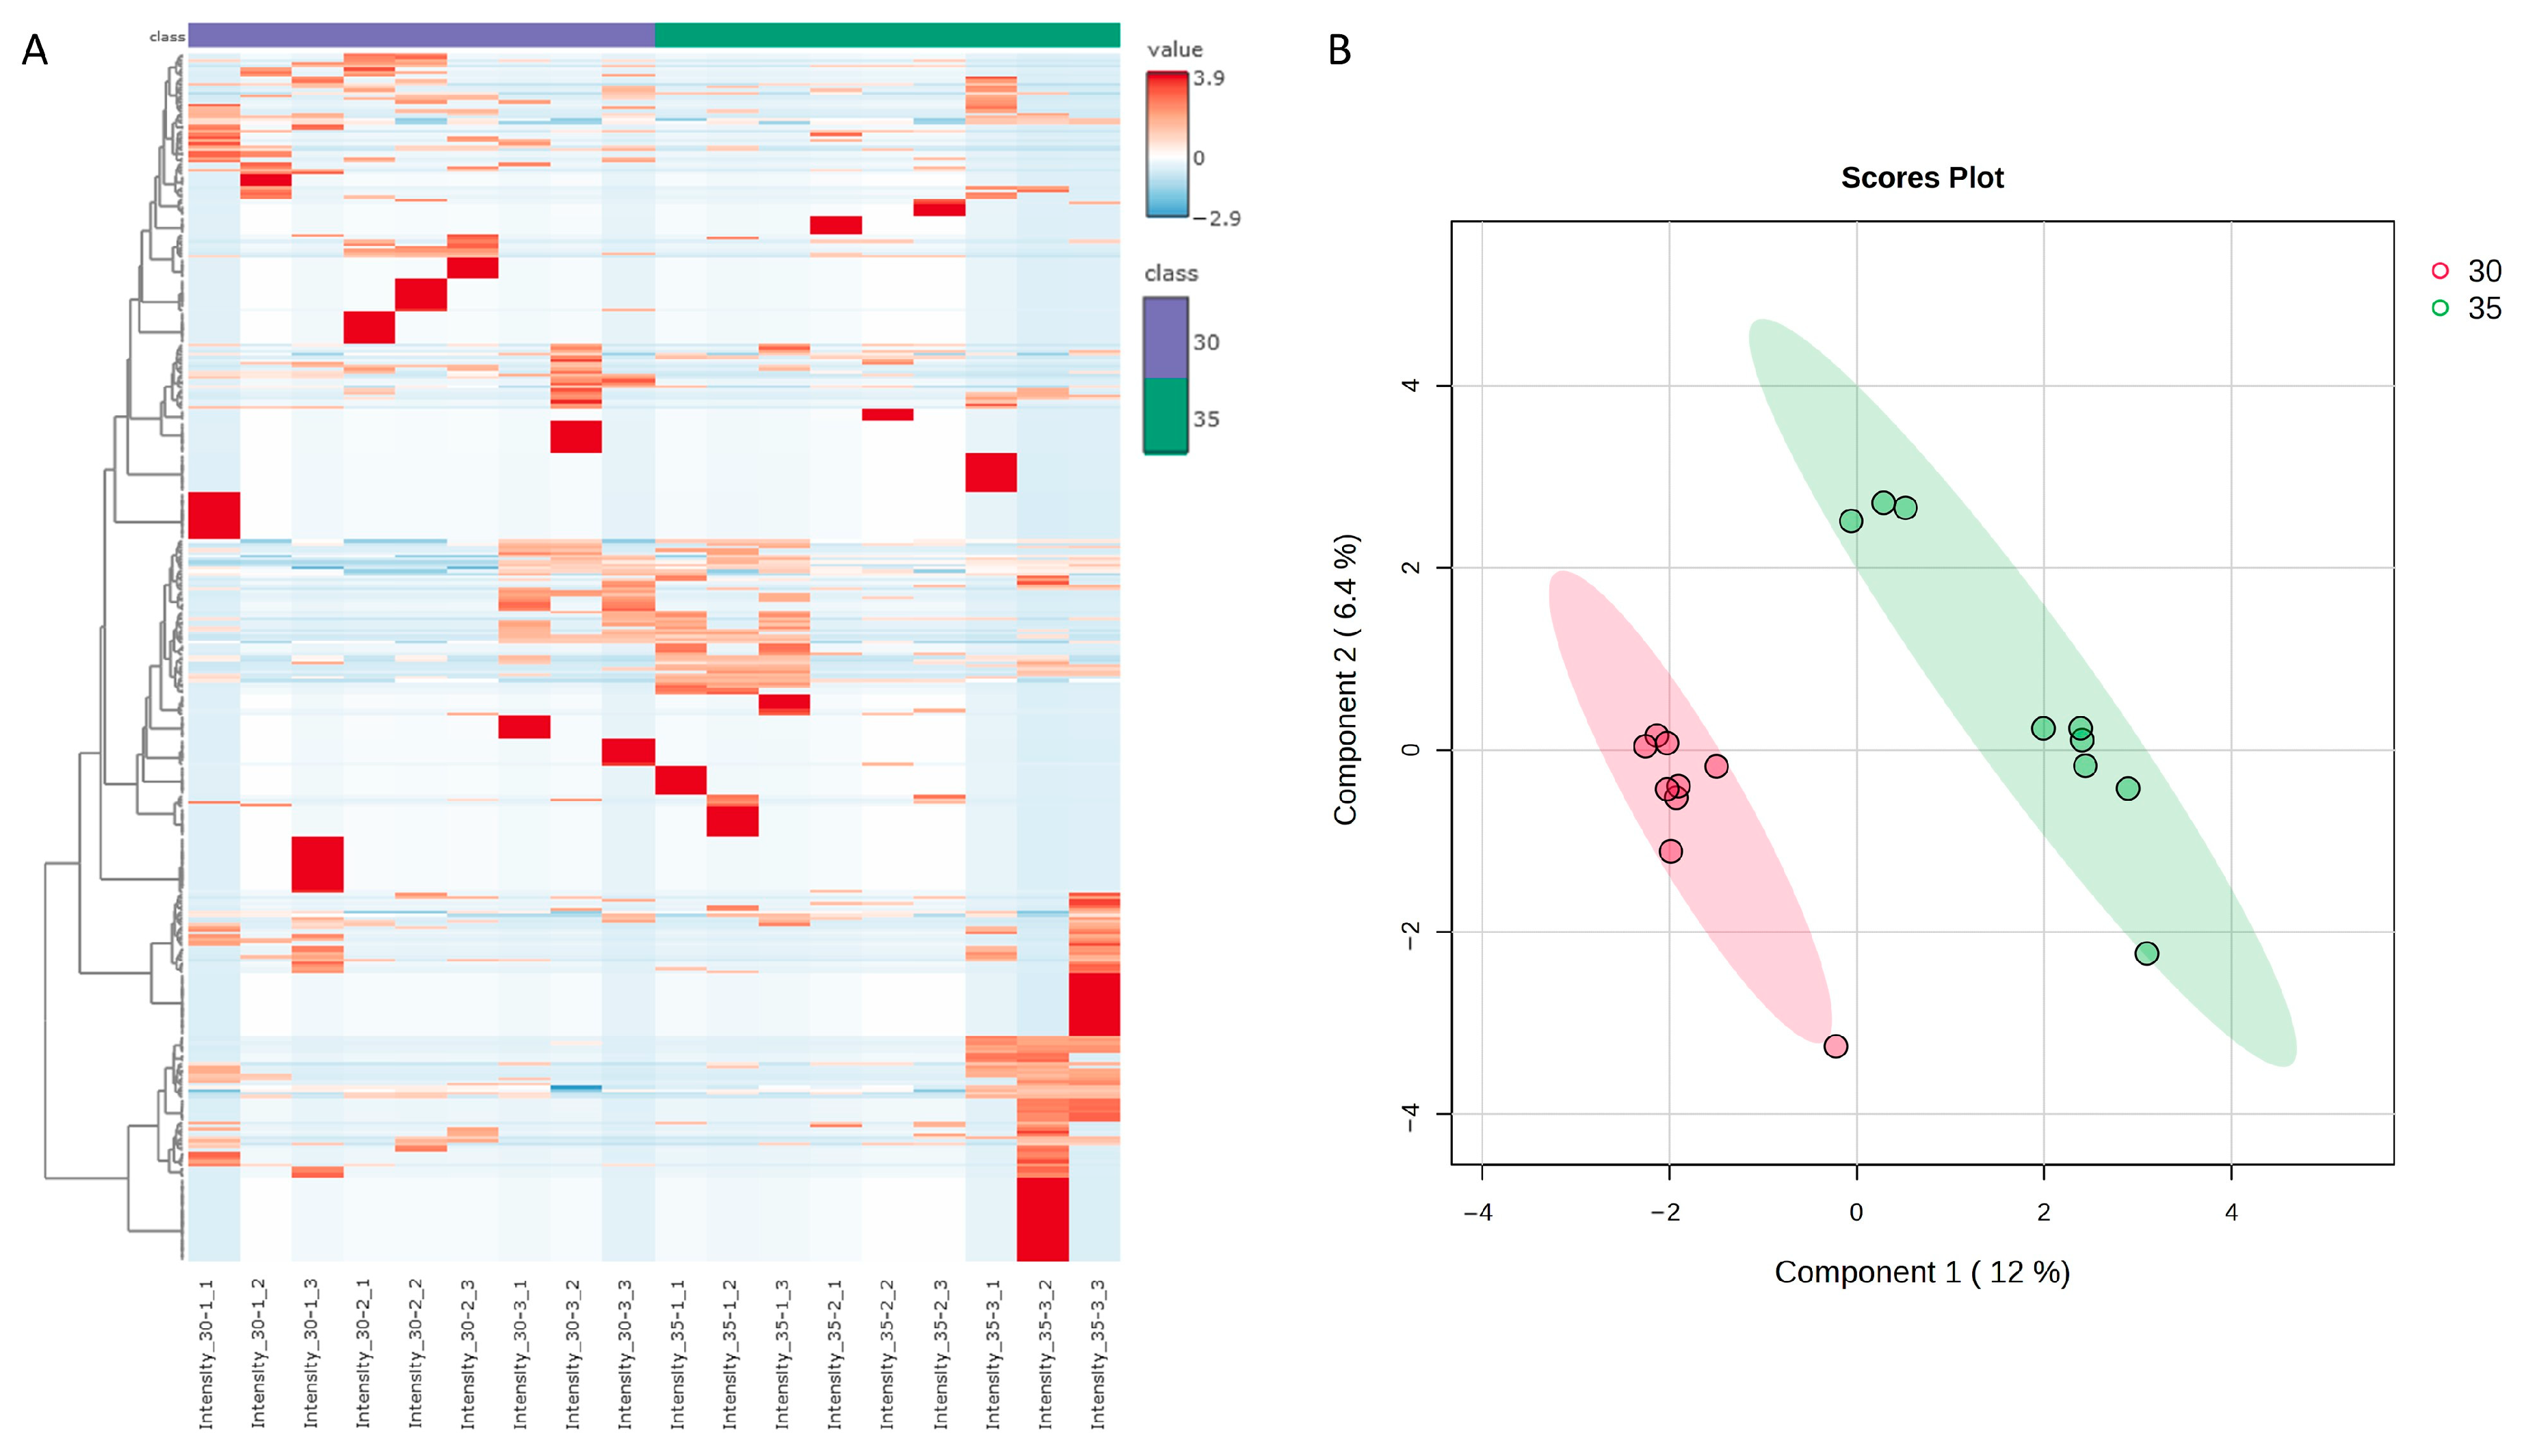
Median normalization and log 10 transformation were applied to the protein intensity. A heat map was generated using the protein abundance in each group; the groups were cultivated at 30 °C and 35 °C (Figure 1A). This heat map illustrates the protein expression profiles of the different samples. A Partial Least Squares Discriminant Analysis (PLS-DA) confirmed the separation of the groups cultivated at 30 °C from those cultivated at 35 °C (Figure 1B).
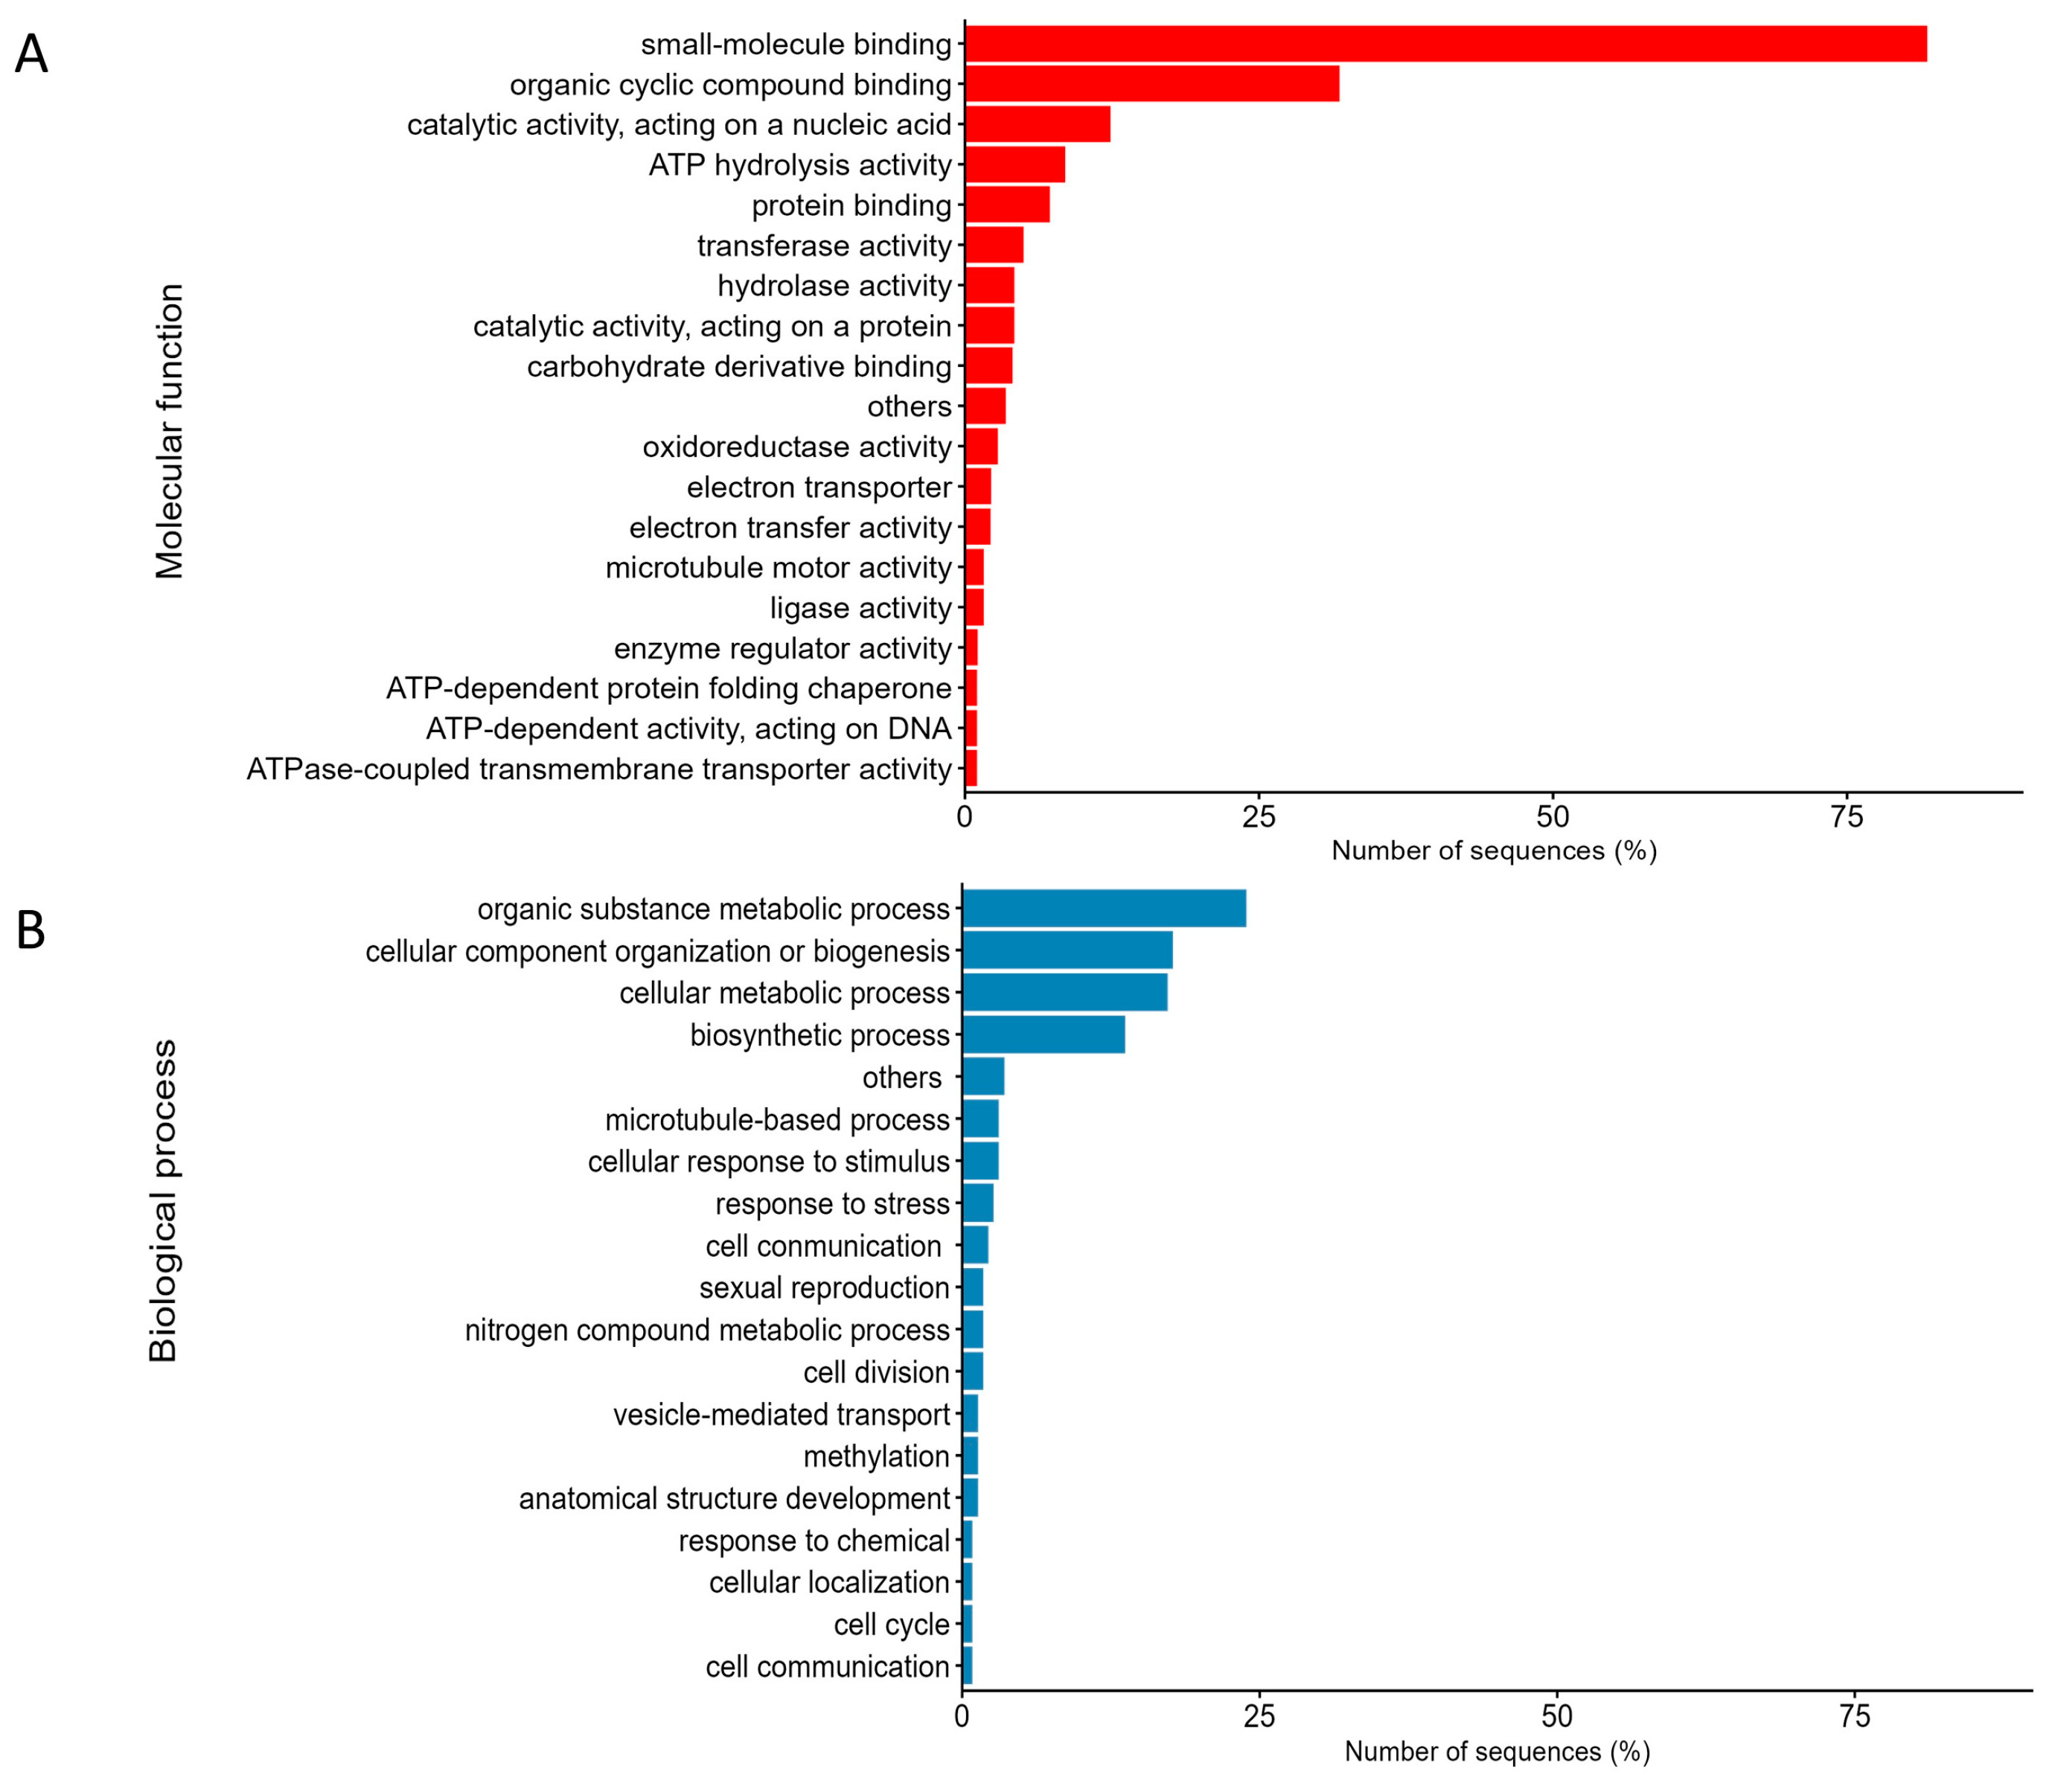
The UniProt ID was used to identify the Gene Ontology (GO) terms [20] associated with the molecular functions and biological processes of the differentially expressed proteins (DEPs). Among these, the molecular functions of the DEPs primarily included small-molecule binding, organic cyclic compound binding, catalytic activity, ATP hydrolysis activity, and protein binding (Figure 2A). Small-molecule binding was the most represented, accounting for 81.82% of the DEPs. This was followed by organic cyclic compound binding at 31.86% and catalytic activity at 12.40%. Small-molecule binding refers to the interaction between small molecules and biological macromolecules, such as proteins and nucleic acids. As the temperature increases, proteins can denature and lose their function, which affect various processes, including photosynthesis and other metabolic pathways. The production of small heat shock proteins (sHSPs) during heat stress is one of the mechanisms used to cope with this situation. sHSPs help maintain protein stability, re-folding, and degradation [28]. Organic cyclic compound binding refers to the molecular function of binding to organic cyclic compounds. In terms of photosynthetic pigments, chlorophyll is a good example. A decrease in these pigments can affect the photosynthetic efficiency of algae, impacting their ability to harness the energy from sunlight for growth and survival [29]. The catalytic function associated with the GO term refers to the mechanism where enzymes or other large biological molecules facilitate the biochemical reactions under the typical physiological temperatures. This function is vital for sustaining the metabolic processes in living organisms, including algae, and it is indispensable for their growth, development, and survival. Elevated temperatures can trigger oxidative stress in algae, affecting their ability to maintain the levels of certain chemicals, such as H2O2, which can impact their catalytic activity and the overall cellular processes [30].
Regarding the biological processes, the annotated proteins were predominantly categorized into four main areas. The largest group among the annotated proteins was organic substance metabolic processes, accounting for 23.89% of the total. This was followed by the cellular component organization at 17.70%, cellular metabolic processes at 17.26%, and biosynthetic processes at 13.72% (Figure 2B). Several studies have demonstrated that the organic substance metabolic processes play a crucial role in responding to temperature stress, as algae are sensitive to the changes in temperature. For example, a study on Arabidopsis revealed that osmoprotectants, such as sugar and proline, which are organic molecules, accumulate under stress conditions to stabilize proteins and membranes. This contributes to cell osmotic pressure, which helps them survive under stress conditions [31]. The changes in temperature alter the cellular component organization in algae. Algae cells can modify their cell wall components and morphology in response to temperature variations, with different species exhibiting specific responses [32,33]. For example, the wall-less alga, D. tertiolecta, experiences significant nanomechanical and chemical changes at different temperatures, while the algae with silicified walls show distinct alterations in their hydrophobicity [32]. The cellular metabolic processes in algae also impact various physiological functions, such as biomass production, respiration, and photosynthesis. Temperature changes induce oxidative stress in algae cells, which affects the membrane fluidity and fatty acid saturation levels. In a study of the algal adaptation responses to temperature, it was found that cells become stiffer at lower temperatures and more compliant at higher temperatures, suggesting molecular changes in the cell envelope [32]. Cellular metabolic processes and biosynthetic processes are closely related aspects of a cell’s functioning, both essential for its survival and proper functioning. Therefore, biosynthetic processes, as indicated by GO terms, also contribute significantly. For example, among the proteins related to biosynthetic processes, glutathione and heat shock protein 97 (Hsp97) have been identified as core factors in algae’s response to temperature stress [34]. Additionally, the membrane fluidity of algae can be adjusted by altering the fatty acid saturation levels to adapt to temperature changes [35].

3.2. Comparison of Significant Differentially Abundant Proteins and the Associated Pathways

We compared the protein profiles of the groups cultivated at 30 °C and 35 °C. Through a T-test statistical analysis, we identified 12 proteins that were either upregulated or downregulated significantly (p-value < 0.05), with the fold change threshold set to 2.0 (Figure 3). Among these significant proteins were those annotated as cell division protein, protein kinase domain-containing protein, phospholipid-transporting ATPase, small ribosomal subunit protein, and others (Table 1). Integrating proteomics with the STITCH database, an online platform facilitating the identification of protein–protein and protein–chemical interactions, enhanced our capability to comprehensively understand the mechanistic functions of the significant protein expression changes between the two groups cultivated at different temperatures. The names of the significant proteins were used to search for proteins with similar functions in the Arabidopsis thaliana protein database [20] and to illustrate the correlation with other proteins purported to play a role in defining the distinctive characteristics of the calcareous green algae. The words glucose, fructose, sucrose, photosynthesis, photosystem, chlorophyll, carotenoids, calcium carbonate, and carbon dioxide were also added to the protein list to search for chemical–protein and protein–protein interactions (Supplementary Table S2).
Glucose, fructose, and sucrose, as carbohydrates, play vital roles in the metabolism and energy equilibrium of both plants and algae, which are photosynthetic organisms [36,37,38]. They are generated through photosynthesis, serving as essential energy sources and metabolic fuels that contribute to growth and development. The expression and production of these sugars may exhibit variations in response to environmental stresses [37,38]. In addition, photosynthesis and a photosystem were incorporated into our search to explore their interactions. Chlorophyll and carotenoids, responsible for facilitating photosynthesis [39], were also included for context. Since Halimeda holds significance as a potential carbon sink species with a crucial role in the global carbonate budget [9], calcium carbonate and carbon dioxide were added to the search to depict their intricate interactions. However, the interaction was searched based on Arabidopsis thaliana, a well-studied plant model known for various aspects, including DNA, RNA, and protein studies. Notably, the protein database of A. thaliana revealed 16,373 reviewed proteins (Swiss-Prot). In contrast, Chlamydomonas reinhardtii, a recognized model organism for molecular studies in algae, showed a more limited number, with only 369 reviewed proteins [20]. In addition, the number of reviewed proteins in Halimeda was found to be zero, as expected. Therefore, we decided to apply the protein annotations from A. thaliana to better illustrate the interaction pathway of the significant protein profile of H. macroloba.
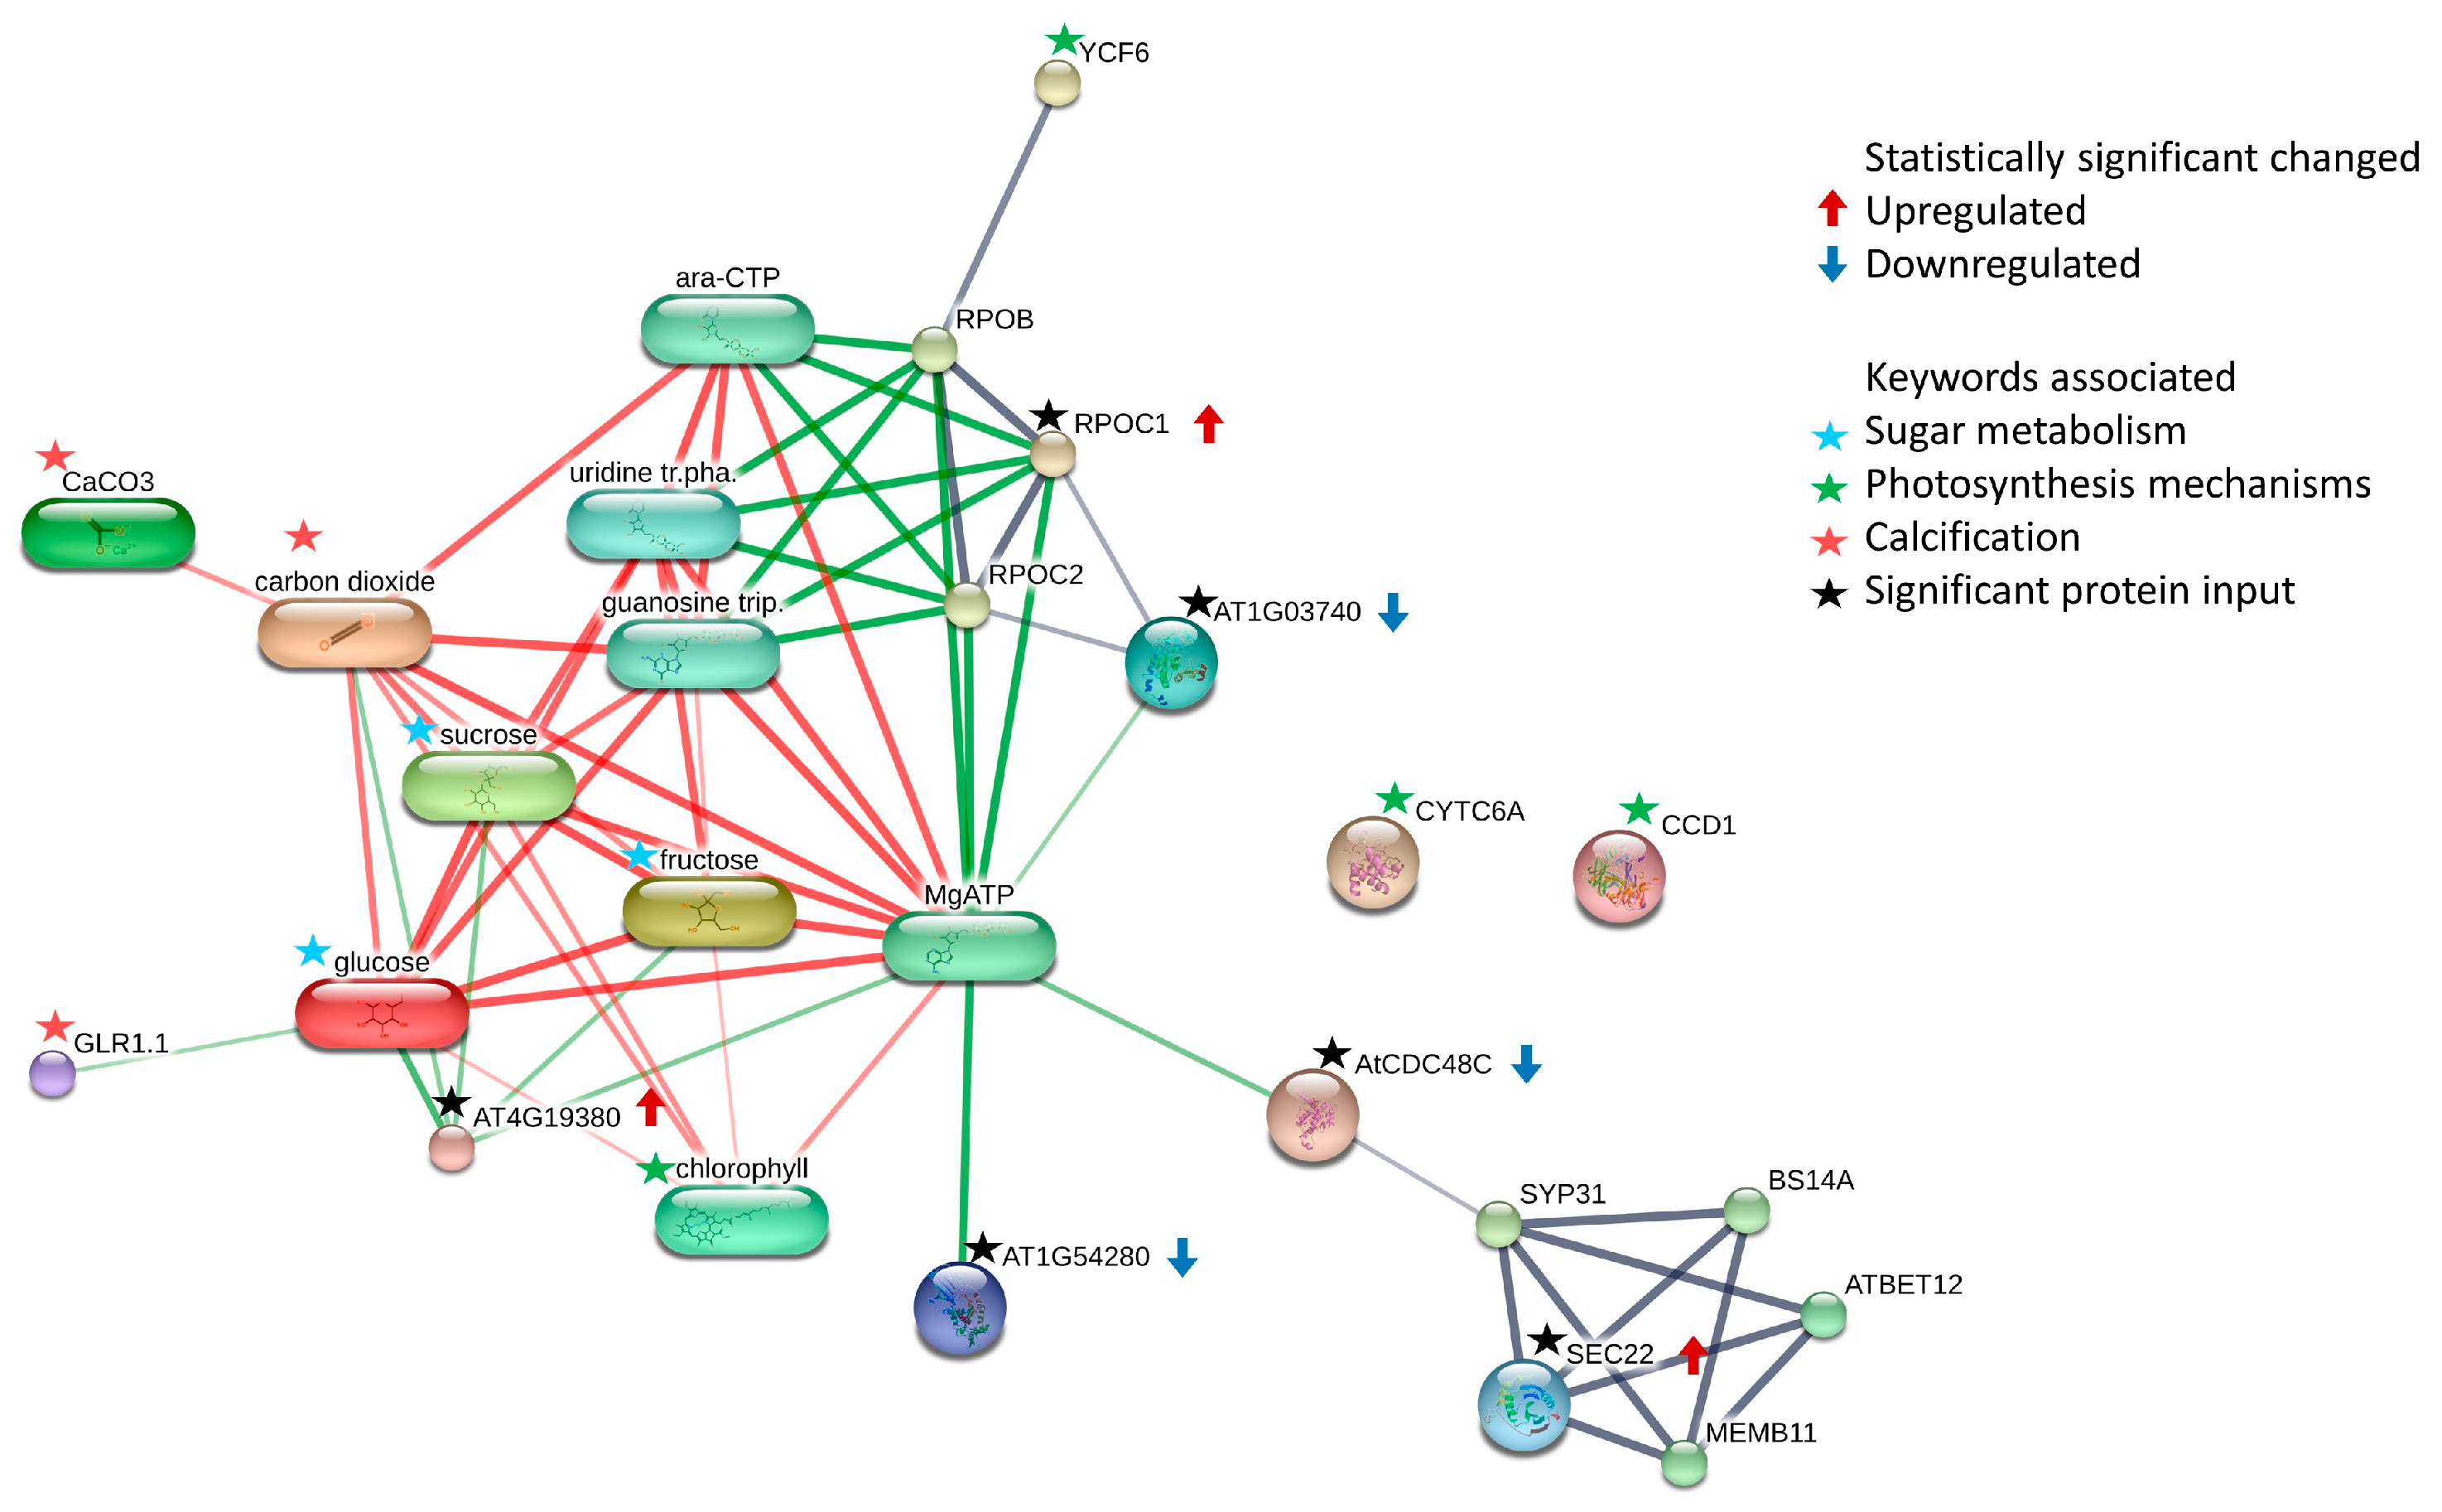
According to the STITCH functional pathway enrichment analysis, proteins that function as protein kinase domain-containing protein, long-chain alcohol oxidase, cell division protein, DNA-directed RNA polymerase subunit beta, phospholipid-transporting ATPase, and secreted protein induced alterations in proteins with functions related to abiotic stress, producing energy and inducing calcification (Figure 4). The primary products generated through photosynthesis include sugars and oxygen. Sugars play a ubiquitous and crucial role as fundamental components in general metabolism. They serve as a primary carbon source for synthesizing diverse biomolecules and producing energy. Additionally, sugars, including glucose, sucrose, and fructose, act as essential signaling molecules, influencing the cellular metabolic status and responding to both biotic and abiotic stresses [36,40,41]. Indeed, chlorophyll was found to be associated with numerous proteins, particularly those related to energy metabolism and growth, in the interaction map. Additionally, the photosystem-related protein, YCF6, was linked to RPOB, wherein the DNA-dependent RNA polymerase catalyzed [20] and led to binding with the other proteins. However, two proteins related to cytochrome c6 and CCD1 (Supplementary Table S2) did not exhibit links or associations with the other proteins in the interaction map, despite their functions being related to photosynthesis, like chlorophyll (Figure 4).
Soluble sugars primarily exist in the forms of sucrose, glucose, and fructose in plants. The distribution of sugars is determined by the transportation processes from sources to sinks and within the various organelles within the cell. This allocation depends upon the specific needs of the plant at each stage or specific time point [36]. Sucrose, a prominent carbohydrate resulting from photosynthesis, plays essential roles in plant growth and development, functions as a storage reserve, contributes to cell signaling, and aids in stress acclimation [42]. Sucrose serves as the primary sugar transported through the phloem of plants and constitutes the primary source of organic matter [38]. The metabolic utilization of sucrose in sink tissues commences with the breakdown of sucrose into its monosaccharides. This cleavage process is accomplished through either invertase (INV), resulting in the production of glucose and fructose, or through sucrose synthase (SUS), leading to the formation of UDP-glucose and fructose [38]. Furthermore, the synthesis of sucrose is notably influenced by the temperature, with increased temperatures enhancing its formation. This temperature-dependent process may involve the activation of a thermophilic enzyme system [43]. For instance, Dunaliella accumulates sucrose at higher temperatures [43] (Müller & Wegmann, 1978), whereas Klebsormidium flaccidum exhibits sucrose accumulation at lower temperatures [44].
Rapid global warming has impacted various aspects of the ocean, such as increasing the ocean’s interior temperatures, raising the sea levels, and melting the ice sheets. In addition to global warming, rising carbon dioxide (CO2) concentrations in the atmosphere have a direct impact on ocean acidification (OA), reducing the pH levels. This phenomenon poses challenges for marine organisms, such as corals, oysters, and pteropods, hindering their ability to form calcium carbonate shells and skeletons [45]. Carbon dioxide (CO2) in the atmosphere can dissolve in seawater (H2O); it forms carbonic acid (H2CO3) and leads to the formation of bicarbonate ions (HCO3) [46]. The interaction map presents links between CaCO3, CO2, glutamate receptor 1.1 (GLR1.1), and other significant proteins. GLR1.1 functions as a non-selective cation channel capable of transporting sodium, potassium, and calcium ions [47]. Furthermore, it serves as a regulator and/or sensor for carbon and nitrogen, influencing carbon and nitrogen metabolism [48]. GLR1.1 also shows a link between glucose and other sugars in the interaction map (Figure 4). This indicates that the protein profile induced by different temperatures could show the different proteins related to the calcification process.
The secreted protein (SEC22) exhibits unique interactions with other proteins involved in protein transport. Notably, this protein is linked to the cell division protein (AtCDC48C), which interacts with specific SNAREs during specialized membrane fusion events, facilitating the fusion of vesicles from the same organelle [20].
Interestingly, MgATP was found in the interaction map and linked the proteins that showed significant changes (FC > 2.0 and p-value < 0.05) in the volcano plot. MgATP, or magnesium adenosine triphosphate, is a complex of ATP and Mg2⁺ ions, and it plays a crucial role in the cellular energy metabolism esterified to the sugar moiety [20,49,50]. In biological systems, MgATP stabilizes ATP’s structure and is vital for enzymes using ATP as a substrate. It participates in processes such as glycolysis, cellular respiration, and phosphorylation reactions, facilitating energy transfer and cellular signaling pathways [49,51,52,53,54].
The results of the STITCH functional pathway enrichment analysis revealed significant changes in the protein profile of H. macroloba under different growth temperatures. Proteins with the same ID but different abundances in the 30 °C and 35 °C treatments were associated with key processes such as sugar metabolism for energy production, chlorophyll and electron transport in photosynthesis, and the utilization of CO2 as a crucial substrate for the calcification process. These metabolic alterations may be influenced by abiotic stress factors, particularly the elevated temperature in the atmosphere (Figure 4).

4. Conclusions

In conclusion, H. macroloba was evaluated using LC-MS/MS-based proteomics coupled with bioinformatics to elucidate the interaction pathways. Through a proteomic analysis, 407 proteins were identified, and hierarchical clustering was performed. The proteins associated with cell division, protein kinase domains, phospholipid transport, and the small ribosomal subunit were found to be significantly altered. The integration of proteomics with a STITCH functional pathway enrichment analysis provided crucial information on the impact of different growth temperatures, which caused changes in the protein profile of H. macroloba. The variations in protein abundance between the 30 °C and 35 °C treatments were associated with key metabolic processes: sugar metabolism for energy production, chlorophyll and electron transport in photosynthesis, and the utilization of CO2 for calcification. The significant proteins identified in the two groups exhibited distinct abundance levels, suggesting that the regulation of these vital cellular components is temperature-dependent. These findings imply a direct link between the environmental temperature and the regulation of the essential pathways crucial for the organism’s energy balance, photosynthetic machinery, and calcification processes. This study contributes to the fundamental knowledge of how temperature variations can trigger specific molecular responses in H. macroloba, bridging the gap between environmental factors and the cellular processes in this marine organism.

Supplementary Materials

The following supporting information can be downloaded at: https://www.mdpi.com/article/10.3390/jmse12071073/s1, Supplementary Table S1: Complete list of 407 proteins in H. macroloba derived from LC-MS/MS; Supplementary Table S2: Protein list for chemical–protein and protein–protein interaction analyses using STICH.

Author Contributions

Conceptualization, N.C., K.S., S.R. and J.M.; methodology, N.P., S.R., S.P., T.W. and J.M.; investigation, N.C., S.P., T.W. and J.M.; formal analysis, N.C., N.P. and S.R.; resources, N.P., J.M. and S.R.; writing—original draft preparation, N.C.; writing—review and editing, S.R. and J.M.; visualization, N.C. and K.S.; supervision, K.S. and J.M.; project administration, K.S. and J.M., funding acquisition, K.S. and J.M. All authors have read and agreed to the published version of the manuscript.

Funding

This research was supported by the National Science, Research, and Innovation Fund (NSRF); the Prince of Songkla University (Grant No. SCI6505008S); and the Faculty of Science Research Fund, Faculty of Science, Prince of Songkla University (2024), awarded to J.M. In addition, this research was supported by the Postdoctoral Fellowship from Prince of Songkla University, Thailand. This research had received funding support from the NSRF via the Program Management Unit for Human Resources & Institutional Development, Research and Innovation (grant number B13F660074).

Institutional Review Board Statement

Not applicable.

Informed Consent Statement

Not applicable.

Data Availability Statement

Data will be made available on request.

Conflicts of Interest

The authors declare no conflicts of interest.

References

  1. Feely, R.A.; Sabine, C.L.; Lee, K.; Berelson, W.; Kleypas, J.; Fabry, V.J.; Millero, F.J. Impact of anthropogenic CO2 on the CaCO3 system in the oceans. Science 2004, 305, 362–366. [Google Scholar] [CrossRef] [PubMed]
  2. Dentener, F.; Drevet, J.; Lamarque, J.F.; Bey, I.; Eickhout, B.; Fiore, A.M.; Hauglustaine, D.; Horowitz, L.W.; Krol, M.; Kulshrestha, U.C.; et al. Nitrogen and sulfur deposition on regional and global scales: A multimodel evaluation. Glob. Biogeochem. Cycles 2006, 20. [Google Scholar] [CrossRef]
  3. IPCC. Climate Change 2021: The Physical Science Basis. Contribution of Working Group I to the Sixth Assessment Report of the Intergovernmental Panel on Climate Change; Cambridge University Press: Cambridge, UK; New York, NY, USA, 2021; pp. 423–552. [Google Scholar] [CrossRef]
  4. Lobban, C.S.; Harrison, P.J. Seaweed Ecology and Physiology; Cambridge University Press: Cambridge, UK, 1994. [Google Scholar]
  5. Wilson, K.L.; Kay, L.M.; Schmidt, A.L.; Lotze, H.K. Effects of increasing water temperatures on survival and growth of ecologically and economically important seaweeds in Atlantic Canada: Implications for climate change. Mar. Biol. 2015, 162, 2431–2444. [Google Scholar] [CrossRef]
  6. Graba-Landry, A.C.; Loffler, Z.; McClure, E.C.; Pratchett, M.S.; Hoey, A.S. Impaired growth and survival of tropical macroalgae (Sargassum spp.) at elevated temperatures. Coral Reefs 2020, 39, 475–486. [Google Scholar] [CrossRef]
  7. Lee, J.E.; Kang, J.W. The interactive effects of elevated temperature and nutrient concentrations on the physiological responses of Ulva linza Linnaeus (Ulvales, Chlorophyta). J. Appl. Phycol. 2020, 32, 2459–2467. [Google Scholar] [CrossRef]
  8. Huang, Y.; Cui, J.; Wang, S.; Chen, X.; Liao, J.; Guo, Y.; Xin, R.; Huang, B.; Xie, E. Transcriptome analysis reveals the molecular mechanisms of adaptation to high temperatures in Gracilaria bailinae. Front. Plant Sci. 2023, 14, 1125324. [Google Scholar] [CrossRef]
  9. Mayakun, J.; Liao, C.-P.; Liu, S.-L. The standing stock and CaCO3 contribution of Halimeda macroloba in the tropical seagrass-dominated ecosystem in Dongsha Island, the main island of Dongsha Atoll, South China Sea. J. Mar. Biol. Assoc. U.K. 2020, 100, 1219–1227. [Google Scholar] [CrossRef]
  10. Schubert, N.; Alvarez-Filip, L.; Hofmann, L.C. Systematic review and meta-analysis of ocean acidification effects in Halimeda: Implications for algal carbonate production. Clim. Chang. Ecol. 2023, 4, 100059. [Google Scholar] [CrossRef]
  11. Mayakun, J.; Prathep, A. Calcium carbonate productivity by Halimeda macroloba in the tropical intertidal ecosystem: The significant contributor to global carbonate budgets. Phycol. Res. 2019, 67, 94–101. [Google Scholar] [CrossRef]
  12. Prathep, A.; Kaewsrikhaw, R.; Mayakun, J.; Darakrai, A. The effects of light intensity and temperature on the calcification rate of Halimeda macroloba. J. Appl. Phycol. 2018, 30, 3405–3412. [Google Scholar] [CrossRef]
  13. Wei, Z.; Mo, J.; Huang, R.; Hu, Q.; Long, C.; Ding, D.; Yang, F.; Long, L. Physiological performance of three calcifying green macroalgae Halimeda species in response to altered seawater temperatures. Acta Oceanol. Sin. 2020, 39, 89–100. [Google Scholar] [CrossRef]
  14. Sinutok, S.; Hill, R.; Doblin, M.A.; Kühl, M.; Ralph, P.J. Microenvironmental changes support evidence of photosynthesis and calcification inhibition in Halimeda under ocean acidification and warming. Coral Reefs 2012, 31, 1201–1213. [Google Scholar] [CrossRef]
  15. Kurdrid, P.; Senachak, J.; Sirijuntarut, M.; Yutthanasirikul, R.; Phuengcharoen, P.; Jeamton, W.; Roytrakul, S.; Cheevadhanarak, S.; Hongsthong, A. Comparative analysis of the Spirulina platensis subcellular proteome in response to low- and high-temperature stresses: Uncovering cross-talk of signaling components. Proteome Sci. 2011, 9, 39. [Google Scholar] [CrossRef]
  16. Samutrtai, P.; Krobthong, S.; Roytrakul, S. Proteomics for toxicological pathways screening: A case comparison of low-concentration ionic and nanoparticulate silver. Anal. Sci. 2020, 36, 981–987. [Google Scholar] [CrossRef] [PubMed]
  17. Sithtisarn, S.; Yokthongwattana, K.; Mahong, B.; Roytrakul, S.; Paemanee, A.; Phaonakrop, N.; Yokthongwattana, C. Comparative proteomic analysis of Chlamydomonas reinhardtii control and a salinity-tolerant strain revealed a differential protein expression pattern. Planta 2017, 246, 843–856. [Google Scholar] [CrossRef] [PubMed]
  18. Chamnanmanoontham, N.; Pongprayoon, W.; Pichyangkura, R.; Roytrakul, S.; Chadchawan, S. Chitosan enhances rice seedling growth via gene expression network between nucleus and chloroplast. Plant Growth Regul. 2014, 75, 101–114. [Google Scholar] [CrossRef]
  19. Tyanova, S.; Temu, T.; Cox, J. The MaxQuant computational platform for mass spectrometry-based shotgun proteomics. Nat. Protoc. 2016, 11, 2301–2319. [Google Scholar] [CrossRef] [PubMed]
  20. Consortium, T.U. UniProt: The Universal Protein Knowledgebase in 2023. Nucleic Acids Res. 2022, 51, D523–D531. [Google Scholar] [CrossRef]
  21. Pang, Z.; Zhou, G.; Ewald, J.; Chang, L.; Hacariz, O.; Basu, N.; Xia, J. Using MetaboAnalyst 5.0 for LC–HRMS spectra processing, multi-omics integration and covariate adjustment of global metabolomics data. Nat. Protoc. 2022, 17, 1735–1761. [Google Scholar] [CrossRef]
  22. Sun, P.; Mao, Y.; Li, G.; Cao, M.; Kong, F.; Wang, L.; Bi, G. Comparative transcriptome profiling of Pyropia yezoensis (Ueda) M.S. Hwang & H.G. Choi in response to temperature stresses. BMC Genom. 2015, 16, 463. [Google Scholar] [CrossRef]
  23. Calegario, G.; Freitas, L.; Santos, E.; Silva, B.; Oliveira, L.; Garcia, G.; Omachi, C.; Pereira, R.; Thompson, C.; Thompson, F. Environmental modulation of the proteomic profiles from closely phylogenetically related populations of the red seaweed Plocamium brasiliense. PeerJ 2019, 7, e6469. [Google Scholar] [CrossRef] [PubMed]
  24. Xu, K.; Xu, Y.; Ji, D.; Xie, J.; Chen, C.; Xie, C. Proteomic analysis of the economic seaweed Pyropia haitanensis in response to desiccation. Algal Res. 2016, 19, 198–206. [Google Scholar] [CrossRef]
  25. Park, H.S.; Jeong, W.J.; Kim, E.; Jung, Y.; Lim, J.M.; Hwang, M.S.; Park, E.J.; Ha, D.S.; Choi, D.W. Heat shock protein gene family of the Porphyra seriata and enhancement of heat stress tolerance by PsHSP70 in Chlamydomonas. Mar. Biotechnol. 2012, 14, 332–342. [Google Scholar] [CrossRef]
  26. Zhang, H.; Li, W.; Li, J.; Fu, W.; Yao, J.; Duan, D. Characterization and expression analysis of hsp70 gene from Ulva prolifera J. Agardh (Chlorophycophyta, Chlorophyceae). Mar Genom. 2012, 5, 53–58. [Google Scholar] [CrossRef] [PubMed]
  27. Ji, D.; Li, B.; Xu, Y.; Chen, C.; Xie, C. Cloning and quantitative analysis of five heat shock protein 70 genes from Pyropia haitanensis. J. Appl. Phycol. 2015, 27, 499–509. [Google Scholar] [CrossRef]
  28. Kobayashi, Y.; Harada, N.; Nishimura, Y.; Saito, T.; Nakamura, M.; Fujiwara, T.; Kuroiwa, T.; Misumi, O. Algae sense exact temperatures: Small heat shock proteins are expressed at the survival threshold temperature in Cyanidioschyzon merolae and Chlamydomonas reinhardtii. Genome. Biol. Evol. 2014, 6, 2731–2740. [Google Scholar] [CrossRef] [PubMed]
  29. Dong, S.; Jiang, Y.; Bu, Y.; Wang, S.; Zhang, H.; Wang, R. Growth, photosynthetic pigment proteins responses and transcriptome analysis provide insights into survival strategies against short-term cold stress in the blue-green algae, Arthrospira. Aquac. Rep. 2022, 27, 101403. [Google Scholar] [CrossRef]
  30. Singh, S.P.; Singh, P. Effect of temperature and light on the growth of algae species: A review. Renew. Sustain. Energy Rev. 2015, 50, 431–444. [Google Scholar] [CrossRef]
  31. Kaplan, F.; Kopka, J.; Haskell, D.W.; Zhao, W.; Schiller, K.C.; Gatzke, N.; Sung, D.Y.; Guy, C.L. Exploring the temperature-stress metabolome of Arabidopsis. Plant Physiol. 2004, 136, 4159–4168. [Google Scholar] [CrossRef]
  32. Novosel, N.; Mišić Radić, T.; Zemla, J.; Lekka, M.; Čačković, A.; Kasum, D.; Legović, T.; Žutinić, P.; Gligora Udovič, M.; Ivošević DeNardis, N. Temperature-induced response in algal cell surface properties and behaviour: An experimental approach. J. Appl. Phycol. 2022, 34, 243–259. [Google Scholar] [CrossRef]
  33. González-Hourcade, M.; Fernando, D.; Gentili, F.G. Morphological and cellular organization of green microalgae to cope with cold stress in subarctic environment. Algal Res. 2023, 75, 103254. [Google Scholar] [CrossRef]
  34. Xing, C.; Li, J.; Yuan, H.; Yang, J. Physiological and transcription level responses of microalgae Auxenochlorella protothecoides to cold and heat induced oxidative stress. Environ. Res. 2022, 211, 113023. [Google Scholar] [CrossRef] [PubMed]
  35. Aslam, S.N.; Strauss, J.; Thomas, D.N.; Mock, T.; Underwood, G.J.C. Identifying metabolic pathways for production of extracellular polymeric substances by the diatom Fragilariopsis cylindrus inhabiting sea ice. ISME J. 2018, 12, 1237–1251. [Google Scholar] [CrossRef]
  36. Chardon, F.; Bedu, M.; Calenge, F.; Klemens, P.A.W.; Spinner, L.; Clement, G.; Chietera, G.; Léran, S.; Ferrand, M.; Lacombe, B.; et al. Leaf fructose content is controlled by the vacuolar transporter SWEET17 in Arabidopsis. Curr. Biol. 2013, 23, 697–702. [Google Scholar] [CrossRef] [PubMed]
  37. Raven, J.A.; Beardall, J. Carbohydrate metabolism and respiration in algae. In Photosynthesis in Algae; Larkum, A.W.D., Douglas, S.E., Raven, J.A., Eds.; Springer: Dordrecht, The Netherlands, 2003; pp. 205–224. [Google Scholar]
  38. Stein, O.; Granot, D. Plant fructokinases: Evolutionary, developmental, and metabolic aspects in sink tissues. Front. Plant Sci. 2018, 9, 339. [Google Scholar] [CrossRef] [PubMed]
  39. Green, B.R.; Durnford, D.G. The chlorophyll-carotenoid proteins of oxygenic photosynthesis. Annu. Rev. Plant Physiol. Plant Mol. Biol. 1996, 47, 685–714. [Google Scholar] [CrossRef] [PubMed]
  40. Lastdrager, J.; Hanson, J.; Smeekens, S. Sugar signals and the control of plant growth and development. J. Exp. Bot. 2014, 65, 799–807. [Google Scholar] [CrossRef] [PubMed]
  41. Rolland, F.; Baena-Gonzalez, E.; Sheen, J. Sugar sensing and signaling in plants: Conserved and novel mechanisms. Annu. Rev. Plant Biol. 2006, 57, 675–709. [Google Scholar] [CrossRef] [PubMed]
  42. Jiang, S.-Y.; Chi, Y.-H.; Wang, J.-Z.; Zhou, J.-X.; Cheng, Y.-S.; Zhang, B.-L.; Ma, A.; Vanitha, J.; Ramachandran, S. Sucrose metabolism gene families and their biological functions. Sci. Rep. 2015, 5, 17583. [Google Scholar] [CrossRef]
  43. Müller, W.; Wegmann, K. Sucrose biosynthesis in Dunaliella. Planta 1978, 141, 155–158. [Google Scholar] [CrossRef]
  44. Nagao, M.; Uemura, M. Sucrose phosphate phosphatase in the green alga Klebsormidium flaccidum (Streptophyta) lacks an extensive C-terminal domain and differs from that of land plants. Planta 2012, 235, 851–861. [Google Scholar] [CrossRef] [PubMed]
  45. Garcia-Soto, C.; Cheng, L.; Caesar, L.; Schmidtko, S.; Jewett, E.B.; Cheripka, A.; Rigor, I.; Caballero, A.; Chiba, S.; Báez, J.C.; et al. An Overview of Ocean Climate Change Indicators: Sea Surface Temperature, Ocean Heat Content, Ocean pH, Dissolved Oxygen Concentration, Arctic Sea Ice Extent, Thickness and Volume, Sea Level and Strength of the AMOC (Atlantic Meridional Overturning Circulation). Front. Mar. Sci. 2021, 8, 642372. [Google Scholar] [CrossRef]
  46. Doney, S.C.; Fabry, V.J.; Feely, R.A.; Kleypas, J.A. Ocean acidification: The other CO2 problem. Annu. Rev. Mar. Sci. 2009, 1, 169–192. [Google Scholar] [CrossRef] [PubMed]
  47. Tapken, D.; Hollmann, M. Arabidopsis thaliana glutamate receptor ion channel function demonstrated by ion pore transplantation. J. Mol. Biol. 2008, 383, 36–48. [Google Scholar] [CrossRef] [PubMed]
  48. Kang, J.; Turano, F.J. The putative glutamate receptor 1.1 (AtGLR1.1) functions as a regulator of carbon and nitrogen metabolism in Arabidopsis thaliana. Proc. Natl. Acad. Sci. USA 2003, 100, 6872–6877. [Google Scholar] [CrossRef] [PubMed]
  49. Gout, E.; Rébeillé, F.; Douce, R.; Bligny, R. Interplay of Mg2+, ADP, and ATP in the cytosol and mitochondria: Unravelling the role of Mg2+ in cell respiration. Proc. Natl. Acad. Sci. 2014, 111, E4560–E4567. [Google Scholar] [CrossRef] [PubMed]
  50. Schwartz, S.C.; Pinto-Pacheco, B.; Pitteloud, J.-P.; Buccella, D. Formation of ternary complexes with MgATP: Effects on the detection of Mg2+ in biological samples by bidentate fluorescent sensors. Inorg. Chem. 2014, 53, 3204–3209. [Google Scholar] [CrossRef] [PubMed]
  51. Chesinta, V.; Andrea, M.P.R. Role of magnesium in the regulation of hepatic glucose homeostasis. In Glucose Homeostasis; Leszek, S., Ed.; IntechOpen: Rijeka, Croatia, 2014; p. Ch. 4. [Google Scholar]
  52. Kleczkowski, L.A.; Igamberdiev, A.U. Magnesium and cell energetics: At the junction of metabolism of adenylate and non-adenylate nucleotides. J. Plant Physiol. 2023, 280, 153901. [Google Scholar] [CrossRef] [PubMed]
  53. Pilchova, I.; Klacanova, K.; Tatarkova, Z.; Kaplan, P.; Racay, P. The involvement of Mg2+ in regulation of cellular and mitochondrial functions. Oxid. Med. Cell. Longev. 2017, 2017, 6797460. [Google Scholar] [CrossRef]
  54. Run, C.; Yang, Q.; Liu, Z.; OuYang, B.; Chou, J.J. Molecular basis of MgATP selectivity of the mitochondrial SCaMC carrier. Structure 2015, 23, 1394–1403. [Google Scholar] [CrossRef]
Figure 1. (A) Hierarchical clustering was applied to the 407 proteins identified within each group. The color key represents the mean normalized values. (B) In the PLS–DA of the 407 proteins, component 1, which accounted for 12% of the explained variation, was well separated, indicating notable differences between the groups cultivated at 30 °C and 35 °C. The samples from different groups are color-coded: red represents the 30 °C control group (n = 9), and green represents the 35 °C group (n = 9).
Jmse 12 01073 g001
Figure 2. Functional enrichment analysis (GO term) was performed on the expressed proteins in terms of molecular function (A) and biological processes (B).
Jmse 12 01073 g002
Figure 3. Volcano plot visualizing quantitative proteome alterations, allowing for comparison of 30 °C and 35 °C cultivation. Fold change (FC) threshold was 2.0, and p < 0.05. Significant proteins are presented as red dots (up) and blue dots (down). The X-axis illustrates the log2-transformed FC, while the Y-axis represents the log10-transformed p-value.
Jmse 12 01073 g003
Figure 4. Map illustrating the interactions among the 12 significant proteins (indicated with black stars), each exhibiting a fold change greater than 2.0, as well as both protein–protein and chemical–protein interactions. To enhance the relevance to the characteristics of H. macroloba, keywords associated with its traits were incorporated into the search for interactions within the map, indicated with red stars. This represents the confidence perspective, where more robust associations are depicted with thicker lines. Gray lines indicate protein–protein interactions, green lines are chemical–protein interactions, and red lines represent interactions between chemicals.
Jmse 12 01073 g004
Table 1. List of significant proteins, with fold change set to 2.0 and p-value < 0.05.
Protein IDsProtein NamesGene Ontology
(Biological Process)
Gene Ontology (Molecular Function)FClog2(FC)
A0A0D6E2P6Cell division proteinCell divisionSmall-molecule binding0.10701−3.2242
A0A8S1IWT5Protein kinase domain-containing proteinCellular metabolic processSmall-molecule binding0.18418−2.4408
A0A8S1J0X3Phospholipid-transporting ATPaseMacromolecule localizationSmall-molecule binding0.249−2.0058
A0A8S1J4V3TPM domain-containing protein--0.27397−1.8679
A0A386B1A2Small ribosomal subunit protein uS3cBiosynthetic processOrganic cyclic compound binding0.29894−1.7421
A0A8S1J867Uncharacterized protein--0.48295−1.05
A0A8S1J8Q1Uncharacterized protein--3.14151.6515
A0A8S1J7D8Uncharacterized protein--3.69461.8854
A0A8S1ILY7Secreted proteinEstablishment of localizationTransport4.80542.2647
A0A3S5X2Q5DNA-directed RNA polymerase subunit betaBiosynthetic processOrganic cyclic compound binding7.96622.9939
A0A8S1J7E9Long-chain alcohol oxidaseOxidoreductase activitySmall-molecule binding19.4984.2853
A0A8S1IXJ6Fungal lipase-like domain-containing proteinOrganic substance metabolic processGene Ontology (molecular function)29.4724.8813
Disclaimer/Publisher’s Note: The statements, opinions and data contained in all publications are solely those of the individual author(s) and contributor(s) and not of MDPI and/or the editor(s). MDPI and/or the editor(s) disclaim responsibility for any injury to people or property resulting from any ideas, methods, instructions or products referred to in the content.