Article

Hybrid Torque Coefficient Control of Average-to-Peak Ratio for Turbine Angular Velocity Reduction in Oscillating-Water-Column-Type Wave Energy Converter

Division of Marine System Engineering, Korea Maritime and Ocean University, 727 Taejong-ro, Yeongdo-gu, Busan 49112, Republic of Korea
*
Author to whom correspondence should be addressed.
J. Mar. Sci. Eng. 2024, 12(7), 1080; https://doi.org/10.3390/jmse12071080
Submission received: 19 April 2024 / Revised: 17 June 2024 / Accepted: 22 June 2024 / Published: 26 June 2024
(This article belongs to the Special Issue The Control, Modeling, and the Development of Wave Energy Convertors)

Abstract

:
Wave energy converters (WECs) have significant potential to meet the increasing energy demands and using an oscillating water column (OWC) is one of the most reliable ways to implement them. The OWC has a simple structure and excellent durability. However, control of the power take-off (PTO) system is difficult due to variability in the input wave energy. In particular, the design and control of the PTO system are complex, as the average-to-peak ratio of the output generation is large. Owing to the nature of the OWC, if the energy above the rating cannot be controlled, the power generated is inevitably reduced due to the decrease in operating time. We propose a method to reduce the angular speed of the turbine by dividing the section according to the input energy and correspondingly changing the torque coefficient, thereby increasing the operating time of the OWC. The control methods for the PTO system of OWC are verified through a 30 kW full-scale experimental device to be installed in a real sea area. The full-scale experimental device consists of an inverter that simulates the mechanical torque of an OWC based on the aerodynamic simulation of an impulse turbine, an induction motor, a permanent magnet synchronous generator, an AC/DC converter, and a battery for the energy storage system. The performance of conventional control methods and the proposed method are compared based on the results of numerical simulations and experiments. We show that the fluctuation in the turbine angular velocity in the proposed method is significantly reduced compared with that in the conventional control methods under regular and irregular wave conditions.

1. Introduction

Wave energy converters (WECs) are promising energy sources that will potentially contribute to answering the world’s energy demand [1]. WECs are estimated to have a potential production of 2–3 TW worldwide. The research on WECs started in 1970, and numerous studies have been conducted on their development in coastal countries such as the UK, China, Sweden, Norway, France, and Italy during the past decades [2]. Consequently, various concepts and approaches have been proposed to convert wave energy into electrical energy, and several technologies have been verified by analytical methods [1], numerical methods [3,4], and experimental methods [5]. Recent studies have advanced WECs, control algorithms for WECs [6], power performance analysis of hybrid wind–wave systems [7], and experimental validation of mom-based control [8]. Wave energy can be used for various purposes, such as supplying electricity, supporting hydrogen production desalination plants, or transporting with minimal negative impact on the environment. However, to date, most of these WECs are in the pre-commercial stage, and they require a stable electricity supply and economic feasibility for improving the system efficiency. To this end, considerable research has been conducted on improving system efficiency using control strategies [9,10] for power take-off (PTO) systems or optimizing the geometric design [11,12,13,14]. However, most of the research efforts have been limited to systems performing independently, ignoring couplings or losses between subsystems that are critical for accurately analyzing WECs’ electrodynamics and power performance and accurately determining the optimal electrical load. Most of the developed control methods aim to increase the power absorbed from the waves rather than the generated power, for instance, considering transmission losses or non-ideal PTOs. To solve this problem, using a numerical method, a mathematical model that integrates all the components from the wave side to the electric grid or electric load side is developed. For a physical solution, a water tank experiment or a real sea experiment must be performed.
The OWC is widely considered as the simplest and most reliable concept for a WEC. The only moving part of the PTO mechanism is the rotor of an air turbine, which directly drives conventional electricity. A numerical analysis was conducted from the wave side to the electric grid side of the OWC. Considering the cost and time of the physical experiment, it was used for model-based control of a WEC in regular and irregular waves using numerical simulation in a temporal mathematical model called the wave-to-wire model [15,16]. An overall numerical time-domain model for the OWC using a turbine was presented to provide an accurate prediction of the power generation, and a reduction-order model was proposed to reduce the computational burden for system integration [15]. A Newtonian model considering all energy conversion steps for the interrelationships of the OWC was constructed, and a turbine efficiency tracking control strategy using Lyapunov stability analysis was employed [16]. The control strategy can be verified with a numerical model; however, small model tests must be performed for the full-size WEC.
The following limitations exist for small-scale model testing of the entire energy conversion chain from the wave to the electric grid side. If the geometric scale ratio of the WEC model (considering the Froude scaling criterion) is expressed as ε, the PTO power scale is ε7/2 (if the final difference between the seawater and freshwater densities in the tank is neglected) [17,18]. This indicates that even at the largest scale (approximately 1:10) at which a WEC can be tested in a surge tank, the PTO power scale is approximately (1/10)7/2 = 1/3162. At this scale, the power rating of a large WEC (e.g., 1 MW) is simulated with the model scale at 316 W, which is too low for actual PTO physical testing. Even at levels lower than the full scale, field testing is costly and time consuming; it also raises the problem of the reproducibility of the conditions.
While the main aim is to test the response of electrical equipment and the control strategy of the PTO, a significantly more economical and faster alternative is to test generators and power electronics in the laboratory at a sufficiently large power scale [19]. The generator is mechanically driven by a machine that simulates the torque and rotational speed of a real PTO. This is achieved by connecting a properly supplied and controlled electric motor to the generator. The energy conversion steps, starting from the waves to the output of the mechanical machine driving the generator, must be simulated numerically in the time domain of the adopted scale. In this study, we verify the control strategy of the OWC based on a method similar to the one mentioned above.
The OWC control strategy must be controlled to maximize the average power output at the instantaneous rotational speed. Hence, the control algorithm implements a control law that relates the electric torque of the generator to the instantaneous rotation speed [19,20,21,22,23]. Most studies have investigated the control algorithm for maximizing the average power output according to the rotational speed; however, owing to the characteristics of wave energy, the control strategy is insufficient in sea conditions that exceed the allowable limit [22,23,24]. If the rated energy is not controlled, the amount of power generated will decrease due to the reduction in the operating time of the PTO system [24]. A control method was proposed to increase the average output while overcoming the problem of energy levels above the rated energy by reducing the air flow rate using a high-speed valve and a relief valve in high-energy sea conditions [22]. The performance of the peak-shaving technology based on valve control was experimentally verified by increasing the efficiency and power generation using a new high-performance turbine [23]. An algorithm was proposed to reduce the average-to-peak ratio by latching control using a valve [24]. Most studies proposed rating control using valves and control algorithms to reduce the average-to-peak ratio.
In this paper, we propose an algorithm that can control the irregularly changing characteristics of all wave energy even when using mechanical valves. The proposed method was able to reduce the amplitude of the change in angular velocity by using a hybrid load control curve according to the angular velocity section. In other words, a control strategy for safe operation is established by reducing the average-to-peak power ratio across all sections. This has made it possible to reduce the occurrence of the problem of stopping the entire system due to energy exceeding the rating [25].
This can increase power generation by increasing the overall operation time of the OWC. In other words, the valve closing time is reduced and more energy can be extracted [21]. The proposed algorithm reduces the angular velocity fluctuation of the turbine and increases the inertia using the torque coefficient fluctuation. The PTO system characteristics and power generation performance are analyzed through a comparison with conventional algorithms. Furthermore, we demonstrate the performance of the proposed algorithm through full-scale experiments.
As for the structure of the paper, Section 1 mentions the background necessary for this study, and Section 2 provides an explanation of the research structure and existing methods to verify the proposed method. Section 3 explains the method proposed in this study, and Section 4 presents experimental results and analysis to verify it. Section 5 presents the results of the paper.

2. Materials and Methods

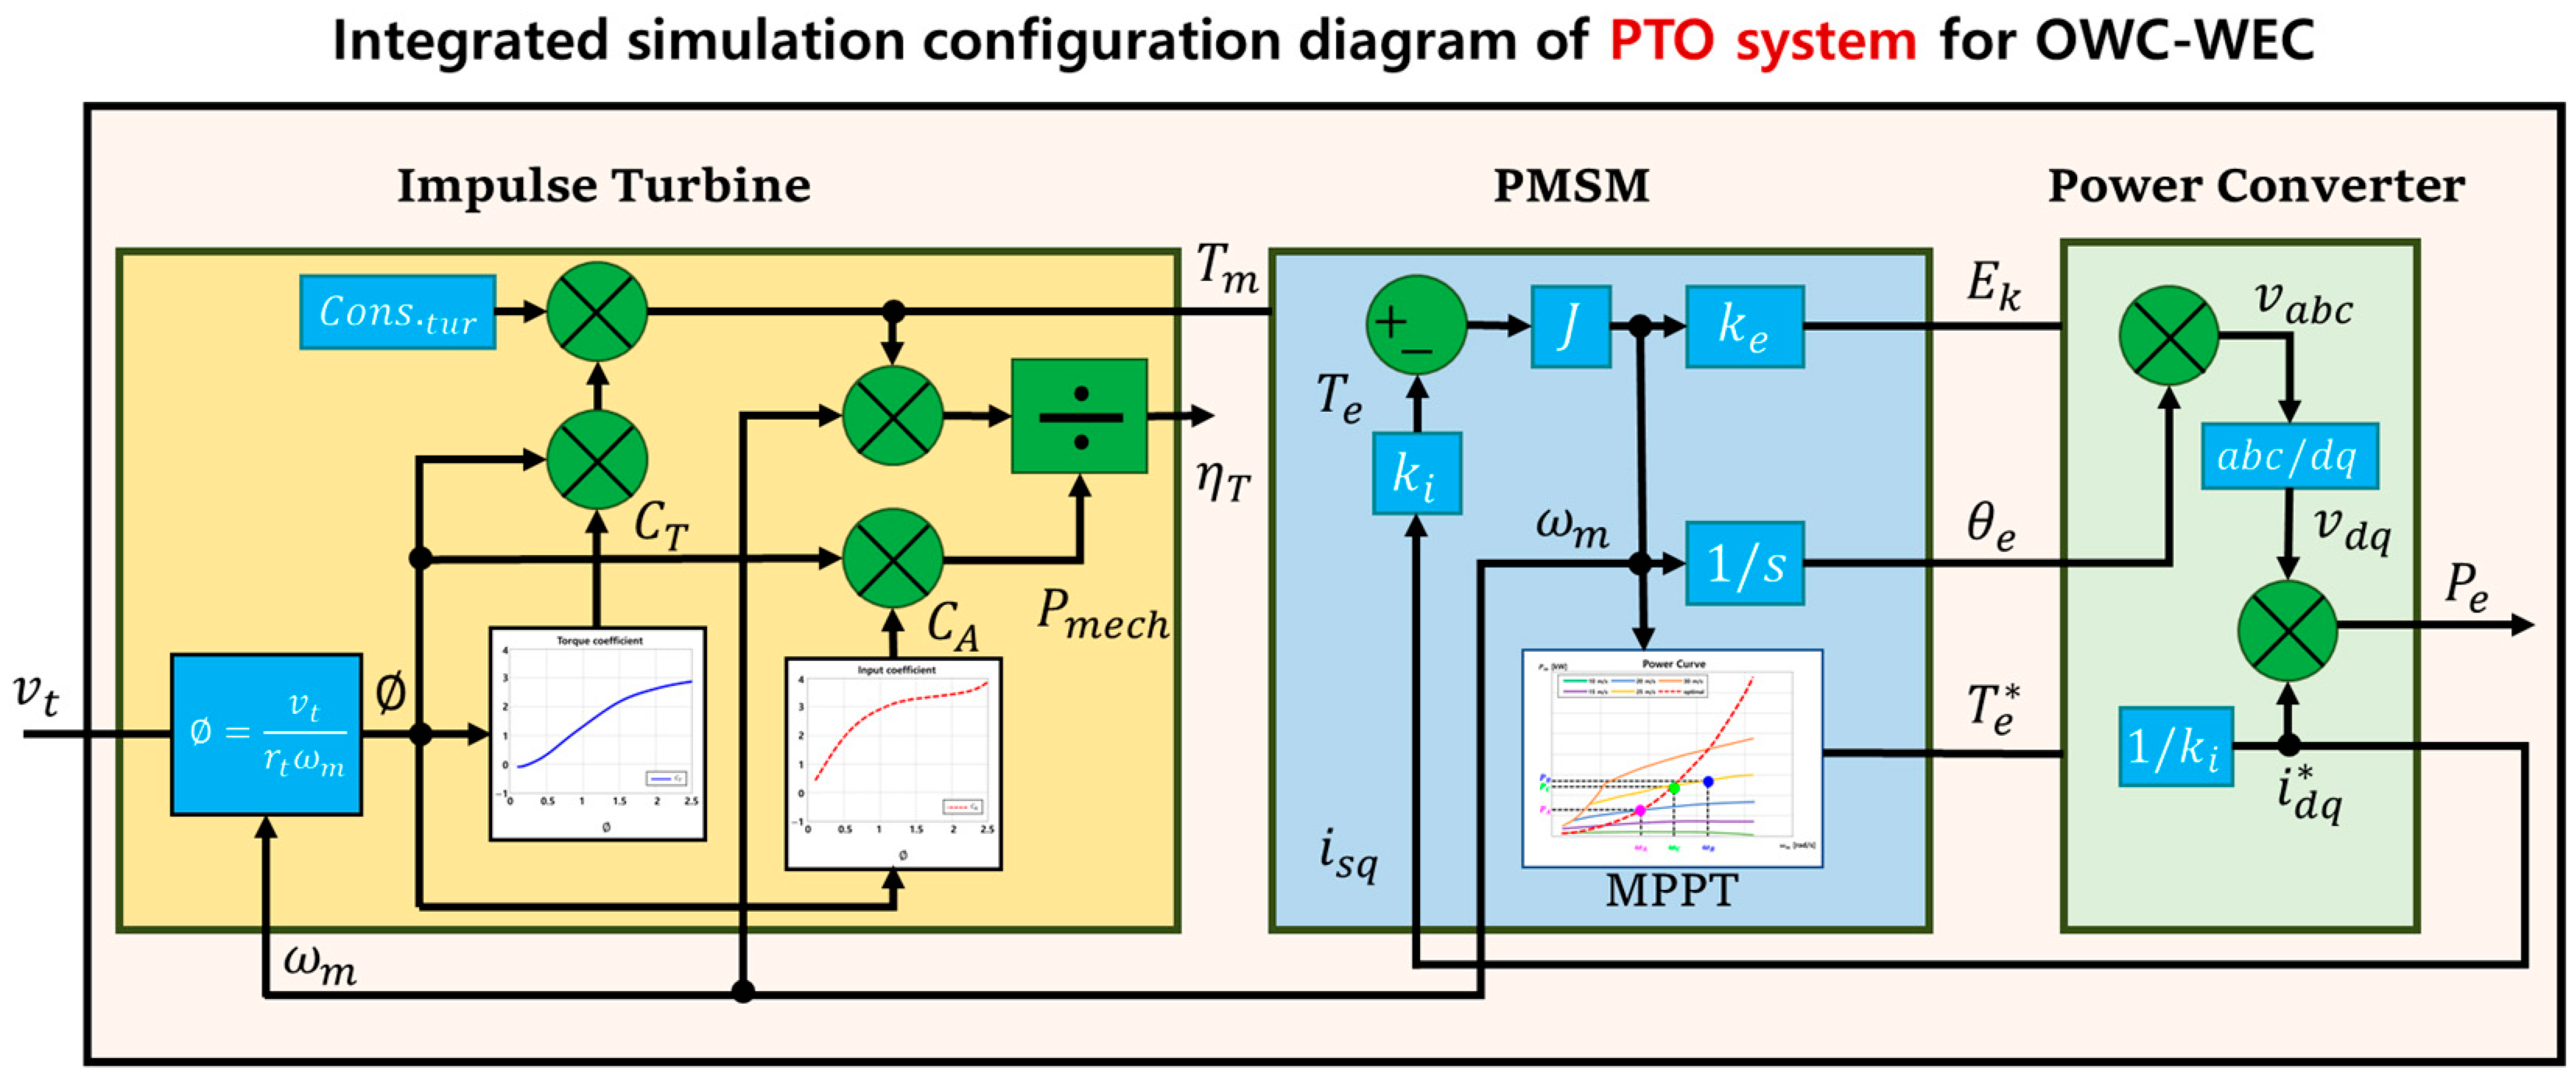
2.1. Turbine and Generator System Modeling

Figure 1 shows the PTO system of OWC, which is composed of a turbine system. The turbine system converts the pneumatic energy in the OWC chamber into mechanical energy, which can start the generator. The mechanical energy of the turbine system is converted into electrical energy through the generator, and the maximum output power is obtained through the current control in the AC/DC converter.
In this study, the characteristics of the PTO system were analyzed based on the input flow velocity of the turbine, without considering the hydrodynamic characteristics of the OWC chamber. In the turbine system, the angular velocity is changed by the input flow velocity and electric torque, and the efficiency of the turbine system changes accordingly. Therefore, the basic control of the OWC is based on electric torque control, which controls the output current of the generator such that the efficiency of the turbine can be maximized [19,20,21].
The OWC PTO system is analyzed using the turbine side flow velocity as an input condition. Thus, the input power can be calculated using the input coefficient of the turbine as follows:
P p n e = p Q = C A × β × v x 3 × ( 1 + 1 | | 2 )
where P p n e is the amount of input pneumatic power, and it is the output power generated in the OWC chamber. C A is the input coefficient of the turbine in the OWC PTO system.
The output torque of the turbine system is calculated using the torque coefficient, as follows:
T m = C T × β × v x 2 × 1 + 1 | | 2 × r t
where C T is the torque coefficient of the turbine in the OWC PTO system.
The angular velocity of a turbine is expressed as follows, using the dynamic equation of the turbine:
d d t ω m = 1 J ( T m T e )
d d t θ m = ω m
where ω m is the angular velocity of the turbine, θ m is the rotor angle of the turbine, J is the moment of inertia, and T m and T e are the mechanical torque and electrical torque.
As shown in Equation (3), the angular velocity of the turbine system changes according to the difference between the mechanical and electric torques in Equation (2). The electric torque must be controlled to maximize the efficiency of the turbine through electric load control. The reference torque for electric load control is calculated using the current of the generator, as follows:
T e = P e ω m = 3 2 ω e Ψ p m i s q ω m = 3 2 N p Ψ p m i q
where ω e is the electrical angular frequency, N p is the number of dipoles of the rotor, Ψ p m is the flux linkage of the permanent magnet, and P e is the instantaneous power from the generator.
The generator-side D-axis current is found through the DQ conversion of the three-phase generator-side current. Since the content on DQ conversion is general, a relevant reference [26] has been added to provide further background.
i d i q = 2 3 c o s ( θ ) c o s ( θ 2 π 3 ) c o s ( θ + 2 π 3 ) s i n ( θ ) s i n ( θ 2 π 3 ) s i n ( θ + 2 π 3 ) i a i b i c
The efficiency of the turbine system is estimated using Equations (1) and (2).
η T = P m P p n e = T × ω m p Q = C T C A × | |
where P m is the mechanical power delivered by the turbine system.
As shown in Equation (7), the efficiency of the turbine system changes according to the flow coefficient, which is calculated as follows.
| | = v x r t ω m
The input and torque coefficients of the turbine used in this study were experimentally obtained for the impulse turbine, and the experimental results are shown in Figure 2.

2.2. Conventional Control Method for OWC PTO System

The basic control method of the OWC PTO system aims to satisfy the flow coefficient that can maximize the efficiency of the turbine system to obtain the maximum power generation according to the input flow rate. Hence, the angular velocity of the turbine is appropriately changed through electric torque control according to the input flow velocity, and the changed angular velocity of the turbine must satisfy the flow coefficient that maximizes the efficiency of the turbine system. When the angular velocity of the turbine changes, the flow coefficient shown in Equation (6) changes, and the efficiency of the turbine changes accordingly.
The efficiency of the turbine system with respect to the flow coefficient is shown in Figure 3. It was derived through extrapolation of the flow coefficient (ϕ < 0.3) section below a certain level due to the limitations of the experimental equipment. Due to use of an impulse turbine, negative efficiency is observed below a certain coefficient. The electric torque control required to maximize the efficiency of the turbine can be calculated using the torque coefficient shown in Equation (2). By using the flow coefficient in Equation (2), the mechanical torque of the turbine can be expressed as follows:
T m = C T × β v x 2 ω m 2 r t 2 × 1 + 1 2 × r t 3 × ω m 2 .
The electrical reference torque for satisfying the efficiency of the turbine can be calculated as follows, assuming that Equation (9) is optimal.
T e = T m . o p t = C T . o p t × β × o p t 2 × 1 + 1 o p t 2 × r t 3 × ω m 2
P p n e = p Q = C A × β × v x 3 × ( 1 + 1 | | 2 )
The electrical torque control measures the angular velocity of the turbine and calculates the reference torque based on Equation (10), and the reference torque according to the input energy and the efficiency of the turbine system is shown in Figure 4.
It is essential to overcome the irregular wave energy variability in an oscillating-water-column-type wave energy converter. Irregular changes in the input energy cause a large amount of energy to enter instantaneously, and therefore, the average-to-peak ratio is very large [22,23,24]. The conventional control methods of the OWC mentioned above only use the maximum power control to maximize the efficiency of the turbine. A high-speed series flow control valve was used to limit the energy above the rated level for large quantities of energy [23,24]. The high-speed series flow control valve can limit the energy above the rating; however, there is a limit to reducing the variability in the wave energy. Thus, conventional control methods have limitations in terms of the input energy and system characteristics of the oscillating-water-column-type wave energy converter.
Figure 5 shows a graph of the output power generation of an OWC that is subjected to a conventional control technique in a real sea area. The negative value appears due to the power that is required to maintain voltage in the DC link. The average-to-peak ratio of the output generation amount differs significantly, by a factor larger than 36. Because the output power generation is proportional to the revolutions per minute (RPM), the RPM variability also increases the average-to-peak ratio. Therefore, it is necessary to develop a control technique to overcome the characteristics of large output variability and average-to-peak ratio in irregular waves.
Increasing the rated capacity of the PTO system to operate in a high-energy sea condition, reflecting the characteristics of the input energy of the OWC, increases the cost and reduces the efficiency under low-load conditions. Therefore, we conduct a comparative study on a control technique that reduces the variability of irregular waves and the peak-to-average ratio, rather than the torque coefficient that optimizes the efficiency of the turbine, as in the conventional method. In the following section, a new algorithm that can secure a continuous operating time by reducing the peak-to-average ratio is proposed and compared with the existing methods.

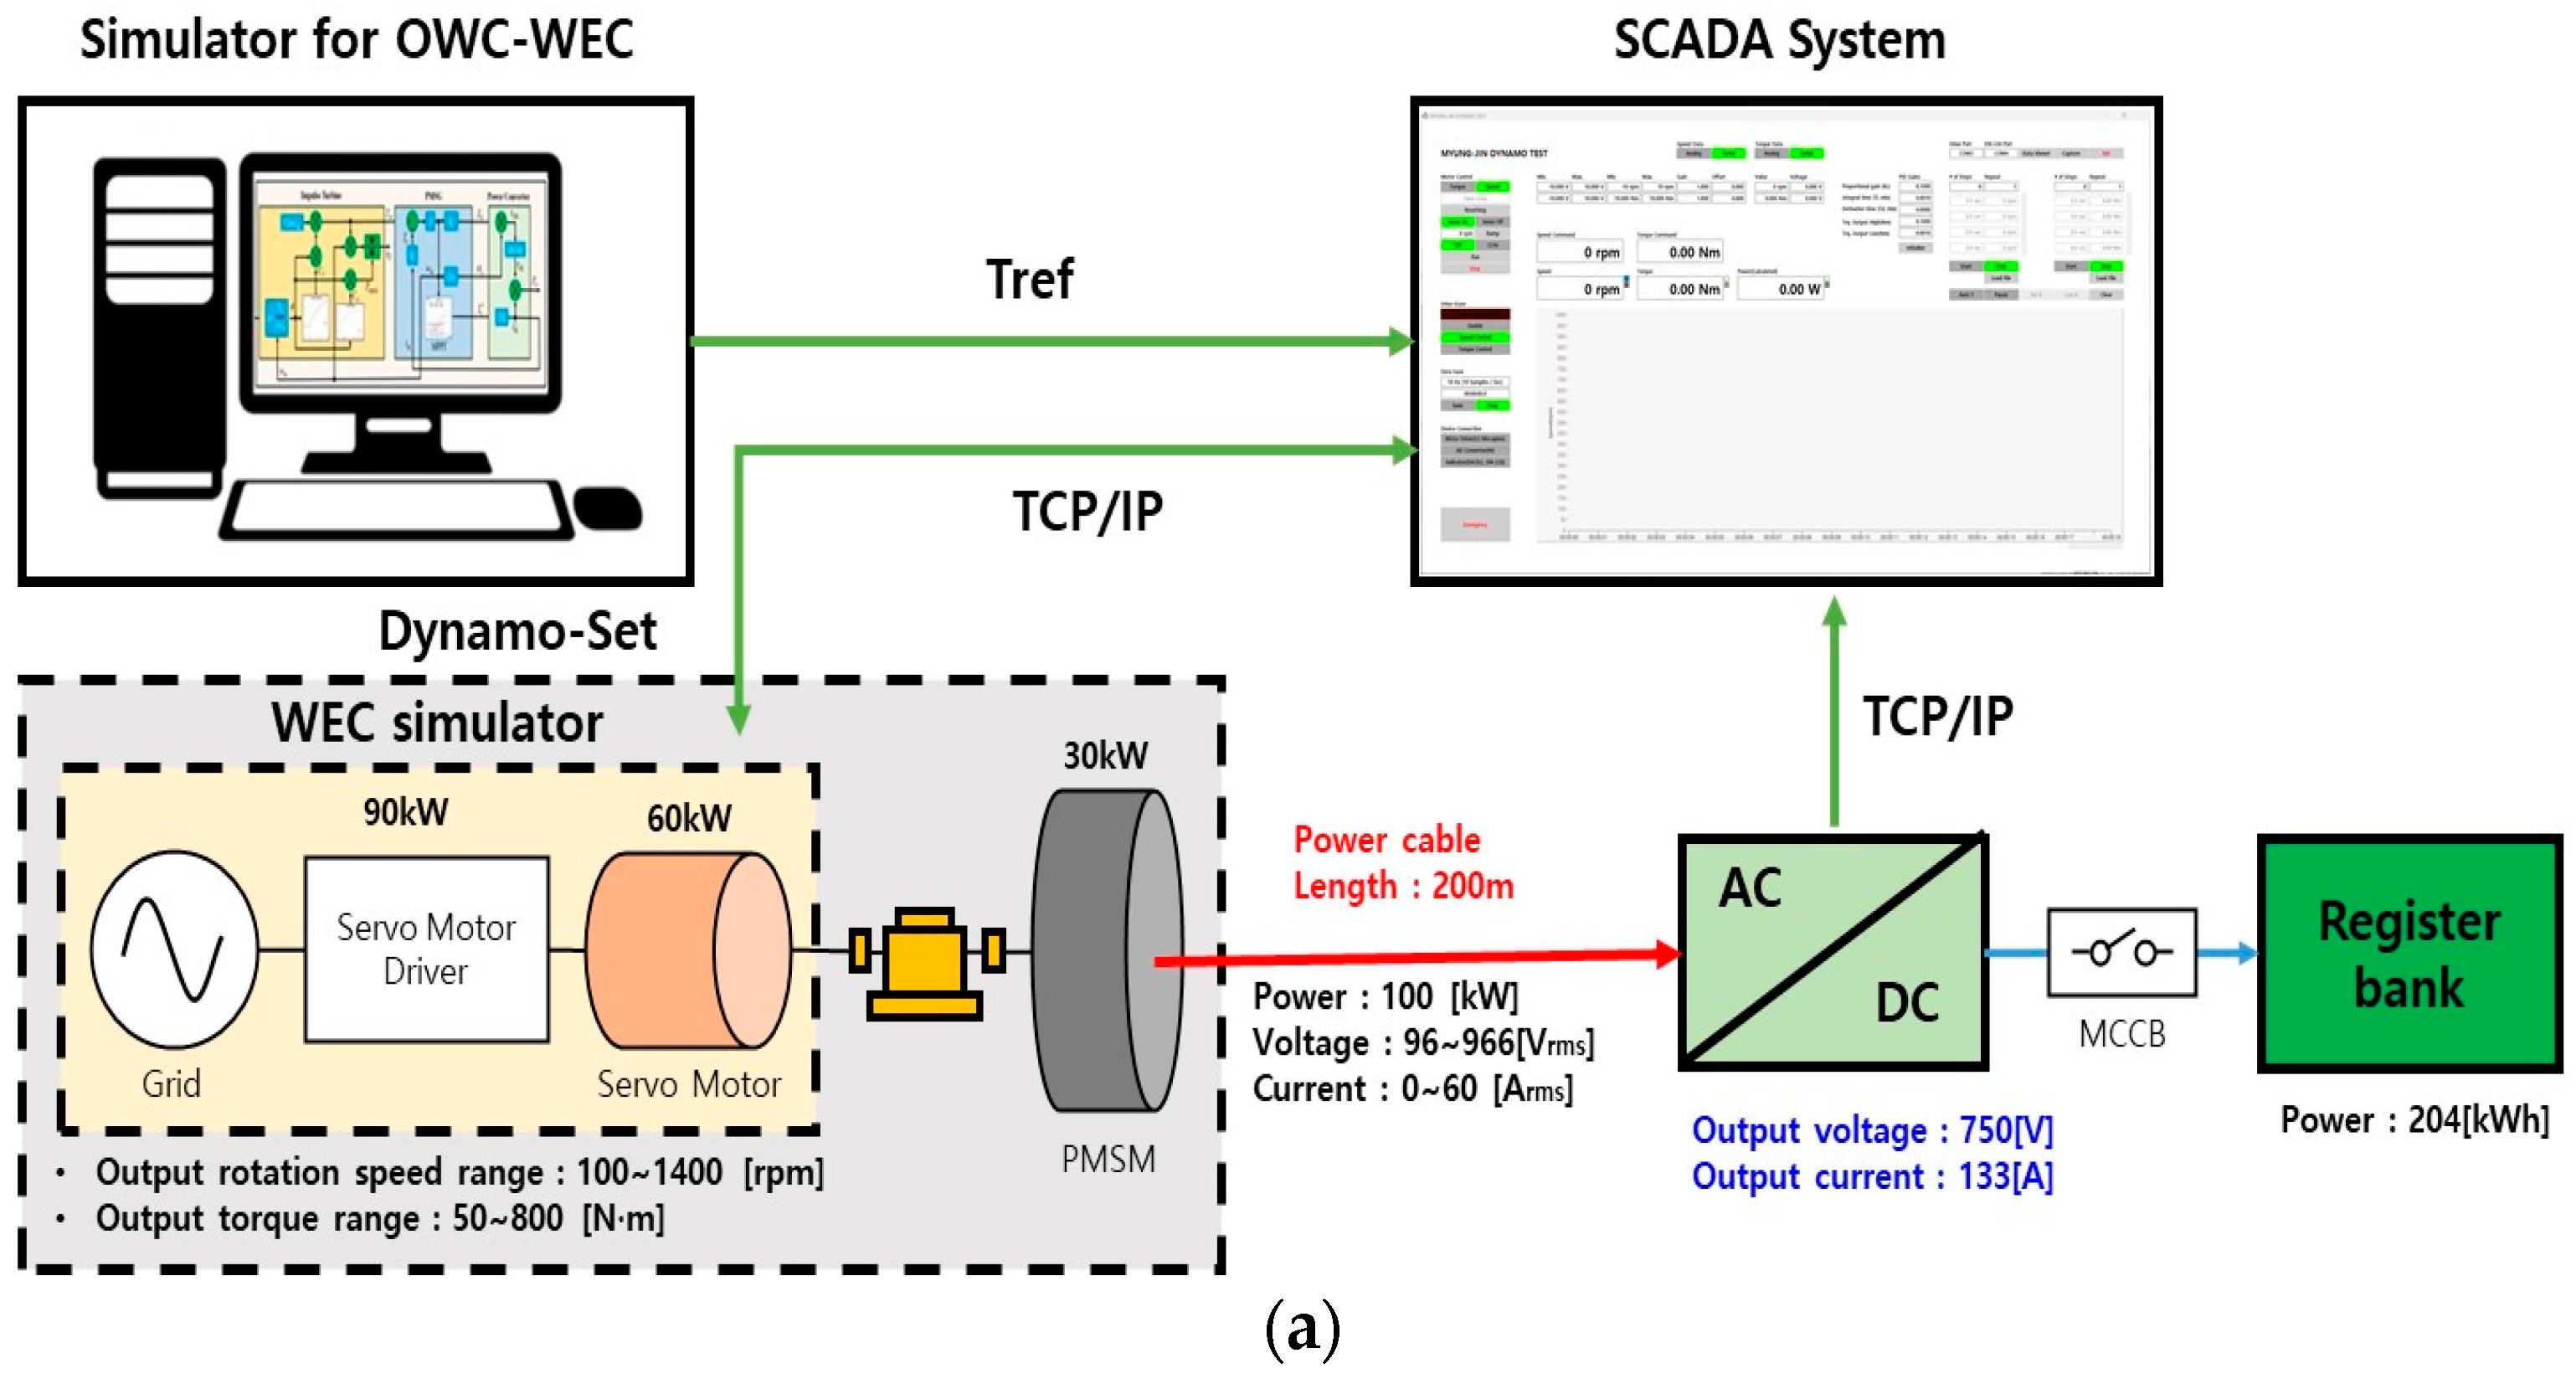
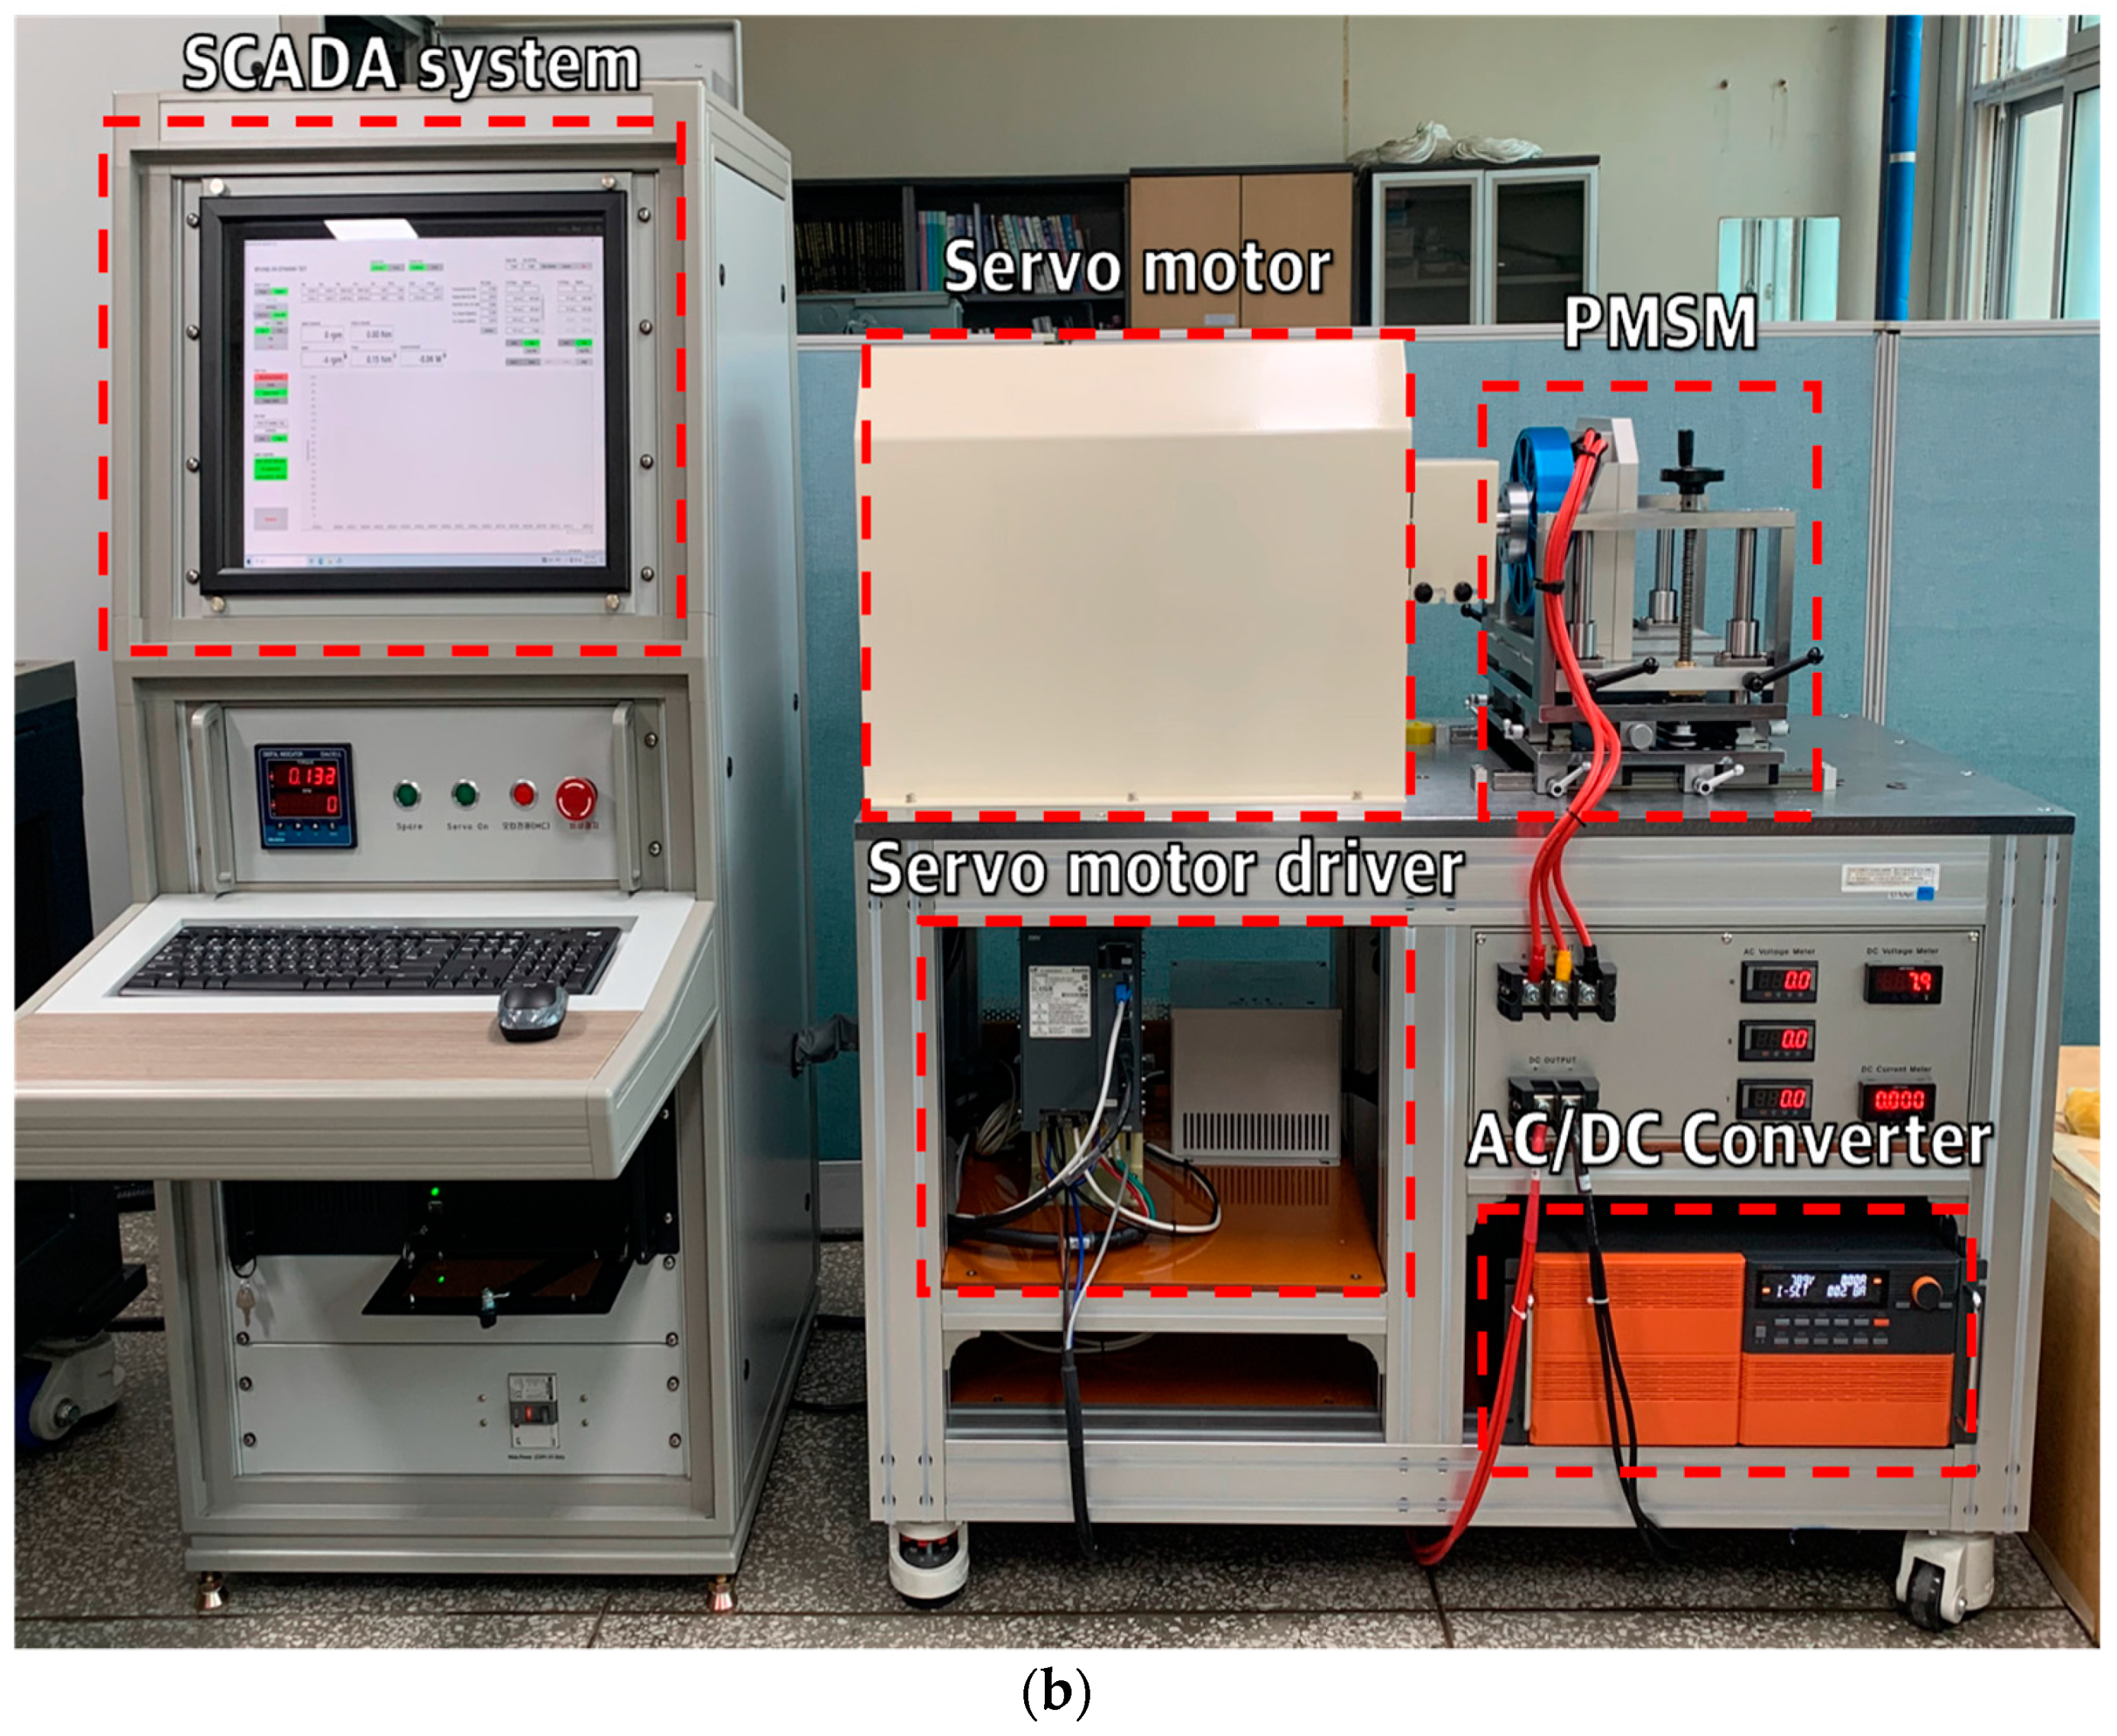
2.3. Configuration for Algorithm Verification

The characteristics and power generation performance of the OWC PTO system according to each algorithm described in this paper are verified through simulations and experiments. The simulation of the OWC PTO system is shown in Figure 6. The block diagram shows how the algorithm in this paper was validated.
Based on the mechanical torque of the turbine calculated in the simulation, a 30 kW class full-scale experimental device was constructed. Figure 7 shows the configuration of the 30 kW class full-scale experiment equipment and a photograph of the experimental equipment used.
The mechanical torque of the turbine obtained by the simulation is controlled by an OWC simulator using a supervisory control and data acquisition (SCADA) system. The OWC simulator is composed of an inverter (90 kW) and a motor (60 kW), and the motor is connected to a permanent magnet synchronous generator with a rated power of 30 kW. The motor is an induction motor rated at 60 kW and consists of four poles, and the torque of the turbine was simulated using torque control as an inverter for vector control. The speed control range of the motor extended up to 1800 RPM, and the torque control range was 859 Nm/1000 RPM. This satisfies the rated 30 kW at 800 RPM, which is the specification of the permanent magnet synchronous generator. The permanent magnet synchronous generator is connected to the AC–DC converter to control the electrical torque according to the input RPM and analyze the PTO system characteristics and power generation performance by applying the algorithms presented in this paper. All the sensor data were monitored and stored in the SCADA system via RS232 communication. Based on the experimental results, the simulation results were verified through simulation and mutual comparison.
The experimental components were conducted under regular and irregular wave conditions, and because this study did not perform a hydrodynamic simulation, the flow velocity of the turbine was used as the input condition of the PTO system.

3. Comparison of Algorithm Characteristics with Respect to Change in Torque Coefficient in OWC

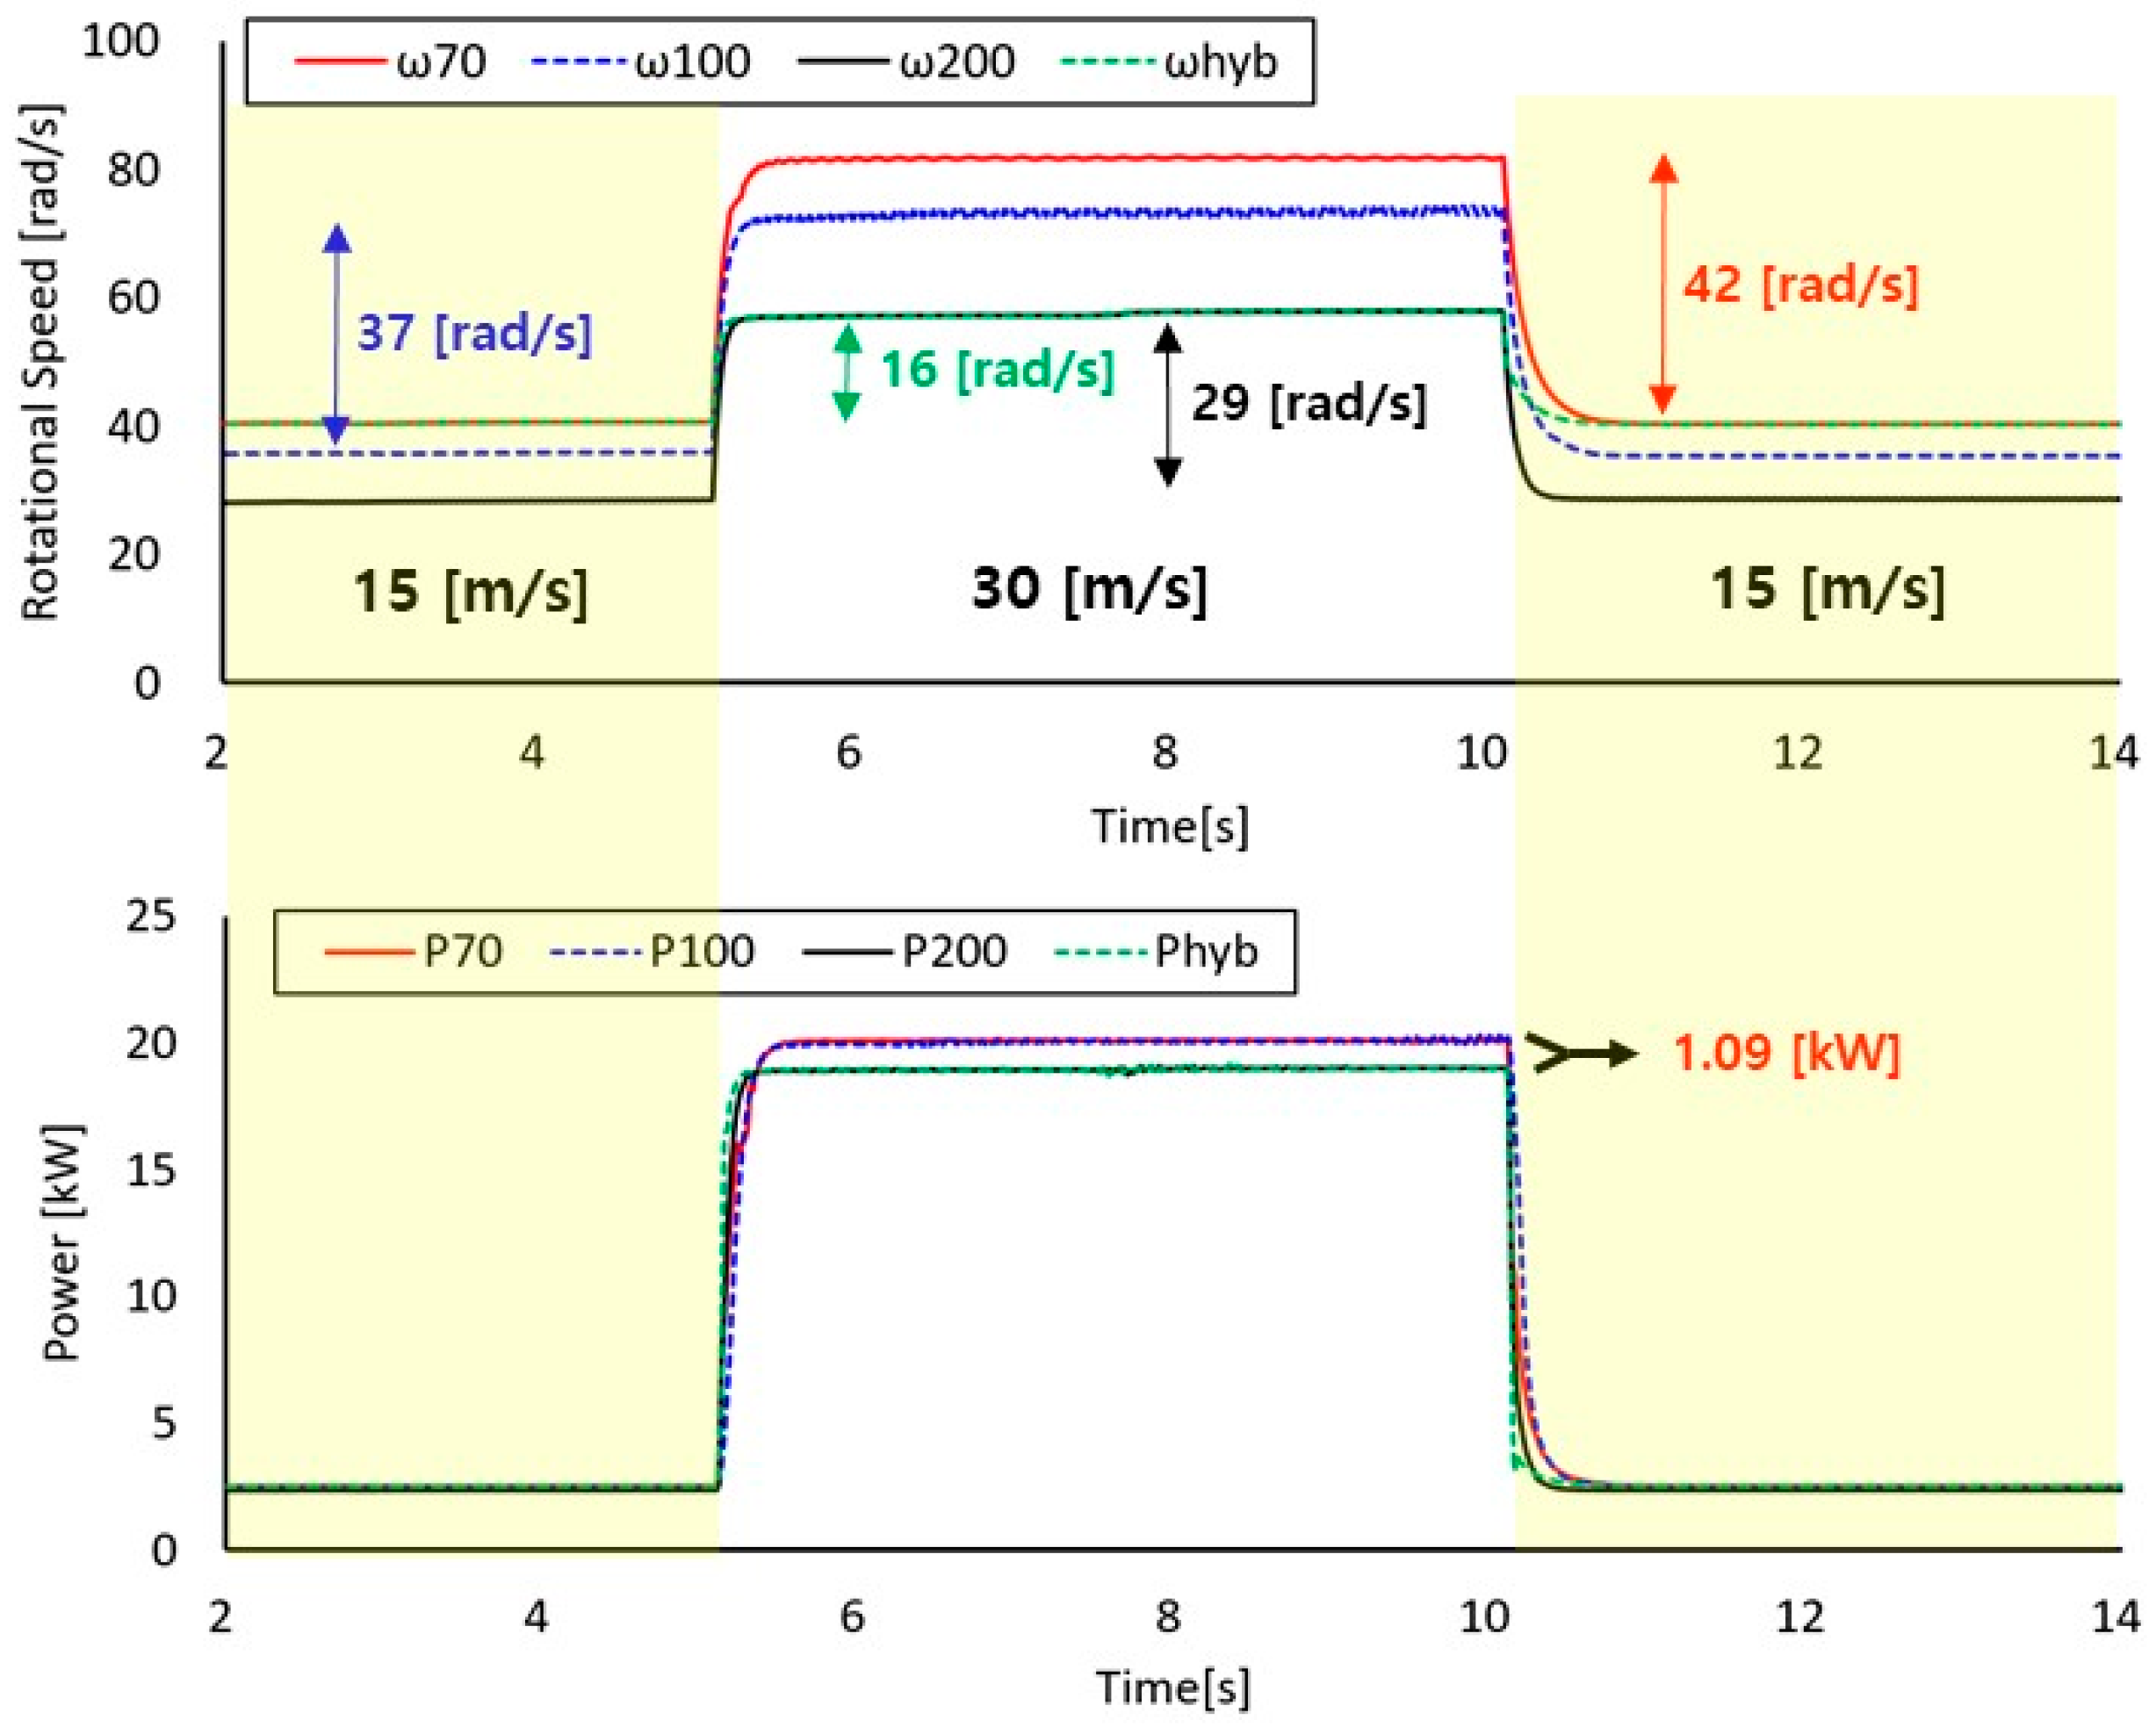
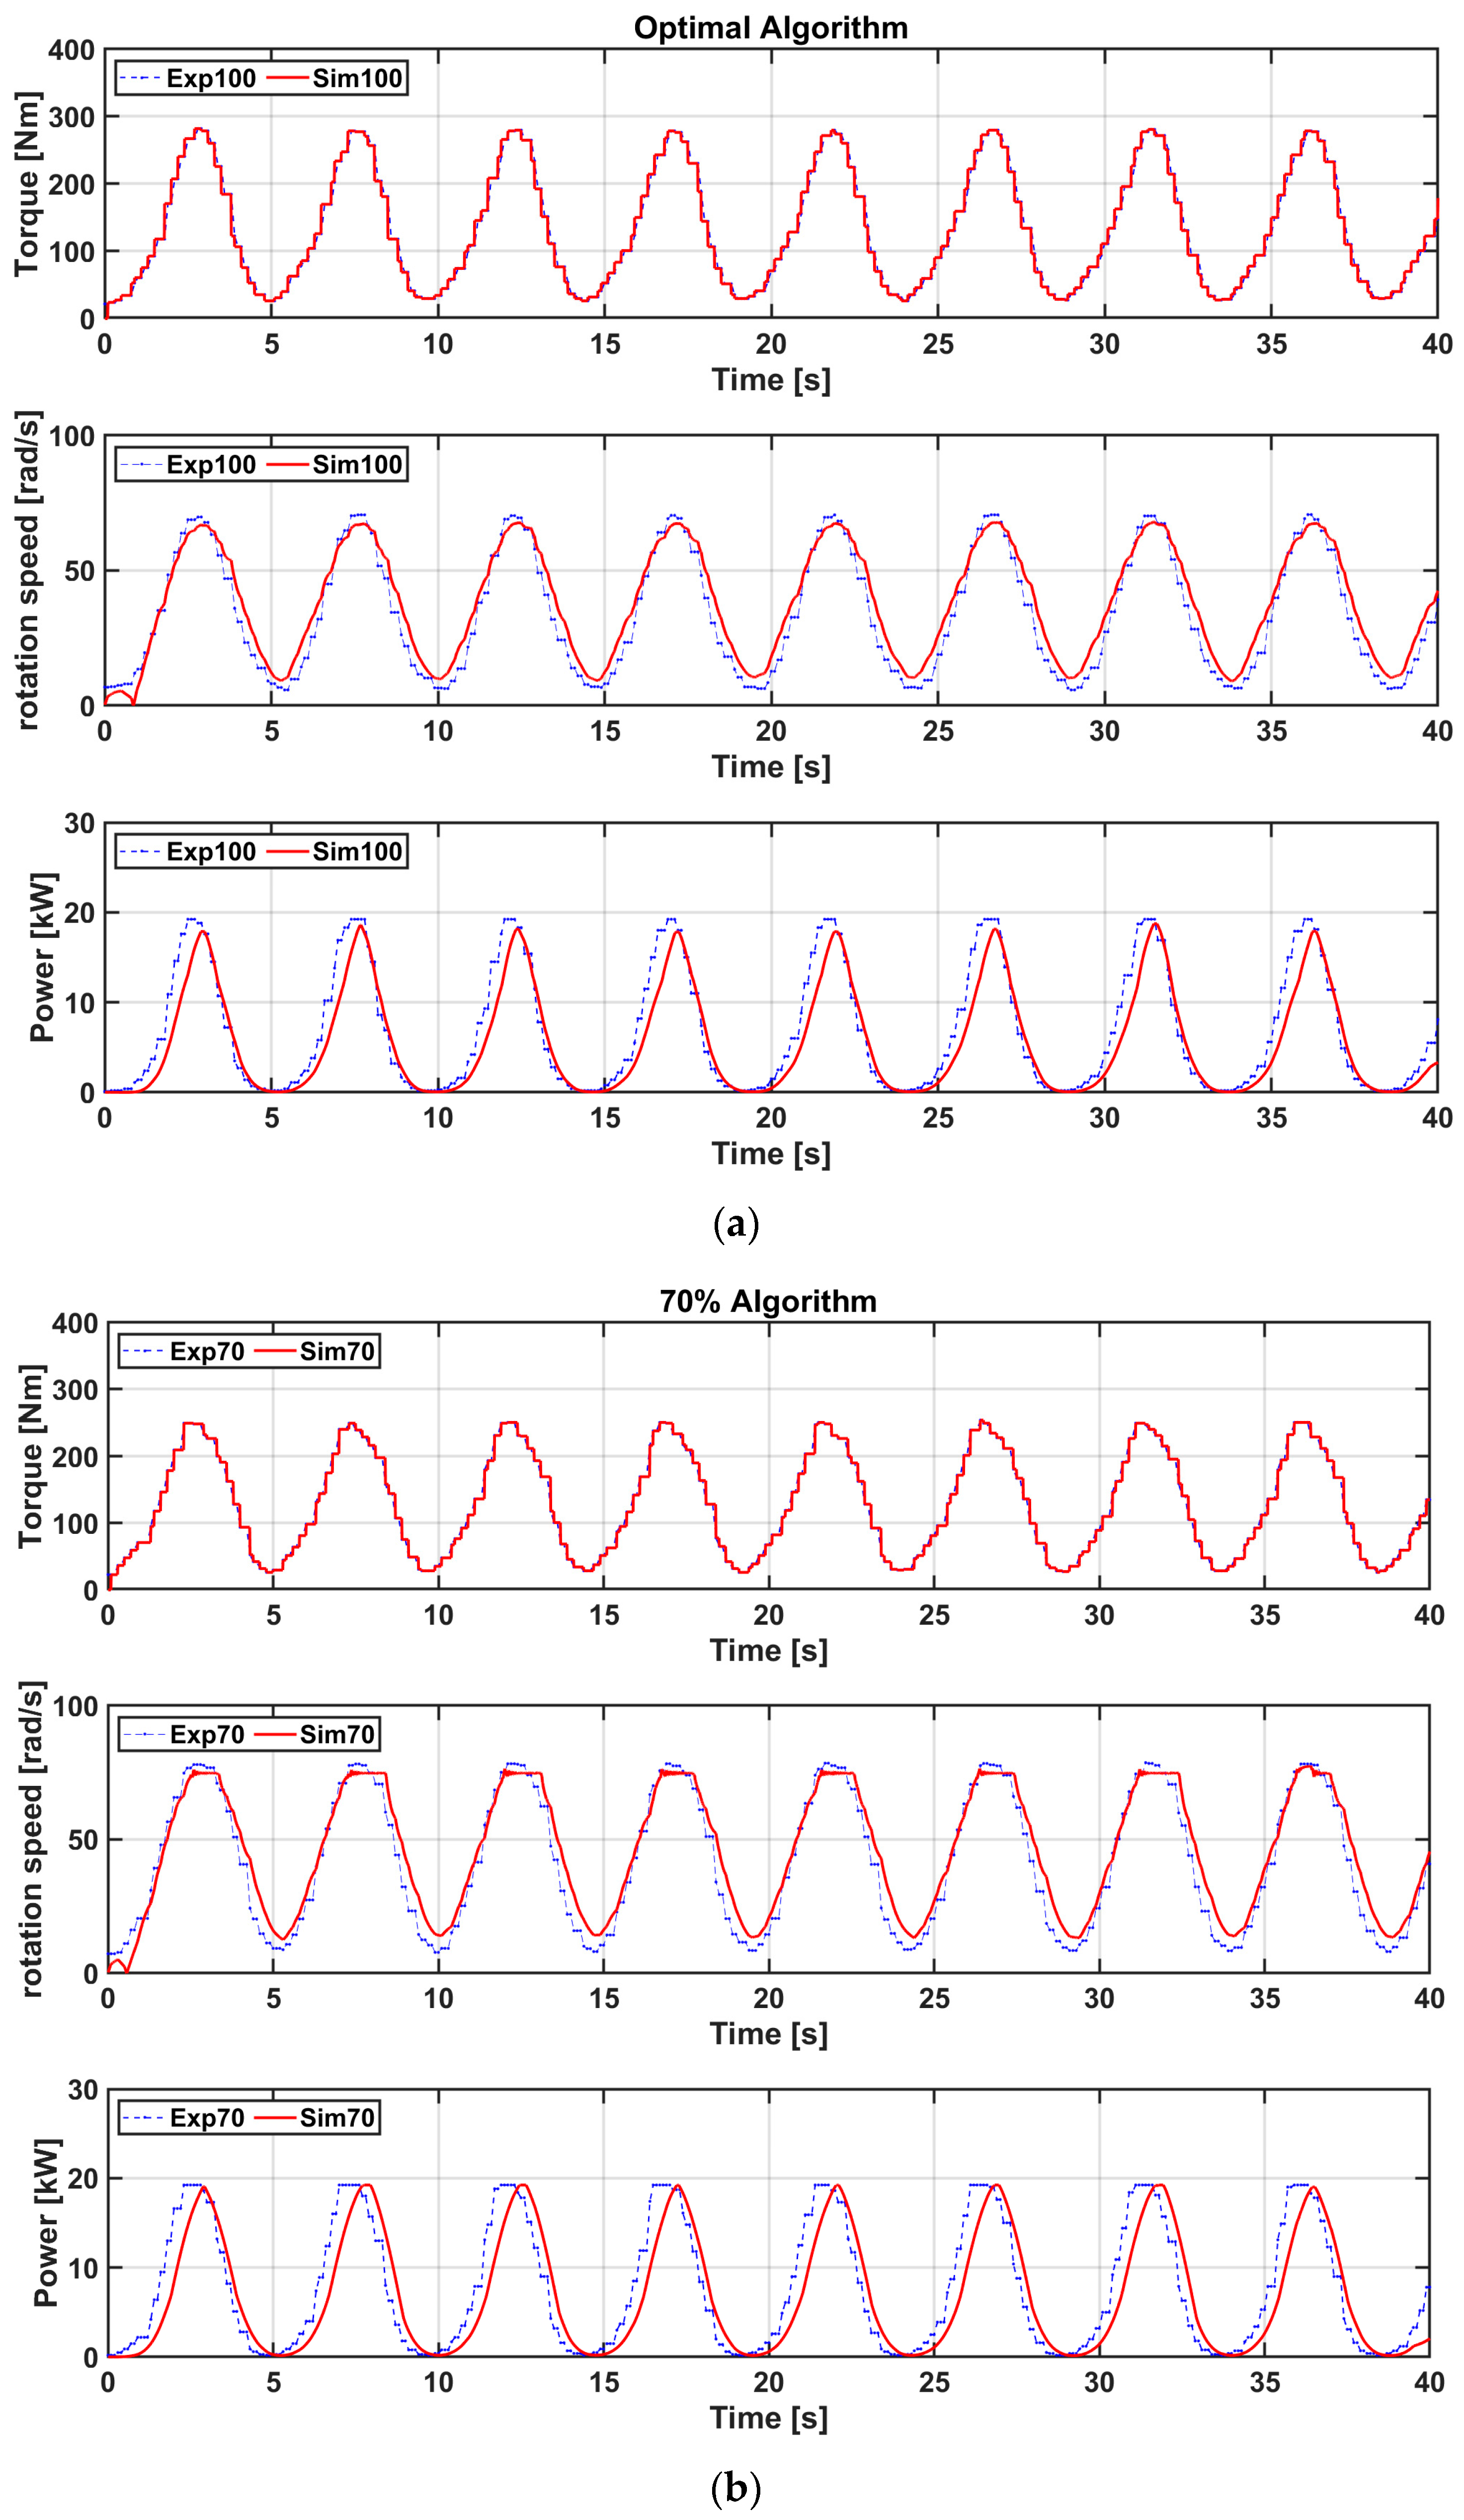
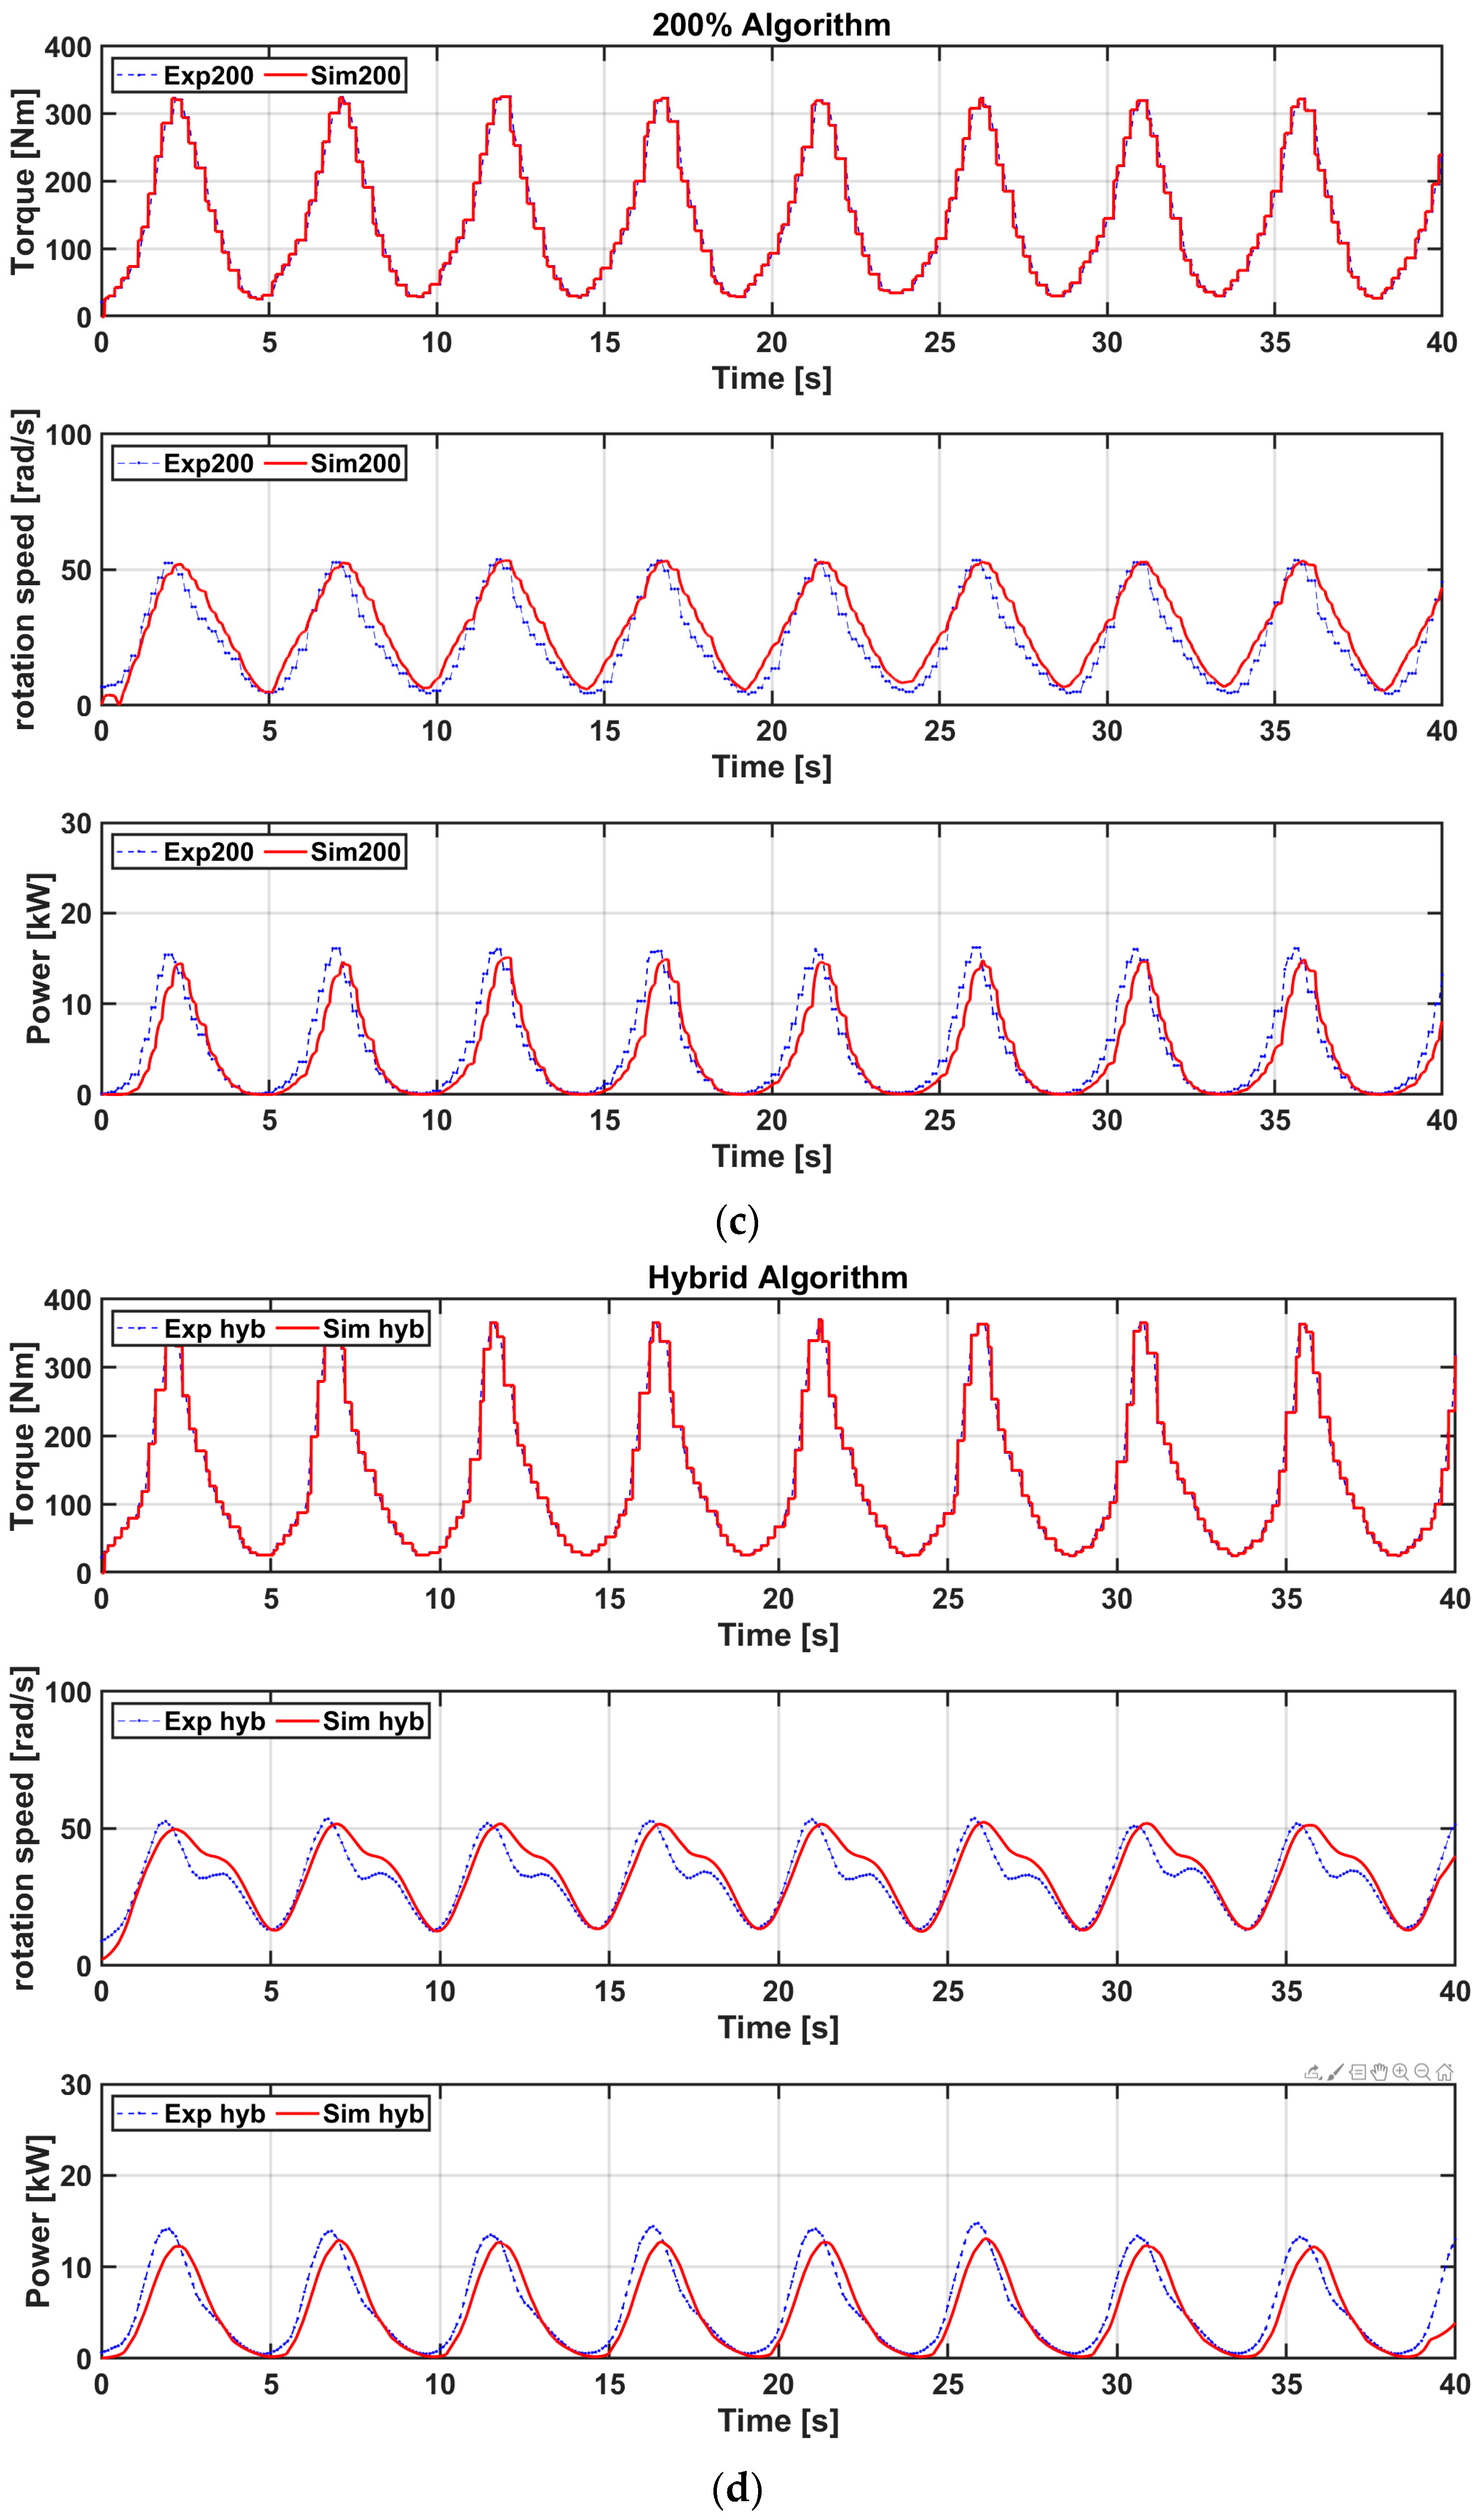
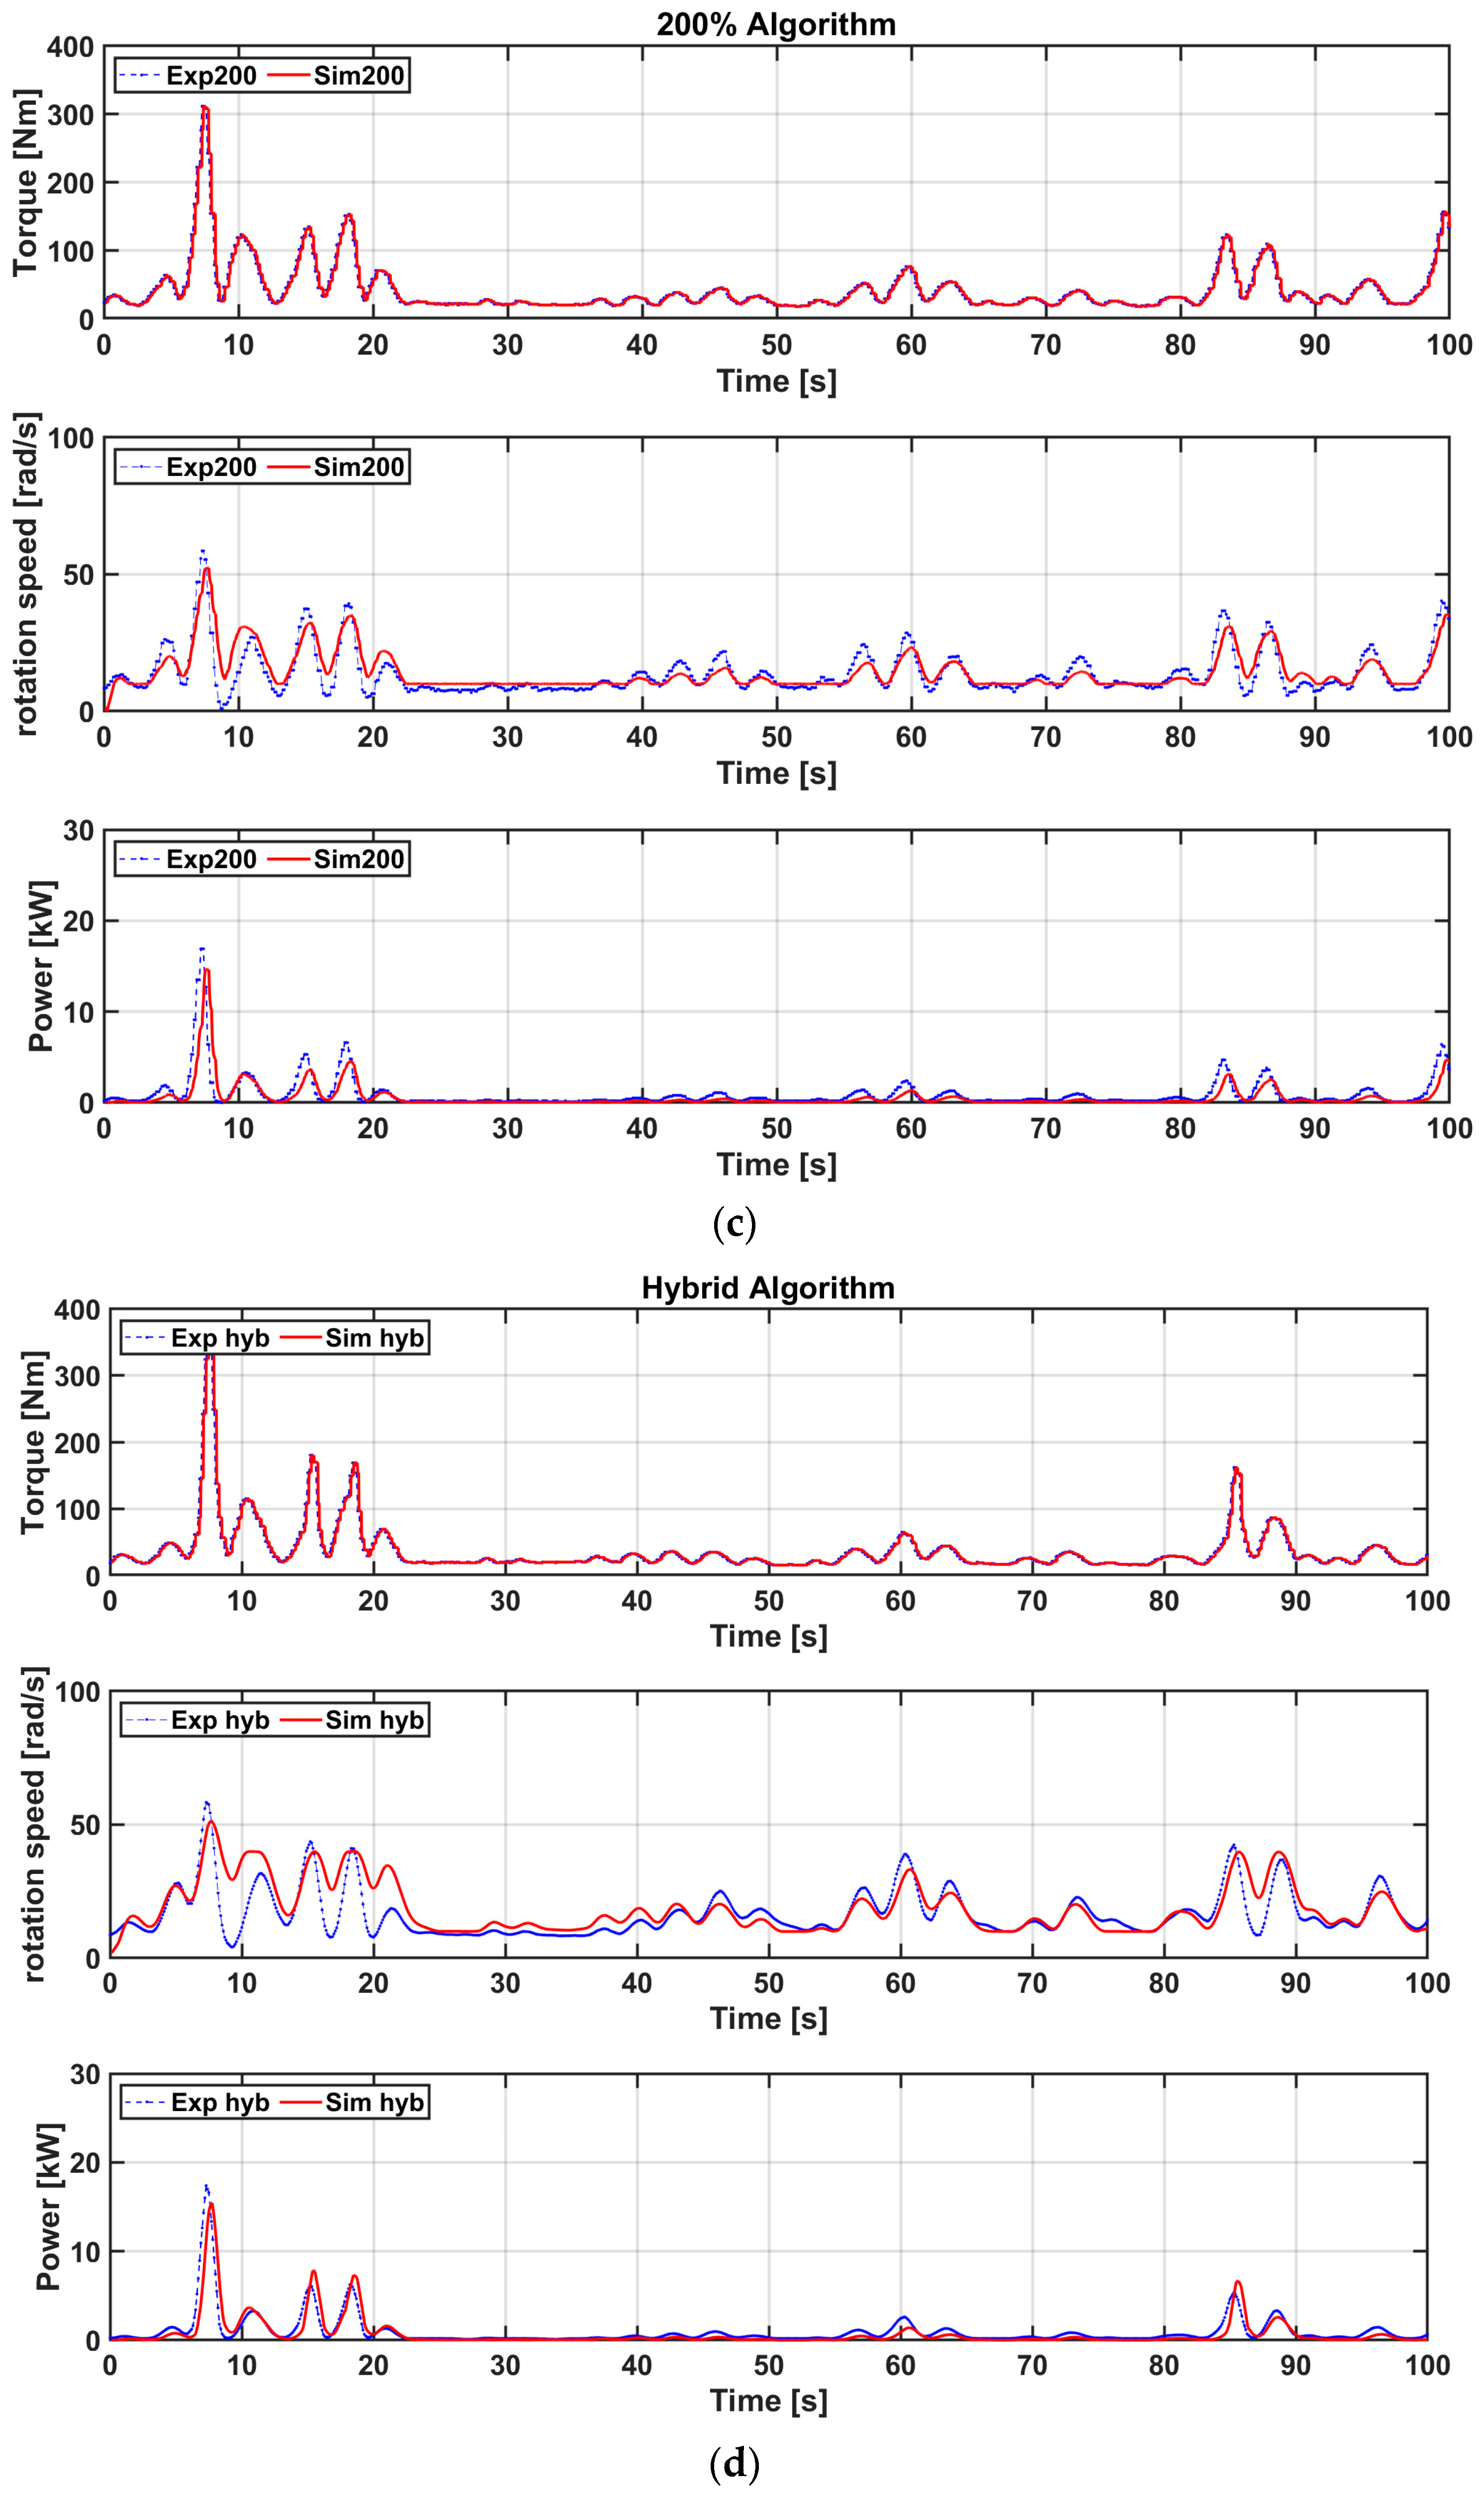
3.1. Algorithm Performance in Increase/Decrease in Torque Coefficient (70/200%)

As with the conventional control method of an oscillating-water-column-type wave energy converter, the optimal torque coefficient for maximizing the efficiency of the turbine is calculated using Equation (10). However, to overcome the variability of irregular waves and the wave energy characteristic with a high average-to-peak ratio, this study verifies the algorithm performance according to the change in the torque coefficient, not the optimal torque coefficient, as shown in Equation (11). The performance of each algorithm is compared through an analysis of the PTO system characteristics and power generation performance.
The analysis was performed according to the increase or decrease in the torque coefficient [19]. First, when the torque coefficient is lower than the optimal torque coefficient, the RPM moves within a larger range, because the electrical load is small compared to the input energy. That is, because the electrical load is smaller than the incoming energy, the RPM increases to the same extent as the remaining energy. This indicates that when the torque coefficient is smaller than its optimum, the variability in the RPM increases further. Because the RPM increases above the optimal torque coefficient control, the amount of power generation may increase slightly, while the variability and average-to-peak ratio increase further.
Furthermore, when the torque coefficient is larger than its optimum, the RPM decreases compared to the optimal torque control, because the electrical load is larger than the input energy. Because the electric torque is largely applied when the input energy is low, the RPM cannot be increased. That is, when the variability in RPM decreases, the variability and average-to-peak ratio of irregular waves decrease. However, in terms of the average power generation, the quantity of power generated decreases due to the reduction in the efficiency of the turbine compared to the conventional method using the optimal torque coefficient.
Based on Equations (10) and (11), the electrical reference torque can be calculated according to the increase or decrease in the torque coefficient as follows:
T e , 70 = 0.7 × k o p t × ω m 2
T e , 200 = 2 × k o p t × ω m 2

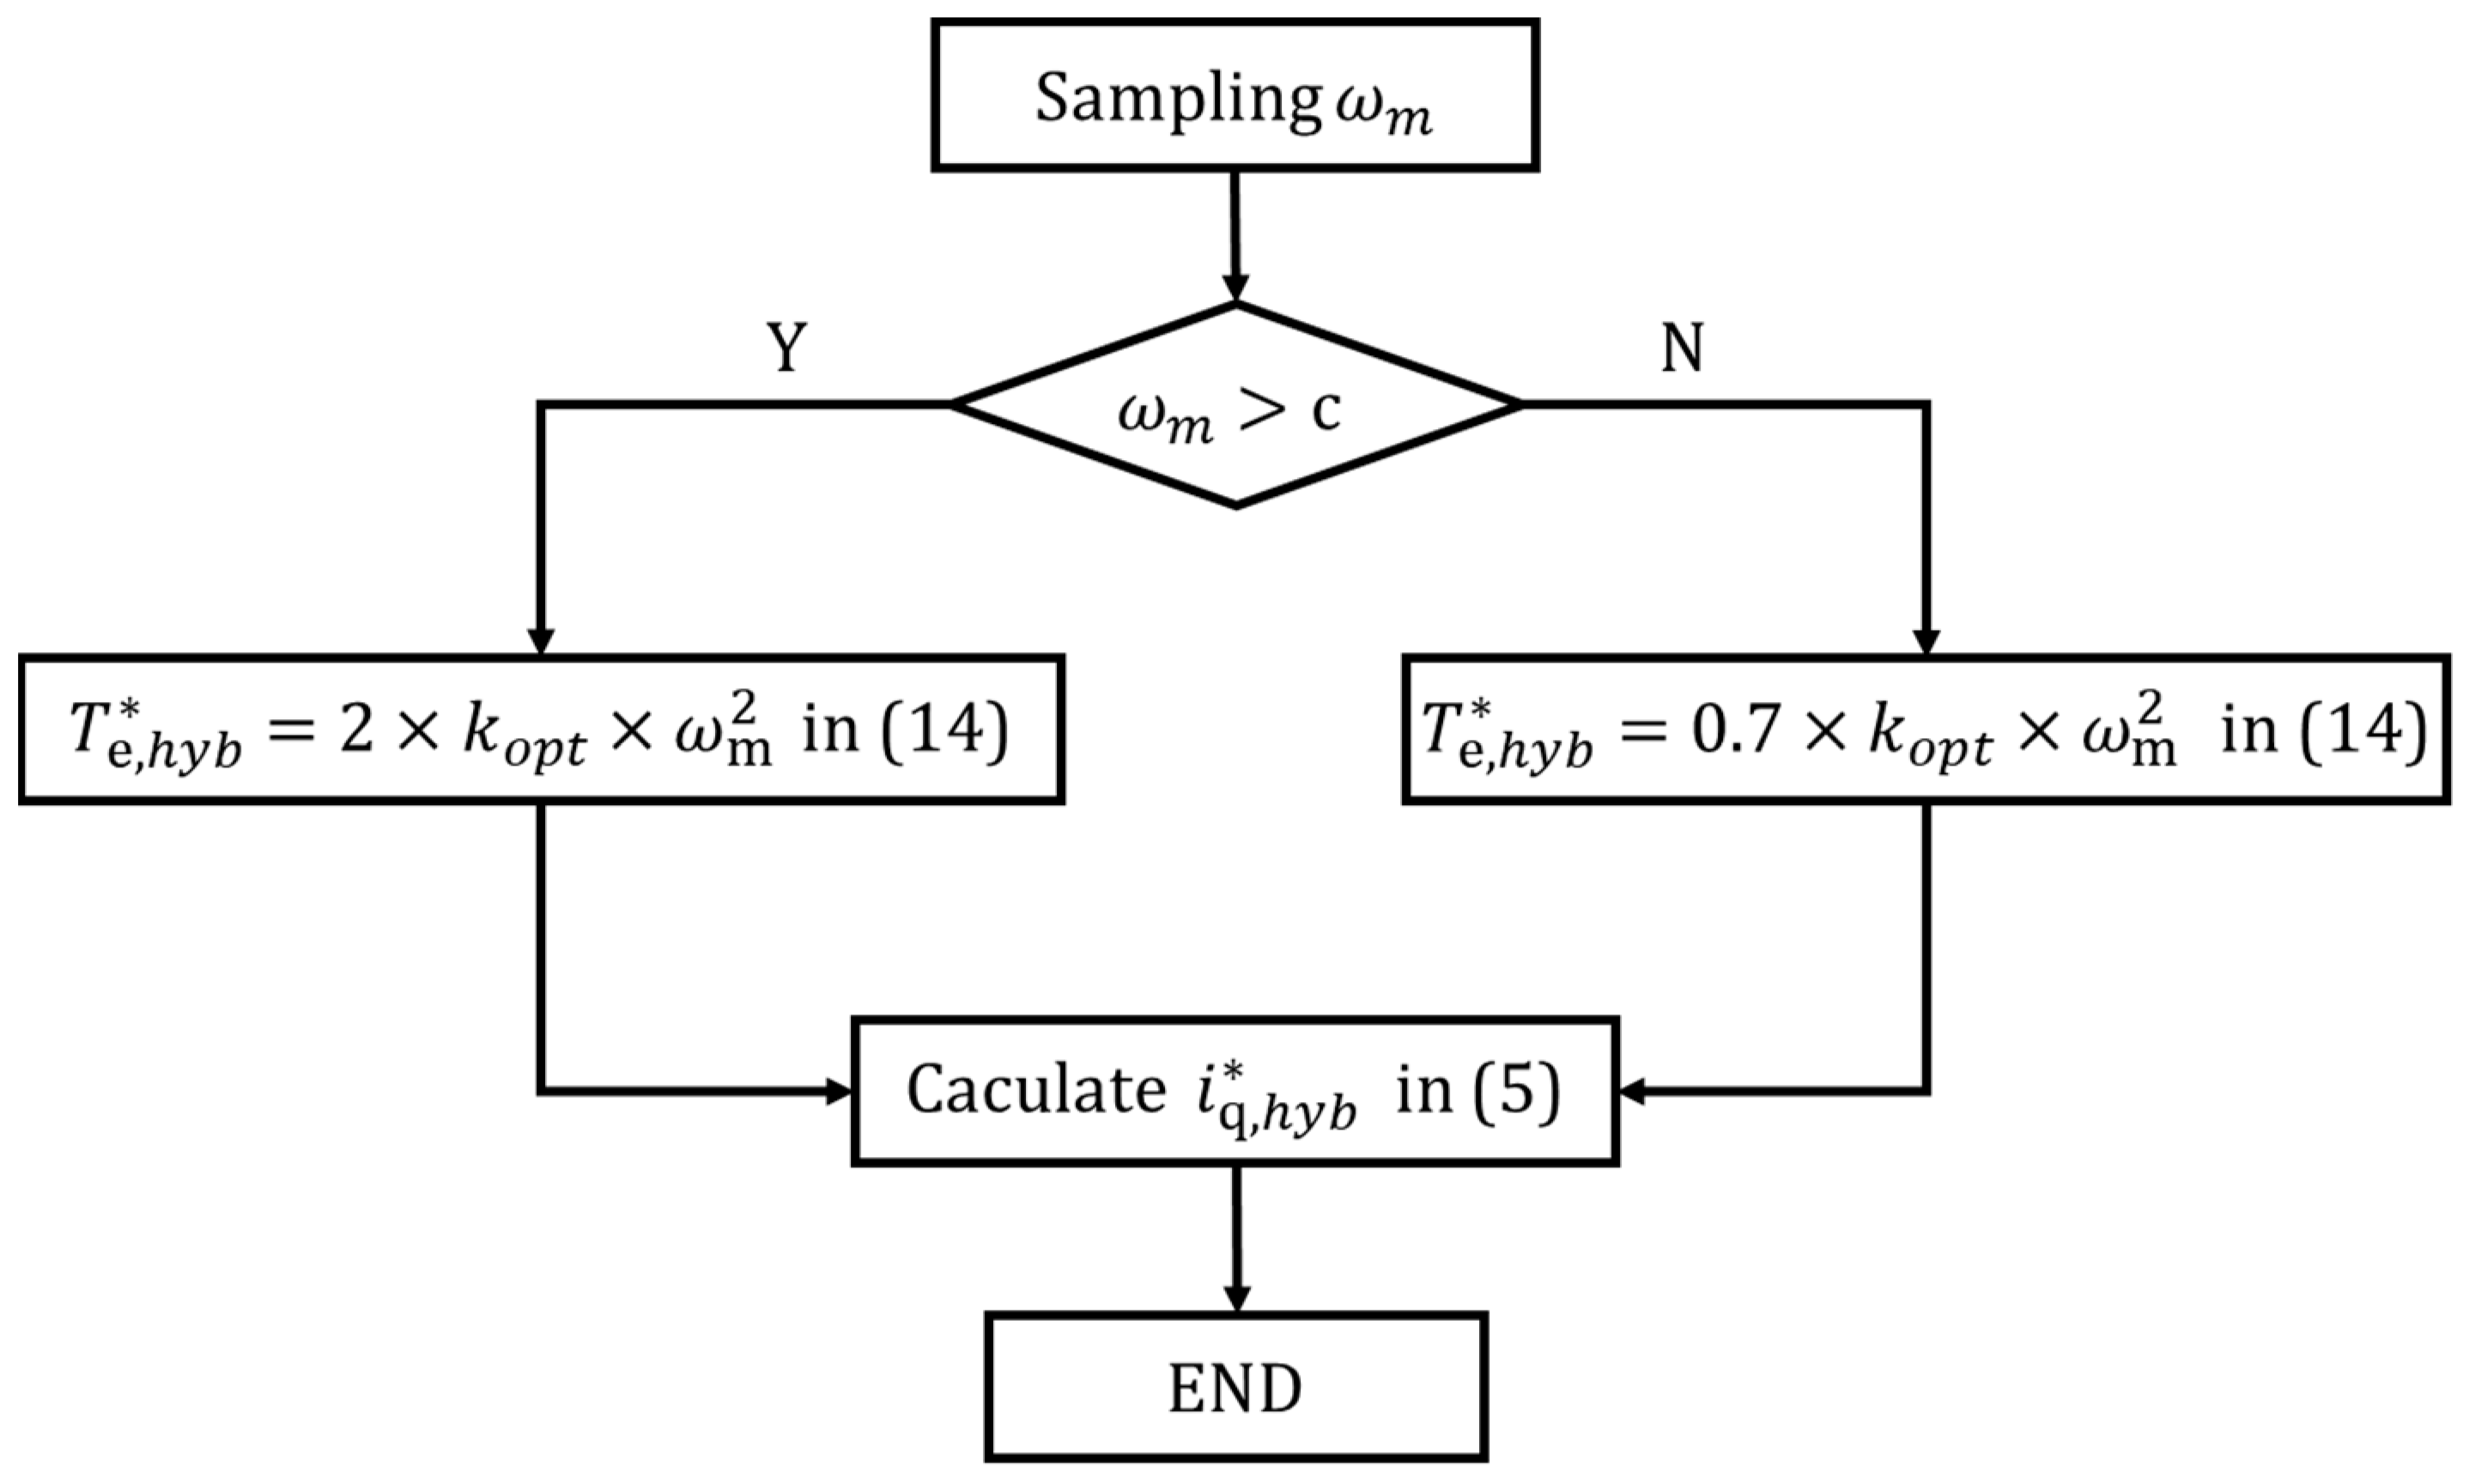
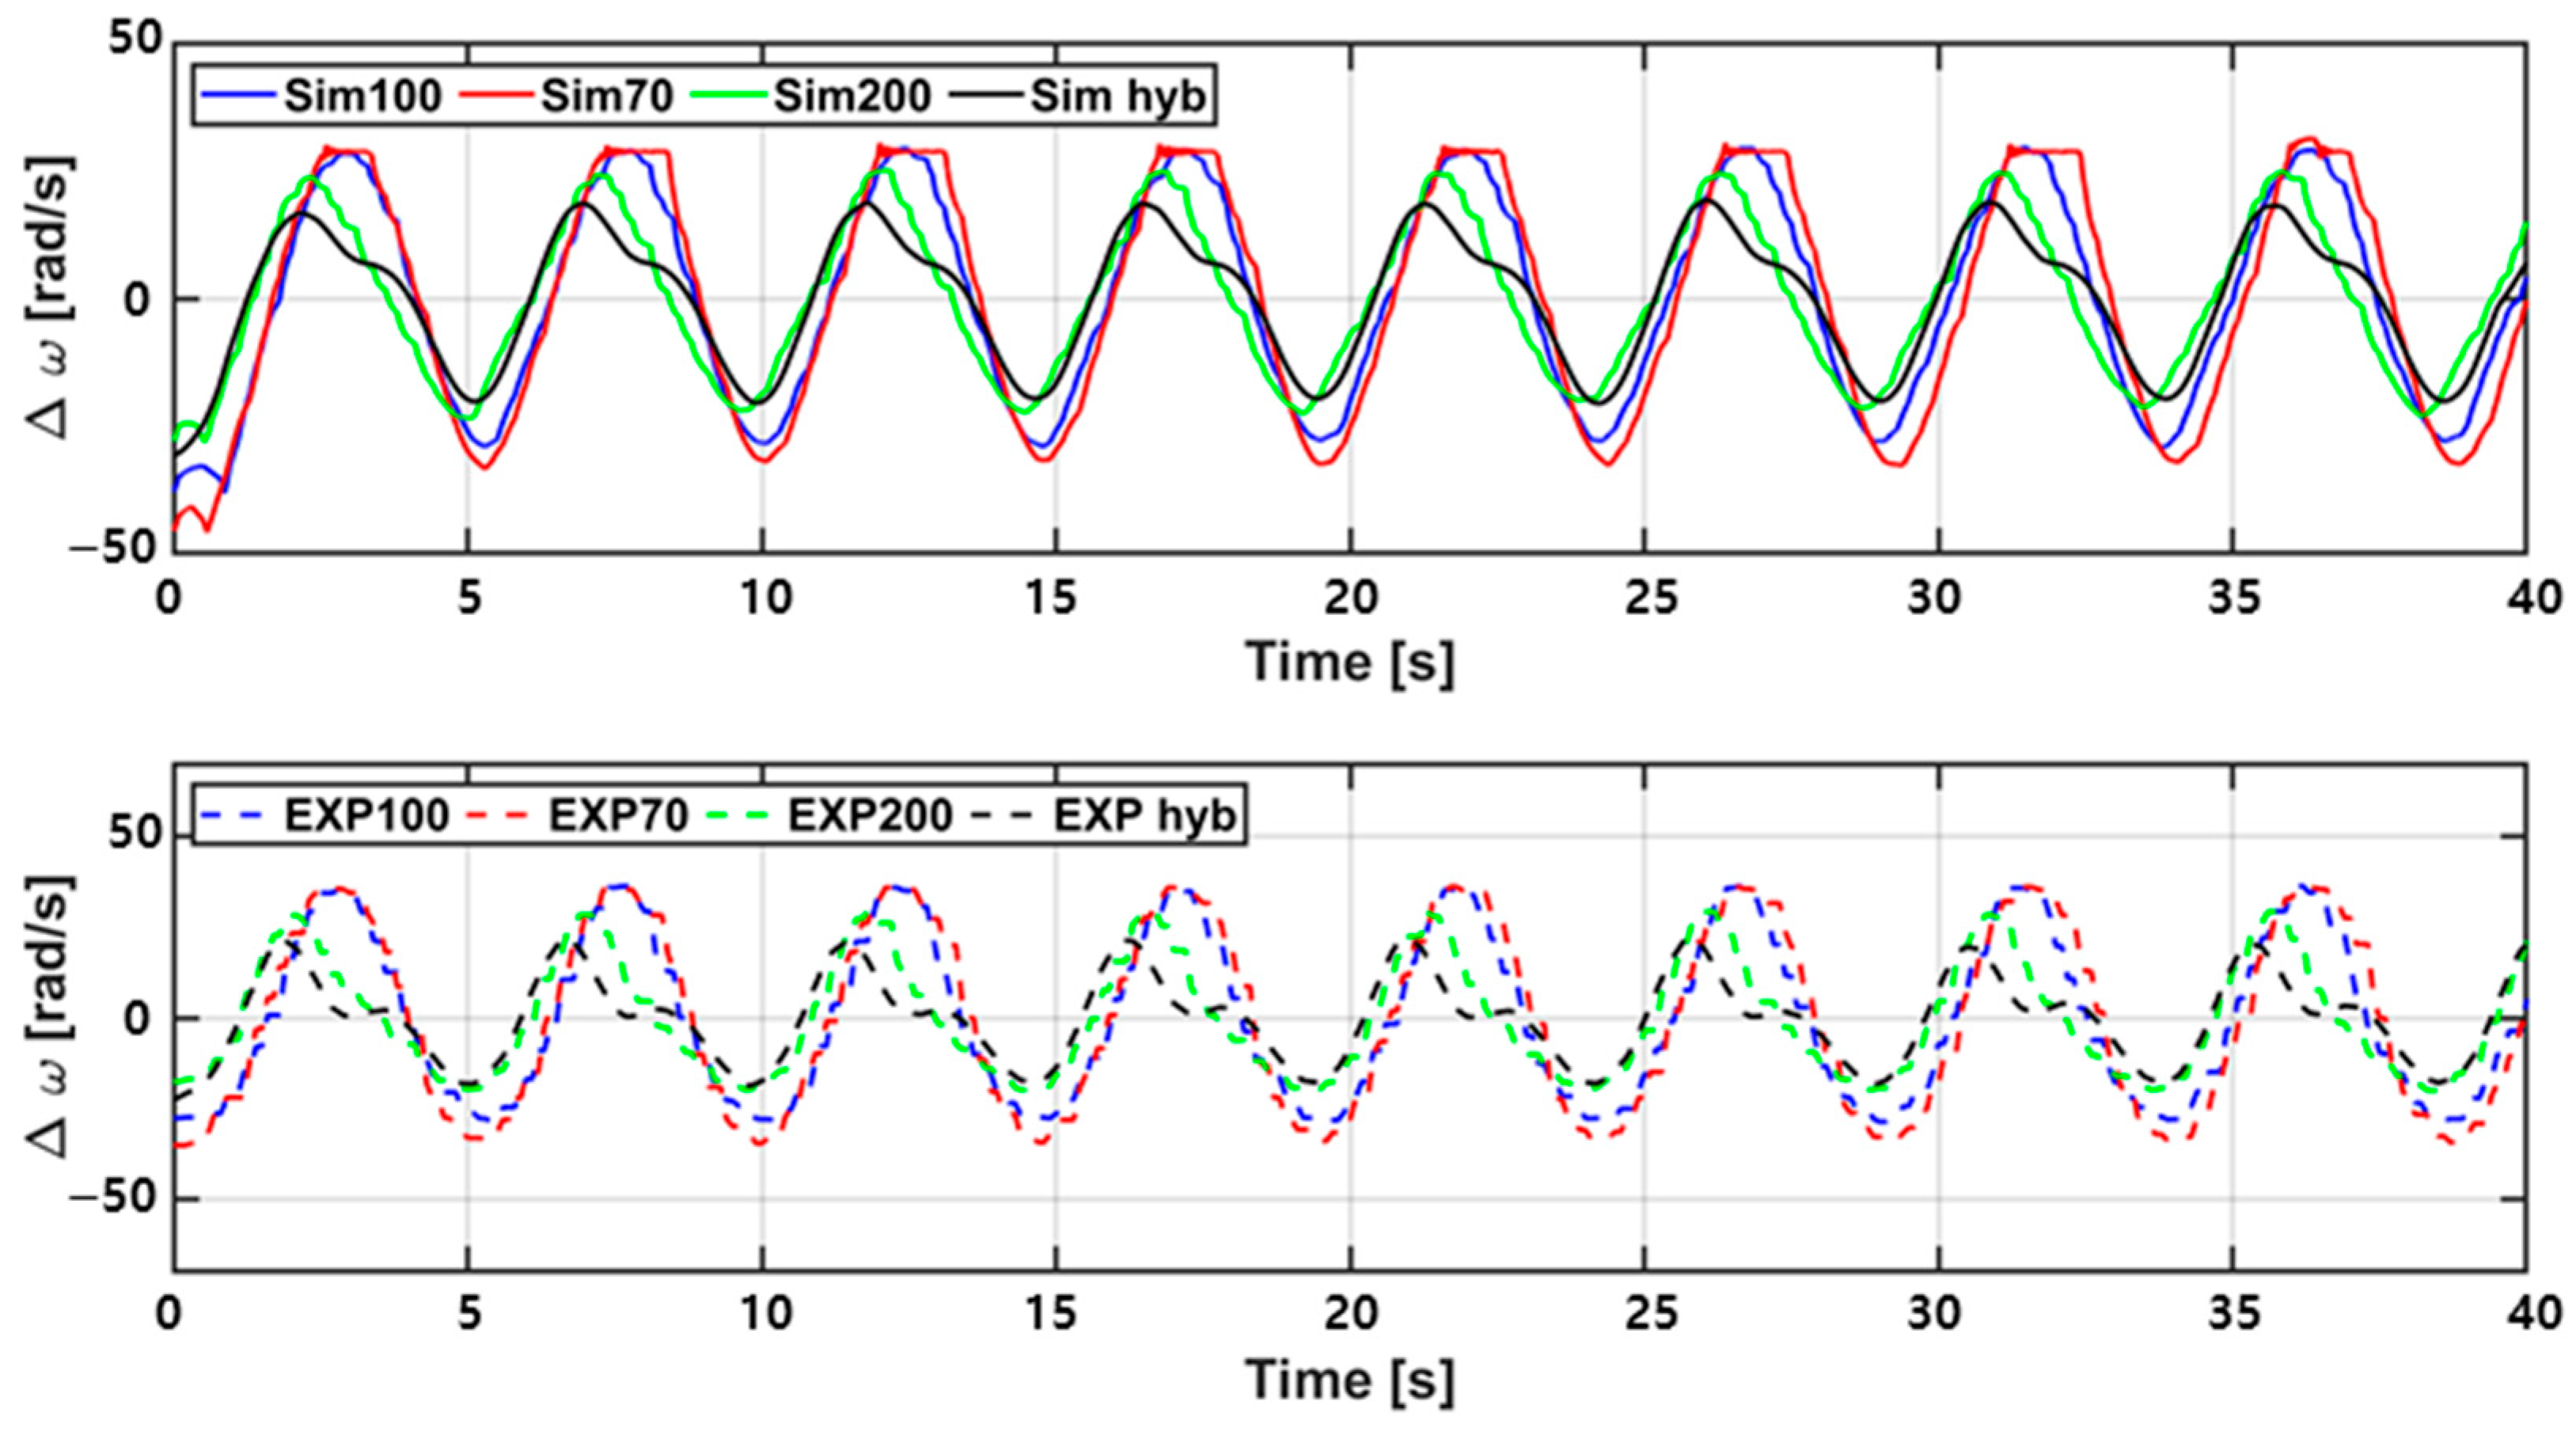
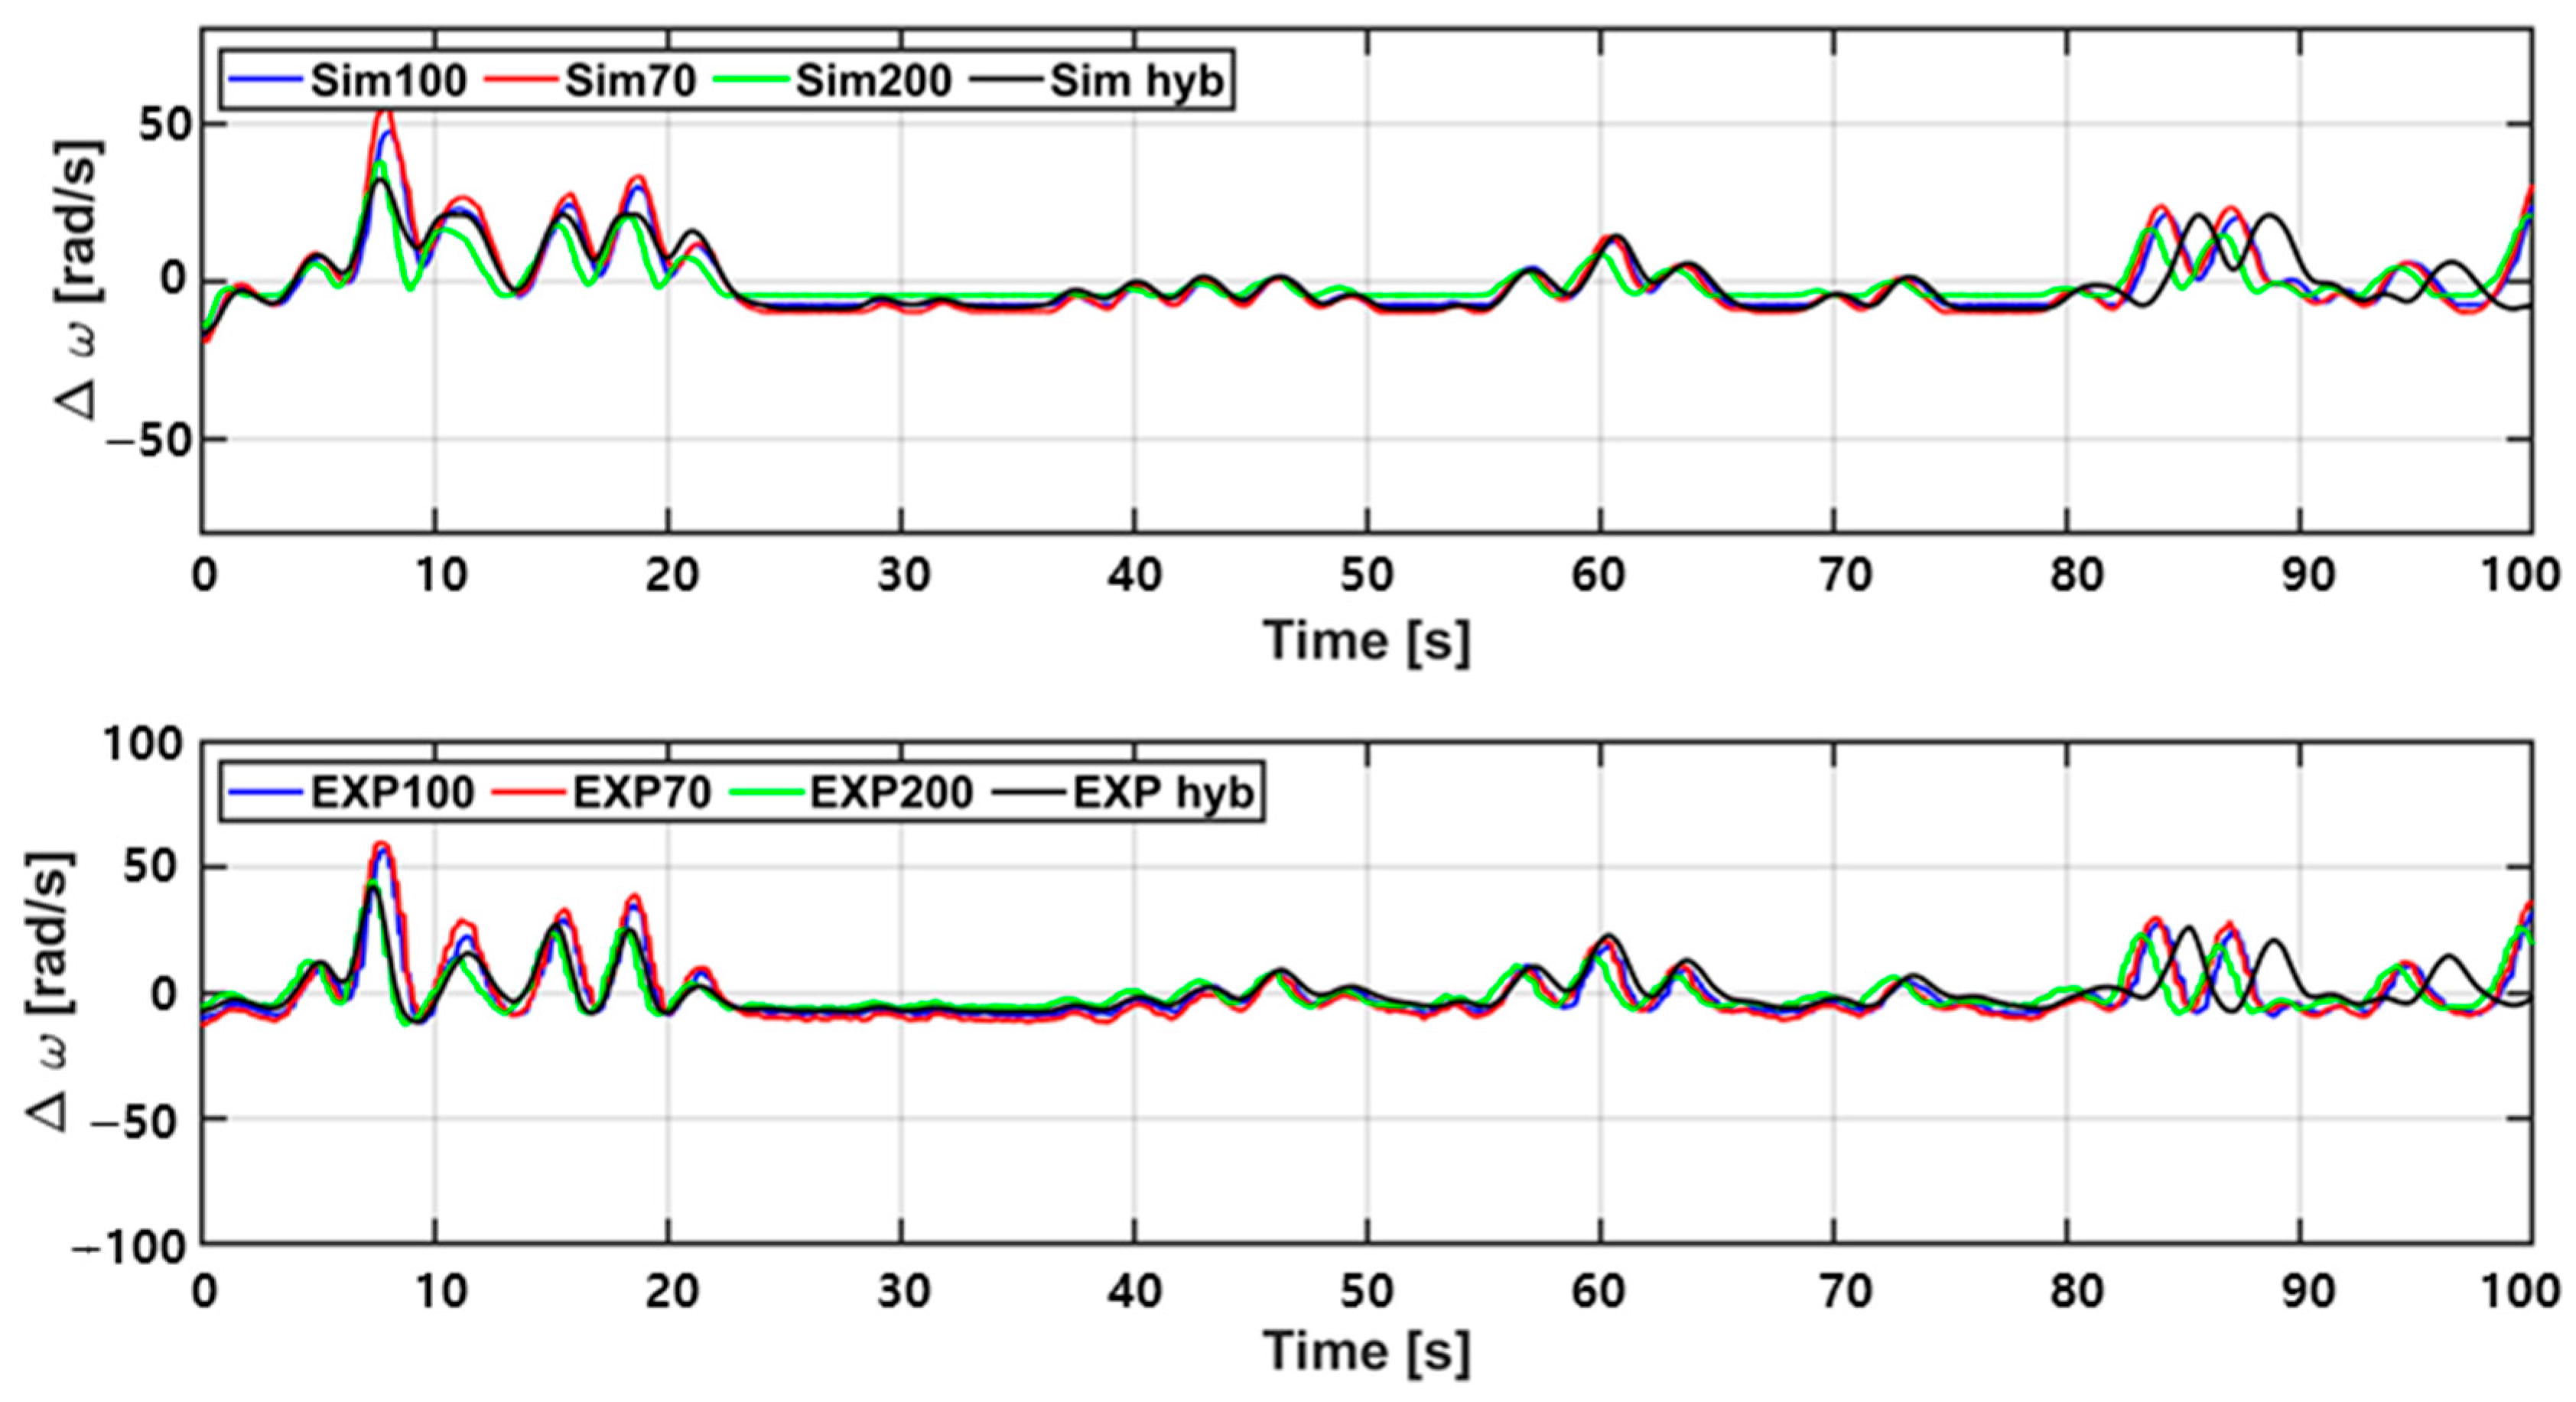
3.2. Hybrid Control Method to Reduce Turbine Angular Velocity Variation

Figure 8 shows a flowchart of the proposed hybrid torque control. As described above, the characteristics of the PTO system as well as the power generation characteristics change according to the change in the torque coefficient. Decreasing the torque coefficient increases the variability in the RPM, while increasing it decreases the variability in the RPM. However, if the torque coefficient is increased to reduce the variability in the RPM, the RPM cannot be increased, and the amount of power generated decreases as well. Therefore, the characteristics of the PTO system are analyzed by applying the hybrid method, which reduces the torque coefficient to increase the RPM in the low-energy section and increases the load in the high-RPM section, thereby reducing the variability in the RPM. The electrical reference torque of the hybrid method is calculated as follows:
ω m C ,       T e , h y b = 0.7 × k o p t × ω m 2 ω m > C ,       T e , h y b = 2 × k o p t × ω m 2
Here, C is the turbine angular velocity value that changes the torque coefficient and can be expressed as a constant value.
As shown in Figure 9, the hybrid method increases the RPM by reducing the electrical torque to a value lower than the input energy in the low-RPM section ( ω m C ) and decreases the RPM by increasing the electrical torque in the high-RPM section ( ω m > C ). For example, when the input flow velocity changes from 10 to 30 m/s, the electric power of the hybrid method changes from A to A*, as shown in Figure 6. That is, even if the input flow rate changes significantly, it is confirmed that the change in the RPM is not large in the hybrid method. The conventional optimal method changes from B to B* under the same input condition, and the RPM changes more significantly than the hybrid method. Therefore, the hybrid method can overcome irregular wave variability an wave power generation characteristics with a higher average-to-peak ratio than the conventional method.
Figure 10 shows the turbine angular velocity and power generation performance according to each algorithm when the input flow velocity changes based on the previously analyzed contents. Conventional optimal torque control, torque coefficient increase and decrease control, and hybrid methods are applied to compare the PTO system characteristics and power generation performance under the same input conditions. To compare the performance of each control algorithm in detail, an analysis was performed assuming a steady state. The input flow rate was changed from 15 to 30 m/s and back to 15 m/s. As shown in Figure 10, the value of the turbine angular velocity decreases as the torque coefficient increases. This is because when the torque coefficient increases, the angular velocity of the turbine cannot increase due to the large load when the input energy is small. To overcome this, in this study, the hybrid method was applied to increase the angular velocity by decreasing the torque coefficient below a certain angular velocity and increasing the torque coefficient above the constant angular velocity to prevent its increase.
In conclusion, the hybrid method is the same as the case where the torque coefficient decreases when the input energy is small as well as the case where the torque coefficient increases when the input energy is large. As shown in Figure 8, the hybrid method achieved the lowest RPM variability. However, because the RPM cannot be increased, the amount of power generation decreases slightly compared to the optimal control method.

4. Results

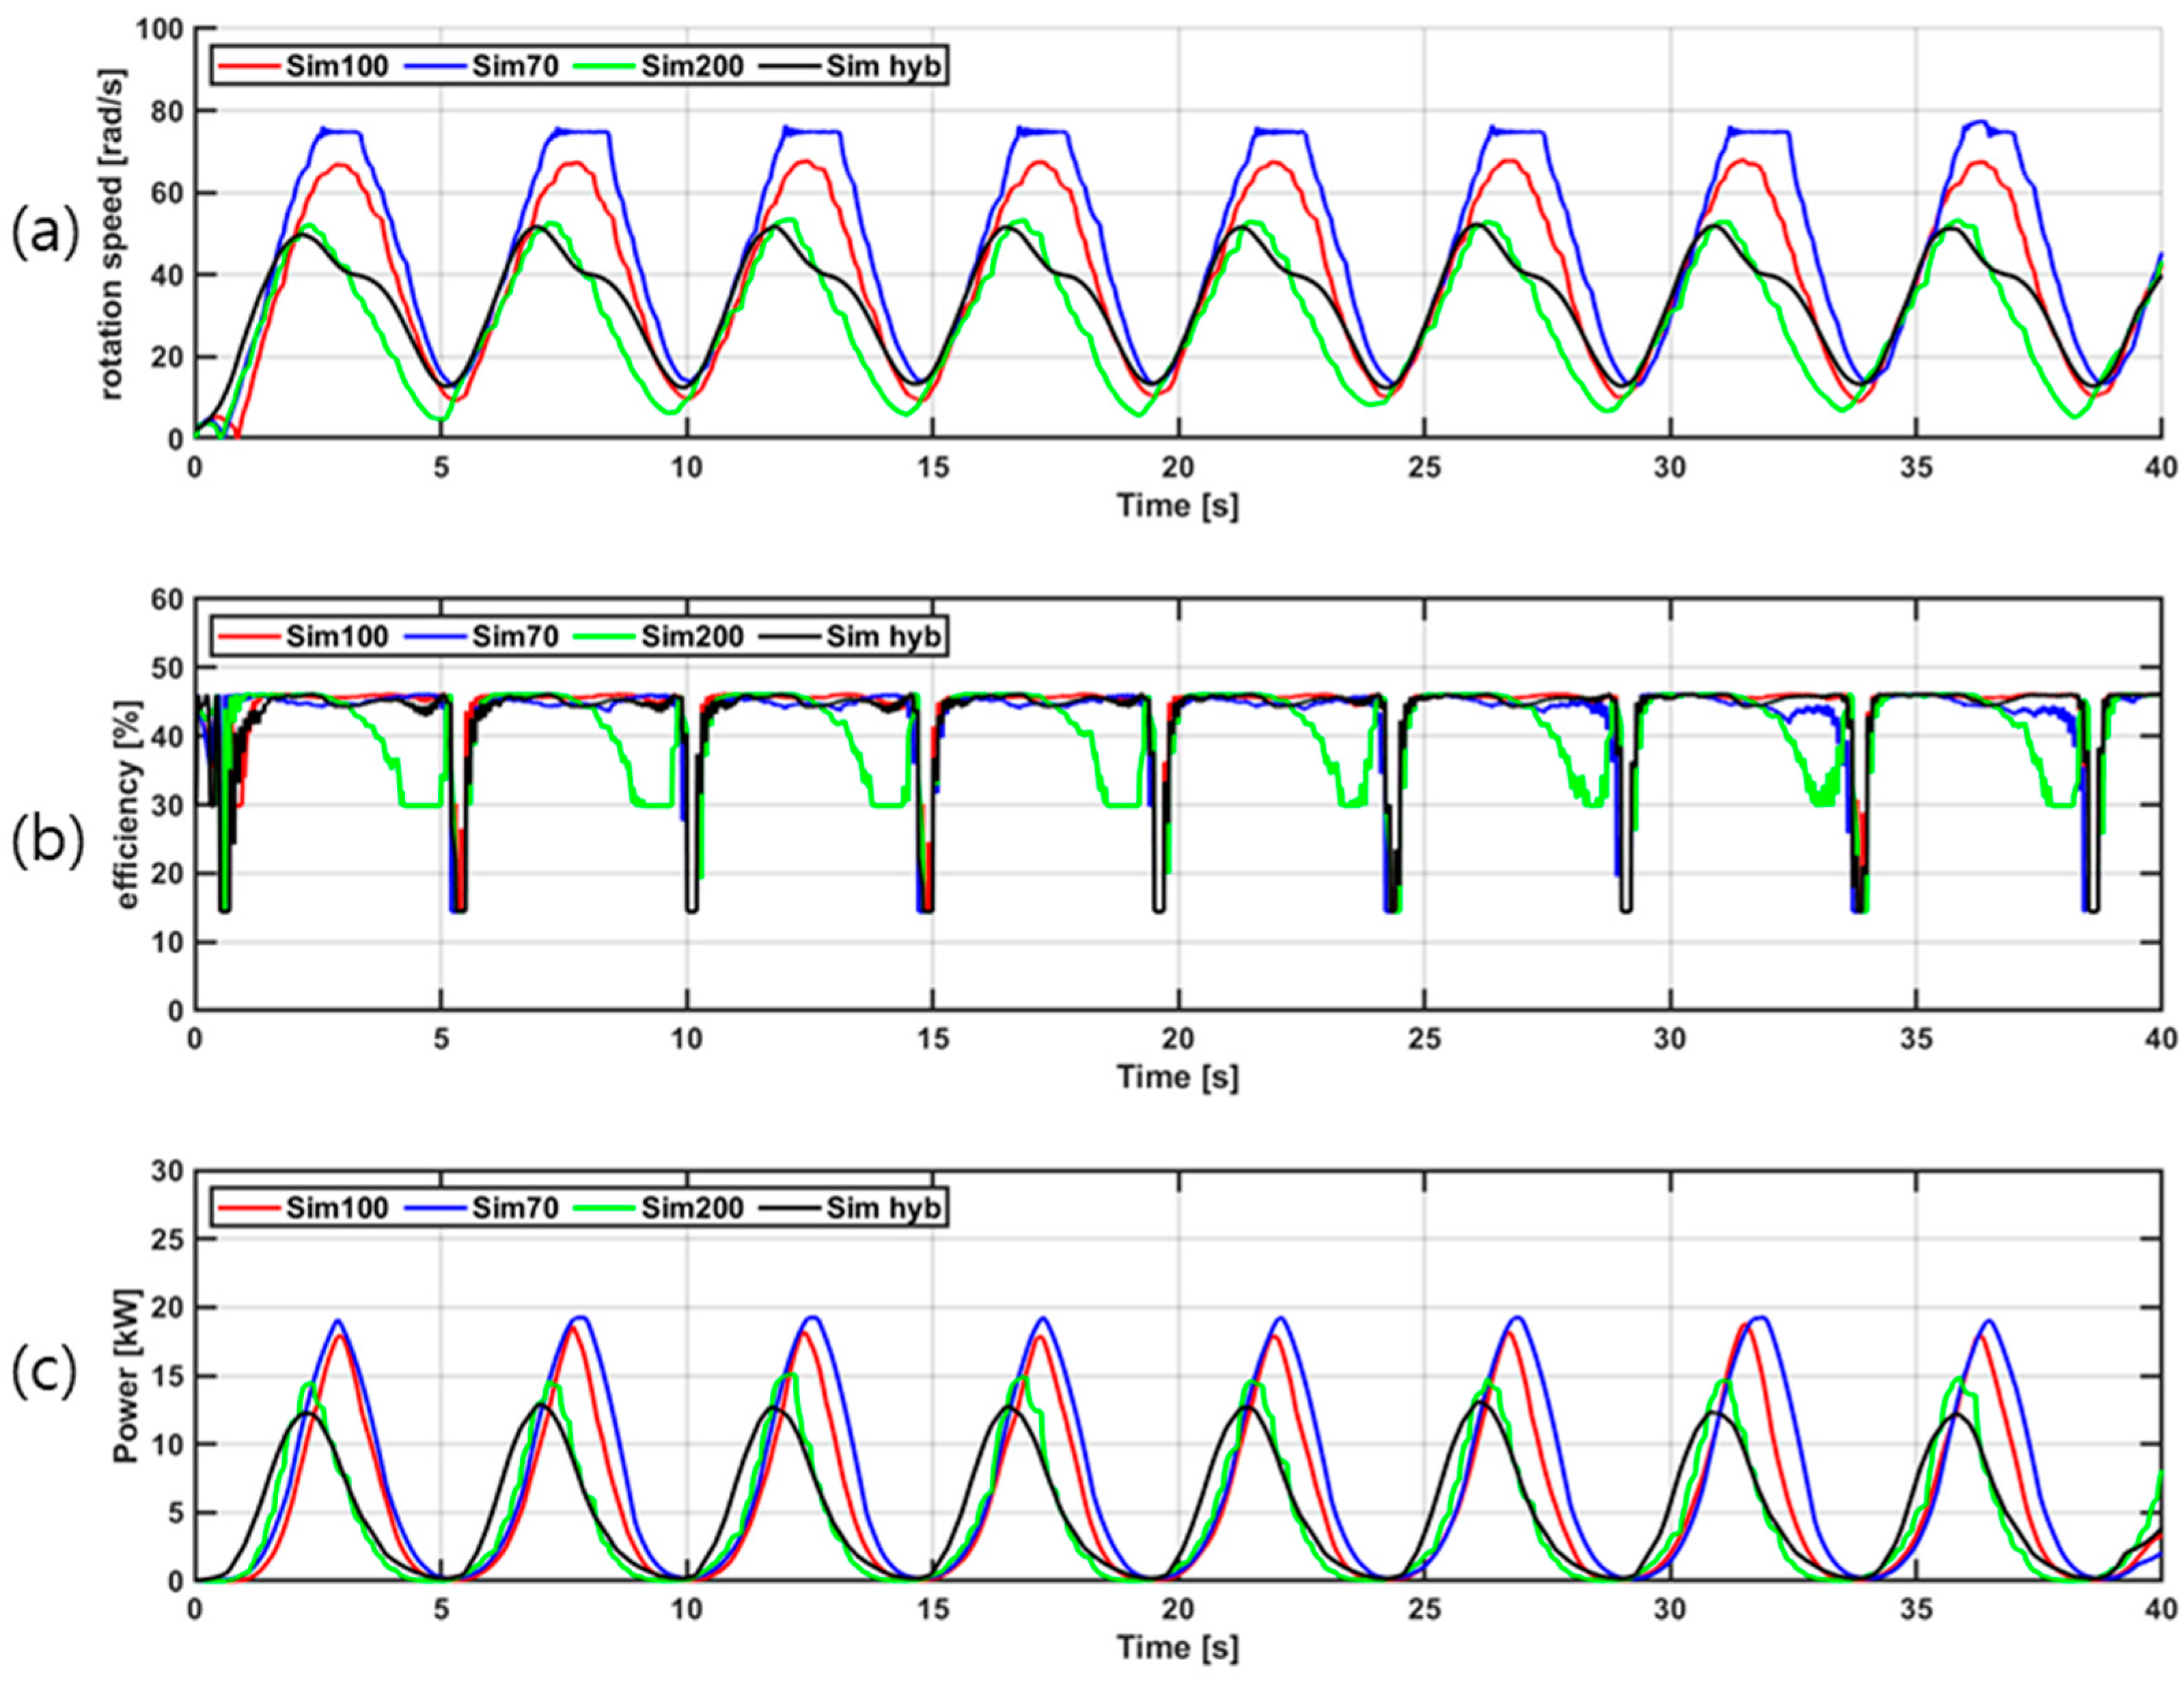
4.1. Analysis of Algorithm Characteristics under Regular Wave Conditions

The OWC PTO system was analyzed according to each algorithm under the same regular wave input condition. As mentioned above, this study used the turbine flow velocity as a regular wave input condition, because the hydrodynamic simulation was not conducted for the oscillating-column-type chamber. The experiment was conducted using the experimental apparatus described above, based on the torque of the turbine calculated in the simulation. A slight difference may occur because the physical properties of the experimental apparatus cannot be accurately simulated in the simulation; however, it is confirmed that the characteristics and power generation performance of the PTO system are almost similar to those of the simulation under the same torque conditions. The performance of each algorithm was compared using both simulations and experiments.
Figure 11 shows the characteristics and power generation performance results of the OWC PTO system according to each algorithm under regular wave conditions. The simulation and experimental results were compared with the results of each algorithm under the same conditions.
As shown in Figure 11a, there is a limit to lowering the variability in regular waves and the average-to-peak ratio, because the optimal control is the maximum power control to maximize the efficiency of the turbine. Therefore, as shown in Figure 11b,c, the analysis was conducted for the cases where the torque coefficient of the optimal control was small or large.
As shown in Figure 11b, when the torque coefficient is decreased, the variability in the RPM becomes larger than the optimal control, and accordingly, the amount of power generation increases slightly. As the RPM increases, the turbine’s flow coefficient decreases, and the efficiency may be slightly reduced; however, the amount of power generated is slightly higher due to the increase in RPM rather than due to the decrease in efficiency. As the variability in the RPM increases further, the operation becomes more difficult due to the characteristics of the OWC.
If the torque coefficient is increased, as shown in Figure 11c, the variability in the RPM becomes smaller than the optimal control, contrary to the previous result, and the amount of power generated by the decrease in RPM decreases as well. This is because a large load is applied at low energy such that the RPM cannot be increased, and consequently the amount of power generation decreases as well.
In the hybrid control method, as shown in Figure 11d, the RPM was increased by decreasing the electric torque in the low-energy section, and the electric torque increased considerably in the high-energy section to prevent a rise in the RPM. Because the RPM fluctuates only near the section where the torque coefficient changes, the algorithm reduces the regular wave variability and average-to-peak ratio due to the nature of wave energy. Furthermore, the amount of power generation was increased by increasing the average value of RPM, rather than by continuously increasing the torque coefficient, as shown in Figure 11c.
Figure 12 shows the angular velocity variability of the turbine according to each algorithm. The angular velocity variability of the turbine is defined as the present turbine velocity minus the average turbine velocity.
ω m = ω m ω m , a v g
The power extraction efficiency ratio (PEER) is defined as the ratio of the average power and peak power, and it is given as follows:
P E E R % = P a v g P p e a k × 100 .
Figure 13 shows the PEER according to each algorithm under regular wave conditions. When the PEER is high, the ratio of the average power to the maximum power increases, yielding a stable power generation performance.
In the case where the torque coefficient was reduced, the angular velocity fluctuation of the turbine changed past the optimal control, because an electric torque smaller than the input energy was applied. The average power generated can increase; however, the maximum power generated with respect to the variability in the angular velocity increases as well, such that the value of the PEER is lower than the optimal control. As the torque factor increases, the angular velocity of the turbine decreases, and the maximum power decreases as the electrical torque is consistently larger than the input energy. However, because a large load is applied consistently, the average power decreases as well, and the PEER value decreases beyond the optimal control. The PEER attains the highest value in the proposed hybrid method, which changes the torque coefficient according to the angular velocity section of the turbine. This is because the angular velocity of the turbine moves only in the section where the torque coefficient is changed; hence, the average power generation is slightly reduced compared to the optimum control; however, the PEER value is increased by significantly reducing the peak power.
Figure 14 shows the turbine angular velocity, efficiency characteristics, and output power generation performance according to each algorithm under regular wave conditions. The variability in the turbine angular velocity changes according to the change in the optimal control and torque coefficient. Figure 12 shows that as the torque coefficient decreases, the variability in the RPM increases (and vice versa), and the power generated according to the increase in RPM increases.
As shown in Figure 6, when the torque coefficient is small under the same flow rate input condition, the part where the input energy and output energy converge is higher than the optimal control. On the contrary, as the torque coefficient increases, the variability in the RPM decreases, and the flow coefficient increases according to Equation (7), thereby reducing the efficiency of the turbine system. Consequently, the amount of power generated also decreases. Figure 8 shows that the part where the input and output energy converge under the same flow velocity input condition exists in the lower section.
Furthermore, variations in the RPM of the hybrid control were small, whereas the average RPM was higher than that of the 200% algorithm with a large torque coefficient; thus, the efficiency of the turbine system increased as the flow coefficient came closer to the optimal flow coefficient than in the case with a large torque coefficient. Moreover, because the load applied is low in the section with low energy, the RPM increases along with the power generated.
Overall, the output power generation performance is shown to be in the order of the 70% algorithm, optimal control algorithm, hybrid algorithm, and 200% algorithm, and the specific output power generation is summarized in Table 1.

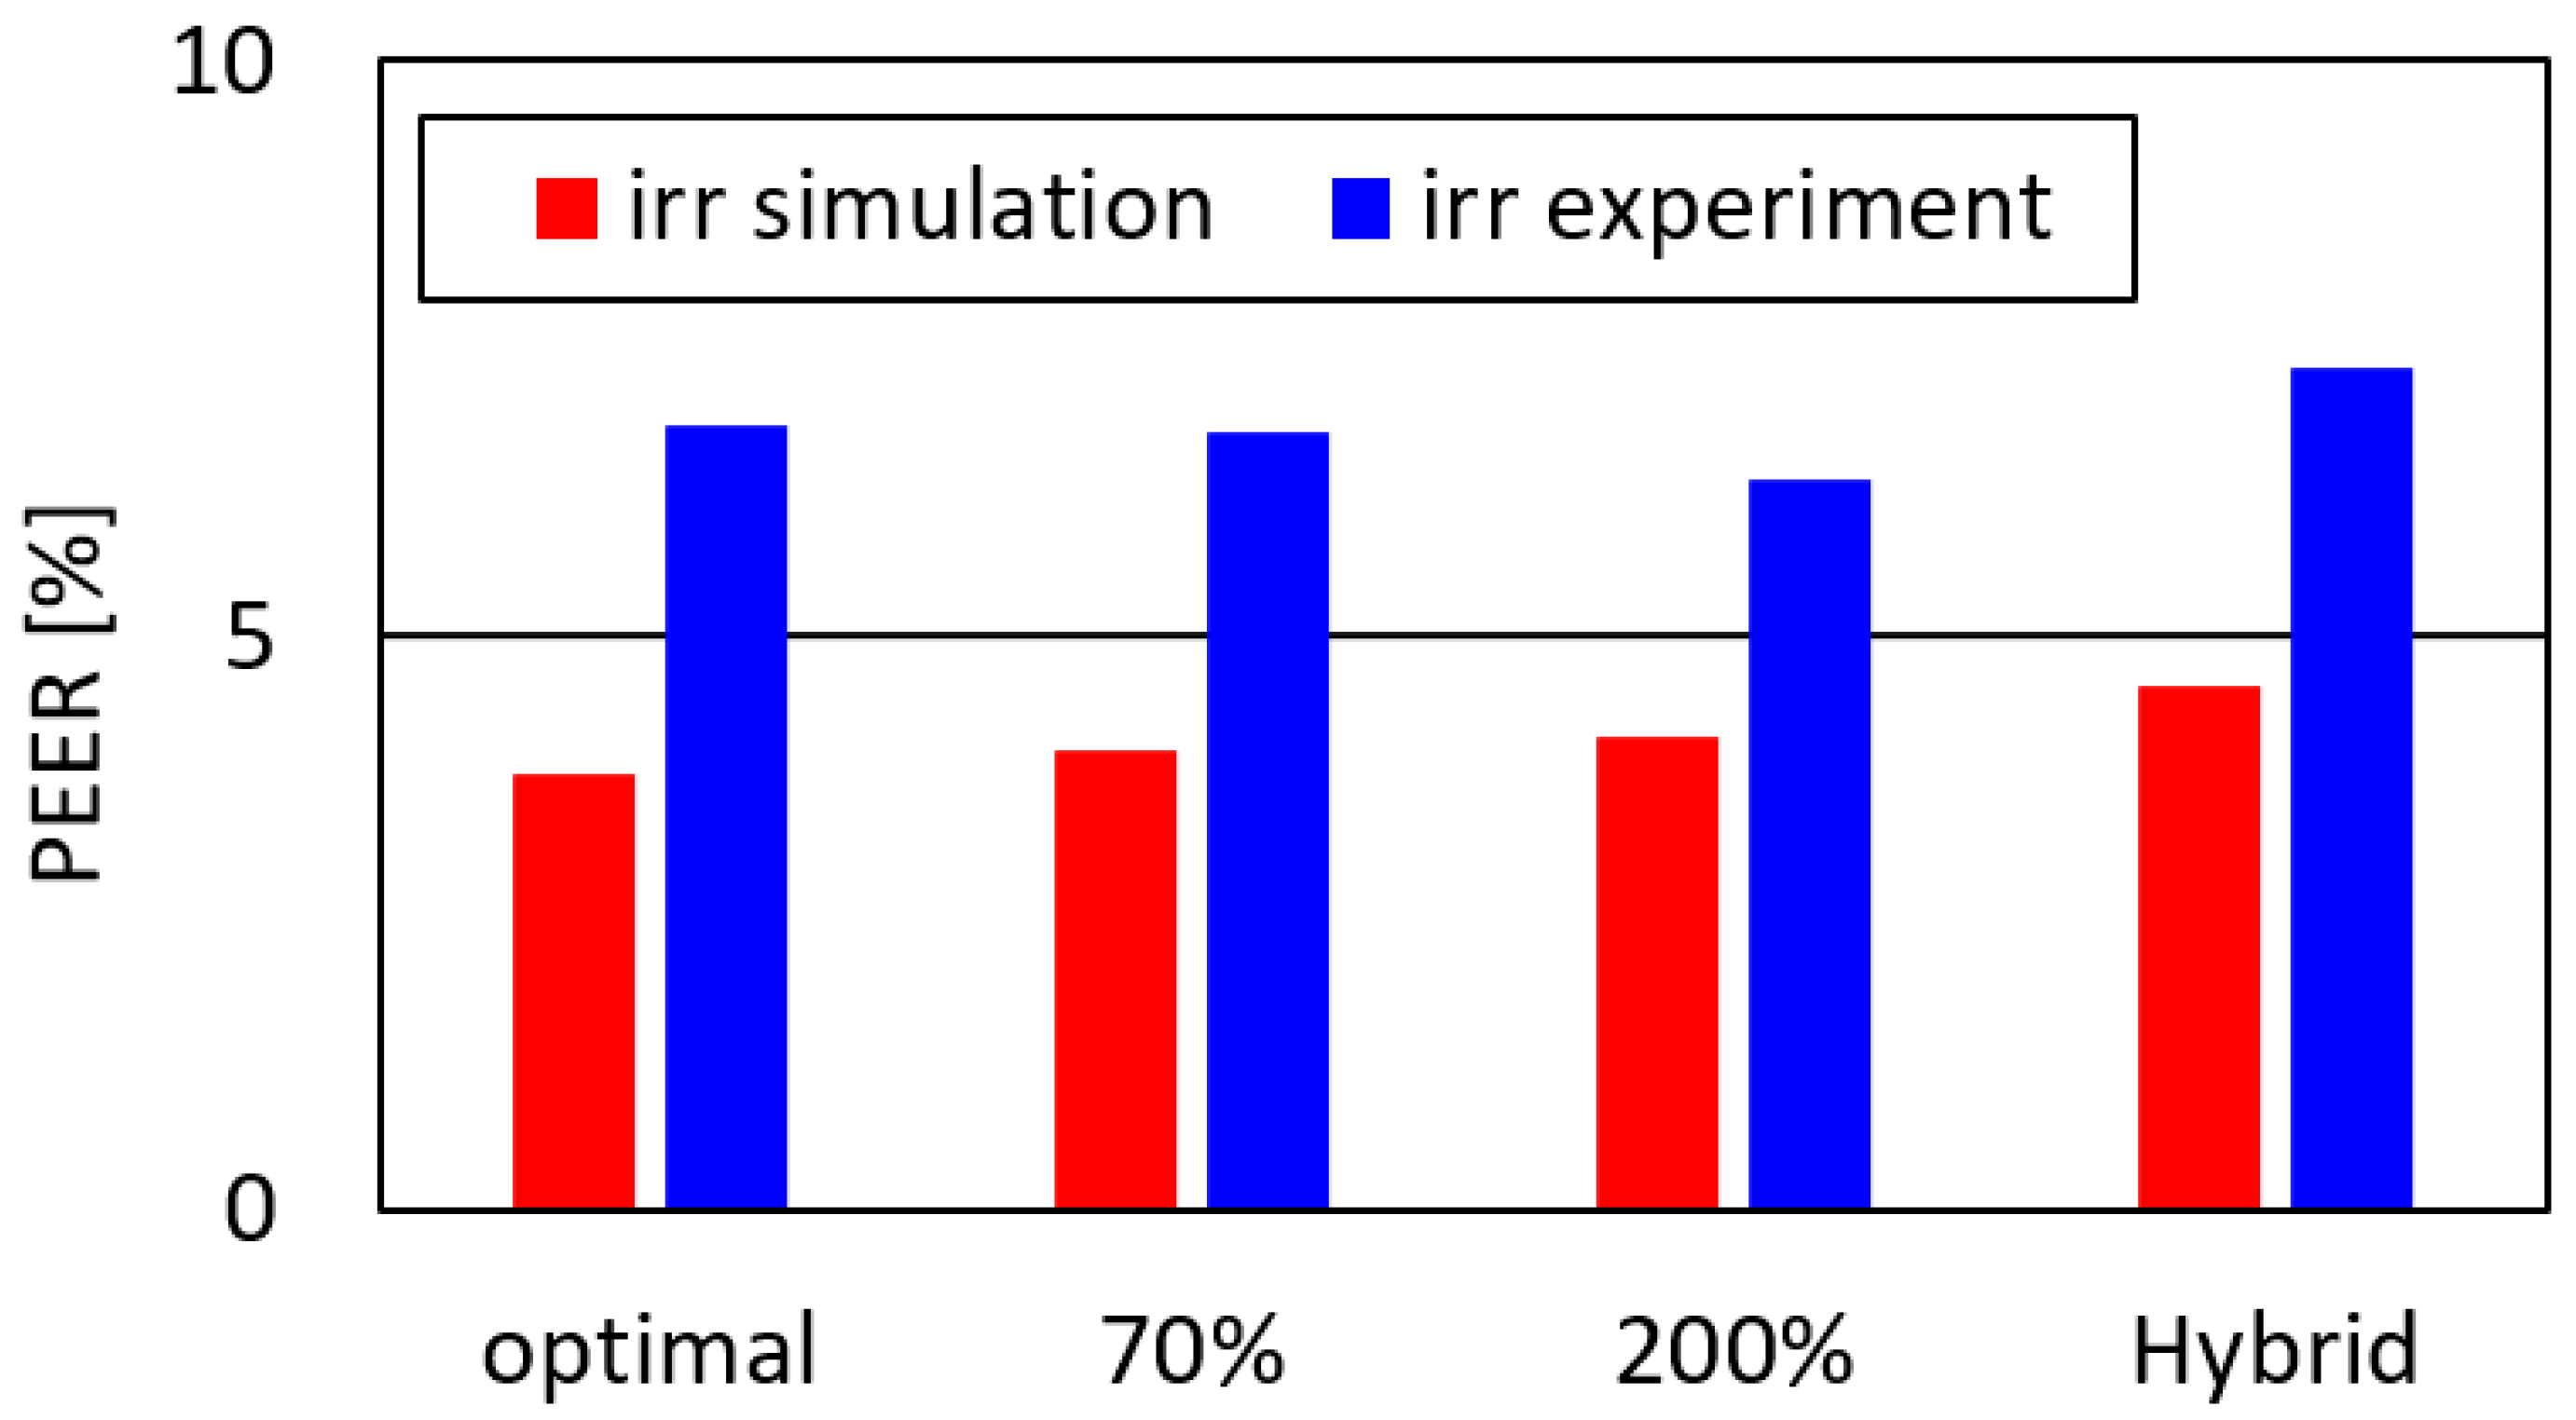
4.2. Analysis of Algorithm Characteristics under Irregular Wave Conditions

The OWC PTO system was analyzed according to the algorithm characteristics under the same irregular wave input condition. Similar to the regular wave result, the irregular wave result was used as the input condition for the irregular wave, because the hydrodynamic simulation was not performed. The experiment was conducted using the torque of the turbine calculated in the simulation, and the simulation and experimental results were compared with each other. Even under irregular wave conditions, the PTO system characteristics and power generation performance results were similar between the simulation and experimental results.
Figure 15 shows the characteristics and power generation performance results of an OWC PTO system for each algorithm under irregular wave conditions. For irregular wave conditions, the simulation and experimental results were compared under the same conditions for each algorithm.
Figure 15a shows that the optimal control condition is the same as for the regular wave condition; hence, the maximum power control is performed to maximize the efficiency of the turbine, and there is a limit to lowering the variability in irregular waves and the average-to-peak ratio. Therefore, the characteristics and power generation performance of the PTO system were analyzed according to the changes in the torque coefficient, not the optimal control.
Similar to the regular wave results, when the torque coefficient is reduced, as shown in Figure 15b, the variability in the RPM becomes larger than the optimal control, while the amount of power generation increases slightly. However, the variability in the RPM increases further, and the operation with irregular RPM becomes more difficult due to the characteristics of the OWC. In the same manner as the regular wave results, if the torque coefficient is increased, as shown in Figure 15c, the variability in RPM becomes smaller than the optimal control, contrary to the previous result, while the power generated decreases as well. This is because a large load operates at low energy and the RPM decreases; however, the amount of power generation is also reduced.
Therefore, in this study, hybrid control is used to change the torque coefficient according to the input energy. As with the regular wave result, the hybrid control shown in Figure 15d is an algorithm that can reduce the irregular wave variability and the average-to-peak ratio owing to the characteristics of wave power generation, because the RPM changes only in the section where the torque coefficient changes. Furthermore, the amount of power generation also increases, because the average value of RPM increases rather than continuously increasing the torque coefficient, as shown in Figure 15c.
Figure 16 shows the angular velocity variability of the turbine according to each algorithm under irregular wave conditions. The angular velocity variability of the turbine was calculated using Equation (10), similar to the regular wave conditions.
Figure 17 shows the PEER for each algorithm under irregular wave conditions. If the torque coefficient decreases as in the regular wave condition, the angular velocity variability of the turbine becomes larger than that of the conventional method, and the peak power increases, thereby decreasing the PEER. In contrast, as the torque coefficient increases, the angular velocity variability and the peak power decrease, while the average power decreases; consequently, the PEER decreases.
Furthermore, the proposed hybrid method, which changes the torque coefficient according to the angular velocity section of the turbine, moves the angular velocity of the turbine only in the section where the torque coefficient is changed; therefore, the angular velocity fluctuation is lowered, and the peak power is reduced. However, in the section where the input energy is low, because the load is small, the average turbine angular velocity increases, which increases the average power.
Figure 18 shows the angular velocity, efficiency characteristics, and output power generation performance of the turbine for each algorithm under irregular wave conditions. The variability in the RPM changes according to the conventional optimal control and the change in the torque coefficient. With regard to the regular wave results, when the torque coefficient decreases, the variability in RPM increases, and when the torque coefficient increases, the variability in RPM decreases. The efficiency of the turbine in the irregular wave conditions varies according to the algorithm, because the input flow velocity continuously changes. However, in the case of the 200% algorithm, because a large load operates at low energy, the RPM cannot be increased; therefore, the flow coefficient is relatively large compared to other algorithms, which confirms that the turbine efficiency is low. Accordingly, the output power generation performance is in the order of the 70% algorithm, the optimal control algorithm, the hybrid algorithm, and the 200% algorithm; the specific power generation amount is listed in Table 2.

5. Conclusions

We presented a control algorithm to overcome the variability in the PTO system occurring due to irregular wave energy. Further, we compared the performance of the conventional control methods and the proposed method with full-scale experimental results. The conventional optimal control method of the OWC applies control to obtain the maximum output power; hence, it may momentarily exceed the rated power according to the irregular input energy. As a result of operating the actual system, in order to solve the decrease in operation time due to changes in angular velocity, the proposed hybrid control technique reduces the variability in the turbine angular velocity of the PTO system by applying a small torque coefficient at low energy and a high torque coefficient at high energy according to the input energy. Although valve control can be used for rated control in high-energy sea conditions, we believe that the proposed method will reduce the angular velocity fluctuation of the turbine and secure the operating time of the OWC owing to the wave energy characteristics that change momentarily. Unlike conventional studies which only discuss existing control algorithms based on simulations [22], we have experimentally validated the results through a 30 kW full-scale electrical test device. The electrical test apparatus was driven by a vector inverter and induction motor system to simulate the mechanical torque of the turbine based on the aerodynamic simulation of the impulse turbine. By applying each algorithm, the characteristics and power generation performance of the PTO system were compared with each other through the current control of the AC/DC converter. Under the same input conditions, the proposed algorithm significantly reduced the variability in the turbine angular velocity compared to that achieved by the existing control method.
In future studies, it will be necessary to compare the performance of each algorithm when the air chamber, turbine system, and electric system are integrated after installation in a real sea area. Furthermore, the control stability of the proposed algorithm in cases where relief valves and high-speed stop valves are used needs to be confirmed by comparing the performance of each algorithm.

Author Contributions

Methodology, C.R.; Software, C.R.; Investigation, H.C.; Data curation, H.C.; Writing—original draft, H.C.; Writing—review & editing, C.R.; Supervision, C.R.; Project administration, C.R. All authors have read and agreed to the published version of the manuscript.

Funding

This research was supported by Basic Science Research Program through the National Research Foundation of Korea (NRF) funded by the Ministry of Education (No. RS-2022-00165789).

Conflicts of Interest

The authors declare no conflict of interest.

References

  1. Falnes, J. A review of wave-energy extraction. Mar. Struct. 2007, 20, 185–201. [Google Scholar] [CrossRef]
  2. Falcao, A.O. Wave energy utilization: A review of the technologies. Renew. Sustain. Energy Rev. 2010, 14, 899–918. [Google Scholar] [CrossRef]
  3. Ekstrom, R.; Ekergård, B.; Leijon, M. Electrical damping of linear generators for wave energy converters—A review. Renew. Sustain. Energy Rev. 2015, 42, 116–128. [Google Scholar] [CrossRef]
  4. Lopez, I.; Andreu, J.; Ceballos, S.; Martínez de Alegría, I.; Kortabarria, I. Review of wave energy technologies and the necessary power-equipment. Renew. Sustain. Energy Rev. 2013, 27, 413–434. [Google Scholar] [CrossRef]
  5. Lavidas, G. Selection index for wave energy deployments (SIWED): A near-deterministic index for wave energy converters. Energy 2020, 196, 117131. [Google Scholar] [CrossRef]
  6. Carrelhas, A.A.D.; Gato, L.M.C.; Henriques, J.C.C. Peak shaving control in OWC wave energy converts: From concept to implementation in the Mutriku wave power plant. Renew. Sustain. Energy Rev. 2023, 180, 113299. [Google Scholar] [CrossRef]
  7. Zhou, B.; Hu, J.; Jin, P.; Sun, K.; Li, Y.; Ning, D. Power performance and motion response of a floating wind platform and multiple heaving wave energy converters hybrid system. Energy 2023, 265, 126314. [Google Scholar] [CrossRef]
  8. Faedo, N.; Peña-Sanchez, Y.; Garcia-Violini, D.; Ferri, F.; Mattiazzo, G.; Ringwood, J.V. Experimental assessment and validation of energy-maximising moment-based optimal control for a prototype wave energy converter. Control Eng. Pract. 2023, 133, 105454. [Google Scholar] [CrossRef]
  9. Wang, L.; Isberg, J.; Tedeschi, E. Review of control strategies for wave energy conversion systems and their validation: The wave-to-wire approach. Renew. Sustain. Energy Rev. 2018, 81, 366–379. [Google Scholar] [CrossRef]
  10. Hong, Y.; Waters, R.; Bostrom, C.; Eriksson, M.; Engström, J.; Leijon, M. Review on electrical control strategies for wave energy converting systems. Renew. Sustain. Energy Rev. 2014, 31, 329–342. [Google Scholar] [CrossRef]
  11. Kurniawan, A.; Moan, T. Optimal geometries for wave absorbers oscillating about a fixed axis. IEEE J. Ocean Eng. 2013, 38, 117–130. [Google Scholar] [CrossRef]
  12. Shadman, M.; Estefen, S.F.; Rodriguez, C.A.; Nogueira, I.C.M. A geometrical optimization method applied to a heaving point absorber wave energy converter. Renew. Energy 2018, 115, 533–546. [Google Scholar] [CrossRef]
  13. Garcia-Rosa, P.B.; Bacelli, G.; Ringwood, J.V. Control-informed geometric optimization of wave energy converters: The impact of device motion and force constraints. Energies 2015, 8, 13672–13687. [Google Scholar] [CrossRef]
  14. Wen, Y.; Wang, W.; Liu, H.; Mao, L.; Mi, H.; Wang, W.; Zhang, G. A shape optimization method of a specified point Absorber wave energy converter for the south China sea. Energies 2018, 11, 2645. [Google Scholar] [CrossRef]
  15. Suchithra, R.; Ezhilsabareesh, K.; Samad, A. Development of a reduced order wave to wire model of an OWC wave energy converter for control system analysis. Ocean Eng. 2019, 172, 614–628. [Google Scholar] [CrossRef]
  16. Song, S.K.; Park, J.B. Control strategy of an impulse turbine for an oscillating water column-wave energy converter in time-domain using Lyapunov stability method. Appl. Sci. 2016, 6, 281. [Google Scholar] [CrossRef]
  17. Heller, V. Development of wave devices from initial conception to commercial demonstration. In Comprehensive Renewable Energy; Sayigh, A., Ed.; Elsevier: Oxford, UK, 2012; pp. 79–110. [Google Scholar] [CrossRef]
  18. Falcao, A.F.O.; Henriques, J.C.C. Model-prototype similarity of oscillating water-column wave energy converters. Int. J. Mar. Energy 2014, 6, 18–34. [Google Scholar] [CrossRef]
  19. Henriques, J.C.C.; Gomes, R.P.F.; Gato, L.M.C.; Falcao, A.F.O.; Robles, E.; Ceballos, S. Testing and control of a power take-off system for an oscillating-water-column wave energy converter. Renew. Energy 2016, 85, 714–724. [Google Scholar] [CrossRef]
  20. Falcao, A.F.O. Control of an oscillating-water-column wave power plant for maximum energy production. Appl. Ocean Res. 2002, 24, 73–82. [Google Scholar] [CrossRef]
  21. Falcao, A.F.O.; Henriques, J.C.C.; Gato, L.M.C.; Gomes, R.P.F. Air turbine choice and optimization for floating oscillating-water-column wave energy converter. Ocean Eng. 2014, 75, 148–156. [Google Scholar] [CrossRef]
  22. Chan, R.; Kim, K.W.; Park, J.Y.; Park, S.W.; Kim, K.H.; Kwak, S.S. Power performance analysis according to the configuration and load control algorithm of power take-off system for oscillating water column type wave energy converters. Energies 2020, 13, 6415. [Google Scholar] [CrossRef]
  23. Carrelhas, A.A.D.; Gato, L.M.C.; Henriques, J.C.C.; Falcão, A.F.O.; Varandasb, J. Test results of a 30 kW self-rectifying biradial air turbine-generator prototype. Renew. Sustain. Energy Rev. 2019, 109, 187–198. [Google Scholar] [CrossRef]
  24. Henriques, J.C.C.; Gato, L.M.C.; Lemos, J.M.; Gomes, R.P.F.; Falcao, A.F.O. Peak-power control of a grid-integrated oscillating water column wave energy converter. Energy 2016, 109, 378–390. [Google Scholar] [CrossRef]
  25. Roh, C. Enhancing power generation stability in oscillating-water-column wave energy converters through deep-learning-based time delay compensation. Processes 2023, 11, 1787. [Google Scholar] [CrossRef]
  26. Krause, P.C.; Wasynczuk, O.; Sudhoff, S.D. (Eds.) Reference-Frame Theory. In Analysis of Electric Machinery and Drive Systems, 3rd ed.; John Wiley & Sons: Hoboken, NJ, USA, 2013; Volume 75, pp. 86–120. [Google Scholar]
Figure 1. Configuration of OWC.
Jmse 12 01080 g001
Figure 2. Experimental results of impulse turbine.
Jmse 12 01080 g002
Figure 3. Turbine efficiency graph according to flow coefficient.
Jmse 12 01080 g003
Figure 4. Electrical output and turbine efficiency graphs with respect to angular velocity.
Jmse 12 01080 g004
Figure 5. Output characteristics of OWC with a large average peak.
Jmse 12 01080 g005
Figure 6. PTO system integration simulation configuration diagram for OWC.
Jmse 12 01080 g006
Figure 7. (a) Diagram and (b) photograph of 30 kW class full-scale experiment device.
Jmse 12 01080 g007aJmse 12 01080 g007b
Figure 8. Flow chart of proposed hybrid torque control.
Jmse 12 01080 g008
Figure 9. Electrical output and turbine output graph with respect to angular velocity.
Jmse 12 01080 g009
Figure 10. Comparison of angular speed and power generation performance of each algorithm according to input flow rate change.
Jmse 12 01080 g010
Figure 11. Analysis of characteristics (torque, turbine generator speed) and output power generation performance according to the algorithm under regular wave conditions: (a) optimal control, (b) 70% control, (c) 200% control, (d) hybrid control.
Jmse 12 01080 g011aJmse 12 01080 g011b
Figure 12. Turbine angular velocity fluctuation for each algorithm under regular wave condition.
Jmse 12 01080 g012
Figure 13. PEER for each algorithm under regular wave conditions.
Jmse 12 01080 g013
Figure 14. (a) Turbine angular velocity, (b) efficiency characteristics, and (c) power generation performance results according to each algorithm.
Jmse 12 01080 g014
Figure 15. Characteristics (torque, turbine generator speed) and output power generation performance according to the algorithm characteristics under irregular wave conditions: (a) optimal control, (b) 70% control, (c) 200% control, (d) hybrid control.
Jmse 12 01080 g015aJmse 12 01080 g015b
Figure 16. Turbine angular velocity variability in algorithms under irregular wave conditions.
Jmse 12 01080 g016
Figure 17. Average-to-peak ratio of angular velocity of turbine of algorithms under irregular wave conditions.
Jmse 12 01080 g017
Figure 18. (a) Turbine angular velocity, (b) efficiency characteristics, and (c) power generation performance results according to the algorithm.
Jmse 12 01080 g018
Table 1. Comparison of power generation performance of algorithms under regular wave conditions.
Optimal70%200%Hybrid
Simulation [kWh]5.666.754.355.05
Experiment [kWh]6.867.345.075.88
Table 2. Comparison of power generation performance in algorithms under irregular wave conditions.
Optimal70%200%Hybrid
Simulation [kWh]0.680.700.600.68
Experiment [kWh]1.311.451.051.21
Disclaimer/Publisher’s Note: The statements, opinions and data contained in all publications are solely those of the individual author(s) and contributor(s) and not of MDPI and/or the editor(s). MDPI and/or the editor(s) disclaim responsibility for any injury to people or property resulting from any ideas, methods, instructions or products referred to in the content.

