Article

Characteristics of Marine Heatwaves in the Southeastern Baltic Sea Based on Long-Term In Situ and Satellite Observations

by
Toma Dabulevičienė
* and
Inesa Servaitė
Marine Research Institute, Klaipeda University, Universiteto Ave. 17, 92294 Klaipeda, Lithuania
*
Author to whom correspondence should be addressed.
J. Mar. Sci. Eng. 2024, 12(7), 1109; https://doi.org/10.3390/jmse12071109
Submission received: 23 May 2024 / Revised: 23 June 2024 / Accepted: 28 June 2024 / Published: 2 July 2024
(This article belongs to the Section Physical Oceanography)

Abstract

:
Marine heatwaves (MHWs) are known to pose a threat to aquatic ecosystems and coastal communities and, as a result, they receive significant attention nowadays, thus motivating our scientific interest in better understanding the regional patterns of these events. In this study, we analyze MHWs in the SE part of the Baltic Sea, defining them as anomalously warm water events, where the water temperature exceeds the 90th percentile threshold of the corresponding calendar day for at least five or more consecutive days. Our study is based on a combination of long-term (1993–2023) in situ data, field measurements, and satellite-derived sea surface temperature data during the warm (May–August) period. Study results suggest that although short-lived (5–9 days) MHW events typically dominate throughout the analyzed period, the occurrences of longer (more than three weeks) and more intense MHWs have increased in our study region in the recent decade. The heatwaves are observed both in coastal and open waters, with SST anomalies up to around 5–6 °C above the 90th percentile threshold during extreme events, extending thermal influence as deep as 20 m during prolonged and more intense events. We believe that the results of this study contribute to a better understanding of MHW patterns in the study region, which is important from an ecological and socio-economic point of view, providing valuable insights for human health aspects as well.

1. Introduction

The Baltic Sea is a regional sea and also one of the world’s largest bodies of brackish water. It is directly surrounded by nine European countries, with a combined population of approximately 85 million living in its drainage basin [1], making the sea of high importance in various aspects, from ecological to economic ones. However, its special geographical, climatological, and oceanographic characteristics render the sea particularly vulnerable to various environmental and anthropogenic impacts [2,3], including climate change.
It is estimated that, as a result of climate change, temperatures are rising worldwide, with the average surface temperature warmed up by 0.85 °C between 1880 and 2012 [4]. The Baltic Sea is considered among the fastest-warming seas globally [5], with the climate models projecting a further increase in water temperatures of the Baltic Sea by 2–4 °C on average by the end of this century [6,7]. It was assessed that the temperature of the surface waters of the southern Baltic Sea increased on average by 0.7 °C per decade between 1980 and 2019, with the highest increase of 0.6–0.65 °C observed within the 0 to 20 m layers [8]. Another study further projects the increasing coastal temperature patterns, with long-term (2070–2100) changes of 2.2 °C in summer and 3 °C in autumn compared with the historical (1975–2005) period in the southeastern Baltic Sea [9].
Consequently, with increasing water temperatures, climate change also results in an increasing frequency and intensity of marine heatwaves (MHWs) [10], which are defined as anomalously warm water events lasting for five or more consecutive days. Extreme temperature changes during MHW events pose the risk of serious and, in some cases, irreversible negative effects on ecosystems, resulting in broad ecological and socio-economic consequences from shifts in species ranges, e.g., [11,12], to mass mortalities of marine organisms [13], to fish kill events and occurrences of harmful algae blooms [14]. MHWs are observed over many regions of the global ocean, including enclosed or semi-enclosed seas such as the Mediterranean, e.g., [13,15,16,17], Black, e.g., [18] and Baltic Seas, e.g., [7,19,20,21], and due to their environmental and socio-economic effects, there is a demand for information about future weather and climate, including forecasts of MHWs [22].
In recent years, there has been a significant rise in scientific interest towards a better understanding of MHW events worldwide and in the Baltic Sea. It was found that MHWs may lead to a decrease in oxygen concentration, thus increasing the risk of hypoxia events in the coastal zone [20,23], which is already considered a huge problem for the Baltic Sea ecosystem [24]. It was also found that bottom water temperature increases during MHWs might lead to increased emissions of carbon dioxide and methane [25] and alter biogeochemical and biological processes, depending on MHW intensity [23]. The main drivers of MHWs in the Baltic Sea vary with the season, i.e., in summer, they are mainly forced by local meteorological conditions over the open water. One synoptic pattern linked to such events is Scandinavian blocking, which promotes strong shortwave downflux, calm winds, and low vertical mixing with colder sub-thermocline waters. Wintertime MHWs are associated with the advection of warm and moist air from the North Atlantic [19].
Conducting regional or basin-specific studies remains crucial for comprehending the development and effects of MHWs on the environment, as these studies can provide valuable insights for the specific regions. This study, therefore, aims to provide a detailed record of MHWs and their characteristics in the SE Baltic Sea region. We employ long-term (1993–2023) in situ data, field measurements, and satellite-derived sea surface temperature data during the warm (May–August) period to accomplish this. As will be further shown, this paper identifies and describes the main characteristics of warm-period MHWs in the SE Baltic Sea region, providing information on their frequency, duration, and intensity, and their effect on sea surface temperature in coastal areas and open waters and deeper layers. Therefore, the results of this study contribute to a better understanding of regional properties of MHW events, providing valuable insights for the scientific community and local decision-makers.

2. Materials and Methods
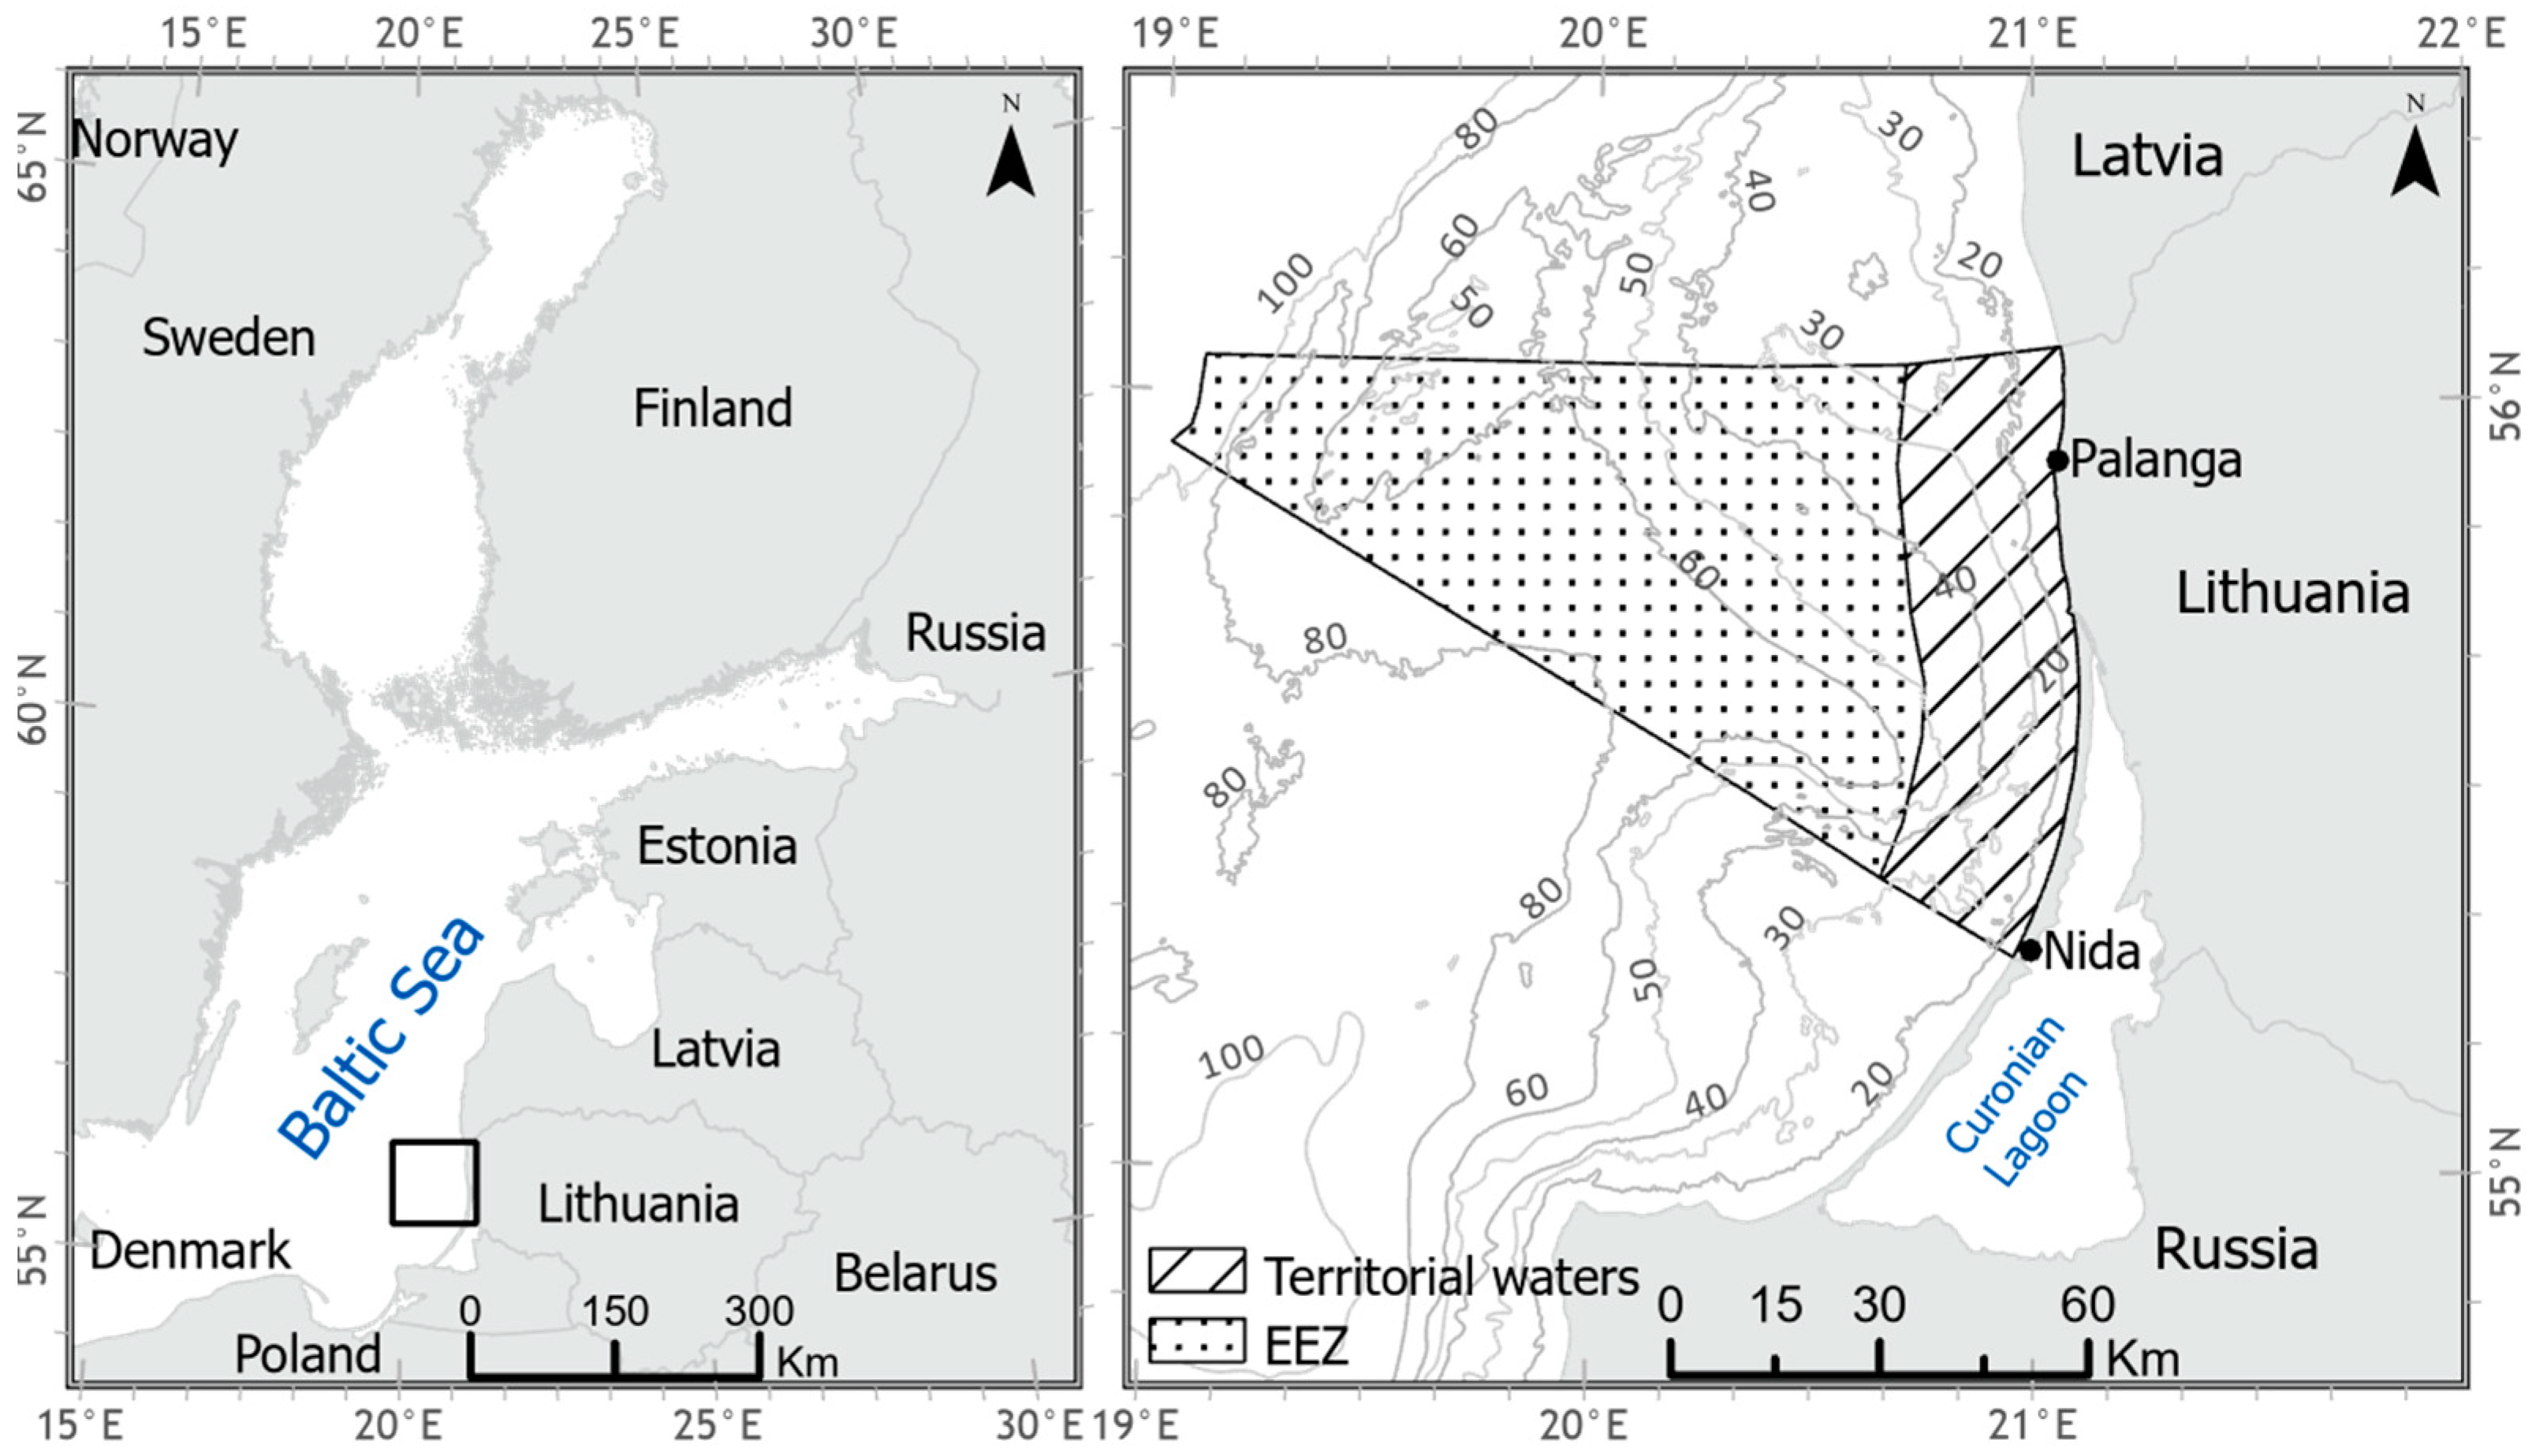
2.1. Study Area

In this study, our focus is on the southeastern part of the Baltic Sea, represented here by the Lithuanian Baltic Sea coastal waters (Figure 1).
The water temperature regime in the study region follows a seasonal pattern, with the highest average surface water temperatures of about 18–19 °C observed in summer months (July and August) and the lowest temperatures of around 2 °C on average in winter (January and February) [26]. In general, the surface water temperature here mostly depends on solar radiation, the thermal properties of air masses, and water circulation [27]. For example, due to coastline orientation in the study region, coastal upwellings are rather frequently observed here under northerly and northeasterly winds, significantly lowering water temperature (maximum and median values of temperature drop due to upwelling of about 12 °C and 4 °C, respectively), especially during the warm period (May–September) [28]. Alternatively, the plume of Curonian Lagoon waters, having different water properties compared to the Baltic Sea, may also be observed in the coastal waters of the study region [29].

2.2. Data

In this study, Moderate Resolution Imaging Spectroradiometer (MODIS) Terra/Aqua Level 2 sea surface temperature (SST) data from the open access NASA OceanColor website (http://oceancolor.gsfc.nasa.gov/, accessed on 12 January 2024) was used, covering the period of 2000–2023. The product covers the study site with a spatial resolution of about 1 km, giving it enough spatial coverage for MHW analysis in the open and coastal areas of the SE Baltic Sea. There are typically about 2 to 4 MODIS observations per day in our study region; therefore, only cloud-free or minimal-cloud-cover satellite imagery was chosen for MHW analysis.
In situ daily water temperature data from two coastal hydrometeorological (HMS) stations alongside the Lithuanian seashore (Nida and Palanga, see Figure 1) for the period 1993–2023 were provided by the Lithuanian Hydrometeorological (LHMT) Service under the Ministry of Environment of the Republic of Lithuania. Additionally, in situ water temperature data collected by the Lithuanian Environmental Protection Agency and Klaipeda University during field campaigns in the coastal waters of the Lithuanian Baltic Sea were used to assess the MHW impact on the deeper water layers.

2.3. Marine Heatwave Identification

We followed the widely used definition provided by the authors of [30]; thus, the 90th percentile threshold was calculated to detect MHWs in the Baltic Sea using daily water temperature measurements from coastal stations for the climatic period of 1993–2023. Cases in which anomalously warm water events exceeding the 90th percentile threshold of the corresponding calendar day persisted for at least five or more consecutive days were considered marine heatwaves. Two MHW events occurring consecutively within a gap of 2 days or less were regarded as one single event.
From in situ data, the duration, i.e., the period when the water temperature remained at or above the 90th percentile threshold for at least five days, the number of events each year during the warm period (May–August), and mean/maximum MHW intensity (averaged/maximal SST anomaly (ΔT, °C) during each MHW event, calculated as a difference between observed water temperature and the corresponding value of the 90th percentile), were quantified. Linear regression analysis was used to estimate trends in MHW frequency and total days. The statistical significance of trends was estimated using a 95% confidence interval.
For the accurate detection of MHWs, it is accepted to use a time series length of at least 30 years [30]; however, MODIS Terra/Aqua SST data, which was used in this study, is only available from the year 2000. Even though shortening the time series may impact the detection of MHWs, e.g., introducing a warm bias into the results [31], this particular satellite data was chosen for additional analysis of MHWs due to its high spatial resolution, enabling analysis of SST variability even in the vicinity of the coast. It has already been widely used for SST studies in the Baltic Sea, e.g., providing fine detail of coastal upwelling properties, e.g., [28,32,33,34], with validation of MODIS SST product against in situ observations, demonstrating a good agreement [26]. Therefore, the detection and quantification of MHW events through satellite SST data were conducted utilizing a 24-year time series of MODIS SST data. Satellite IR SST is sensitive to cloud cover; therefore, in this study, we analyzed the months from May to August, having the least cloudy days in the region. The 90th percentile temperature was calculated for every 1 × 1 km pixel daily throughout the selected months. To solve data “gappiness” arising due to cloud cover, in case of missing satellite data for a certain day, cloud-free SST imagery ±2 days was used instead. The use of satellite data allowed us to preliminary estimate the spatial extent of the MHW and SST alterations induced by the latter in the open and coastal waters (in Figure 1, denoted as EEZ and territorial waters, correspondingly), which is not possible from coastal measurements only.

3. Results

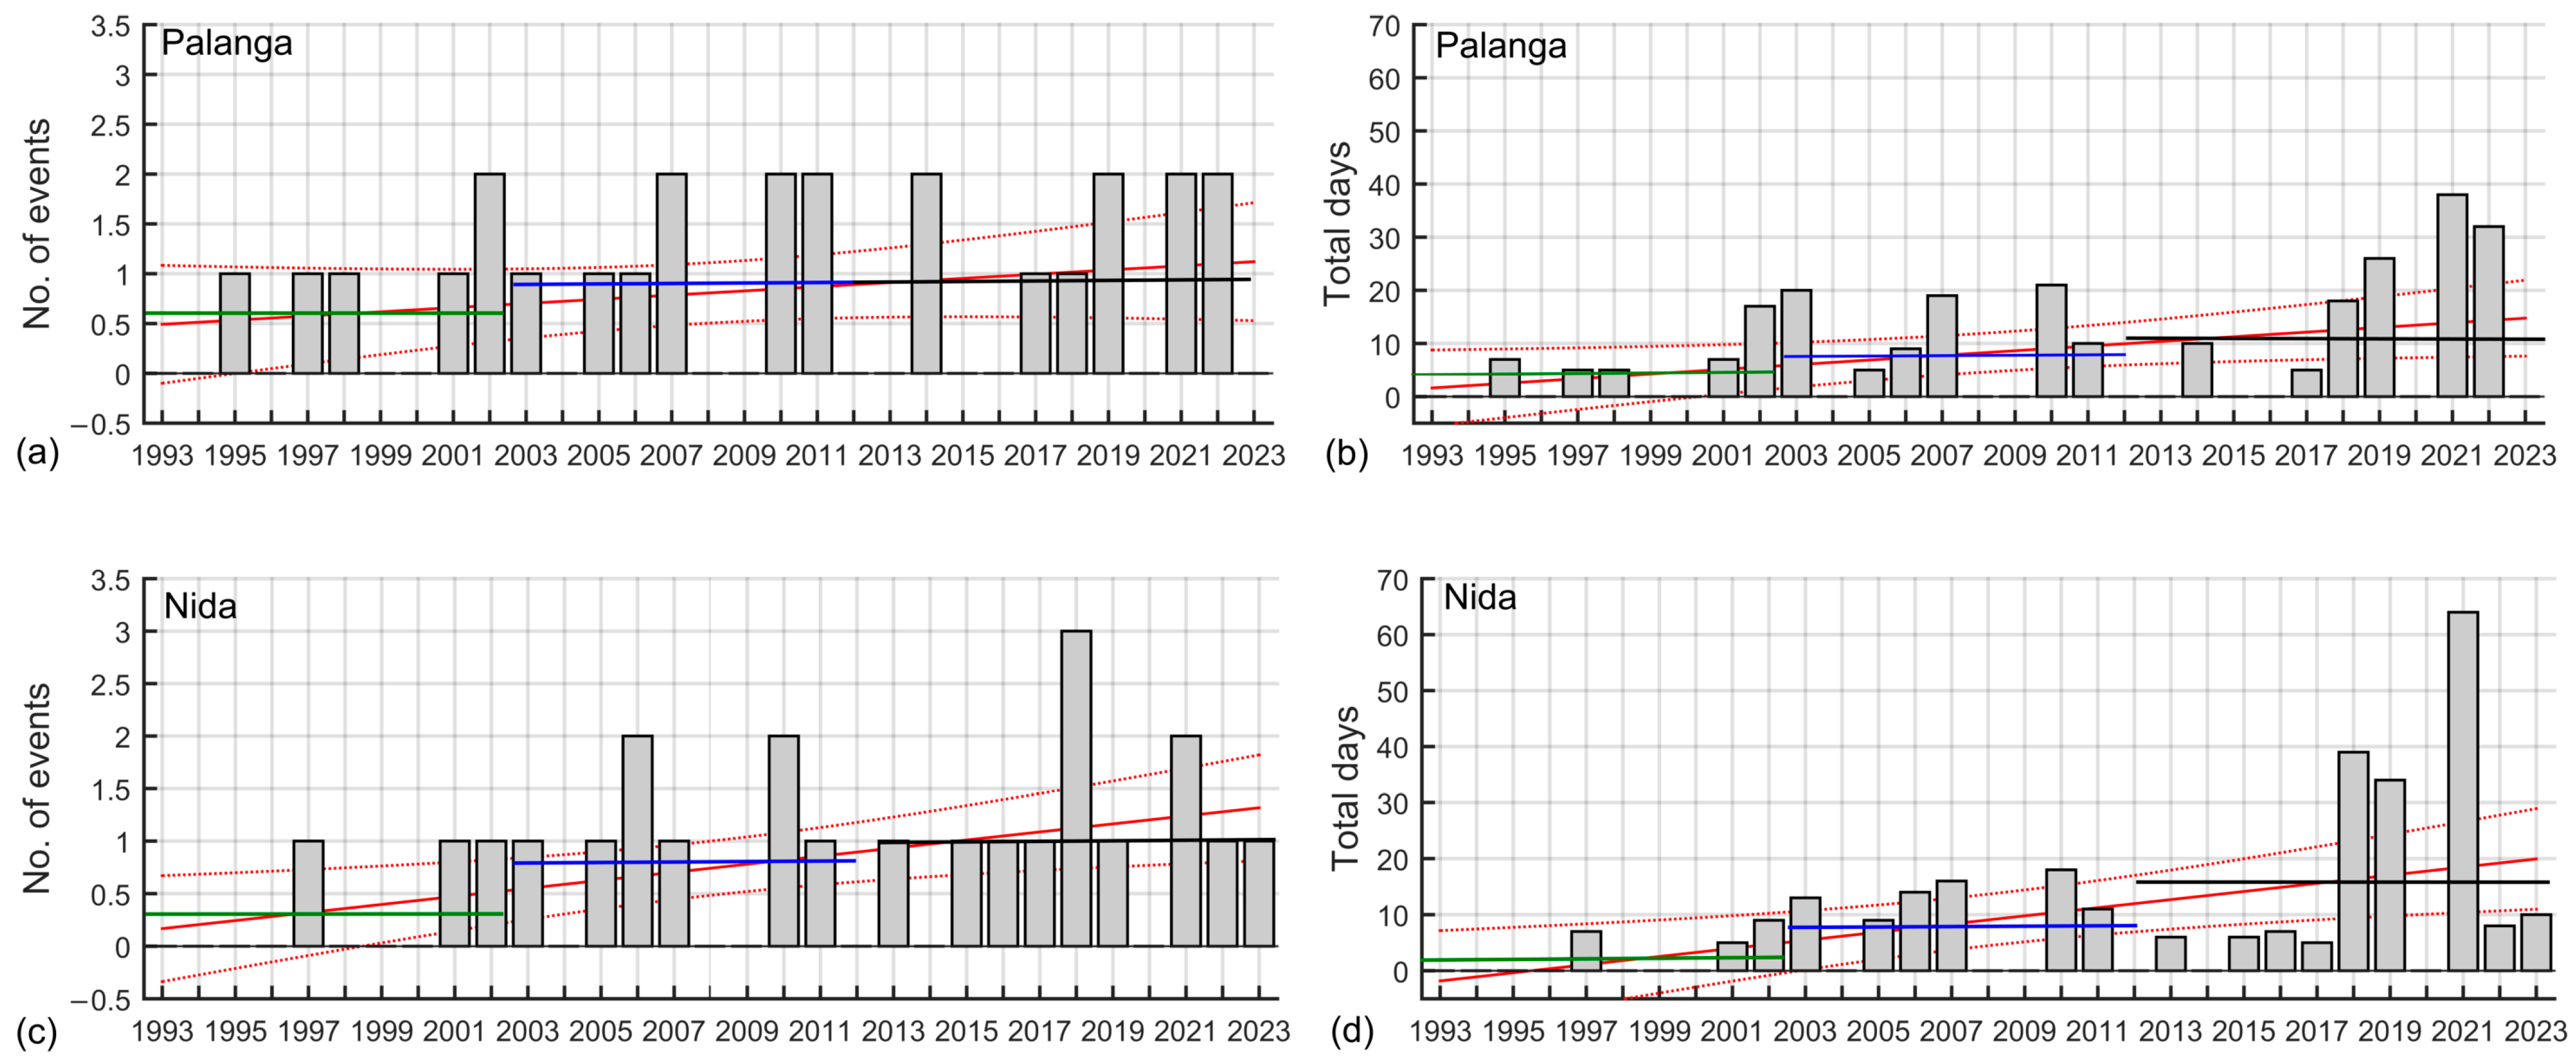
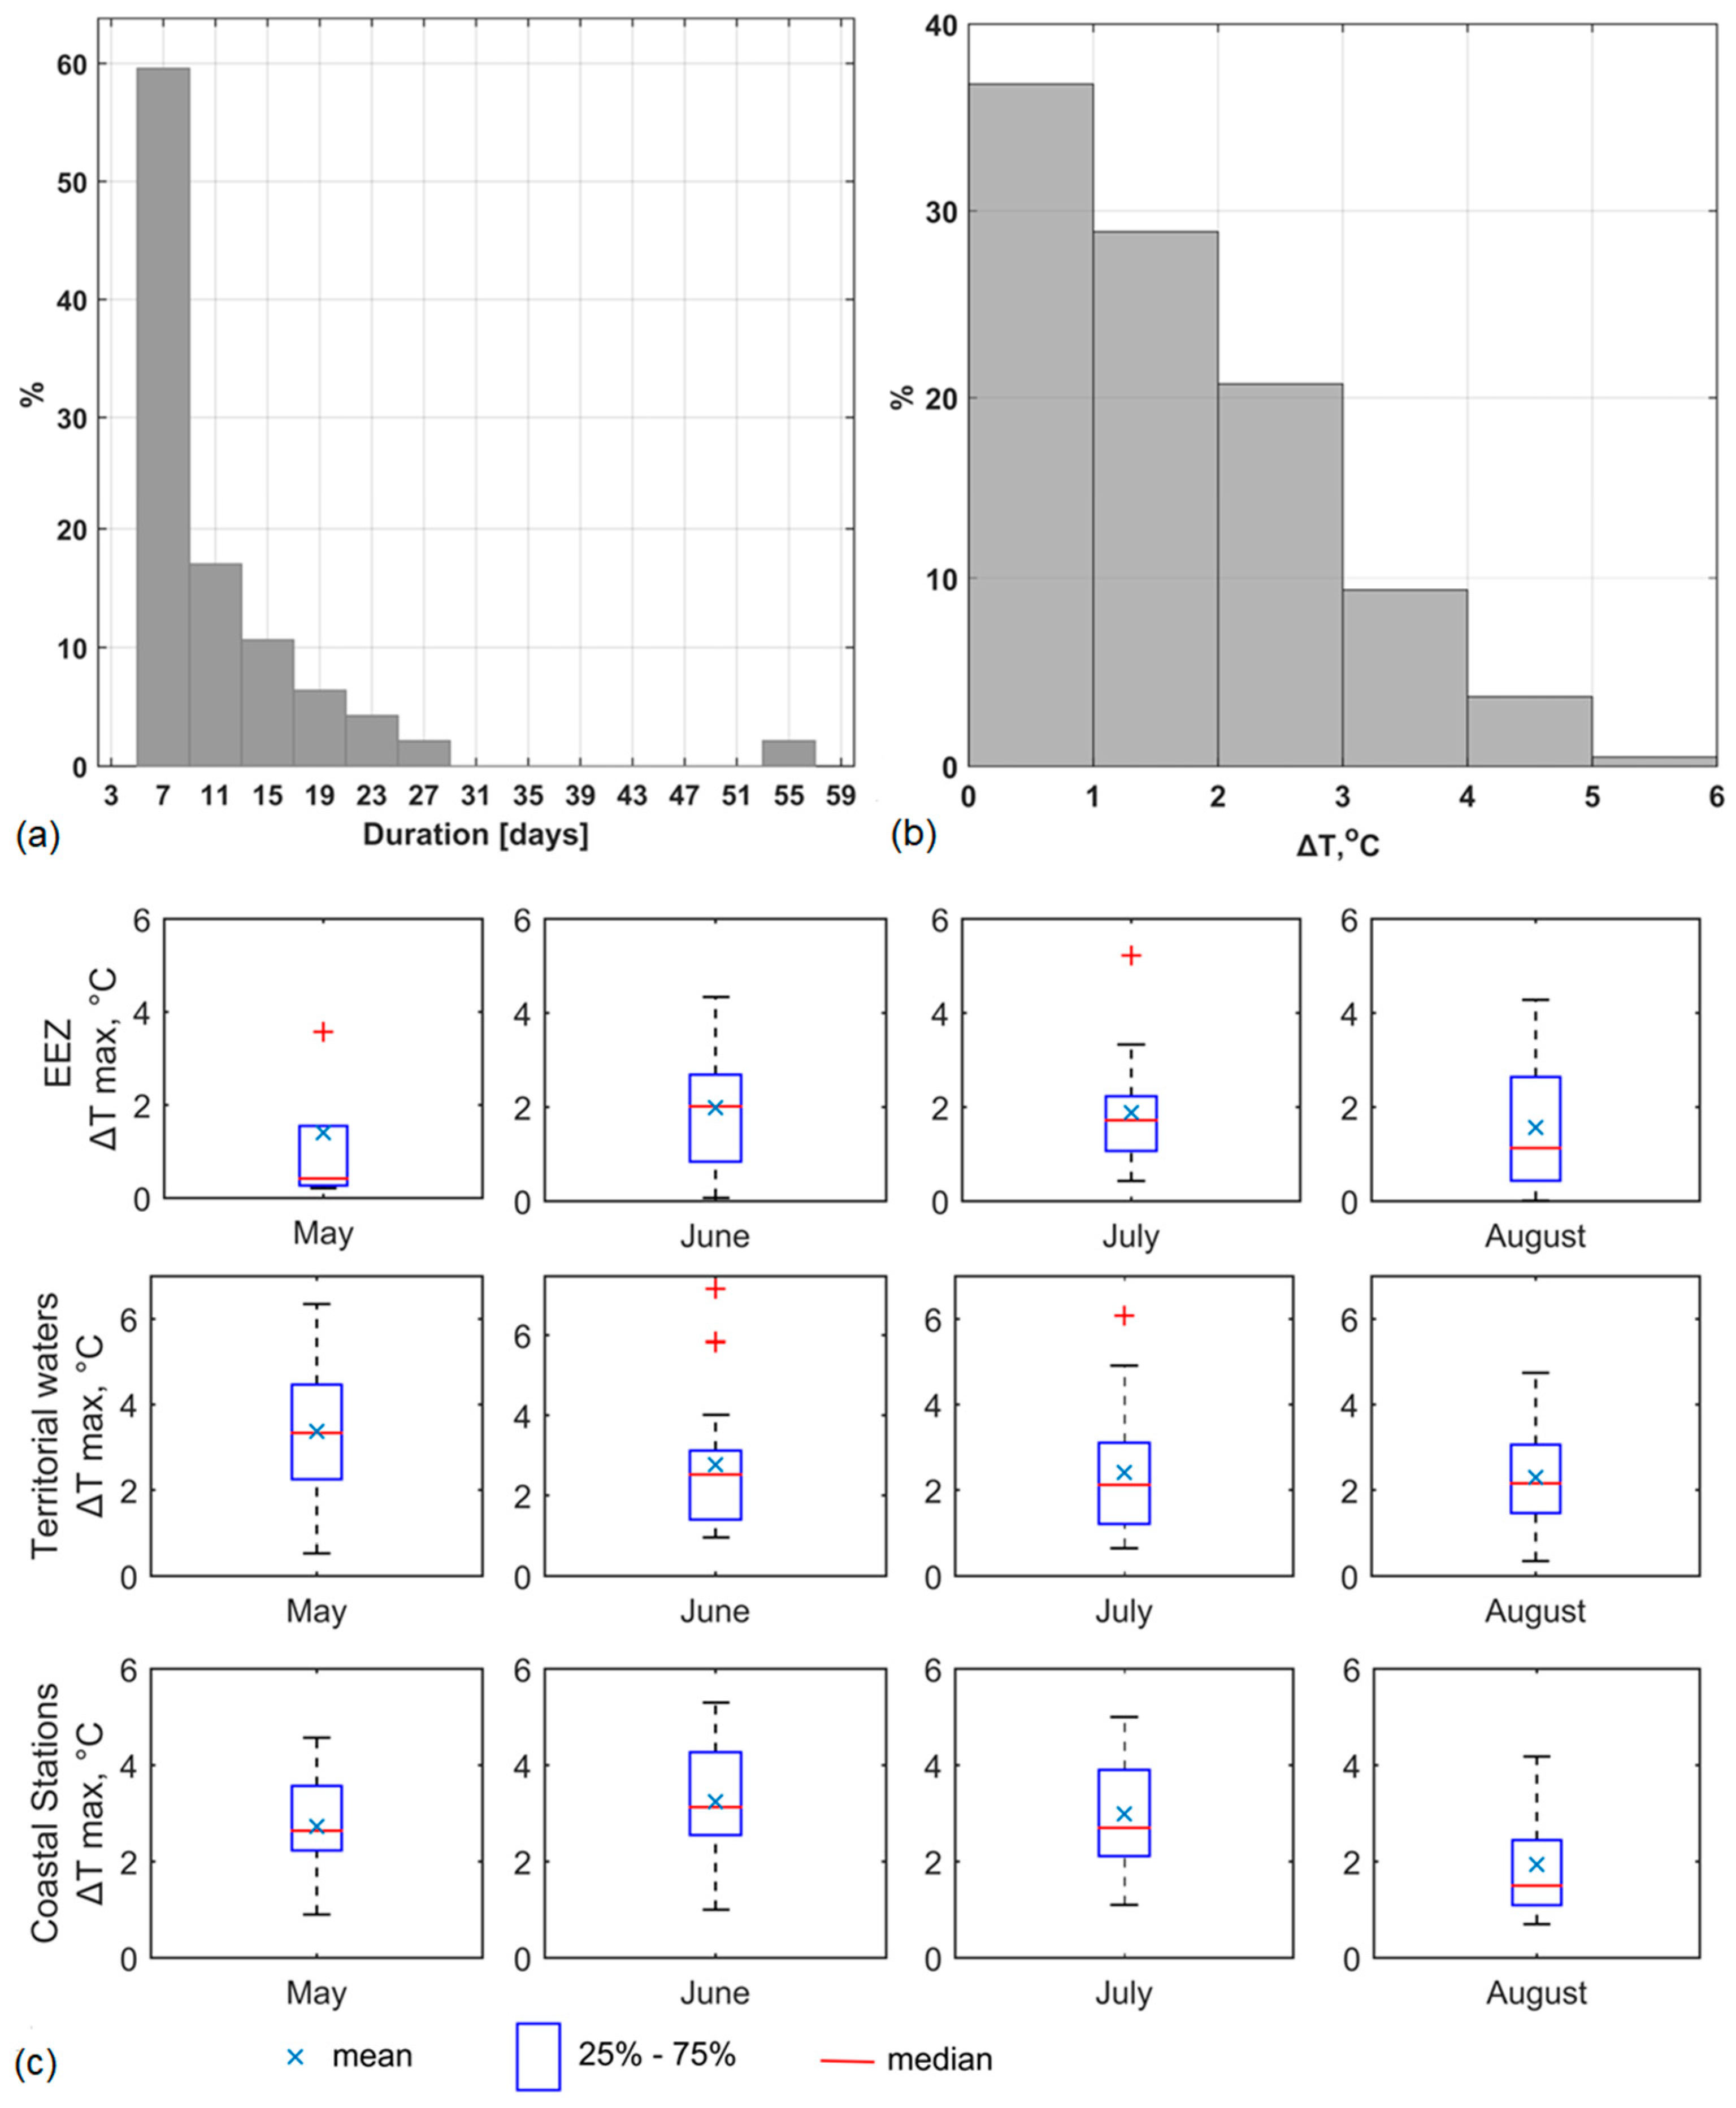
3.1. General Characteristics of MHW

Figure 2a,c show the number of marine heatwaves identified in the in situ water temperature data from two coastal monitoring stations—Nida and Palanga for the warm (May–August) period of 1993–2023, while Figure 2b,d show the total number of MHW days within the same period.
As can be seen, in the first decade of the analyzed period, occurrences of MHWs were relatively uncommon (the mean warm season number of MHW events was 0.6 at Palanga and 0.3 at Nida) with an average of total MHW days being only 2 days in Nida and 4 days in Palanga (Figure 2). In the following years, the occurrences of MHW events slightly increased, reaching an average of one event per warm period within the last decade. However, a significant increase in total MHW days is being observed, with one event lasting even up to several weeks, e.g., in 2003, a single MHW event was recorded to last for 20 days at Palanga and 14 days at Nida, as in situ water temperature records from coastal monitoring stations have shown. The average of total MHW days between the 2003 and 2012 increased to 8 days in both coastal stations. At the end of the analyzed period, a concerning rise in MHW duration was observed, i.e., the mean of total MHW days within the last decade reached 11 days in Palanga and 16 days in Nida. In 2018, the total number of MHW days at the Nida coastal station reached 39 days, in 2019—40 days with a record-breaking event of a 57-day-long single MHW at the Nida coastal station and a total of 64 MHW days during the warm period of 2021. Two marine heatwaves lasting 25 and 13 days each were recorded at Palanga station in the same year, along with two 16-day long MHWs in 2022. Figure 2 also indicates that a statistically significant (p < 0.05) trend of growth in the number of total MHW days in both Palanga and Nida is observed, and for the number of MHW events in Nida, while in Palanga, the trend remains positive but non-significant (p > 0.05).
Figure 3a,b combine measurements from both coastal stations to represent typical MHW characteristics in the coastal areas of the SE Baltic Sea. Figure 3a shows a histogram distribution of MHW duration. As can be seen, short-lived (5–9 days) marine heatwave events dominate, comprising around 60% of the total number recorded both at Nida and Palanga, while around 20% of the events lasted for 2 to 3 weeks. The average duration of warm-period MHWs is around 11 days, yet there have been instances of very long-lasting MHWs, such as those observed in the previously mentioned cases of 2018, 2019 and 2021.
In Figure 3b,c, the mean and maximum intensity of marine heatwaves, quantified in terms of the difference between observed water temperature and the corresponding 90th percentile value, are presented. Figure 3b, consisting of daily MHW coastal data from both stations, shows that the water temperature during MHW events typically exceeds the 90th percentile by up to 2 °C in approximately 66% of daily records, with roughly 14% of records showing temperature increases of 3–6 °C higher than the 90th percentile value, out of which extremely high values up to 5–6 °C cover only around ~1% of the records. Figure 3c shows the maximum MHW intensity (ΔT, °C) during May–August observed in MHW events at Nida and Palanga coastal stations, as well as in MHW events identified in satellite SST images within the territorial waters and Exclusive Economic Zone (EEZ). In general, the lowest average of maximum ΔT values was observed in the open waters of the EEZ, ranging between 1.5–2 °C each month, whereas in the territorial waters and in measurements at coastal stations, it varied from 2.5–3 °C during May and July and approximately 2 °C in August. The highest MHW intensity was observed in the territorial waters, reaching a maximum ΔT of up to 6 °C in May and July, and even around 7 °C in June, although such high values were of a more sporadic nature and did not last for prolonged periods. At the coastal stations, a max ΔT of about 5 °C was reached in June and July, while in the open waters of EEZ, maximum differences were also surprisingly high, reaching up to 6 °C in May and up to 5 °C in July. August was characterized by the lowest maximum ΔT values, varying around 4 °C at all three measurement sites.

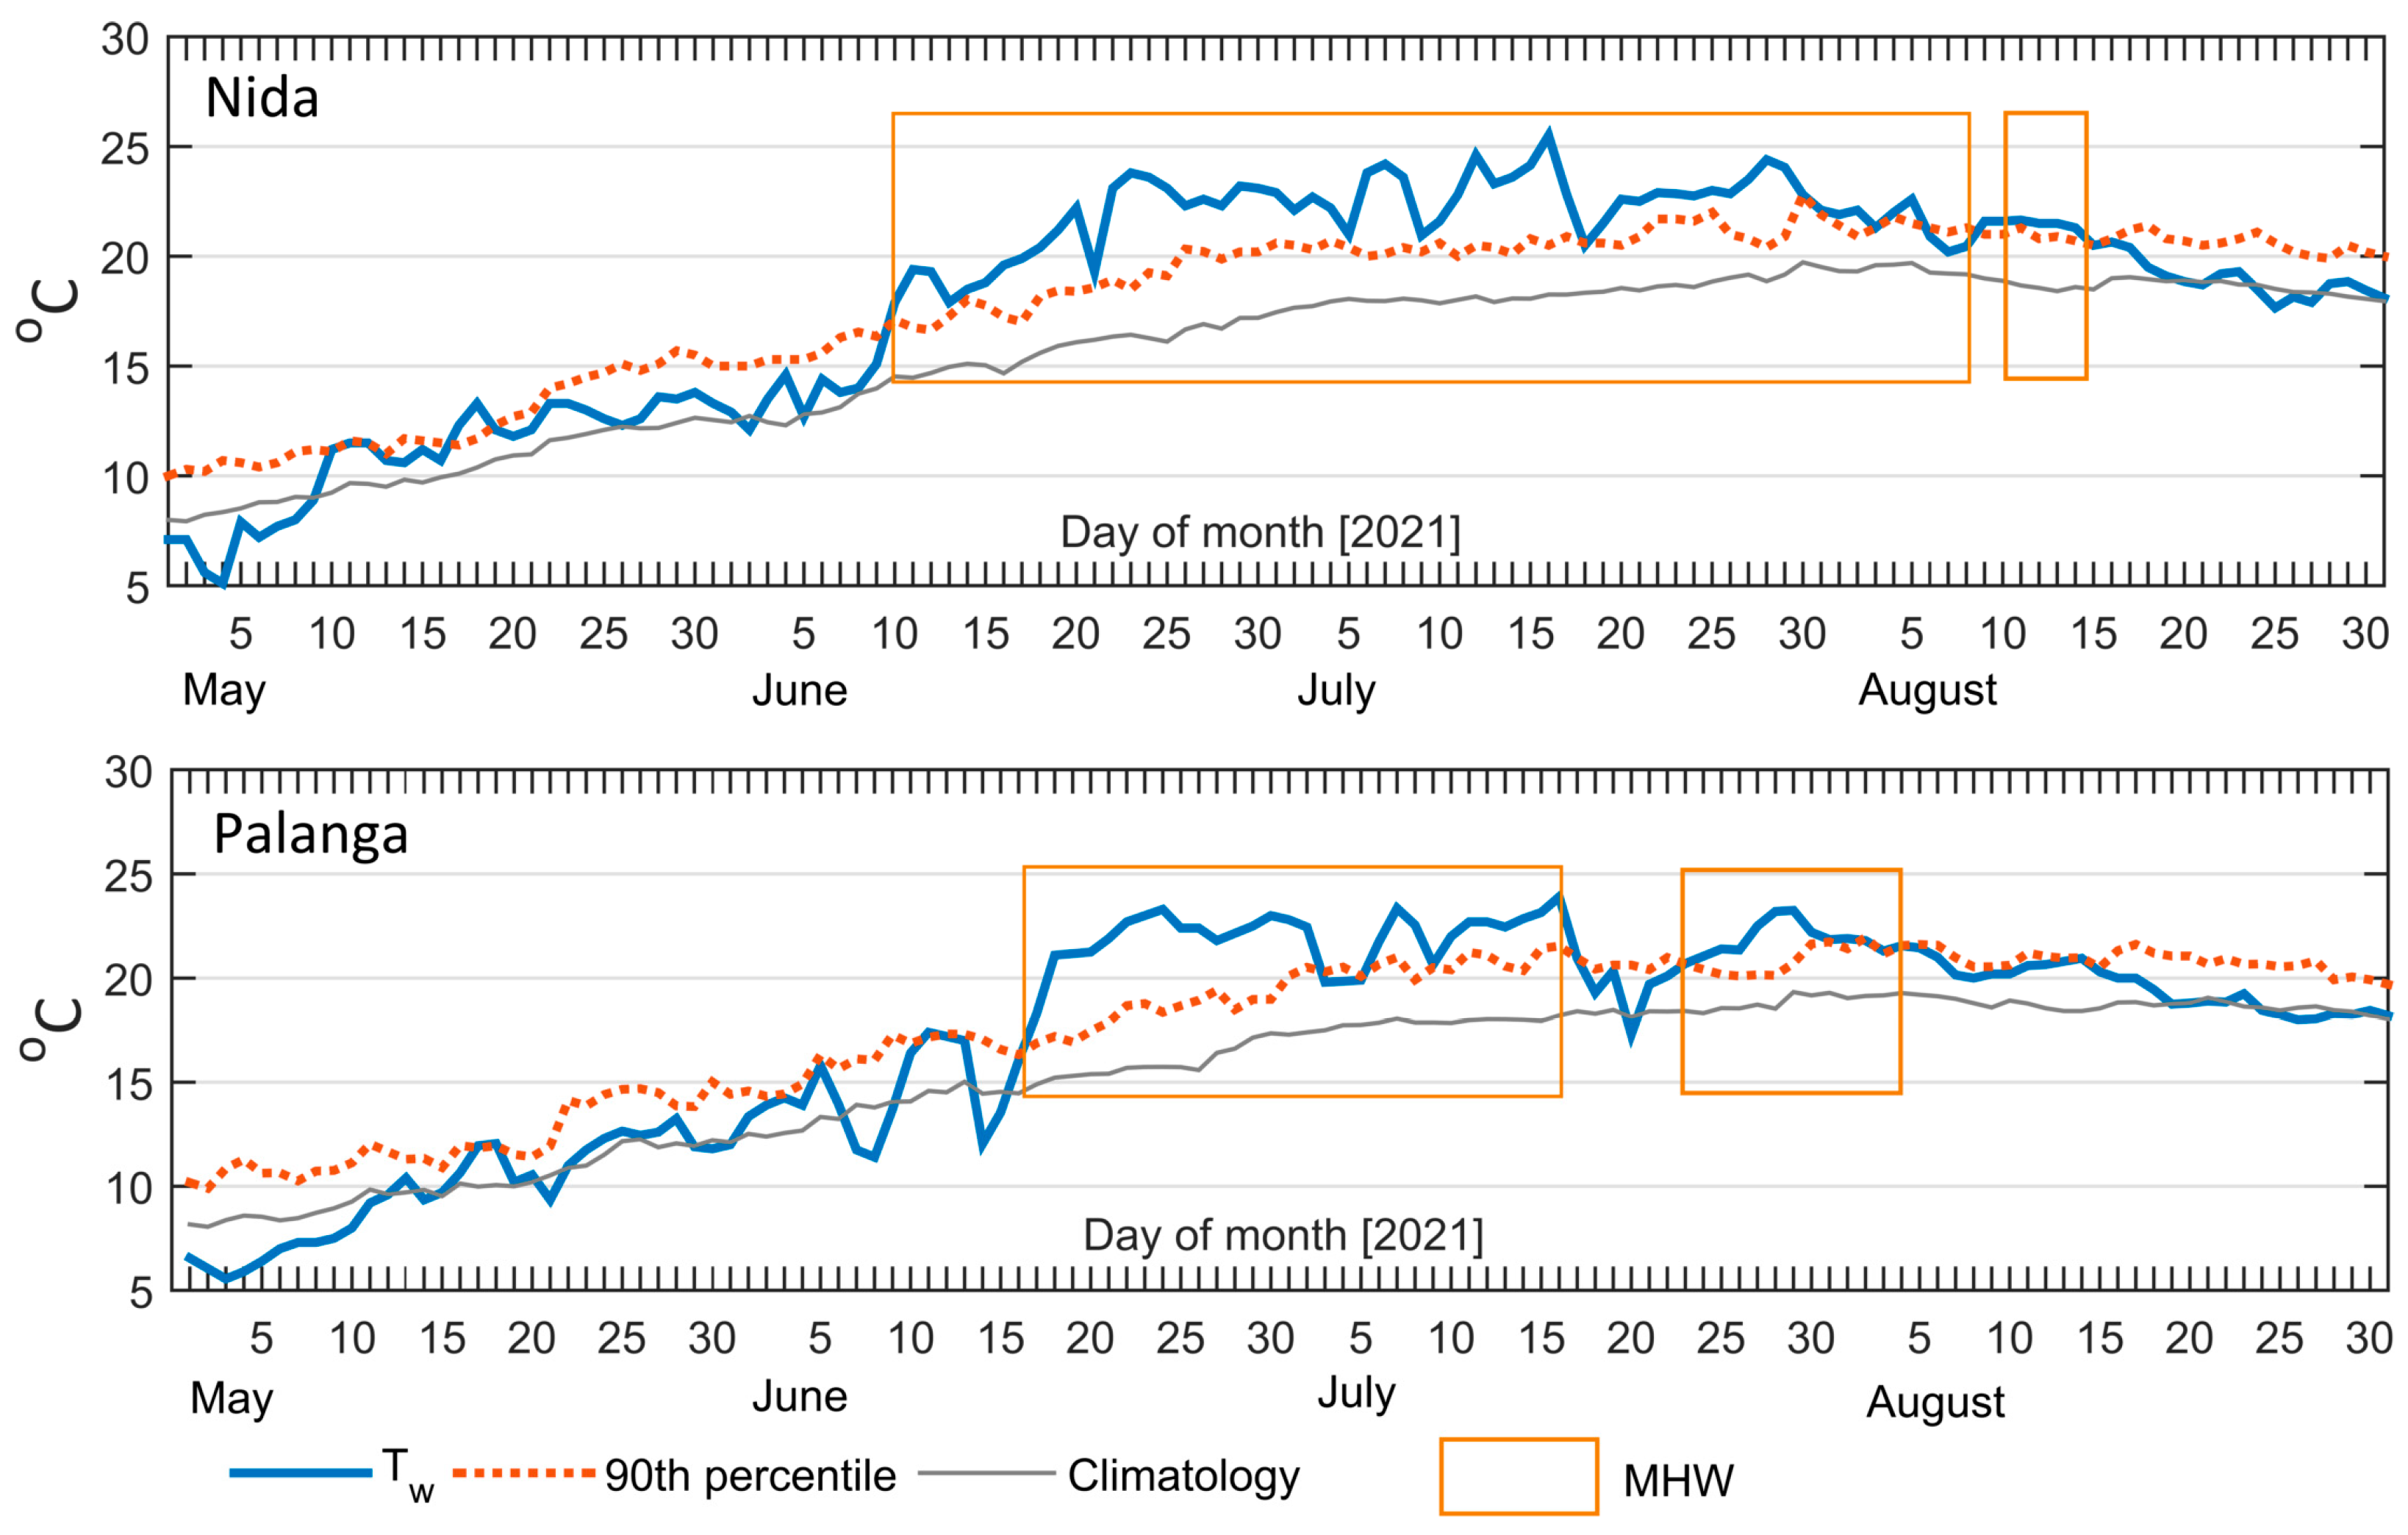
3.2. Major MHW in the Summer of 2021

The longest (57 consecutive days) marine heatwave event identified during the analyzed period occurred in the summer of 2021, and, therefore, was selected for more detailed analysis. Figure 4 illustrates the development of this MHW from Nida and Palanga coastal records. As evident from the in situ data, several heat spikes were already observed at the Nida coastal station in May, with the beginning of the MHW recorded on 10 June, whereas at Palanga, records show that the MHW started a week later, on 17 June. The MHW reached its peak intensity at Nida approximately between 16 and 22 June, surpassing the 90th percentile value by up to 5 °C. In June, the water temperatures here exceeded 23 °C for six days, reaching a maximum of 23.8 °C on 22 June. MHW intensity in July peaked even more, with an average monthly water temperature of 22.91 °C, and hitting a record value of 25.5 °C on 16 July. This was 4.5 °C higher than the climatological mean monthly water temperature in July and more than 7 °C higher than the climatological mean of 16 July. By the end of July and the beginning of August, the intensity of the MHW had weakened, tapering off by 15 August. After a 3-day gap, another 7-day-long marine heatwave was recorded in August at the Nida coastal station; however, its intensity was much lower, with a ΔT of about 0.6 °C.
At Palanga, the MHWs were slightly less intense and shorter in duration, i.e., as can be seen from Figure 4, one heatwave of 29 days took place from 16–17 June, followed by a 6-day gap, and then another MHW lasting 13 days occurred. The first MHW was quite intensive right from the beginning, with ΔT varying around 4 to 5 °C and water temperatures reaching as high as 23.3 °C in June and 23.9 °C in July. During the second MHW recorded at Palanga, the ΔT were slightly lower, fluctuating up to 3 °C, with a peak temperature of 23.3 °C recorded on 29 July.
Analysis of satellite data during the selected MHW event indicates that the signatures of the MHW were most prominent in the territorial waters, although a significant part of the open waters was affected as well (Figure 5).
From Figure 5, it is evident that the highest mean and maximum intensity were observed in the coastal areas, with ΔTs up to 1.6 °C and 6 °C, respectively. In the open waters of the EEZ, the maximum ΔT also reached high values, exceeding the 90th percentile by as much as 4 °C in some locations.
In addition to the coastal records, in situ data collected during field campaigns in the coastal waters of the Lithuanian Baltic Sea were utilized to assess the impact of the marine heatwave event in the summer of 2021 on the deeper water layers. For this, water temperatures from vertical profiles during the MHW event were compared to water temperature measurements taken around the same time in different years, when no MHWs were present (Figure 6). The years 2004 and 2015 were specifically selected due to the absence of any MHWs recorded in the vicinity of the monitoring station, as coastal records at Palanga have shown (Figure 2).
It can be seen from satellite SST measurements and vertical temperature profiles (Figure 6) that while the surface temperature remains relatively high at around 19 to 22 °C throughout all four field campaigns, there are notable differences in the temperature within the deeper layers, depending on the presence/absence of MHWs. The highest surface temperature, about 22 °C, was observed on 11 August 2015; however, a noticeable decrease in water temperature was observed when going to the deeper layers, with temperatures at the bottom (20 m depth) measuring around 17 °C. An analogous situation was similarly noted on 4 August 2004, with the surface water temperature of 19.4 °C and bottom temperatures of only 14.6 °C. As the satellite data and in situ measurements of 6 August 2021 show, the temperature of the surface waters during this particular MHW reached 21–22 °C. It is important to note that the impact of the heat wave extended beyond the surface, and the effect of the MHW was also visible even at the bottom layers at depths as deep as 20 m. From the vertical temperature profiles, it is evident that during the MHW, (6 August 2021) and even more than two weeks after (23 August 2021), the entire water column remained homogenously warm: 21.1 °C and 19.7 °C, respectively.

3.3. Upwelling and MHWs

Comparison of MHW events identified from coastal measurements and satellite data also revealed some interesting findings, such as the potential for some MHWs to go undetected or have their duration underestimated in the in situ data due to the presence of coastal upwelling. To illustrate this, an upwelling event in August 2002 was chosen. The coastal records from Nida and Palanga indicated that winds of northerly directions prevailed in the area during 14–26 August, which is a typical wind direction favoring upwelling formation in our study region. Accordingly, in Figure 7, the water temperature situation for 18–25 August 2002 is depicted using satellite data, along with the water temperature records from the coastal stations of Palanga and Nida.
As can be seen in MODIS SST maps, clear signatures of coastal upwelling were noticeable across the Lithuanian Baltic Sea coastline. This was also reflected in the coastal records showing relatively low water temperatures for August, varying around 16–17 °C. However, upon examining satellite SST data, it is also clearly evident that the water temperature in the open waters was considerably high, up to 22 °C, indicating the presence of a MHW. The estimations of the MHW extent from satellite data confirmed that in this case, the impact of the heatwave was mainly concentrated within the EEZ, while territorial waters remained almost unaffected due to the presence of upwelling. Consequently, in situ records displayed no evidence of a MHW occurring in the coastal areas. However, it is evident from satellite data that the extent of the MHW covered 12 to 36% of the territorial waters when upwelling was the most pronounced (18–24 August). Additionally, with the relaxation of upwelling on 25 August, the extent of the marine heatwave in the territorial waters expanded to as much as 57%. In contrast, the MHW extent in the EEZ was rapidly increasing from 68% of the total area of EEZ on 18 August to 100% between 20–25 August.

4. Discussion

Marine heatwaves are receiving more and more scientific attention throughout the Global Ocean and in the Baltic Sea as well, as they are posing serious risks to ecosystems in terms of, e.g., heat stress [35,36], decrease in oxygen concentration [20], species regime shifts [37,38], and harmful algal blooms [39], also having versatile effects on the seafloor functioning [23]. This, in turn, might lead to economic decline and have many-sided societal effects [38,40]. Warmer water temperatures during MHW events might also increase recreational opportunities in the seas of temperate climate, e.g., the Baltic Sea, but, on the other hand, it might also favor the proliferation of harmful organisms, posing negative impacts on human health [41,42]. Therefore, there is a growing awareness of the need to understand the occurrence and regional patterns of marine heatwaves, as well as their potential local impacts, so the decision-makers can be aware of possible scenarios and take effective management strategies.
It is projected that with climate warming, the frequency and the average duration of the MHWs will increase in the Baltic Sea in the future [7]. Such tendency is already reflected in our results, which show that the number of MHW events slightly increased within the last decade of the 30-year analyzed period, with anomalously long events occurring in the recent years compared to the first decade of analysis, indicating a shift towards more prolonged marine heatwave events and longer total duration. Similar patterns of increased MHW occurrence have been observed in the different parts of the global ocean as well, e.g., in the North Sea [43], Black Sea [18], Mediterranean Sea [15,44,45], Barents Sea [46] and, of course, the Baltic Sea [20]. In our study site, the longest MHWs were recorded in recent years (e.g., 57 days in 2021, 26 days in 2018, and 25 days in 2018), whereas at the beginning of the analyzed period (in the early 1990s), they were relatively rare and short, lasting up to ~1 week. It is interesting to note that a distinctly long 26-day MHW was recorded in the Black Sea as early as 1994, although the general temporal trend within the basin shows an increase in average MHW duration from around 6 to >10 days between 2010 and 2020 [18]. The average MHW duration of around 11 days that was found in our study region is similar to the general characteristics of MHWs in the Baltic Sea, i.e., on average, 10–10.5 days in spring and summer [21]. In our study, we also found that the total number of MHW days during the warm May–August period can span from several weeks up to even two months (e.g., in 2021). Such prolonged periods of warmer-than-usual waters during high tourist season may increase recreational exposure to water, but, at the same time, may also pose a risk to human health, as potentially harmful vibrio species such as V. cholerae thrive in low-salinity warm (SSTs > 18 °C) water [41], making the Baltic Sea a favorable environment during marine heatwaves. It is also important to note that marine heatwaves affect the open waters of the Baltic Sea as well, where water temperatures during an MHW might exceed the 90th percentile by up to 5–6 °C. This is somewhat similar to the maximum MHW intensities recorded in the Mediterranean Sea, i.e., during severe MHW events, the intensities reached more than 6 °C [44]. However, as the SST records show, such high MHW intensities in our study region do not last very long; instead, they are more localized and random in nature.
In Figure 8, it is seen that during marine heatwaves, water temperatures exceeding 18 °C are consistently observed from June onwards, sometimes even reaching values as high as 25 °C, which is more typical of tropical seas than for the seas of temperate climate. Baltic Sea water temperatures exceeding 18 °C in summer may favor cyanobacteria blooms; therefore, increased potential for cyanobacteria blooms may negatively impact the bathing water quality and actually hinder the benefit of MHW-related water temperature increase for tourism [47].
In addition, such high SST values during MHWs might actually be linked to the increased presence of cyanobacteria blooms. The intense blooms may amplify the short-term SST increase in localized cyanobacteria-bloom areas compared to surrounding waters; thus, the areas with cyanobacteria blooms can be significantly warmer (by a maximum of 4.5 °C in the Baltic Sea) than the areas with no algal surface accumulations [29].
In our study, we also discovered that during prolonged marine heatwaves, not only surface waters warmed up, but also deeper layers were affected, with temperatures reaching as high as 21 °C at 20 m depth. The latter was also found in other studies, with marine heatwaves primarily affecting water depths of less than 20 m. This, in turn, led to a decrease in oxygen concentration [20] as the solubility of oxygen decreases with increasing temperature [48], deteriorating oxygen conditions in the bottom layers during MHWs. In addition, our findings also suggest that coastal upwelling in the Baltic Sea may diminish the effects of marine heatwaves in the coastal areas, or, as was found in other studies, it may prevent open-water MHWs from reaching the shore [49]. However, more studies are needed to understand the combined impacts of consecutive MHW and upwelling events on the ecosystems, as sudden temperature changes can have a profound impact on coastal ecosystems through the direct effects of temperature on species performance, and indirectly through species interactions [50].

5. Conclusions

This paper analyzed marine heatwave events in the SE Baltic Sea region during the warm (May–August) period of 1993–2023 utilizing a combination of long-term in situ data, field measurements, and satellite-derived sea surface temperature data. Overall, our findings suggest that MHWs have become slightly more frequent in recent years along the SE Baltic Sea coast compared to the initial period of analysis, i.e., from the average warm season number of MHW events being 0.6 at Palanga and 0.3 at Nida during 1993–2002 to around 1 event within the last decade of 2013–2023. However, what is particularly concerning is that the duration of a single event and total cumulative MHW days during the warm season are increasing very rapidly, as a significant positive trend was observed. While short-lived (5–9 days) marine heatwave events typically dominated, exceptions have been noted in recent years, including prolonged heatwaves exceeding three weeks in 2018 and 2019, and a record-breaking 57-day event in 2021. It was also found that the water temperature during MHW events typically exceeded the 90th percentile by up to 2 °C in approximately 66% of daily records, with roughly 14% of records showing temperature increases of 3–6 °C higher than the 90th percentile value, although the occurrences of ΔTs up to 5–6 °C were relatively rare. The 2021 MHW event was selected for more in-depth analysis as it was the longest and most intense MHW event recorded within the analyzed period. During this event, the average monthly water temperature in July exceeded the climatological monthly mean by more than 4 °C, with temperatures peaking up to 25.5 °C, as the coastal records at Nida have shown. The analysis of satellite SST measurements and data from oceanographic surveys also demonstrated that the impact of MHWs was affecting both the coastal and the open waters, heating not only surface waters but the deeper (20 m depth) parts of the sea as well.

Author Contributions

Conceptualization T.D.; methodology, T.D.; formal analysis, T.D. and I.S.; investigation, T.D. and I.S.; resources, T.D. and I.S.; data curation, T.D. and I.S.; writing—original draft preparation, T.D.; writing—review and editing, T.D. and I.S.; visualization, T.D.; supervision, T.D. All authors have read and agreed to the published version of the manuscript.

Funding

This research received no external funding.

Institutional Review Board Statement

Not applicable.

Informed Consent Statement

Not applicable.

Data Availability Statement

The satellite data used in this work are publicly available online through the NASA OceanColor website (http://oceancolor.gsfc.nasa.gov/, accessed on 12 January 2024). In situ data are available on request from the Lithuanian Hydrometeorological Service and Marine Environmental Assessment Division of the Lithuanian Environmental Protection Agency.

Acknowledgments

The authors are grateful to the Lithuanian Hydrometeorological Service under the Ministry of Environment and to the Marine Environmental Assessment Division of the Lithuanian Environmental Protection Agency for providing the in situ monitoring data. The authors are also grateful to E. Tiškus for providing technical support. T.D. acknowledges the support of Klaipeda University Post-Doctoral Fellowship Program.

Conflicts of Interest

The authors declare no conflicts of interest. The funders had no role in the design of the study; in the collection, analyses, or interpretation of data; in the writing of the manuscript; or in the decision to publish the results.

References

  1. HELCOM. State of the Baltic Sea. Third HELCOM Holistic Assessment 2016–2021. Baltic Sea Environment Proceedings n°194. 2023. Available online: https://helcom.fi/baltic-sea-trends/holistic-assessments/state-of-the-baltic-sea-2023/ (accessed on 12 February 2024).
  2. HELCOM. The Baltic Marine Environment 1999–2002. Baltic Sea Environment Proceedings No. 87. 2003. Available online: https://helcom.fi/wp-content/uploads/2019/10/BSEP87.pdf (accessed on 12 February 2024).
  3. Franz, M.; Lieberum, C.; Bock, G.; Karez, R. Environmental Parameters of Shallow Water Habitats in the SW Baltic Sea. Earth Syst. Sci. Data 2019, 11, 947–957. [Google Scholar] [CrossRef]
  4. Intergovernmental Panel on Climate Change (IPCC). Summary for Policymakers. In Climate Change 2013: The Physical Science Basis. Contribution of Working Group I to the Fifth Assessment Report of the Intergovernmental Panel on Climate Change; Stocker, T.F., Qin, D., Plattner, G.-K., Tignor, M., Allen, S.K., Boschung, J., Nauels, A., Xia, Y., Bex, V., Midgley, P.M., Eds.; Cambridge University Press: Cambridge, UK, 2013. [Google Scholar]
  5. Dutheil, C.; Meier, H.E.M.; Gröger, M.; Börgel, F. Warming of Baltic Sea Water Masses since 1850. Clim. Dyn. 2023, 61, 1311–1331. [Google Scholar] [CrossRef]
  6. HELCOM. Climate Change in the Baltic Sea Area: HELCOM Thematic Assessment in 2013. Baltic Sea Environment Proceedings No. 137. 2013. Available online: https://www.helcom.fi/wp-content/uploads/2019/10/BSEP137.pdf (accessed on 12 February 2024).
  7. Meier, H.E.M.; Dieterich, C.; Gröger, M.; Dutheil, C.; Börgel, F.; Safonova, K.; Christensen, O.B.; Kjellström, E. Oceanographic Regional Climate Projections for the Baltic Sea until 2100. Earth Syst. Dyn. 2022, 13, 159–199. [Google Scholar] [CrossRef]
  8. Zalewska, T.; Wilman, B.; Łapeta, B.; Marosz, M.; Biernacik, D.; Wochna, A.; Saniewski, M.; Grajewska, A.; Iwaniak, M. Seawater temperature changes in the southern Baltic Sea (1959–2019) forced by climate change. Oceanologia 2023, 66, 37–55. [Google Scholar] [CrossRef]
  9. Idzelytė, R.; Čerkasova, N.; Mėžinė, J.; Dabulevičienė, T.; Razinkovas-Baziukas, A.; Ertürk, A.; Umgiesser, G. Coupled Hydrological and Hydrodynamic Modelling Application for Climate Change Impact Assessment in the Nemunas River Watershed–Curonian Lagoon–Southeastern Baltic Sea Continuum. Ocean Sci. 2023, 19, 1047–1066. [Google Scholar] [CrossRef]
  10. Marin, M.; Feng, M.; Phillips, H.E.; Bindoff, N.L. A Global, Multiproduct Analysis of Coastal Marine Heatwaves: Distribution, Characteristics, and Long-Term Trends. J. Geophys. Res. Oceans 2021, 126, e2020JC016708. [Google Scholar] [CrossRef]
  11. Lonhart, S.I.; Jeppesen, R.; Beas-Luna, R.; Crooks, J.A.; Lorda, J. Shifts in the Distribution and Abundance of Coastal Marine Species along the Eastern Pacific Ocean during Marine Heatwaves from 2013 to 2018. Mar. Biodivers. Rec. 2019, 12, 13. [Google Scholar] [CrossRef]
  12. Welch, H.; Savoca, M.S.; Brodie, S.; Jacox, M.G.; Muhling, B.A.; Clay, T.A.; Cimino, M.A.; Benson, S.R.; Block, B.A.; Conners, M.G.; et al. Impacts of Marine Heatwaves on Top Predator Distributions Are Variable but Predictable. Nat. Commun. 2023, 14, 5188. [Google Scholar] [CrossRef] [PubMed]
  13. Garrabou, J.; Gómez-Gras, D.; Medrano, A.; Cerrano, C.; Ponti, M.; Schlegel, R.; Bensoussan, N.; Turicchia, E.; Sini, M.; Gerovasileiou, V.; et al. Marine Heatwaves Drive Recurrent Mass Mortalities in the Mediterranean Sea. Glob. Change Biol. 2022, 28, 5708–5725. [Google Scholar] [CrossRef]
  14. Roberts, S.D.; Van Ruth, P.D.; Wilkinson, C.; Bastianello, S.S.; Bansemer, M.S. Marine Heatwave, Harmful Algae Blooms and an Extensive Fish Kill Event During 2013 in South Australia. Front. Mar. Sci. 2019, 6, 610. [Google Scholar] [CrossRef]
  15. Dayan, H.; McAdam, R.; Juza, M.; Masina, S.; Speich, S. Marine Heat Waves in the Mediterranean Sea: An Assessment from the Surface to the Subsurface to Meet National Needs. Front. Mar. Sci. 2023, 10, 1045138. [Google Scholar] [CrossRef]
  16. Pastor, F.; Khodayar, S. Marine Heat Waves: Characterizing a Major Climate Impact in the Mediterranean. Sci Total Environ 2023, 861, 160621. [Google Scholar] [CrossRef]
  17. Androulidakis, Y.S.; Krestenitis, Y.N. Sea Surface Temperature Variability and Marine Heat Waves over the Aegean, Ionian, and Cretan Seas from 2008–2021. J. Mar. Sci. Eng. 2022, 10, 42. [Google Scholar] [CrossRef]
  18. Mohamed, B.; Ibrahim, O.; Nagy, H. Sea Surface Temperature Variability and Marine Heatwaves in the Black Sea. Remote Sens. 2022, 14, 2383. [Google Scholar] [CrossRef]
  19. Gröger, M.; Dutheil, C.; Börgel, F.; Meier, M.H.E. Drivers of Marine Heatwaves in a Stratified Marginal Sea. Clim. Dyn. 2024, 62, 3231–3243. [Google Scholar] [CrossRef]
  20. Safonova, K.; Meier, H.E.M.; Gröger, M. Summer Heatwaves on the Baltic Sea Seabed Contribute to Oxygen Deficiency in Shallow Areas. Commun. Earth Environ. 2024, 5, 1–12. [Google Scholar] [CrossRef]
  21. Travkin, V.S.; Tikhonova, N.A.; Zakharchuk, E.A. Characteristics of Marine Heatwaves of the Baltic Sea for 1993–2022 and Their Driving Factors. Pure Appl. Geophys. 2024, 1–15. [Google Scholar] [CrossRef]
  22. Oliver, E.C.J.; Burrows, M.T.; Donat, M.G.; Sen Gupta, A.; Alexander, L.V.; Perkins-Kirkpatrick, S.E.; Benthuysen, J.A.; Hobday, A.J.; Holbrook, N.J.; Moore, P.J.; et al. Projected Marine Heatwaves in the 21st Century and the Potential for Ecological Impact. Front. Mar. Sci. 2019, 6, 734. [Google Scholar] [CrossRef]
  23. Kauppi, L.; Villnäs, A. Marine Heatwaves of Differing Intensities Lead to Distinct Patterns in Seafloor Functioning. Proc. R. Soc. B 2022, 289, 20221159. [Google Scholar] [CrossRef]
  24. Conley, D.J.; Carstensen, J.; Aigars, J.; Axe, P.; Bonsdorff, E.; Eremina, T.; Haahti, B.-M.; Humborg, C.; Jonsson, P.; Kotta, J.; et al. Hypoxia Is Increasing in the Coastal Zone of the Baltic Sea. Environ. Sci. Technol. 2011, 45, 6777–6783. [Google Scholar] [CrossRef]
  25. Humborg, C.; Geibel, M.C.; Sun, X.; McCrackin, M.; Mörth, C.-M.; Stranne, C.; Jakobsson, M.; Gustafsson, B.; Sokolov, A.; Norkko, A.; et al. High Emissions of Carbon Dioxide and Methane From the Coastal Baltic Sea at the End of a Summer Heat Wave. Front. Mar. Sci. 2019, 6, 493. [Google Scholar] [CrossRef]
  26. Kozlov, I.; Dailidienė, I.; Korosov, A.; Klemas, V.; Mingėlaitė, T. MODIS-Based Sea Surface Temperature of the Baltic Sea Curonian Lagoon. J. Mar. Syst. 2014, 129, 157–165. [Google Scholar] [CrossRef]
  27. Zhu, S.; Luo, Y.; Ptak, M.; Sojka, M.; Ji, Q.; Choiński, A.; Kuang, M. A hybrid model for the forecasting of sea surface water temperature using the information of air temperature: A case study of the Baltic Sea. All Earth 2022, 34, 27–38. [Google Scholar] [CrossRef]
  28. Dabuleviciene, T.; Kozlov, I.E.; Vaiciute, D.; Dailidiene, I. Remote Sensing of Coastal Upwelling in the South-Eastern Baltic Sea: Statistical Properties and Implications for the Coastal Environment. Remote Sens. 2018, 10, 1752. [Google Scholar] [CrossRef]
  29. Vaičiūtė, D.; Sokolov, Y.; Bučas, M.; Dabulevičienė, T.; Zotova, O. Earth Observation-Based Cyanobacterial Bloom Index Testing for Ecological Status Assessment in the Open, Coastal and Transitional Waters of the Baltic and Black Seas. Remote Sens. 2024, 16, 696. [Google Scholar] [CrossRef]
  30. Hobday, A.J.; Alexander, L.V.; Perkins, S.E.; Smale, D.A.; Straub, S.C.; Oliver, E.C.J.; Benthuysen, J.A.; Burrows, M.T.; Donat, M.G.; Feng, M.; et al. A Hierarchical Approach to Defining Marine Heatwaves. Prog. Oceanogr. 2016, 141, 227–238. [Google Scholar] [CrossRef]
  31. Schlegel, R.W.; Oliver, E.C.J.; Hobday, A.J.; Smit, A.J. Detecting Marine Heatwaves With Sub-Optimal Data. Front. Mar. Sci. 2019, 6, 737. [Google Scholar] [CrossRef]
  32. Uiboupin, R.; Laanemets, J. Upwelling Characteristics Derived from Satellite Sea Surface Temperature Data in the Gulf of Finland, Baltic Sea. Boreal Environ. Res. 2009, 14, 297–304. [Google Scholar]
  33. Delpeche-Ellmann, N.; Mingelaitė, T.; Soomere, T. Examining Lagrangian Surface Transport during a Coastal Upwelling in the Gulf of Finland, Baltic Sea. J. Mar. Syst. 2017, 171, 21–30. [Google Scholar] [CrossRef]
  34. Dabuleviciene, T.; Vaiciute, D.; Kozlov, I.E. Chlorophyll—A Variability during Upwelling Events in the South-Eastern Baltic Sea and in the Curonian Lagoon from Satellite Observations. Remote Sens. 2020, 12, 3661. [Google Scholar] [CrossRef]
  35. Green, T.J.; Siboni, N.; King, W.L.; Labbate, M.; Seymour, J.R.; Raftos, D. Simulated Marine Heat Wave Alters Abundance and Structure of Vibrio Populations Associated with the Pacific Oyster Resulting in a Mass Mortality Event. Microb. Ecol. 2019, 77, 736–747. [Google Scholar] [CrossRef]
  36. Masanja, F.; Yang, K.; Xu, Y.; He, G.; Liu, X.; Xu, X.; Xiaoyan, J.; Xin, L.; Mkuye, R.; Deng, Y.; et al. Impacts of Marine Heat Extremes on Bivalves. Front. Mar. Sci. 2023, 10, 1159261. [Google Scholar] [CrossRef]
  37. Brown, M.V.; Ostrowski, M.; Messer, L.F.; Bramucci, A.; van de Kamp, J.; Smith, M.C.; Bissett, A.; Seymour, J.; Hobday, A.J.; Bodrossy, L. A Marine Heatwave Drives Significant Shifts in Pelagic Microbiology. Commun. Biol. 2024, 7, 125. [Google Scholar] [CrossRef] [PubMed]
  38. Smith, K.E.; Burrows, M.T.; Hobday, A.J.; Gupta, A.S.; Moore, P.J.; Thomsen, M.; Wernberg, T.; Smale, D.A. Socioeconomic Impacts of Marine Heatwaves: Global Issues and Opportunities. Science 2021, 374, eabj3593. [Google Scholar] [CrossRef]
  39. Gao, G.; Zhao, X.; Jiang, M.; Gao, L. Impacts of Marine Heatwaves on Algal Structure and Carbon Sequestration in Conjunction With Ocean Warming and Acidification. Front. Mar. Sci. 2021, 8, 758651. [Google Scholar] [CrossRef]
  40. Spillman, C.M.; Smith, G.A.; Hobday, A.J.; Hartog, J.R. Onset and Decline Rates of Marine Heatwaves: Global Trends, Seasonal Forecasts and Marine Management. Front. Clim. 2021, 3, 801217. [Google Scholar] [CrossRef]
  41. Baker-Austin, C.; Trinanes, J.A.; Salmenlinna, S.; Löfdahl, M.; Siitonen, A.; Taylor, N.G.H.; Martinez-Urtaza, J. Heat Wave–Associated Vibriosis, Sweden and Finland, 2014. Emerg. Infect. Dis. 2016, 22, 1216–1220. [Google Scholar] [CrossRef] [PubMed]
  42. Brehm, T.T.; Berneking, L.; Martins, M.S.; Dupke, S.; Jacob, D.; Drechsel, O.; Bohnert, J.; Becker, K.; Kramer, A.; Christner, M.; et al. Heatwave-Associated Vibrio Infections in Germany, 2018 and 2019. Eurosurveillance 2021, 26, 2002041. [Google Scholar] [CrossRef]
  43. Mohamed, B.; Barth, A.; Alvera-Azcárate, A. Extreme Marine Heatwaves and Cold-Spells Events in the Southern North Sea: Classifications, Patterns, and Trends. Front. Mar. Sci. 2023, 10, 1258117. [Google Scholar] [CrossRef]
  44. Hamdeno, M.; Alvera-Azcaráte, A. Marine Heatwaves Characteristics in the Mediterranean Sea: Case Study the 2019 Heatwave Events. Front. Mar. Sci. 2023, 10, 1093760. [Google Scholar] [CrossRef]
  45. Simon, A.; Pires, C.; Frölicher, T.L.; Russo, A. Long-Term Warming and Interannual Variability Contributions’ to Marine Heatwaves in the Mediterranean. Weather Clim. Extrem. 2023, 42, 100619. [Google Scholar] [CrossRef]
  46. Mohamed, B.; Nilsen, F.; Skogseth, R. Marine Heatwaves Characteristics in the Barents Sea Based on High Resolution Satellite Data (1982–2020). Front. Mar. Sci. 2022, 9, 821646. [Google Scholar] [CrossRef]
  47. Neumann, T.; Eilola, K.; Gustafsson, B.; Müller-Karulis, B.; Kuznetsov, I.; Meier, H.E.M.; Savchuk, O.P. Extremes of temperature, oxygen and blooms in the Baltic Sea in a changing climate. Ambio 2012, 41, 574–585. [Google Scholar] [CrossRef] [PubMed]
  48. Mahaffey, C.; Palmer, M.; Greenwood, N.; Sharples, J. Impacts of Climate Change on Dissolved Oxygen Concentration Relevant to the Coastal and Marine Environment around the UK. MCCIP Sci. Rev. 2020, 31–53. [Google Scholar] [CrossRef]
  49. Izquierdo, P.; Taboada, F.G.; González-Gil, R.; Arrontes, J.; Rico, J.M. Alongshore Upwelling Modulates the Intensity of Marine Heatwaves in a Temperate Coastal Sea. Sci Total Environ 2022, 835, 155478. [Google Scholar] [CrossRef]
  50. Iles, A.C.; Gouhier, T.C.; Menge, B.A.; Stewart, J.S.; Haupt, A.J.; Lynch, M.C. Climate-Driven Trends and Ecological Implications of Event-Scale Upwelling in the California Current System. Glob. Change Biol. 2012, 18, 783–796. [Google Scholar] [CrossRef]
Figure 1. Map of the study site.
Jmse 12 01109 g001
Figure 2. (a,c) Number of MHWs in May–August, (b,d) total number of MHW days in May–August. The red solid line is the change trend in MHW events and total days, the red dotted line indicates the 95% confidence interval of the trend line. The green lines show the mean value of total MHW events/days during May–August over 1993–2002, the blue lines show the mean value over 2003–2012, and the black lines show the mean value over 2013–2023.
Jmse 12 01109 g002
Figure 3. (a) Histogram distribution of MHW duration; (b) MHW intensity (ΔT, °C); (c) maximum MHW intensity in different months in the open waters (EEZ), territorial waters, and at coastal stations.
Jmse 12 01109 g003
Figure 4. Development of major MHW in the summer of 2021 from Nida and Palanga coastal records.
Jmse 12 01109 g004
Figure 5. (A) Mean and (B) maximum intensity of 2021 marine heatwave in terms of the difference between observed water temperature and the corresponding 90th percentile value.
Jmse 12 01109 g005
Figure 6. Satellite SST images (left) and vertical water temperature profiles (right) depicting the situation during the presence/absence of MHWs. Locations of in situ measurements for vertical temperature profiles are marked with a “+” sign.
Jmse 12 01109 g006
Figure 7. (a) Satellite SST images indicating the presence of coastal upwelling and MHW, (b) water temperature measurements from coastal stations.
Jmse 12 01109 g007
Figure 8. Highest recorded temperatures at Palanga and Nida coastal stations during MHW events in different months.
Jmse 12 01109 g008
Disclaimer/Publisher’s Note: The statements, opinions and data contained in all publications are solely those of the individual author(s) and contributor(s) and not of MDPI and/or the editor(s). MDPI and/or the editor(s) disclaim responsibility for any injury to people or property resulting from any ideas, methods, instructions or products referred to in the content.

