Article

Impact of Anthropogenic Activities on Sedimentary Records in the Lingdingyang Estuary of the Pearl River Delta, China

1
School of Ocean Engineering and Technology, Sun Yat-sen University, Zhuhai 519082, China
2
Southern Marine Science and Engineering, Guangdong Laboratory (Zhuhai), Zhuhai 519082, China
3
Guangdong Province Engineering Research Center of Coasts, Islands and Reefs, Guangzhou 510275, China
*
Author to whom correspondence should be addressed.
J. Mar. Sci. Eng. 2024, 12(7), 1139; https://doi.org/10.3390/jmse12071139 (registering DOI)
Submission received: 18 June 2024 / Revised: 2 July 2024 / Accepted: 4 July 2024 / Published: 6 July 2024
(This article belongs to the Section Coastal Engineering)

Abstract

:
High-intensity anthropogenic activities have greatly altered the estuarine-shelf depositional processes of sediments, and the intensity and frequency of the impacts of human interventions have far exceeded the natural development of estuarine systems. Since the reform and opening up, human activities such as dams, sand mining, channel dredging, and reclamation have already caused anomalous changes in the dynamical–sedimentary–geomorphological processes of the Lingdingyang Estuary (LE). Analyzing the impact of high-intensity anthropogenic activities on sedimentary processes and the hydrodynamic environment through sedimentary records can provide a scientific basis for predicting the evolution of the estuary and the sustainable development of the Guangdong–Hongkong–Macao Greater Bay Area. The aims of this study are to reveal the impact of varying intensity human activities across different periods on depositional pattern and conduct a preliminary investigation into the spatial differences in sedimentary characteristic attributed to human activities. Two cores (LD11 and LD13) located in the LE were selected for continuous scanning of high-resolution XRF, grain size, and 210Pbex dating tests, and scrutinized with the previous studies of the historical process of human activities in the LE. The results show the following: (1) The abrupt alterations in 210Pbex, geochemical indices, and grain size in LD13 happened in close proximity to the 95 cm layer, suggesting a shift in the sedimentary environment during 1994. (2) In the context of the continuous reduction in water and sediment flux into the LE after 1994, the large-scale and high-intensity human activities like sand mining, channel dredging, and reclamation are responsible for the sedimentation rate increase rather than decrease, the coarsening of sediment fractions, the frequent fluctuations in Zr/Rb, Zr/Al, Sr/Fe, and Sr/Al ratios, and the increase in anomalous extremes. (3) Sedimentary records found in locations varying in anthropogenic intensities differ greatly. Compared with the nearshore siltation area, the grain size composition in the channel area is noticeably coarser and exhibits a wider range of grain size variations. The 210Pbex is strongly perturbed and the vertical distribution is disturbed; the phenomenon of multiple inversions from the surface downwards is shown, making it impossible to carry out sedimentation rate and dating analysis, and the geochemical indicators have changed drastically without any obvious pattern. The evidence of the human activities can be retrieved in the sedimentary record of the estuary and provide a different angle to examine the impacts of the human activities.

1. Introduction

Estuaries are located at the junctions of rivers and seas. They are subjected to strong land and sea interactions, and are also sensitive areas where various interface elements in the Earth system penetrate and interact with each other [1]. Moreover, estuaries, abundant in resources, densely populated, and highly urbanized, are the core areas of economic development and have active anthropopressure. Their sedimentary environments are particularly sensitive to the response of watershed human activities and changes in the marine environment [2]. The study of the sedimentary record in estuaries has been of great interest due to the complexity of the mechanisms of modern sedimentary evolution and the frequent hydrodynamic changes in the estuaries [3,4,5,6].
Strongly anthropogenic activities in the basin have resulted in dramatic changes in the estuarine sediment fluxes and dynamical properties, which have led to heterogeneous dynamical–sedimentary–geomorphic processes in the estuary [7], and the state of the estuarine system is also changing [8]. Many major estuaries in the world, such as the Mississippi River [9,10], Mekong River [11], Yellow River [12], and Yangtze River [13,14], have experienced a sharp decrease in sediment load into the sea because of damming, land reclamation, dredging, and sand mining, resulting in complex sedimentary dynamic backgrounds and drastic changes in estuarine topography, sedimentary processes, and mode transitions [7]. With the deepening influence of anthropogenic factors, changes in the estuarine coastal environments have become more significant and rapid. Especially, in specific periods and regions, anthropogenic factors have surpassed natural effects and have become the dominant factors affecting the sedimentation dynamics, sedimentation rate, and sedimentation process in estuaries.
Lingdingyang Estuary (LE) is one of the largest and most important estuaries in South China, located in the core area of the Guangdong–Hong Kong–Macao Greater Bay Area, and is a typical representative and hotspot for studying the evolution of an estuarine sedimentary environment under the impact of human activities. Before the 1980s, human activities had a relatively small impact on the LE, and the evolution of the estuary was mainly dominated by natural processes. However, the population and economy on both sides of the LE started to grow quickly after the implementation of national reform and opening-up policy. In recent decades, the intensification of human activities, including dam construction, land reclamation, waterway dredging, and sand pumping, in the LE have the potential to change the particle and geochemical compositions of sediments, which are naturally controlled by hydrodynamic and biogeochemical processes [15,16]. Under the influence of a series of strong human activities, the sedimentary pattern and process of the LE have undergone remarkable changes [16]. The accelerated rate of siltation in the LE, influenced by human activities, was measured using bathymetry and shoreline data through modern chart analysis and comparison methods, highlighting changes in sedimentation patterns [17]. However, this method is limited by its reliance on short-term modern charts. Overlaying modern nautical charts with historical charts and integrating remote sensing data to analyze the accelerated sedimentation rates, estuarine area shrinkage, and the transformation of beach and channel landforms in the LE under anthropogenic pressure can be performed [18]. Despite this approach, early nautical charts have lower spatial resolution and accuracy compared to modern ones, potentially leading to deviations. Additionally, the effects of high-intensity human activities on sediment movement, depositional patterns, and depositional mechanisms in the LE were analyzed using sedimentological indicators from core [19]. Although based on the core extent of the time scale of the study and of avoided issues such as large calibration errors of charts of different years and low accuracy of early charts, the sedimentary environment is severely disturbed due to the influence of high-intensity human activities in the LE, and the age of sediments on the centennial scale is difficult to determine, which increases the difficulty of the study. Therefore, there are fewer studies based on cores with continuous sedimentary records to identify the change of the sedimentary environment and response to human activities in the LE.
In this paper, we comprehensively utilize the results of grain size, geological age, and geochemistry of core sediments, combined with the historical process of regional human activities, to explore the sedimentation process of the LE and its response to human activities, as well as temporal differences and implications for spatial differences. On the one hand, this work enriches the sedimentation data of the LE within the century scale by providing high-precision core element scanning results and sedimentation rate. Furthermore, in the situation of the sharp decrease in the amount of sediment inflow from the watershed, the study of modern estuarine sedimentary processes in response to anthropopressure can provide a scientific basis for the development and utilization of resources in the LE, as well as marine ecological environmental protection and restoration.

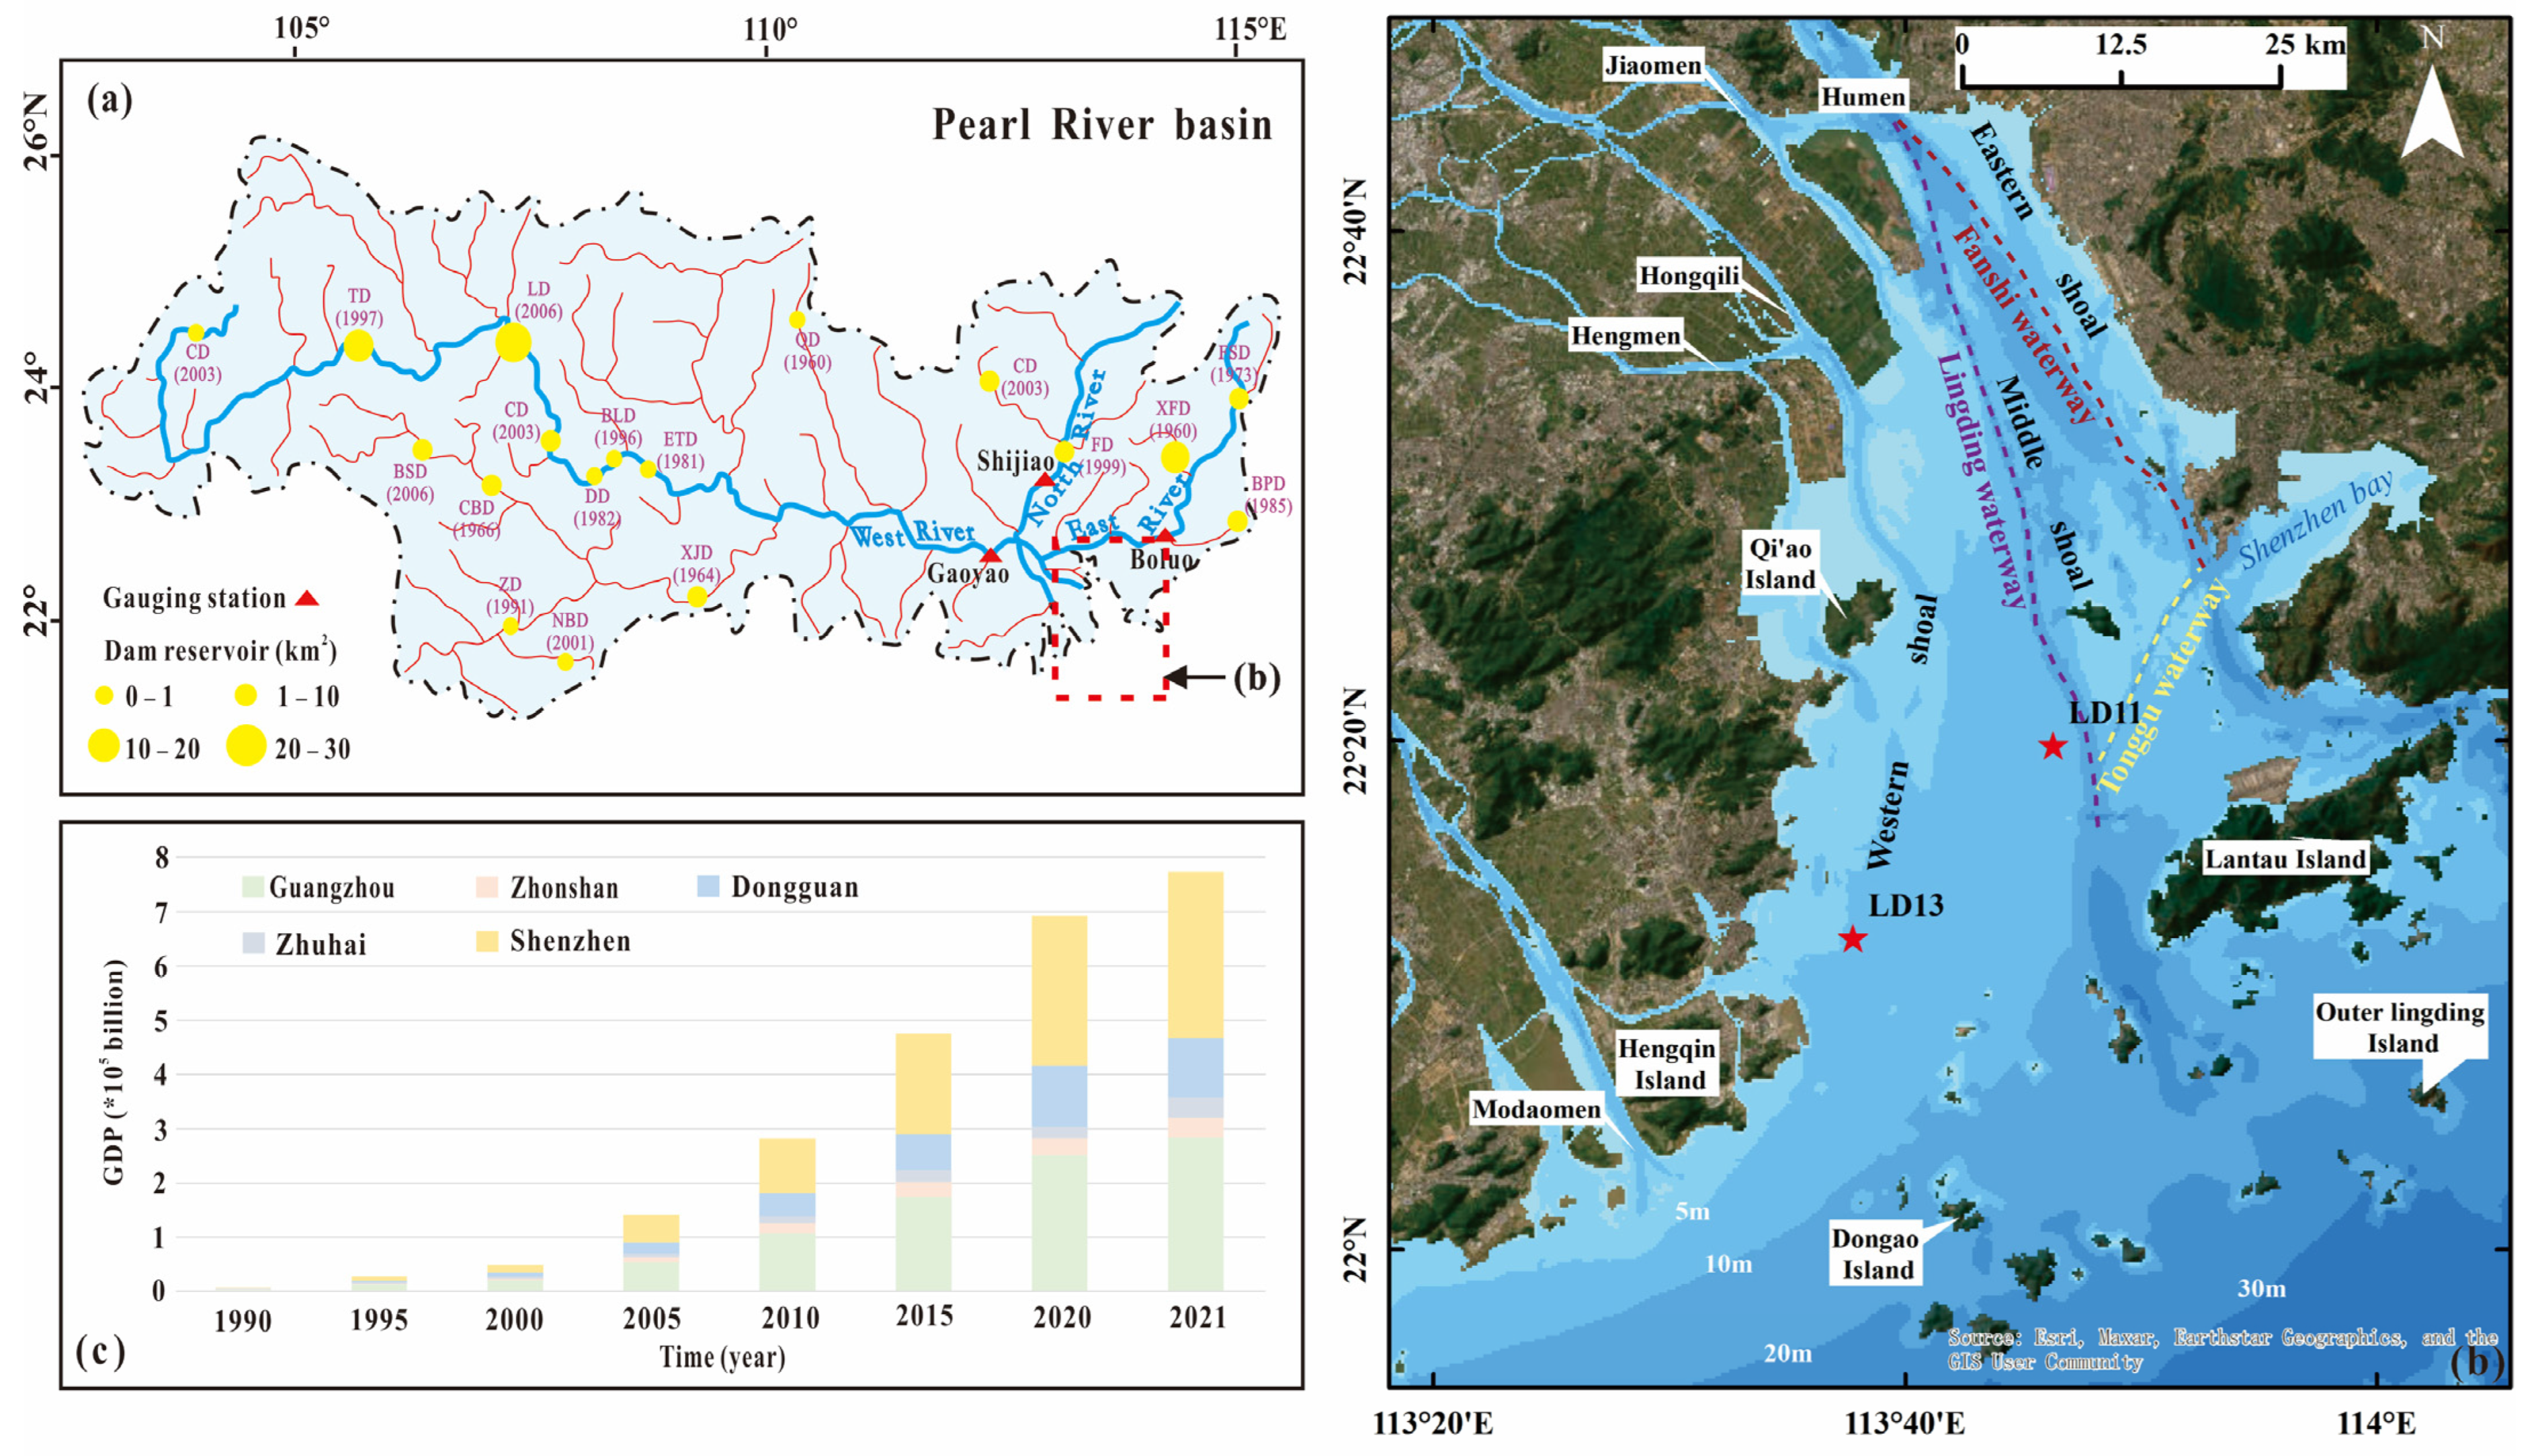
2. Regional Settings

The Lingdingyang Estuary (LE) is located on the south coast of China and flows into the northern part of the South China Sea, with an NNW–SSE trend. Water and sediment from the West River, the North River, and the East River through four outlets (Hengmen, Hongqimen, Jiaomen, and Humen) discharge into the LE (Figure 1a). The hydrological data of the Ministry of Water Resources of the People’s Republic of China from 1954 to 2015 show that the average annual runoff from rivers into the Pearl River estuary is 1741 × 108 m3, and the average annual sediment discharge is 4099 × 104 t, accounting for 61.1% and 54% of the total in the Pearl River, respectively [18], and more than 53% of the runoff and 48% of the total sediment load was incepted in the LE [20,21,22].
There are three major dynamic systems in the LE: (1) Runoff-dominated dynamics in the western and northern sections of Hengmen, Hongqili, and Jiaomen; (2) Tidal-current-dominated dynamics in the northern and central parts of Humen; (3) The control of high-salinity shelf water intrusion in the south and southeastern parts of the LE [23,24,25]. Therefore, runoff, tidal current, and high-salinity shelf water are the main factors controlling sediment movement in the LE. The mixing of runoff, tidal current, salt water, and freshwater, as well as wind and wave action, causes continuous sediment transport.
The most distinctive landform patterns of the LE comprise two troughs and three shoals (Figure 1b). The water depth of the three shoals is shallower than 5 m, namely, west shoals, middle shoals, and east shoals. Two channels are divided by three shoals, i.e., the Lingdingyang waterway (LW, western channel) and the Fanshi waterway (eastern channel), with water depths between 10 and 25 m. Especially, the LW is the main shipping channel of the LE.
The LE is the region with the fastest urbanization and population growth in the world, surrounded by several big cities, e.g., Dongguan, Shenzhen, and Hong Kong at its east, Guangzhou at its north, Zhongshan, and Zhuhai and Macao at its west, and rapid development of the economy, with the number of total gross domestic product nearly CNY 8 × 10⁵ billion (Hong Kong and Macao not included; Figure 1c). Similar to many major estuaries in the world, sediments in the LE have always experienced intensified human perturbation [5,26], including channel dredging, sand mining, land reclamation, bridge building, and fishing [18,27,28]. Hence, the terrain and geomorphic pattern, dynamic processes, and sedimentary characteristics of the LE certainly will undergo significant changes.

3. Materials and Methods

We obtained two cores in the LE to analyze grain size and geochemical elements. Combined with the dating framework, we analyzed the changes in sediment characteristics over time. A literature review was conducted to understand the history of interference of human activities and its intensity differences in distinct locations where the cores have been located over the past decades, with a view to quantifying the sedimentation effects of human disturbance.

3.1. Site Location and Sample Collection

Two cores were collected in April 2023 using a gravity coring tube, and Figure 2 shows the scanning images of these two cores. The sampling site for the core LD11 (22.2089° N, 113.6614° E) was located adjacent to the LW (the main shipping lanes in Pearl River estuary) with a length of 167 cm at a water depth of 6.4 m. Meanwhile, the LD13 (22.3298° N, 113.7488° E) core was located in the western shoal (outside the shipping channel and close to land), with a length of 185 cm at a depth of 5.7 m. The natural sedimentary environments in the region of two cores are significantly different because of the distinct sites between the two cores, which will better ensure that comparative analysis accurately represents the impact of varying degree of anthropogenic activities.

3.2. Laser Particle Size Analysis

Approximately 352 samples were collected for grain size analysis in cores LD11 and LD13. Grain size analysis of 1 cm subsamples (≈10 g) was conducted using a Malvern Mastersizer-3000 laser particle analyzer (Malvern Instruments Ltd., Worcestershire, UK; The measurement range of 0.02–2000 µm with a relative error of <2% for repeated measurements) after pretreating the samples with 0.1 N HCl, 10% H2O2, and 0.5% (NaPO3)6 to remove organic matter and biogenic carbonate and fully disperse the samples, respectively. Grain size parameters were calculated following Folk and Ward [29]. The GRADISTAT v9.1 software developed by Blott and Pyemean was used to calculate the mean grain size (Mz), sorting (S), skewness (Sk), and kurtosis (K) [30]. We adopted the Shepard classification scheme [31] in this study to describe marine sediment types of various sections of the core. The change in grain size can sensitively reflect the evolution of the sedimentary environment [32,33].

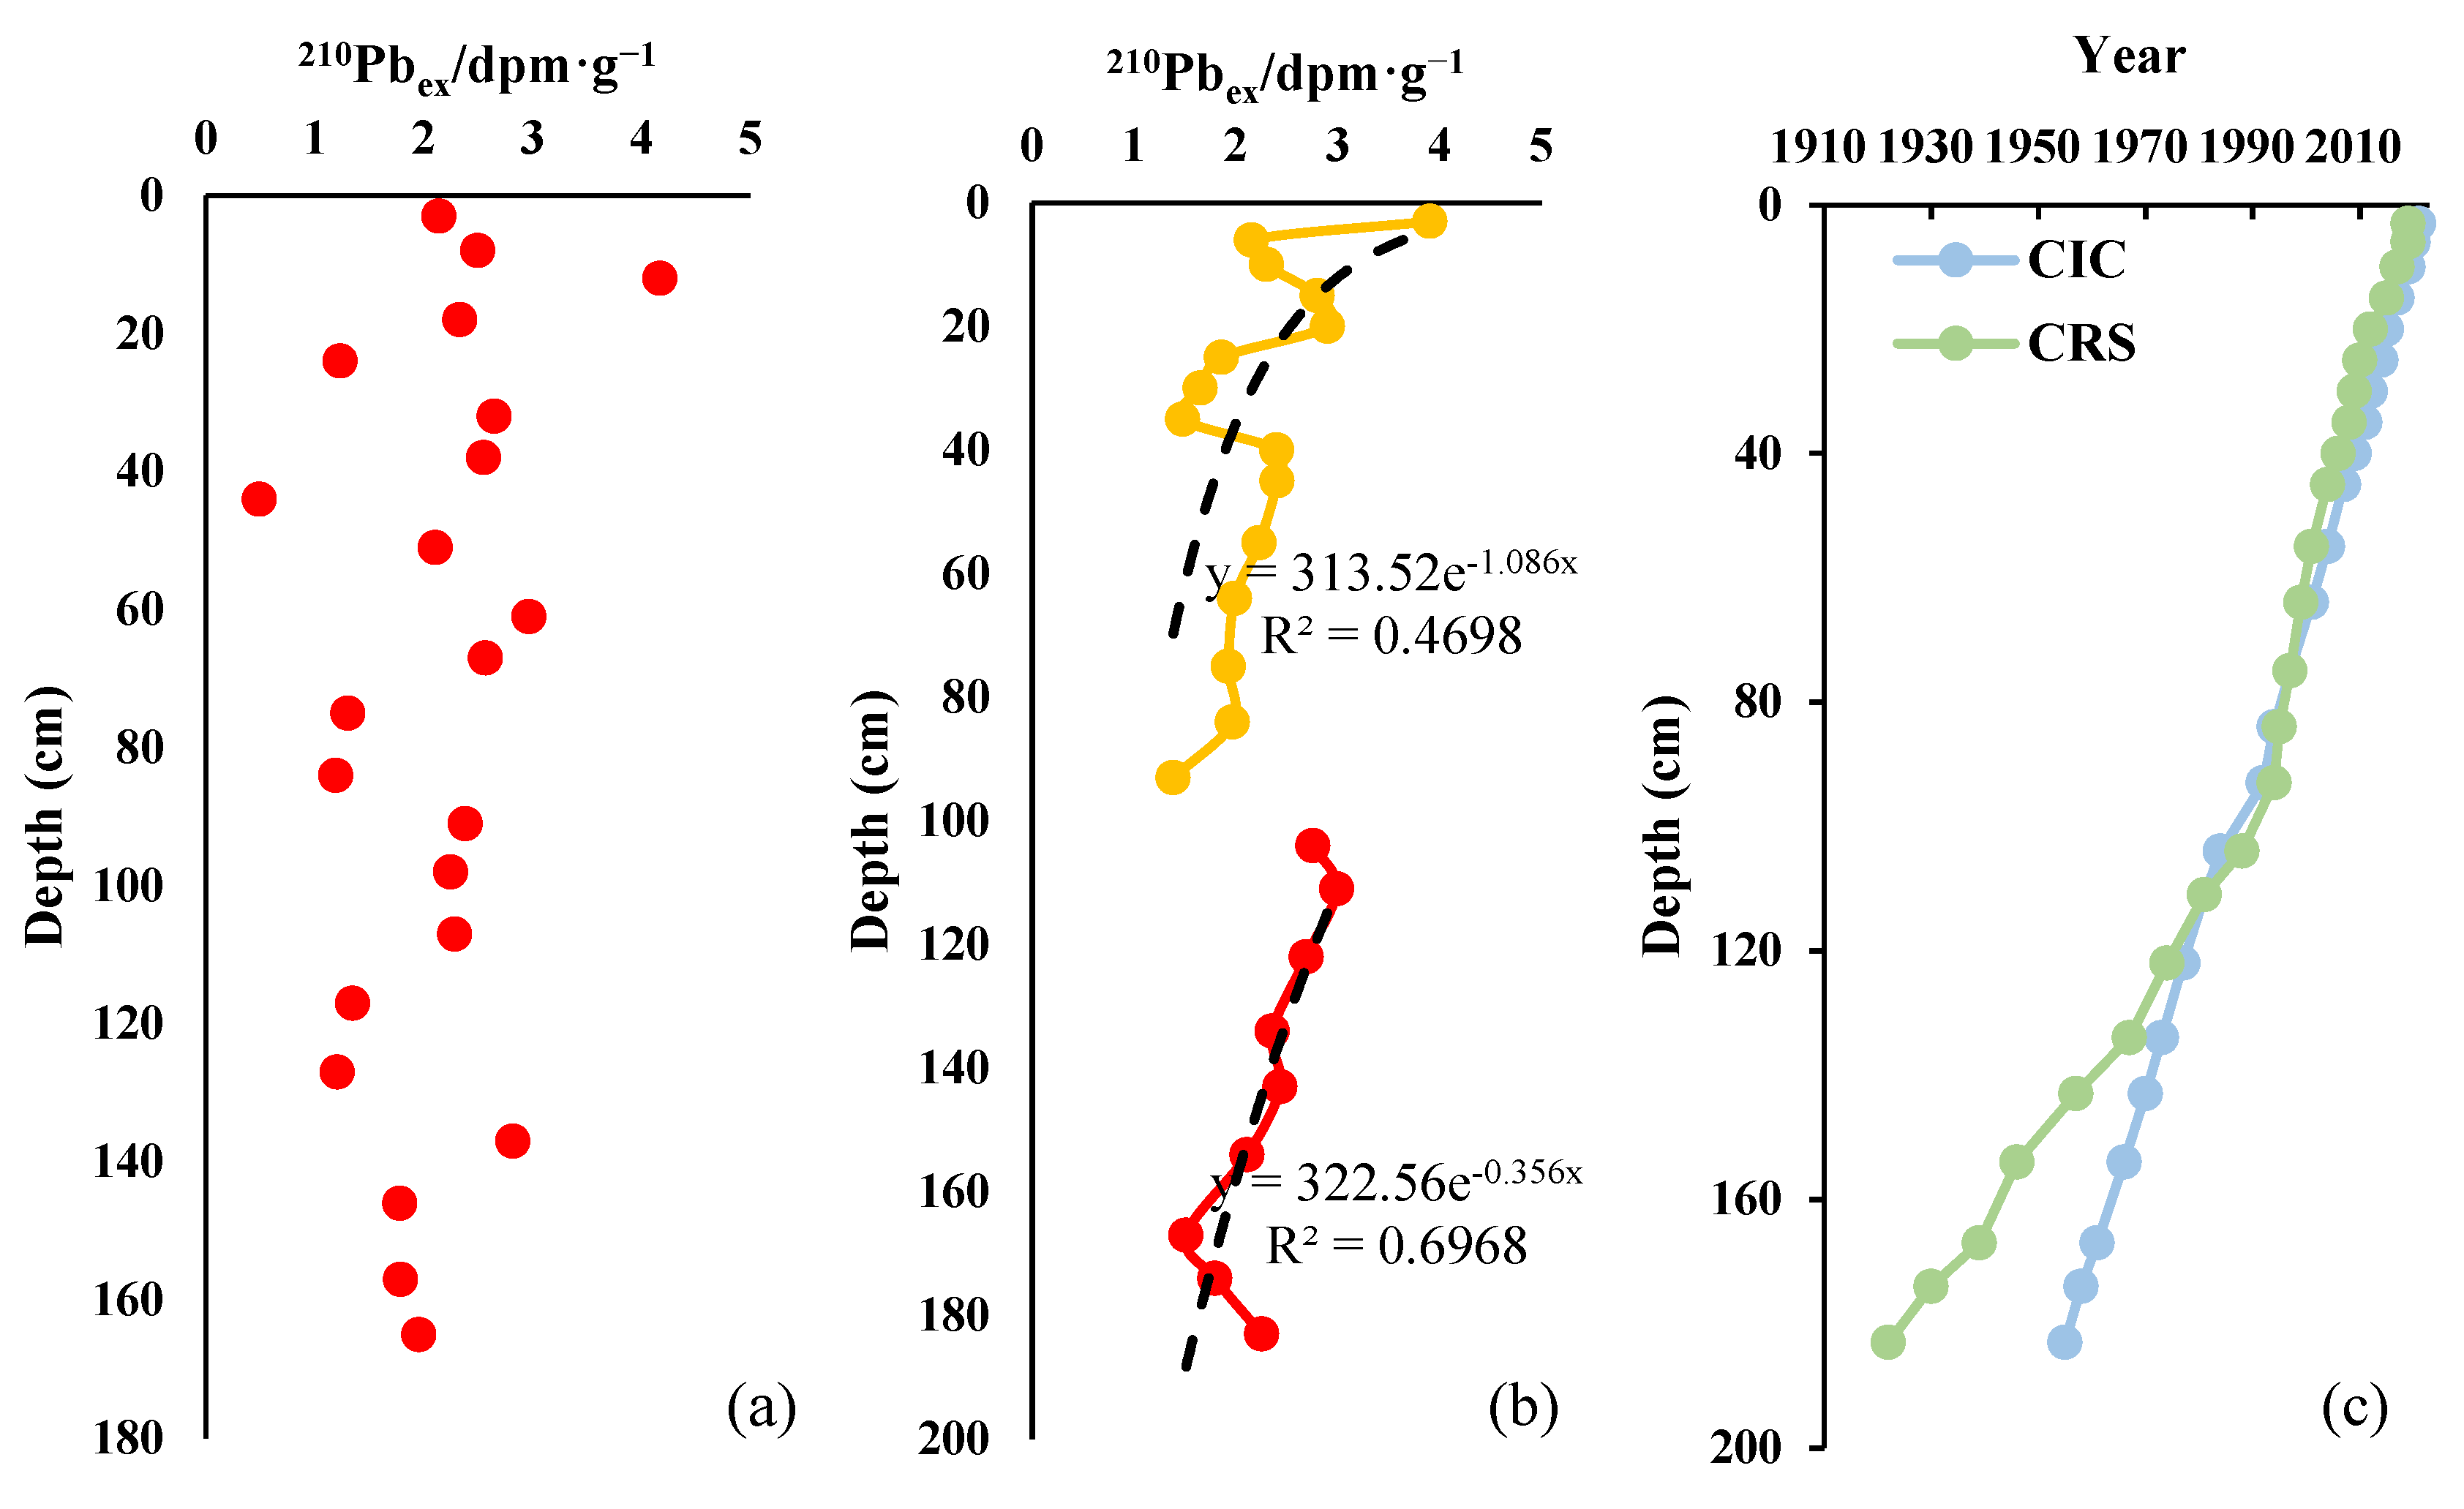
3.3. Radionuclide Analysis

Dating with 210Pb was performed in sediment cores by using the constant initial concentration (CIC) model and constant rate of supply (CRS) model [34,35]. To quantify the sedimentation rate, total 210Pb was determined by alpha spectrometry through its granddaughter 210Po, assuming secular equilibrium. 210Po and 209Po (yield tracer) were spontaneously deposited onto a nickel disc which was counted on a standard silicon surface barrier detector [36]. The dating test was completed at the Key Laboratory of Coastal and Island Development, Nanjing University, Nanjing.

3.4. XRF Core Scan

X-ray fluorescence (XRF) is a well-established analytical technique for estimating the composition of rocks and sediments. The cores were each split into two parts using a GeoTek Core Splitter (Geotek Ltd., Northamptonshire, UK). The XRF analysis of core sediments was performed with an ITRZX™ core scanner (Cox Analytical Systems, Goteborg, Sweden). The cores were analyzed at 0.5 cm intervals for 10 s at 10 Kv and 30 Kv voltages to identify concentrations of elements within the sediments. The concentrations of most elements between Mg and U were tested and obtained finally. Some layers were missing data (LD11: 0~3 cm and 72.5~75 cm; LD13: 0~7 cm and 94.5~103 cm) due to the influence of surface roughness of the sample and potential human error in the sampling and testing process (Figure 2).

4. Results

4.1. Depth–Age Framework

The excess 210Pb radioactivity (210Pbex) corresponding to different depth layers of core LD11 and LD13 is shown in Figure 3. The vertical distribution of 210Pbex in LD11 is relatively disordered, showing multiple inversion phenomena from bottom to surface, making it unsuitable for calculating sedimentation rate and dating (Figure 3a). The 210Pbex profile of LD13 can be divided into two distinct natural decay processes: upper and lower. The upper section of the curve (0~93 cm) exhibits a multistage inverted distribution, especially with large fluctuations from surface to 40 cm, possibly due to marked changes in the sedimentary environment, but overall it shows an exponential decreasing trend with depth. The lower section (93~183 cm) decays in a nearly constant amplitude oscillation, showing an ideal exponential decay trend (Figure 3b). Based on the CIC model, the sedimentation rate of the upper section of LD13 (3.36 cm/y) is greater than that of the lower section (2.73 cm/y), with corresponding sedimentation times from 2023 to 1994 and 1994 to 1956, respectively, with a segmented time of about 1994.
In theory, the CIC model of 210Pbex is suitable for relatively stable sedimentary environments, while the CRS model may provide more accurate dating results for less stable sedimentary environments [15,37]. Therefore, the LD13 chronological sequence calculated using the CRS model is from 1922 to 2021 (Figure 3c). On this basis, two depth chronological frameworks were established for two models. The ages of the sediments at the same depth above 122 cm in the core are basically consistent, with an average time difference of 1.4 years, implying that the dating results are credible. The corresponding sedimentation year at the upper and lower sections of LD13 was 1994. It can be seen that the calculation results of both the CIC model and the CRS model are roughly based on the 1994 (approximately corresponding to the 93 cm location of the core). The sedimentary environment in the area where LD13 is located has been changed, and there are differences in its sedimentation rates.

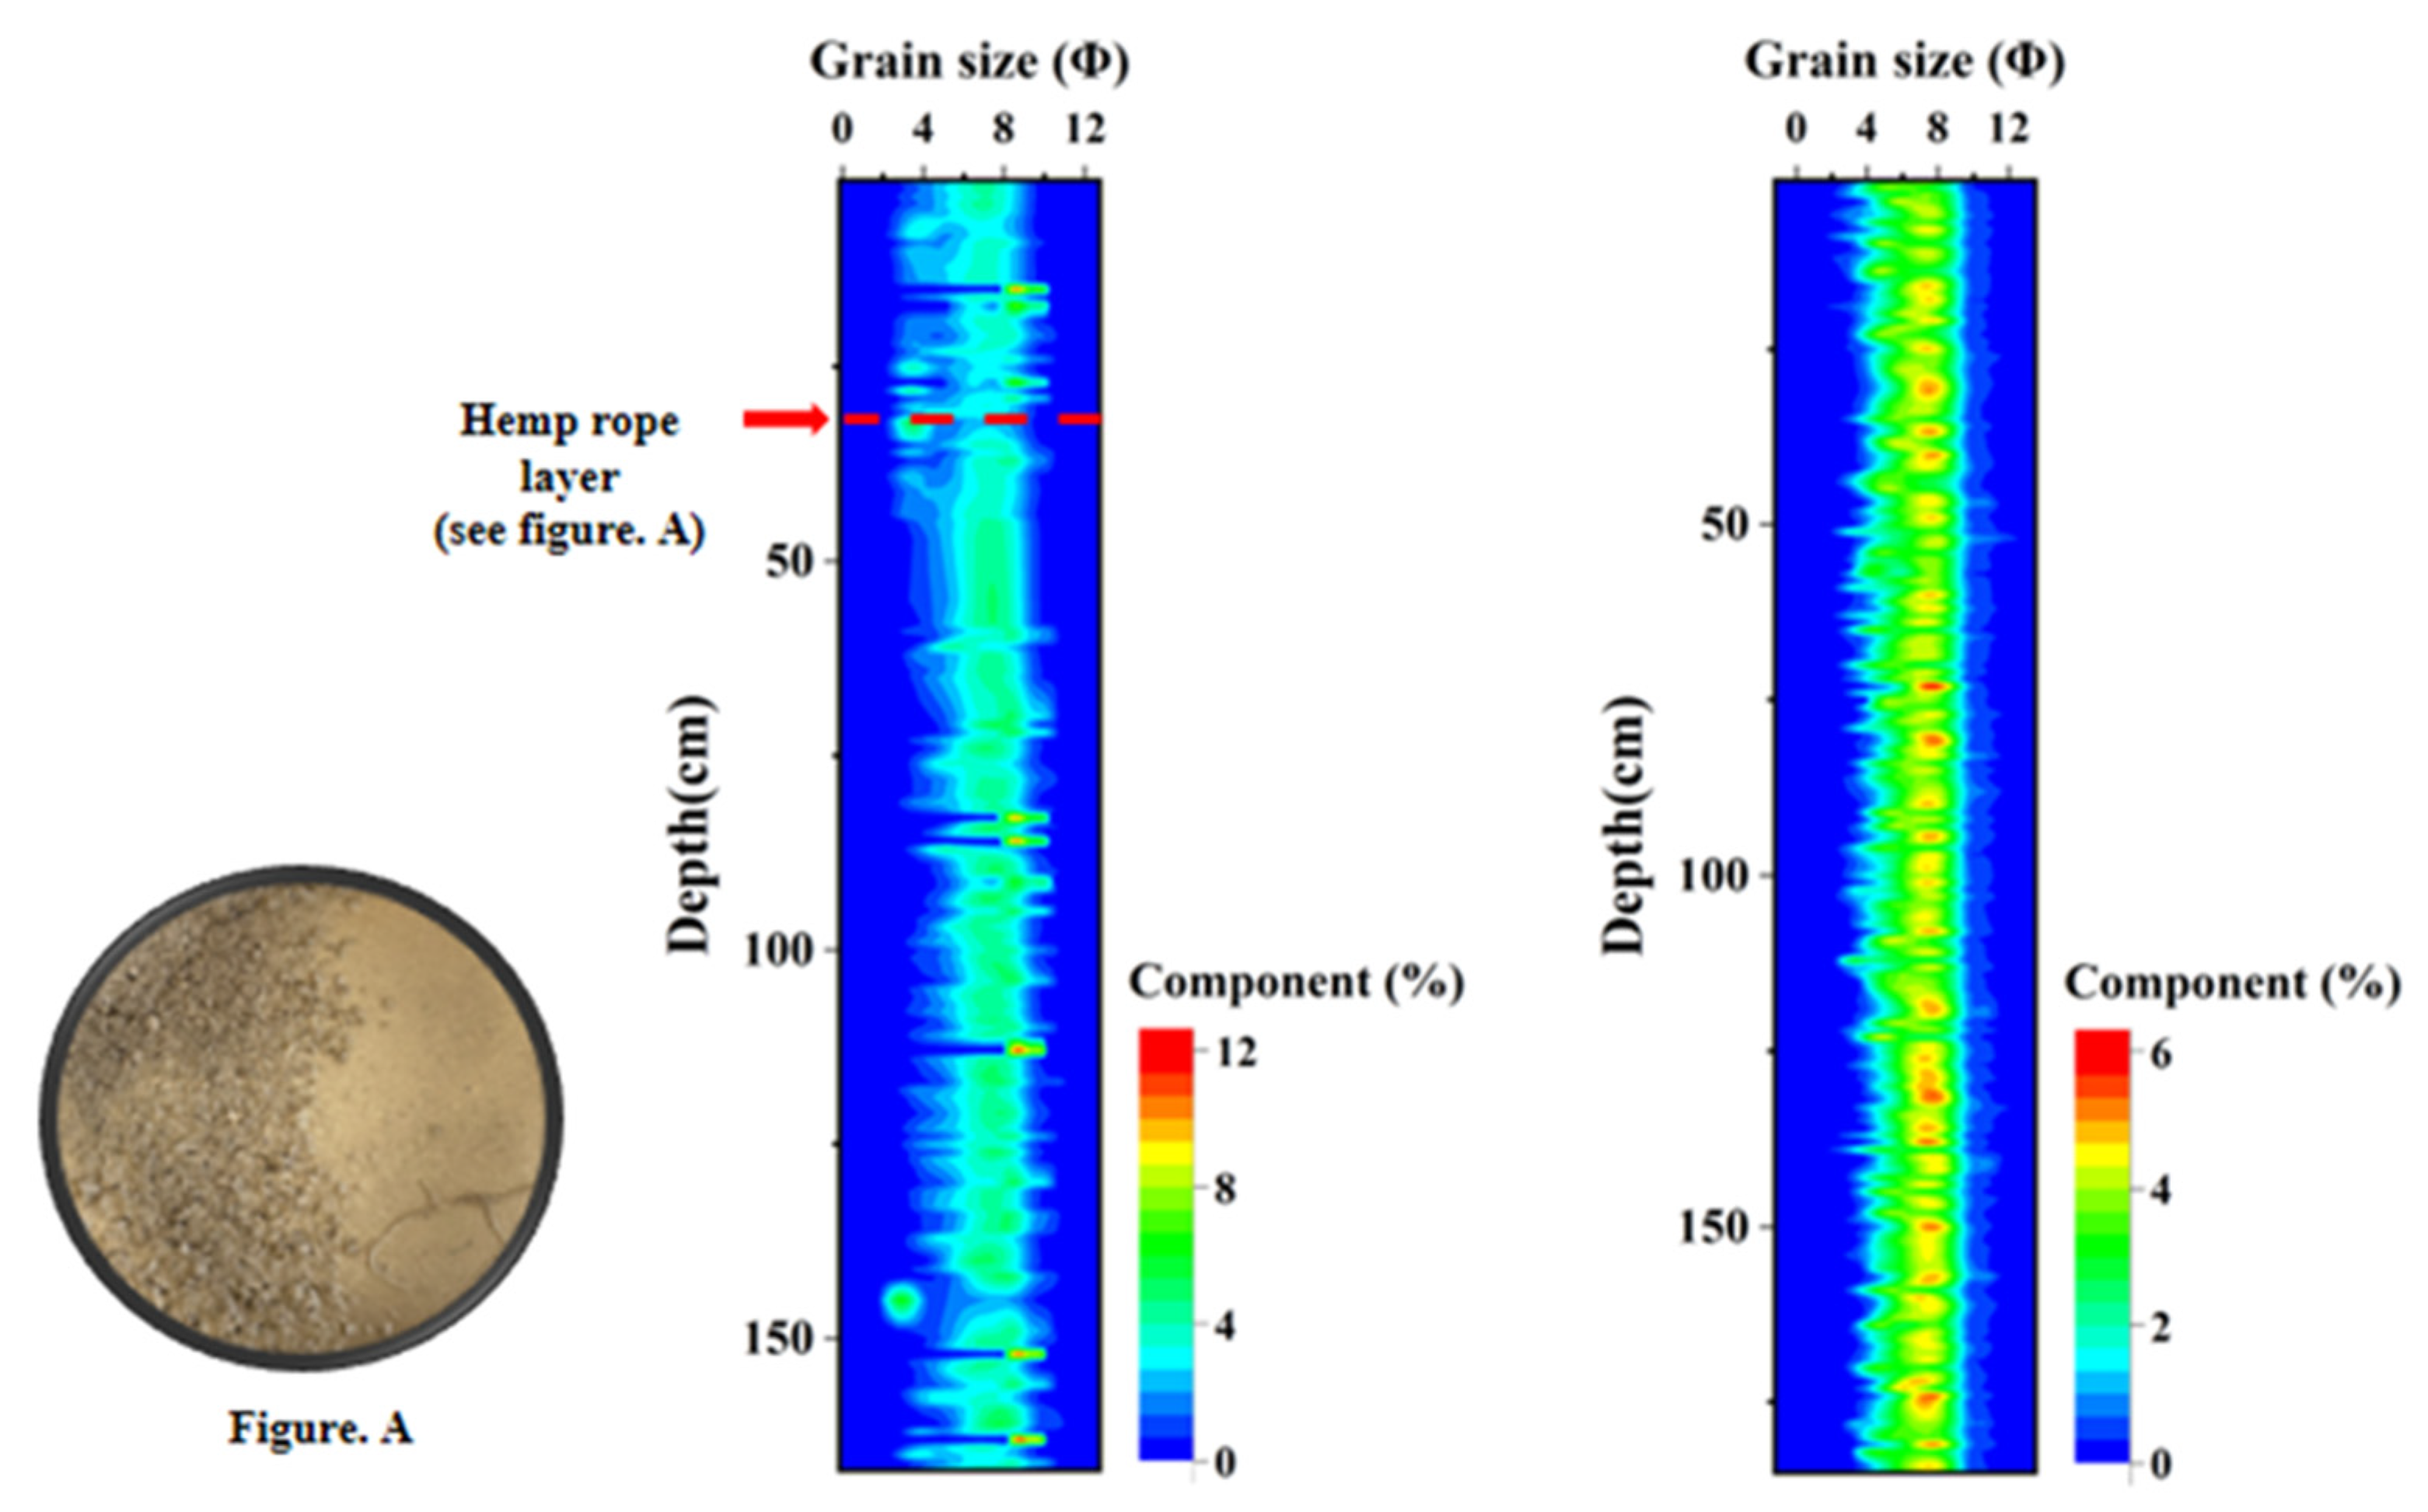
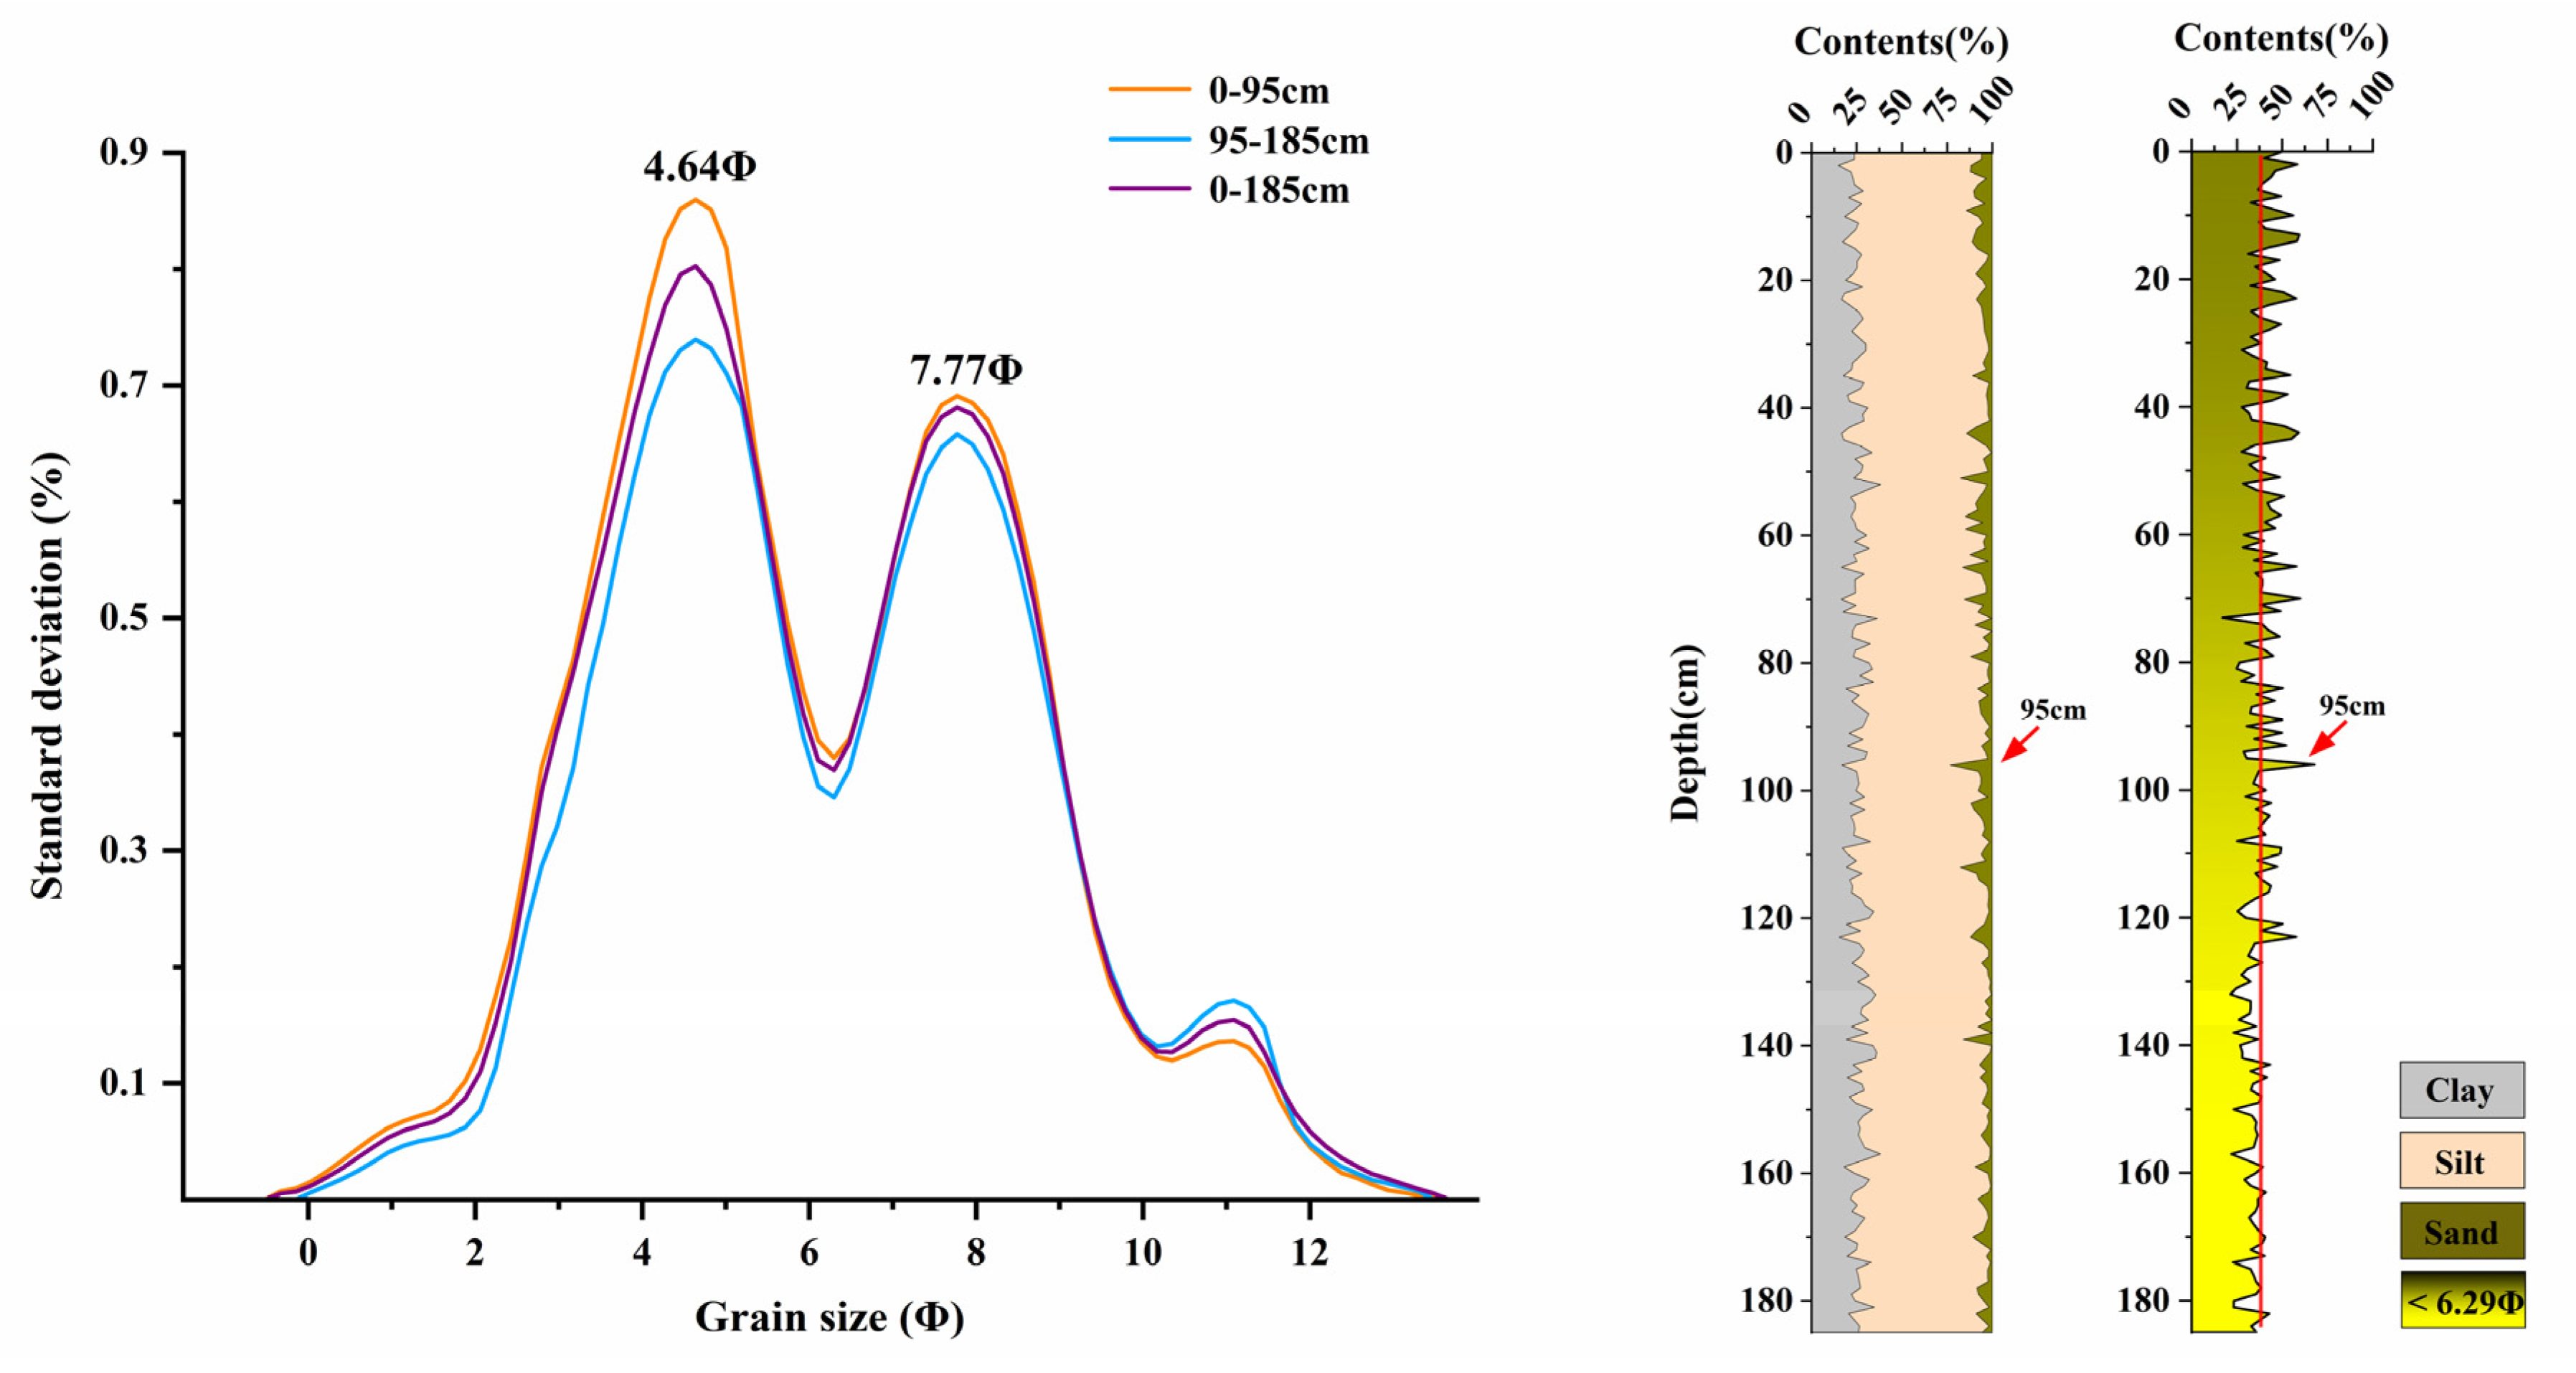
4.2. Lithology and Particle Size Characteristics

LD11 has a relatively single lithology, mainly composed of dark gray and grayish-green clayey silt, with thin sandy layers. Plant roots, shell fragments, and artificial debris (such as hemp rope) can be seen (Figure 4). The component percentage of silt fluctuates greatly, ranging from 0 to 75.34%, with an average value of 60.40%. The sand content is the lowest, ranging from 0 to 50.70%, with an average value of 7.97%. The clay content is in between, with a wide range of variation, with a maximum value of 100%, a minimum value of 13.13%, and an average value of 31.63%. The average grain size ranges from 4.70 to 9.03 Φ, and an average value is 5.87 Φ. The fluctuation range of the sorting coefficient is 0.53~2.46, with an average value of 1.72, indicating good to poor sorting. Among them, samples with poor sorting performance are dominant. The skewness fluctuation range is −0.29~0.50, with an average value of −0.07. The kurtosis value ranges from 0.68 to 1.15, with an average value of 0.93.
Similar to LD11, LD13 has a uniform composition, presenting a grayish-yellow color, mainly composed of clayey silt, with visible black organic debris and occasional fine sandy silt layers. The contents of sand, silt, and clay are 0.10~23.75% (average 5.27%), 58.95–78.73% (average 69.17%), and 14.90~38.18% (average 25.55%), respectively. The average grain size is 5.69~7.49 Φ, and average value is 6.75 Φ. The sorting coefficient ranges from 1.25 to 2.22, with an average value of 1.68, indicating poor sorting performance. The skewness value ranges from −0.19 to 0.25, with a wide range of variations, ranging from negative skewness to positive skewness, with nearly symmetric samples being the majority, with an average value of −0.04. The kurtosis ranges from 0.74 to 1.14, including three levels of kurtosis ranging from wide to narrow, but the vast majority belong to wide and medium, with an average value of 0.95. There are obvious changing layers of grain size at 9 cm, 35 cm, 44 cm, 51 cm, 65 cm, 95 cm, 112 cm, and 139 cm (with an increase in coarse particle component content and particle size), where 95 cm is the maximum of grain size, with the 210Pbex dating age corresponding to approximately 1994 (±1.4a). Based on the vertical distribution characteristics of grain size parameters, the core is divided into two sections: 0~95 cm and 95~185 cm.
Performing grain size standard deviation analysis on LD13, the sensitive curve shows a two-peak distribution, corresponding to 4.64 Φ and 7.77 Φ, respectively (Figure 5). The separation point between the two components is approximately 6.29 Φ. The larger the peak value, the greater the sensitivity of the grain size to environmental changes, i.e., 4.64 Φ is the most sensitive grain size in LD13. The sensitive grain size changes in layers above 95 cm (0~95 cm) and below (95~185 cm) are significantly different. The first sensitive grain size fraction (4.64 Φ) shows a sudden increase above the 95 cm section and a moderate increase in the 95–185 cm section. The second sensitive grain size fraction (7.77 Φ) exhibits a moderate increase both above 95 cm and in the 95–185 cm section, with relatively little change overall. Additionally, the grain size components of this core can be divided into C1 (<6.29 Φ) and C2 (>6.29 Φ). There are two types of components, which can basically represent the sensitive components of coarse and fine particles in the sediment. The content of the C1 component gradually decreases throughout the core, while the content of the C2 component is the opposite, with the content of both increasing and decreasing. From the variation curve of C1 components, it can be seen that there are large fluctuations in the 0~95 cm layer, with multiple high peak areas and with an average content of 41.86%. The changes in the 95~185 cm layer are relatively gentle, with an average content of 34.83%, reduced by 7% compared to the 0~95 cm layer.

4.3. Geochemical Characteristics of Sediment Elements

The high-resolution scanning results of LD11 and LD13 show fluctuations and differences in each element, with relatively stable elements such as Zr, Rb, Al, Sr, and Fe selected for analysis. However, the results of these elements are relative values, and they are easily affected by sediment grain size, water content, and surface roughness. To minimize the influence of the above factors on the results, and to improve the accuracy of the indications, specific geochemical elemental indicators that are indicative of changes in the depositional environment are used [38,39]. Therefore, element ratios Zr/Rb, Zr/Al, Sr/Fe, and Sr/Al were used for analysis, which are often used as indicators for identifying human activity events in previous studies [37,38]. Zircon is the major host mineral for Zr, with strong weathering resistance and enrichment in coarse particles. Rb is mainly present in K-containing potassium feldspar and clay minerals through isomorphism, indicating fine particles. In marine sediments, Sr, as a sea-derived element, is mainly found in Ca-bearing minerals such as plagioclase feldspars and carbonate minerals and biological debris, and is generally enriched in coarse grains, while Fe and Al are generally enriched in fine grains [39,40,41]. Thus, fluctuating changes and anomalous extremes in Zr/Rb, Zr/Al, Sr/Fe, and Sr/Al ratios can reflect changes in the relative sizes of sediment particles, and shifts in depositional environments that have the ability to respond to anthropogenic events.
The Zr/Rb values of core LD11 vary from 0.41 to 1.81, with an average value of 0.76 and a standard deviation of 0.63. The Zr/Al value fluctuates widely, ranging from 0.17 to 1.49, with an average value of 0.36 and a standard deviation of 0.24. The variation range of Sr/Al value is 0.11~0.47, with an average value of 0.21 and a standard deviation of 0.33. The variation range of Sr/Fe value is 0.12~0.40, with an average value of 0.27 and a standard deviation of 0.32. Overall, the four indexes varied drastically in the vertical profile with no clear pattern (Figure 6).
The four indicators of LD13 show a fluctuating increasing trend. The variation range of Zr/Rb is 0.63~1.89, with an average value of 0.87 and a standard deviation of 0.15. The Zr/Al fluctuates widely, ranging from 0.23 to 1.44, with an average value of 0.40 and a standard deviation of 0.12. The variation range of Sr/Al is 0.12~0.48, with an average value of 0.21 and a standard deviation of 0.25. The variation range of Sr/Fe is 0.21~0.46, with an average value of 0.28 and a standard deviation of 0.13.
At 94.5 cm, four indicators (Zr/Rb, Zr/Al, Sr/Al, Sr/Fe) all showed marked peaks (maxima). Taking 94.5 cm as the cut-off point, the standard deviation of the upper segment was greater than that of the lower segment (Table 1), the standard deviation of the upper section is larger than that of the lower section, which indicates that the fluctuation of the four indicators in the upper section is larger than that of the lower section, and the range of fluctuation is also larger, and the peaks in the upper section are more than those in the lower section (Figure 7). According to the depth–age framework, the corresponding age at 94.5 cm is 1995, which is basically consistent with the corresponding age at 93 cm (1994 year). In addition, the element content of LD13 was less discrete than that of LD11.

5. Discussion

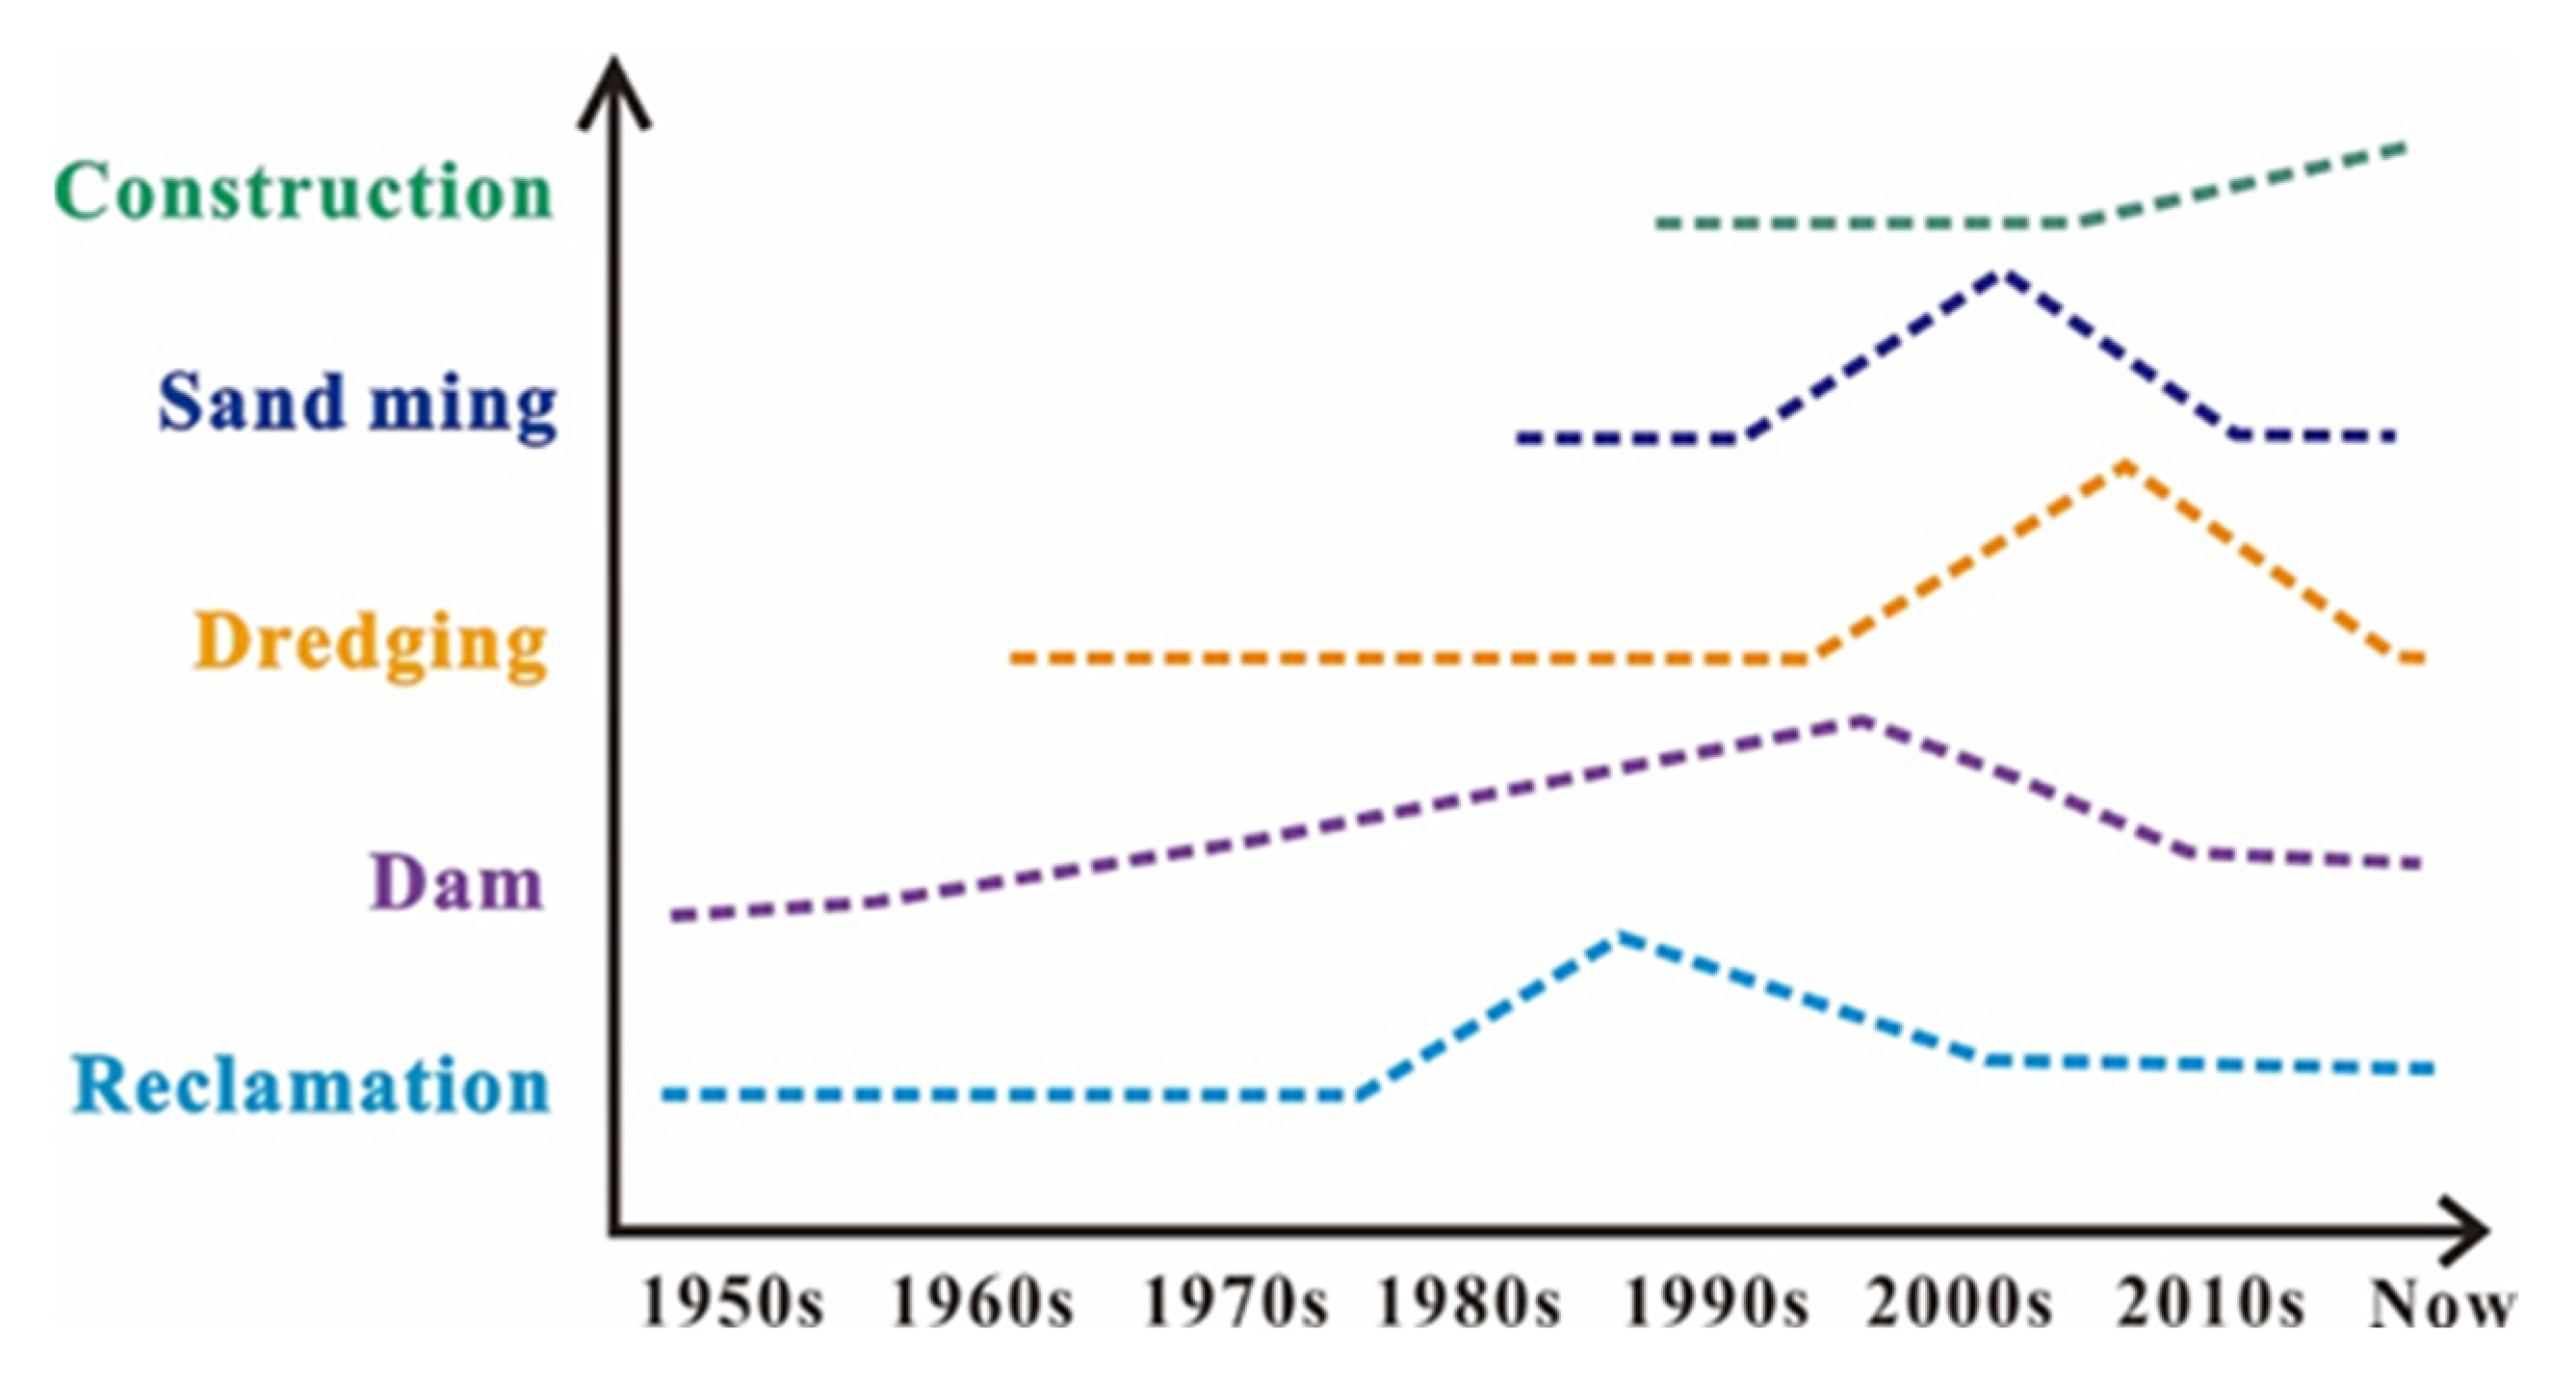
5.1. The Historical Process of Strong Anthropopressure

In recent decades, the increasing intensity and scale of diverse human activities, such as embankment, land reclamation, channel dredging, and sand excavation, have affected sediment movement processes that can alter sediment sources and sinks in the LDB, resulting in a more complex morphological evolution (Figure 1c).

5.1.1. Human Activities in the Upper Streams of the LE

The watershed and estuary are an integrated system, and changes in the runoff and sediment load from the basin due to human activities result in morphological changes in deltas [24,28]. Figure 6 presents the annual water discharge and sediment load of the Pearl River basin since the 1950s as measured at the stations of Gaoyao (West River gauging station), Shijiao (North River gauging station), and Boluo (East River gauging station), averaging ~3.10 × 10¹¹ m3/y and 2.80 × 10⁷ t/y, respectively. Notably, sediment discharge of the Pearl River to the estuary began to show a dramatically decreasing trend after 1994 (Figure 8). The sharp increase in water and sediment discharge in 1994 occurred due to the huge floods in June of 1994 (designated as “94.6”). Before 1994, the water flux and sediment inputs fluctuated but remained relatively constant, except for occasional unusually dry or wet years. Moreover, the fluctuations in sediment load in the river basin were synchronous with fluctuations in water discharge, and both are mainly determined by hydroclimatic factors. This is confirmed by previous studies [17], where the correlation coefficients between water discharge and sediment load were up to 88% [17]. After 1994, conversely, the discharge of water and sediment showed a decreasing trend because much of the river’s sediment load was trapped by the reservoirs [42,43]. Many reservoirs were constructed along the Pearl River for flood control and power generation from the 1950s to the 1990s, with a total storage capacity of 518 × 108 m3, accounting for 15.9% of the annual runoff of the Pearl River [44], particularly after completion of the Longtan reservoir in 2006, the second largest dam in China, with a total storage capacity of 162 × 108 m3 [45]. Compared with the 1950s~1980s, the sediment flux of the Pearl River decreased by 70% after 2006 [17].

5.1.2. Human Activities in the LE

(1)
Land reclamation
Reclamation in the LE began to rise rapidly after the reform and open policy (after 1980), and the shortage of land resources became a vital factor restricting economic development; as a result, reclamation became more and more frequent. As shown in Figure 9, in the reclamation process of Lingding Bay (LDB) since 1972, nearly 300 km2 of the LE has been reclaimed [18,44]. Reclamation on the west sides of the LE is mainly in the outer Jiaomen Island, Wanqingsha Island, and outer Hengmen Island, while on the east sides, it is concentrated in Jiaoyiwan Bay, Dachanwan Bay, and Shenzhen Bay. Before the 1990s, the growth of the land area in the LE was at a relatively slow level (about 0.7 km2/y) [46] and was almost entirely used for agriculture [17]. The peak period of reclamation mainly took place during the 1990s to the mid-2000s (about 1.2 km2/y) [46]; much of the land from the intertidal zone and the shoal area was reclaimed for town construction. After the mid-2000s, however, there was a decrease in the rate of reclamation (about 0.2 km2/y) due to the policy of strict regulation of land reclamation [46,47]. Land reclamation directly alters the length of the coastline and the shape of estuaries, leading to rapid seaward advancement and lengthening of the coastline, while the distance to the sea at the outlets is also extended. For example, compared with the late 1970s, the distances to the sea of Jiaomen, Hongqili, and Hengmen increased by 26.3 km, 10.5 km, and 18.0 km, respectively, in the 2010s [28]. Furthermore, there is a positive correlation between coastline length and reclamation area [21,48], indicating that the land area grew with the extension of the coastline.
Obviously, reclamation efforts to reduce the area of the estuary bay and alter the shoreline morphology greatly impact tidal currents and their power. The changes to topographic boundaries affect the direction and state of tidal currents, causing the equilibrium zone of runoff tidal action to shift downward. This shift results in smoother and more centralized water flow, enhancing the capacity to hold sediment and facilitating upstream sediment transport downstream. Consequently, sedimentation rates accelerate in the shallow waters outside the outlets.
(2)
Coastline extensions
As mentioned above, the coastline of the LE has undergone dramatically tremendous changes because of intensive human forcing. Moreover, interferences from anthropogenic forcing have transformed irregularly shaped shorelines into straight artificial shorelines, while natural shorelines continue to decrease.
Land reclamation has directly reduced the water area of the LDB from 1309.7 km2 before the 1990s to 1121.7 km2 in 2017, while increasing the length of the shoreline (Table 2). The length of the coastline in the LE increased continuously and was originally 216.4 km long before the 1990s, an increase of approximately 90 km before the 1990s. It expanded to 234.3 km, 275.8 km, and 301.7 km in 1996, 2005, and 2017, respectively (Table 2). In 1996–2005, the expansion rate of the coastline reached its maximum, 4.62 km/y. After 2005, the expansion rate decreased to only 2.16 km/y due to the constraints of ecological protection and under strict control of reclamation policies. The shoreline of the LE is the same as nowadays, with little change after 2017.
(3)
Waterway dredging and sand excavation
Since the 1960s, the LW has relied on dredging to maintain the channel over the years, with water depth increasing from 5 m to 18 m, and the total dredging depth reaching 13 m, which was 2.5% of the natural water depth before 1949 [25,45]. During the 45 years from 1970 to 2015, channel dredging resulted in a reduction of approximately 75 Mt (1.89 Mt/y) of sediment in the entire estuary [17]. Sand mining in the LE started in the 1980s. Nevertheless, after the late 1990s, there was comprehensive prohibition of sand mining in the river network area. Hence, sand mining activities began to shift to the shallow beach area of the estuary. It was also after this that the sand mining in the LE reached its peak, and most of the sand mining activities were concentrated in the middle beach and near the East Channel, where sand sources were abundant [49,50]. According to incomplete statistics, since the 1980s, the amount of sand extracted from the estuarine bay has been approximately 0.66 Mm3, causing the riverbed to change from slow sedimentation to strong erosion. Since 2006, the amount of sand extracted from the shallow flats of the estuarine bay has exceeded 52 Mm3/y [51], which is equivalent to three times the total annual sedimentation of the entire LE. After 2008, due to manual sand mining on the middle beach, a giant sand pit with a volume of 7 × 10⁸ m3 was formed, and a maximum excavation depth of 27.5 m appeared at the same time [52]. Such high-intensity dredging and sand mining have a huge impact on the evolution of the dynamical–sedimentary–geomorphological system in the LE, producing an anomaly that exceeds natural processes.

5.2. Temporal Differences of Sedimentary Records under Varying Intensities of Human Activities

Over the past hundred years, human activities in the LE have had different phases, and the type, spatial, and temporal characteristics of human activities in each stage have been quite different. Figure 10 shows the main human activities carried out in the LE in recent decades. Bridge and tunnel construction, sand mining, and waterway dredging mainly occurred after the 1980s, while reclamation and upstream reservoir and dam construction began in the 1950s and mainly occurred in the 1980s~2000s. Overall, the high-intensity human activities in the LE were mainly concentrated in the mid-1990s~2000s. Before the mid-1990s, the scale and intensity of human activities were limited. Since then, due to the need for socioeconomic development, the extent, type, and intensity of activities have increased. After the 21st century, due to a series of restrictive policies, the extent and intensity of human activities have been limited and slowed down, but they are still ongoing. The sedimentary environment of the LE is constantly changing, and the sedimentary characteristics of LD13 are well documented and responsive to these changes.
The sediment in the LE mainly comes from the upstream basin, with less sediment coming from the ocean [53,54]. The construction of dams in the upper reaches of the Pearl River and excessive sand mining activities in the river channel have reduced sediment input. This has resulted in a decrease in the amount of sediment transported into the LE, particularly fine-grained sediment, while the input of coarse-grained components has decreased abruptly. Generally, under natural boundary conditions, the upstream input of coarse-grained fractions into the LE should be reduced, and the sedimentation rate should be reduced simultaneously. However, after 1994, the sedimentation rate of core LD13 (>95 cm) increased and the content of coarse grain components (<6.29 Φ) increased, which is not consistent with changes in natural boundary conditions, and is speculated to be closely related to human activities. During the sand washing part of the sand mining process, some of the coarse particles of sediment will return to the sea, and they will spread and silt up with the upstream and downstream movement of the tidal current, affecting a more distant area, mainly located downstream of the sand mining pit [52]. Moreover, studies by Ying et al. [52] have also shown that each sand mining vessel can form a turbid zone of 300~400 m, artificially creating a high concentration of turbid water, and each sand mining vessel is estimated to produce about 18,000 t of net sand per day, whereas more than 50,000 t of sediment is estimated to be discharged into the water during the sand production process, and a large amount of sediment can be rapidly deposited within a certain range. This may contribute to an increase in the sedimentation rate of LD13, which is located in the downstream sediment deposition area of the sand mining area. Simultaneously, it also leads to an increase in the content of C2 components and grain size, and the values of all four geochemical indices exhibit a fluctuating increase trend in LD13 after 1994. In addition to sand mining, channel dredging and the disposal of its dredged material can also lead to coarsening of sediment fractions. On the one hand, channel dredging can lead to the deepening and exposition of coarse sediment particles [5]. On the other hand, the coarsening of grain size in the upper layer of LD13 may be related to the dumping of marine-dredged material, because the dynamics of these locations are weak, and the sand fractions that appear to be coarse-grained do not match with the regional dynamics, while the distribution location of this site corresponds to the location of the marine dumping area (the dumping area of the southeastern Qi’ao Island and the dumping area of the Tonggu waterway) [55], and the process of resuspension and sorting of the dumped sand occurs [56], which enables the coarse-grained sediment retention in the shallow area, and therefore results in the coarsening of sediment fractions of the core. The frequent low values of 210Pbex distribution profiles in the core, prior to decaying to background levels, are attributed to sand dredging, channel dredging, and dumping activities that have mixed older sediments into the strata. In actuality, the phenomenon of coarsening of estuarine sediments caused by human activities in the estuaries is reflected in major river deltas such as the Yangtze River and Yellow River [57,58]. However, the intensity of human activities in the LE is greater, and the sediment response to this is more sensitive and intense. At the same time, geochemical indicators such as Zr/Rb, Zr/Al, Sr/Al, and Sr/Fe, which indicate the coarsening of sediment components and the strengthening of a sedimentary dynamic environment, have also experienced increases in numerical values and peak values since 1994, and the fluctuation frequency and range of these indicators are also more severe than before 1994.
Against the backdrop of continuous decrease in incoming water and oscillation frequency, the increase in sedimentation rate is not only related to sand mining and channel dredging but also to the extension of the shoreline towards the sea under reclamation. This is evidenced by the large-scale reclamation that has advanced isobath seaward on a large scale [18], a downward shift of the equilibrium zone of tidal action, and a substantial seaward deposition of sediments, with rapid siltation of the shallow water areas beyond the outlets [59,60]. While the original deep-water depth will become shallower and the power will become weaker, which is beneficial for sediment to settle in shallow water areas along the way, coupled with the outer LE sediment transport trends showing that the main southwestward transport, a sedimentation center has been formed in the nearshore of West Beach where LD13 is located exactly in this area [50], which will further facilitate the rapid sedimentation. Furthermore, Chu [61] analyzed the structural evolution of the LE shoal and trough using a digital elevation model based on a century’s worth of nautical chart data. The study showed that human activities around 1998 led to a new erosion and sedimentation pattern: “erosion in the inner LE and sedimentation in the outer LE”. This finding corresponds to the increased sedimentation rate in LD13, located in the outer LE, observed after 1994. With the reduction in river sediment, the core sediment is likely derived primarily from the erosion of sediments in the inner LE.
Based on the discussion above, before the mid-1990s, although there were fluctuations in various indicators, the overall changes were gentle, and the sedimentary environment was in a relatively stable state during this period. After the mid-1990s, the high intensity and rapid process of human activities such as sand excavation, channel dredging, dumping, and reclamation are directly reflected in the grain size, 210Pbex activity distribution, sedimentation rate, and organic geochemistry of core samples, resulting in coarsening of the grain size components of core sediments, irregular distribution of 210Pbex activity, and an increase in the peak and fluctuation frequency and amplitude of Zr/Rb, Zr/Al, Sr/Al, and Sr/Fe, and the changes in these indicators are synchronous with each other.

5.3. Spatial Differences of Different-Intensity Human-Perturbed on Sedimentary Records

Although LD11 cannot provide an accurate chronology–depth framework and cannot be effectively analyzed in terms of time because of the disordered distribution of 210Pbex radioactivity, based on the variation characteristics of sedimentary records in LD11 and its spatial location (near the waterway with stronger human disturbances), and further comparison with LD13 located near the coast, it can be inferred that the intensity of human activities varies significantly in different spatial locations.
From a spatial perspective, LD11 and LD13 are located in different dynamic environment zones. The former is located near the main channel (LW), where modern large seagoing vessels can cause resuspension of seabed sedimentation, erosion of the channel and shoal, enhancement of seafloor sedimentation activity, and thickening of the active layer, and there is a major impact on seabed topography and sedimentation processes [37]. Furthermore, developed shipping inevitably requires waterway regulation engineering for maintenance. The LW regulation engineering has a long history, with deep operational depth, large spatial span, and long time series [17,20]. The frequent and strong disturbance of bottom sediment inevitably affects the normal distribution of 210Pbex in sedimentary strata, with younger and older sediments alternately distributed in the strata. Additionally, the dredging and sand excavation in the waterway overturns the residual coarse sand in the riverbed, artificially forming new sources of coarse sand [19,51], resulting in an increase in the sedimentary content of sand and silt components in LD11, accompanied by an increase in grain size. Subsequently, there are large vertical variations and high dispersion in Zr/Rb, Zr/Al, Sr/Fe, and Sr/Al, accordingly. In addition, Yuan [19] and Yuan et al. [26] revealed that the anomalous patches of coarse-grained sediments and terrestrially sourced organic carbon were mainly distributed in the navigation channels and on their adjacent shoals, reflecting channel dredging, dumping, and sand mining activities. Therefore, the origins and spatial distributions of the grain size and organic carbon composition of the surficial sediments in LDB in 2016 were not controlled by hydrodynamic conditions and land–sea interactions, but overwhelmingly by human activities. To sum up, the sedimentary environment in this area is unstable and extremely turbulent due to the intense interference of human activities, such as ship traffic, channel dredging, and sand mining in the sea all year round. Therefore, within a large depth range of 167 cm in borehole LD11, the distribution of 210Pbex is disorderly and irregular, while the geochemical indices undergo dramatic fluctuations magnitude, making it impossible to determine the age. Additionally, the grain size is large and exhibits large vertical variations, while organic geochemical indicators change greatly with high frequency and large amplitude of fluctuations.
LD13 also exhibits coarsening in grain size components and fluctuations in distribution curves, alternating distribution of 210Pbex profile values, as well as numerous peaks and discrete distributions of organic geochemical indices. However, the depth of its affected region is limited (i.e., the alternating distribution of 210Pbex values and the intense fluctuations of Zr/Rb, Zr/Al, Sr/Fe, Sr/Al only centrally occur at layers above 45 cm) and the range of changes is much smaller than that of LD11 (i.e., the standard deviation of the organic geochemical ratio index in LD11 is more than twice as large as in LD13), and it follows a discernible pattern. This is because the core is not only located in the nearshore area with a relatively weak hydrodynamic environment, far away from the waterway and sand mining area, but also with a low intensity of human activity, and relatively stable sedimentary environment. Therefore, the intensity and depth of disturbance from human activities are limited for various indicators in LD13. Meanwhile, to further and more precisely reveal the spatial and temporal impacts of human activities on LE sedimentation, additional cores will be obtained in different geomorphological units of the LE to identify these impacts.

6. Conclusions

Anthropogenic activities in the LE originated in the 1980s, and their impact on sedimentation has deepened since the 1990s. Although there are currently only two boreholes, their sampling locations are representative. Moreover, the sediment characteristics within these boreholes provide excellent records and indicators of the impact of human activities, thus supporting the study of anthropogenic disturbances on sedimentary changes over time and space. By studying characteristics of estuary sediments from shipping lanes and nearshore shallow water zones, our study found that over the past few decades, with the enhancement of human activity in the LE, changes in estuary sediment deposition have occurred. The conclusions are as follows:
(1)
The construction of multiple dams and hydroelectric power stations in the Pearl River Basin has reduced the water and sediment entering the LE, a trend projected to persist. Reclamation in the LE has reshaped the shoreline, extending the coastline to over 300 km and shifting the equilibrium zone of runoff and tidal action downward, thereby accelerating siltation rates. Furthermore, channel dredging and sand mining have introduced new sources of coarse-grained sands and sedimentation centers, leading to increased sedimentation rates, coarser grain size, and alterations in the geochemical characteristics of the sediments.
(2)
Based on the CIC model, the sedimentation rate of the LE increased from 2.73 cm/y to 3.36 cm/y after 1994, which is inconsistent with the boundary conditions of decreasing incoming water and sand, and decreasing and stabilizing the frequency of oscillations. This is largely due to strong human activities in the LE, such as sand mining, reclamation, and dredging. The added sediment is likely derived primarily from the erosion of sediments in the inner LE.
(3)
There were obvious changes in the sediment grain size composition after anthropogenic disturbance; the sedimentation response may have occurred as early as 1994. The coarse particle fraction of the sediment became more active and the particles coarser than 6.29 Φ were increased (by approximately 7%) after being disturbed by reclamation, channel dredging, ocean dumping, and sand excavation.
(4)
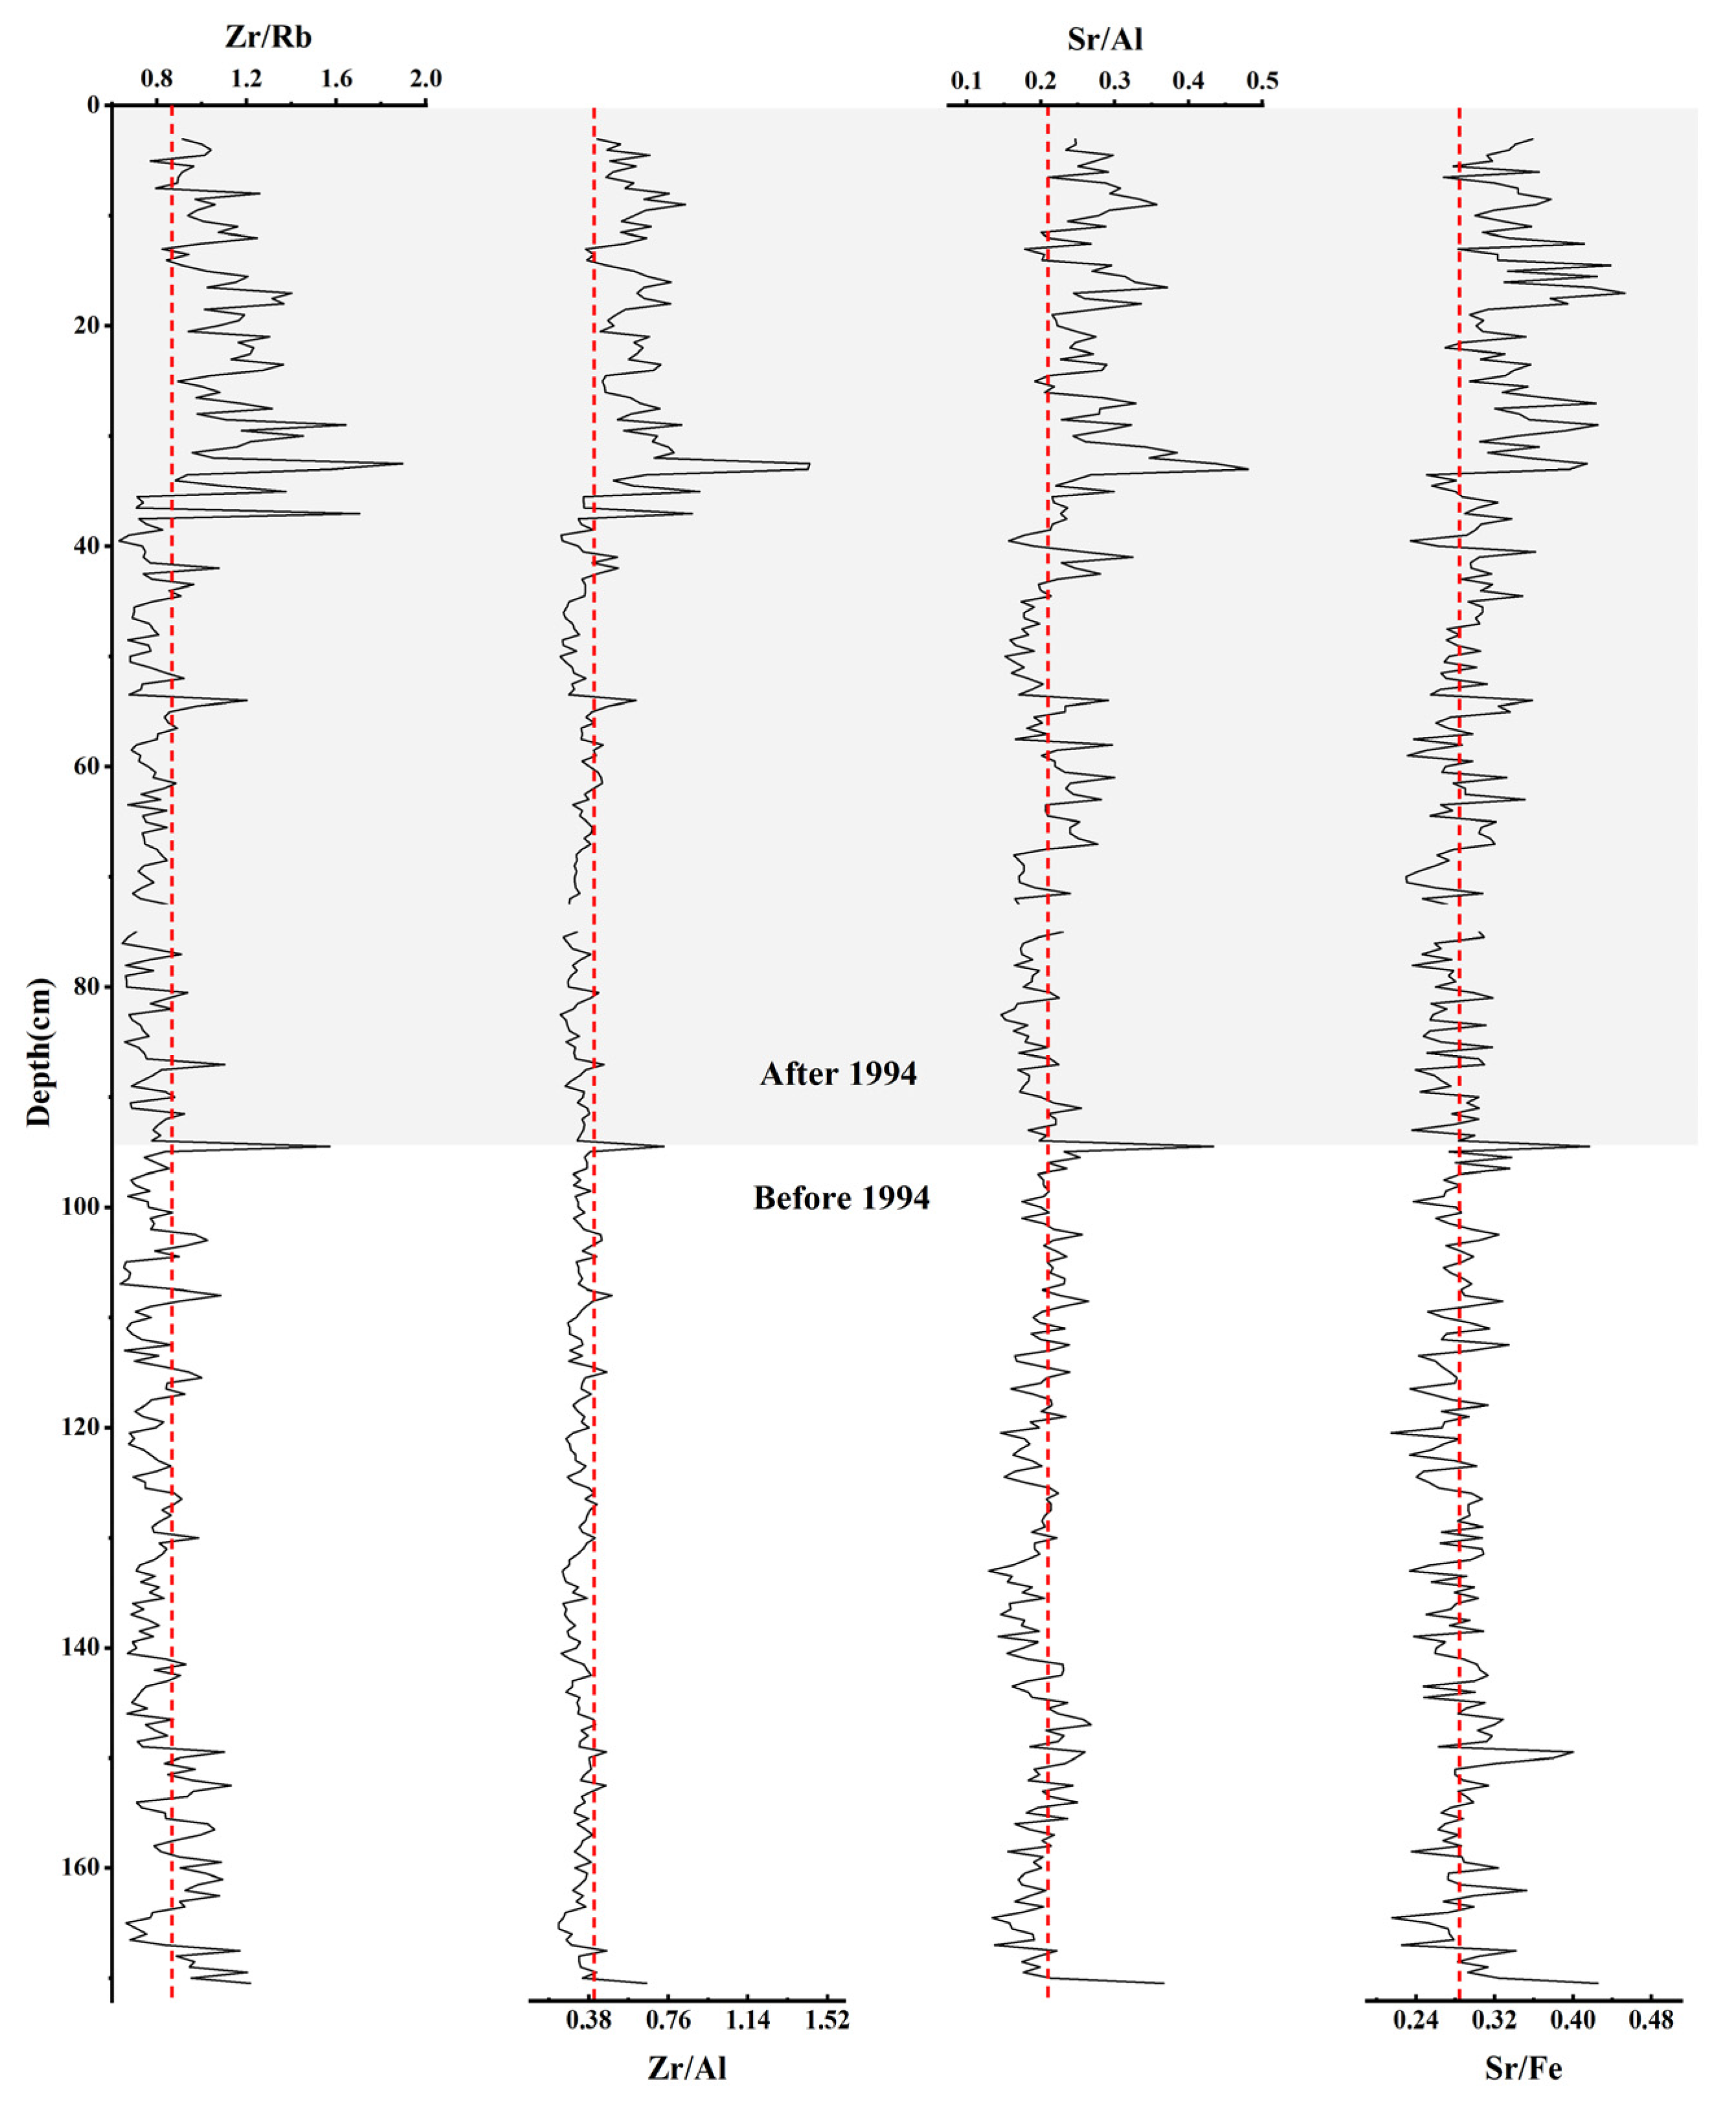
As the frequency and intensity of influence by multiple anthropogenic stresses have increased, the vertical variation amplitudes of Zr/Rb, Zr/Al, Sr/Al, and Sr/Fe have increased, with standard deviations rising from 0.12, 0.05, 0.31, and 0.30 to 0.23, 0.19, 0.58, and 0.46, respectively. This change response is consistent with the change in grain size and sedimentation rate.
(5)
Although no valid chronological information can be obtained from LD11, which is located in the adjacent channel, the environmental information under the influence of strong disturbance was well recorded, and it can be spatially compared with LD13, which is located in the nearshore siltation zone, and the sedimentary records of the two cores are different. Compared with the nearshore siltation area, the sedimentary layers in the channel area were disturbed at a deeper depth, with a coarser grain size composition and a wider range of grain size variations, a serious inversion of the 210Pbex, and frequent and violent fluctuations of Zr/Rb, Zr/Al, Sr/Fe, and Sr/Al, with no obvious pattern.

Author Contributions

Conceptualization, D.L. and L.J.; methodology, D.L.; software, D.L., Y.L. and T.Z.; validation, D.L., Y.L., T.Z. and L.J.; formal analysis, D.L.; investigation, D.L., Y.L., T.Z., E.H. and Z.Z.; resources, D.L. and L.J.; data curation, D.L.; writing—original draft preparation, D.L.; writing—review and editing, D.L. and L.J.; visualization, D.L.; supervision, L.J.; project administration, L.J.; funding acquisition, L.J. All authors have read and agreed to the published version of the manuscript.

Funding

This research was funded by Southern Marine Science and Engineering Guangdong Laboratory (Zhuhai) (SML2020SP006; SML2023SP220).

Institutional Review Board Statement

Not applicable.

Informed Consent Statement

Not applicable.

Data Availability Statement

Data will be made available on request.

Acknowledgments

The authors are very grateful to Jianhua Gao of Nanjing University for his important support and mentoring, to Mengmeng Wu and Shengjing Liu of Nanjing University for their guidance on the experiment. All the authors thank the Editor and the three anonymous reviewers for their constructive comments and suggestions, which have greatly improved the quality of this paper.

Conflicts of Interest

The authors declare no conflicts of interest.

References

  1. Dyer, K.R. Estuaries: A Physical Introduction; Wiley-Interscience: New York, NY, USA; London, UK, 1973; pp. 79–149. [Google Scholar]
  2. Bianchi, T.S.; Allison, M.A. Large-river delta-front estuaries as natural “recorders” of global environmental change. Proc. Natl. Acad. Sci. USA 2009, 106, 8085–8092. [Google Scholar] [CrossRef] [PubMed]
  3. Freitas, M.; Andrade, C.; Moreno, J.; MunháJ, M.; Cach, O.M. The sedimentary record of recent (last 500 years) environmental changes in the Seixal Bay marsh, Tagus estuary, Portugal. Geol. Mijnb. 1998, 77, 283–293. [Google Scholar] [CrossRef]
  4. Joshua, W.; Timothy, D.; Patrick, L.; Lee, G. Historical reconstruction of anthropogenic mercury input from sedimentary records: Yeongsan Estuary, South Korea. Estuar. Coast. Shelf Sci. 2015, 167, 436–446. [Google Scholar] [CrossRef]
  5. Yuan, X.Q.; Yang, Q.S.; Luo, X.X.; Yu, F.L.; Liu, F.; Li, J.Y.; Wang, Z.H. Distribution of grain size and organic elemental composition of the surficial sediments in Lingding Bay in the Pearl River Delta, China: A record of recent human activity. Ocean Coast. Manag. 2019, 178, 104849. [Google Scholar] [CrossRef]
  6. Xia, F.; Zhang, Y.Z.; Wang, L.; Liu, D.Z. Sedimentary Sequence and Age of Core NTCJ1 in the Sheyang Estuary, Western South Yellow Sea: A Re-Interpretation. Water 2023, 15, 3617. [Google Scholar] [CrossRef]
  7. Best, J. Anthropogenic stresses on the world’s big rivers. Nat. Geosci. 2019, 12, 7–21. [Google Scholar] [CrossRef]
  8. Shin, H.J.; Lee, G.H.; Kang, K.R.; Park, K. Shift of estuarine type in altered estuaries. Anthr. Coasts 2019, 2, 145–170. [Google Scholar] [CrossRef]
  9. Milliman, J.D.; Farnsworth, K.L.; Jones, P.D.; Xu, K.F.; Smith, L.C. Climatic and anthropogenic factors affecting river discharge to the global ocean, 1951–2000. Glob. Planet. Chang. 2008, 62, 187–194. [Google Scholar] [CrossRef]
  10. Bentley, S.J.; Blum, M.D.; Maloney, J.; Pond, L.; Paulsell, R. The Mississippi River source-to-sink system: Perspectives on tectonic, climatic, and anthropogenic influences, Miocene to Anthropocene. Earth Sci. Rev. 2016, 153, 139–174. [Google Scholar] [CrossRef]
  11. Gao, J.J.; Dai, Z.J.; Mei, X.F.; Ge, Z.P.; Wei, W.; Xie, H.L.; Li, S.S. Interference of natural and anthropogenic forcings on variations in continental freshwater discharge from the Red River (Vietnam) to sea. Quat. Int. 2015, s380–s381, 133–142. [Google Scholar] [CrossRef]
  12. Wu, X.; Wang, H.J.; Bi, N.S.; Saito, Y.; Xu, J.P.; Zhang, Y.; Lu, T.T.; Cong, S.; Yang, Z.S. Climate and human battle for dominance over the Yellow River’s sediment discharge: From the Mid-Holocene to the Anthropocene. Mar. Geol. 2020, 425, 106188. [Google Scholar] [CrossRef]
  13. Yang, S.L.; Milliman, J.D.; Xu, K.H.; Deng, B.; Zhang, X.Y.; Luo, X.X. Downstream sedimentary and geomorphic impacts of the Three Gorges Dam on the Yangtze River. Earth Sci. Rev. 2014, 138, 469–486. [Google Scholar] [CrossRef]
  14. Zheng, S.W.; Cheng, H.Q.; Lv, J.S.; Li, Z.J.; Zhou, L. Morphological evolution of estuarine channels influenced by multiple anthropogenic stresses: A case study of the North Channel, Yangtze estuary, China. Estuar. Coast. Shelf Sci. 2021, 249, 107075. [Google Scholar] [CrossRef]
  15. Zhang, S.R.; Lu, X.X.; Higgitt, D.L.; Chen, C.T.A.; Han, J.T.; Sun, H.G. Recent changes of water discharge and sediment load in the Zhujiang (Pearl River) Basin, China. Glob. Planet. Chang. 2008, 60, 365–380. [Google Scholar] [CrossRef]
  16. Zhang, Q.; Chen, Y.D.; Jiang, T.; Chen, X.H.; Liu, Z.F. Human-induced regulations of river channels and implications for hydrological alterations in the Pearl River Delta, China. Stoch. Environ. Res. Risk Assess. 2011, 25, 1001–1011. [Google Scholar] [CrossRef]
  17. Wu, Z.Y.; Saito, Y.; Zhao, D.N.; Zhou, J.Q.; Cao, Z.Y.; Li, S.J.; Shang, J.H.; Liang, Y.Y. Impact of human activities on subaqueous topographic change in Lingding Bay of the Pearl River estuary, China, during 1955–2013. Sci. Rep. 2016, 6, 37742. [Google Scholar] [CrossRef] [PubMed]
  18. Wei, X.; Cai, S.Q.; Zhan, W.K. Impact of anthropogenic activities on morphological and deposition flux changes in the Pearl River Estuary, China. Sci. Rep. 2021, 11, 16643. [Google Scholar] [CrossRef] [PubMed]
  19. Yuan, X.Q. Modern Sedimentary Characteristics of Lingding Bay, Pearl River Estuary and Its Implications for Human Activities. Ph.D. Thesis, East China Normal University, Shanghai, China, 2022; pp. 1–114. (In Chinese). [Google Scholar]
  20. Xia, Z.; Jia, P.H.; Ma, S.Z.; Liang, K.; Shi, Y.H.; Waniek, J.J. Sedimentation in the Lingdingyang Bay, Pearl River Estuary, Southern China. J. Coast. Res. 2013, 66, 12–24. [Google Scholar] [CrossRef]
  21. Xia, Z.; Jia, P.H.; Chen, L.Y. Dynamics of coastal land use patterns of Inner Lingdingyang Bay in the Zhujiang River estuary. Chin. Geogr. Sci. 2007, 17, 222–228. [Google Scholar] [CrossRef]
  22. Zeng, W.Z.; Zheng, Z.Y.; Zhang, C.P.; Zhou, P. Sedimentary Records of the Dramatic Environmental Changes in the Lingdingyang Bay of the Pearl River Estuary in Southern China. Ocean Sci. J. 2023, 58, 12. [Google Scholar] [CrossRef]
  23. Chen, Y.T.; Luo, Z.R. Modern sedimentary velocity and their reflected sedimentary characteristics in the Pearl River mouth. Trop. Geog. 1991, 10, 57–64, (In Chinese with English abstract). [Google Scholar]
  24. Hu, D.L.; Yang, Q.S.; Wu, C.Y.; Bao, Y.; Ren, J. Changing water and sediment dynamics in the Pearl River network and consequences on water and sediment regimes in the Lingdingyang estuary. Adv. Water Sci. 2010, 21, 69–76, (In Chinese with English abstract). [Google Scholar] [CrossRef]
  25. Li, M.G.; Han, Z.Y.; Li, W.D.; Xu, T. A Review on the Seabed Evolution and Hydrodynamic Sediment Environmenin Lingdingyang Bay of the Pearl River Estuary. Trans. Oceanol. Limnol. 2019, 41, 20–33, (In Chinese with English abstract). [Google Scholar] [CrossRef]
  26. Yuan, X.Q.; Yang, Q.S.; Meadows, M.E.; Luo, X.X.; Wang, Z.H. Grain size and organic geochemistry of recent sediments in Lingding Bay, Pearl River Delta, China: Implications for sediment dispersal and depositional processes perturbed by human activities. Anthr. Coasts 2021, 4, 147–167. [Google Scholar] [CrossRef]
  27. Li, X.; Damen, M.C.J. Coastline change detection with satellite remote sensing for environmental management of the Pearl River Estuary, China. J. Mar. Syst. 2010, 82, S54–S61. [Google Scholar] [CrossRef]
  28. Yang, L.Z.; Liu, F.; Gong, W.P.; Cai, H.Y.; Pan, H.Z. Morphological response of Lingding Bay in the Pearl River Estuary to human intervention in recent decades. Ocean Coast. Manag. 2019, 176, 1–10. [Google Scholar] [CrossRef]
  29. Folk, R.L.; Ward, W.C. Brazos River bar: A study in the significance of grain size parameters. J. Sediment. Res. 1957, 27, 3–26. [Google Scholar] [CrossRef]
  30. Blott, S.J.; Pye, K. GRADISTAT: A grain size distribution and statistics package for the analysis of unconsolidated sediments. Earth Surf. Process. Landf. 2001, 26, 1237–1248. [Google Scholar] [CrossRef]
  31. Shepard, F.P. Nomenclature based on Sand-Silt-Clay ratios. J. Sediment. Res. 1954, 24, 151–158. [Google Scholar] [CrossRef]
  32. Pszonka, J.; Schulz, B.; Sala, D. Application of mineral liberation analysis (MLA) for investigations of grain size distribution in submarine density flow deposits. Mar. Pet. Geol. 2021, 129, 105109. [Google Scholar] [CrossRef]
  33. Pszonka, J.; Godlewski, P.; Fheed, A.; Dwornik, M.; Schulz, B.; Wendorff, M. Identification and quantification of intergranular volume using SEM automated mineralogy. Mar. Pet. Geol. 2024, 162, 106708. [Google Scholar] [CrossRef]
  34. Sanchez-Cabeza, J.A.; Ruiz-Fernández, A.C. 210Pb sediment radiochronology: An integrated formulation and classification of dating models. Geochim. Cosmochim. Acta 2012, 82, 183–200. [Google Scholar] [CrossRef]
  35. Kumar, A.; Hage-Hassan, J.; Baskaran, M.; Miller, C.J.; Selegean, J.P.; Creech, C.T. Multiple sediment cores from reservoirs are needed to reconstruct recent watershed changes from stable isotopes (δ13C and δ15N) and C/N ratios: Case studies from the mid western united states. J. Paleolimnol. 2016, 56, 15–31. [Google Scholar] [CrossRef]
  36. Goldberg, E.D.; Koide, M.; Schmitt, R.A.; Smith, R.H. Rare Earth Distributions in the Marine Environment. J. Geophys. 1963, 68, 4209–4217. [Google Scholar] [CrossRef]
  37. Xue, C.F.; Yang, Y.; Zhao, P.P.; Wei, D.Y.; Gao, J.H.; Sun, P.; Huang, Z.Y.; Jia, J.J. Impact of Ship Traffic on the Characteristics of Shelf Sediments: An Anthropocene Prospective. Front. Mar. Sci. 2021, 8, 678845. [Google Scholar] [CrossRef]
  38. Catherine, C.G.; Witold, S.; Shinozaki, T. Applications of geochemistry in tsunami research: A review. Earth Sci. Rev. 2017, 165, 203–244. [Google Scholar] [CrossRef]
  39. Tian, Y.; Fan, D.J.; Zhang, X.L.; Chen, B.; Wang, L.; Liu, M.; Yang, Z.S. Event deposits of intense typhoons in the muddy wedge of the East China Sea over the past 150 years. Mar. Geol. 2019, 410, 109–121. [Google Scholar] [CrossRef]
  40. Zhou, L.; Gao, S.; Yang, Y.; Zhao, Y.Y.; Han, Z.C.; Li, G.C.; Jia, P.H.; Yin, Y. Typhoon events recorded in coastal lagoon deposits, southeastern Hainan Island. Acta Oceanol. Sin. 2017, 36, 37–45. [Google Scholar] [CrossRef]
  41. Yang, Z.X.; Xue, C.F.; Yang, Y.; Zhou, L.; Ai, Q.; Gao, J.H.; Jia, J.J. A 100-year reconstruction of typhoon events on the inner shelf of the East China Sea: Coupling of meteorological observations and sedimentary records. Haiyang Xuebao 2020, 42, 119–129, (In Chinese with English abstract). [Google Scholar] [CrossRef]
  42. Wu, C.S.; Yang, S.L.; Liu, Y.P. Quantifying the anthropogenic and climatic impacts on water discharge and sediment load in the Pearl River (Zhujiang), China (1954–2009). J. Hydrol. 2012, 452–453, 190–204. [Google Scholar] [CrossRef]
  43. Wu, Z.Y.; Milliman, J.D.; Zhao, D.N.; Zhou, J.Q.; Yao, C.H. Recent geomorphic change in LingDing Bay, China, in response to economic and urban growth on the Pearl River Delta, Southern China. Glob. Planet. Chang. 2014, 123, 1–12. [Google Scholar] [CrossRef]
  44. Liu, F.; Yuan, L.R.; Yang, Q.S.; Ou, S.Y.; Xie, L.L.; Cui, X. Hydrological responses to the combined influence of diverse human activities in the Pearl River delta, China. Catena 2014, 113, 41–55. [Google Scholar] [CrossRef]
  45. Xie, L.L.; Liu, X.; Yang, Q.S.; Huang, G.L. Variations of current and sediment transport in Lingding Bay during spring tide in flood season driven by human activities. J. Sediment. Res. 2015, 60, 56–62, (In Chinese with English abstract). [Google Scholar] [CrossRef]
  46. Chen, K.L.; Dong, H.Y.; Jia, L.W.; He, Z.X. Depocentre transfer in the Lingdingyang estuary: Interferences from natural and anthropogenic forcings. Ocean Coast. Manag. 2020, 185, 1–15. [Google Scholar] [CrossRef]
  47. Chen, K.L.; He, Z.X.; Liu, J.; Lin, Y.T.; Jia, L.W. Long-term morphological evolution and its mechanism of Lingdingyang Estuary: Interferences from anthropogenic forcings. Mar. Geol. 2022, 450, 106856. [Google Scholar] [CrossRef]
  48. Zhang, W.; Xu, Y.; Hoitink, A.J.F.; Sassi, M.G.; Zheng, J.H.; Chen, X.W.; Zhang, C. Morphological change in the Pearl River Delta, China. Mar. Geol. 2015, 363, 202–221. [Google Scholar] [CrossRef]
  49. Tang, M.Q.; Zhang, Z.Q.; Xing, Y.Q. Environment monitoring of offshore sand mining in Pearl River estuary. Procedia Environ. 2011, 10, 1410–1415. [Google Scholar] [CrossRef]
  50. Zhang, T.; Niu, L.X.; He, F.T.; Liu, F.; Luo, X.X.; Yang, Q.S. Anthropogenic Impact on Evolution of Lingding Bay Sedimentary Framework. Acta Sediment. Sin. 2021, 40, 753–764, (In Chinese with English abstract). [Google Scholar]
  51. Luo, X.L.; Zeng, E.Y.; Ji, R.Y.; Wang, C.P. Effects of in-channel sand excavation on the hydrology of the Pearl River Delta, China. J. Hydrol. 2007, 343, 230–239. [Google Scholar] [CrossRef]
  52. Ying, Q.; He, J.; Xin, W.J. Influence of giant artificial sand pits on the natural evolution of Lingding Bay. Adv. Water. Sci. 2019, 30, 915–922, (In Chinese with English abstract). [Google Scholar] [CrossRef]
  53. Liu, P.R.; Wen, P.; Zhou, Z.F. Analysis of influencing factor on shoal and thoughdevelopment of Lingdingyang Bayat Zhujiang Estuary. J. Oceano. Taiwan. Stra. 2000, 19, 119–124. (In Chinese) [Google Scholar]
  54. Wong, L.A.; Chen, J.C.; Dong, L.X. A model of the plume front of the Pearl River estuary, China and adjacent coastal waters in the winter dry season. Cont. Shelf Res. 2004, 24, 1779–1795. [Google Scholar] [CrossRef]
  55. Zhao, D.N. Morphological Evolution of the Pearl River Delta in the Past 165 Years and Its Response to Human Activities. Ph.D. Thesis, Zhejiang University, Hangzhou, China, 2017; pp. 1–232. (In Chinese). [Google Scholar]
  56. Wang, L.; Fan, D.J.; Zhang, X.L. The impact of Artificial Channel Dredging on Inshore Marine Sedimentation: Taking the Huludao Harbor for Example. J. Ocean Univ. China 2012, 40, 88–96, (In Chinese with English abstract). [Google Scholar] [CrossRef]
  57. Wang, Q.; Wang, X.L.; Li, X.Y.; Wang, X.; Zhan, C. Grain size characteristics and coarsening phenomenon of inter-tidal flat surficial sediment along the abandoned southern Yellow River Sub-delta. Quat. Sci. 2017, 37, 353–367, (In Chinese with English abstract). [Google Scholar] [CrossRef]
  58. Yang, H.F.; Yang, S.L.; Meng, Y.; Xu, K.F.; Luo, X.X.; Wu, C.S.; Shi, X.F. Recent coarsening of sediments on the southern Yangtze subaqueous delta front: A response to river damming. Cont. Shelf Res. 2018, 155, 45–51. [Google Scholar] [CrossRef]
  59. He, W. Bifurcated Mechanism and Its Impact on Flood Discharge and Saline Intrusion in Pearl River Estuary. Master’s Thesis, East China Normal University, Shanghai, China, 2012; pp. 1–127. (In Chinese). [Google Scholar]
  60. Yang, Q.S.; Fu, L.X.; Wei, W.; Jia, L.W.; Li, B.; Wang, H.; Huang, E.M. Study on the structural evolution and dynamic balance of the shoal and channel in the Huangmaohai Estuary of the Zhujiang River. Haiyang Xuebao 2023, 45, 68–81, (In Chinese with English abstract). [Google Scholar] [CrossRef]
  61. Chu, N.Y. The Evolution of Lingding Bay Channel-Shoal System Under Anthropogenic Influence; Sun Yat-sen University: Guangzhou, China, 2020; pp. 1–262. (In Chinese) [Google Scholar]
Figure 1. (a) A map of the Pearl River basin. (b) Location map of four outlets (Humen, Jiaomen, Hongqili, and Hengmen), three shoals (west shoals, middle shoals, and east shoals), main shipping lane (Lingding waterway, Fanshi waterway, and Tonggu waterway), and sampling sites (LD11 and LD13). (c) Gross domestic product of the LE coastal cities (data are available at www.dsec.gov.mo (accessed on 1 May 2024) and stats.gd.gov.cn (accessed on 1 May 2024)).
Jmse 12 01139 g001
Figure 2. Photographs of cores LD11 and LD13 (units: cm). Core LD11 measures 167 cm in length, while LD13 measures 185 cm.
Jmse 12 01139 g002
Figure 3. (a) Vertical distribution of 210Pbex in core LD11 (Red dots is excess 210Pb radioactivity). (b) Vertical distribution of 210Pbex and exponential fitting between depth (Y axis: cm) and 210Pbex (X axis: dpm·g−1) in core LD13 (Yellow dots is excess 210Pb radioactivity in the upper section; Red dots is excess 210Pb radioactivity in the lower section; Black dashed lines is the fitting curve). (c) The depth–age framework of LD13 based on CIC and CRS model.
Jmse 12 01139 g003
Figure 4. Vertical variation of grain size content in cores LD11 (left) and LD13 (right), and the traces of human disturbance in the sediment of core LD11 can be observed (Figure. A).
Jmse 12 01139 g004
Figure 5. Sensitive grain size curves, variations in content of grain size, and <6.29 Φ components of core LD13 are as follows: There are two peak values of standard deviation at 4.64 Φ and 7.77 Φ, respectively; 6.29 Φ is the separation point between two sensitive grain sizes. The 95 cm layer shows significant changes in particle size distribution. The content of the <6.29 Φ component decreases from the top to the bottom of the core (the red line represents the average contents of the <6.29 Φ component).
Jmse 12 01139 g005
Figure 6. Variation of the element ratios over time in core LD11 (red dotted line is the average value).
Jmse 12 01139 g006
Figure 7. Variation of the element ratios over time in core LD13 (red dotted line is the average value).
Jmse 12 01139 g007
Figure 8. Annual variation of water discharge and sediment load from Pearl River to the estuary since the 1950s, as measured at Gaoyao, Shijiao, and Boluo stations.
Jmse 12 01139 g008
Figure 9. Schematic diagram of reclamation, sand mining, and waterway dredging in the LDB during 1972–2017 (HuM: Humen, JM: Jiaomen, HQL: Hongqili, HM: Hengmen).
Jmse 12 01139 g009
Figure 10. The main human activities in the LE in the past 70 years.
Jmse 12 01139 g010
Table 1. Standard deviation and peak value at 94.5 cm of four indicators of LD13.
Zr/RbZr/AlSr/AlSr/Fe
Peak value of 94.5 cm1.580.730.430.41
Overall standard deviation0.190.150.490.40
Upper standard deviation0.230.190.580.46
Lower standard deviation0.120.050.310.30
Table 2. Variation of coastline length, water area, and mean water depth in the LDB (referenced from [18]).
YearBefore 1990s199620052017
Coastline length (km) 216.4234.3275.8301.7
Water area (km2)1309.71195.51152.11121.7
Mean water depth (m)6.196.15.996.07
Disclaimer/Publisher’s Note: The statements, opinions and data contained in all publications are solely those of the individual author(s) and contributor(s) and not of MDPI and/or the editor(s). MDPI and/or the editor(s) disclaim responsibility for any injury to people or property resulting from any ideas, methods, instructions or products referred to in the content.

