
Buffer Blocks as Wave Energy Dissipators: Flow Depth Reduction
 , ,
, , 
Abstract
:1. Introduction
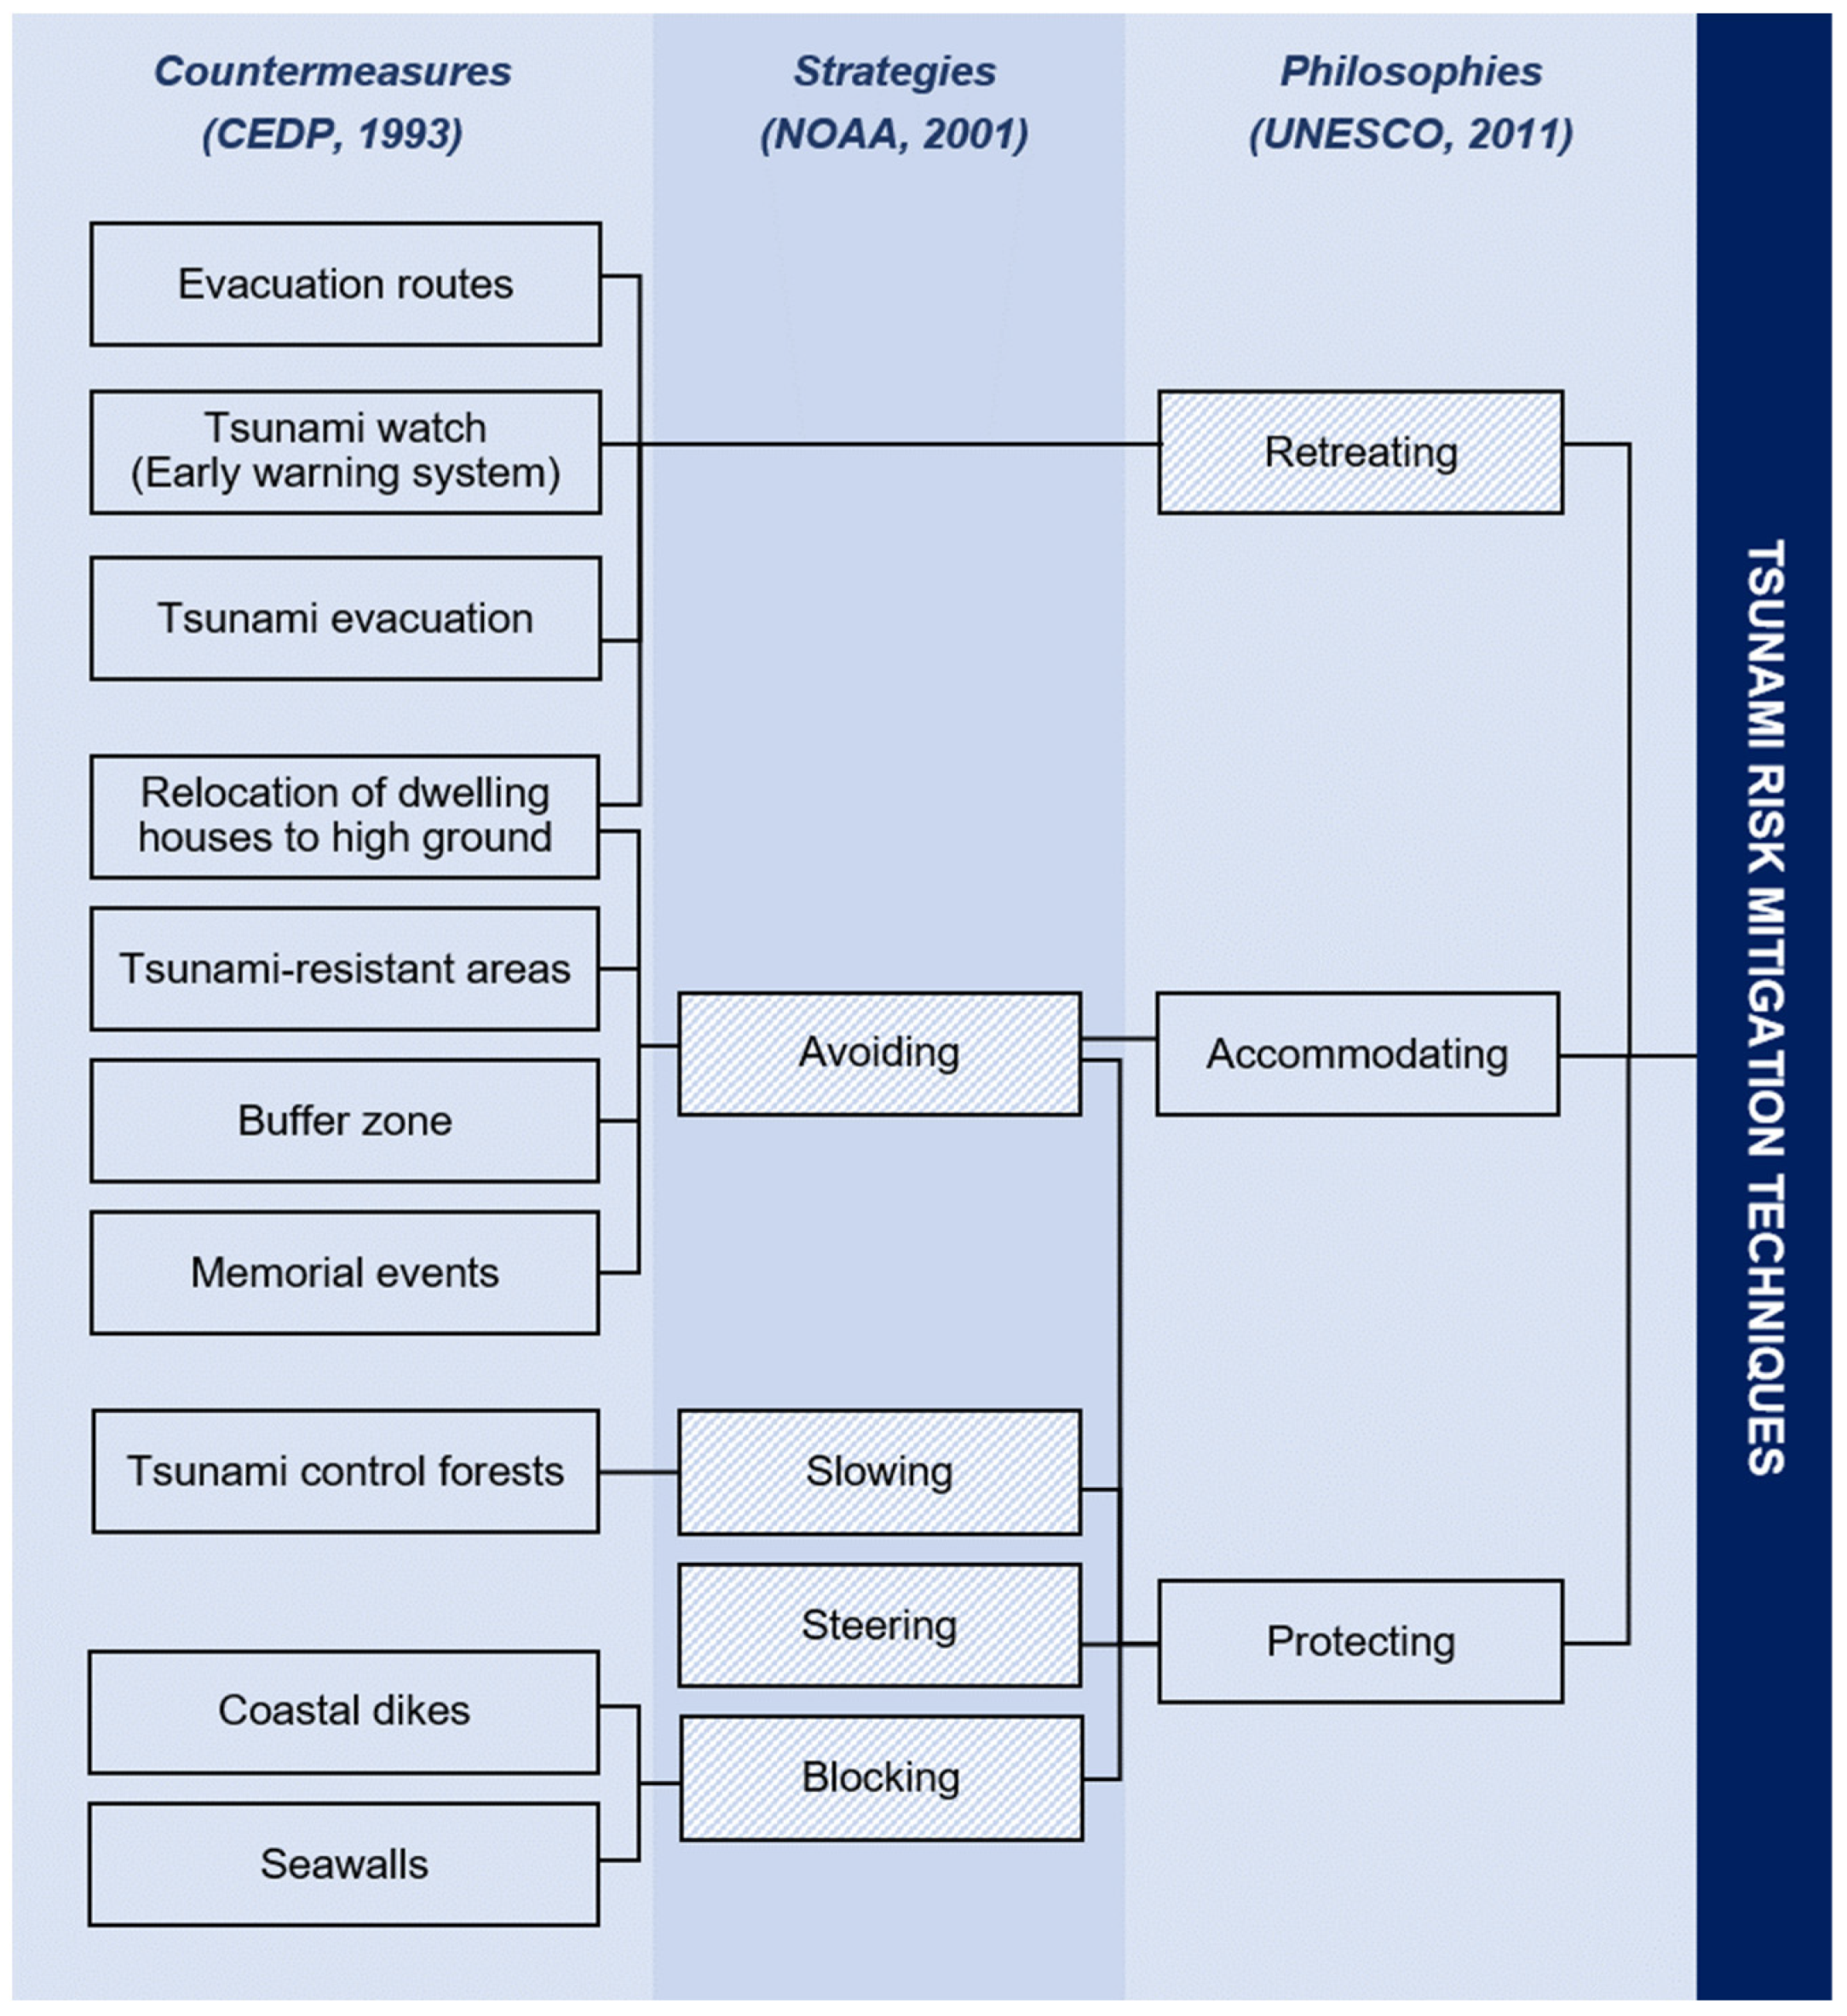
2. Tsunami Mitigation Techniques
2.1. Shortcomings of Traditional Approaches
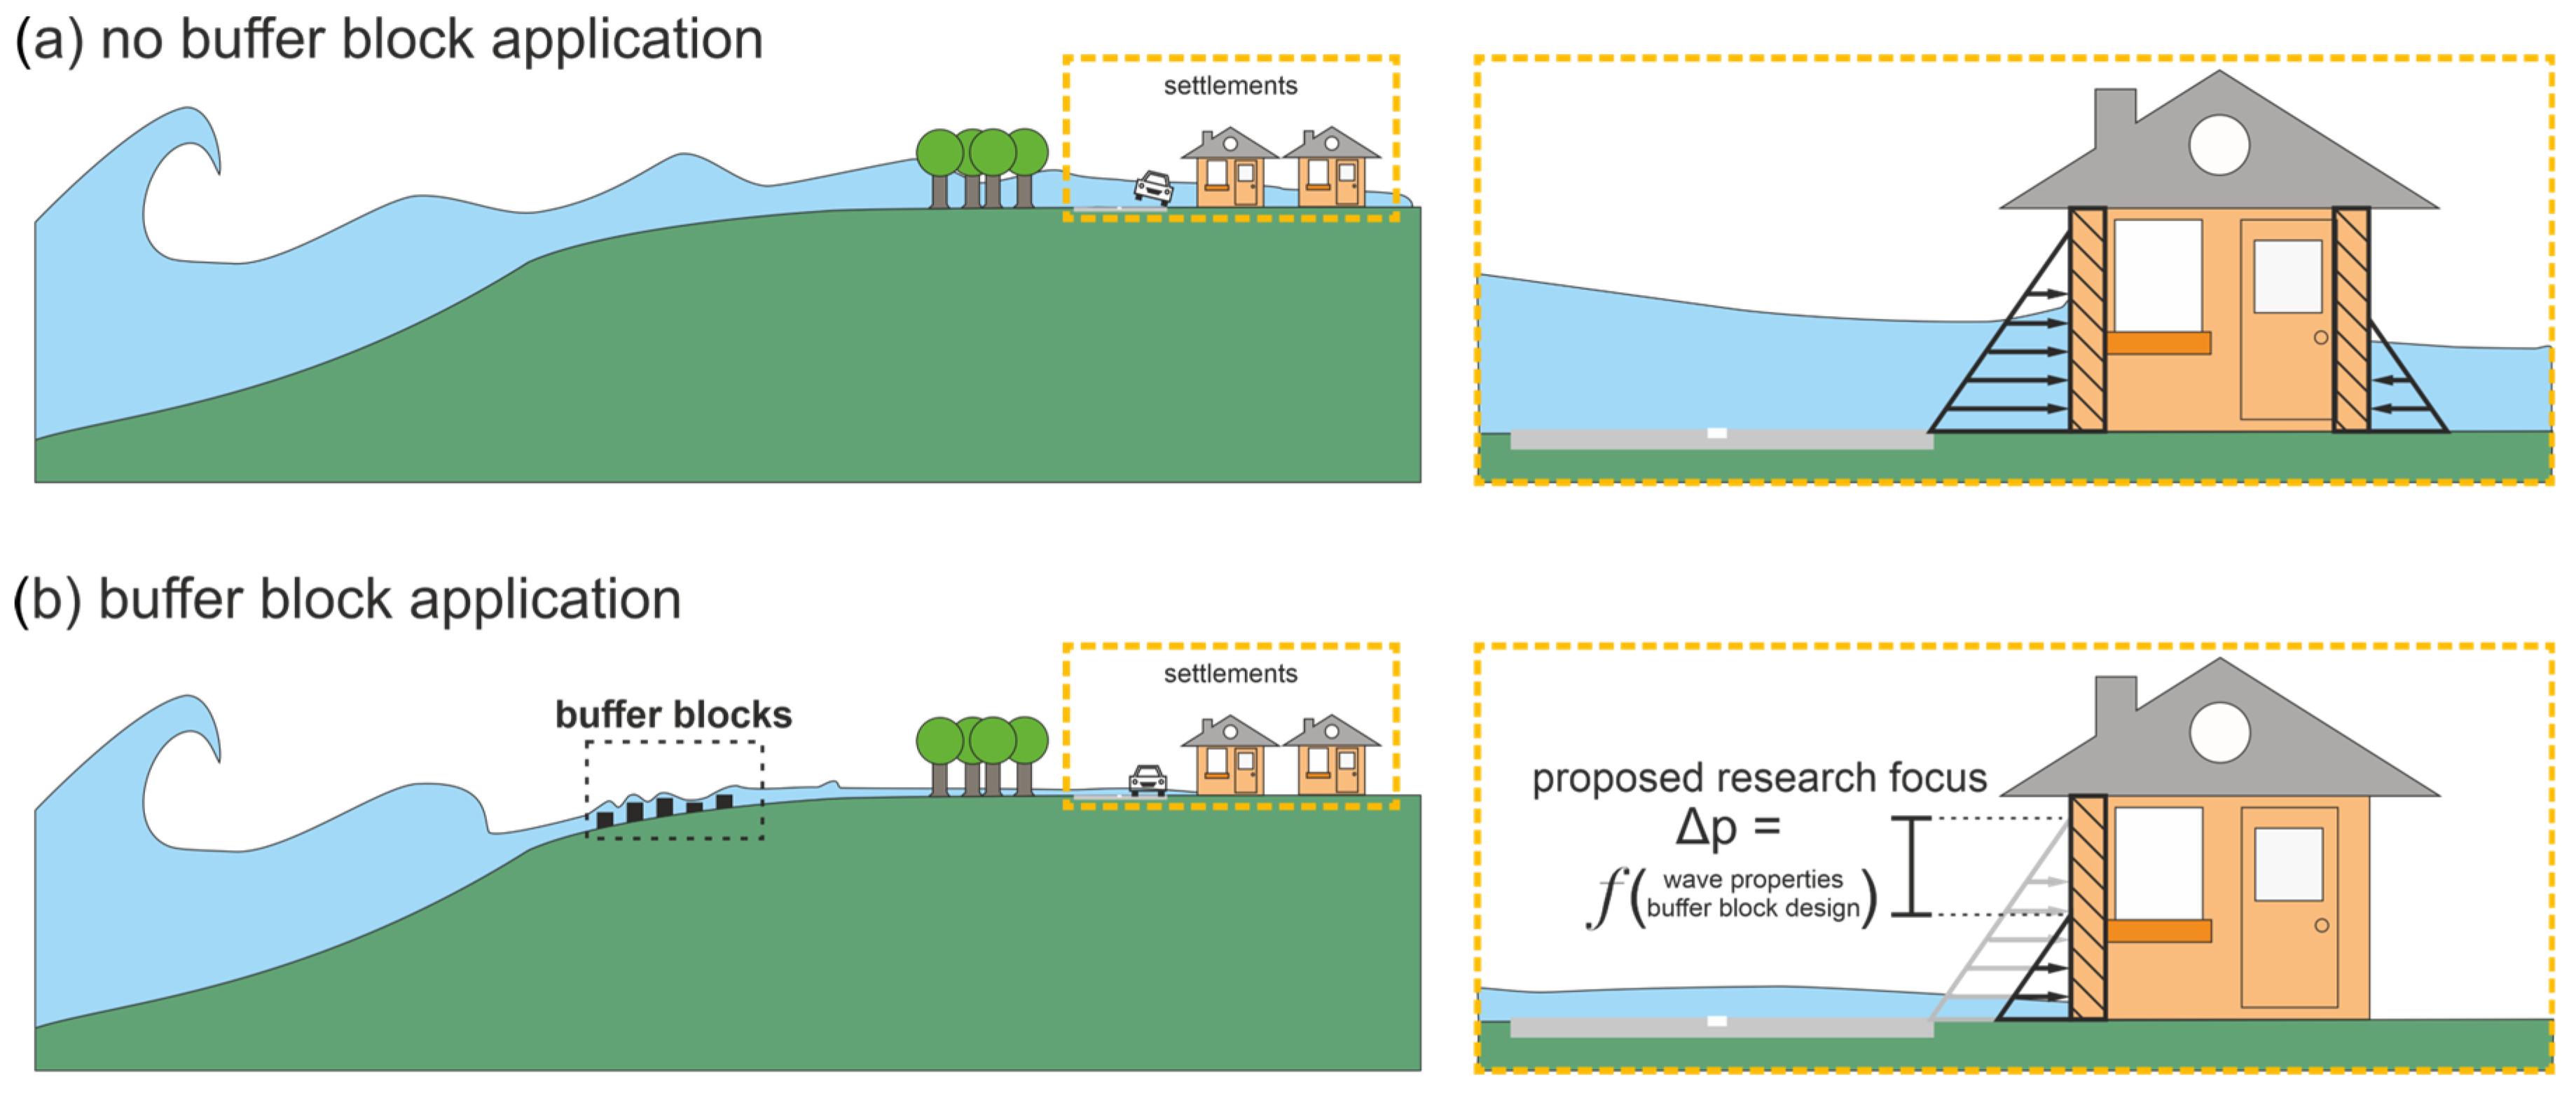
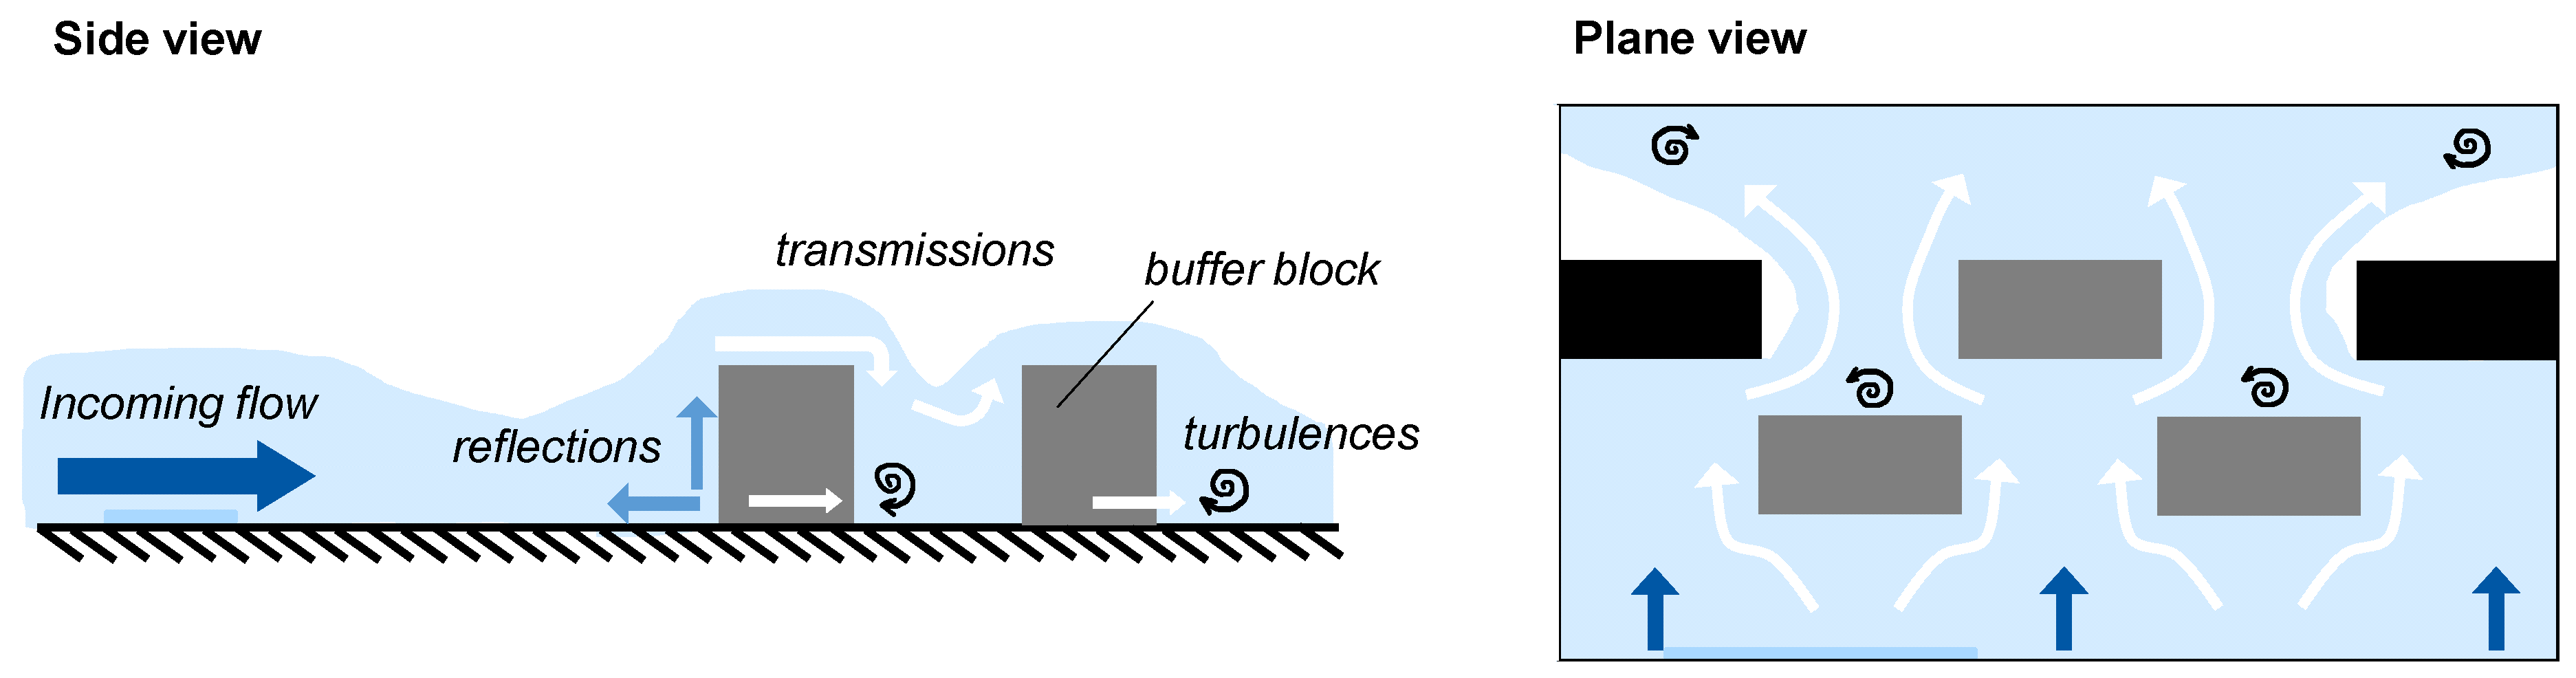
2.2. Macro-Roughness Elements
3. Materials and Methods
3.1. Experimental Facility
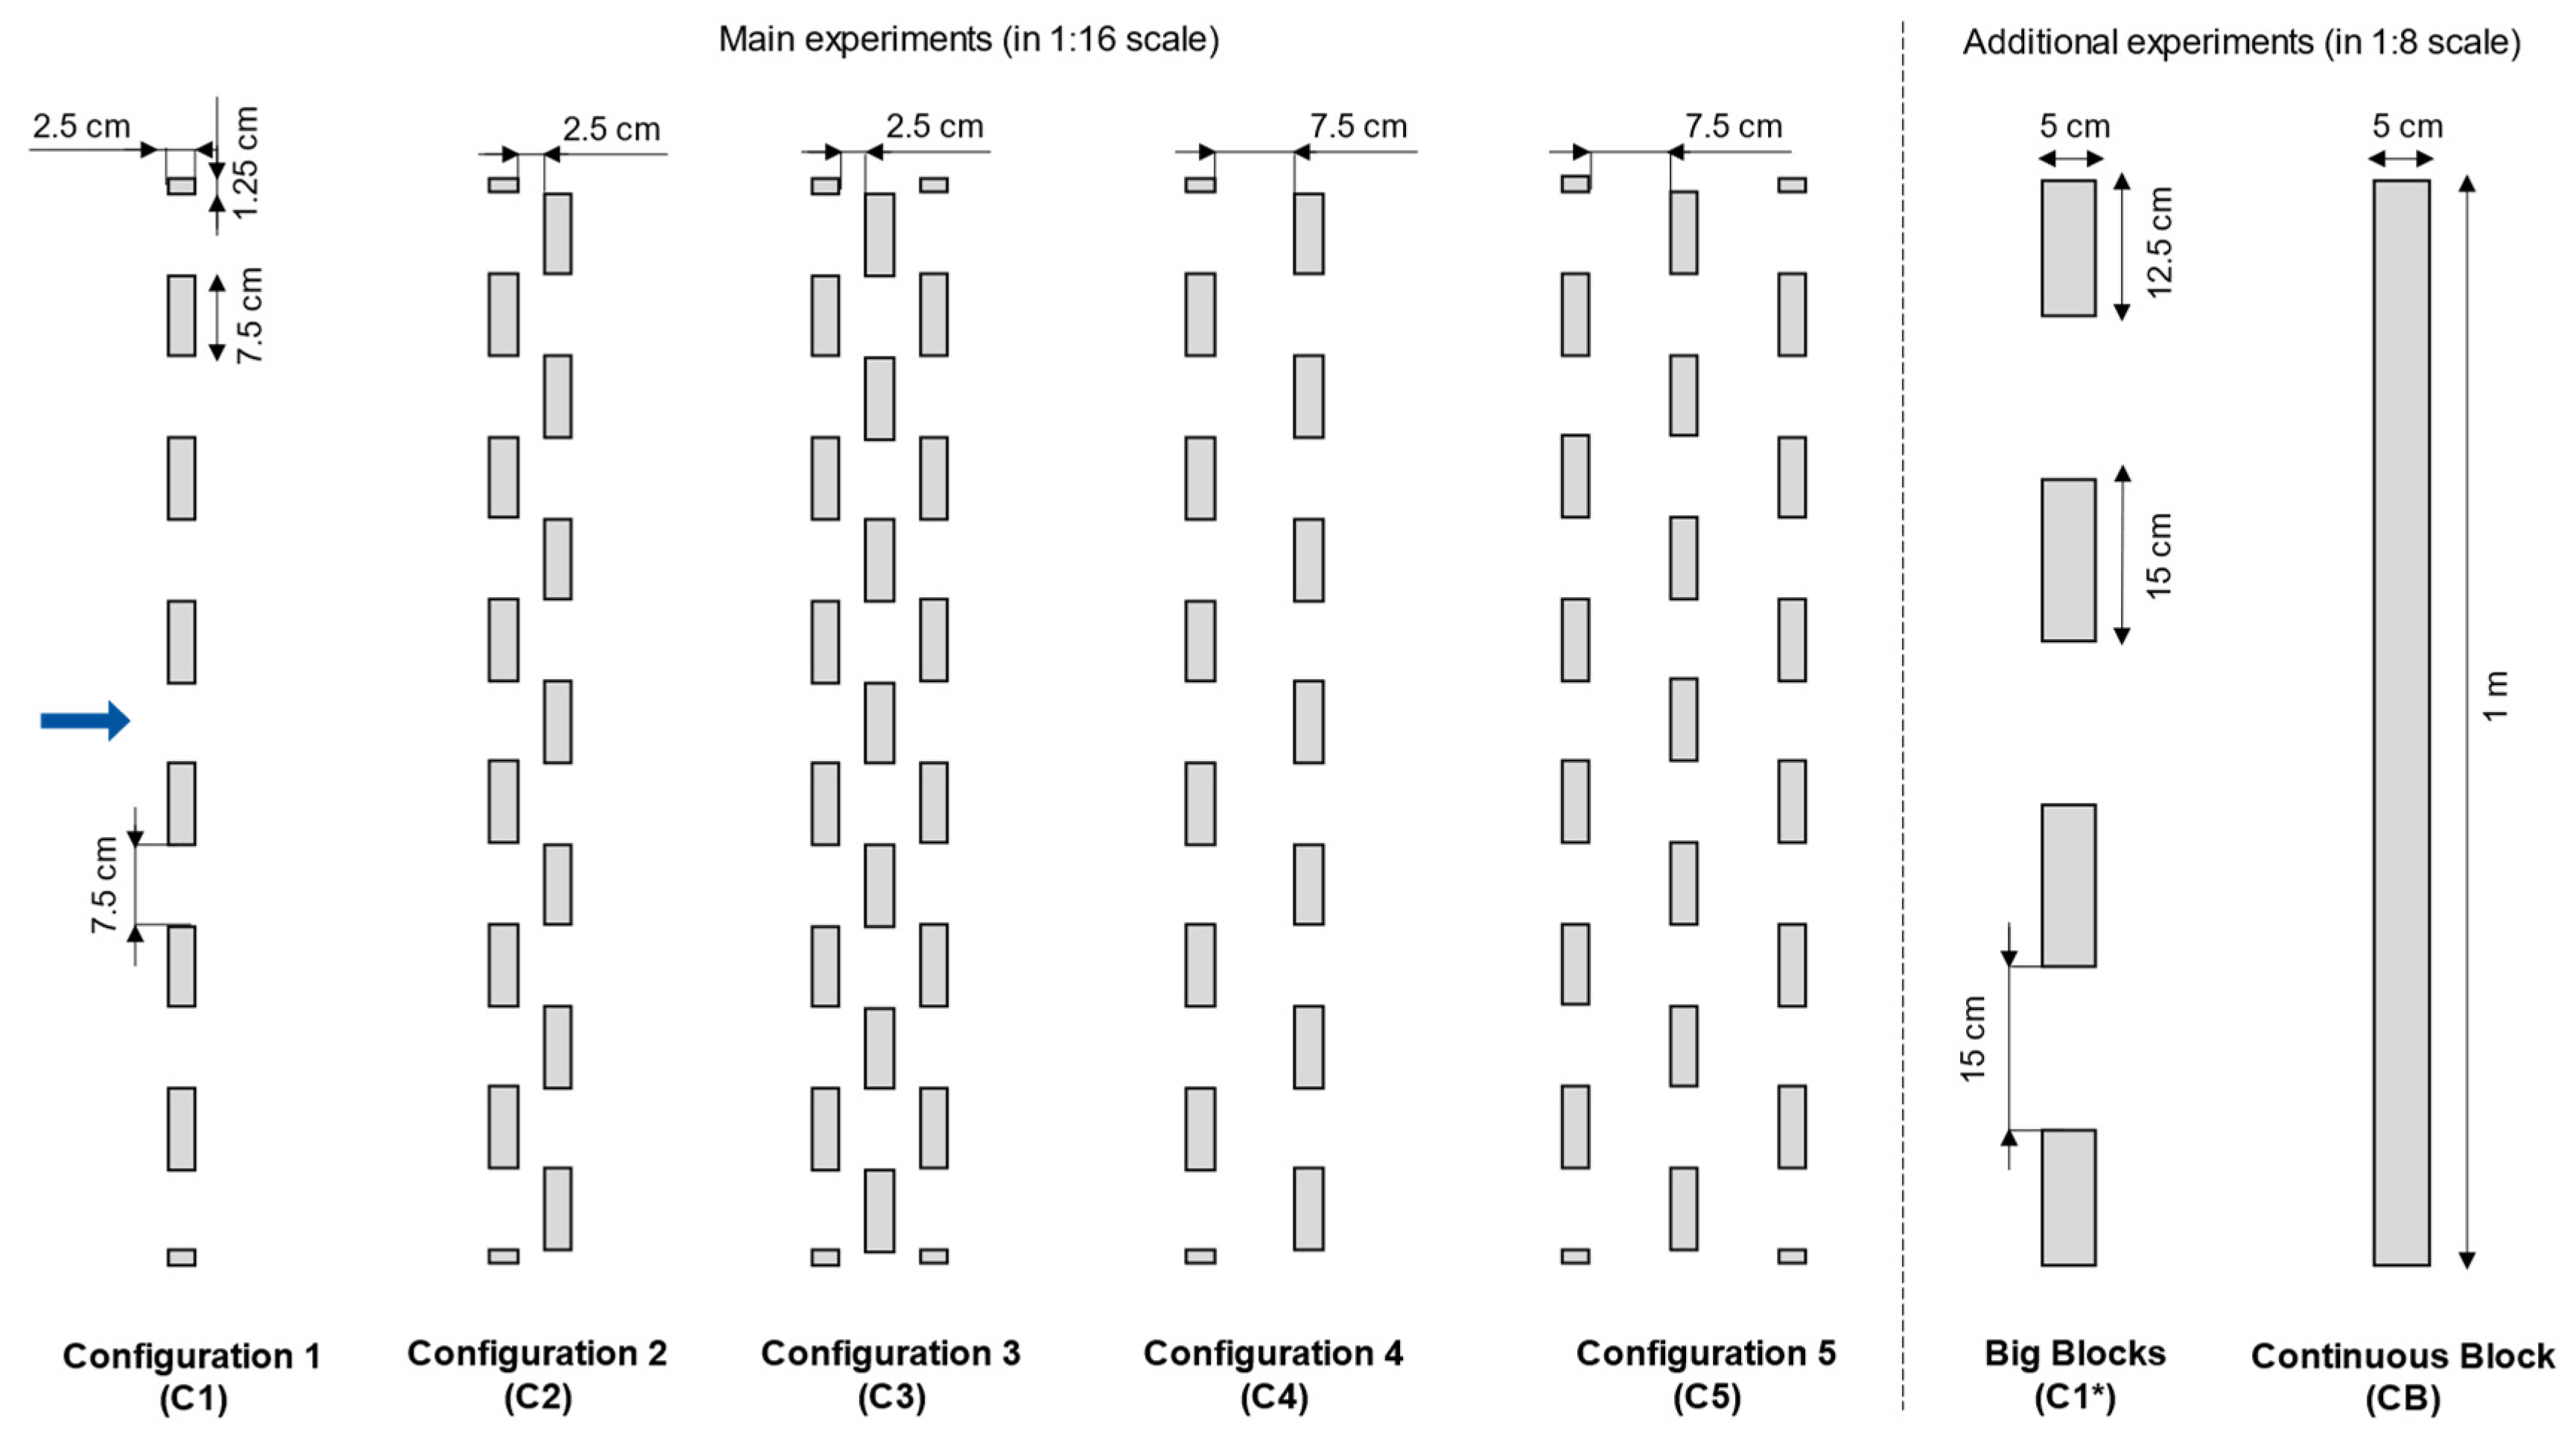
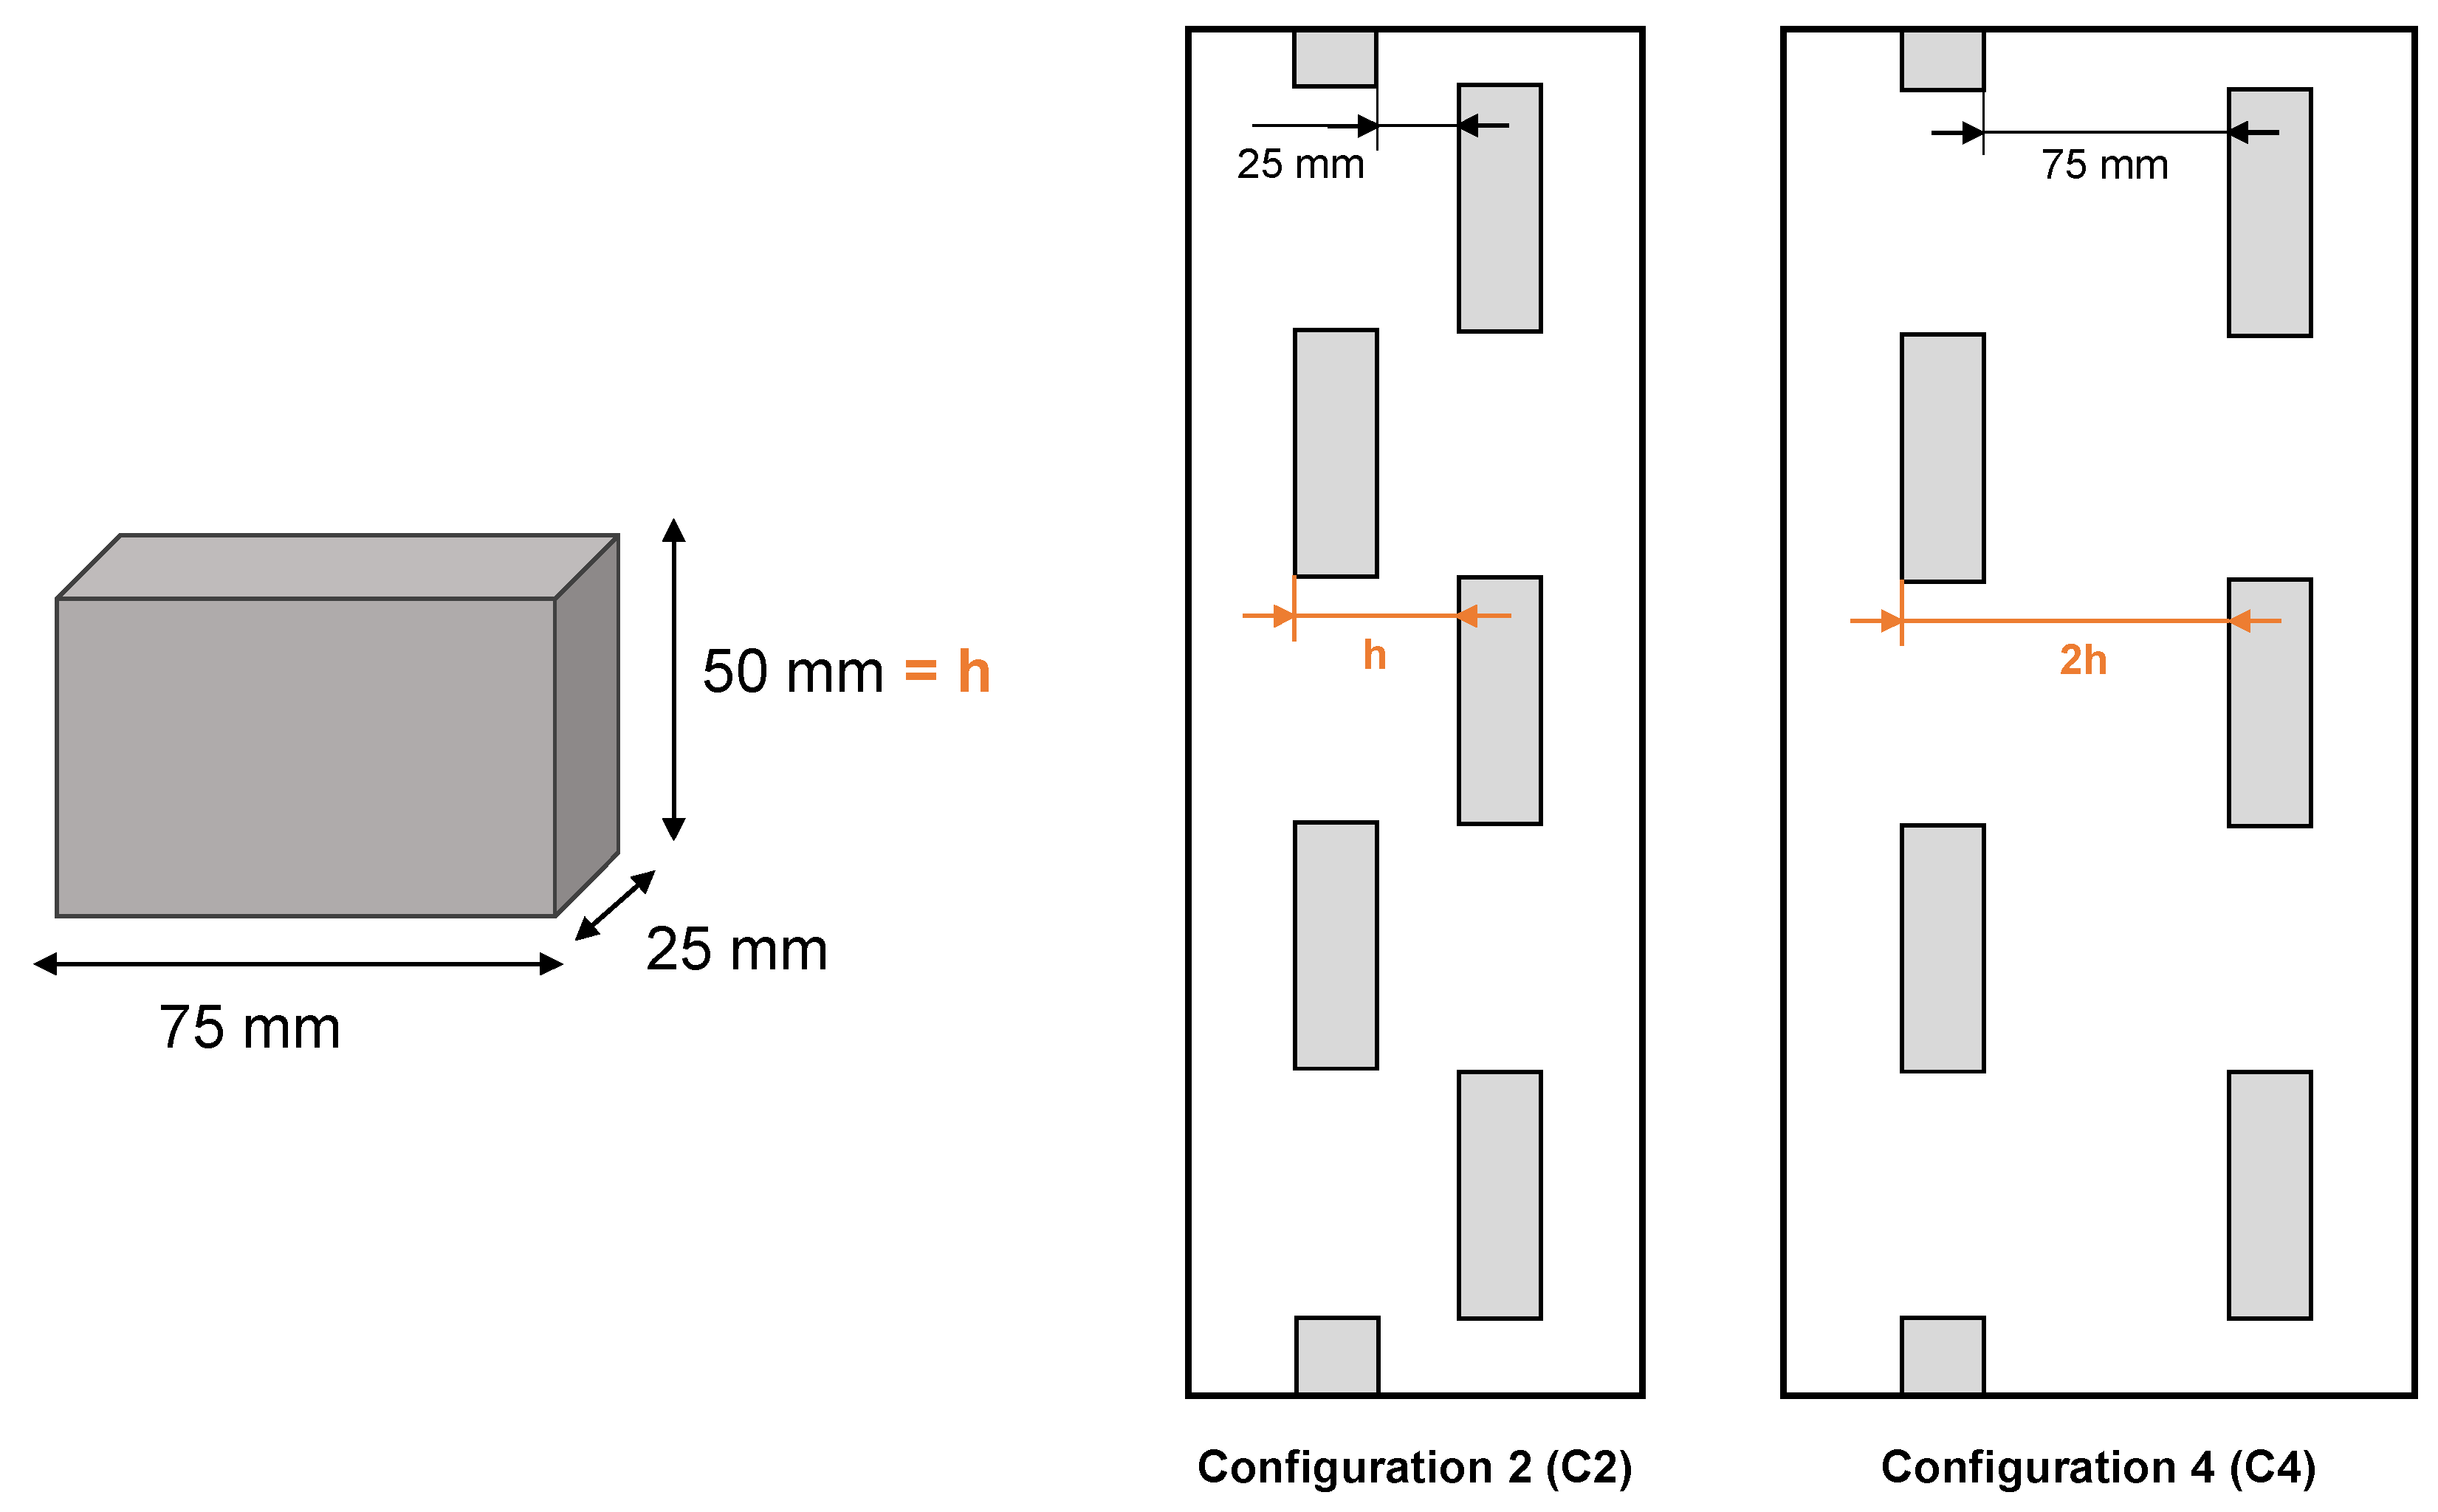
3.2. Model Setup
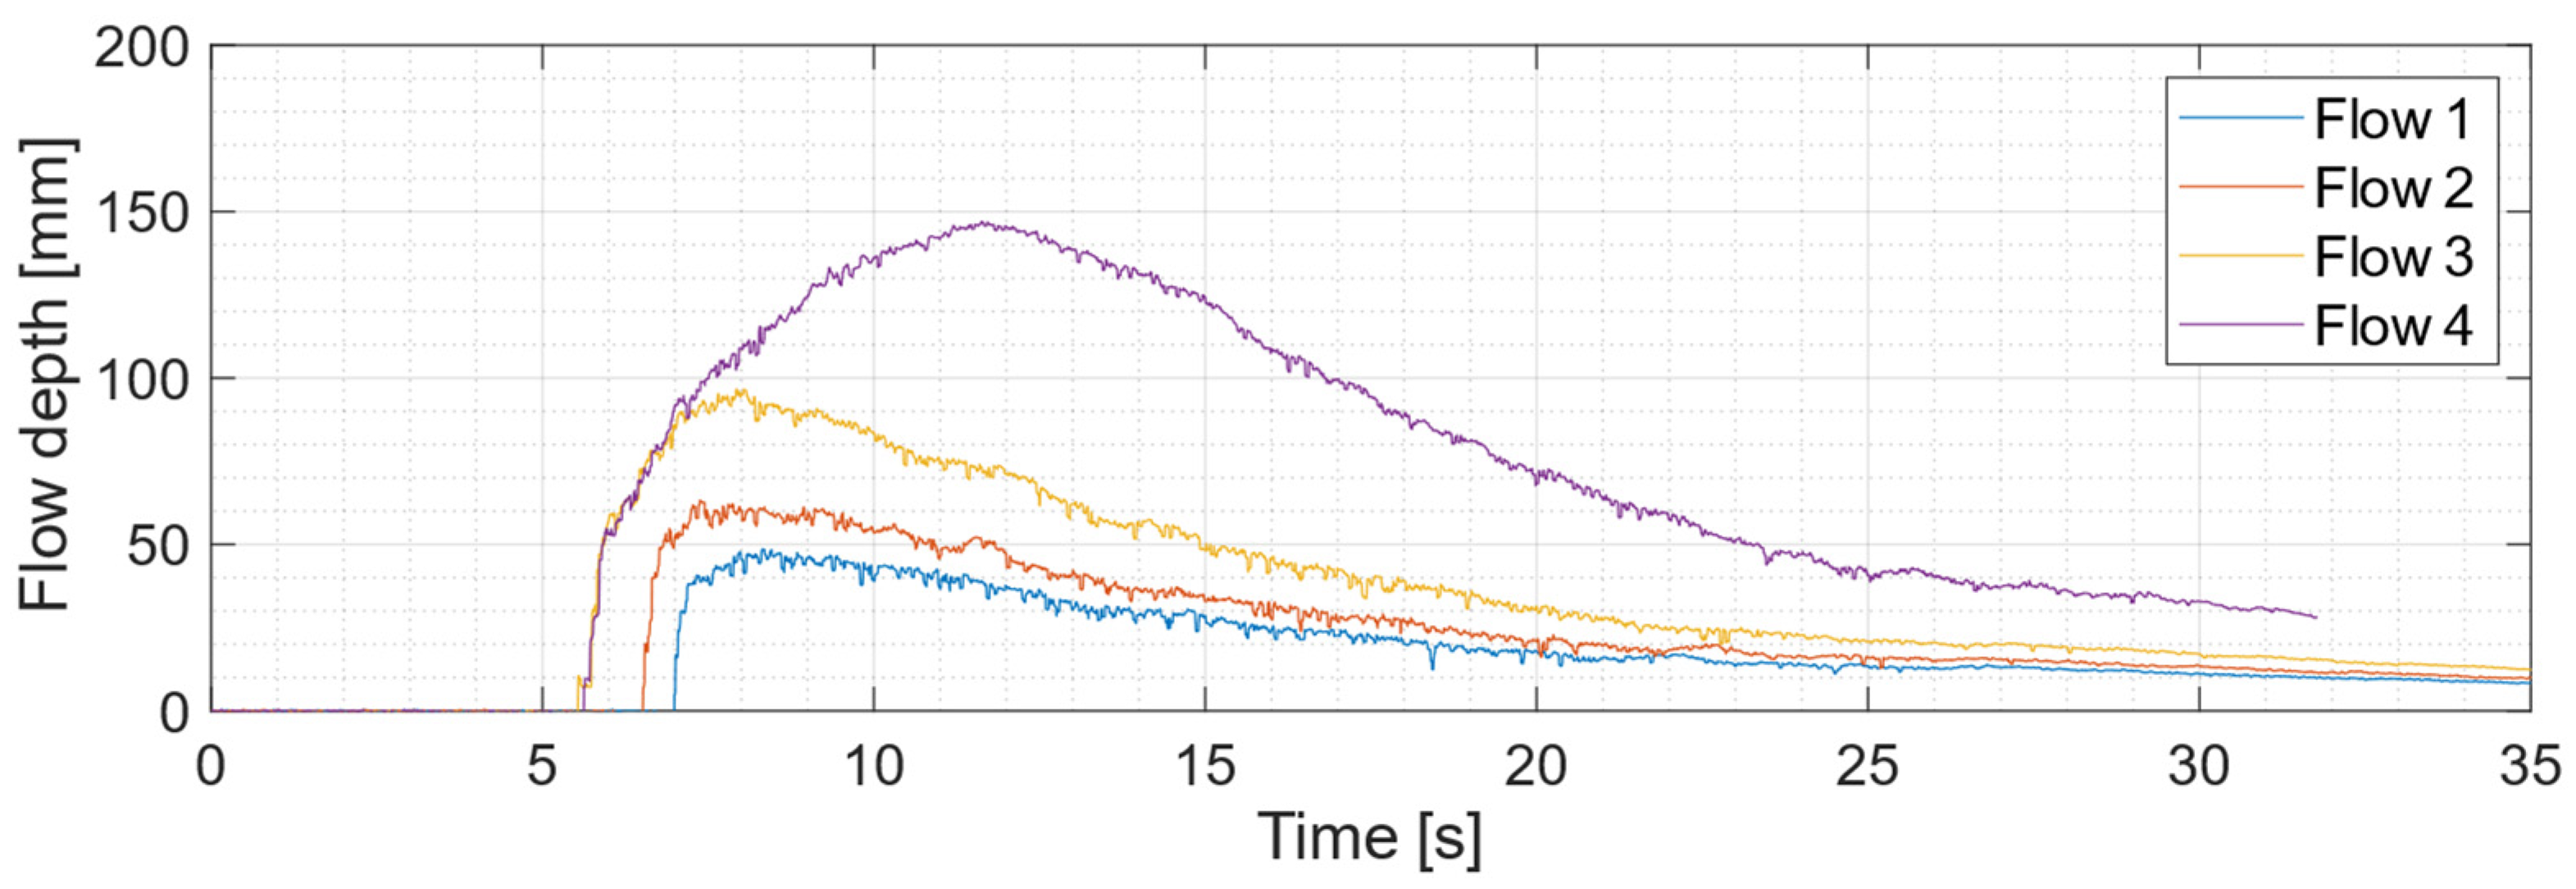
3.3. Test Program
3.4. Instrumentation
4. Results and Discussion
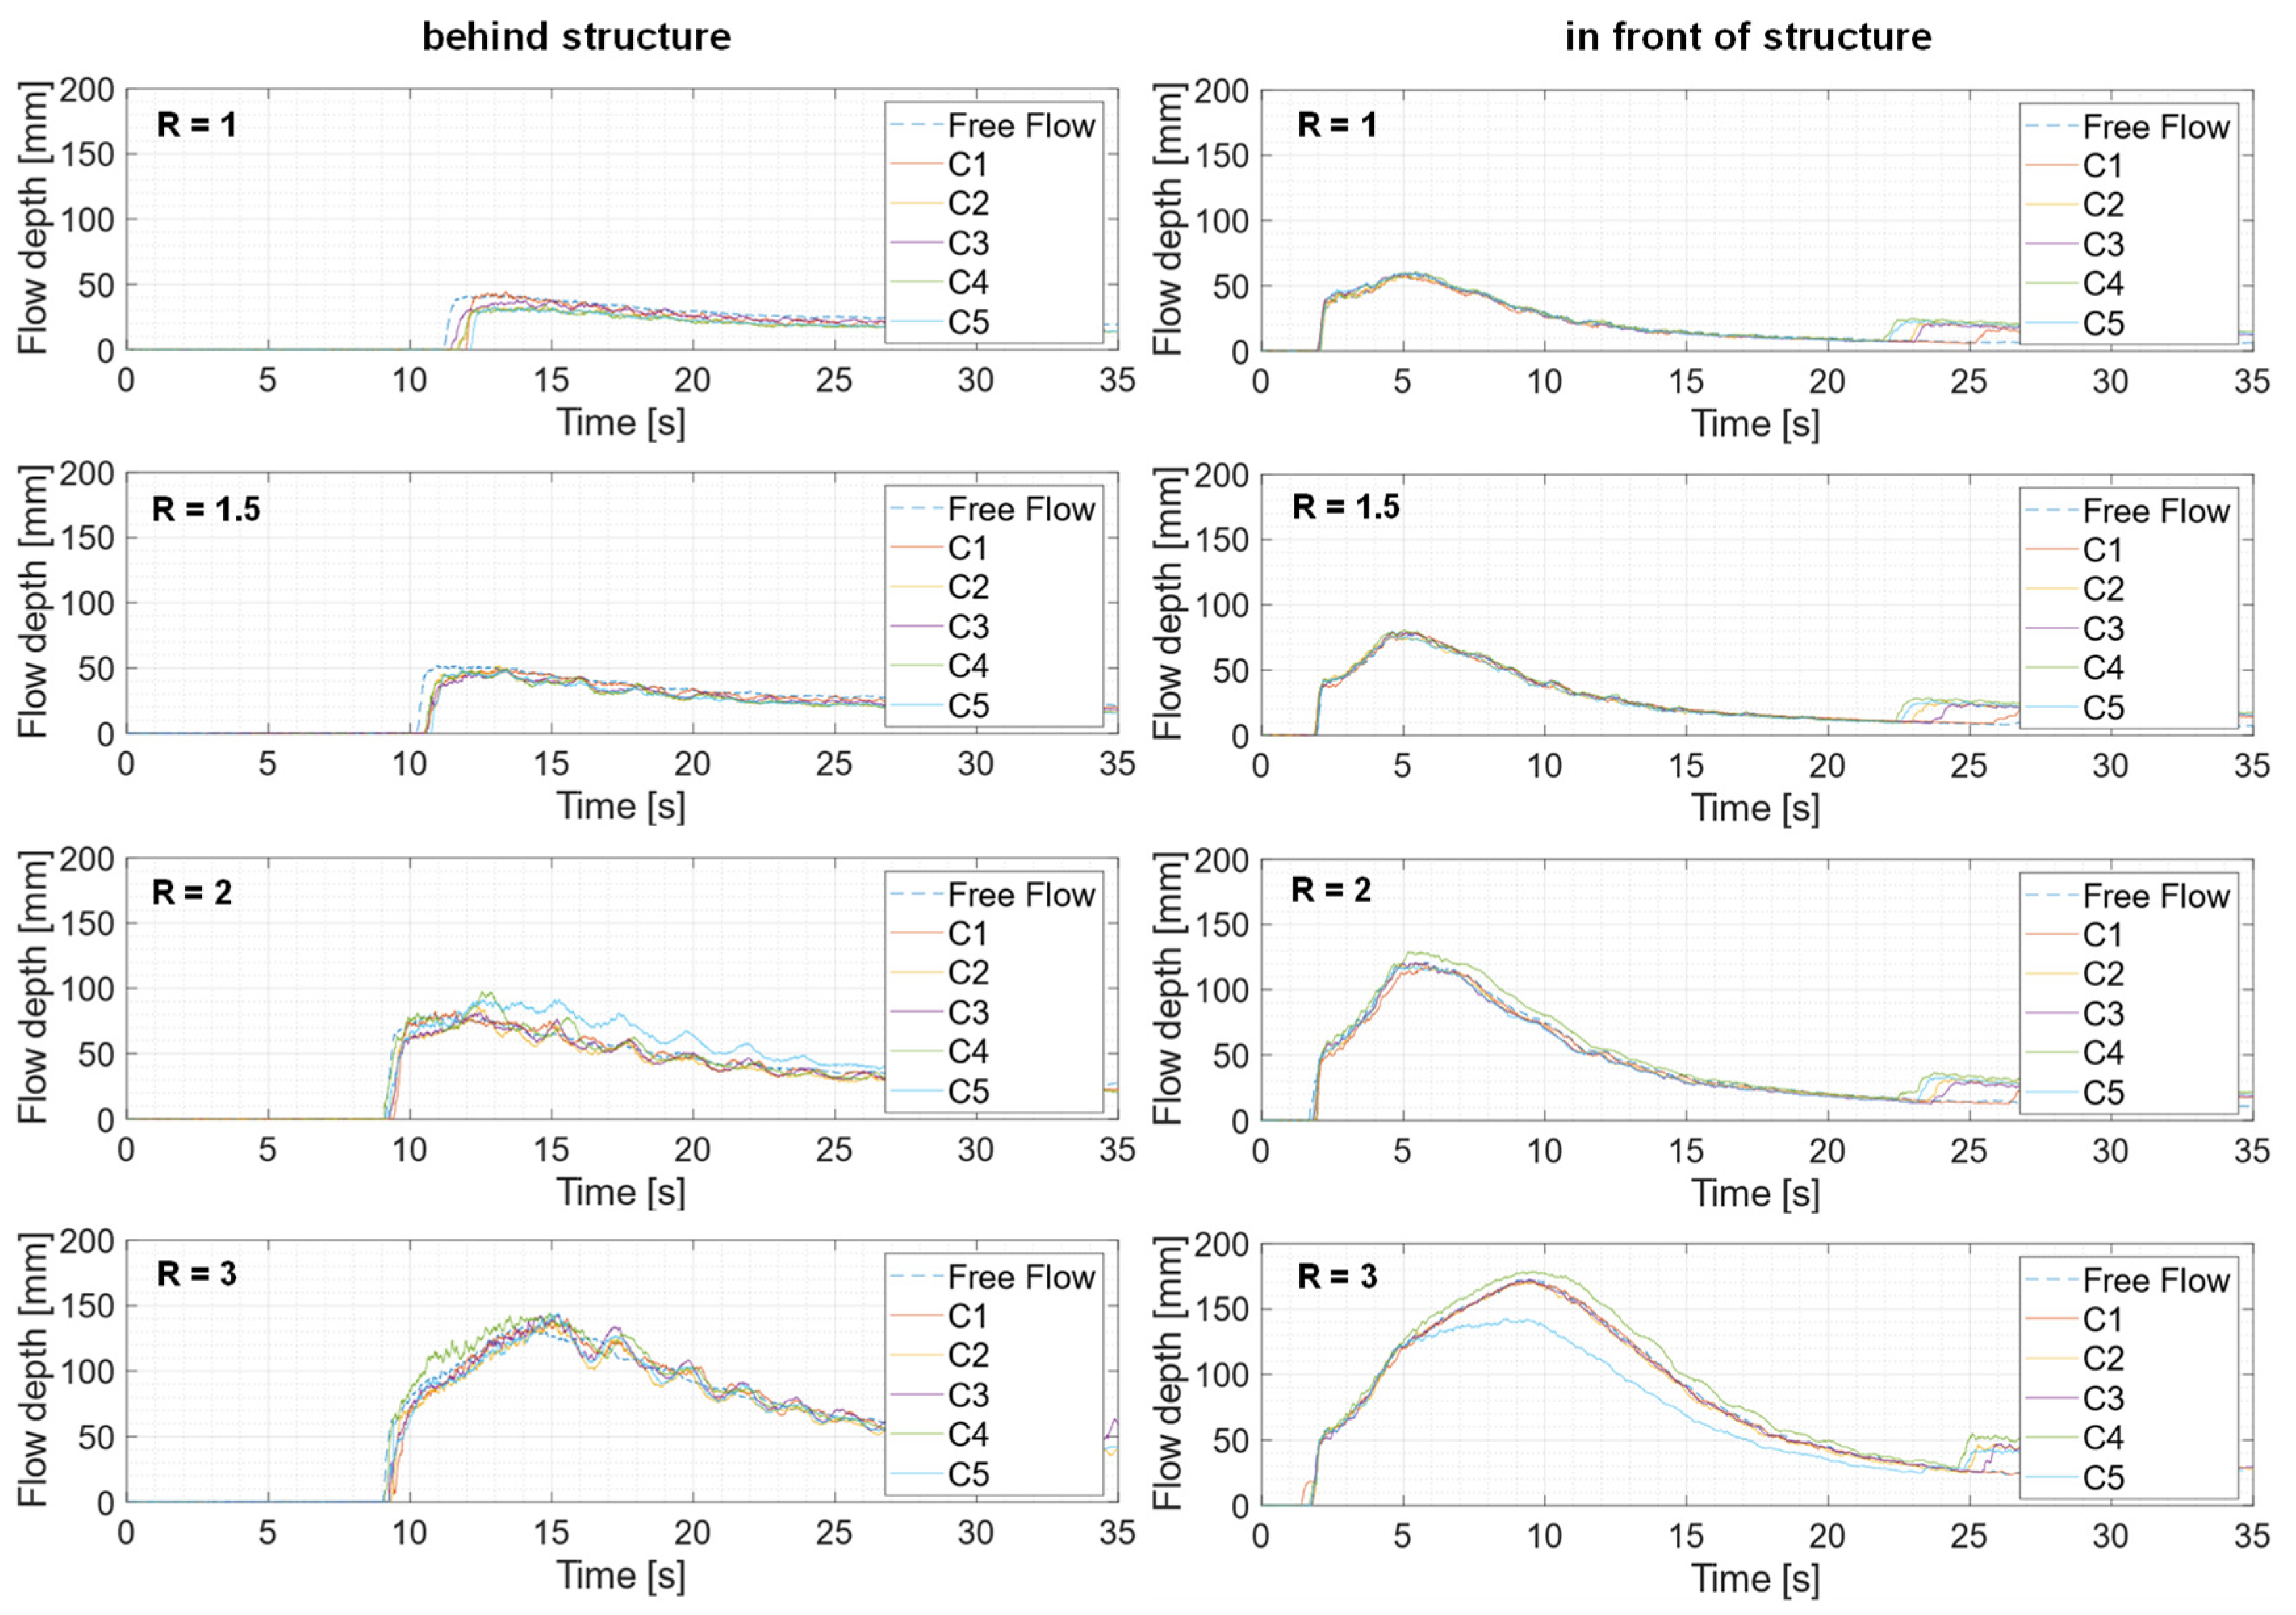
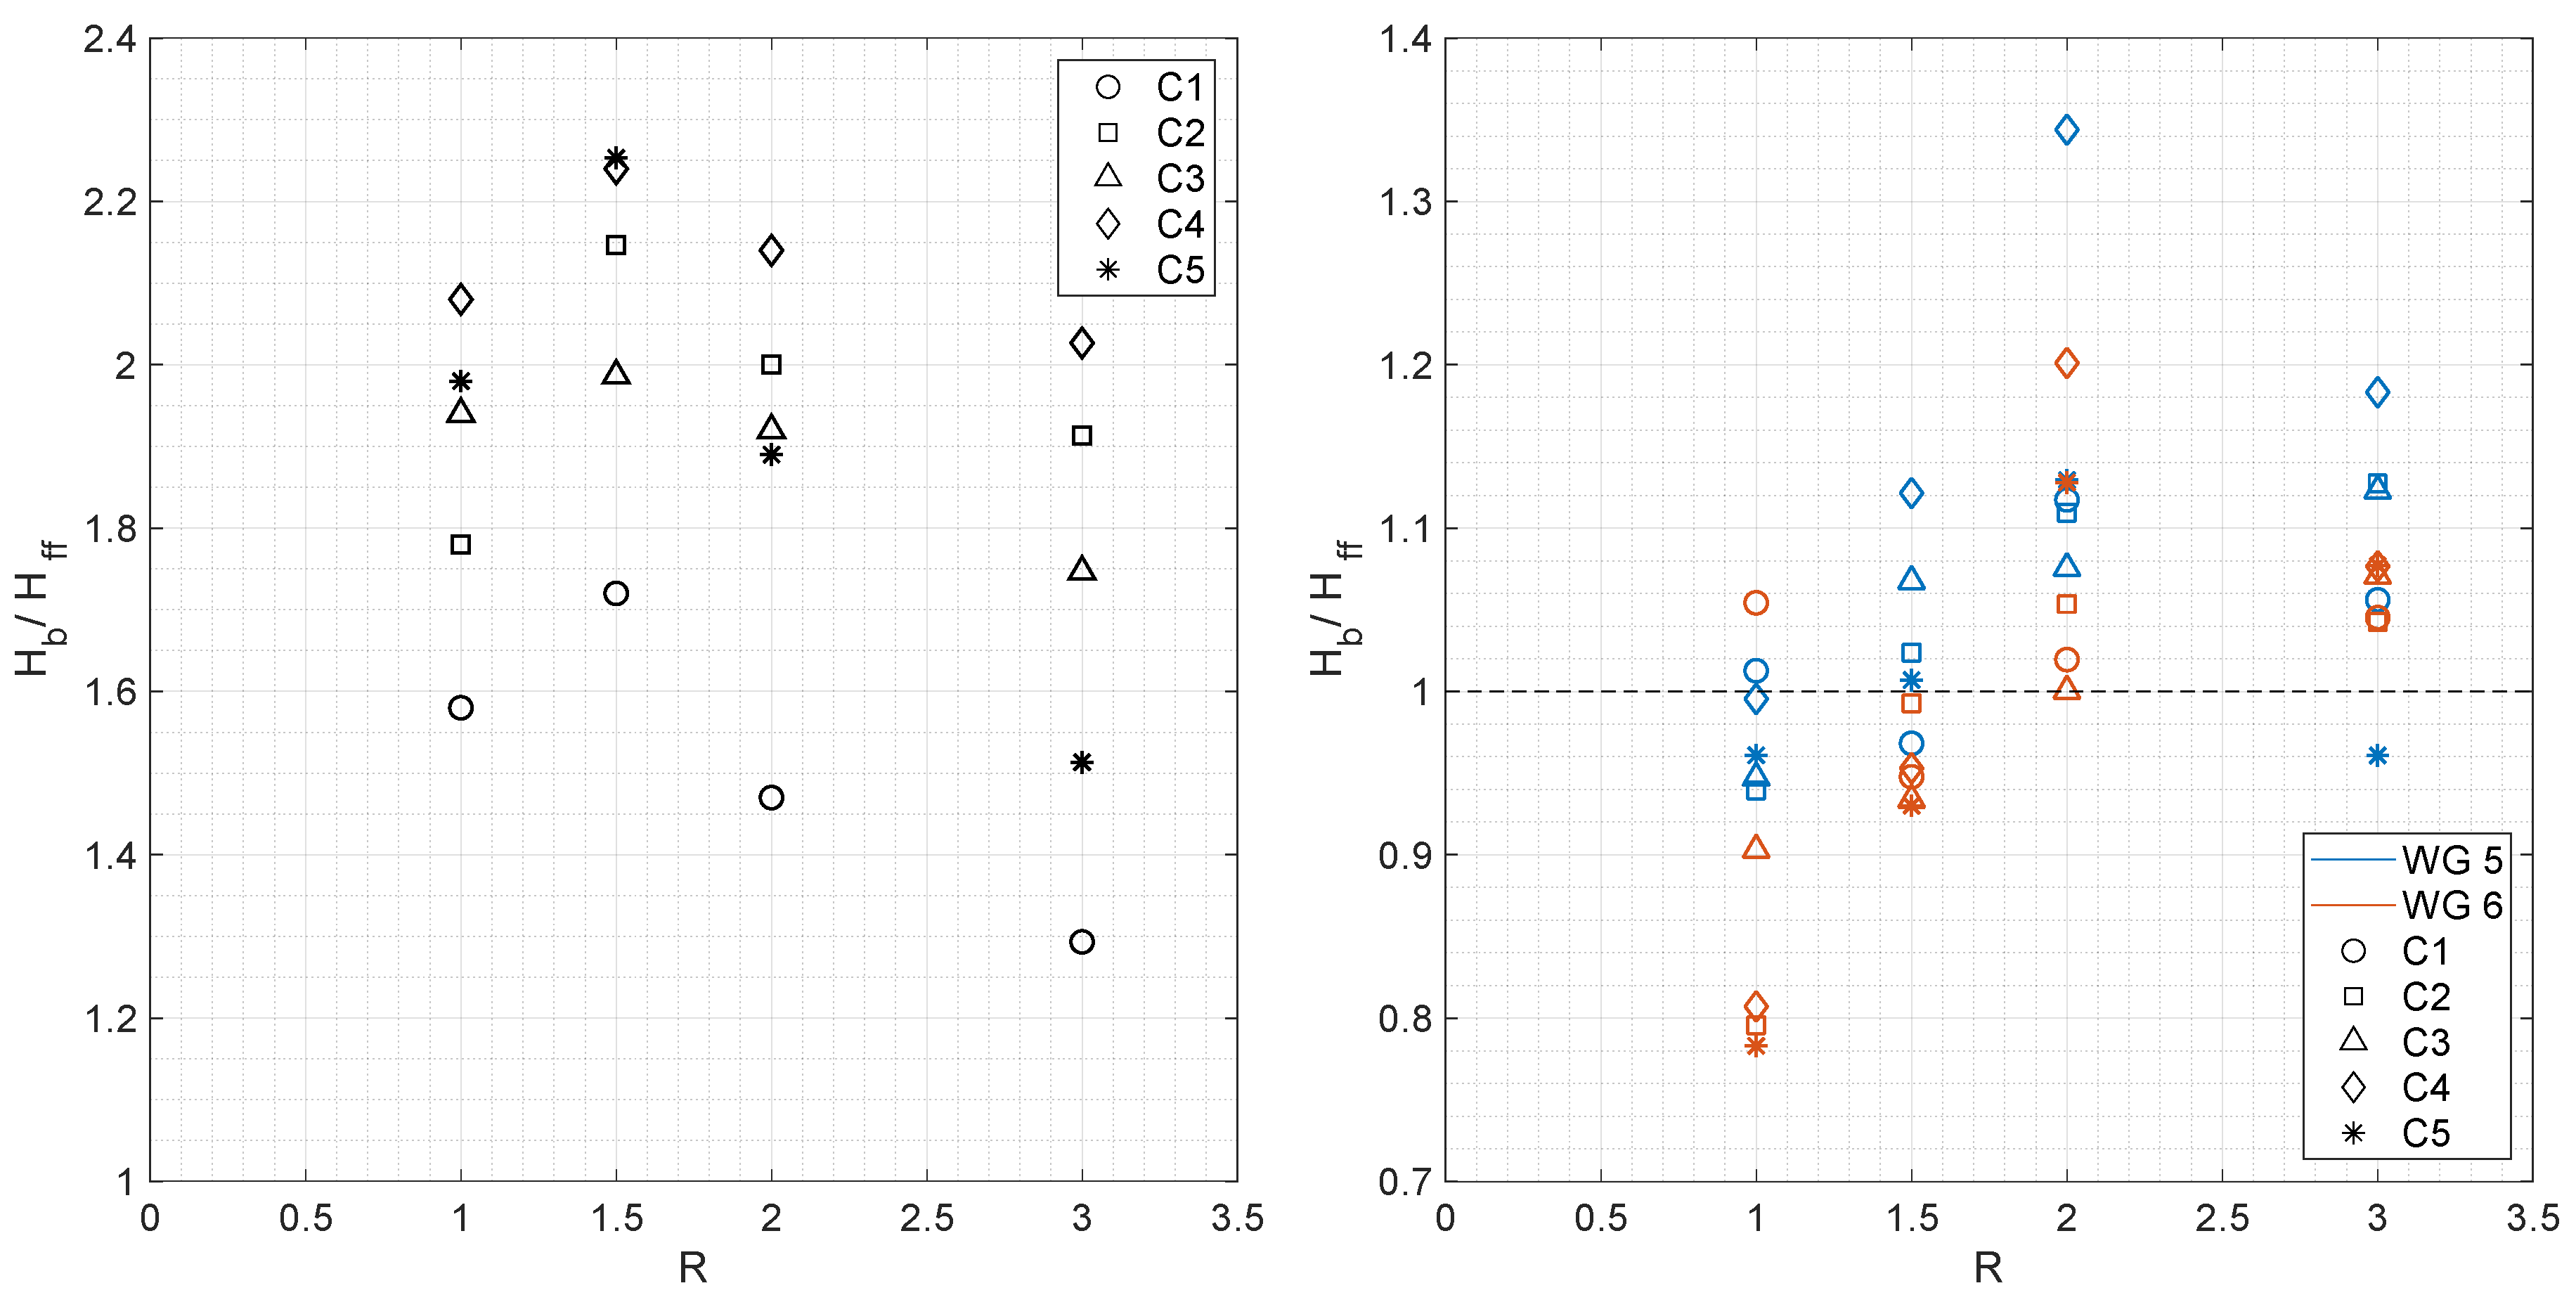
4.1. Experiments with Configurations C1 to C5
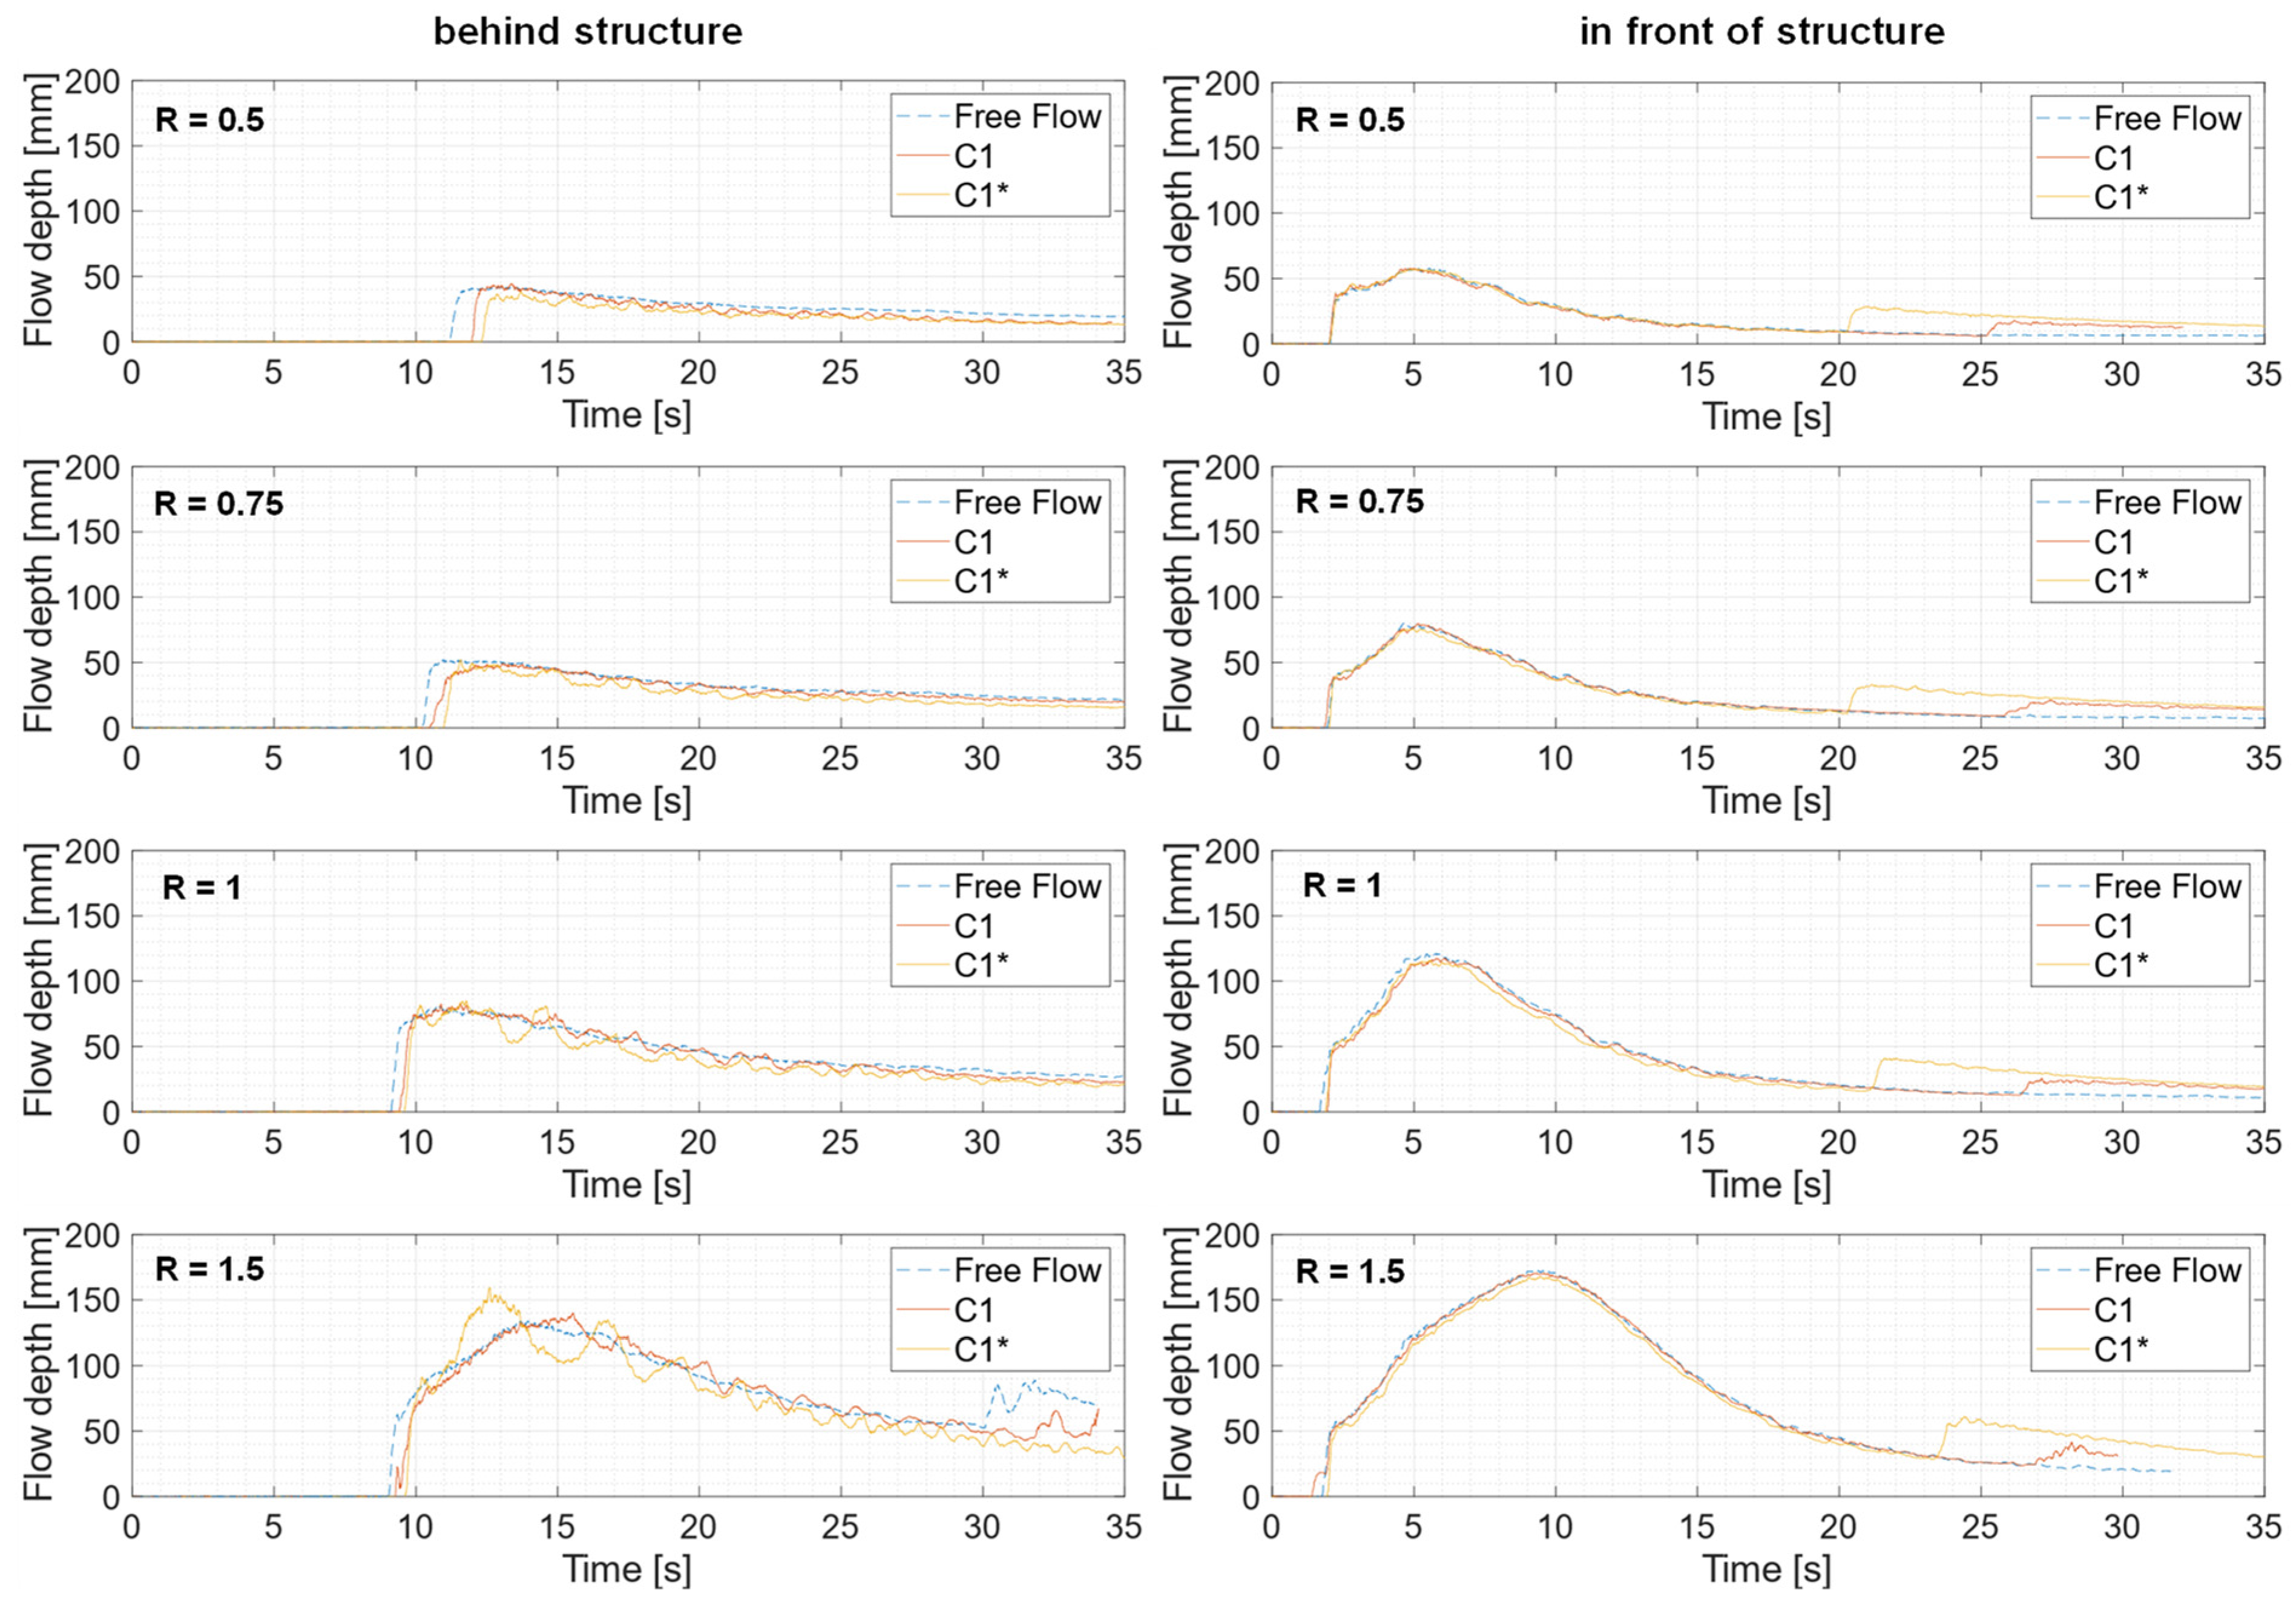
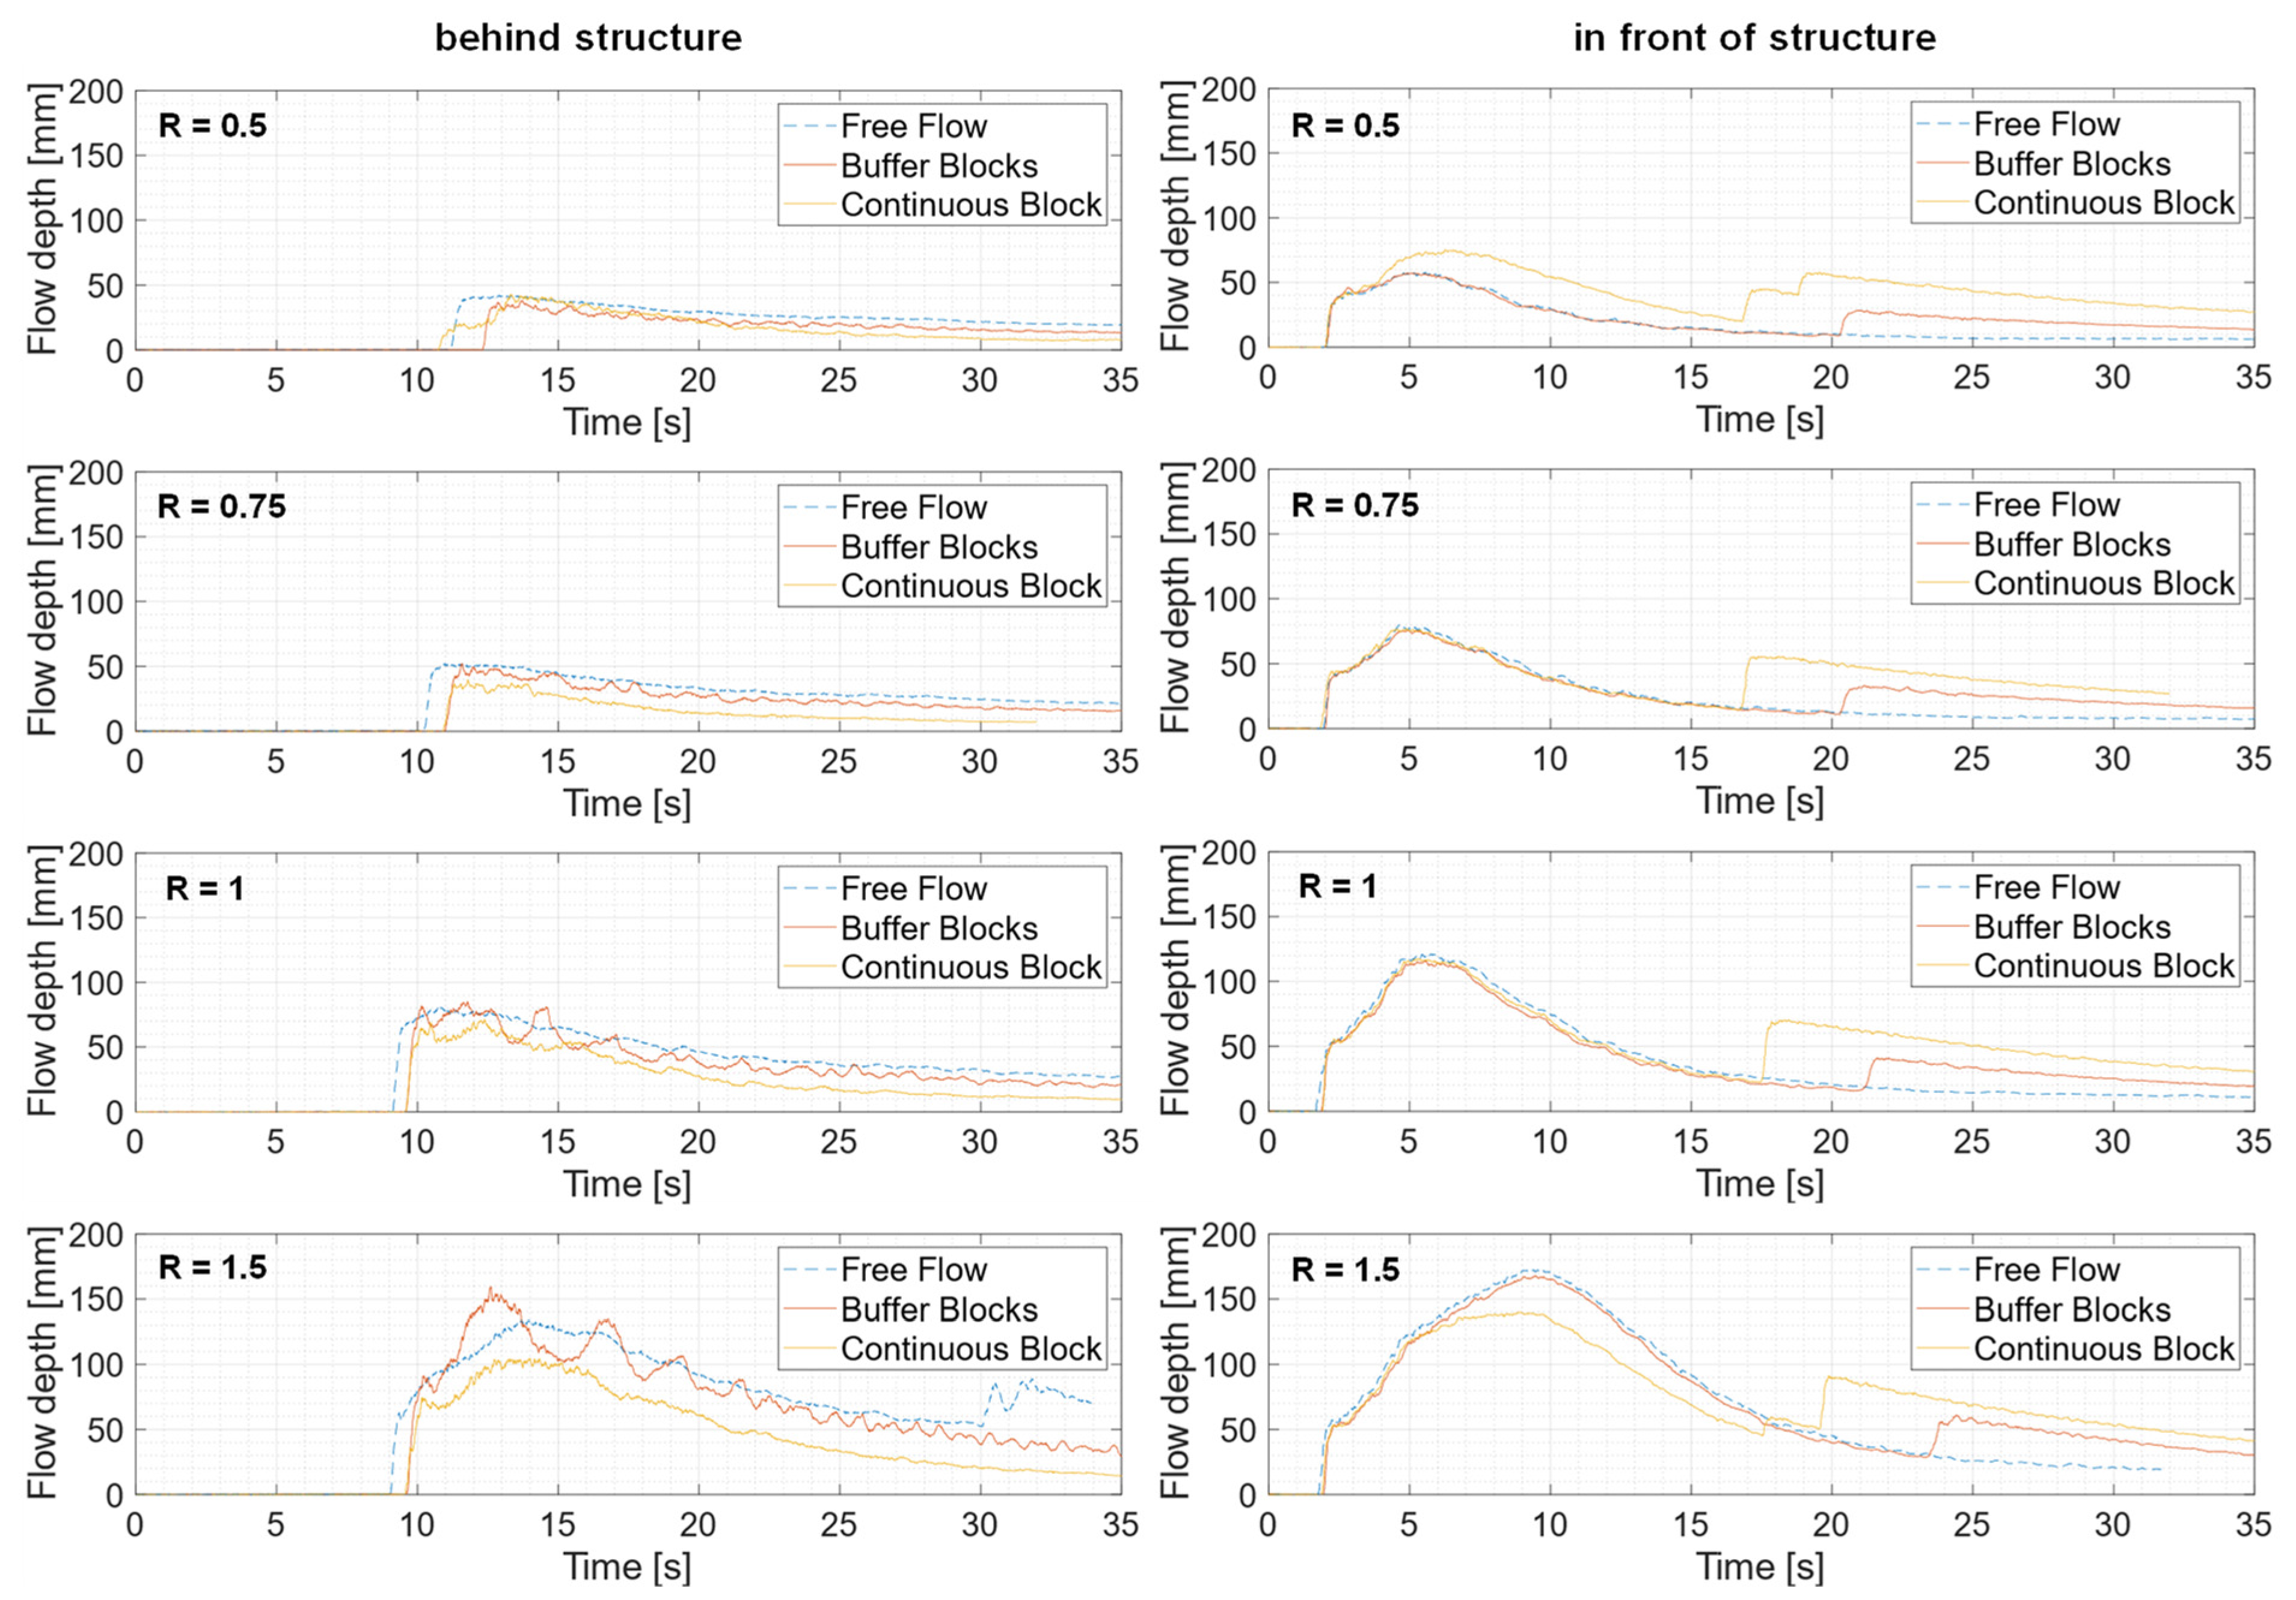
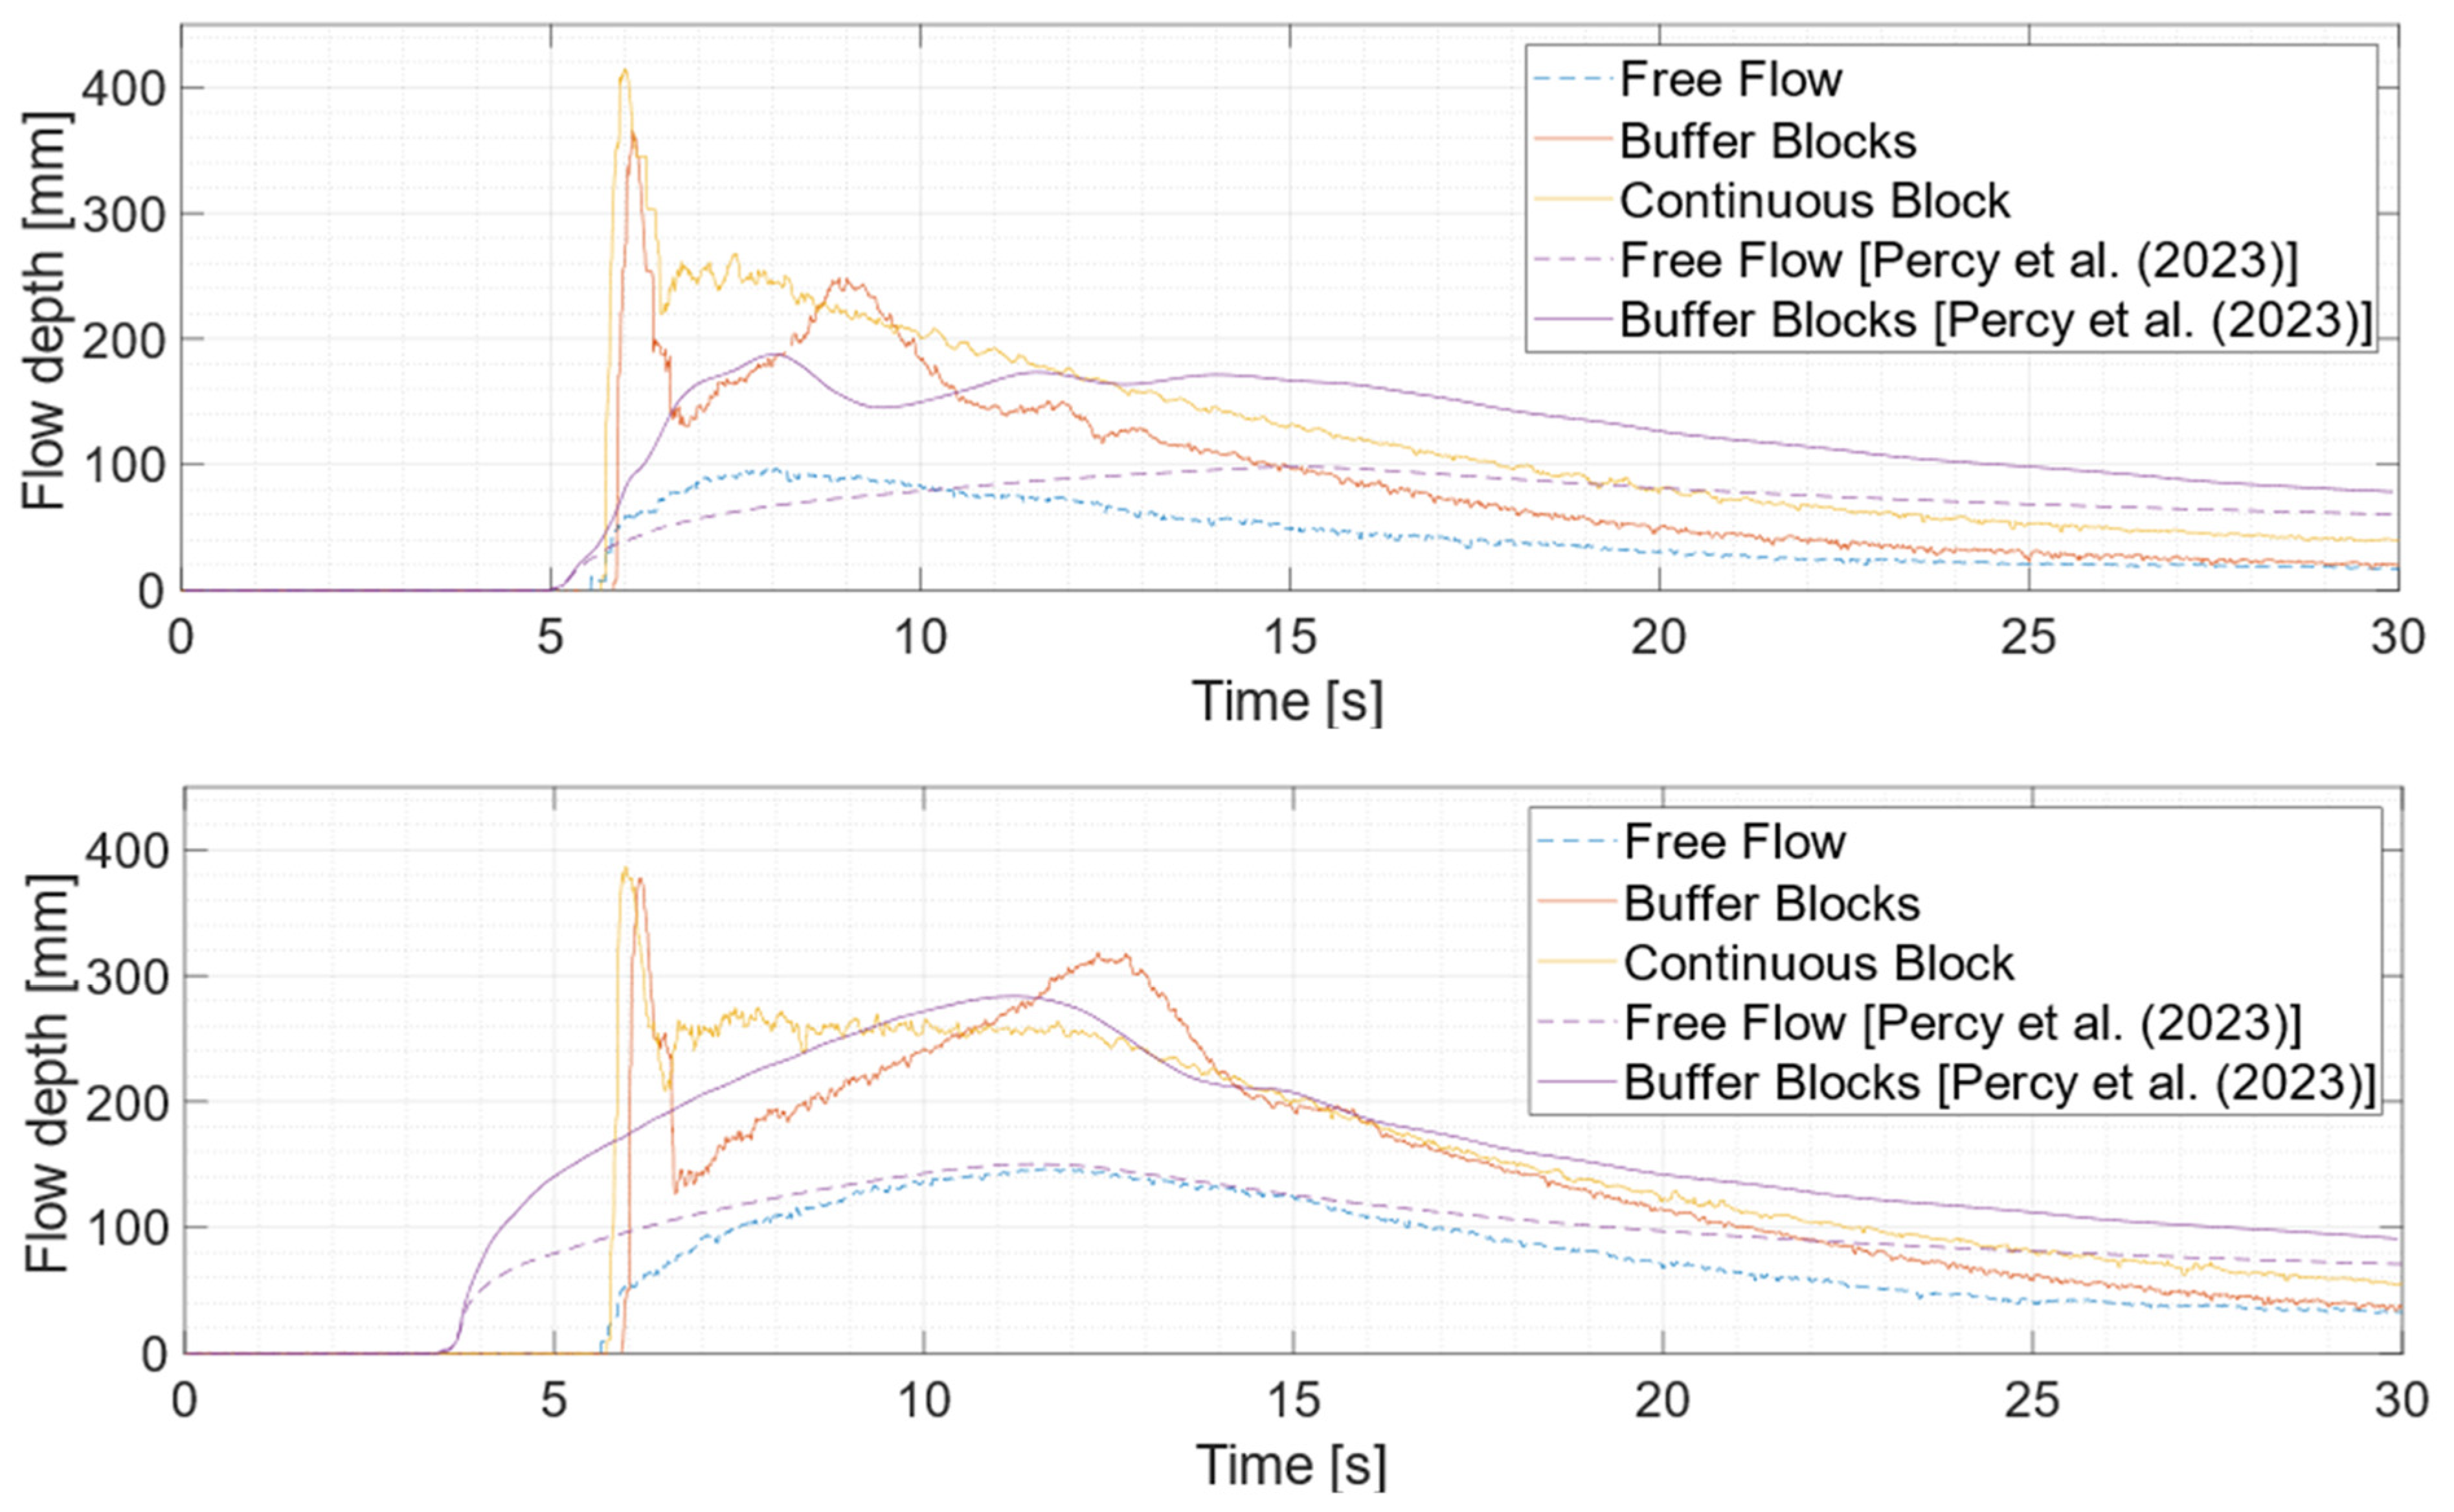
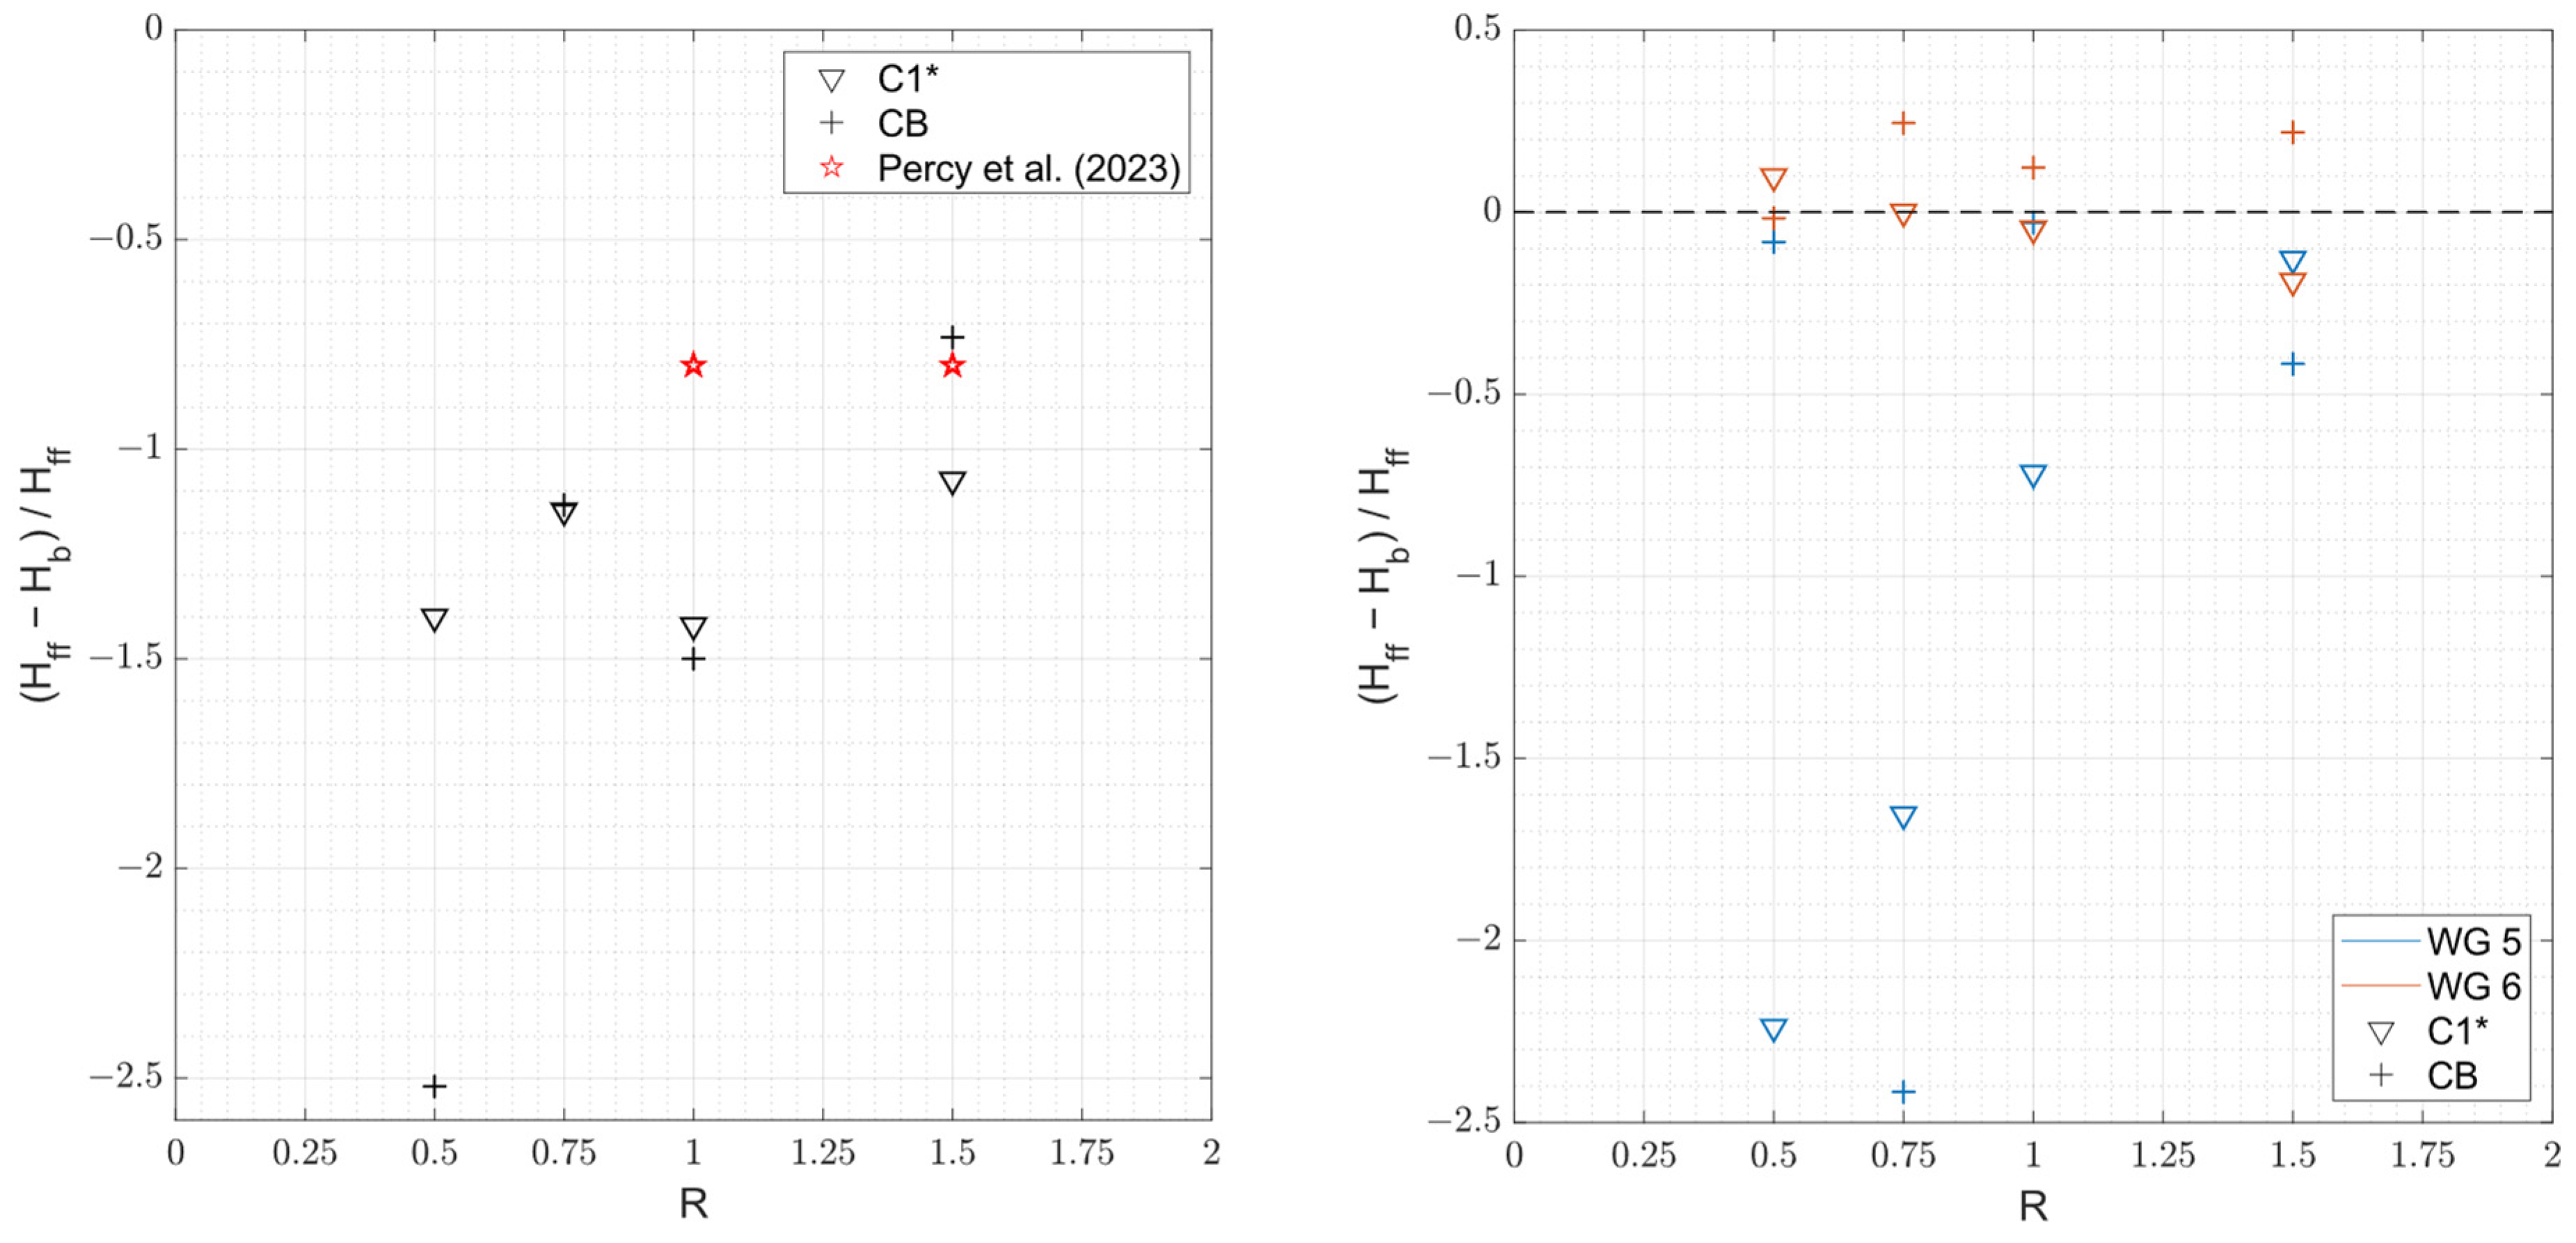
4.2. Additional Experiments with Configuration C1* and CB
5. Conclusions and Future Research
- Buffer blocks effectively delay flow arrival and reduce flow depths for flow depth to block height ratios (R) below 1.5. However, their effectiveness reduces for higher R as the flow overtops the blocks. The flow overtopping, in most cases, resulted in increased flow depth immediately behind the buffer blocks and, hence, behaves negatively.
- Increasing the number of rows enhanced the flow depth reduction behind the buffer blocks and increased the flow depth in the vicinity of the buffer blocks on its upstream side due to the increase in the obstruction.
- Multiple-row configurations with wider spacing achieved the best flow depth reduction behind the buffer blocks, hence necessitating sufficient space between the buffer blocks’ rows. C5 configuration yielded the best results out of the tested configuration when R ≤ 1.5.
- Comparisons with continuous block structures revealed that buffer blocks perform better in flow depth reduction by inducing more turbulence and oscillations. Thus, buffer blocks can be realized as an alternative to the conventional sea walls of low heights.
Author Contributions
Funding
Data Availability Statement
Acknowledgments
Conflicts of Interest
References
- Neumann, B.; Vafeidis, A.T.; Zimmermann, J.; Nicholls, R.J. Future coastal population growth and exposure to sea-level rise and coastal flooding—A global assessment. PLoS ONE 2015, 10, e0118571. [Google Scholar] [CrossRef] [PubMed]
- McGranahan, G.; Balk, D.; Anderson, B. The rising tide: Assessing the risks of climate change and human settlements in low elevation coastal zones. Environ. Urban. 2007, 19, 17–37. [Google Scholar] [CrossRef]
- IPCC. Summary for Policymakers. In IPCC Special Report on the Ocean and Cryosphere in a Changing Climate; Cambridge University Press: Cambridge, UK; New York, NY, USA, 2019. [Google Scholar] [CrossRef]
- Goseberg, N. Reduction of maximum tsunami run-up due to the interaction with beachfront development—Application of single sinusoidal waves. Nat. Hazards Earth Syst. Sci. 2013, 13, 2991–3010. [Google Scholar] [CrossRef]
- Mehvar, S.; Filatova, T.; Dastgheib, A.; van Ruyter Steveninck, E.; Ranasinghe, R. Quantifying Economic Value of Coastal Ecosystem Services: A Review. JMSE 2018, 6, 5. [Google Scholar] [CrossRef]
- UNEP. Marine and Coastal Ecosystems and Human Well-Being: A Synthesis Report Based on the Findings of the Millennium Ecosystems Assessment; UNEP: Cambridge, UK, 2006; Available online: https://www.unep.org/resources/report/marine-and-coastal-ecosystems-and-human-well-being-synthesis-report-based-findings (accessed on 8 May 2024).
- Telford, J.; Cosgrave, J.; Houghton, R. Joint Evaluation of the International Response to the Indian Ocean Tsunami: Synthesis Report; Edita: October City, Egypt, 2006. [Google Scholar]
- Kajitani, Y.; Chang, S.E.; Tatano, H. Economic Impacts of the 2011 Tohoku-Oki Earthquake and Tsunami. Earthq. Spectra. 2013, 29, 457–478. [Google Scholar] [CrossRef]
- Goto, K.; Ishizawa, T.; Ebina, Y.; Imamura, F.; Sato, S.; Udo, K. Ten years after the 2011 Tohoku-oki earthquake and tsunami: Geological and environmental effects and implications for disaster policy changes. Earth Sci. Rev. 2021, 212, 103417. [Google Scholar] [CrossRef]
- Oetjen, J.; Sundar, V.; Venkatachalam, S.; Reicherter, K.; Engel, M.; Schüttrumpf, H.; Sannasiraj, S.A. A comprehensive review on structural tsunami countermeasures. Nat. Hazards 2022, 113, 1419–1449. [Google Scholar] [CrossRef]
- Shuto, N.; Fujima, K. A short history of tsunami research and countermeasures in Japan. Proc. Jpn. Acad. Ser. B 2009, 85, 267–275. [Google Scholar] [CrossRef]
- CEDP. Note on prevention against tsunamis, Sanshu-sha, Tokyo. Council on Earthquake Disaster Prevention, Ministry of Education (in Japanese) 1993, 1–14.
- NOAA (Ed.) Designing for Tsunamis: Seven Principles for Planning and Designing for Tsunami Hazards; National Tsunami Hazard Mitigation Program (NTHMP): Galveston, TX, USA, 2001. [Google Scholar]
- UNESCO; IOC. Reducing and Managing the Risk of Tsunamis: Manuals and Guides; UNESCO: Paris, France, 2011; Volume 57. [Google Scholar]
- Golda Percy, V.P.; Sriram, V.; Sundar, V.; Schüttrumpf, H. Effect of the buffer blocks in attenuating a tsunami-like flow. Ocean Eng. 2023, 286, 115489. [Google Scholar] [CrossRef]
- Kathiresan, K.; Rajendran, N. Coastal mangrove forests mitigated tsunami. Estuar. Coast. Shelf Sci. 2005, 65, 601–606. [Google Scholar] [CrossRef]
- Olwig, M.F.; Sørensen, M.K.; Rasmussen, M.S.; Danielsen, F.; Selvam, V.; Hansen, L.B.; Nyborg, L.; Vestergaard, K.B.; Parish, F.; Karunagaran, V.M. Using remote sensing to assess the protective role of coastal woody vegetation against tsunami waves. Int. J. Remote Sens. 2007, 28, 3153–3169. [Google Scholar] [CrossRef]
- Iverson, L.R.; Prasad, A.M. Modeling tsunami damage in Aceh: A reply. Landsc. Ecol. 2008, 23, 7–10. [Google Scholar] [CrossRef]
- Tanaka, N.; Sasaki, Y.; Mowjood, M.I.M.; Jinadasa, K.B.S.N.; Homchuen, S. Coastal vegetation structures and their functions in tsunami protection: Experience of the recent Indian Ocean tsunami. Landsc. Ecol. Eng. 2007, 3, 33–45. [Google Scholar] [CrossRef]
- Tanaka, S.; Istiyanto, D.C.; Kuribayashi, D. Planning and Design of Tsunami-Mitigative Coastal Vegetation Belts; International Centre for Water Hazard and Risk Management under the Auspices of UNESCO, Public Works Research Institute: Tsukuba, Japan, 2010. [Google Scholar]
- Baird, A.H.; Kerr, A.M. Landscape analysis and tsunami damage in Aceh: Comment on Iverson and Prasad (2007). Landsc. Ecol. 2008, 23, 3–5. [Google Scholar] [CrossRef]
- Yanagisawa, H.; Koshimura, S.; Goto, K.; Miyagi, T.; Imamura, F.; Ruangrassamee, A.; Tanavud, C. The reduction effects of mangrove forest on a tsunami based on field surveys at Pakarang Cape, Thailand and numerical analysis. Estuar. Coast. Shelf Sci. 2009, 81, 27–37. [Google Scholar] [CrossRef]
- Sundar, V.; Murali, K.; Noarayanan, L. Effect of vegetation on run-up and wall pressures due to cnoidal waves. J. Hydraul. Res. 2011, 49, 562–567. [Google Scholar] [CrossRef]
- Noarayanan, L.; Murali, K.; Sundar, V. Role of Vegetation on Beach Run-up due to Regular and Cnoidal Waves. J. Coast. Res. 2012, 278, 123–130. [Google Scholar] [CrossRef]
- Noarayanan, L.; Murali, K.; Sundar, V. Manning’s ‘n’ for staggered flexible emergent vegetation. J. Earthq. Tsunami 2013, 7, 1250029. [Google Scholar] [CrossRef]
- Strusińska-Correia, A.; Husrin, S.; Oumeraci, H. Tsunami damping by mangrove forest: A laboratory study using parameterized trees. Nat. Hazards Earth Syst. Sci. 2013, 13, 483–503. [Google Scholar] [CrossRef]
- Nateghi, R.; Bricker, J.D.; Guikema, S.D.; Bessho, A. Statistical Analysis of the Effectiveness of Seawalls and Coastal Forests in Mitigating Tsunami Impacts in Iwate and Miyagi Prefectures. PLoS ONE 2016, 11, e0158375. [Google Scholar] [CrossRef]
- EurOtop. Manual on Wave Overtopping of Sea Defences and Related Structures. An Overtopping Manual Largely Based on European Research, But for Worldwide Application. Available online: www.overtopping-manual.com (accessed on 7 April 2023).
- Oumeraci, H. Nonconventional Wave Damping Structures. In Handbook of Coastal and Ocean Engineering; World Scientific: Singapore, 2009; pp. 287–315. ISBN 978-981-281-929-1. [Google Scholar]
- Goseberg, N. The Run-Up of Long Waves: Laboratory-Scaled Geophysical Reproduction and Onshore Interaction with Macro-roughness Elements: Mitteilungen Heft 97. Ph.D. Thesis, Leibniz Universität Hannover, Hannover, Germany, 2011. [Google Scholar]
- Rahman, S.; Akib, S.; Khan, M.T.R.; Shirazi, S.M. Experimental study on tsunami risk reduction on coastal building fronted by sea wall. Sci. World J. 2014, 2014, 729357. [Google Scholar] [CrossRef] [PubMed]
- Thomas, S.; Killian, J.; Bridges, K. Influence of Macroroughness on Tsunami Loading of Coastal Structures. J. Waterw. Port Coast. Ocean Eng. 2015, 141, 04014028. [Google Scholar] [CrossRef]
- Capel, A. Wave run-up and overtopping reduction by block revetments with enhanced roughness. Coast. Eng. 2015, 104, 76–92. [Google Scholar] [CrossRef]
- Moon, W.C.; Chiew, L.Q.; Cheong, K.W.; Tee, Y.C.; Chun, J.B.; Lau, T.L. An experimental study for estimating tsunami wave forces acting on building with seaward and landward macroroughness. Ocean Eng. 2019, 186, 106116. [Google Scholar] [CrossRef]
- Ishii, H.; Takabatake, T.; Esteban, M.; Stolle, J.; Shibayama, T. Experimental and numerical investigation on tsunami run-up flow around coastal buildings. Coast. Eng. 2021, 63, 485–503. [Google Scholar] [CrossRef]
- Giridhar, G.; Muni Reddy, M.G. Hydrodynamic Study of Energy Dissipation Blocks on Reduction of Wave Run-up and Wave Reflection. Aquat. Procedia 2015, 4, 281–286. [Google Scholar] [CrossRef]
- Ono, S.; Hiraishi, T. Tsunami Force Reduction due to Obstacle in Front of Coastal Dike and Evaluation of Collision Force by Driftage. JEPE 2017, 11, 300–310. [Google Scholar] [CrossRef]
- Oetjen, J.; Engel, M.; Pudasaini, S.P.; Schuettrumpf, H. Significance of boulder shape, shoreline configuration and pre-transport setting for the transport of boulders by tsunamis. Earth Surf. Process. Landf. 2020, 45, 2118–2133. [Google Scholar] [CrossRef]
- Harish, S.; Sriram, V.; Schüttrumpf, H.; Sannasiraj, S.A. Tsunami-like flow induced force on the structure: Prediction formulae for the horizontal force in quasi-steady flow phase. Coast. Eng. 2021, 168, 103938. [Google Scholar] [CrossRef]
- Harish, S.; Sriram, V.; Schüttrumpf, H.; Sannasiraj, S.A. Flow-structure interference effects with the surrounding structure in the choked quasi-steady condition of tsunami: Comparison with traditional obstruction approach. Appl. Ocean Res. 2022, 126, 103255. [Google Scholar] [CrossRef]
- Harish, S.; Sriram, V.; Schüttrumpf, H.; Sannasiraj, S.A. Tsunami-like flow induced forces on the structure: Dependence of the hydrodynamic force coefficients on Froude number and flow channel width in quasi-steady flow phase. Coast. Eng. 2022, 172, 104078. [Google Scholar] [CrossRef]
- Harish, S.; Sriram, V.; Schüttrumpf, H.; Sannasiraj, S.A. Tsunami-like flow induced forces on the building with openings and orientation in the quasi-steady flow phase. Ocean Eng. 2024, 301, 117337. [Google Scholar] [CrossRef]


| Strategy | Targeted Tsunami Level | Financial Effort | Area of Application | Shortcomings |
|---|---|---|---|---|
| Blocking | Level 1 * | Very high | Developed area | Increased hazard by failure of structure, wave overtopping, wave reflection, wave amplifications, or redirection of wave energy into unintended directions Intervention into water ecology Disconnection of settlements from sea (fisheries, tourism, etc.) False sense of security |
| Steering | Level 1 | Not developed area | Increased hazard for subsequent buildings Increased flood velocities due to neighboring steering structures | |
| Slowing | Level 1 | Reasonable | Developed area | Insufficient knowledge No design guidelines exist |
| Avoiding | Level 1 | High | Not developed area/in development | Subsequent enforcement of coastal areas impossible |
| Retreating | Level 1, Level 2 | Not developed area/recently affected areas | Enormous intervention for local communities |
| Study | Type of Buffer Blocks | Characteristics Varied in Buffer Block Configurations | Wave Generation | Scale | Bed Type and Condition |
|---|---|---|---|---|---|
| Goseberg [4,30] | Cubic elements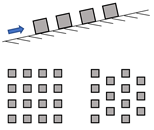 | Arrangement (staggered/aligned) Orientation (perpendicular/45° oblique) Obstruction ratio (cross-shore/long-shore) | Single sinusoidal waves (pump system) | Not specified | Sloped (1:40), Dry |
| Giridhar and Reddy [36] | Rectangular/semi-circular/trapezoidal elements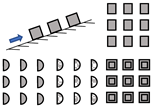 | Distance between blocks Porosity | Monochromatic waves (wave paddle) | Not specified | Sloped (1:35), Dry |
| Rahman et al. [31] | Continuous and perforated elements | Height Position Permeability (26% perforated/solid) | Tsunami-like waves (dam-break setup) | 1:35 | Flat, Dry |
| Thomas et al. [32] | Cubic elements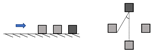 | Wake clearance angle | Long-period waves (wavemaker) | 1:25 | Flat, Dry |
| Ono and Hiraishi [37] | Continuous elements | Height Material (wood/artificial raisin) | Solitary waves (piston-type wavemaker) | 1:40 | Flat, Dry |
| Moon et al. [34] | Cuboid elements | Arrangement (staggered/aligned) Presence of seaward/landward roughness | Solitary waves (dam-break setup) | 1:100 | Flat, Dry |
| Ishii et al. [35] | Cuboid elements | Blockage ratio (single/parallel/perpendicular) | Tsunami-like waves (pump-driven dam- break setup) | 1:80 | Flat, Dry |
| Percy et al. [15] | Cuboid elements | Number of rows Distance between rows | Hydraulic bores (dam-break setup) | 1:8 | Flat, Dry |
| Present study | Cuboid elements | Number of rows Distance between rows | Hydraulic bores (pump system) | 1:16 | Flat, Dry |
| Free-Flow Depth at Buffer Block Position H [cm] | Free-Flow Depth to Block Height Ratio R [−] | |
|---|---|---|
| For Setups C1 to C5 (1:16 Scale) | For Setups C1* and CB (1:8 Scale) | |
| 5 | 1 | 0.5 |
| 7.5 | 1.5 | 0.75 |
| 10 | 2 | 1 |
| 15 | 3 | 1.5 |
Disclaimer/Publisher’s Note: The statements, opinions and data contained in all publications are solely those of the individual author(s) and contributor(s) and not of MDPI and/or the editor(s). MDPI and/or the editor(s) disclaim responsibility for any injury to people or property resulting from any ideas, methods, instructions or products referred to in the content. |
© 2024 by the authors. Licensee MDPI, Basel, Switzerland. This article is an open access article distributed under the terms and conditions of the Creative Commons Attribution (CC BY) license (https://creativecommons.org/licenses/by/4.0/).
Share and Cite
Nageswaran, P.; Oetjen, J.; Harish, S.; Sriram, V.; Sundar, V.; Schüttrumpf, H. Buffer Blocks as Wave Energy Dissipators: Flow Depth Reduction. J. Mar. Sci. Eng. 2024, 12, 1145. https://doi.org/10.3390/jmse12071145
Nageswaran P, Oetjen J, Harish S, Sriram V, Sundar V, Schüttrumpf H. Buffer Blocks as Wave Energy Dissipators: Flow Depth Reduction. Journal of Marine Science and Engineering. 2024; 12(7):1145. https://doi.org/10.3390/jmse12071145
Chicago/Turabian StyleNageswaran, Praba, Jan Oetjen, S. Harish, V. Sriram, V. Sundar, and Holger Schüttrumpf. 2024. "Buffer Blocks as Wave Energy Dissipators: Flow Depth Reduction" Journal of Marine Science and Engineering 12, no. 7: 1145. https://doi.org/10.3390/jmse12071145