
Seasonal Variability of Hydrological Parameters and Estimation of Circulation Patterns: Application to a Mediterranean Coastal Lagoon
Abstract
:1. Introduction
2. Methods
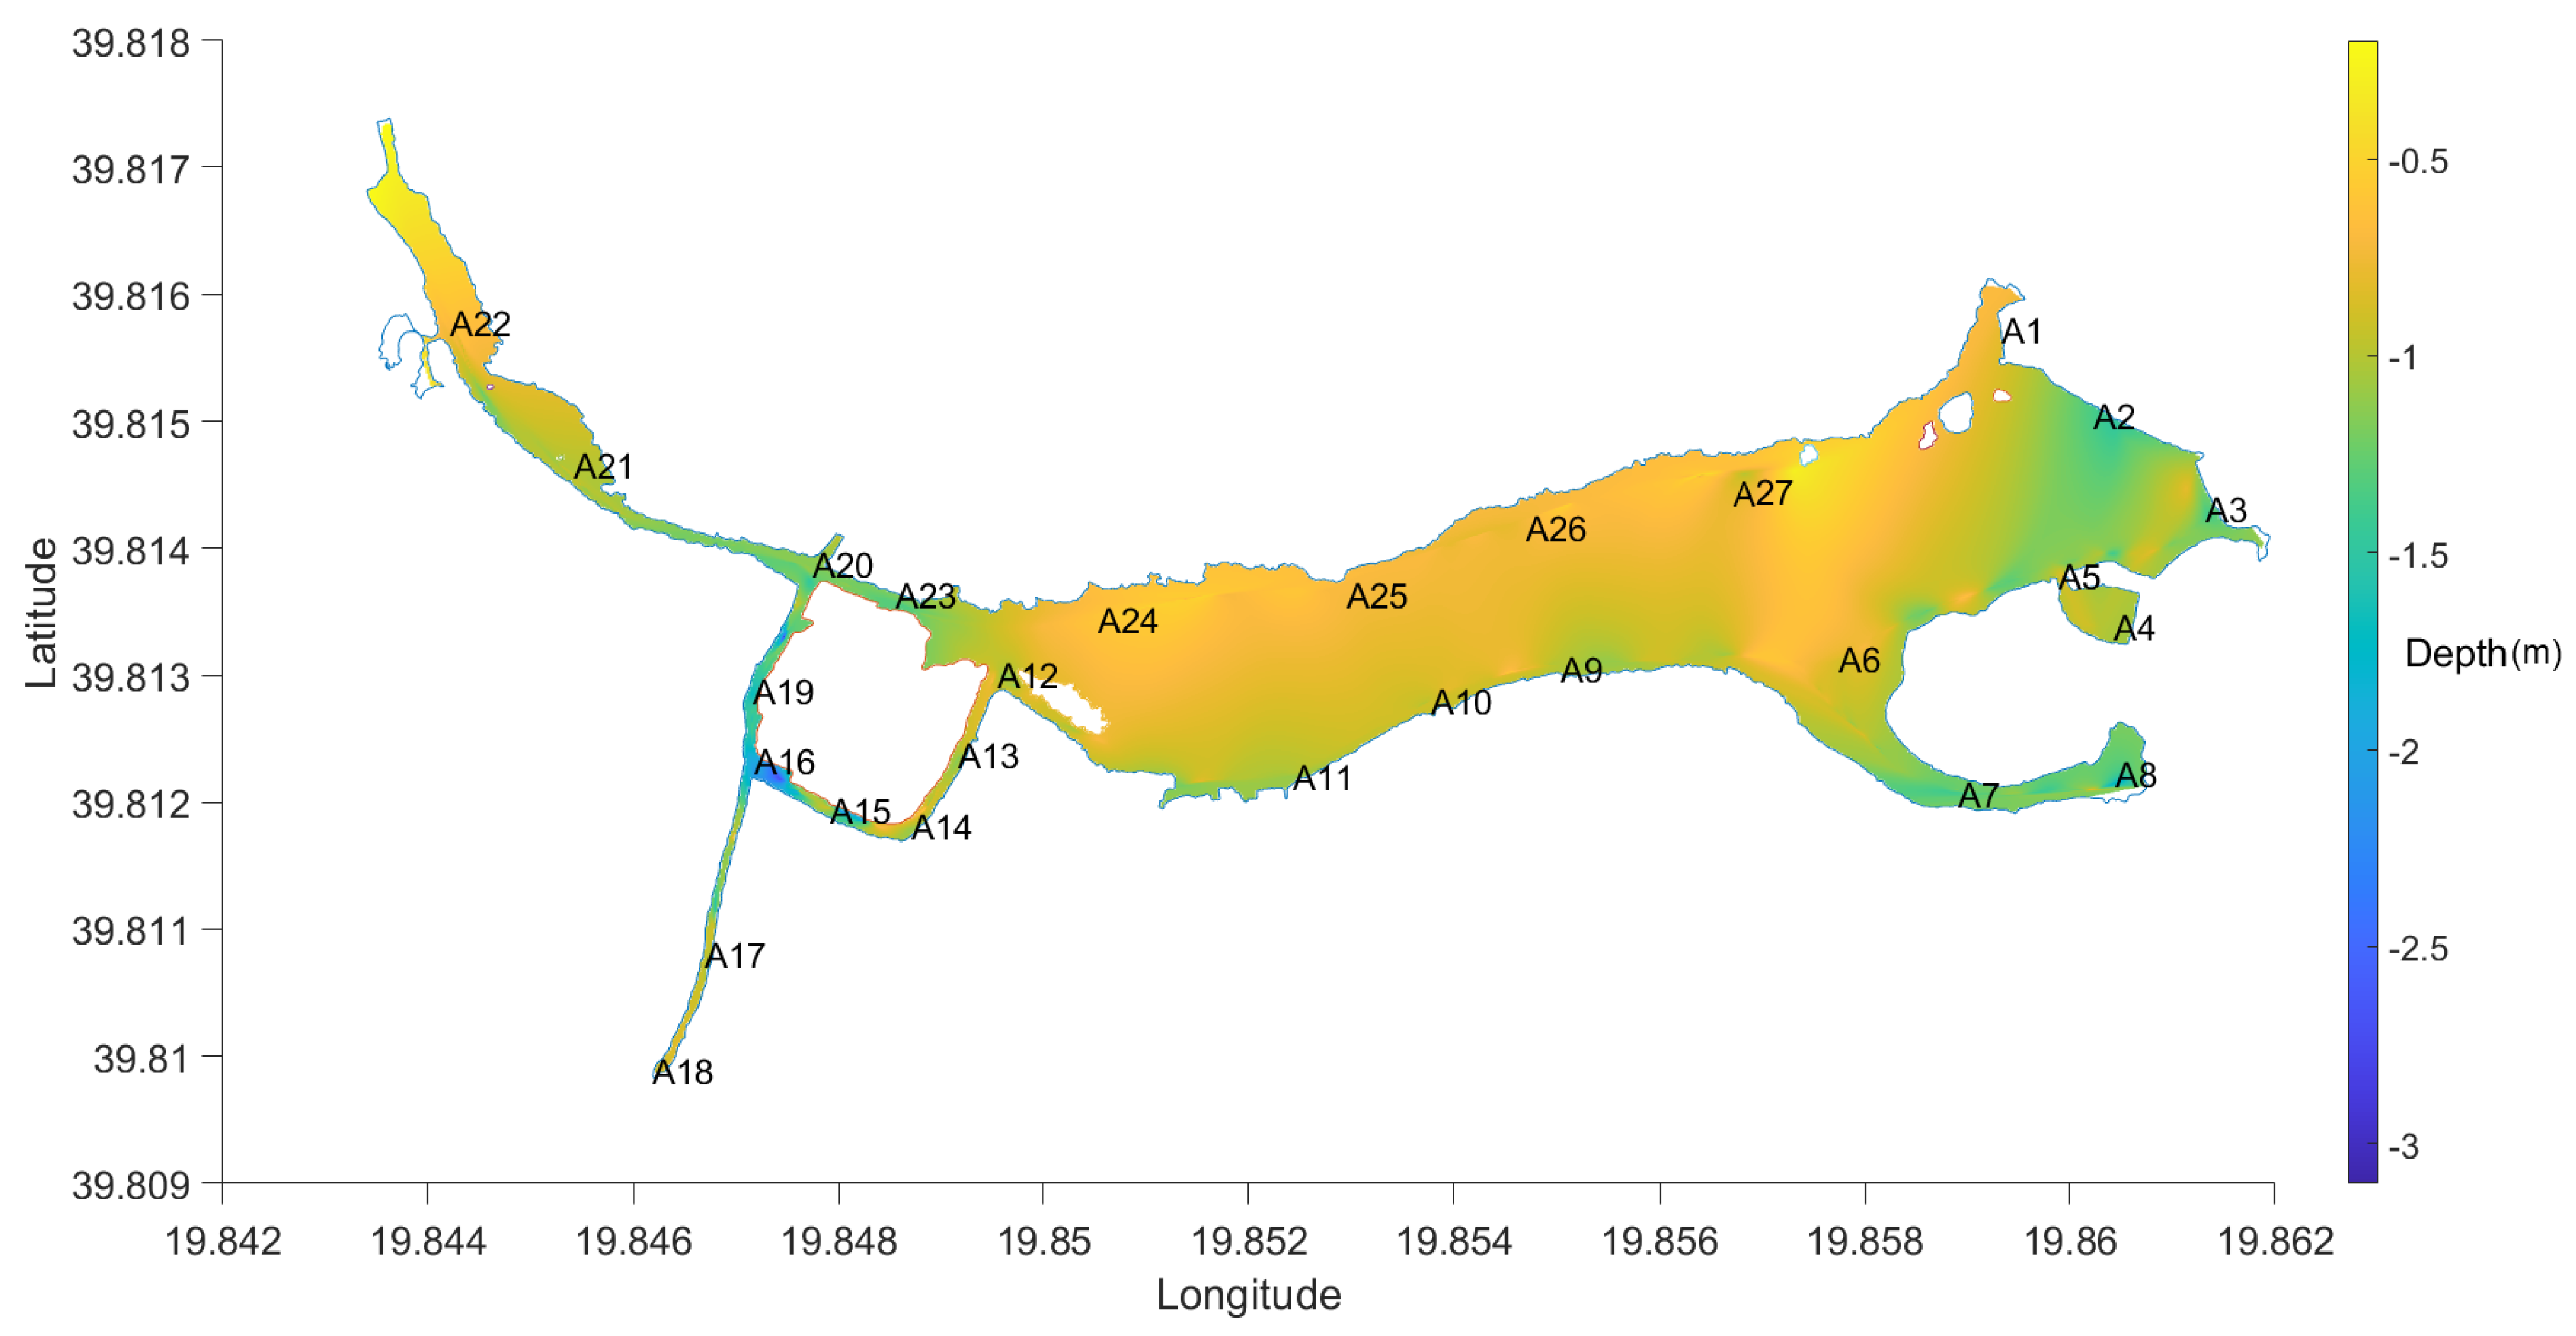
2.1. Study Site
2.2. Bathymetry
2.3. Sampling
2.4. Heat and Salt Content
3. Results
3.1. Meteorological Data
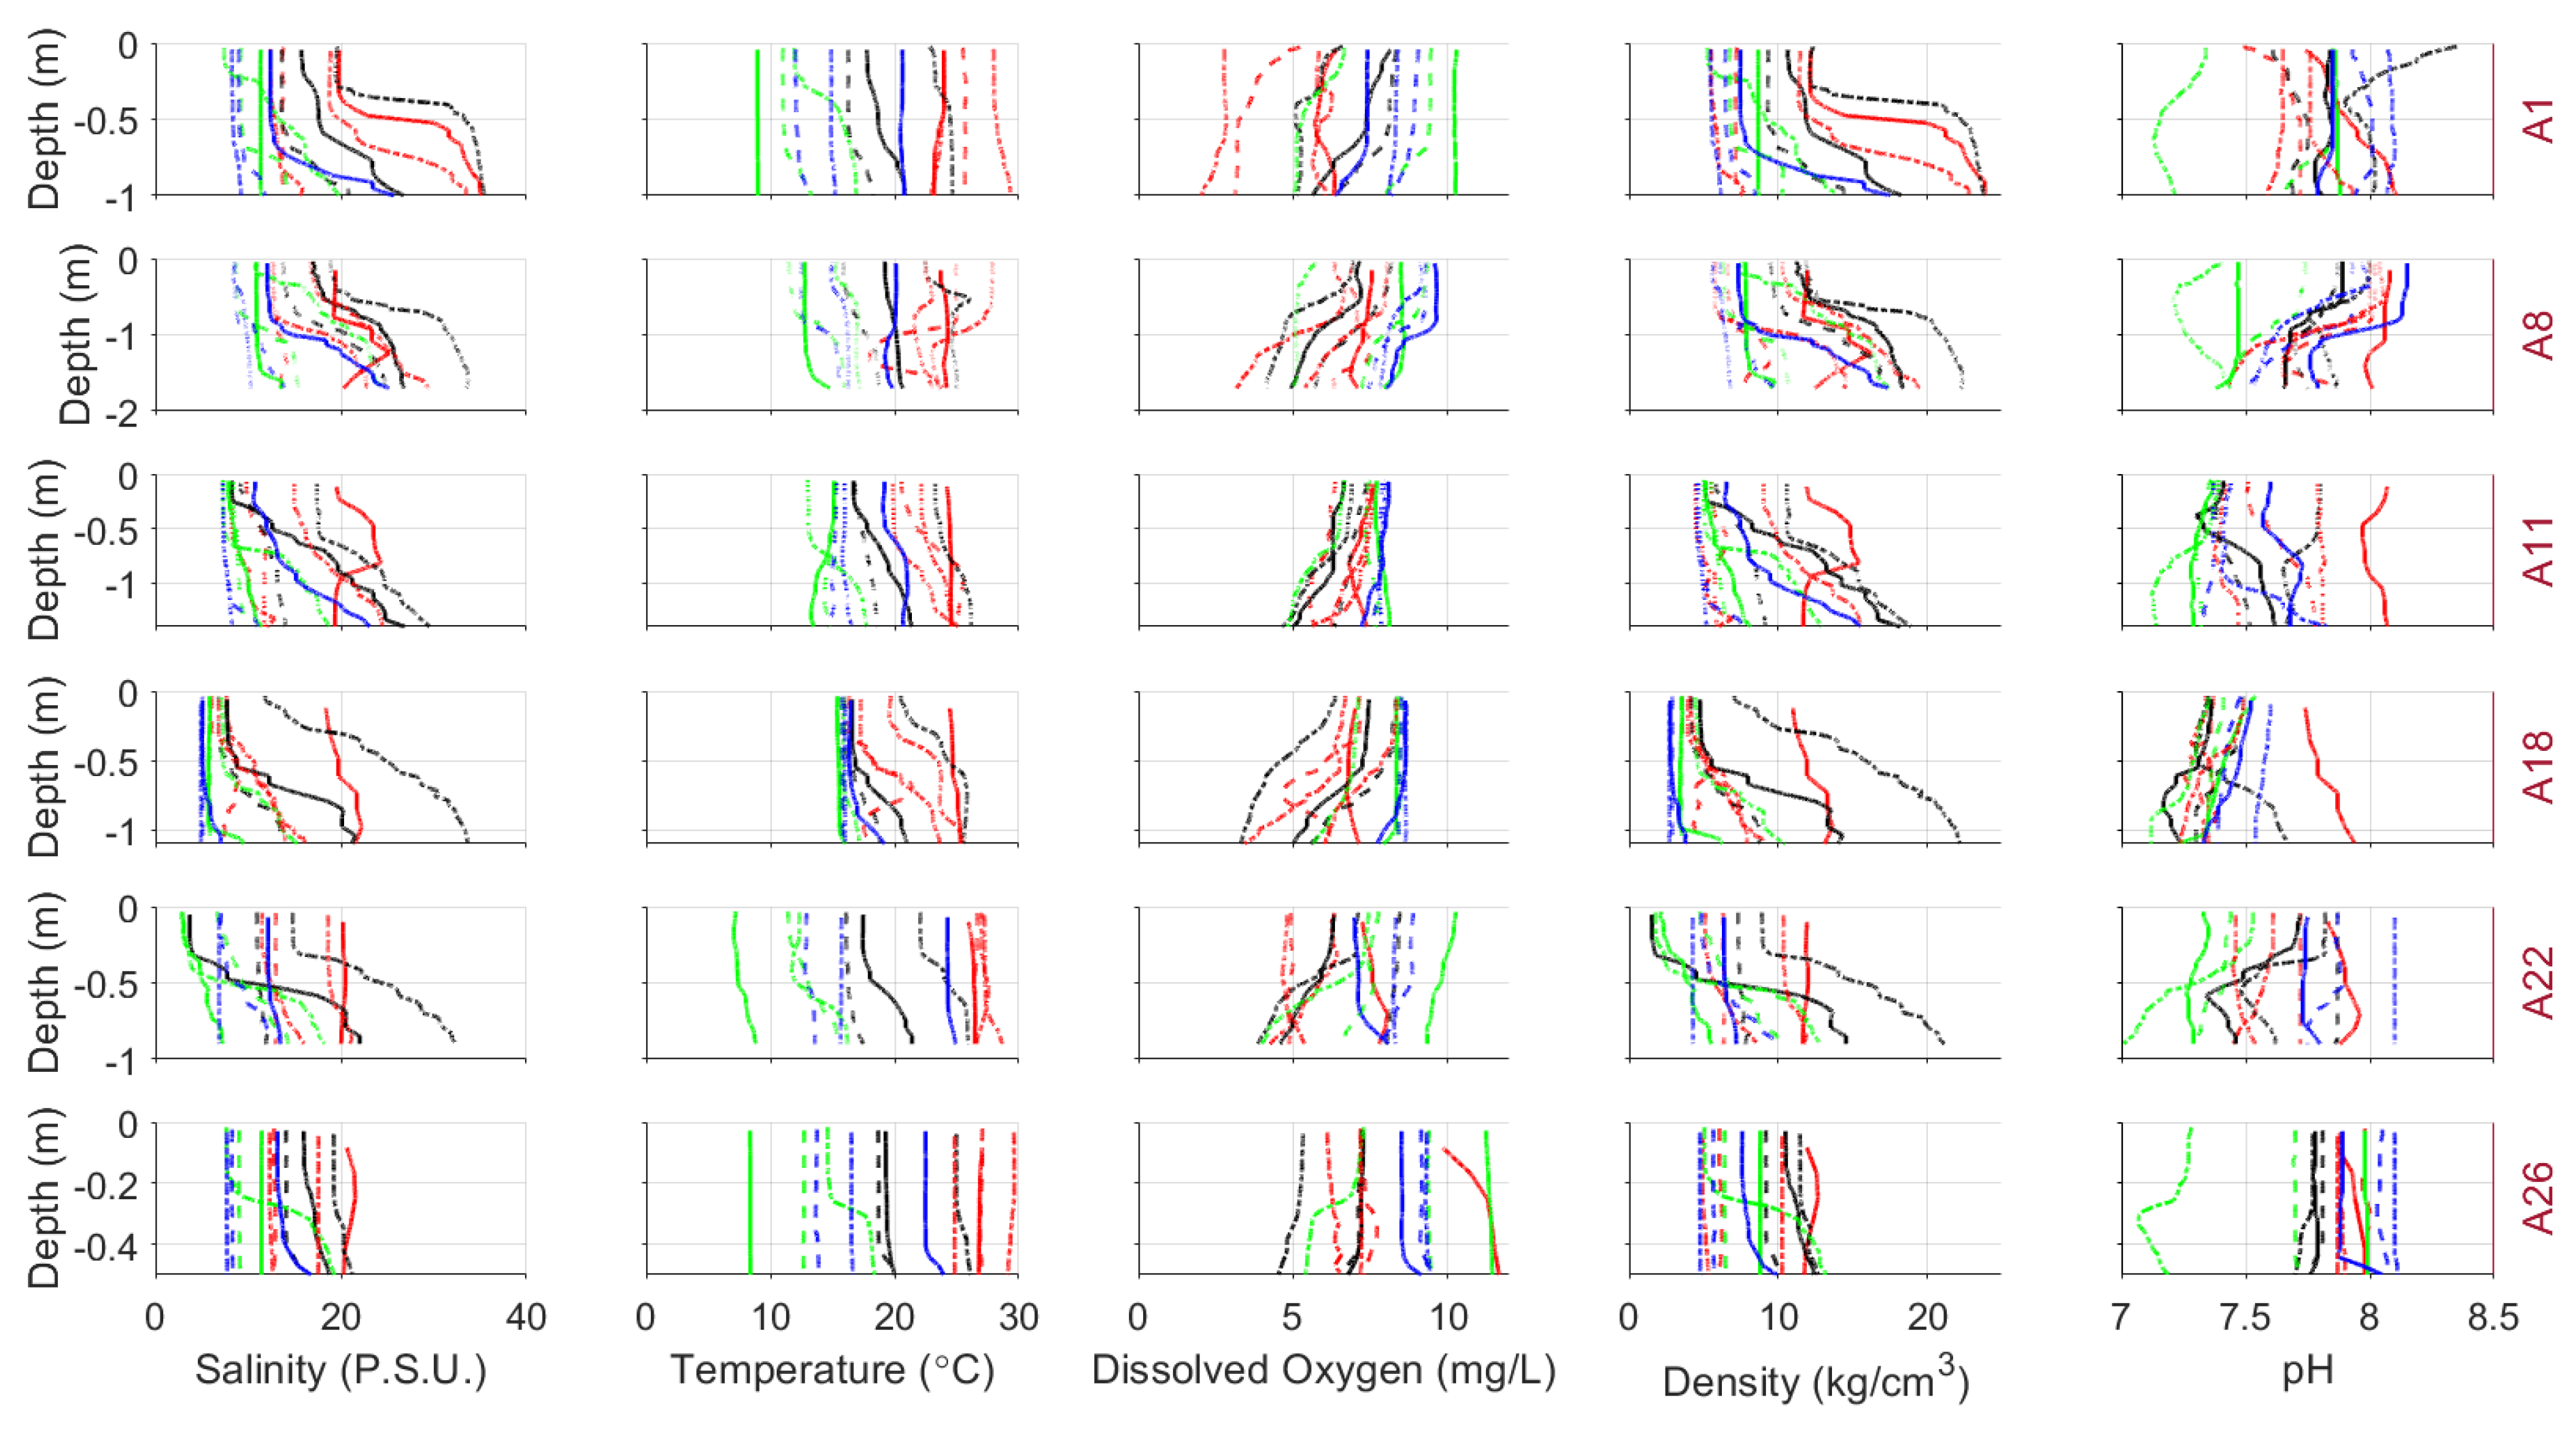
3.2. Profiles
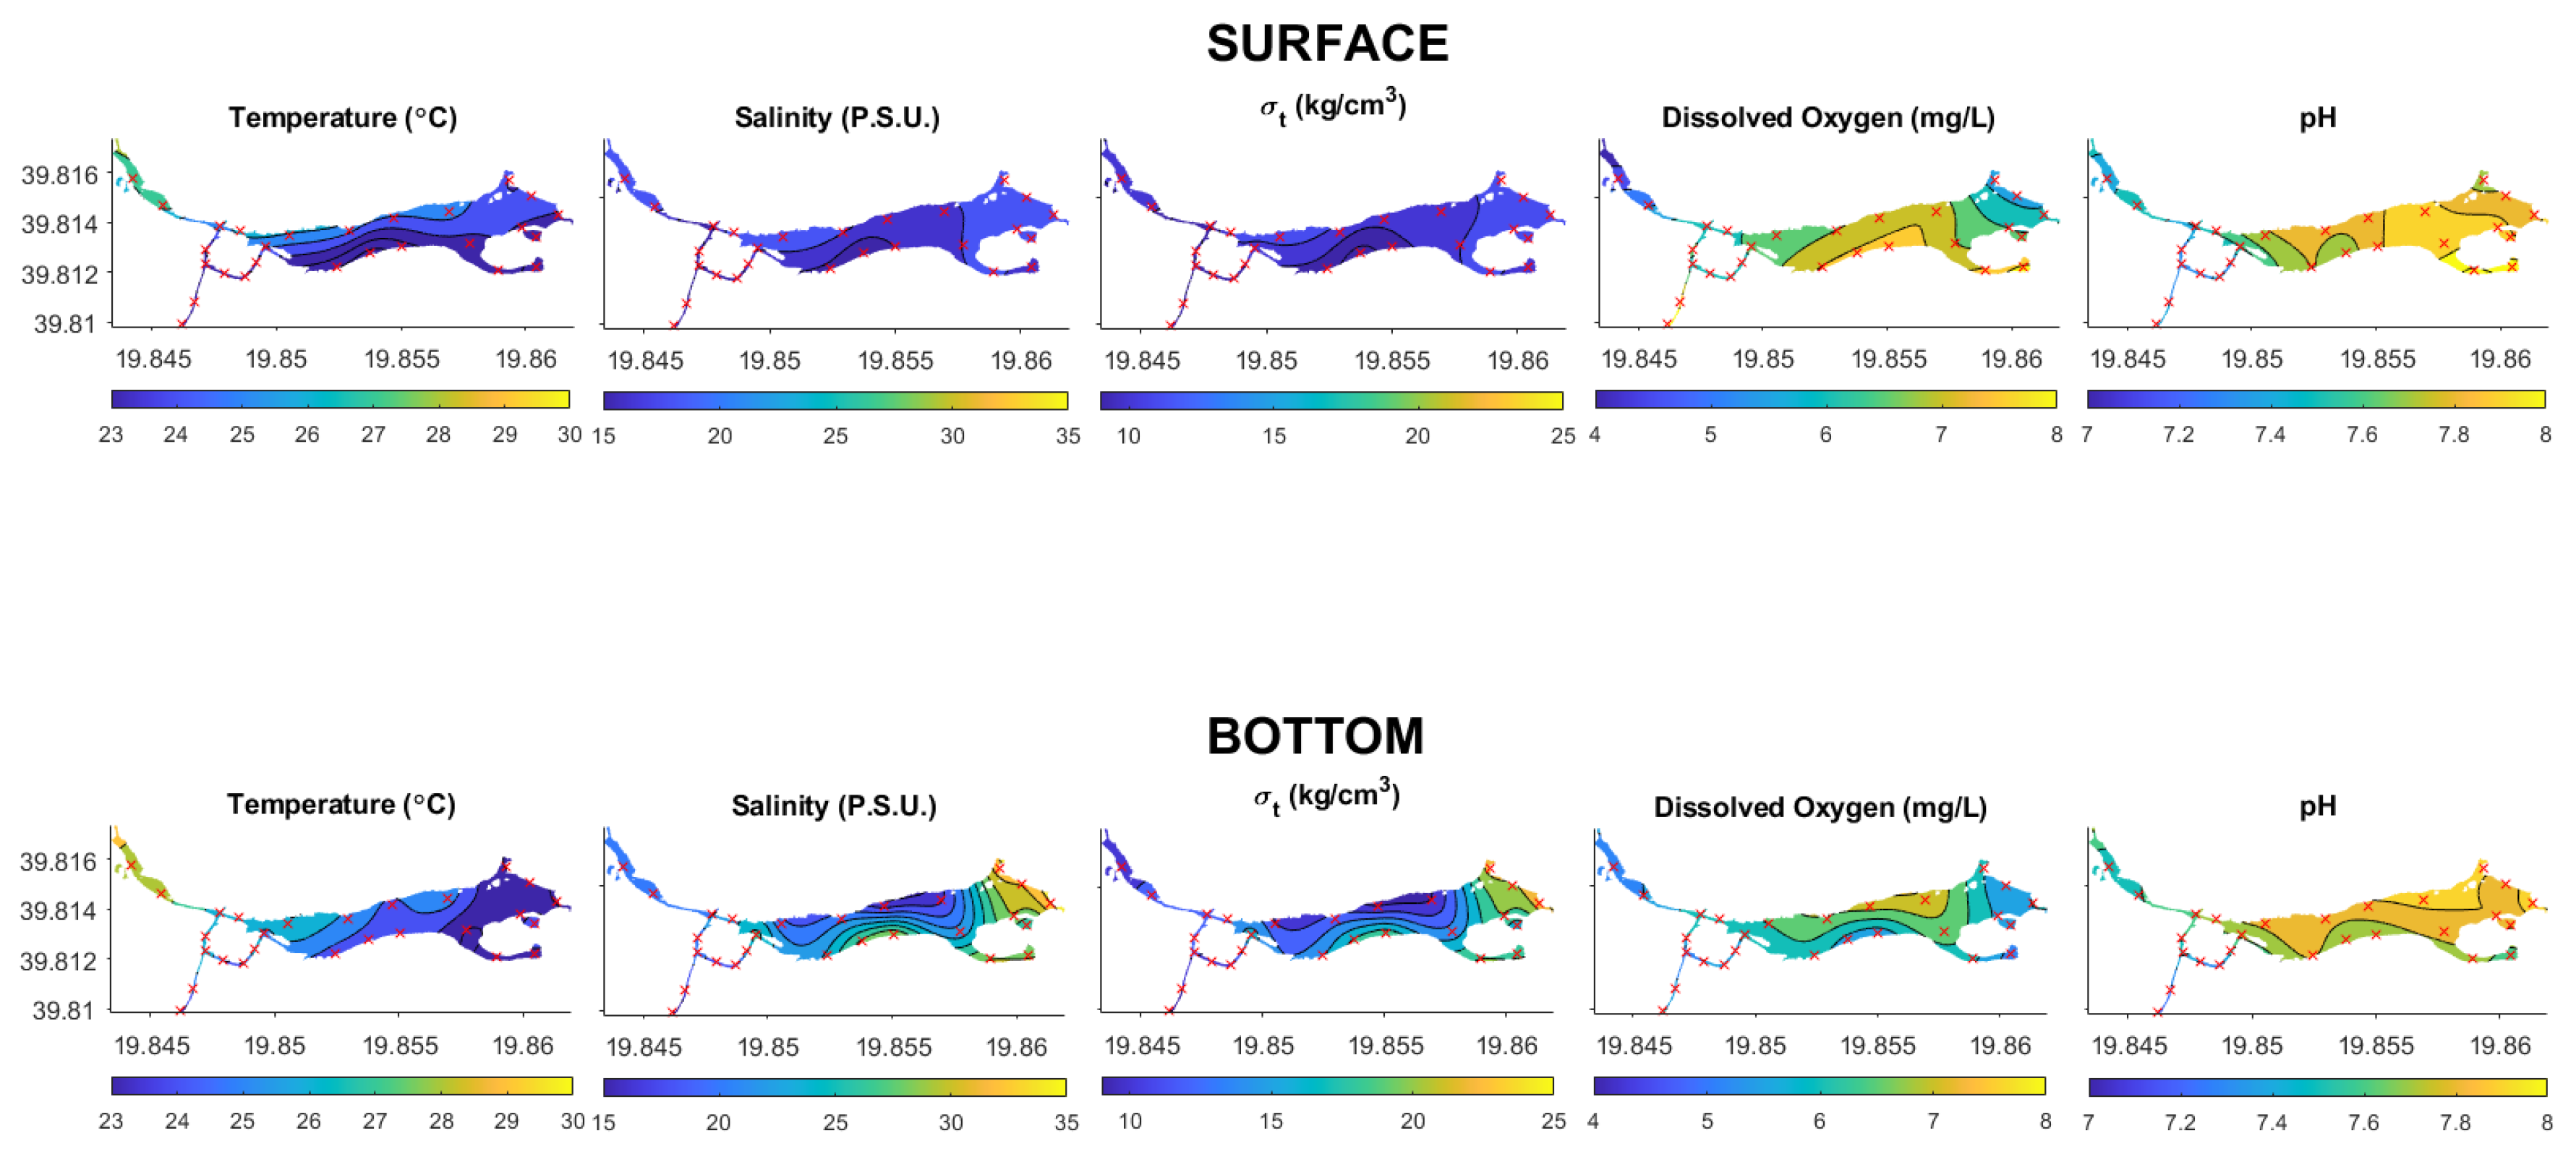
3.3. Spatial Interpolation
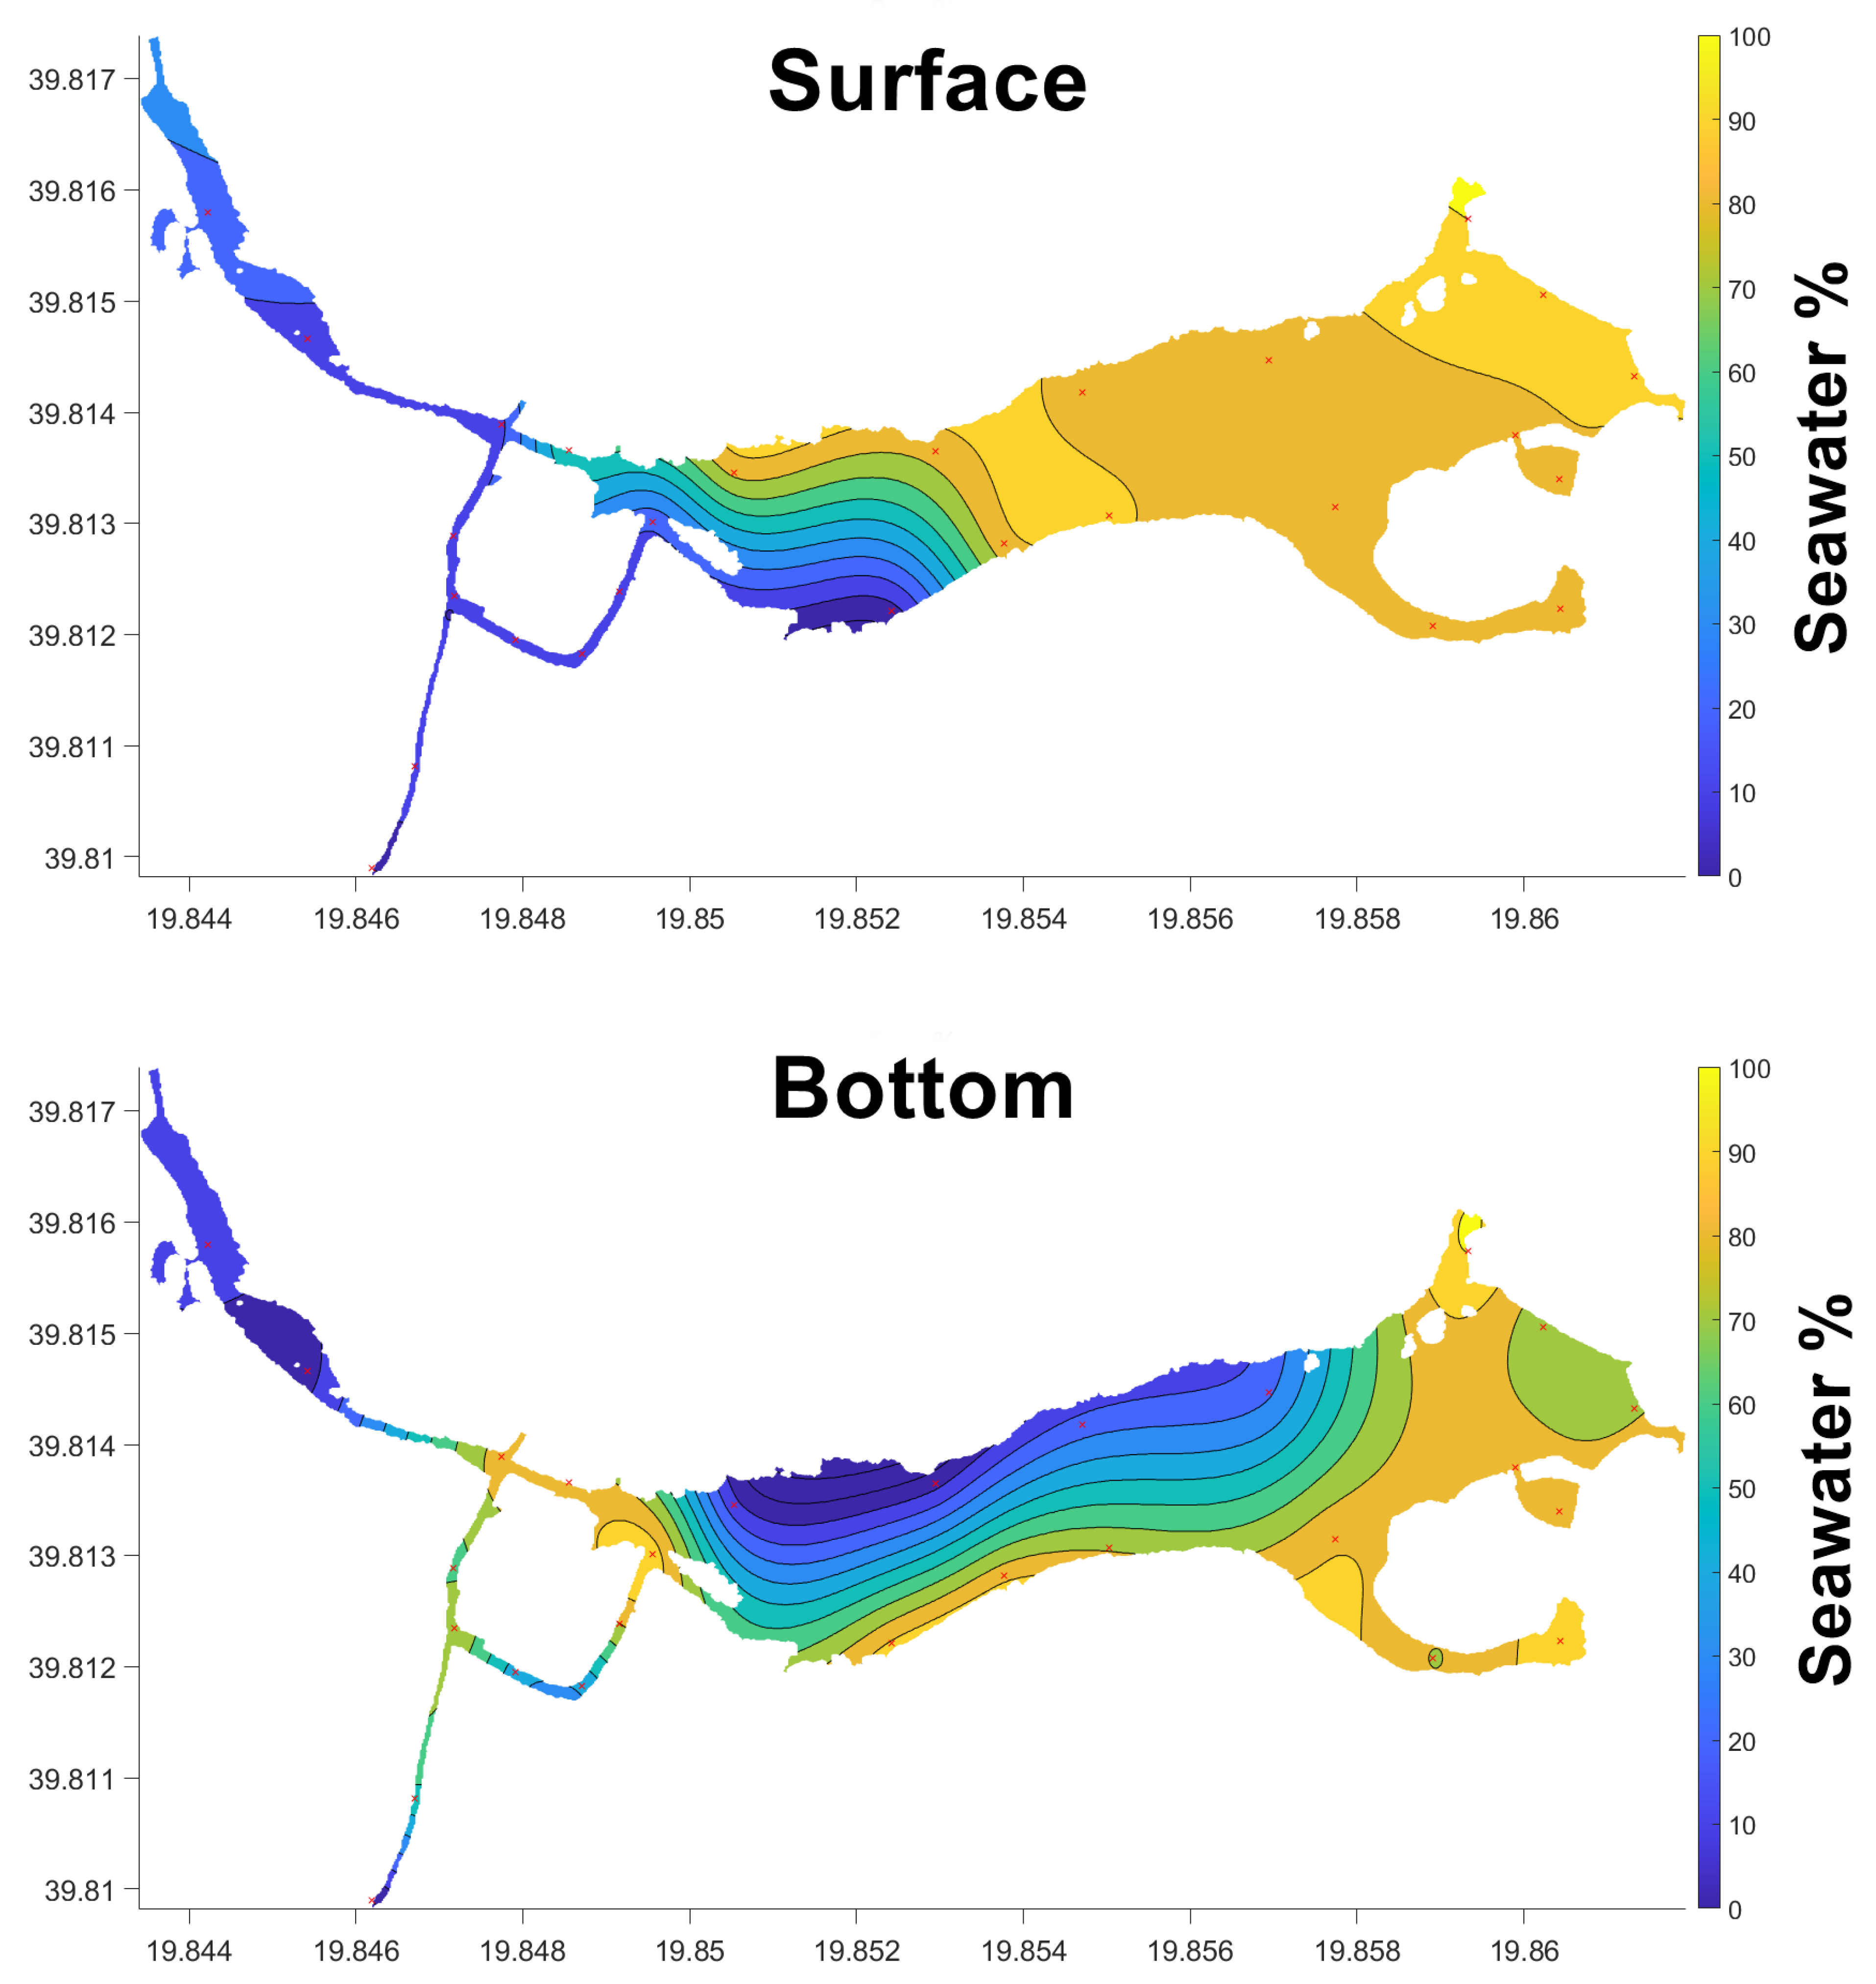
3.4. November 2020
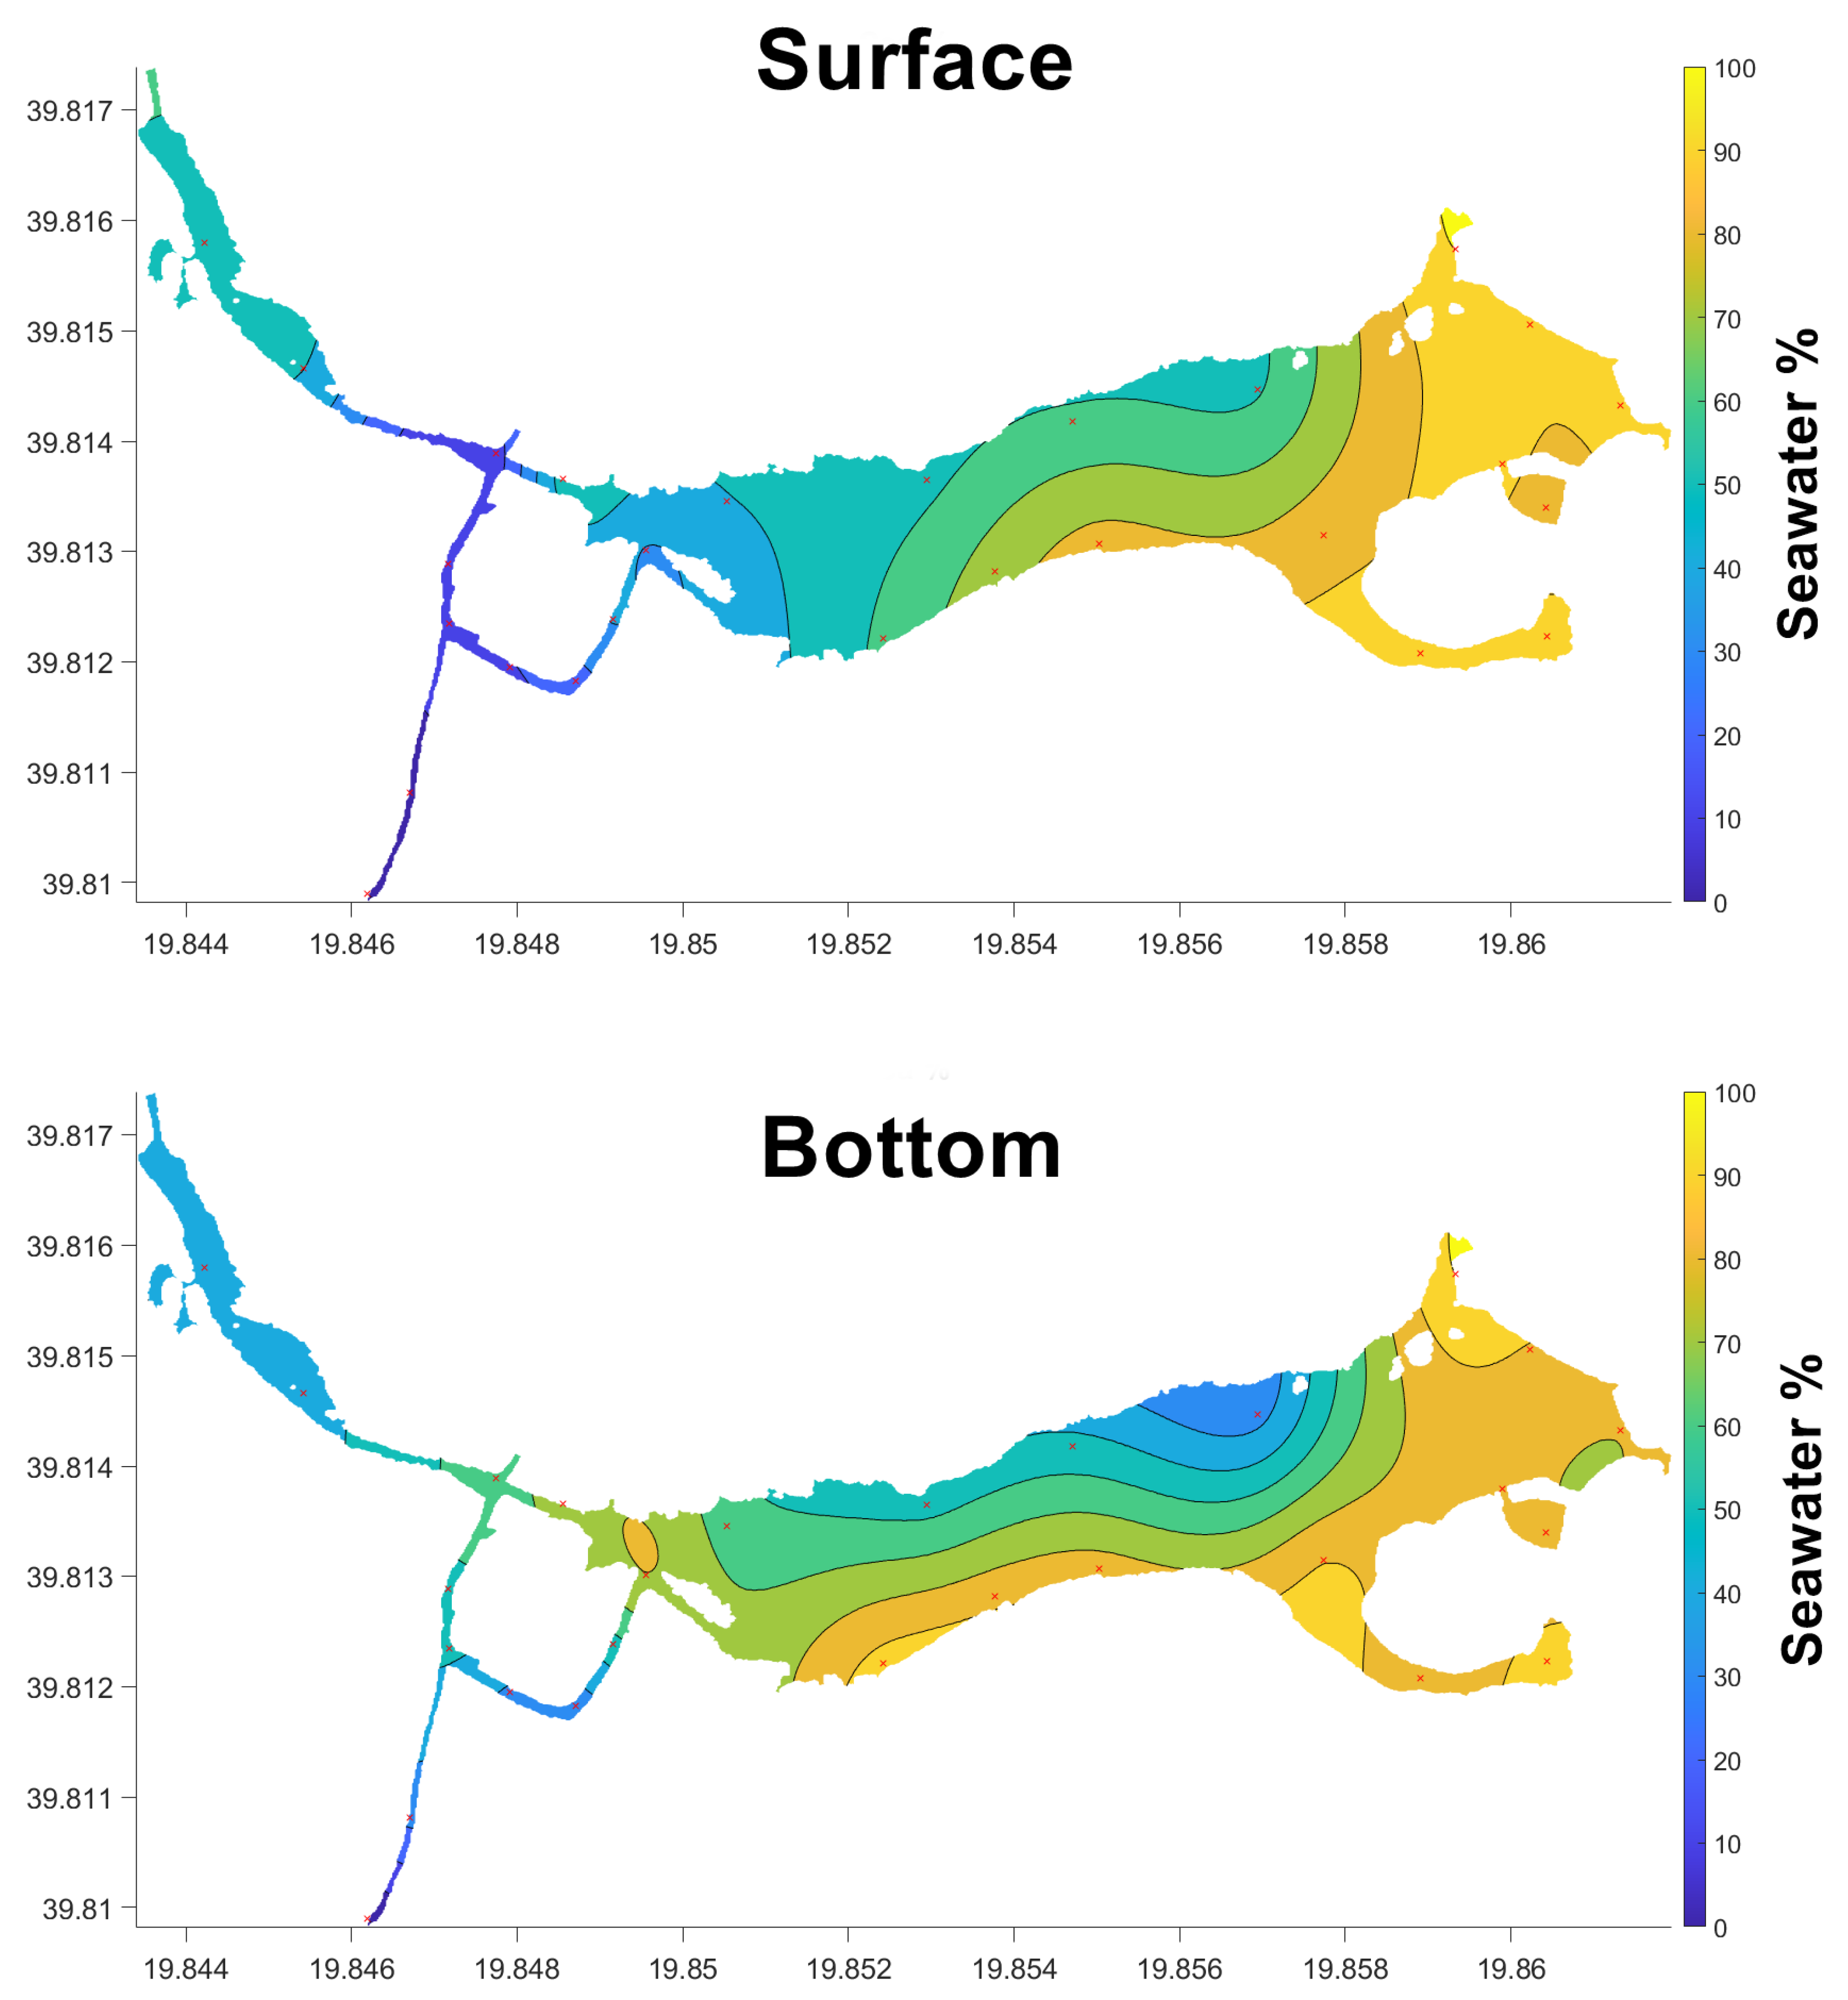
3.5. June 2021
4. Discussion
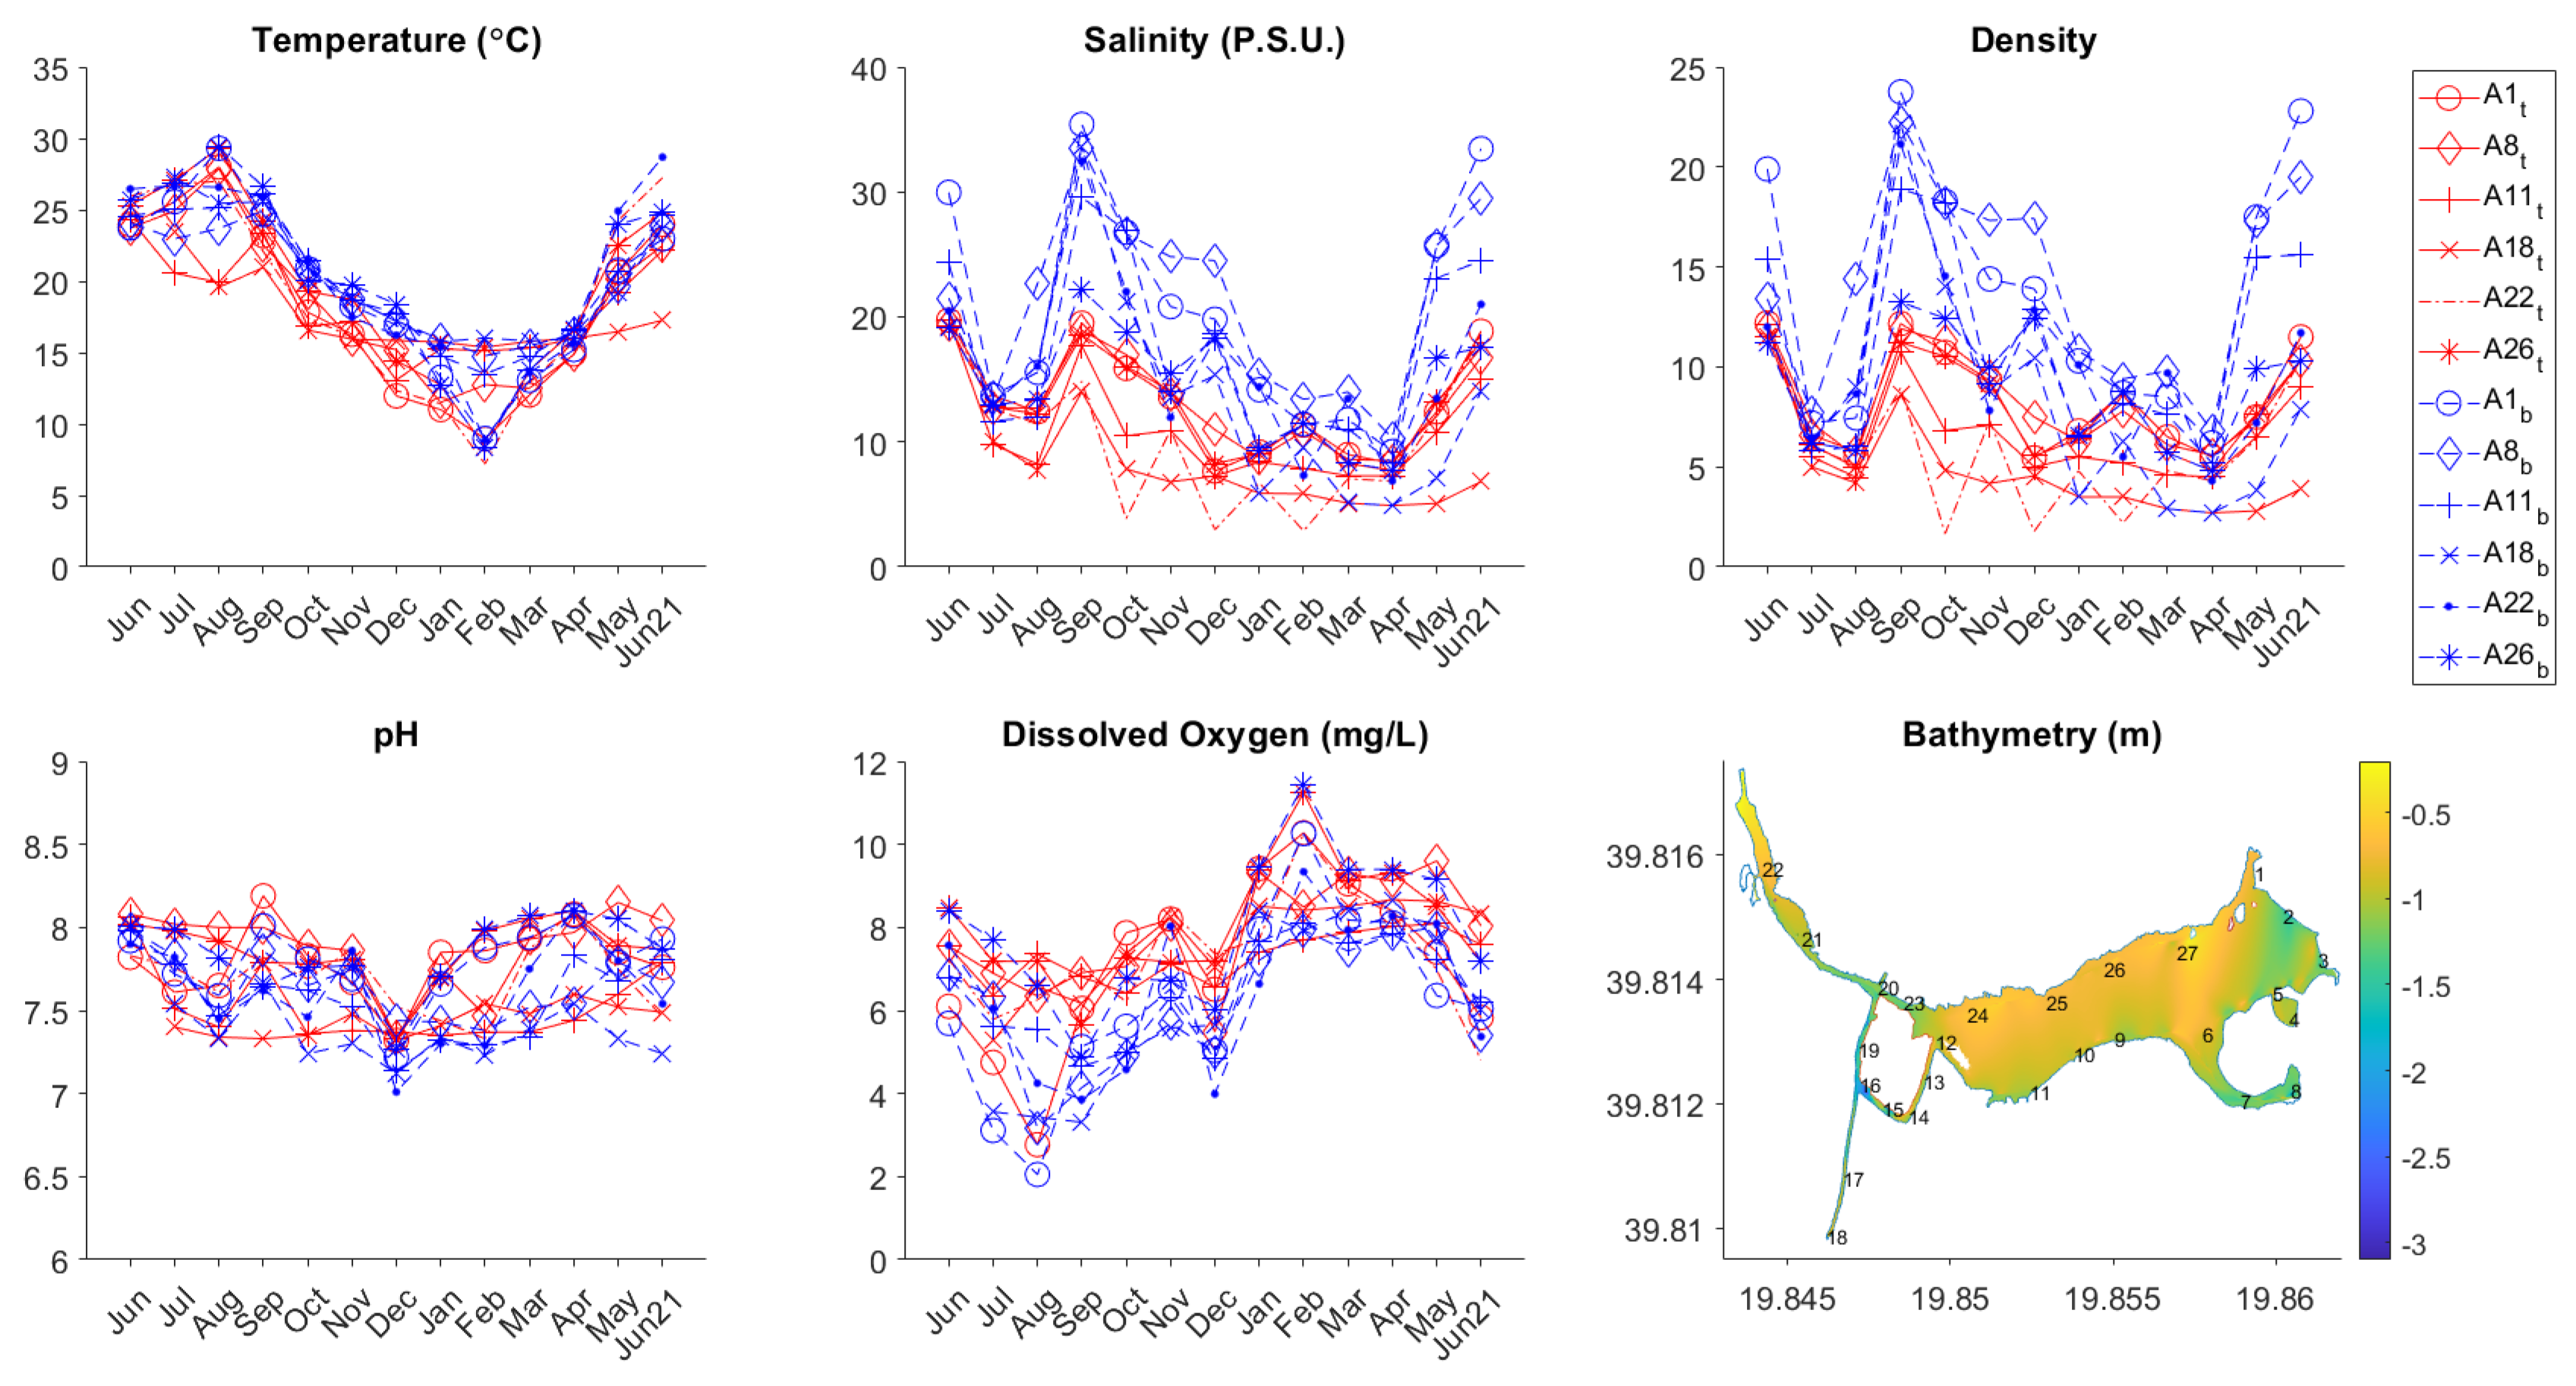
4.1. Seasonal Variability of Water Properties
4.2. Heat and Salt Budgets
4.3. Circulation
4.4. Comparison with Investigations of Other Coastal Lagoons
4.5. Consequences for Aquaculture
5. Conclusions
Author Contributions
Funding
Institutional Review Board Statement
Informed Consent Statement
Data Availability Statement
Acknowledgments
Conflicts of Interest
References
- Barbier, E.B.; Hacker, S.D.; Kennedy, C.; Koch, E.W.; Stier, A.C.; Silliman, B.R. The value of estuarine and coastal ecosystem services. Ecol. Monogr. 2011, 81, 169–193. [Google Scholar] [CrossRef]
- Cromwell, J.E. Barrier Coast Distribution: A World-Wide Survey. In Proceedings of the Abstracts, Second Coastal and Shallow Water Research Conference; US Office of Naval Research Geography Program; University Press, University of Southern California: Los Angeles, CA, USA, 1971. [Google Scholar]
- Kjerfve, B. Coastal lagoons. In Elsevier Oceanography Series; Elsevier: Amsterdam, The Netherlands, 1994; Volume 60, pp. 1–8. [Google Scholar]
- Wolanski, E.; Delesalle, B.; Dufour, V.; Aubanel, A. Modeling the fate of pollutants in the Tiahura Lagoon, Moorea, French Polynesia. In Proceedings of the 11th Australasian Conference on Coastal and Ocean Engineering: Coastal Engineering a Partnership with Nature; Preprints of Papers; Institution of Engineers: Barton, Australia, 1993; p. 583. [Google Scholar]
- Kraines, S.; Yanagi, T.; Isobe, M.; Komiyama, H. Wind-wave driven circulation on the coral reef at Bora Bay, Miyako Island. Coral Reefs 1998, 17, 133–143. [Google Scholar] [CrossRef]
- Kraines, S.B.; Suzuki, A.; Yanagi, T.; Isobe, M.; Guo, X.; Komiyama, H. Rapid water exchange between the lagoon and the open ocean at Majuro Atoll due to wind, waves, and tide. J. Geophys. Res. Ocean. 1999, 104, 15635–15653. [Google Scholar] [CrossRef]
- Tartinville, B.; Rancher, J. Wave-induced flow over Mururoa atoll reef. J. Coast. Res. 2000, 16, 776–781. [Google Scholar]
- Andréfouët, S.; Pages, J.; Tartinville, B. Water renewal time for classification of atoll lagoons in the Tuamotu Archipelago (French Polynesia). Coral Reefs 2001, 20, 399–408. [Google Scholar] [CrossRef]
- Angwenyi, C.M.; Rydberg, L. Wave-driven circulation across the coral reef at Bamburi Lagoon, Kenya. Estuar. Coast. Shelf Sci. 2005, 63, 447–454. [Google Scholar] [CrossRef]
- Hench, J.L.; Leichter, J.J.; Monismith, S.G. Episodic circulation and exchange in a wave-driven coral reef and lagoon system. Limnol. Oceanogr. 2008, 53, 2681–2694. [Google Scholar] [CrossRef]
- Kench, P.; McLean, R. Hydrodynamics and sediment flux of hoa in an Indian Ocean atoll. Earth Surf. Process. Landforms: J. Br. Geomorphol. Res. Group 2004, 29, 933–953. [Google Scholar] [CrossRef]
- Chevalier, C.; Devenon, J.L.; Rougier, G.; Blanchot, J. Hydrodynamics of the Toliara reef lagoon (Madagascar): Example of a lagoon influenced by waves and tides. J. Coast. Res. 2015, 31, 1403–1416. [Google Scholar] [CrossRef]
- Taebi, S.; Lowe, R.; Pattiaratchi, C.; Ivey, G.; Symonds, G. Modelling nearshore circulation in a fringing reef system: Ningaloo Reef, Australia. J. Coast. Res. 2011, 1200–1203. [Google Scholar]
- Hoeke, R.K.; Storlazzi, C.D.; Ridd, P.V. Drivers of circulation in a fringing coral reef embayment: A wave-flow coupled numerical modeling study of Hanalei Bay, Hawaii. Cont. Shelf Res. 2013, 58, 79–95. [Google Scholar] [CrossRef]
- Chevalier, C.; Sous, D.; Devenon, J.L.; Pagano, M.; Rougier, G.; Blanchot, J. Impact of cross-reef water fluxes on lagoon dynamics: A simple parameterization for coral lagoon circulation model, with application to the Ouano Lagoon, New Caledonia. Ocean Dyn. 2015, 65, 1509–1534. [Google Scholar] [CrossRef]
- Sous, D.; Chevalier, C.; Devenon, J.L.; Blanchot, J.; Pagano, M. Circulation patterns in a channel reef-lagoon system, Ouano lagoon, New Caledonia. Estuar. Coast. Shelf Sci. 2017, 196, 315–330. [Google Scholar] [CrossRef]
- Lowe, R.J.; Falter, J.L.; Monismith, S.G.; Atkinson, M.J. Wave-driven circulation of a coastal reef–lagoon system. J. Phys. Oceanogr. 2009, 39, 873–893. [Google Scholar] [CrossRef]
- Caspers, H.R.S.K. BARNES: Coastal Lagoons. The Natural History of a Neglected Habitat.= Cambridge Studies in Modern Biology 1.–106 pp. Cambridge: University Press 1980. ISBN 0 521 23422 0 (hard cover) 29945 4 (paperback)£ 12.00/4.95. Int. Rev. Hydrobiol. 1981, 66, 905. [Google Scholar] [CrossRef]
- Koutsoubas, D.; Dounas, C.; Arvanitidis, C.; Kornilios, S.; Petihakis, G.; Triantafyllou, G.; Eleftheriou, A. Macrobenthic community structure and disturbance assessment in Gialova Lagoon, Ionian Sea. ICES J. Mar. Sci. 2000, 57, 1472–1480. [Google Scholar] [CrossRef]
- Reizopoulou, S.; Nicolaidou, A. Benthic diversity of coastal brackish-water lagoons in western Greece. Aquat. Conserv. Mar. Freshw. Ecosyst. 2004, 14, S93–S102. [Google Scholar] [CrossRef]
- Carassou, L.; Le Borgne, R.; Rolland, E.; Ponton, D. Spatial and temporal distribution of zooplankton related to the environmental conditions in the coral reef lagoon of New Caledonia, Southwest Pacific. Mar. Pollut. Bull. 2010, 61, 367–374. [Google Scholar] [CrossRef]
- Szmant, A.M. Nutrient enrichment on coral reefs: Is it a major cause of coral reef decline? Estuaries 2002, 25, 743–766. [Google Scholar] [CrossRef]
- Cuif, M.; Kaplan, D.M.; Lefèvre, J.; Faure, V.M.; Caillaud, M.; Verley, P.; Vigliola, L.; Lett, C. Wind-induced variability in larval retention in a coral reef system: A biophysical modelling study in the South-West Lagoon of New Caledonia. Prog. Oceanogr. 2014, 122, 105–115. [Google Scholar] [CrossRef]
- Botsou, F.; Karageorgis, A.P.; Paraskevopoulou, V.; Dassenakis, M.; Scoullos, M. Critical Processes of Trace Metals Mobility in Transitional Waters: Implications from the Remote, Antinioti Lagoon, Corfu Island, Greece. J. Mar. Sci. Eng. 2019, 7, 307. [Google Scholar] [CrossRef]
- Simantiris, N.; Vardaki, M.Z.; Koralli, P.; Chochos, C.L.; Gregoriou, V.G.; Kourkoumelis, N.; Avlonitis, M. Seasonal evaluation of floating microplastics in a shallow Mediterranean coastal lagoon: Abundance, distribution, chemical composition, and influence of environmental factors. Estuar. Coast. Shelf Sci. 2022, 272, 107859. [Google Scholar] [CrossRef]
- Simantiris, N.; Avlonitis, M. Effects of future climate conditions on the zooplankton of a Mediterranean coastal lagoon. Estuar. Coast. Shelf Sci. 2023, 282, 108231. [Google Scholar] [CrossRef]
- Simantiris, N.; Violaris, I.G.; Avlonitis, M. Computing invasive species population based on a generalized random walk process: Application to blue crab (Callinectes sapidus). J. Mar. Sci. Eng. 2023, 11, 1282. [Google Scholar] [CrossRef]
- Simantiris, N.; Theocharis, A.; Avlonitis, M. Environmental effects on zooplankton dynamics of a shallow Mediterranean coastal lagoon (October 2020–March 2021). Reg. Stud. Mar. Sci. 2021, 48, 102001. [Google Scholar] [CrossRef]
- Mcleod, E.; Poulter, B.; Hinkel, J.; Reyes, E.; Salm, R. Sea-level rise impact models and environmental conservation: A review of models and their applications. Ocean Coast. Manag. 2010, 53, 507–517. [Google Scholar] [CrossRef]
- FitzGerald, D.M.; Fenster, M.S.; Argow, B.A.; Buynevich, I.V. Coastal impacts due to sea-level rise. Annu. Rev. Earth Planet. Sci. 2008, 36, 601–647. [Google Scholar] [CrossRef]
- Passeri, D.L.; Hagen, S.C.; Medeiros, S.C.; Bilskie, M.V.; Alizad, K.; Wang, D. The dynamic effects of sea level rise on low-gradient coastal landscapes: A review. Earth’s Future 2015, 3, 159–181. [Google Scholar] [CrossRef]
- Carrasco, A.R.; Ferreira, Ó.; Roelvink, D. Coastal lagoons and rising sea level: A review. Earth-Sci. Rev. 2016, 154, 356–368. [Google Scholar] [CrossRef]
- Kirwan, M.L.; Walters, D.C.; Reay, W.G.; Carr, J.A. Sea level driven marsh expansion in a coupled model of marsh erosion and migration. Geophys. Res. Lett. 2016, 43, 4366–4373. [Google Scholar] [CrossRef]
- Simantiris, N.; Avlonitis, M.; Theocharis, A. Simulation of the transport of marine microplastic particles in the Ionian Archipelago (NE Ionian Sea) using a Lagrangian model and the control mechanisms affecting their transport. J. Hazard. Mater. 2022, 437, 129349. [Google Scholar] [CrossRef]
- Simantiris, N.; Vardaki, M.Z.; Kourkoumelis, N.; Avlonitis, M.; Theocharis, A. Microplastics in the Mediterranean and elsewhere in coastal seas. In Reference Module in Earth Systems and Environmental Sciences; Elsevier: Amsterdam, The Netherlands, 2023. [Google Scholar] [CrossRef]
- Grémillet, X. Proposals for the conservation of otters Lutra lutra L. on Corfu island (Ionian Sea, Greece). Hystrix, Ital. J. Mammal. 1995, 7, 219–222. [Google Scholar] [CrossRef]
- Ferrarin, C.; Madricardo, F.; Rizzetto, F.; Kiver, W.M.; Bellafiore, D.; Umgiesser, G.; Kruss, A.; Zaggia, L.; Foglini, F.; Ceregato, A.; et al. Geomorphology of scour holes at tidal channel confluences. J. Geophys. Res. Earth Surf. 2018, 123, 1386–1406. [Google Scholar] [CrossRef]
- Hull, V.; Parrella, L.; Falcucci, M. Modelling dissolved oxygen dynamics in coastal lagoons. Ecol. Model. 2008, 211, 468–480. [Google Scholar] [CrossRef]
- Amanieu, M.; Lasserre, G. Organisation et évolution des peuplements lagunaires. Oceanol. Acta 1982, 35752. [Google Scholar]
- Van Haren, H. Pacific shallow lagoon high-resolution temperature observations. arXiv 2019, arXiv:1910.03451. [Google Scholar]
- Marr, J.B.; Smith, D.W. Lagoons and ponds. Res. J. Water Pollut. Control. Fed. 1991, 63, 394–398. [Google Scholar]
- Guelorget, O.; Frisoni, G.; Perthuisot, J. La zonation biologique des milieux lagunaires: Définition d’une échelle de confinement dans le domaine paralique méditerranéen. J. Rech. Oceanogr. 1983, 8, 15–36. [Google Scholar]
- Béjaoui, B.; Harzallah, A.; Moussa, M.; Chapelle, A.; Solidoro, C. Analysis of hydrobiological pattern in the Bizerte lagoon (Tunisia). Estuar. Coast. Shelf Sci. 2008, 80, 121–129. [Google Scholar] [CrossRef]
- Ferrarin, C.; Umgiesser, G.; Bajo, M.; Bellafiore, D.; De Pascalis, F.; Ghezzo, M.; Mattassi, G.; Scroccaro, I. Hydraulic zonation of the lagoons of Marano and Grado, Italy. A modelling approach. Estuar. Coast. Shelf Sci. 2010, 87, 561–572. [Google Scholar] [CrossRef]
- Solidoro, C.; Canu, D.M.; Cucco, A.; Umgiesser, G. A partition of the Venice Lagoon based on physical properties and analysis of general circulation. J. Mar. Syst. 2004, 51, 147–160. [Google Scholar] [CrossRef]
- Suckow, M.A.; Weisbroth, S.H.; Franklin, C.L. Seawater: It’s Composition, Properties and Behaviour; Elsevier: Amsterdam, The Netherlands, 1995. [Google Scholar]
- Tamborski, J.; Van Beek, P.; Rodellas, V.; Monnin, C.; Bergsma, E.; Stieglitz, T.; Heilbrun, C.; Cochran, J.K.; Charbonnier, C.; Anschutz, P.; et al. Temporal variability of lagoon–sea water exchange and seawater circulation through a Mediterranean barrier beach. Limnol. Oceanogr. 2019, 64, 2059–2080. [Google Scholar] [CrossRef]
- da Silva, D.V.; Oleinik, P.H.; Costi, J.; de Paula Kirinus, E.; Marques, W.C. Residence time patterns of Mirim Lagoon (Brazil) derived from two-dimensional hydrodynamic simulations. Environ. Earth Sci. 2019, 78, 1–11. [Google Scholar] [CrossRef]
- Ouillon, S.; Douillet, P.; Lefebvre, J.P.; Le Gendre, R.; Jouon, A.; Bonneton, P.; Fernandez, J.M.; Chevillon, C.; Magand, O.; Lefèvre, J.; et al. Circulation and suspended sediment transport in a coral reef lagoon: The south-west lagoon of New Caledonia. Mar. Pollut. Bull. 2010, 61, 269–296. [Google Scholar] [CrossRef]
- Bruyère, O.; Soulard, B.; Lemonnier, H.; Laugier, T.; Hubert, M.; Petton, S.; Desclaux, T.; Van Wynsberge, S.; Le Tesson, E.; Lefèvre, J.; et al. Hydrodynamic and hydrological processes within a variety of coral reef lagoons: Field observations during six cyclonic seasons in New Caledonia. Earth Syst. Sci. Data 2022, 14, 5439–5462. [Google Scholar] [CrossRef]
- Carrasco, A.R.; Plomaritis, T.; Reyns, J.; Ferreira, Ó.; Roelvink, D. Tide circulation patterns in a coastal lagoon under sea-level rise. Ocean. Dyn. 2018, 68, 1121–1139. [Google Scholar] [CrossRef]
- Cunha, C.d.L.d.N.; Scudelari, A.C.; Sant’Ana, D.d.O.; Luz, T.E.B.; Pinheiro, M.K.d.R. Effects on circulation and water renewal due to the variations in the river flow and the wind in a Brazilian estuary lagoon complex. Rev. Ambiente Água 2021, 16, e2600. [Google Scholar] [CrossRef]
- Meredith, W.; Casamitjana, X.; Quintana, X.D.; Menció, A. Effects of morphology and sediment permeability on coastal lagoons’ hydrological patterns. J. Hydrol. 2022, 612, 128259. [Google Scholar] [CrossRef]
- Gonzalez-Vazquez, J.A.; Hernández-Vivar, E.; Rojas-Serna, C.; Valle-Morales, J.D. Diagnosis of water circulation in an estuary: A case study of the Jamapa River and the Mandinga lagoons, Veracruz, Mexico. Cienc. Mar. 2019, 45, 1–16. [Google Scholar] [CrossRef]
- Zhan, P.; Krokos, G.; Langodan, S.; Guo, D.; Dasari, H.; Papadopoulos, V.P.; Lermusiaux, P.F.; Knio, O.M.; Hoteit, I. Coastal circulation and water transport properties of the Red Sea Project lagoon. Ocean. Model. 2021, 161, 101791. [Google Scholar] [CrossRef]
- Tavora, J.; Fernandes, E.H.; Thomas, A.C.; Weatherbee, R.; Schettini, C.A. The influence of river discharge and wind on Patos Lagoon, Brazil, Suspended Particulate Matter. Int. J. Remote Sens. 2019, 40, 4506–4525. [Google Scholar] [CrossRef]


| Lagoon (Country) | Method | Forcing | Reference |
|---|---|---|---|
| Antinioti (Greece) | Experimental | Fresh–seawater inputs and atmospheric conditions | Present study |
| Bizerte (Tunisia) | Experimental | Fresh–seawater inputs | Béjaoui et al. [43] |
| Ouano (Nea Caledonia) | Experimental | Wave and wind activity | Sous et al. [16] |
| La Palme (France) | Experimental | Wind speed | Tamborski et al. [47] |
| Various lagoons (New Caledonia) | Experimental | Atmospheric conditions, freshwater inputs, and internal waves | Bruyere et al. [50] |
| Ria Formosa (Portugal) | Numerical | Fresh–seawater interactions | Carrasco et al. [51] |
| Mundaú-Manguaba (Brazil) | Numerical | Freshwater inputs and wind speed | Cunha et al. [52] |
| Mirim (Brazil) | Numerical | Wind speed | da Silva et al. [48] |
| Marano, Grado (Italy) | Numerical | Fresh–seawater interactions | Ferrarin et al. [44] |
| La Pletera (Spain) | Numerical | Bathymetry/topography | Meredith et al. [53] |
| South-West (New Caledonia) | Numerical | Wind speed | Ouillon et al. [49] |
| Venice (Italy) | Numerical | Fresh–seawater interaction and atmospheric conditions | Solidoro et al. [45] |
| Mandinga (Mexico) | Numerical | Fresh–seawater inputs | Gonzalez-Vazquez et al. [54] |
| RSP (Saudi Arabia) | Numerical | Topography, wind speed, and fresh–seawater inputs | Zhan et al. [55] |
| Patos (Brazil) | Remote sensing | Freshwater inputs and wind direction | Tavora et al. [56] |
Disclaimer/Publisher’s Note: The statements, opinions and data contained in all publications are solely those of the individual author(s) and contributor(s) and not of MDPI and/or the editor(s). MDPI and/or the editor(s) disclaim responsibility for any injury to people or property resulting from any ideas, methods, instructions or products referred to in the content. |
© 2024 by the authors. Licensee MDPI, Basel, Switzerland. This article is an open access article distributed under the terms and conditions of the Creative Commons Attribution (CC BY) license (https://creativecommons.org/licenses/by/4.0/).
Share and Cite
Simantiris, N.; Theocharis, A. Seasonal Variability of Hydrological Parameters and Estimation of Circulation Patterns: Application to a Mediterranean Coastal Lagoon. J. Mar. Sci. Eng. 2024, 12, 1212. https://doi.org/10.3390/jmse12071212
Simantiris N, Theocharis A. Seasonal Variability of Hydrological Parameters and Estimation of Circulation Patterns: Application to a Mediterranean Coastal Lagoon. Journal of Marine Science and Engineering. 2024; 12(7):1212. https://doi.org/10.3390/jmse12071212
Chicago/Turabian StyleSimantiris, Nikolaos, and Alexander Theocharis. 2024. "Seasonal Variability of Hydrological Parameters and Estimation of Circulation Patterns: Application to a Mediterranean Coastal Lagoon" Journal of Marine Science and Engineering 12, no. 7: 1212. https://doi.org/10.3390/jmse12071212