Article

A Parallelized Climatological Drifter-Based Model of Sargassum Biomass Dynamics in the Tropical Atlantic

by
Karl Payne
*,
Khalil Greene
and
Hazel A. Oxenford
Centre for Resource Management and Environmental Studies, Cave Hill Campus, The University of the West Indies, Bridgetown BB11000, Barbados
*
Author to whom correspondence should be addressed.
J. Mar. Sci. Eng. 2024, 12(7), 1214; https://doi.org/10.3390/jmse12071214
Submission received: 18 May 2024 / Revised: 26 June 2024 / Accepted: 27 June 2024 / Published: 19 July 2024
(This article belongs to the Section Marine Biology)

Abstract

:
The movement and biomass fluctuations of sargassum across the Tropical Atlantic have profound implications when influxes reach the Eastern Caribbean. These influxes have cross-cutting impacts across ecological, economic, and social systems. The objective of this work is to quantify sargassum biomass accumulation in the Eastern Caribbean, accounting for the spatial variability in sea surface temperature and morphotype diversity. A parallel implementation of a climatological drifter-based model was used to simulate advection of sargassum across the model domain. After determining the trajectory of virtual sargassum particles, Monte Carlo simulations using 1000 realizations were run to quantify biomass accumulations along these tracks. For simulations with a single morphotype, the biomass accumulation as predicted by the model effectively reproduced the seasonal distributions of sargassum for the simulated period (May 2017 to August 2017). The model closely approximated an observed increase during the period from May to July 2017, followed by a subsequent decline in sargassum abundance. A major factor that led to the discrepancy between the simulated and observed biomass accumulation is the occlusion of the optical satellite signal from cloud cover, which led to underestimates of sargassum abundance. The mean maximum growth rate required to reproduce the observed sargassum biomass was 0.05 day−1, which is consistent with other published experimental and computational studies that have reported similar growth rates for sargassum populations under comparable environmental conditions. An innovative aspect of this study was the investigation of the biomass dynamics of the three dominant morphotypes found in the study area. The results from these simulations show that the accumulation of the fastest growing morphotype, Sargassum fluitans var. fluitans, closely approximates the profiles of the overall prediction with a single morphotype.

1. Introduction

Since 2011, blooms of pelagic Sargassum spp. (referred to here simply by their common name ‘sargassum’) occurring in the Tropical Atlantic have resulted in unprecedented sargassum biomass influxes that have inundated the coastlines of Caribbean and West African countries. These influxes have caused significant environmental damage as well as social and economic hardship [1,2]. There has been increasing scientific evidence to support the linkage between these proliferations and increased nutrient availability in the Tropical Atlantic, exacerbated by climate variability and change [3,4] and an acceptance that this has now become a ‘normal’ annual event that will continue [1,5]. While there are many ongoing efforts to valorize sargassum biomass (see review by [6]), there has yet to be a demonstrated long-term solution that can use sufficiently large amounts of biomass to mitigate the negative impacts on the environment, tourism, fisheries, and health sectors [7,8]. Given the cross-cutting implications of sargassum inundation in coastal areas and the thrust to utilize the biomass as a resource, accurate forecasts of sargassum transport and beaching have become increasingly important [9,10,11].
Numerical and data-driven models are powerful tools that enable tracking the movement of sargassum biomass and the fate of nutrients spatially and temporally. This enables early warning of severe influxes, spatial and temporal analysis, and biomass quantification. These capabilities are necessary for more informed decision-making, adaptive management strategies, and improved preparedness to address the impacts of sargassum influx events on coastal regions. Sargassum transport models generally fall into two categories: hydrodynamic models and Lagrangian drift models. Hydrodynamic models simulate the physical processes of ocean currents and water movement using the numerical solution of partial differential equations (PDEs) that describe physical oceanographic phenomena. The Hybrid Coordinate Ocean Model (HYCOM) [12] and the Nucleus for European Modelling of the Ocean (NEMO) model [13] are examples of physically based hydrodynamic models of transport processes. Lagrangian models simulate the movement of ‘particles’, typically based on observed ocean currents and factors such as wind. By following the trajectories of numerous virtual particles, the movement of sargassum can be determined. A skill assessment comparing HYCOM to a Lagrangian drift model showed that the Lagrangian model had a higher skill score, using satellite tracked drifters from the Global Drifter Program (GDP) for validation [14].
Understanding the dynamics of sargassum biomass is complex owing to a multiplicity of factors. Missing satellite data, induced by cloud occlusion and/or low resolution and frequency of images, result in variable ability to detect and follow sargassum [15]. Langmuir circulation leads to counter-rotating vortices that influence the agglomeration dynamics of sargassum biomass. Moreover, there is uncertainty in the growth, longevity, fragmentation rates, and morphological variations under varying conditions such as sea surface temperature (SST), nutrient availability, age, and changing sea conditions. Collectively, these have implications for biomass estimation and remote sensing detection efficacy. Recent efforts using deep learning, an artificial intelligence (AI) technique, have demonstrated promising results in overcoming challenges related to cloud-adjacent straylight and shadows that cause false positive and false negative detections [16]. Notwithstanding the challenges, an improved understanding of biomass dynamics is integral to improving the accuracy of forecasts attempting to quantify sargassum influxes, which would enable a stronger scientific basis for decision-making. For the small and open economies in the Caribbean, better management of sargassum influxes is indispensable, given the dependence on tourism especially, and the need to optimally allocate scarce resources for sargassum removal and use.
Generally, predicting sargassum biomass dynamics is accomplished through physical–biochemical models. Biomass growth and mortality are determined by the numerical integration of ordinary differential equations (ODEs) along the tracks derived from transport models. Jouanno et al. (2021) implemented a model referred to as NEMO-Sarg1.0, which used modelled ocean currents from NEMO along with advection–dispersion and sargassum growth-mortality models to represent the spatial distribution and seasonal cycle of sargassum biomass in the western Atlantic and the Caribbean Sea [17]. The growth model accounted for internal nutrient reserves, dissolved inorganic nutrients in the external medium, light factors, and SST. Another study by Marsh et al. (2021) used the eddy-resolving global configuration (ORCA12) of NEMO, referred to as NEMO-ORCA12, for drift calculations of five-day averages of surface winds and surface currents. Particle trajectories were determined using the Lagrangian ARIANE mass-preserving algorithm to track several seeded ‘virtual’ particles. The biogeochemical model retained many of the features of the NEMO-Sarg 1.0 approach; however, the main point of departure was the relaxation of nutrient- and light-availability-mediated growth [18].
Multiple research gaps exist regarding the transport, growth, and mortality of pelagic sargassum in the Tropical Atlantic. Integration of new growth data from recent experiments would significantly improve the state-of-the-art in sargassum influx event forecasting [19]. To the best of our knowledge, no prior published studies have investigated the integration of Lagrangian drift models with growth models that are consistent with the diversity of sargassum morphotypes. The current state-of-the-art treats sargassum as a carbon pool representative of some overall sargassum biomass that expands and contracts along a trajectory contingent upon whether the rate at which metabolic processes occur exceeds the mortality rate. Recent experimental evidence on the growth rates of Sargassum fluitans var. fluitans, Sargassum natans var. natans, and Sargassum natans var. wingei (respectively [20,21]), the three dominant morphotypes in the Tropical Atlantic [20,21,22], now allows us to develop more biologically consistent growth models that provide a higher-fidelity description of sargassum growth in this region. Moreover, in this study, we account for the spatial variability in SST, ensuring that sargassum biomass growth is contingent upon SST changes along tracks.
In this study, the overall goal is to improve on the existing sargassum forecast developed by Johnson et al. (2020) and used to produce the Sargassum Sub-regional Outlook Bulletins for the Eastern Caribbean (https://www.cavehill.uwi.edu/cermes/projects/sargassum/outlook-bulletin.aspx (accessed on 27 June 2024)) [14]. The specific objectives are to develop: (1) a parallel climatological drifter-based model that simulates the transport of sargassum in the Tropical Atlantic in a computationally efficient manner; (2) an integrated climatological drifter-based and biochemical model that integrates sargassum advection with the growth and mortality of three dominant morphotypes found in the study area; (3) Monte Carlo simulations of biomass dynamics that account for parametric uncertainty; and (4) an approach that incorporates spatially variable sea surface temperatures (SSTs). Collectively, these findings should improve the ability to predict the advection and biomass dynamics of pelagic sargassum in the Tropical Atlantic, enabling more effective forecasting and thus more efficient management of sargassum influxes in coastal areas.

2. Materials and Methods
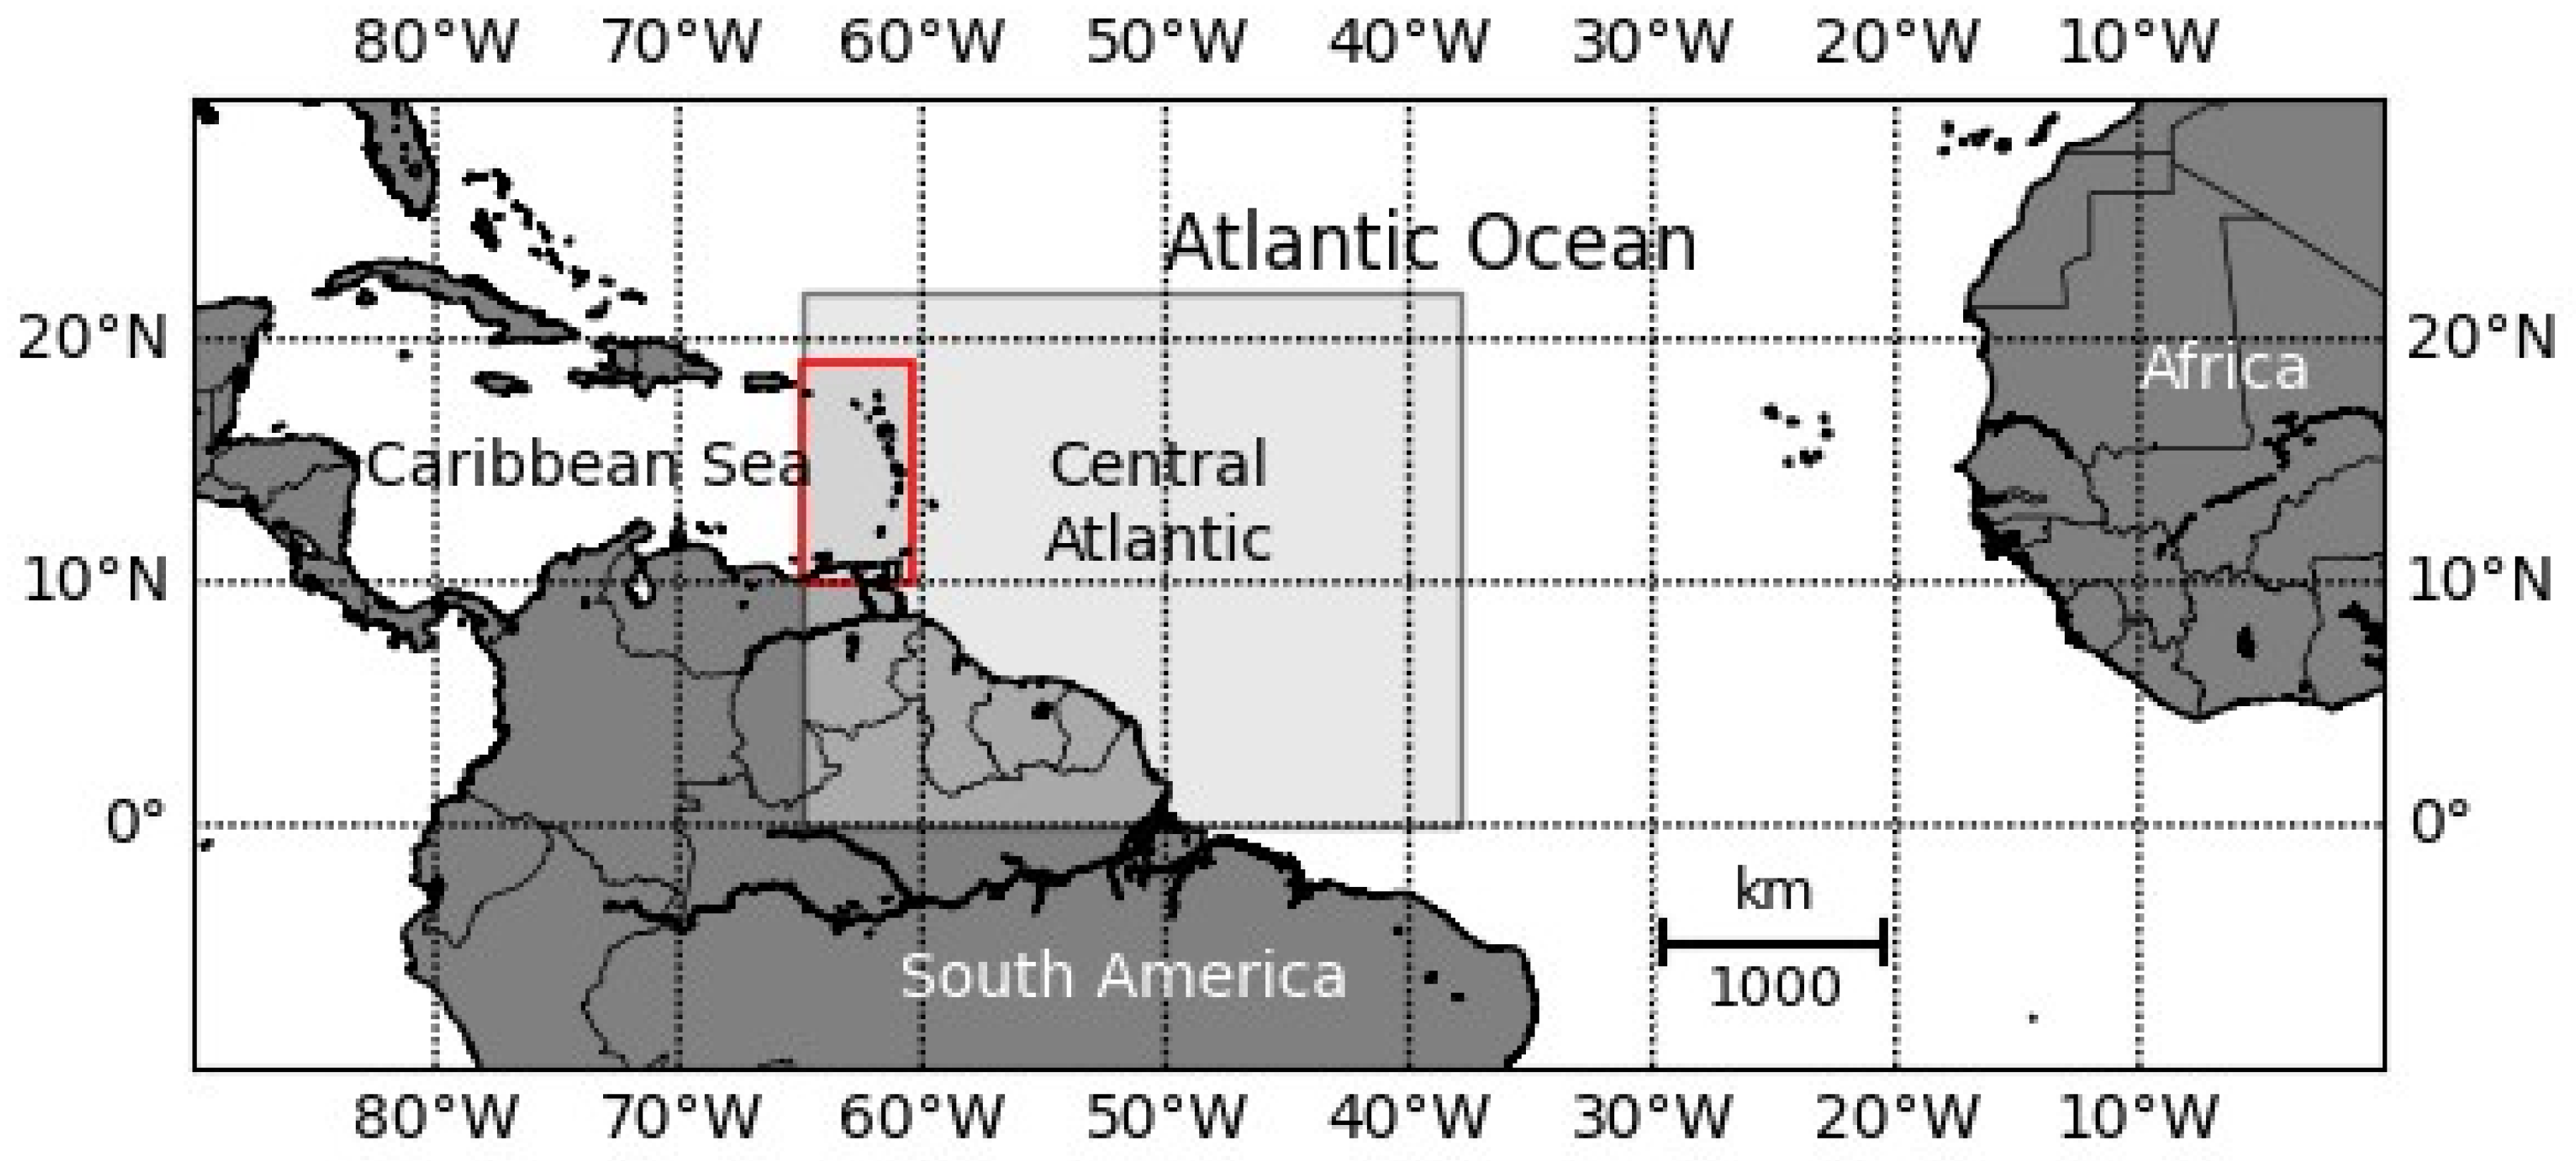
2.1. Study Area

The study area is the Central Atlantic region, which includes areas of the Caribbean Sea and Atlantic Ocean, bounded by latitudes 0° N–22° N and longitudes 38° W–65° W. The prediction region in the Eastern Caribbean is a subset of the study area bound by latitudes 10° N–19° N and longitudes 60.4° W and 65° W (Figure 1). The Central Atlantic represents part of the Great Atlantic Sargassum Belt (GASB), which stretches from West Africa to North America and includes part of the North Equatorial Recirculation Region (NERR), from which sargassum advects to the Lesser Antilles Islands of the Eastern Caribbean.

2.2. Data Sources and Processing

In this section, we describe the data and data processing methods that were required for implementation of the integrated Lagrangian drift and sargassum biomass model. The data sets used were satellite images indicative of the spatial variability in sargassum abundance, current and wind data required for advecting sargassum across the model domain, and SST data utilized to determine biomass dynamics. The main data processing performed was scaling of the satellite images and clipping of the SST data to represent the study area.

2.2.1. Satellite Data for Initializing Lagrangian Drift Model

The Lagrangian drift model for advecting sargassum generally follows the approach by Johnson et al. (2020) [14]. The University of South Florida, College of Marine Science, Optical Oceanography Laboratory publishes seven-day composite maps of an alternative floating algae index (AFAI) daily [16]. These images represent the floating algae density as a percentage of area cover, ranging from 0.1 to 0.4. The images represent sargassum seaweed coverage in the Central Atlantic. The images are mapped to a cylindrical equidistant projection at 1 km resolution. Each image was downloaded as a PNG, then scaled to one-tenth length and height using the Lanczos resampling method. After each image was processed, a predefined color range was assigned, and pixels within this range were seeded with particles to initialize the origin of the sargassum being advected.

2.2.2. Current and Wind Climatological Data

Following Johnson et al. (2020) [14], drifter data used were 6 h interval data from 1990 to 2014, which were interpolated to the 1/12° HYCOM grid at 365 year-days using an inverse distance interpolation with a cut-off at 2° longitude/latitude. Voids in offshore data points were filled by splines over time, especially in proximity to the equator, where mixed-layer drifters tend to flow around the shallow Equatorial Undercurrent (EUC).

2.2.3. Sea Surface Temperature Data Used in Biomass Dynamics Model

One of the novel aspects of the approach in this study is that, rather than uniform SST averages, we account for temperature gradients across the study area, thereby enhancing ecological realism by capturing the diverse thermal environments experienced by sargassum. The temperature data used in the calculation of sargassum growth were 1/4° gridded, seasonal statistical-mean SSTs for the period 1991–2020. The data were extracted from the National Oceanographic and Atmospheric Administration (NOAA) National Centers for Environmental Information (NCEI) World Ocean Atlas (https://www.ncei.noaa.gov/access/world-ocean-atlas-2023/bin/woa23.pl (accessed on 18 June 2023)). The dataset was clipped to represent the study area and temperatures at sea surface level for more efficient processing. The dataset is subset by four seasons (winter, spring, summer, and autumn), allowing an appropriate seasonal subset to be selected based on the date associated with the position of a particle along the forecast track.

2.3. Parallel Implementation of Lagrangian Drift Model for Sargassum Advection

For the Lagrangian drift model developed in this paper, computational efficiency through parallel computing is critical given the need to rapidly test new hypotheses and the need for a tool that can serve as an early warning system. Multiprocessing allows the parallel execution of processes across multiple central processing unit (CPU) cores. This means that a serializable program, with CPU-bound tasks, can be split into multiple tasks or subprocesses and executed simultaneously on a multicore CPU system, resulting in a significant reduction in execution time.
Parallelization is typically performed either using domain decomposition, time-stepping parallelization, or particle-based parallelization. In this study, we utilized the latter method, exploiting the fact that the trajectory of one advected ‘particle’ is independent from that of another advected particle. This was implemented using the Python multiprocessing module, which provides an application programming interface (API) with access to a Pool object [https://docs.python.org/3/library/multiprocessing.html (accessed on 27 June 2024)]. Data parallelism is invoked using a ‘Pool.map’ function, which applies a defined function mapped to multiple input values in a single iterable data structure, spawning subprocesses to simultaneously execute the function against multiple values. Each task is run in its own subprocess. The ‘Pool.map’ function was utilized for particle-based parallelism, which tracked each Lagrangian particle stepwise through time on a random CPU core. The system used in this study is a Dell Alienware Area 51 R5 system with an Intel Core i9-7980XE processor (18 Hyper-Thread cores), 32 GB of RAM, a 1TB SSD, and an NVIDIA GeForce GTX 1080 Ti graphics card. The algorithm for multiprocessing sargassum tracks is given at Algorithm 1.
Algorithm 1 ForwardTrack
Inputs: Iterable data structure containing tuples of latitude and longitude values representing Lagrangian particles.

Output: Data structure containing latitude and longitude tracks for each particle.
  • Use multiprocessing to apply steps 2–9 to the iterable input.
  • Take a point from the iterable data structure: coordinates ← point tuple.
  • Assign a unique identifier to the coordinates: id.
  • Identify the position as a start point: location ← 0.
  • Save the coordinates.
  • Initialize a day counter variable: day.
  • Set a forward tracking (forecast) period in days: period.
  • Apply Lagrangian tracking to coordinates at intervals of 0.1 day.
    • Calculate and save the new coordinates, coordinatesnew coordinates.
    • If day < period, record location as intermediate point and continue: location ← 1.
    • If day = period, track has ended. Record position as endpoint and stop: location ← 2.
  • Return the coordinates, day, location, and id.

2.4. Modelling Sargassum Biomass Dynamics

In this section, we present the model used for simulating changes in sargassum biomass. The model follows a similar approach to that of Jouanno et al. (2021) [17]; however, the main differences are that we account for the growth and mortality of all three common morphotypes found in the study area, Sargassum fluitans var. fluitans, Sargassum natans var. natans, and Sargassum natans var. wingei, and incorporate the heterogeneity of the temperature field by using SST data at the 1/4° spatial dimension. Without support from experimental data, we invoke the assumption that the sinking and mortality rates for the three morphotypes is the same. Sargassum is considered to be a carbon pool, C, composed of the three dominant morphotypes, denoted by C1, C2, and C3, respectively.
The ODEs representing the growth and mortality model are given by:
d C 1 d t = μ m a x , 1 C 1 f T φ m ( T )
d C 2 d t = μ m a x , 2 C 2 f T φ m ( T )
d C 3 d t = μ m a x , 3 C 3 f T φ m ( T )
where C1, C2, and C3 are the carbon fractions of Sargassum fluitans var. fluitans, Sargassum natans var. natans, and Sargassum natans var. wingei in the overall carbon pool; μmax,1, μmax,2, and μmax,3 are the maximum uptake rates of carbon of the three sargassum morphotypes; ϕm (T) is a temperature-dependent mortality term; and f(T) accounts for temperature-dependent growth factors. The functions that vary with temperature are given by:
f T = e 0.5 T T o p t T x T 2
where T is temperature, Topt is the optimal temperature for sargassum growth, Tx = Tmin for TTopt, and Tx = Tmax for T > Topt. Tmin and Tmax are the minimum and maximum temperatures for sargassum growth, respectively. The mortality is formulated as the same function presented in Marsh et al. (2021) [18], given by:
φ m ( T ) = m e λ m ( T 30 )  
An Euler method was used to numerically intergrate the growth and mortality model as represented by Equations (1)–(5). Monte Carlo simulations with 1000 realizations were run to account for the uncertainty in model parameters. Table 1 shows the model parameterization used in the simulations of a single morphotype.

2.5. Quantification of Sargassum Biomass

The growth model described in Section 2.4 was applied to tracked sargassum particles daily as they were advected across the Central Atlantic and into the Caribbean Sea. To forecast the final biomass values, the cumulative total biomass was accounted for by assessing particles remaining within the Eastern Caribbean prediction zone (between longitudes 60.4° W and 65° W) on each forecast day.

3. Results and Discussion

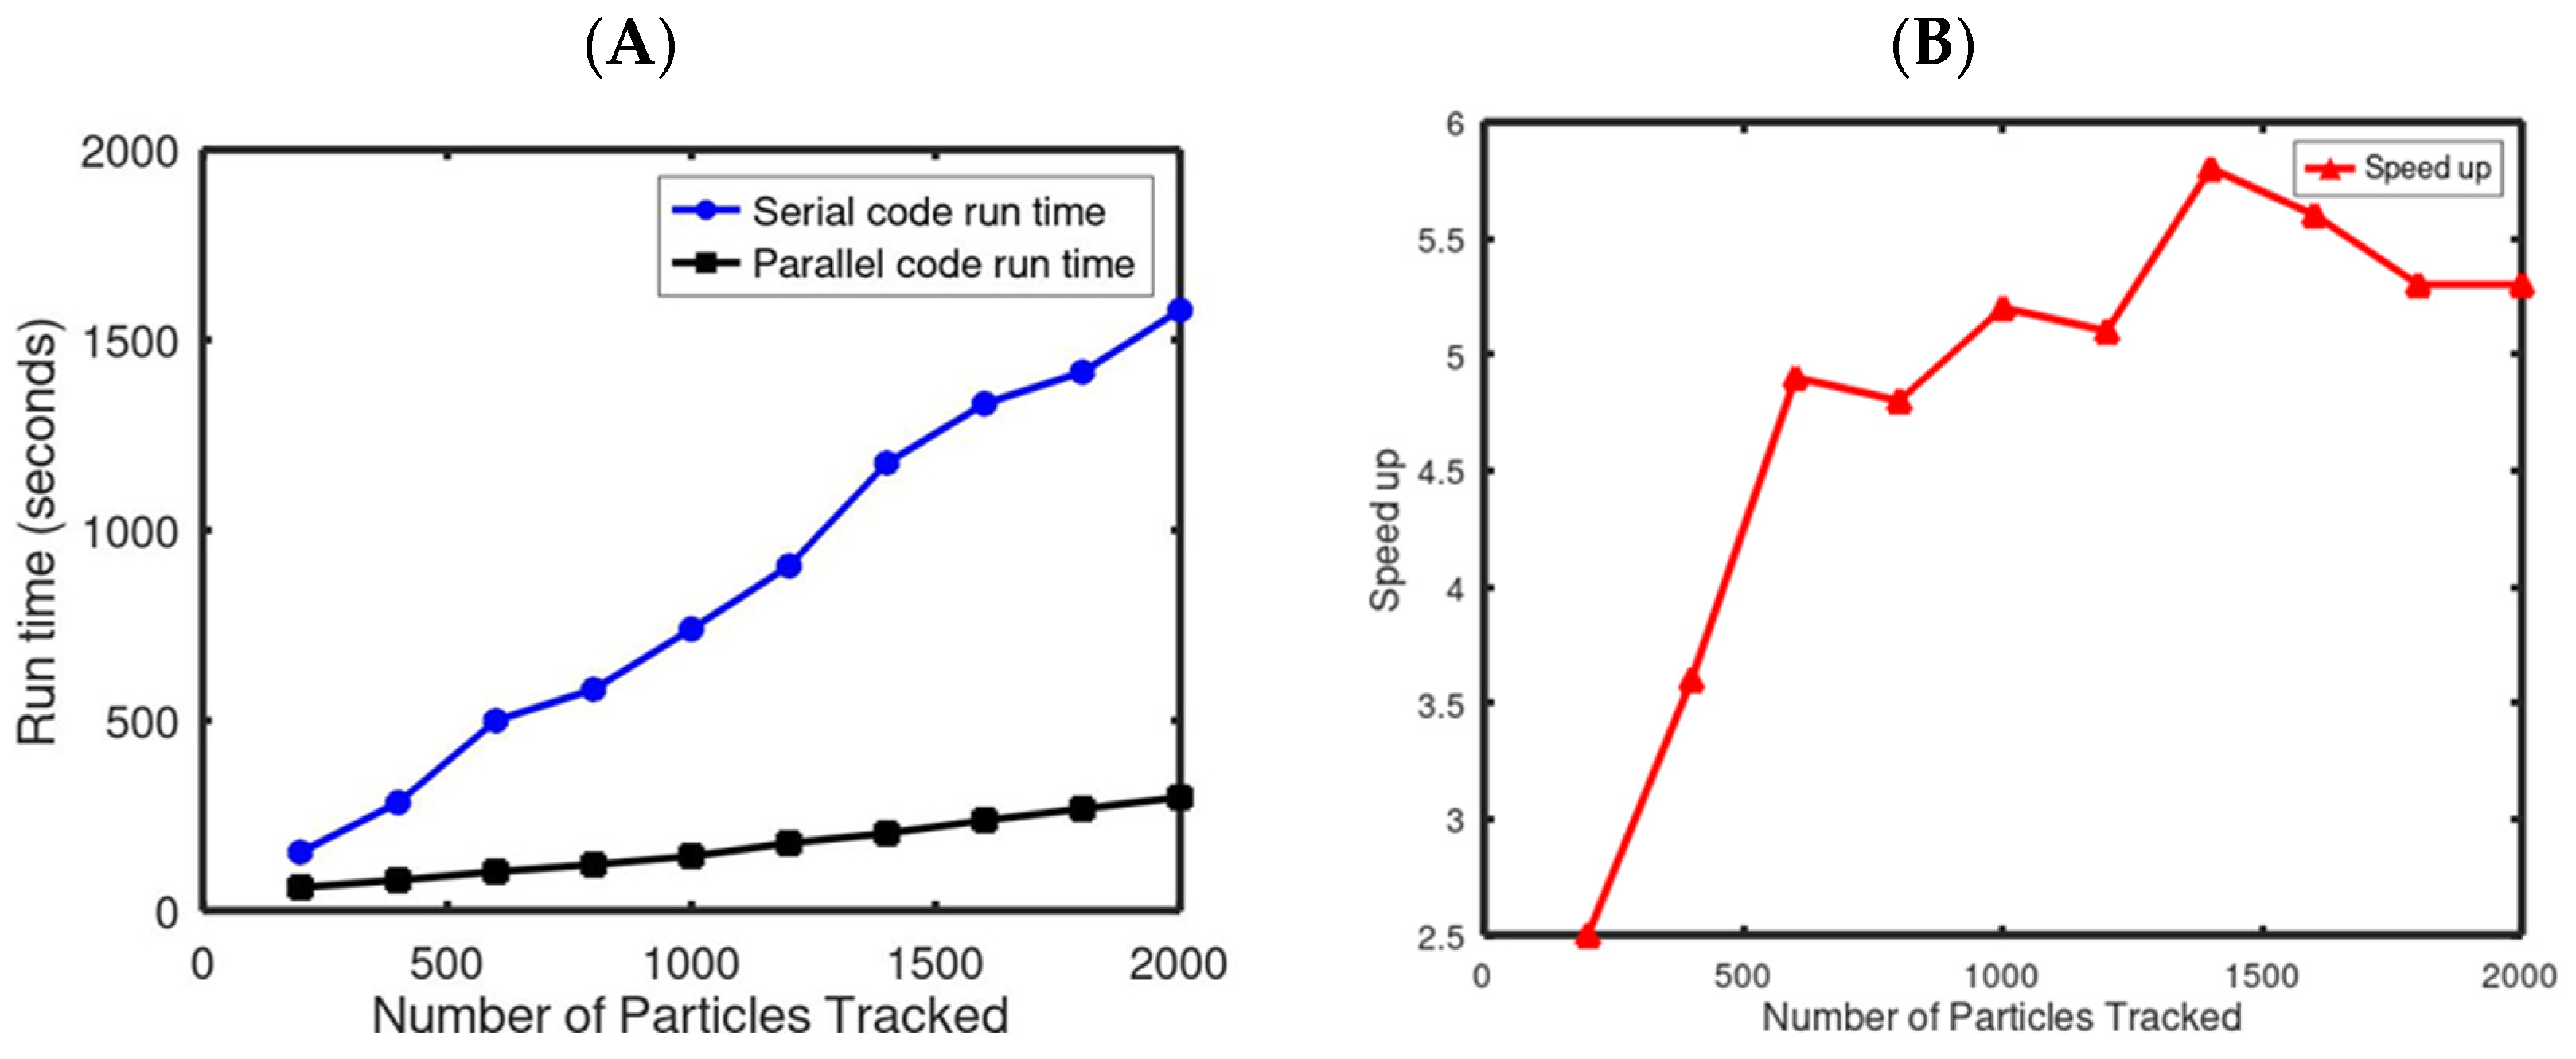
3.1. Benchmarking the Parallel Climatological Drifter-Based Sargassum Model

The benchmarking of the parallel Lagrangian drift model was performed using 34 parallel processes while reserving two virtual cores to handle overhead and other system processes, with the goal of achieving optimal system performance. The number of Lagrangian particles tracked varied between 200 and 2000 with increments of 200; this generated 10 different numerical experiments. The run time for the serial and parallel code was determined for each numerical experiment. Figure 2A shows a comparison of the run time for the two codes. The figure shows that the run time of the serial code (blue line) increases linearly as the number of particles tracked increases. This is because the serial code processes each particle sequentially, and the more particles there are, the longer it takes to process them all. The run time for simulating the trajectory of 200 and 2000 particles with the serial code was 153 s and 1579 s, respectively.
The run time of the parallel code (black line) increases more slowly as the number of particles tracked increases relative to the serial code. The parallel implementation distributes the task of processing the particles across multiple processors, which leads to more particles being tracked in a shorter amount of time than the serial code. The run time for simulating the trajectory of 200 and 2000 particles with the parallel code was 61 s and 298 s, respectively. Overall, the plot suggests that the parallel code is more efficient than the serial code for tracking a large number of particles.
Figure 2B shows the speed-up gained through implementation of parallel Lagrangian particle tracking. The speed-up was calculated by dividing the run time of the serial algorithm by the run time of the parallelized version. Intuitively, the increase in computational performance increases as the number of particles increases, from a factor of approximately 3 to 5. The plot shows that there is non-monotonicity in speed-up characteristics. This is likely attributable to the overhead required for communication and scheduling among multiple processes. While the algorithms were different, similar results testing the Python multiprocessing library were found in the work by [22,23].

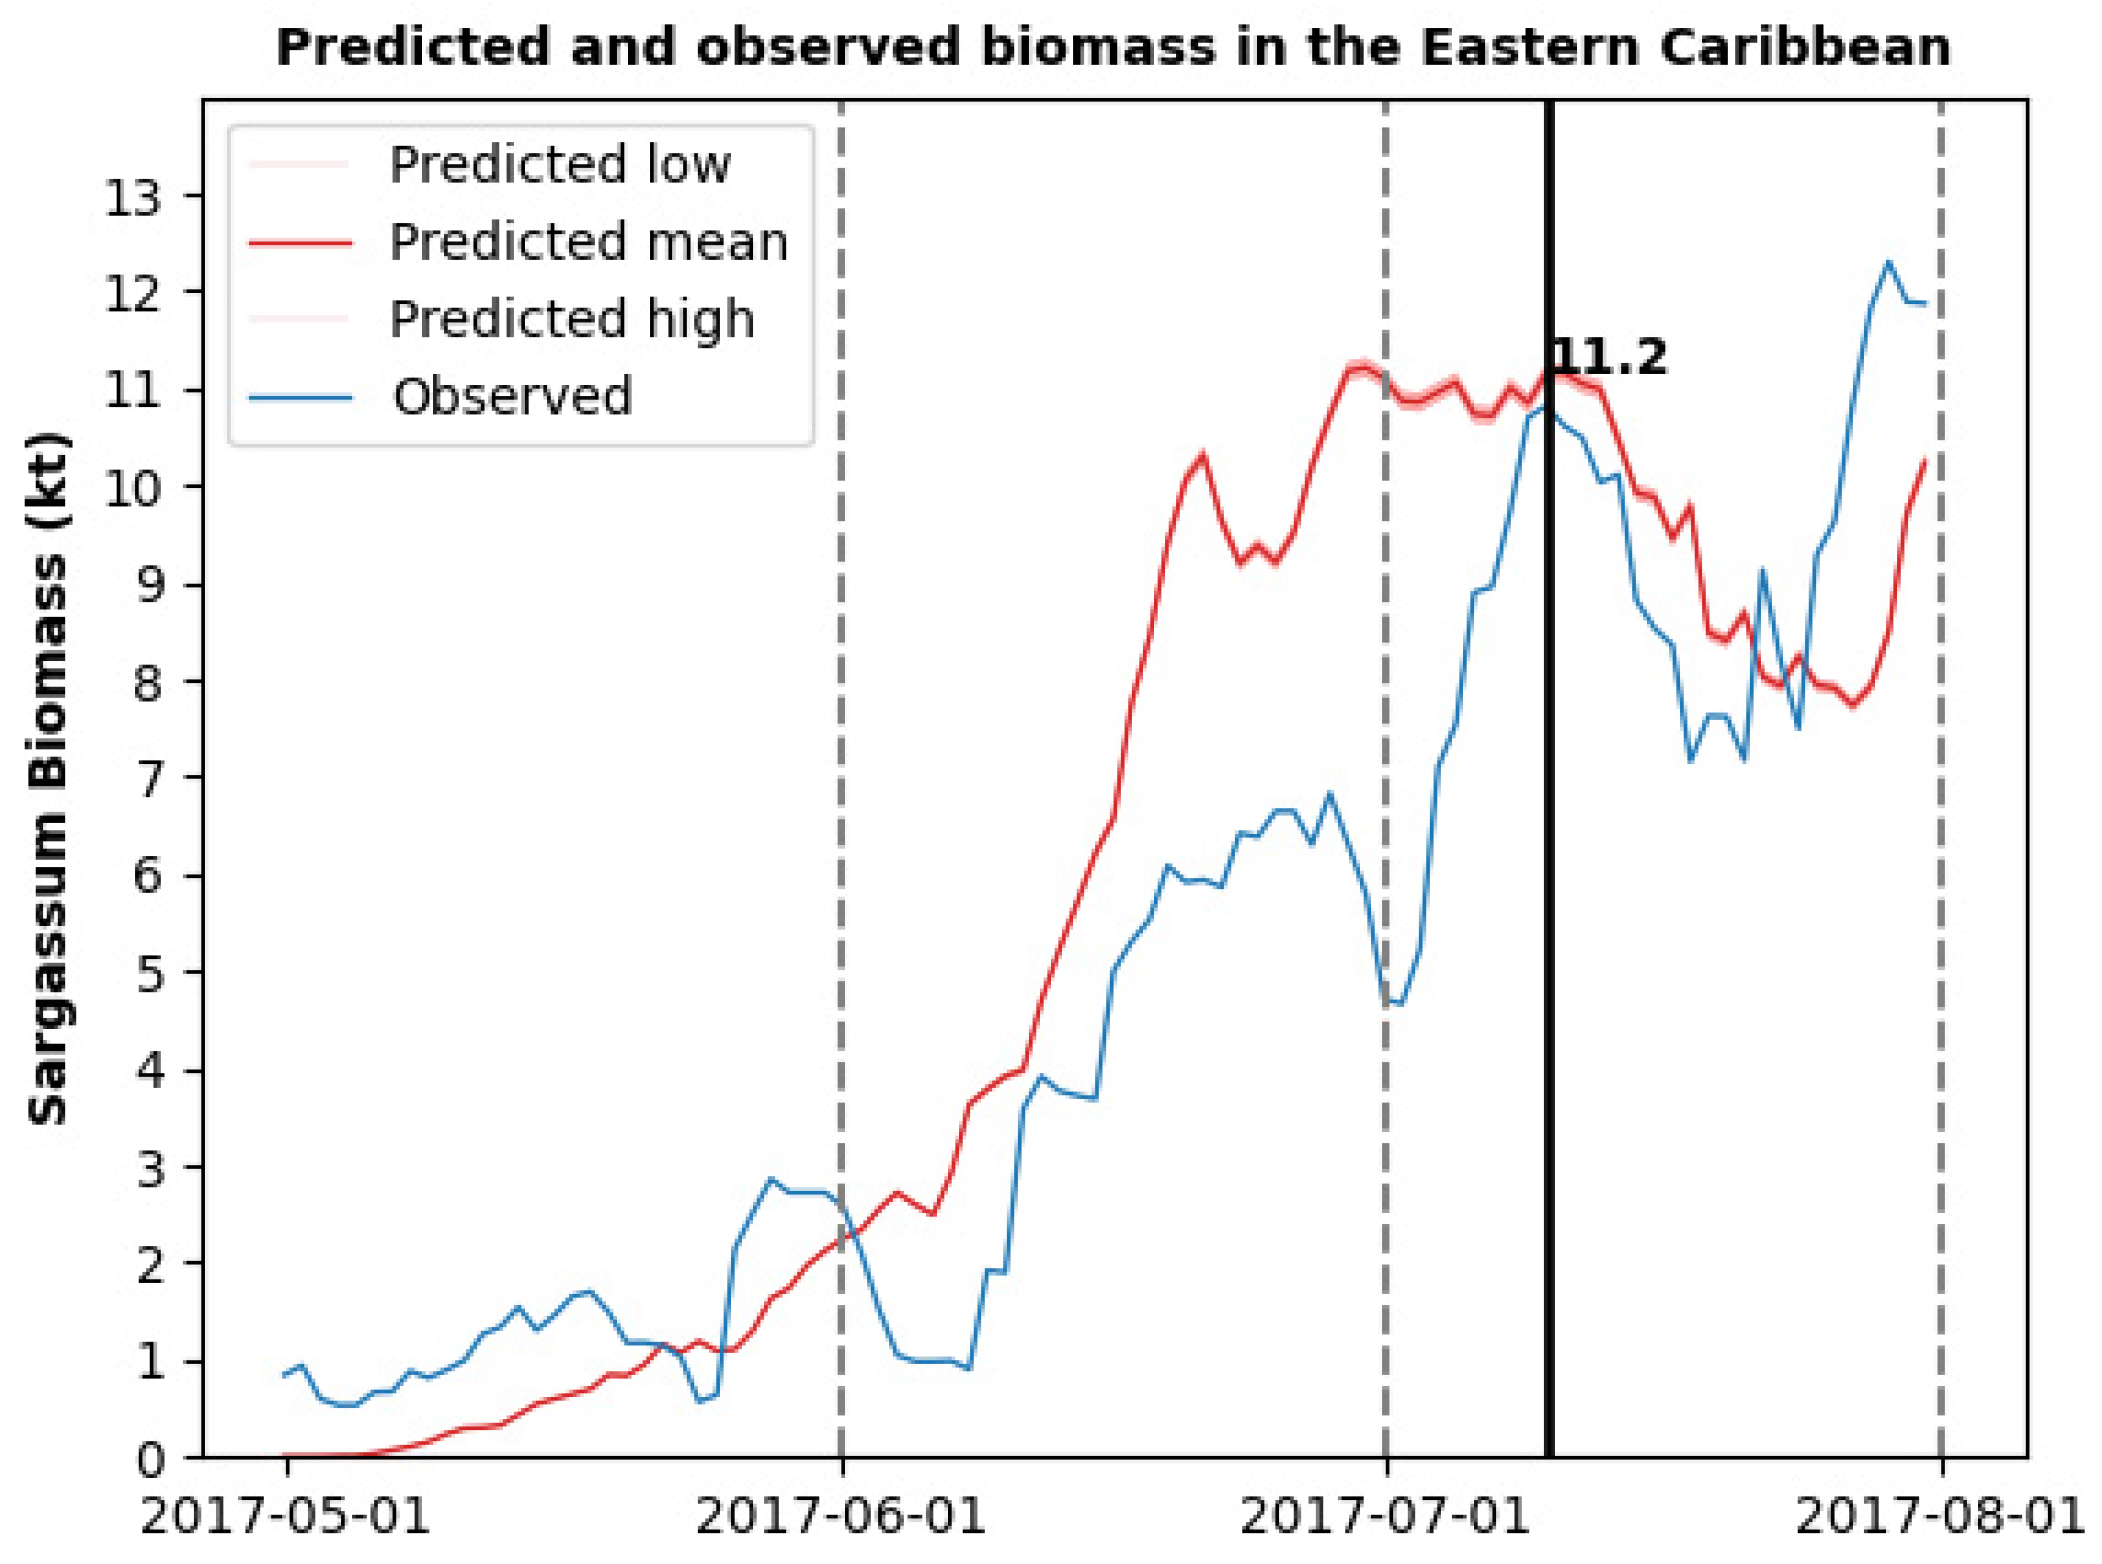
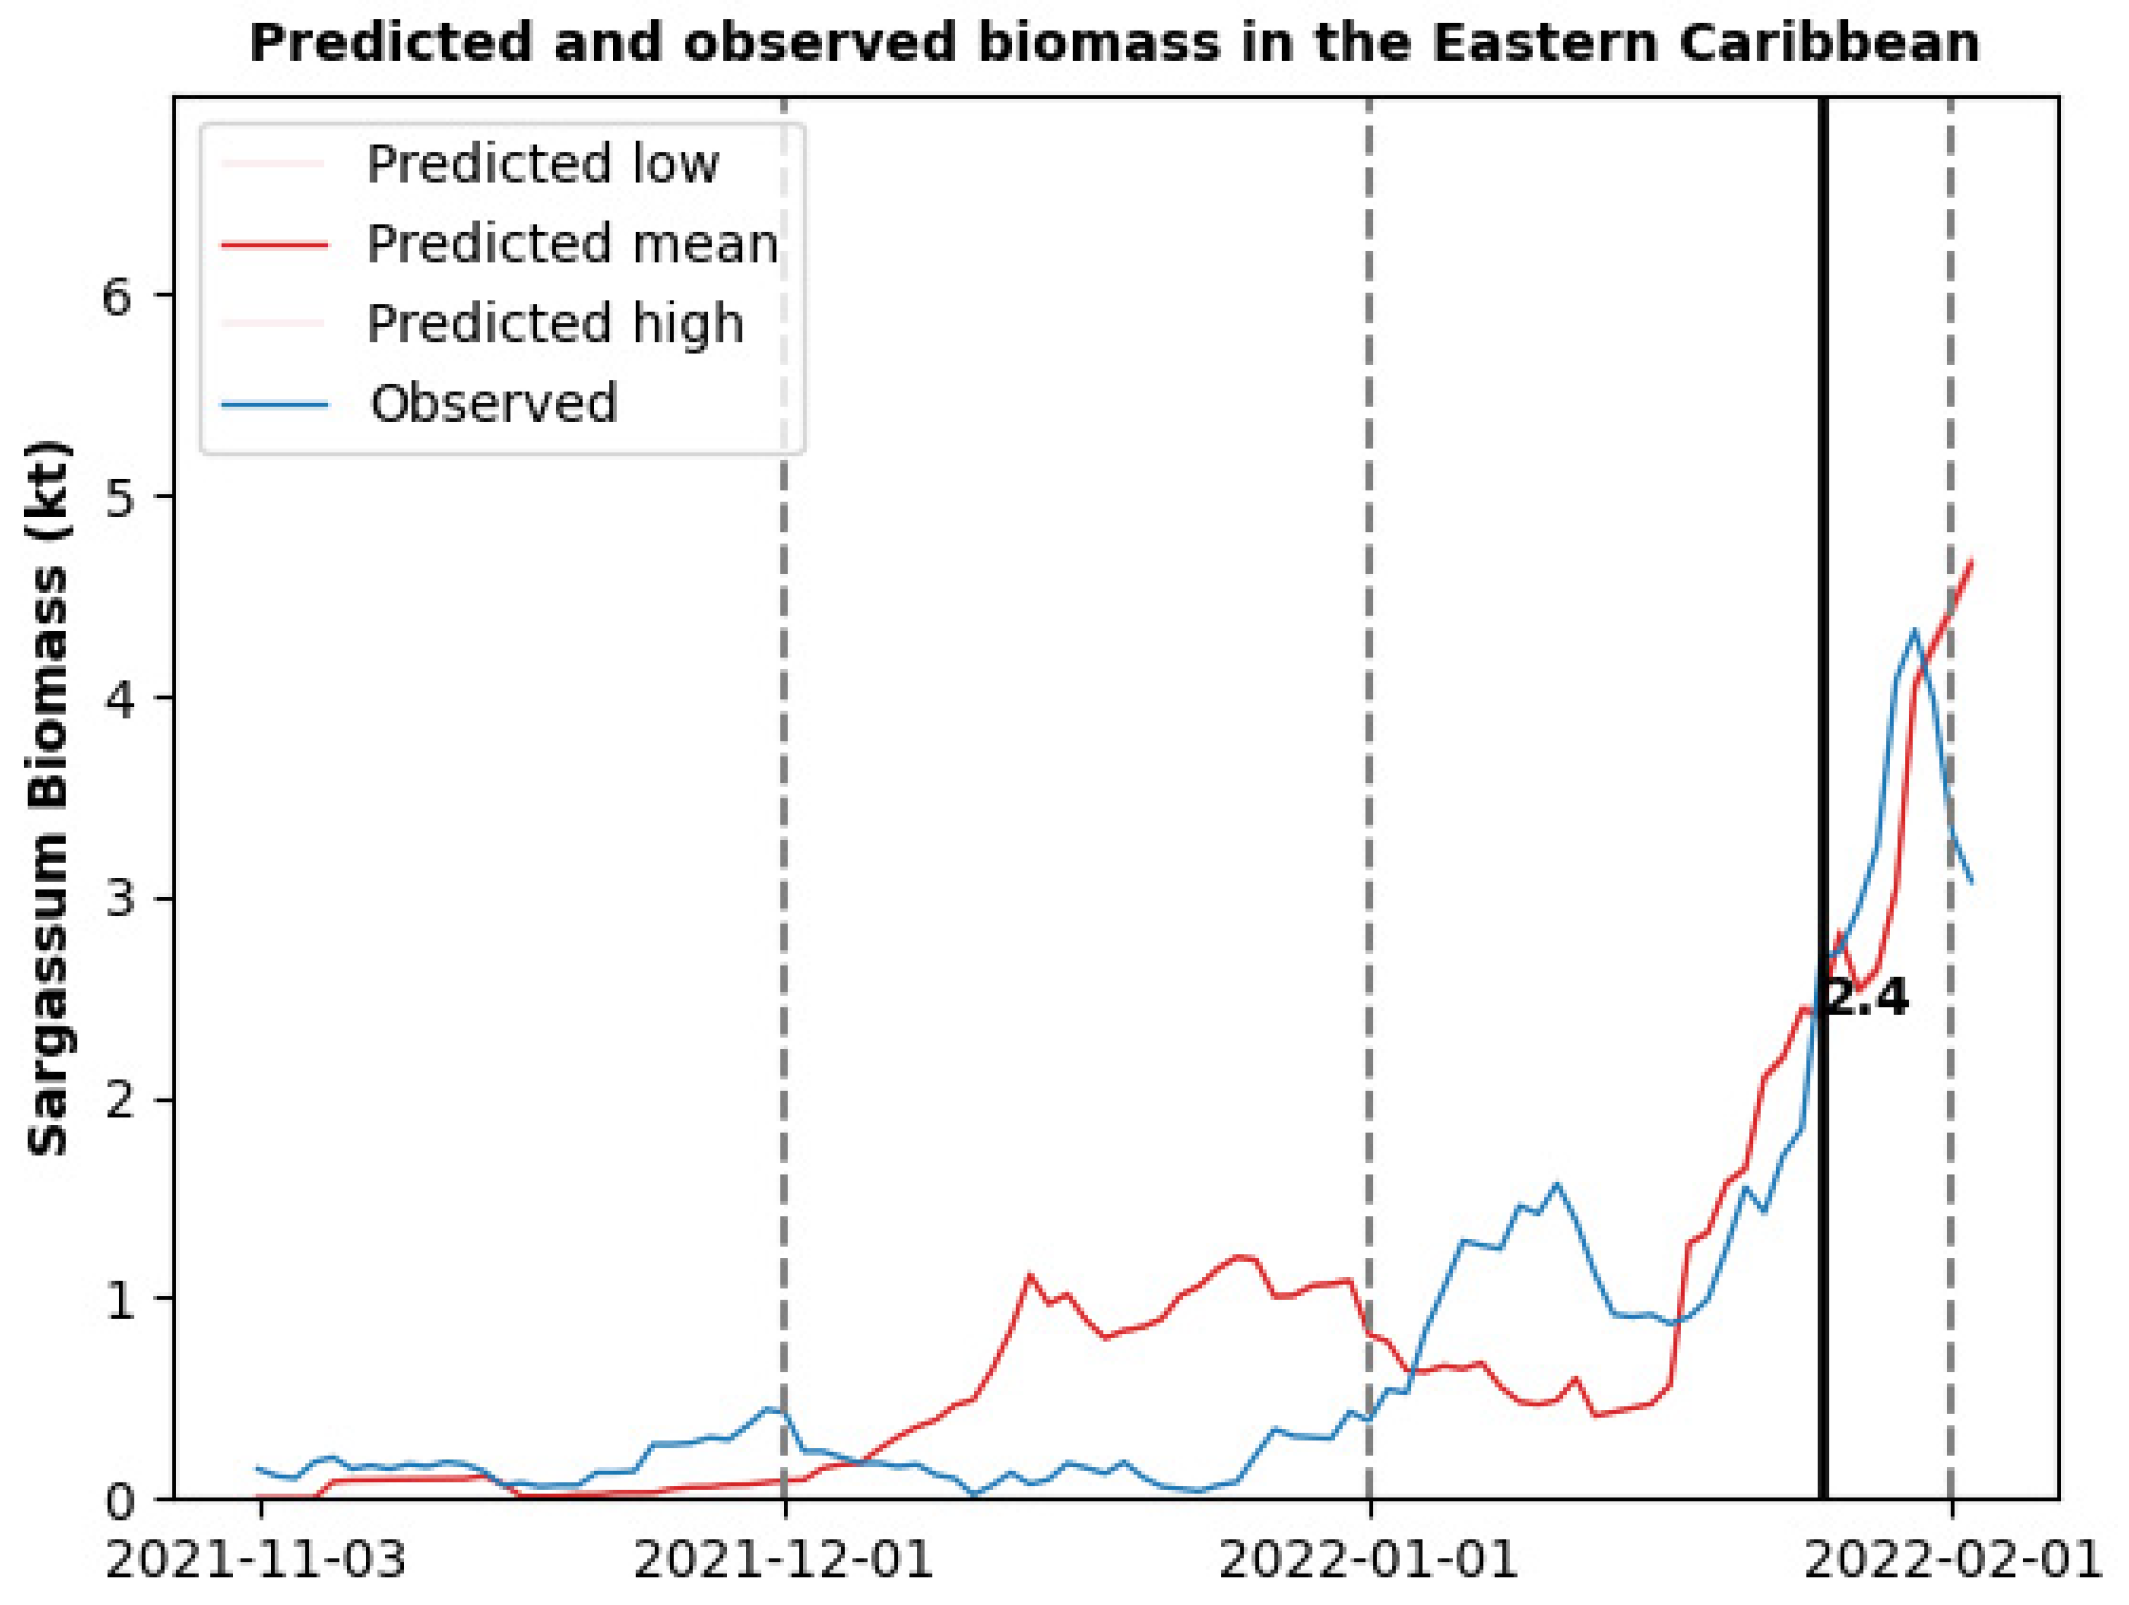
3.2. Sargassum Biomass Dynamics for a Single Morphotype

Figure 3 shows a comparison between the predicted and observed sargassum biomass dynamics for the period 1 May 2017 to 1 August 2017. This period was chosen because it overlaps with the simulation period found in Jouanno et al. (2021) [17], which allows for a comparison of results with one of the previous studies performed for a similar study area. Moreover, the sargassum biomass accumulation observed from AFAI satellite images shows dynamic behavior, as evidenced by periods with varying degrees of sargassum accumulation followed by declines. The model effectively captured the observed seasonal variations in sargassum biomass accumulation during the simulated period in early summer months between May and late June, followed by a subsequent decline between July and August. There was no inherent bias in the predictions, as indicated by periods where the model both overestimates and underestimates the observed biomass.
To match the observed biomass, the model parameterization required a mean maximum growth rate of 0.05 day−1 and mortality rate of 0.08 day−1 [0.06–0.1], consistent with previous experimental and computational studies. To explain the discrepancies between the predicted sargassum biomass dynamics and the observations, we plotted the biomass accumulation overlaid with the number of pixels identified as cloud cover in AFAI satellite imagery of the Eastern Caribbean prediction region, between longitudes 60.4° W and 65° W (Figure 4). There were three prominent peaks in cloud cover, which coincided with a decline in biomass accumulation. Differences between predicted and observed biomass accumulation were likely caused by an increased density in cloud cover, as shown in Figure 4, leading to underestimates of sargassum abundance.
To assess the impact of cloud cover on the degradation of model predictions, we simulated a period for which there was minimal cloud cover. The period chosen was from November 2021 to February 2022. The biomass accumulation was lower than for the summer period used in the previous computational experiment, which is consistent with the historical observations of peak abundance during the summer months. For periods with very little cloud cover, there was excellent correspondence between the model and observations (Figure 5). By contrast, the largest discrepancy between the predicted and observed sargassum biomass was for the period from December 2021 to early January 2022, coinciding with the highest cloud cover (Figure 6).

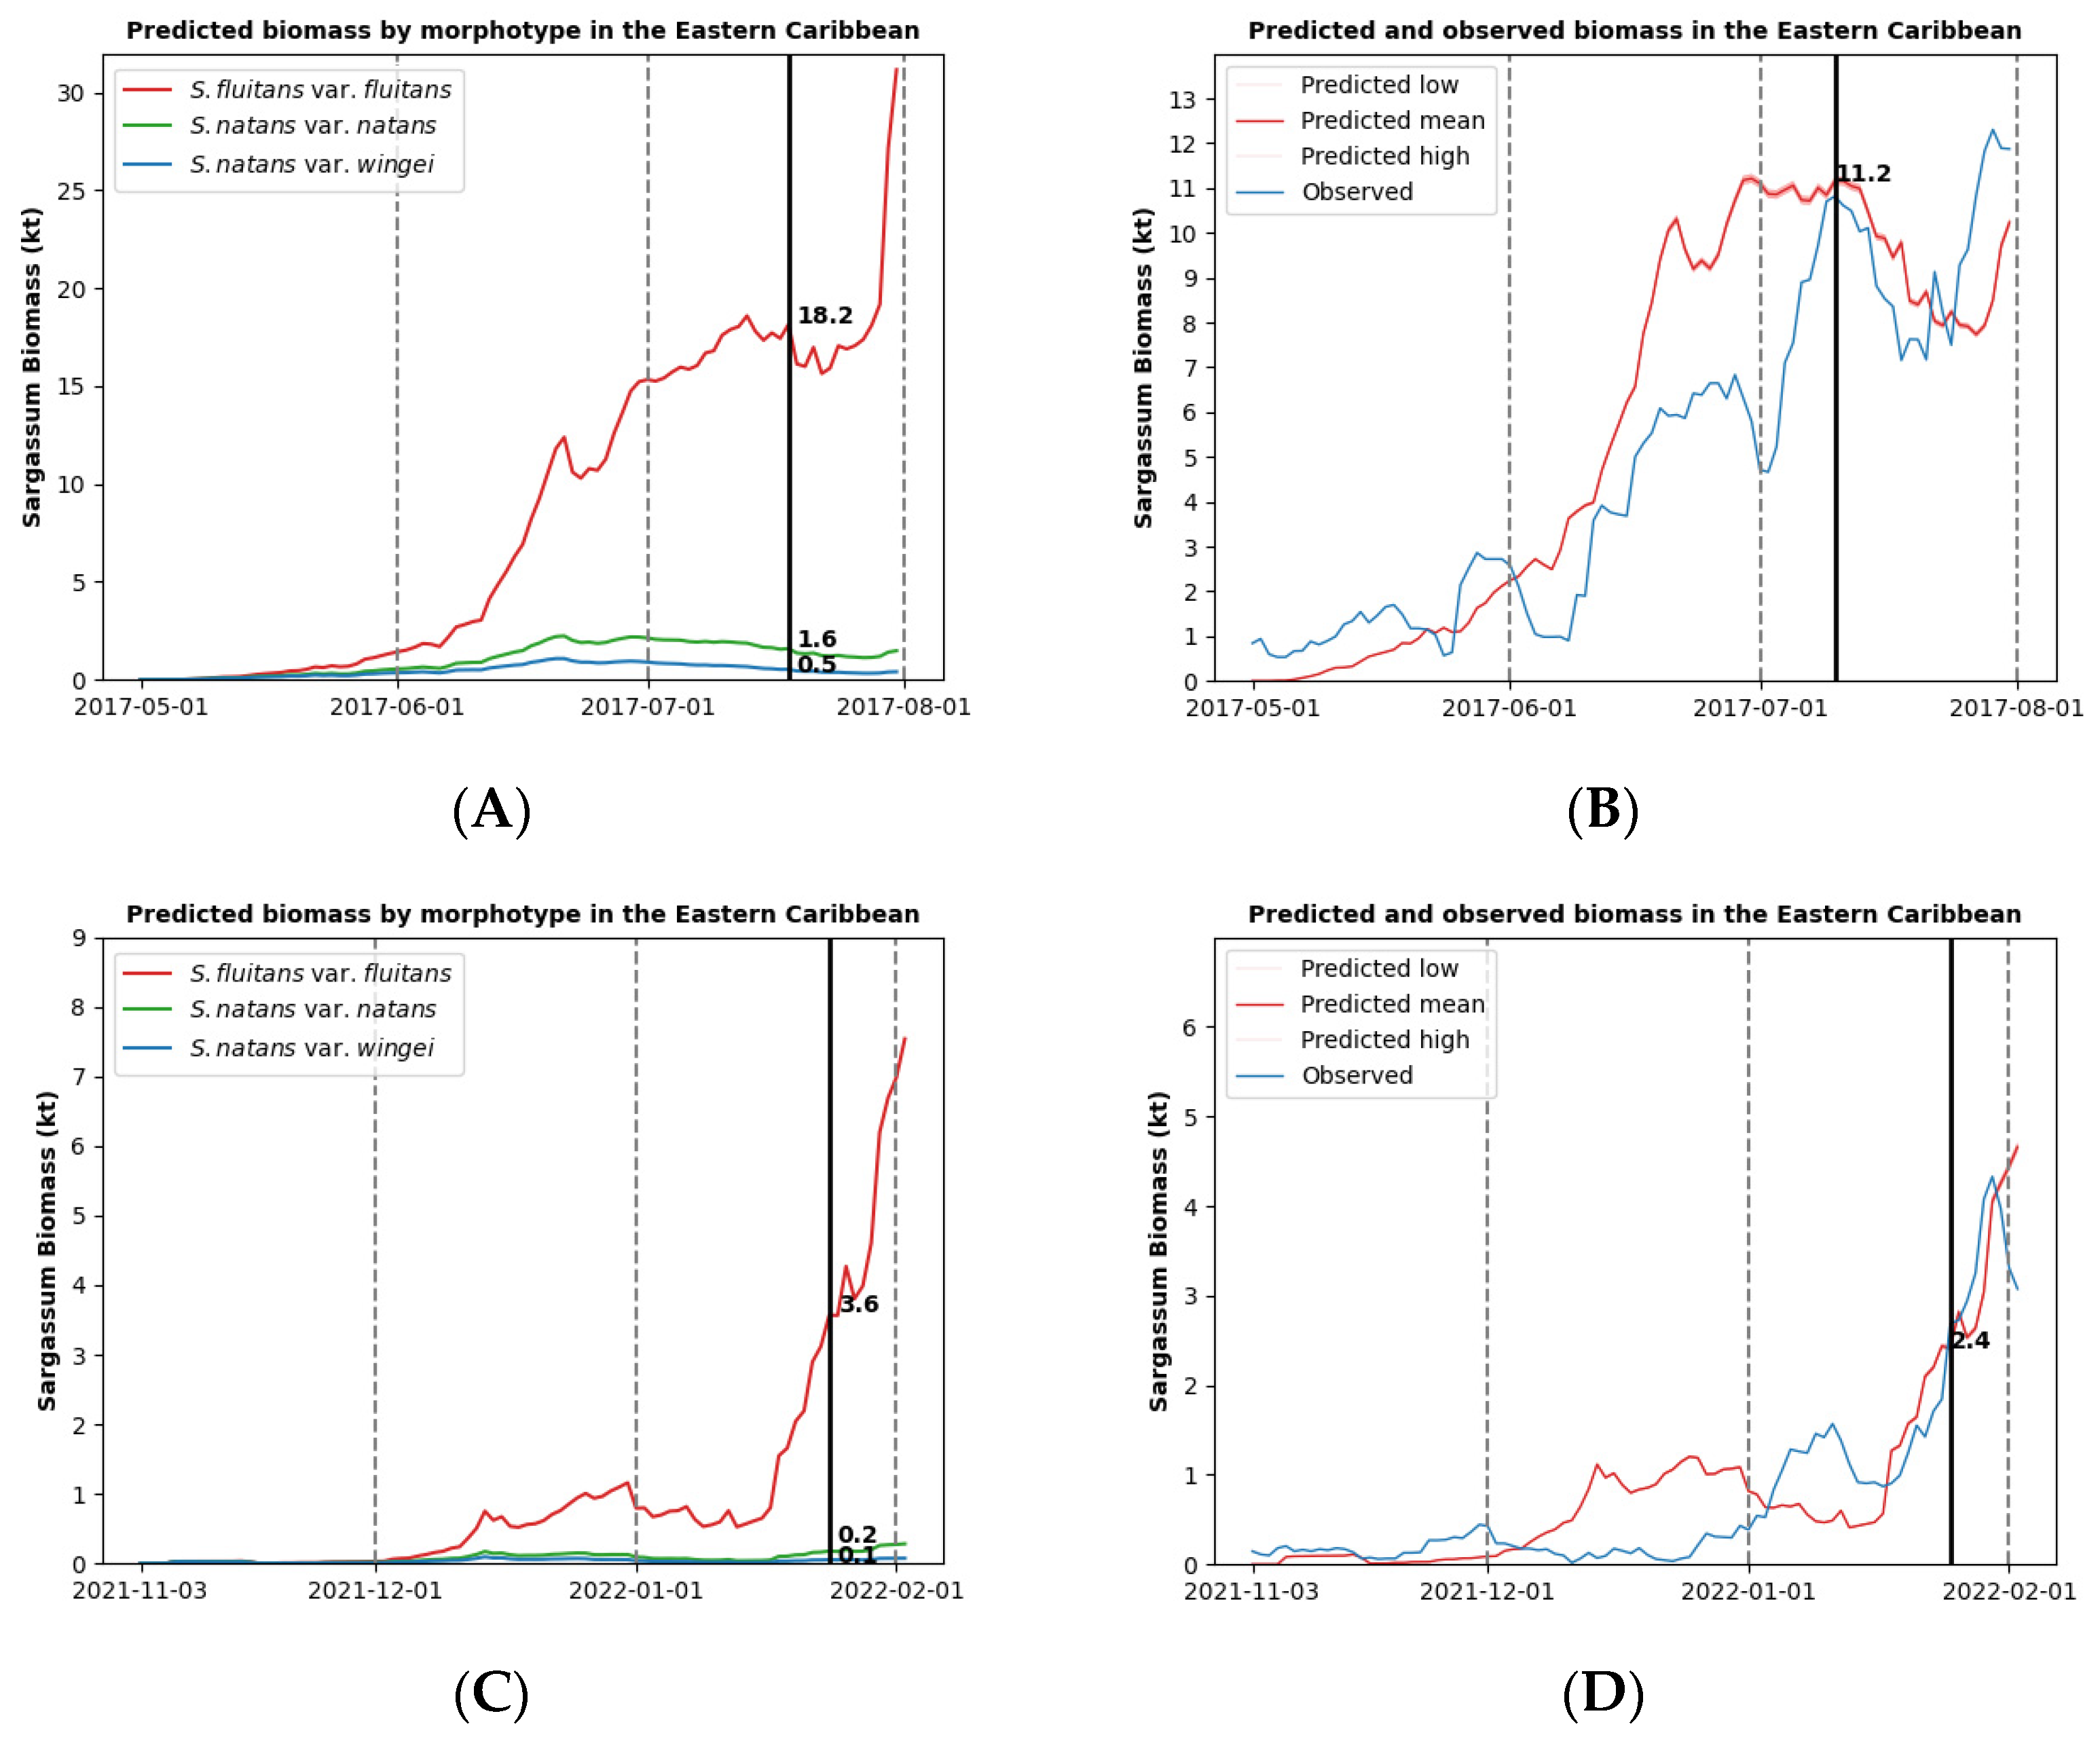
3.3. Sargassum Biomass Dynamics for Multiple Morphotypes

Seminal taxonomic research conducted by Parr (1939) delineated six distinct pelagic sargassum morphotypes, each distinguished by unique morphological features [24]. However, within the North Atlantic and Tropical Atlantic regions, only three of these morphotypes—Sargassum fluitans var. fluitans, Sargassum natans var. natans, and Sargassum natans var. wingei—are commonly encountered, as documented in [20,21,25]. Simulations were run to investigate sargassum biomass dynamics for the three morphotypes found within the study area over the two study periods, May–August 2017 and November-February 2021. A selective temperature-dependent growth model was applied to both study periods. Considering that along forecasted tracks, sargassum particles experience a range of SSTs encompassing ‘warm’ and ‘cool’ temperatures throughout both study periods, average growth rates for each morphotype were assigned values based on experimental data found in Corbin and Oxenford (2023) which showed different growth rates for warm and cool periods [21]. The datasets were therefore split about the mean SST of 27.45 °C, assigning warm-period growth rates to track points experiencing SSTs above the mean and cool-period growth rates to points at or below the mean. Furthermore, in the absence of empirical data on the initial detected biomass for each morphotype, we assume an equal initial distribution of 1/3 total biomass for each morphotype. These criteria were applied to both study periods. The initial relative biomass and growth rates are shown in Table 2.
The predictions of the fastest-growing morphotype, S. fluitans var. fluitans, as seen in Figure 7A,C, closely approximates the profiles of the overall prediction for the same period in Figure 7B,D. The experimental growth rates result in a combined biomass prediction of 20.3 kt for 10 July 2017 (A), compared to the 11.2 kt predicted by simulated rates (B). Similarly, for 25 January 2022, the prediction using experimental growth rates results in a combined biomass of 3.9 kt (C), compared to 2.4 kt using simulated rates (D).

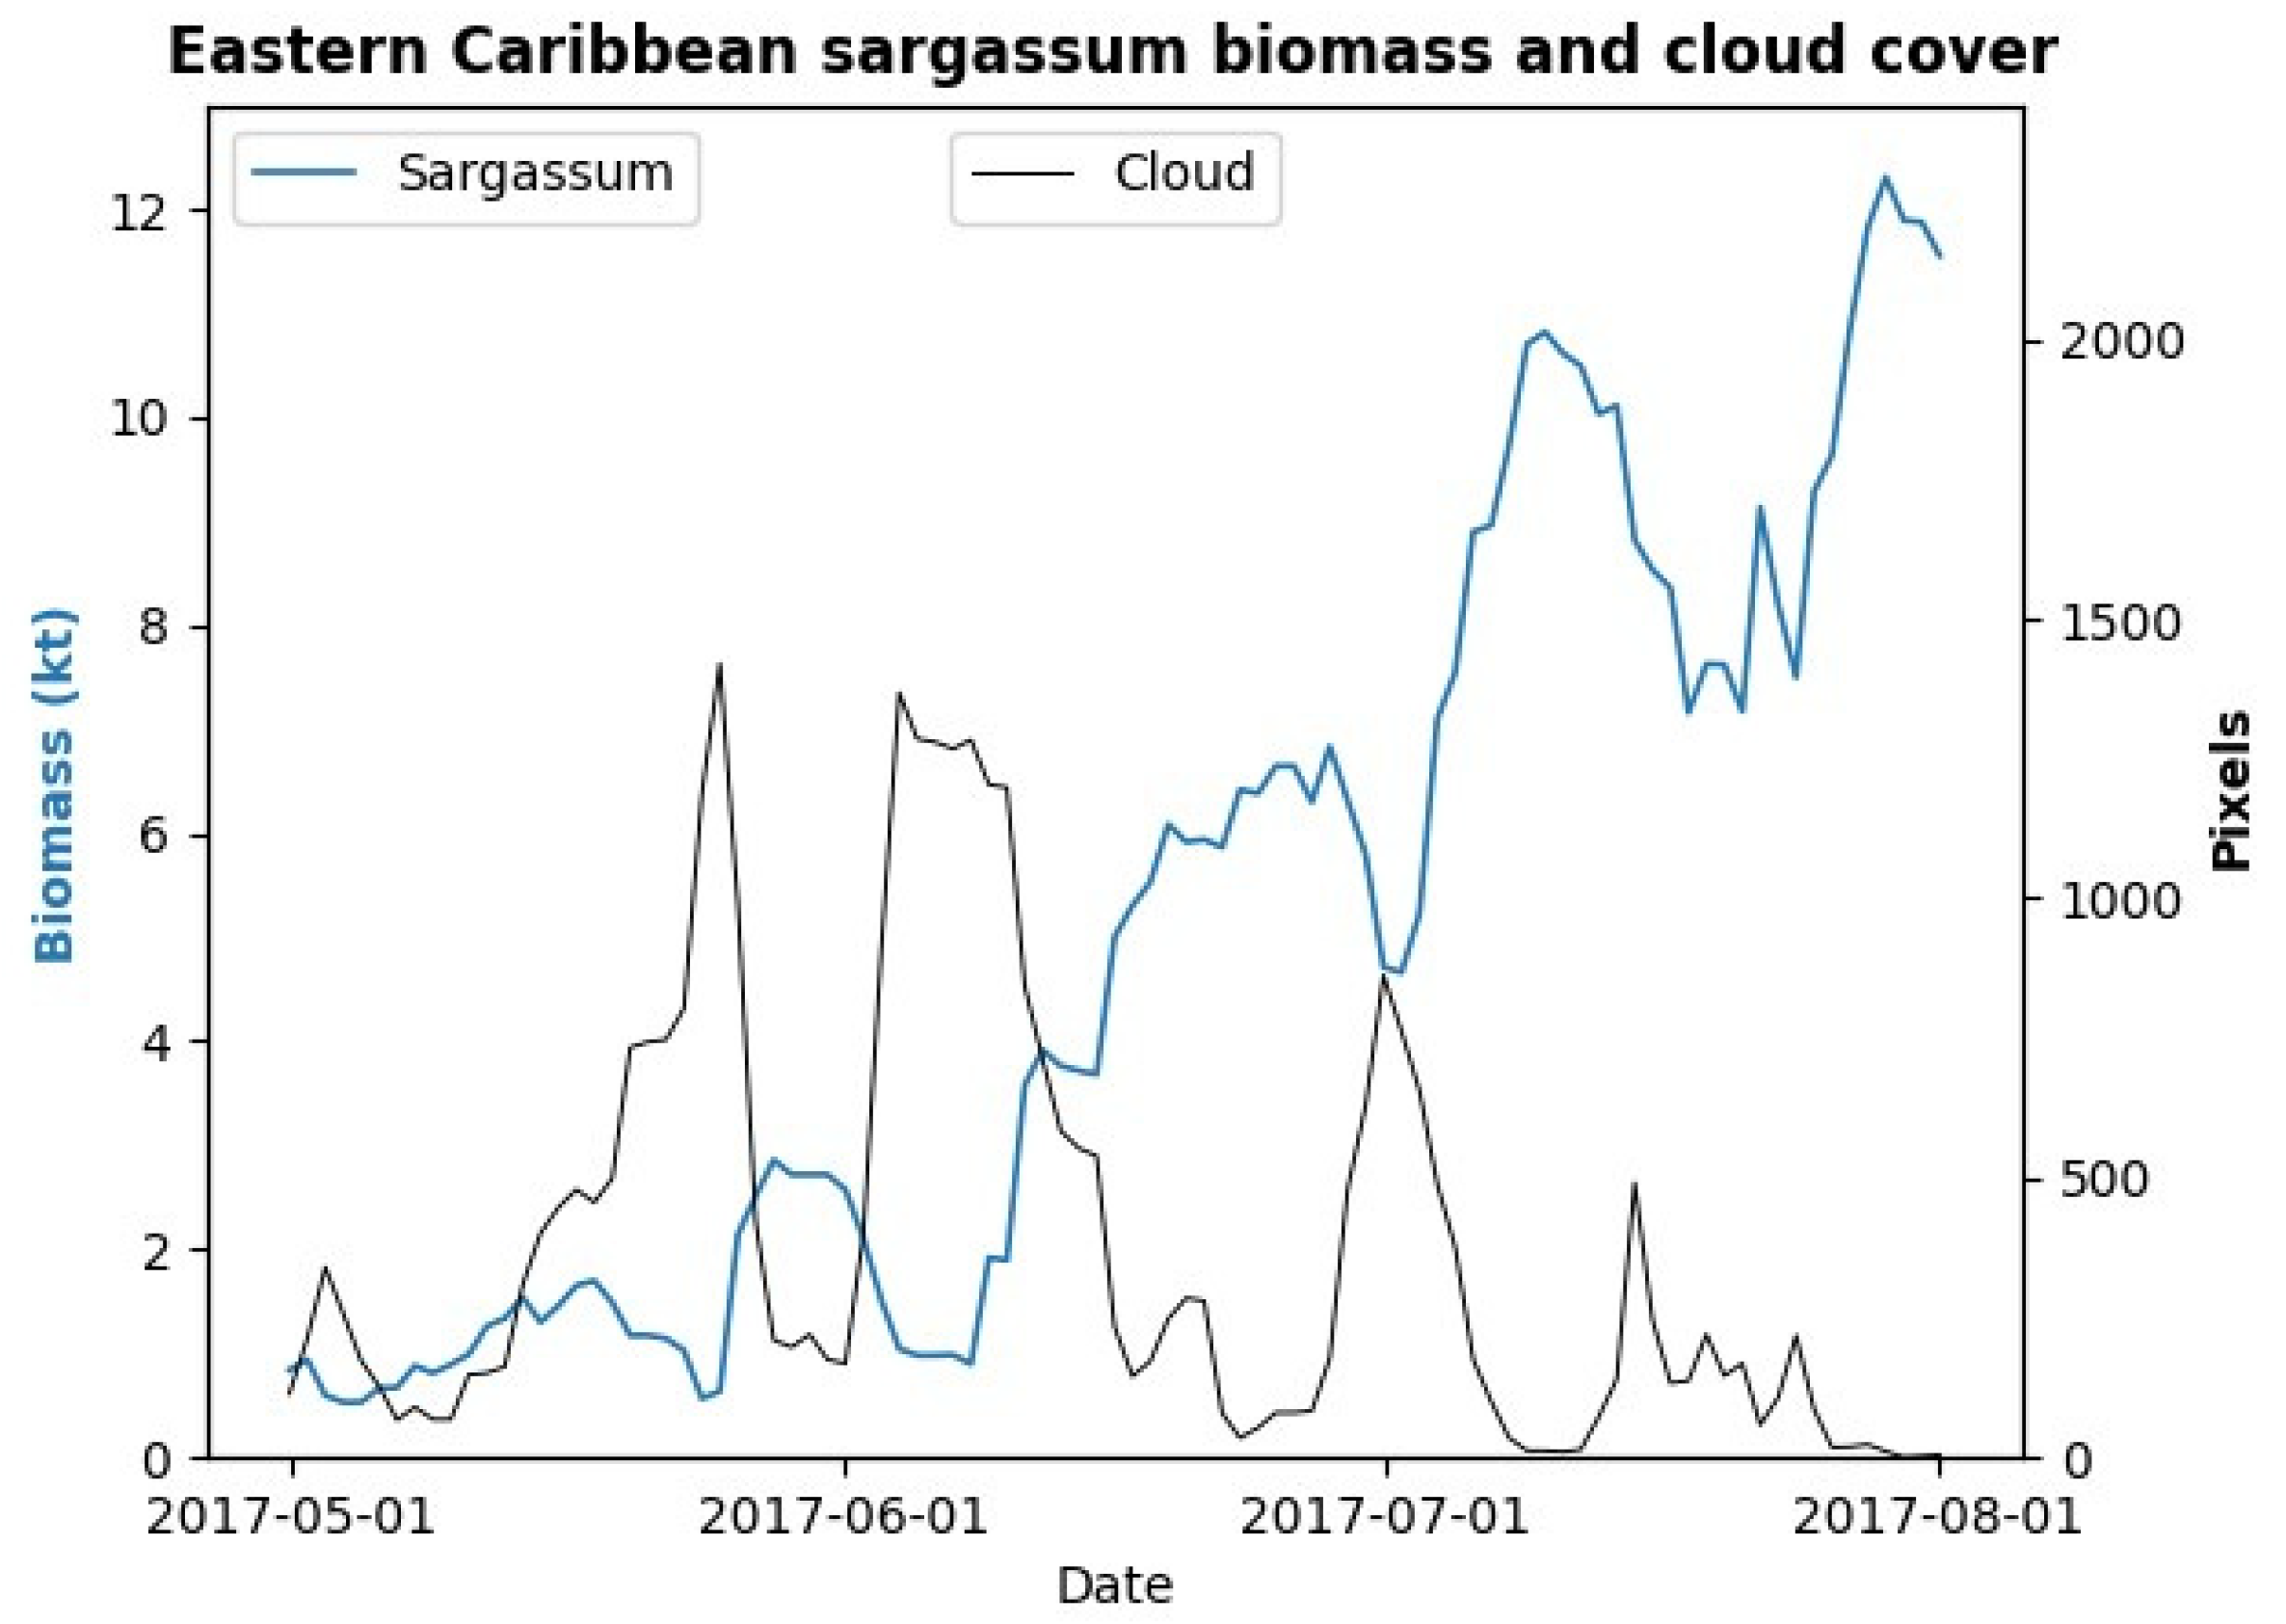
3.4. Limitations and Future Research Directions

Forecasts including the one developed in this study that depend on optical sensing have a limitation related to the resolution of satellite imagery and occlusion due to cloud cover. These limitations likely lead to an underestimation of sargassum abundance used as the initial condition for virtual particle seeding. Nonetheless, there are efforts using satellite imagery to support forecasts [26]. The utilization of high-resolution satellite radar is one of the approaches that would overcome the issue of cloud cover. Another key limitation is in the lack of understanding of growth and mortality rates of sargassum under various temperature conditions. Future research could be focused on long-term mesocosm studies that allow for better elucidation of seasonal influences on sargassum growth rates. The data from these studies would enhance the model parameterization, which would lead to more accurate estimates of biomass accumulation. Another future research direction to address this gap would be to couple the model developed herein with a near-shore coastal hydrodynamic model that describes advection processes as sargassum approaches coastlines. Determining morphotype composition at source and how this varies over time (seasons and years) would also fill a critical knowledge gap. Drone technology and satellite trackers deployed in sargassum mats would provide additional data to enhance model predictions. There is an increasing interest in AI techniques for simulating physical and chemical oceanographic processes. Deep learning is one type of AI technique that could prove useful in improving sargassum forecasts [27]. Long short-term memory neural networks could be used as a data-driven approach to forecast the growth and movement patterns of sargassum, leveraging historical data on oceanic conditions, sea surface temperatures, currents, and other relevant variables to generate accurate predictions. Physics-informed neural networks are also a promising deep learning technique that could be used to combine ocean data with the conservation laws governing physico-chemical and biological processes to provide high fidelity models of sargassum dynamics. Combining various data streams from satellite products as well as enhanced forecasting techniques would lead to an improved understanding of beaching events [28].

4. Conclusions

This is the first study to predict sargassum biomass accumulation within the Eastern Caribbean that accounts for spatial variability of SSTs and morphotype diversity of sargassum found within the study area. Another contribution of this study is implementing a parallelized climatological drifter-based model. This computationally efficient approach showed an approximately six-fold enhancement in program run time. This facilitated a computationally efficient investigation of sargassum growth and mortality dynamics. The findings show that the model accurately captures biomass dynamics, as shown by correspondence with satellite-derived sargassum biomass accumulation for two periods with different ambient temperature regimes. Moreover, simulations accounting for morphotype diversity show the growth dynamics of the faster-growing morphotype (S. fluitans var. fluitans) relative to slower-growing morphotypes (S. natans var. natans and S. natans var. wingei), which could provide invaluable data for valorization and response efforts.

Author Contributions

Conceptualization, K.P. and H.A.O.; methodology, K.P. and H.A.O.; software, K.P. and K.G.; validation, K.P., H.A.O. and K.G.; formal analysis, K.P., H.A.O. and K.G.; investigation, K.P., H.A.O. and K.G.; resources, K.P.; data curation, K.G.; writing—original draft preparation, K.P., H.A.O. and K.G.; writing—review and editing, K.P., H.A.O. and K.G.; visualization, K.P. and K.G.; supervision, K.P.; project administration, K.P. All authors have read and agreed to the published version of the manuscript.

Funding

This research received no external funding.

Institutional Review Board Statement

Not applicable.

Informed Consent Statement

Not applicable.

Data Availability Statement

The sea surface temperature (SST) data were extracted from the National Oceanographic and Atmospheric Administration (NOAA) National Centers for Environmental Information (NCEI) World Ocean Atlas (https://www.ncei.noaa.gov/access/world-ocean-atlas-2023/bin/woa23.pl (accessed on 18 June 2023)). The seven-day composite alternative floating algae index (AFAI) satellite image of the Central Atlantic from the University of South Florida (USF) Optical Oceanography Laboratory can be found at: https://optics.marine.usf.edu/cgi-bin/optics_data?roi=C_ATLANTIC&current=1 (accessed on 27 June 2024).

Acknowledgments

The authors would like to thank Donald Johnson for providing the serial version of the IDL code for the climatological drifter-based model. The authors also want to thank Shelly-Ann Cox for her guidance in understanding the computational steps involved in running the forward tracking model.

Conflicts of Interest

The authors declare no conflicts of interest.

References

  1. United Nations Environment Programme-Caribbean Environment Programme. Sargassum White Paper—Turning the crisis into an opportunity. In Proceedings of the Ninth Meeting of the Scientific and Technical Advisory Committee (STAC) to the Protocol Concerning Specially Protected Areas and Wildlife (SPAW) in the Wider Caribbean Region, Kingston, Jamaica, 17–19 March 2021.
  2. Rodríguez-Martínez, R.E.; Torres-Conde, E.G.; Jordán-Dahlgren, E. Pelagic Sargassum cleanup cost in Mexico. Ocean. Coast. Manag. 2023, 237, 106542. [Google Scholar] [CrossRef]
  3. Wang, M.; Hu, C.; Barnes, B.B.; Mitchum, G.; Lapointe, B.; Montoya, J.P. The great Atlantic Sargassum belt. Science 2019, 365, 83–87. [Google Scholar] [CrossRef] [PubMed]
  4. Skliris, N.; Marsh, R.; Addo, K.A.; Oxenford, H. Physical drivers of pelagic sargassum bloom interannual variability in the Central West Atlantic over 2010–2020. Ocean Dyn. 2022, 72, 383–404. [Google Scholar] [CrossRef]
  5. Maréchal, J.-P.; Hellio, C.; Hu, C. A simple, fast, and reliable method to predict Sargassum washing ashore in the Lesser Antilles. Remote Sens. Appl. Soc. Environ. 2017, 5, 54–63. [Google Scholar] [CrossRef]
  6. Desrochers, A.; Cox, S.A.; Oxenford, H.A.; Van Tussenbroek, B. Pelagic Sargassum—A Guide to Current and Potential Uses in the Caribbean; Food and Agriculture Organization: Rome, Italy, 2022. [Google Scholar]
  7. Oxenford, H.A.; Cox, S.-A.; van Tussenbroek, B.I.; Desrochers, A. Challenges of turning the sargassum crisis into gold: Current constraints and implications for the Caribbean. Phycology 2021, 1, 27–48. [Google Scholar] [CrossRef]
  8. Amador-Castro, F.; García-Cayuela, T.; Alper, H.S.; Rodriguez-Martinez, V.; Carrillo-Nieves, D. Valorization of pelagic sargassum biomass into sustainable applications: Current trends and challenges. J. Environ. Manag. 2021, 283, 112013. [Google Scholar] [CrossRef] [PubMed]
  9. Marsh, R.; Oxenford, H.A.; Cox, S.-A.L.; Johnson, D.R.; Bellamy, J. Forecasting seasonal sargassum events across the Tropical Atlantic: Overview and challenges. Front. Mar. Sci. 2022, 9, 914501. [Google Scholar] [CrossRef]
  10. de la Barreda-Bautista, B.; Metcalfe, S.E.; Smith, G.; Sjögersten, S.; Boyd, D.S.; Cerdeira-Estrada, S.; Lopez-Ramırez, P.; Magaldi, A.; Ressl, R.; Perera-Valderrama, S.; et al. Monitoring holopelagic Sargassum spp. along the Mexican Caribbean coast: Understanding and addressing user requirements for satellite remote sensing. Front. Mar. Sci. 2023, 10, 1166000. [Google Scholar] [CrossRef]
  11. Putman, N.F.; Beyea, R.T.; Iporac, L.A.R.; Triñanes, J.; Ackerman, E.G.; Olascoaga, M.J.; Appendini, C.M.; Arriaga, J.; Collado-Vides, L.; Lumpkin, R.; et al. Improving satellite monitoring of coastal inundations of pelagic Sargassum algae with wind and citizen science data. Aquat. Bot. 2023, 188, 103672. [Google Scholar] [CrossRef]
  12. Chassignet, E.P.; Hurlburt, H.E.; Smedstad, O.M.; Halliwell, G.R.; Hogan, P.J.; Wallcraft, A.J.; Baraille, R.; Bleck, R. The HYCOM (hybrid coordinate ocean model) data assimilative system. J. Mar. Syst. 2007, 65, 60–83. [Google Scholar] [CrossRef]
  13. Madec, G. NEMO Ocean Engine. Note du Pôle de Modélisation; Institut Pierre-Simon Laplace (IPSL): Guyancourt, France, 2016; Volume 27, pp. 1288–1619. [Google Scholar]
  14. Johnson, D.; Franks, J.; Oxenford, H.A.; Cox, S.-A. Pelagic sargassum prediction and marine connectivity in the Tropical Atlantic. Gulf Caribb. Res. 2020, 31, 20–30. [Google Scholar] [CrossRef]
  15. Podlejski, W.; Berline, L.; Nerini, D.; Doglioli, A.; Lett, C. A new Sargassum drift model derived from features tracking in MODIS images. Mar. Pollut. Bull. 2023, 188, 114629. [Google Scholar] [CrossRef] [PubMed]
  16. Hu, C.; Zhang, S.; Barnes, B.B.; Xie, Y.; Wang, M.; Cannizzaro, J.P.; English, D.C. Mapping and quantifying pelagic Sargassum in the Atlantic Ocean using multi-band medium-resolution satellite data and deep learning. Remote Sens. Environ. 2023, 289, 113515. [Google Scholar] [CrossRef]
  17. Jouanno, J.; Benshila, R.; Berline, L.; Soulié, A.; Radenac, M.H.; Morvan, G.; Diaz, F.; Sheinbaum, J.; Chevalier, C.; Thibaut, T.; et al. A NEMO-based model of Sargassum distribution in the Tropical Atlantic: Description of the model and sensitivity analysis (NEMO-Sarg1.0). Geosci. Model Dev. 2021, 14, 4069–4086. [Google Scholar] [CrossRef]
  18. Marsh, R.; Addo, K.A.; Jayson-Quashigah, P.N.; Oxenford, H.A.; Maxam, A.; Anderson, R.; Skliris, N.; Dash, J.; Tompkins, E.L. Seasonal predictions of holopelagic Sargassum across the Tropical Atlantic accounting for uncertainty in drivers and processes: The SARTRAC ensemble forecast system. Front. Mar. Sci. 2021, 8, 722524. [Google Scholar] [CrossRef]
  19. Magaña-Gallegos, E.; García-Sánchez, M.; Graham, C.; Olivos-Ortiz, A.; Siuda, A.N.; van Tussenbroek, B.I. Growth rates of pelagic Sargassum species in the Mexican Caribbean. Aquat. Bot. 2023, 185, 103614. [Google Scholar] [CrossRef]
  20. Siuda, A.N.; Blanfuné, A.; Dibner, S.; Verlaque, M.; Boudouresque, C.F.; Connan, S.; Goodwin, D.S.; Stiger-Pouvreau, V.; Viard, F.; Rousseau, F.; et al. Morphological and Molecular Characters Differentiate Common Morphotypes of Atlantic Holopelagic Sargassum. Phycology 2024, 4, 256–275. [Google Scholar] [CrossRef]
  21. Corbin, M.; Oxenford, H.A. Assessing growth of pelagic sargassum in the Tropical Atlantic. Aquat. Bot. 2023, 187, 103654. [Google Scholar] [CrossRef]
  22. Singh, N.; Browne, L.M.; Butler, R. Parallel astronomical data processing with Python: Recipes for multicore machines. Astron. Comput. 2013, 2, 1–10. [Google Scholar] [CrossRef]
  23. Abeykoon, S.K.; Lin, M.; Van Dam, K.K. Parallelizing X-ray photon correlation spectroscopy software tools using python multiprocessing. In Proceedings of the 2017 New York Scientific Data Summit (NYSDS), New York, NY, USA, 6–9 August 2017; pp. 1–10. [Google Scholar]
  24. Parr, A.E. Quantitative observations on the pelagic Sargassum vegetation of the western North Atlantic. Bull. Bingham Oceanogr. Coll. 1939, 6, 1–94. [Google Scholar]
  25. Godinez-Ortega, J.L.; Cuatlan-Cortes, J.V.; Lopez-Bautista, J.M.; van Tussenbroek, B.I. A natural history of floating Sargassum species (Sargasso) from Mexico. In Natural History and Ecology of Mexico and Central America; Hufnagel, L., Ed.; IntechOpen: London, UK, 2021; pp. 59–94. [Google Scholar] [CrossRef]
  26. Ody, A.; Thibaut, T.; Berline, L.; Changeux, T.; André, J.M.; Chevalier, C.; Blanfuné, A.; Blanchot, J.; Ruitton, S.; Stiger-Pouvreau, V.; et al. From in situ to satellite observations of pelagic Sargassum distribution and aggregation in the Tropical North Atlantic Ocean. PLoS ONE 2019, 14, e0222584. [Google Scholar] [CrossRef] [PubMed]
  27. Laval, M.; Belmouhcine, A.; Courtrai, L.; Descloitres, J.; Salazar-Garibay, A.; Schamberger, L.; Chevalier, C. Detection of sargassum from sentinel satellite sensors using deep learning approach. Remote Sens. 2023, 15, 1104. [Google Scholar] [CrossRef]
  28. Cailleau, S.; Bessières, L.; Chiendje, L.; Dubost, F.; Reffray, G.; Lellouche, J.M.; van Gennip, S.; Régnier, C.; Drevillon, M.; Tressol, M.; et al. CAR36, a regional high-resolution ocean forecasting system for improving drift and beaching of Sargassum in the Caribbean archipelago. Geosci. Model Dev. 2024, 17, 3157–3173. [Google Scholar] [CrossRef]
Figure 1. Map showing the Central Atlantic study area and the Eastern Caribbean prediction region (red outline).
Jmse 12 01214 g001
Figure 2. Comparison of run time of serial and parallel codes for tracking Lagrangian particles with particles varying between 200 and 2000 (A) and speed-up achieved through parallelization of Lagrangian tracking algorithm (B).
Jmse 12 01214 g002
Figure 3. Predicted (red line) and observed sargassum biomass (blue line) in the Eastern Caribbean for the period May–August 2017. The black line indicates the predicted biomass of 11.2 kt for 10 July 2017.
Jmse 12 01214 g003
Figure 4. Comparison of detected cloud cover (black line) and sargassum biomass (blue line) from satellite imagery for the period May–August 2017.
Jmse 12 01214 g004
Figure 5. Predicted (red line) and observed sargassum biomass (blue line) in the Eastern Caribbean for the period November 2021 to February 2022. The black line indicates the predicted biomass of 2.4 kt for 25 January 2022.
Jmse 12 01214 g005
Figure 6. Comparison of detected cloud cover (black line) and sargassum biomass (blue line) from satellite imagery for the period November 2021–February 2022.
Jmse 12 01214 g006
Figure 7. Comparison of biomass predictions for three morphotypes (left) and single-morphotype prediction and observation (right) for the period 1 May–1 August 2017 (A,B) and 3 November 2021–3 February 2022 (C,D). The black line indicates predictions for (A), 10 July 2017, 20.3 kt (S. fluitans var. fluitans—18.2 kt, S. natans var. natans—1.6 kt, and S. natans var. wingei—0.5 kt), compared to (B) 11.2 kt and (C) 25 January 2022, 3.9 kt (S. fluitans var. fluitans—3.6 kt, S. natans var. natans—0.2 kt, and S. natans var. wingei—0.1 kt) compared to (D) 2.4 kt.
Jmse 12 01214 g007
Table 1. Parameters used in the simulations for the single-morphotype growth and mortality model.
ParameterDescriptionRangeUnit
TminGrowth ceases below this temperature10–14°C
TmaxGrowth ceases above this temperature40–50°C
ToptOptimum temperature for growth22–27°C
µmaxMaximum carbon uptake rate0.029–0.080d−1
mMaximum mortality rate0.06–0.10d−1
λmTemperature-dependent mortality coefficient0.25–0.65
Parameters adapted from data presented in Jouanno et al. (2021) [17].
Table 2. Parameters used for morphotype biomass predictions.
ParameterS. fluitans var. fluitansS. natans var. natansS. natans var. wingei
Initial biomass fraction0.30.30.3
Warm growth rate0.0600.0420.029
Cool growth rate0.0980.0510.035
Disclaimer/Publisher’s Note: The statements, opinions and data contained in all publications are solely those of the individual author(s) and contributor(s) and not of MDPI and/or the editor(s). MDPI and/or the editor(s) disclaim responsibility for any injury to people or property resulting from any ideas, methods, instructions or products referred to in the content.

