Abstract
With increasing environmental pollution from ship exhaust emissions and increasingly stringent International Maritime Organization carbon regulations, there is a growing demand for cleaner and lower-carbon fuels and near-zero-emission marine engines worldwide. Liquefied natural gas is a low-carbon fuel, and when liquefied natural gas (LNG) is used on ships, dual-fuel methods are often used. The pre-chamber plays a key role in the working process of dual-fuel engines. In this paper, an effective three-dimensional simulation model based on the actual operating conditions and structural characteristics of a marine low-pressure dual-fuel engine is established. In addition, the effects of changing the Precombustion chamber (PCC) volume ratio and the PCC orifice diameter ratio on the mixture composition, engine combustion performance, and pollutant generation were thoroughly investigated. It was found that a small PPC volume ratio resulted in a higher flame jet velocity, a shorter stagnation period, and an acceleration of the combustion process in the main combustion chamber. When the PCC volume was large, the Nitrogen oxygen (NOx) ratio emission was elevated. Moreover, the angle of the PCC orifice affected the flame propagation direction of the pilot fuel. Optimizing the angle of the PCC orifice can improve combustion efficiency and reduce the generation of NOx. Furthermore, reasonable arrangement of the PCC structure can improve the stability of ignition performance and accelerate the flame jet velocity.
1. Introduction
In recent years, with the development of international globalized trade and the shipping industry, the environmental hazards of ship exhaust emissions have become increasingly serious [1,2]. Therefore, in April 2018, the International Maritime Organization (IMO) adopted a preliminary strategy for greenhouse gas emission reduction from ships, which aims at reducing the carbon emission intensity of internationally navigated ships by at least 40% by 2030 compared to 2008 and seeks to reduce carbon emissions by 70% by 2050. As the IMO emission regulations become increasingly stringent, reducing carbon emissions from ships becomes urgent [3,4]. The MARPOL Convention requires that all ships calculate their existing attained Energy Efficiency Index (attained EEXI) to measure ship energy efficiency and begin collecting data to report their annual operational Carbon Intensity Indicator (CII) from 1 January 2023.
In November 2021, the United Nations Climate Change Conference (COP-26) agreed on the common goal that in order to limit the rise in global temperatures to 1.5 °C above pre-industrial levels, all countries need to take immediate additional measures [5,6]. On 3–7 July 2023, the 80th marine environment protection committee session (MEPC 80) was held in London, UK. The meeting adopted the newly revised “Greenhouse Gas Emission Reduction Strategy for Ships to 2023”, put forward a new target of “reaching net zero emissions close to 2050”, and formulated a timetable for medium-term emission reduction measures to come into effect. Green shipping is the future development trend of the global shipping industry, and LNG is an internationally recognized low-carbon fuel, which is a transitional key fuel for achieving the carbon emission reduction target of the shipping industry [7,8].
The research on low-carbon fuels and near-zero-emission internal combustion engines has attracted more and more attention, which puts forward higher standards and requirements for ship power plants [9,10,11]. In recent years, several researchers have studied the application of engine control strategies in natural gas (NG)–diesel dual-fuel (DF) mode. Lebedevas et al. [12] investigated the combustion and emission characteristics of an NG–diesel DF engine through experiments. Under high load conditions, the DF combustion mode at the optimum point of Start of Injection (SOI) reduced NOx and hydrocarbon (HC) emissions by 15–25% and CO2 emissions by 8–16%, but CO emissions increased by six times compared to the diesel-only combustion mode. Liu et al. [13] studied the effects of different lead fuel injection volumes and injection moments on the combustion and emission characteristics of an NG–diesel DF engine. The results showed that the DF combustion mode significantly reduced NOx and PM emissions compared to the diesel combustion mode; however, HC emissions were significantly higher: 90% resulted from unburned methane. Raihan et al. [14] experimentally investigated the effects of the pilot fuel injection moment, inlet pressure, and pilot fuel injection pressure on the combustion and emission characteristics of diesel–methane DF engine. The results showed that NOx emissions could be effectively reduced when the pilot fuel injection moment was advanced. The above studies indicate that the diesel–LNG DF engine can reduce carbon emissions, but methane escape still exists.
Wu et al. [15] numerically investigated the effect of methane value on the combustion performance of a natural gas–diesel dual-fuel engine, and the results showed that the diesel ignition mode was more sensitive to changes in methane value. Kokabi et al. [16] numerically investigated the effect of adding hydrogen and propane on the combustion and emission characteristics of the engine. The results showed that CO and HC emissions can be reduced, and peak in-cylinder pressure can be increased by injecting fuel earlier and adding hydrogen or propane. Kakaee et al. [17] numerically investigated the effect of two natural gas fractions on engine combustion and emissions. It was found that the peak pressure and NOx emissions increased while CO and HC emissions decreased as the Wobbe number increased.
Computational Fluid Dynamics (CFD) technology has been developing rapidly in recent years, and the use of numerical simulation can effectively reduce the cost and shorten the research and development cycle [18,19,20]. Amin Maghbouli et al. [21] simulated the in-cylinder combustion process of a two-stroke DF engine by using three-dimensional (3D) CFD coupled with detailed chemical kinetics. They reported that NOx and CO emission concentrations tended to increase when the increase in the amount of pilot fuel led to delayed ignition, and when the amount of pilot fuel injected was higher, there was an increase in the peak in-cylinder pressure.
There is limited research on CFD simulating the ignition characteristics of PCCs for two-stroke marine engines. In this paper, natural gas, a low-carbon alternative fuel, is combined with novel combustion system optimization to simultaneously meet carbon reduction needs by using the CFD software Converge 3.0.
In the current global decarbonization energy context of carbon peaking and carbon neutrality, the use of low-carbon Fuel LNG for marine low-speed two-stroke engines is a realistic and feasible option [22,23]. This option can progressively meet the IMO’s target of 40% carbon emission reduction in the marine industry by 2030 [24]. Although natural gas–diesel DF engines have excellent combustion and emission performance, there are still some problems in their combustion process control and high load condition expansion [25,26]. In this paper, an effective 3D model is established using the CFD software Converge based on the operation conditions and structural characteristics of a marine low-pressure dual-fuel (LP-DF) engine to compare and analyze the effects of changing the PPC volume ratio and PCC orifice diameter ratio on the mixture components, the combustion performance of the engine, and the generation of pollutants. The research results of this paper can provide a reference for the optimized design of the PCC of a marine LP-DF engine.
2. CFD Modeling and Validation
2.1. Test Bench
The WinGD RT-flex50DF (made in Guangxi YC Diesel, China) used in the experiments is a two-stroke, large-bore marine LP-DF engine. The main parameters of the RT-flex50DF engine are shown in Table 1. The engine is designed with a direct current (DC)-scavenging design, which allows it to run on heavy fuel oil and has a very long stroke (stroke/bore over 4:1). The engine uses a common rail injection system, an electronically controlled hydraulic injection system, and a safe and reliable fuel supply system. The RT-flex50DF engine adopts a single-stage turbocharger, model ABB A165-L (ABB, Swiss, Baden, Switzerland). The air cooler is a single-stage water-cooled design, model KLQC418 (Made in Jiangsu, China).

Table 1.
Dimensions of a WinGD RT-flex50DF-tested diesel engine.
The boundary and initial conditions according to the RT-flex50DF LP-DF engine are shown in Table 2. The ambient temperature was 32.3 °C, the ambient atmospheric pressure was 101.01 kPa, and the relative humidity was 71.5%.
Table 2.
Boundary and initial conditions according to the LP-DF engine.
2.2. CFD Model and Validation
The CAD software Catia was used for 3D modeling in this study. Figure 1 shows a 3D simulation model of a marine LP-DF engine. The two small ellipsoidal structures at the top of the combustion chamber represent the pre-combustion chambers (PCCs), where the pilot fuel injectors are located. In addition, two natural gas admission valves (GAVs) are located in the lower and middle part of the cylinder block, symmetrically distributed above the scavenge inlet ports. The scavenge box is connected to the engine block by 30 inlet ports. Moreover, the exhaust valve and the exhaust pipe are located on the top of the LP-DF engine.

Figure 1.
Three-dimensional model of an LP-DF engine.
To obtain accurate initial conditions and boundary conditions of the RT-Flex50DF engine simulation, a 1D calculation model was developed for the LP-DF engine using GT-power software. The 1D simulation model of a 6RT-Flex50DF engine is shown in Figure 2. The residual exhaust gas in the model cylinder is calibrated based on experimental data. According to the verified model, the required initial conditions and boundary conditions for the 3D CFD model calculation were obtained. The simulation calculation interval is 110–470 °CA, and one completed work cycle process of an LP-DF engine is calculated. Due to the joint 1D simulation calculation, only one cycle of the 6RT-Flex50DF engine working process was simulated.
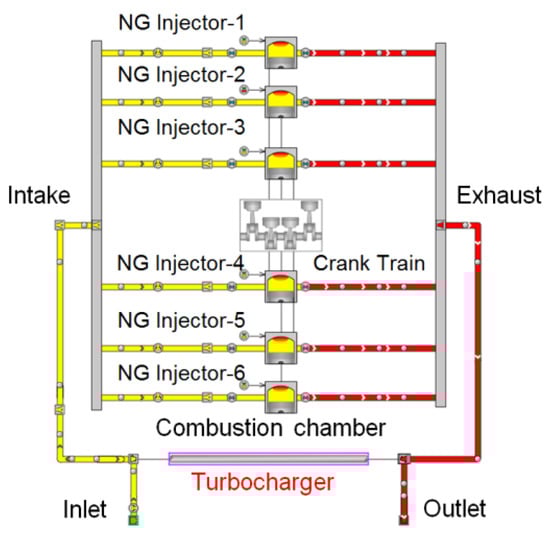
Figure 2.
A 1D model of a 2-stroke LP-DF engine.
To accurately simulate the diesel fuel spray ignition process inside the PCC and main combustion chamber (MCC), it is necessary to carry out a special treatment for the PCC and the PCC grid at the spray holes. The CFD simulation software used is Converge. The mesh was encrypted at the PCC, the exhaust valve seat, the GAV, and the gas scavenge ports. The model was based on the two-layer adaptive encryption of temperature and pressure. The maximum value of the total computational cells of the mesh was about 793,720,000, which ensured that the computational accuracy of the 3D simulation was within the acceptable error range and improved the efficiency of the simulation. The final simulation model passed the verification of the irrelevance of the number of meshes.
The turbulence model used in the CFD simulations is the RNG k-ε model. The RNG k-ε model is widely used in the combustion simulation process of internal combustion engines. RNG k-ε uses two equations to calculate turbulent kinetic energy k and dissipation rate ε, respectively, and their expressions are as follows:
where μt is the turbulent viscosity, m2/s, and Cε1, Cε2, Cε3, and Cε4 are the empirical constants.
The KH-RT model was used for the injection droplet breakup sub-model in the 3D simulation of the marine LP-DF engine, and the collision sub-model of the pilot fuel spray was set as the NTC model. In addition, the standard turbulence model was used. The SAGE model was used as the combustion sub-model as it can couple the LLNL v3.1, and GRI-Mech 3.0 reduced chemical reaction kinetics, which decreased the computational step size in the simulation process and can monitor the process of the dual-fuel engine detonation. Furthermore, the emission model was the Extended Zeldovich NOx emission model, and emissions such as CO and HC were calculated according to the detailed chemical reaction kinetics mechanism.
In order to verify the validity of the 3D CFD model, the cylinder pressure curve and heat release rate (HRR) of the 5RT-flex50DF LP-DF engine at 75% load were compared and verified, respectively, with reference to the data of the WinGD GTD database and the relevant literature. The one-cycle simulation model leads to a fuel injection moment of −8.5 °CA before the top dead center (BTDC) under basic working conditions. From Figure 3, the simulated mean in-cylinder pressure under 75% load is basically in agreement with the measured in-cylinder pressure. In addition, the average error with the experimental results is no more than 2.9%, which meets the requirement of the simulation’s accuracy.
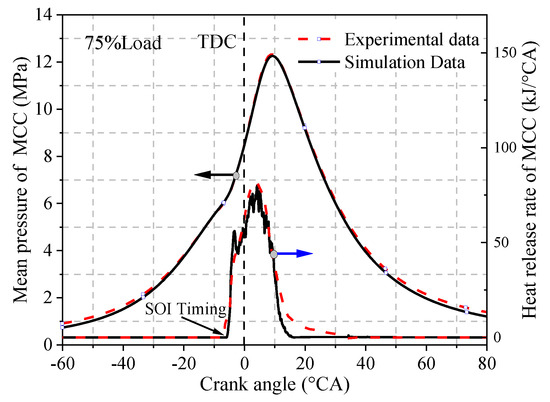
Figure 3.
Comparison of simulated and experimental data of the pressure and HRR under 75% load.
3. Simulation Results Analysis
3.1. Effect of PCC Volume on Engine Performance
The LP-DF engine studied in this paper adopted two PCCs arranged in an opposing manner. The size of the PCC volume affects the air–fuel ratio and the homogeneity of the mixture inside the PCC, which in turn affect the combustion performance and emission generation inside the PCC, thus affecting the combustion process inside the MCC. Three different PCC volume schemes of 2.7 × 10⁻⁴ m3, 3.3 × 10⁻⁴ m3, and 3.95 × 10⁻⁴ m3 were selected; Figure 4 shows the geometrical local models. After calculation, the MCC volume was 0.036 m3, while the PCC volume was 0.74%Vtol (total volume of the combustion chamber), 0.9%Vtol, and 1%Vtol of the MCC volume for the three scenarios, respectively. Keeping the LP-DF engine’s other geometrical and operational parameters unchanged, the effects of different PCC volume percentages on the combustion process and emission generation in the PCC and MCC were investigated.
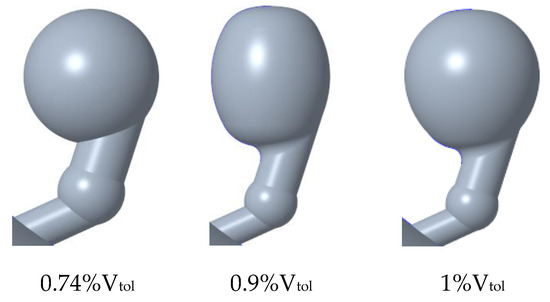
Figure 4.
Scheme of different PCC volume ratios.
Figure 5 and Figure 6 show oxygen and methane content inside the PCC under different PCC volume ratio scenarios. It can be seen that the oxygen and methane contents inside the PCC gradually increase with the increase in the PCC volume ratio. The gases entering the PCC help to improve the homogeneity of the mixture inside the PCC, which prepares for the ignition and combustion of the pilot fuel. When the PCC volume ratio is 1%Vtol, the oxygen content inside the PCC reaches a peak of 1.552 g at −6.88 °CA, and the methane content also reaches a peak of 0.202 g at that time. This indicates that different PCC volume ratios will lead to different air–fuel ratios inside the PCC. The bigger the PCC volume, the more methane and oxygen enter the pre-chamber, forming flame jets with different combustion characteristics inside the PCC. This will also result in the formation of different flame jet speeds and penetration degrees inside the MCC, which will ultimately affect the combustion and emission performance of the MCC.

Figure 5.
Effect of different PCC volume ratios on O2 mass in PCC.
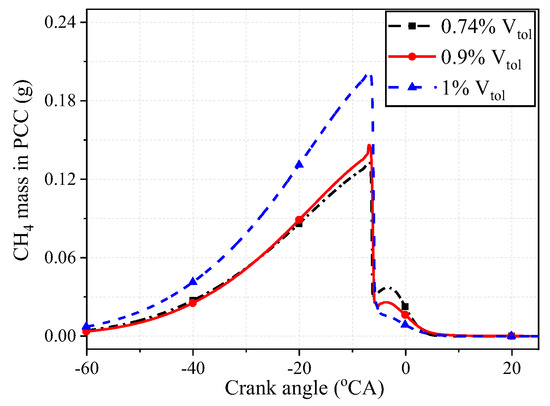
Figure 6.
Effect of different PCC volume ratios on CH4 mass in PCC.
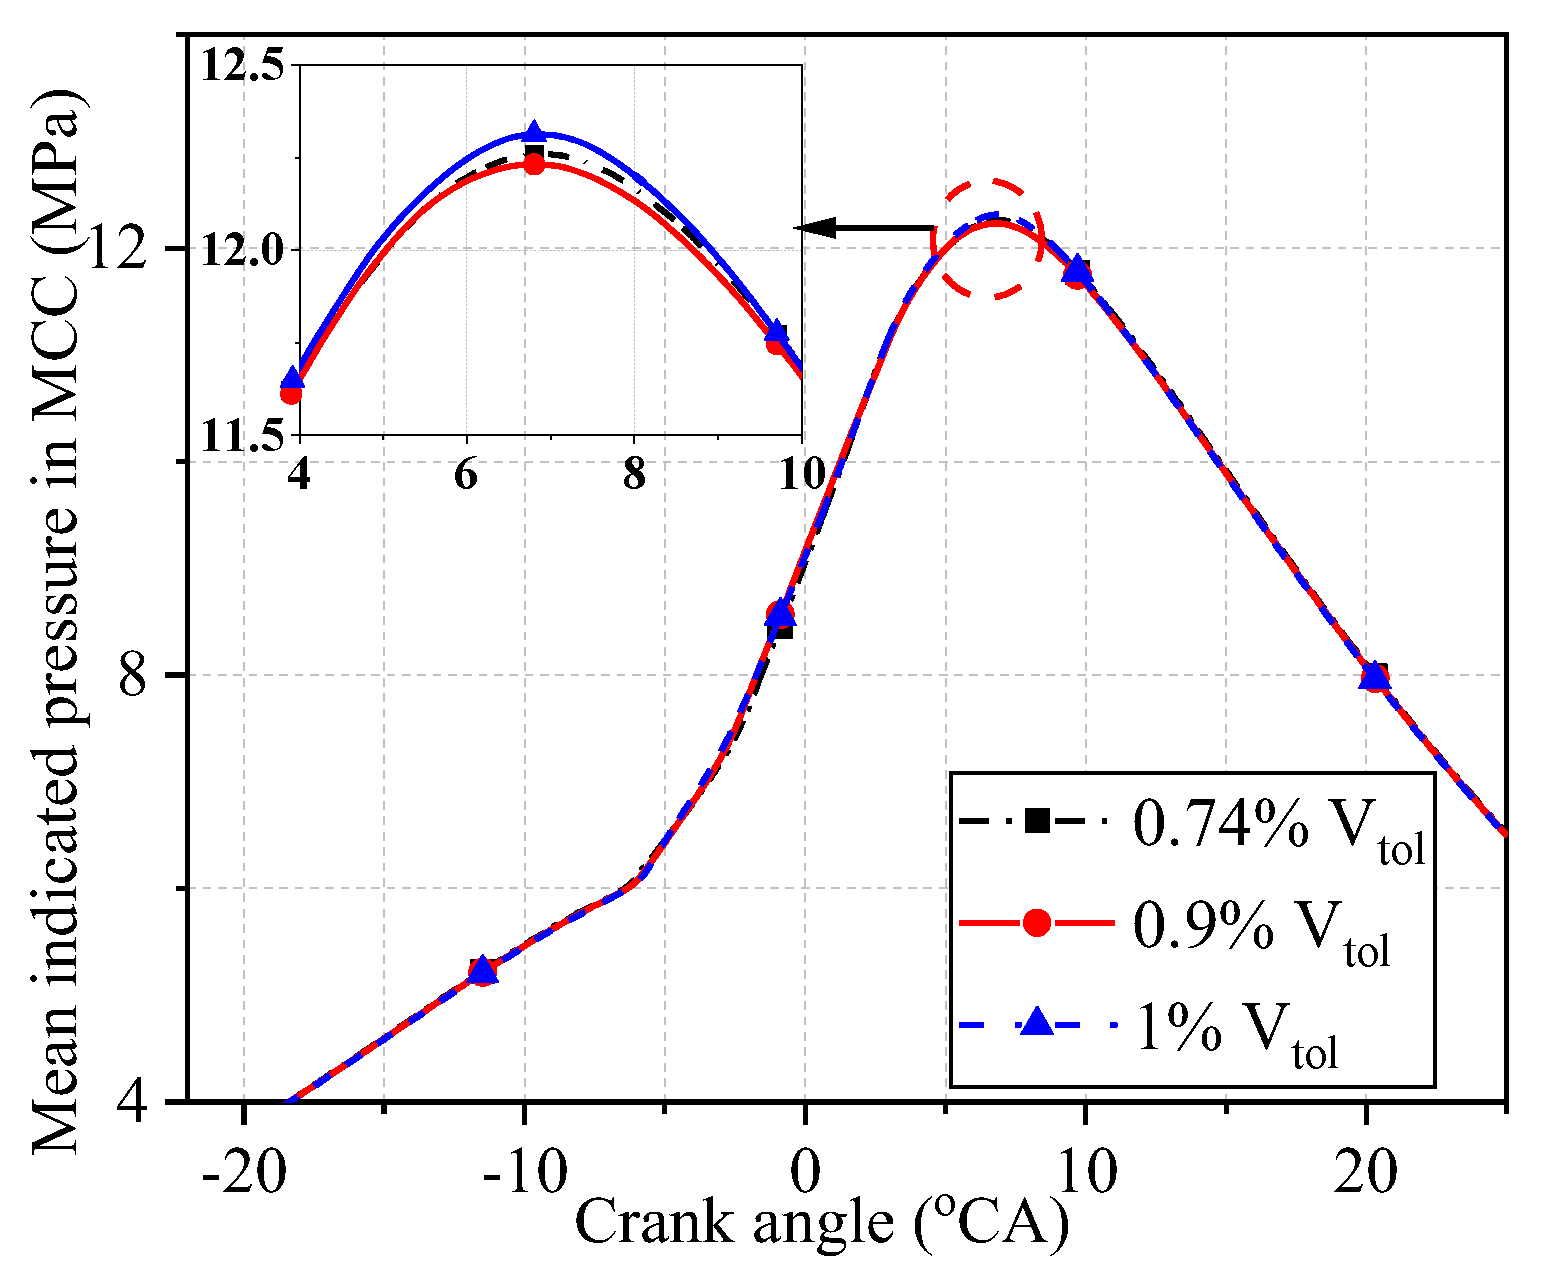
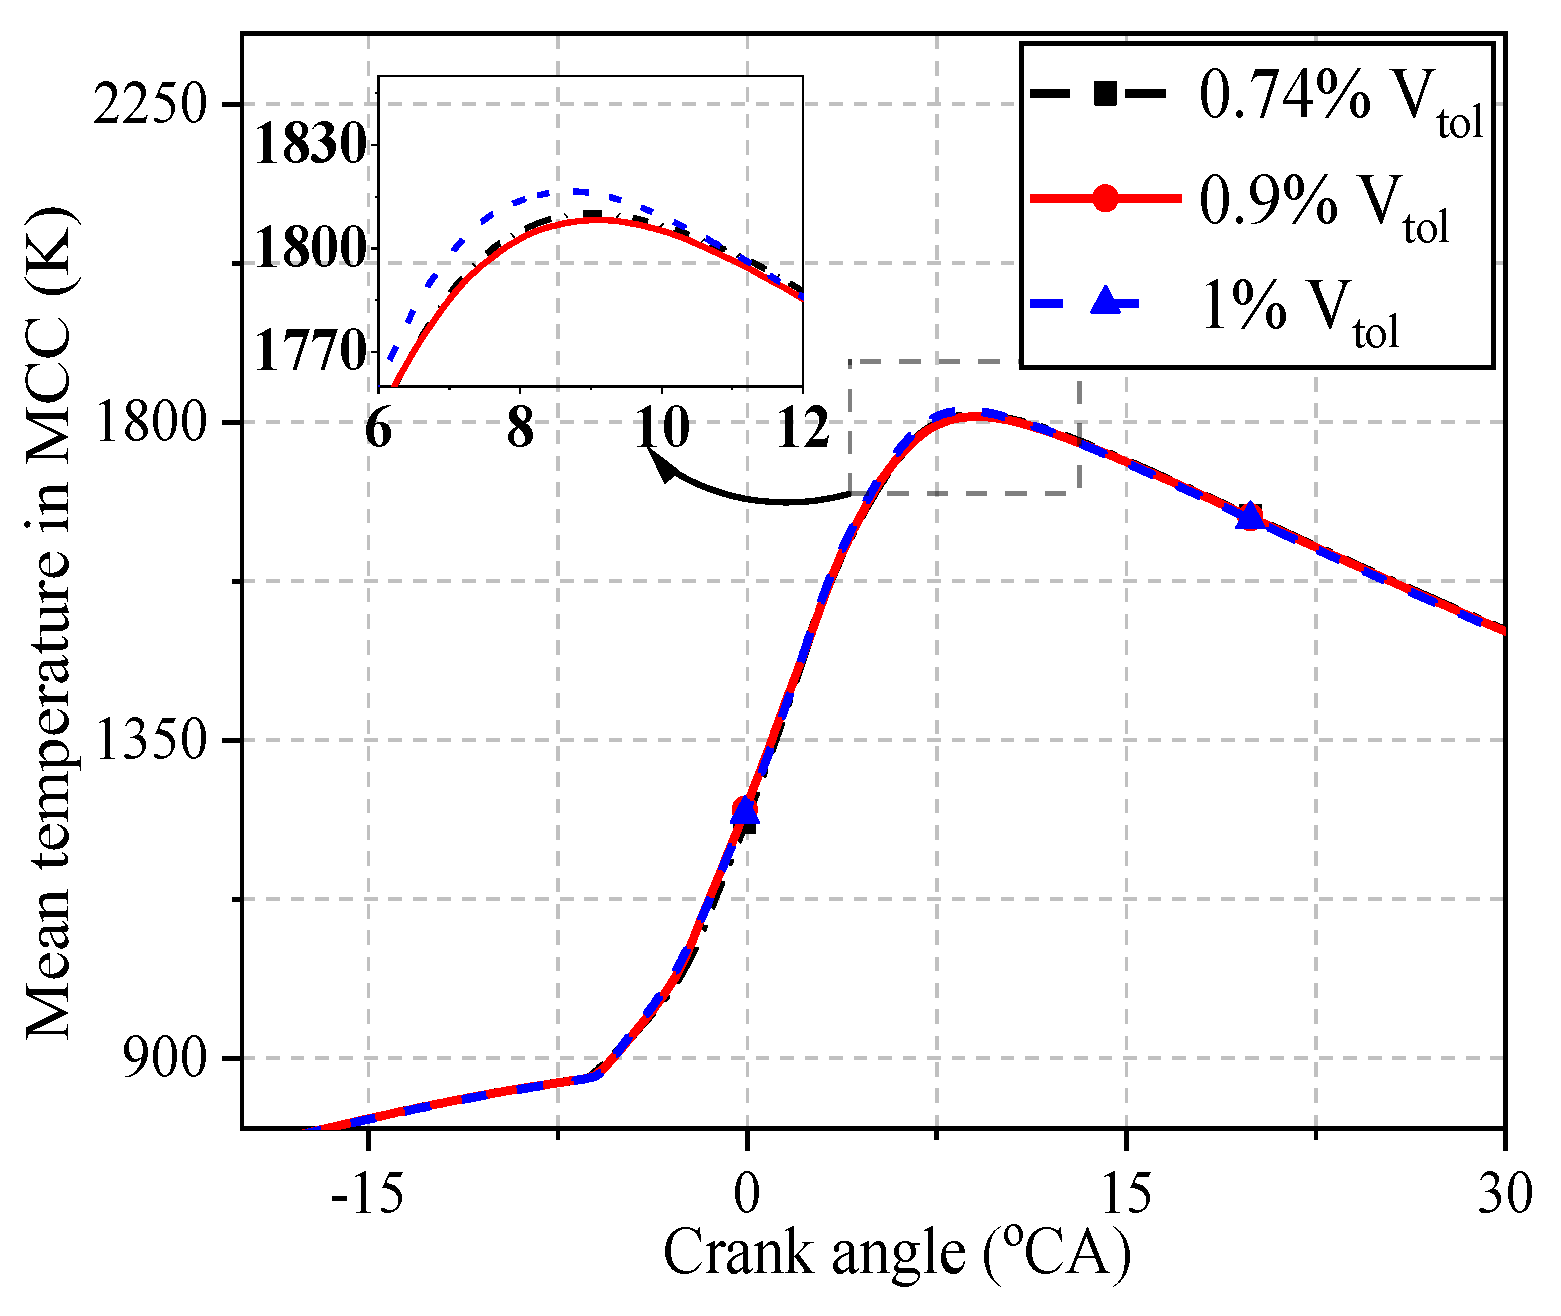
Figure 7 and Figure 8 show the variation in pressure and temperature inside the MCC under different PCC volume ratios. From Figure 6, the MCC’s combustion pressure reaches a maximum peak of 12.31 MPa at 6.9 °CA after the top dead center (ATDC) at a PCC volume ratio of 1%Vtol, while it has a similar variation trend at 0.74%Vtol and 0.9%Vtol PCC volume ratios. It can be seen from Figure 8 that the combustion temperature of the MCC is the highest under a 1%Vtol volume ratio, reaching a peak temperature of 1816.6 K at 8.7 °CA ATDC. In comparison, the MCC’s combustion temperature increase rate is similar under the 0.74%Vtol and 0.9%Vtol PCC volume ratios. This indicates that the larger the volume of the PCC, the better its internal combustion effect is and the easier it is to form higher ignition energy and improve the engine combustion performance.
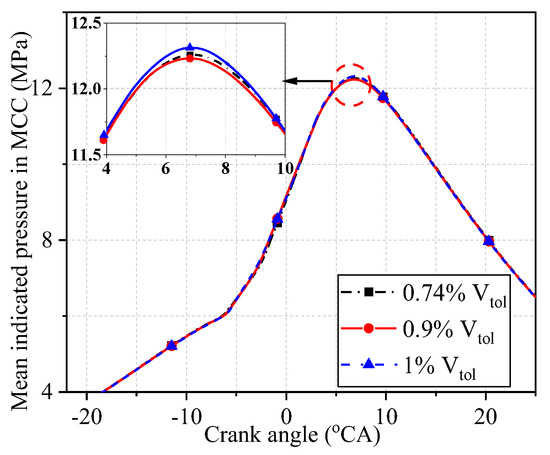
Figure 7.
MCC indicated pressure under different PCC volume ratios.
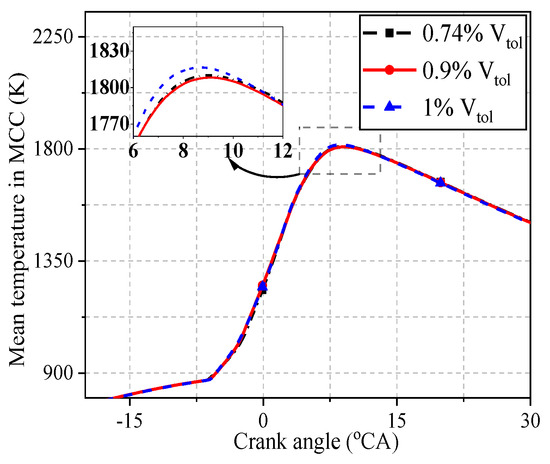
Figure 8.
MCC temperature under different PCC volume ratios.
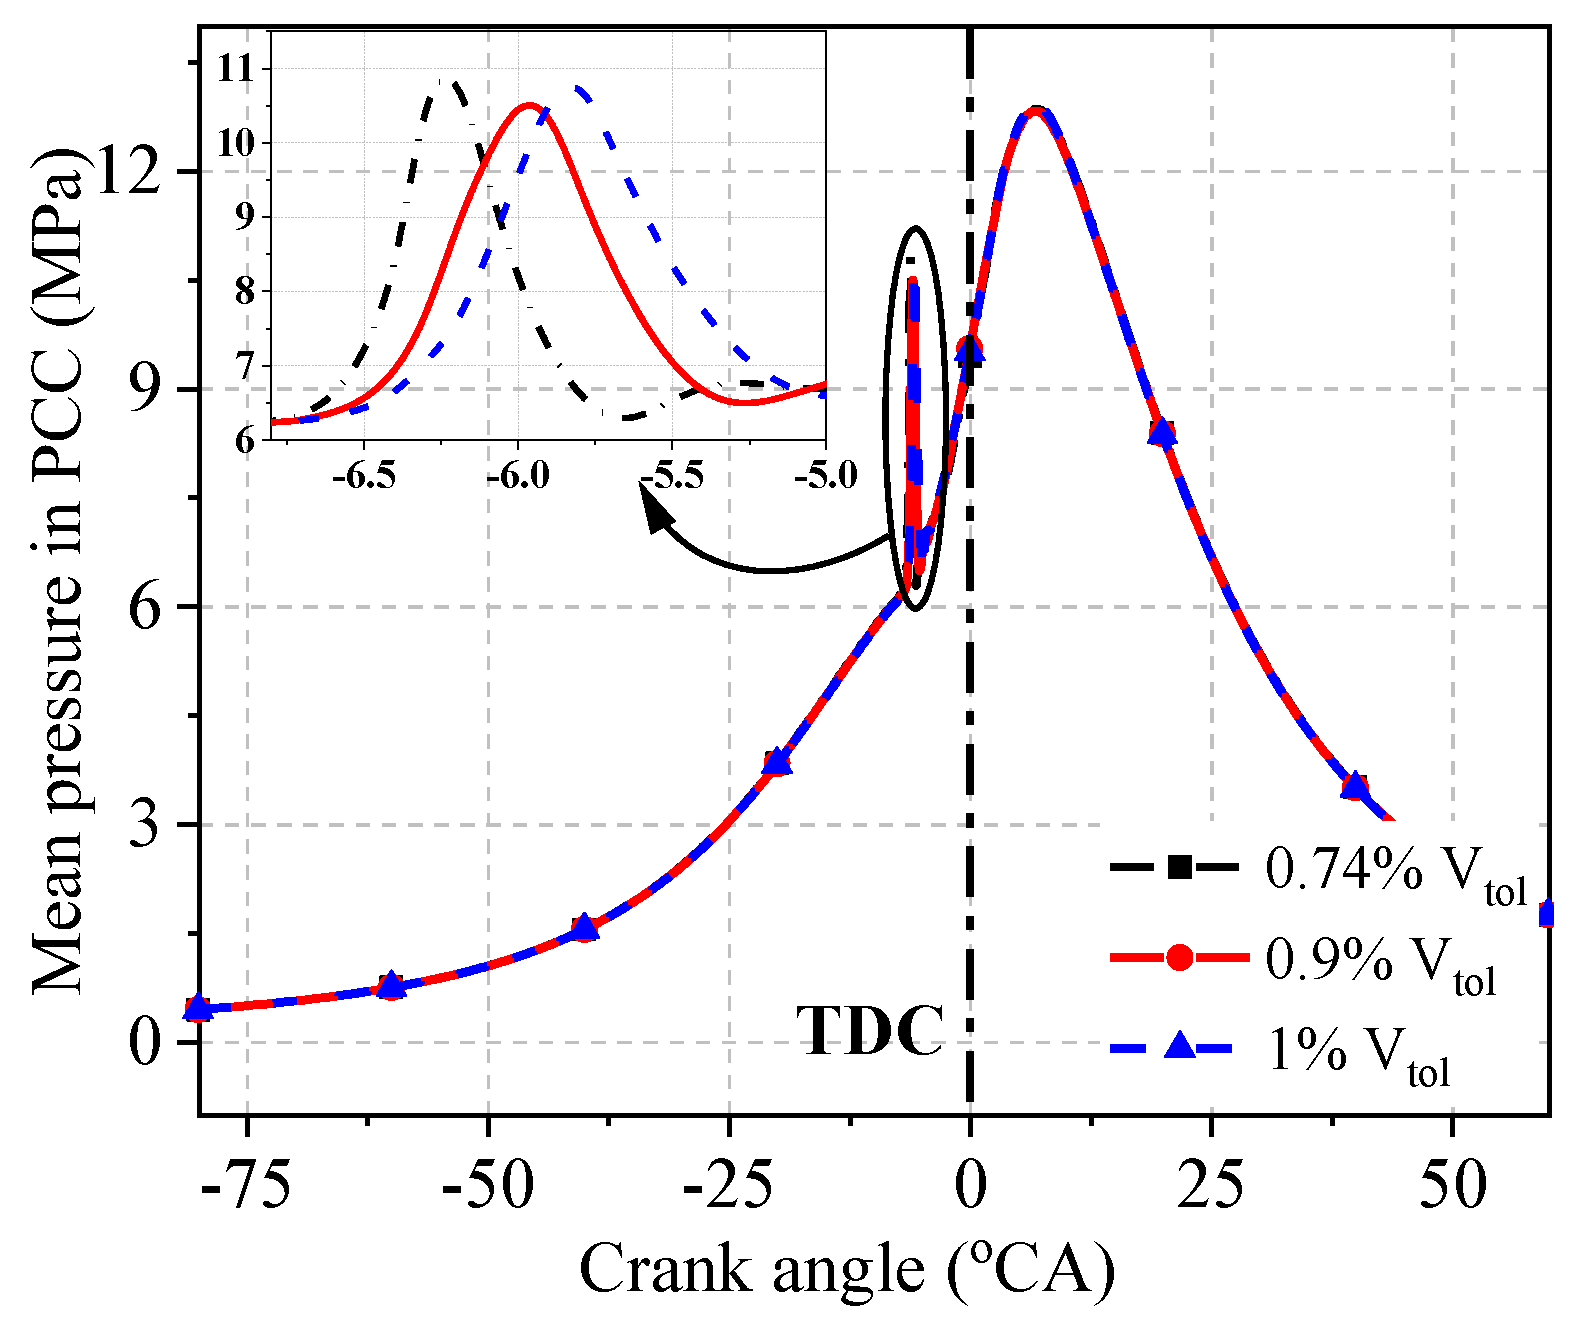
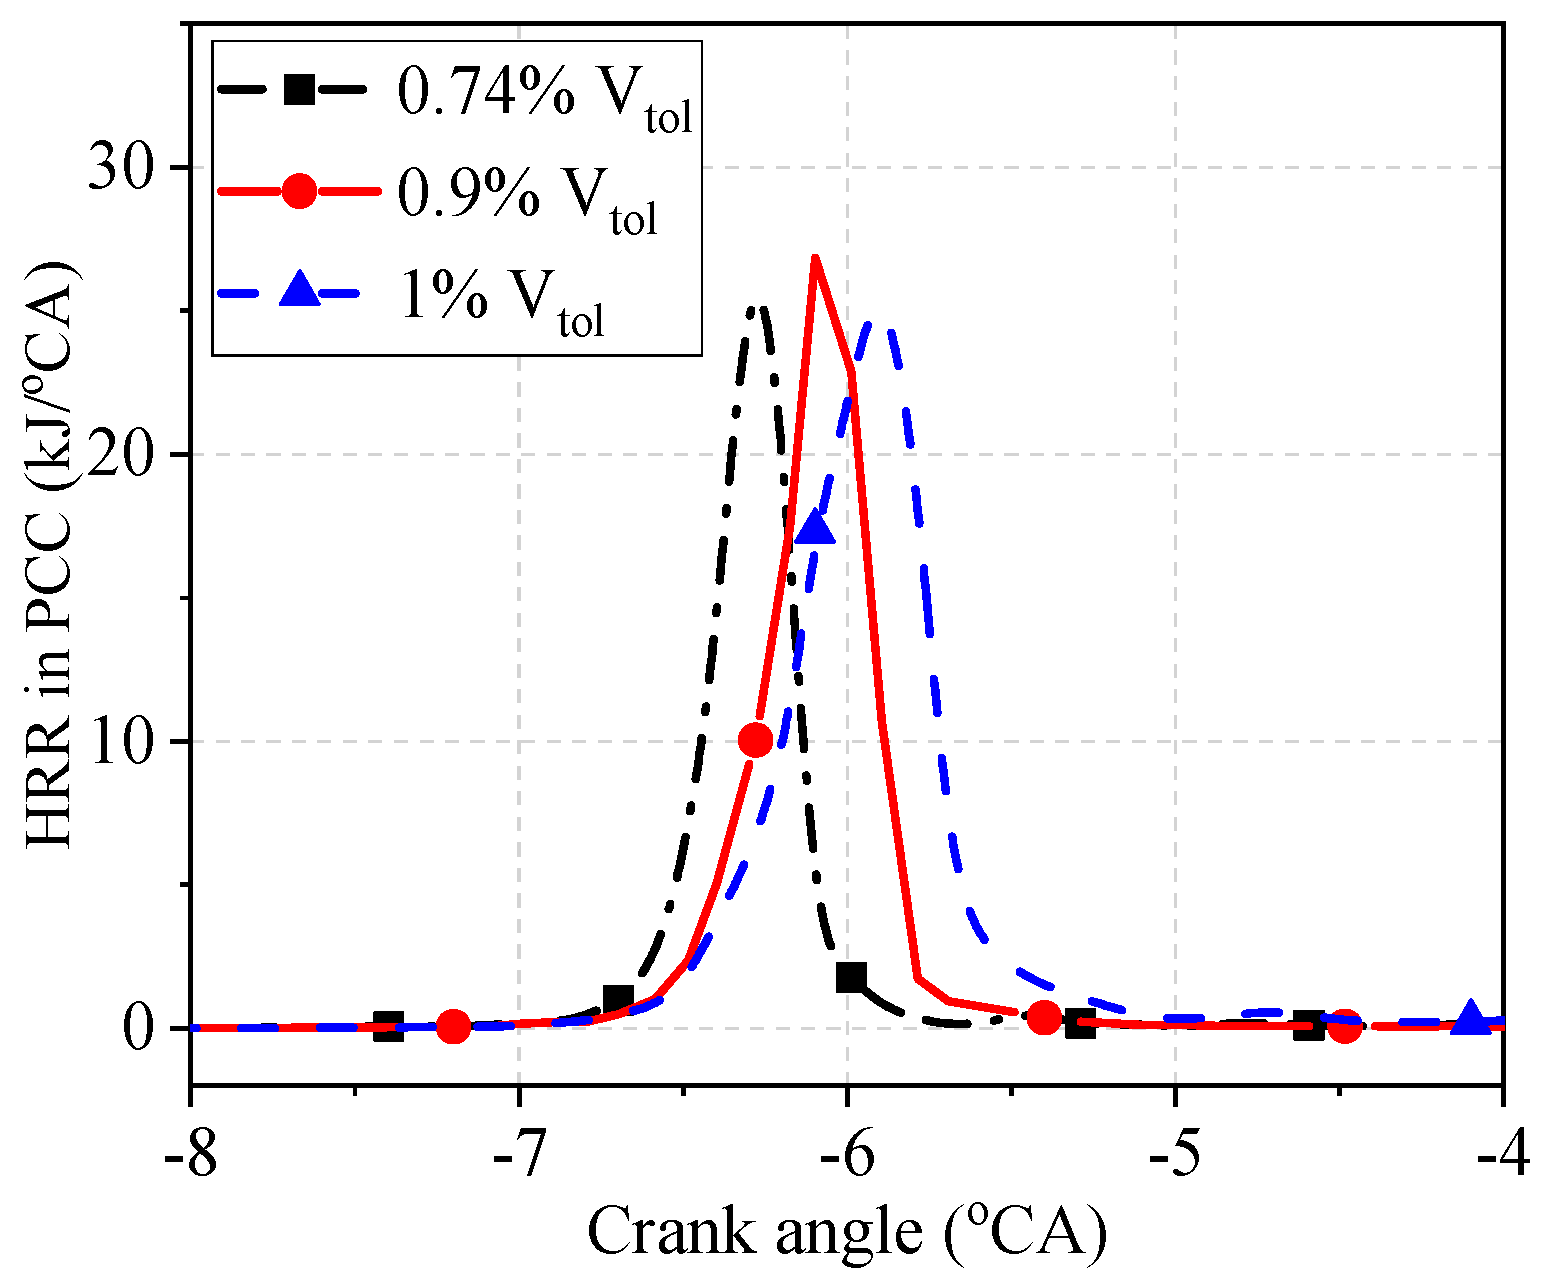
The variation in pressure and heat release rate inside the PCC under different PCC volume ratios is shown in Figure 9 and Figure 10, respectively. From the figure, it can be seen that different PPC volume ratios have little impact on the peak pressure inside the PCC but significantly impact the peak phase of the pressure inside the PCC. This is because different PCC volume ratios essentially change the concentration of each component entering the PCC. That is, different air–fuel ratios inside the PCC will form different flame jet propagation speeds under the condition that the ignition time remains unchanged. The greater the flame jet speed, the greater the penetration, and vice versa. This results in different combustion processes of the combustible mixture in the MCC. Compared with the base case (0.9%Vtol), the smaller the volume proportion of the PCC, the earlier the combustion phase in the PCC at the time of ignition, and the peak phase of the HRR is also advanced accordingly. This is because when the air–fuel ratio is similar, the smaller the volume of the PCC, the higher the pressure at the time of ignition is, which promotes the ignition and combustion process of the pilot fuel inside the PCC and leads to the advancement of the combustion phase.
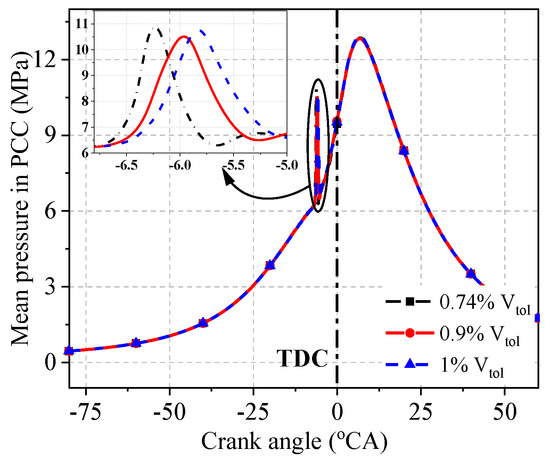
Figure 9.
Mean pressure in PCC under different PCC volume ratios.

Figure 10.
HRR in PCC under different PCC volume ratios.
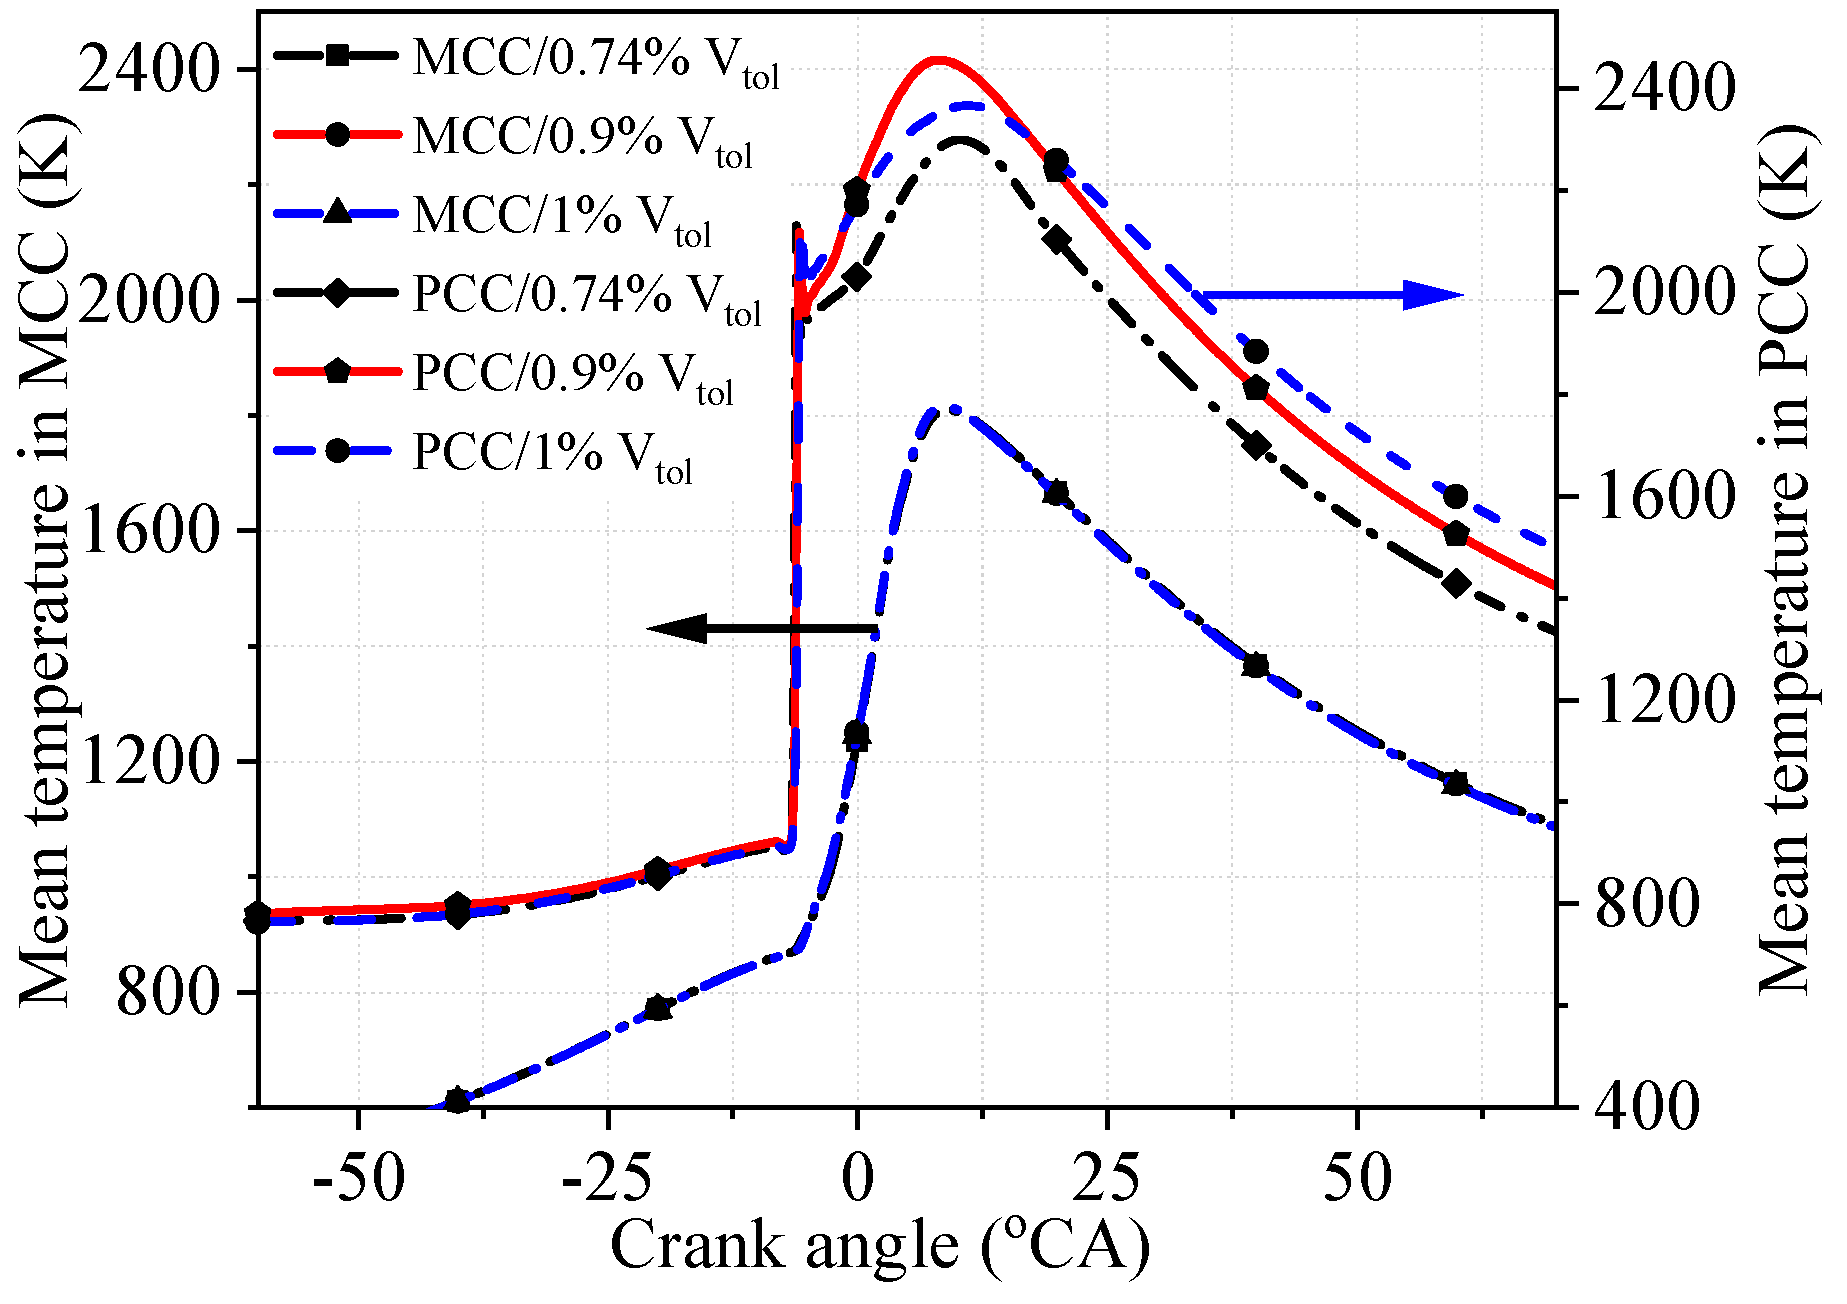
Figure 11 illustrates a comparison of the average temperatures of the PCC and the MCC under different PCC volume ratios. It can be seen from the changing trend in Figure 10 that as the volume of the PCC changes, the average temperature of the MCC chamber changes slightly. As the volume ratio of the PCC increases, the temperature of the PCC first increases and then decreases. Compared with the two schemes of 0.74%Vtol and 1%Vtol, the scheme with a PCC volume ratio of 0.9%Vtol has the highest PCC peak temperature, reaching 2462 K at 8.1 °CA ATDC. This means that the combustion phase is relatively advanced in the PCC with a 0.9%Vtol, indicating that the combustion condition in the PCC is better This is because when the PCC volume ratio is 0.9%Vtol, the air–fuel ratio in the PCC is more conducive to diesel combustion, and the combustion effect is better.
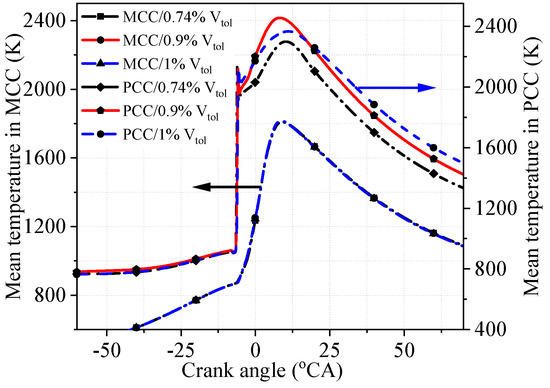
Figure 11.
Mean temperature in MCC and PCC under different PCC volume ratios.
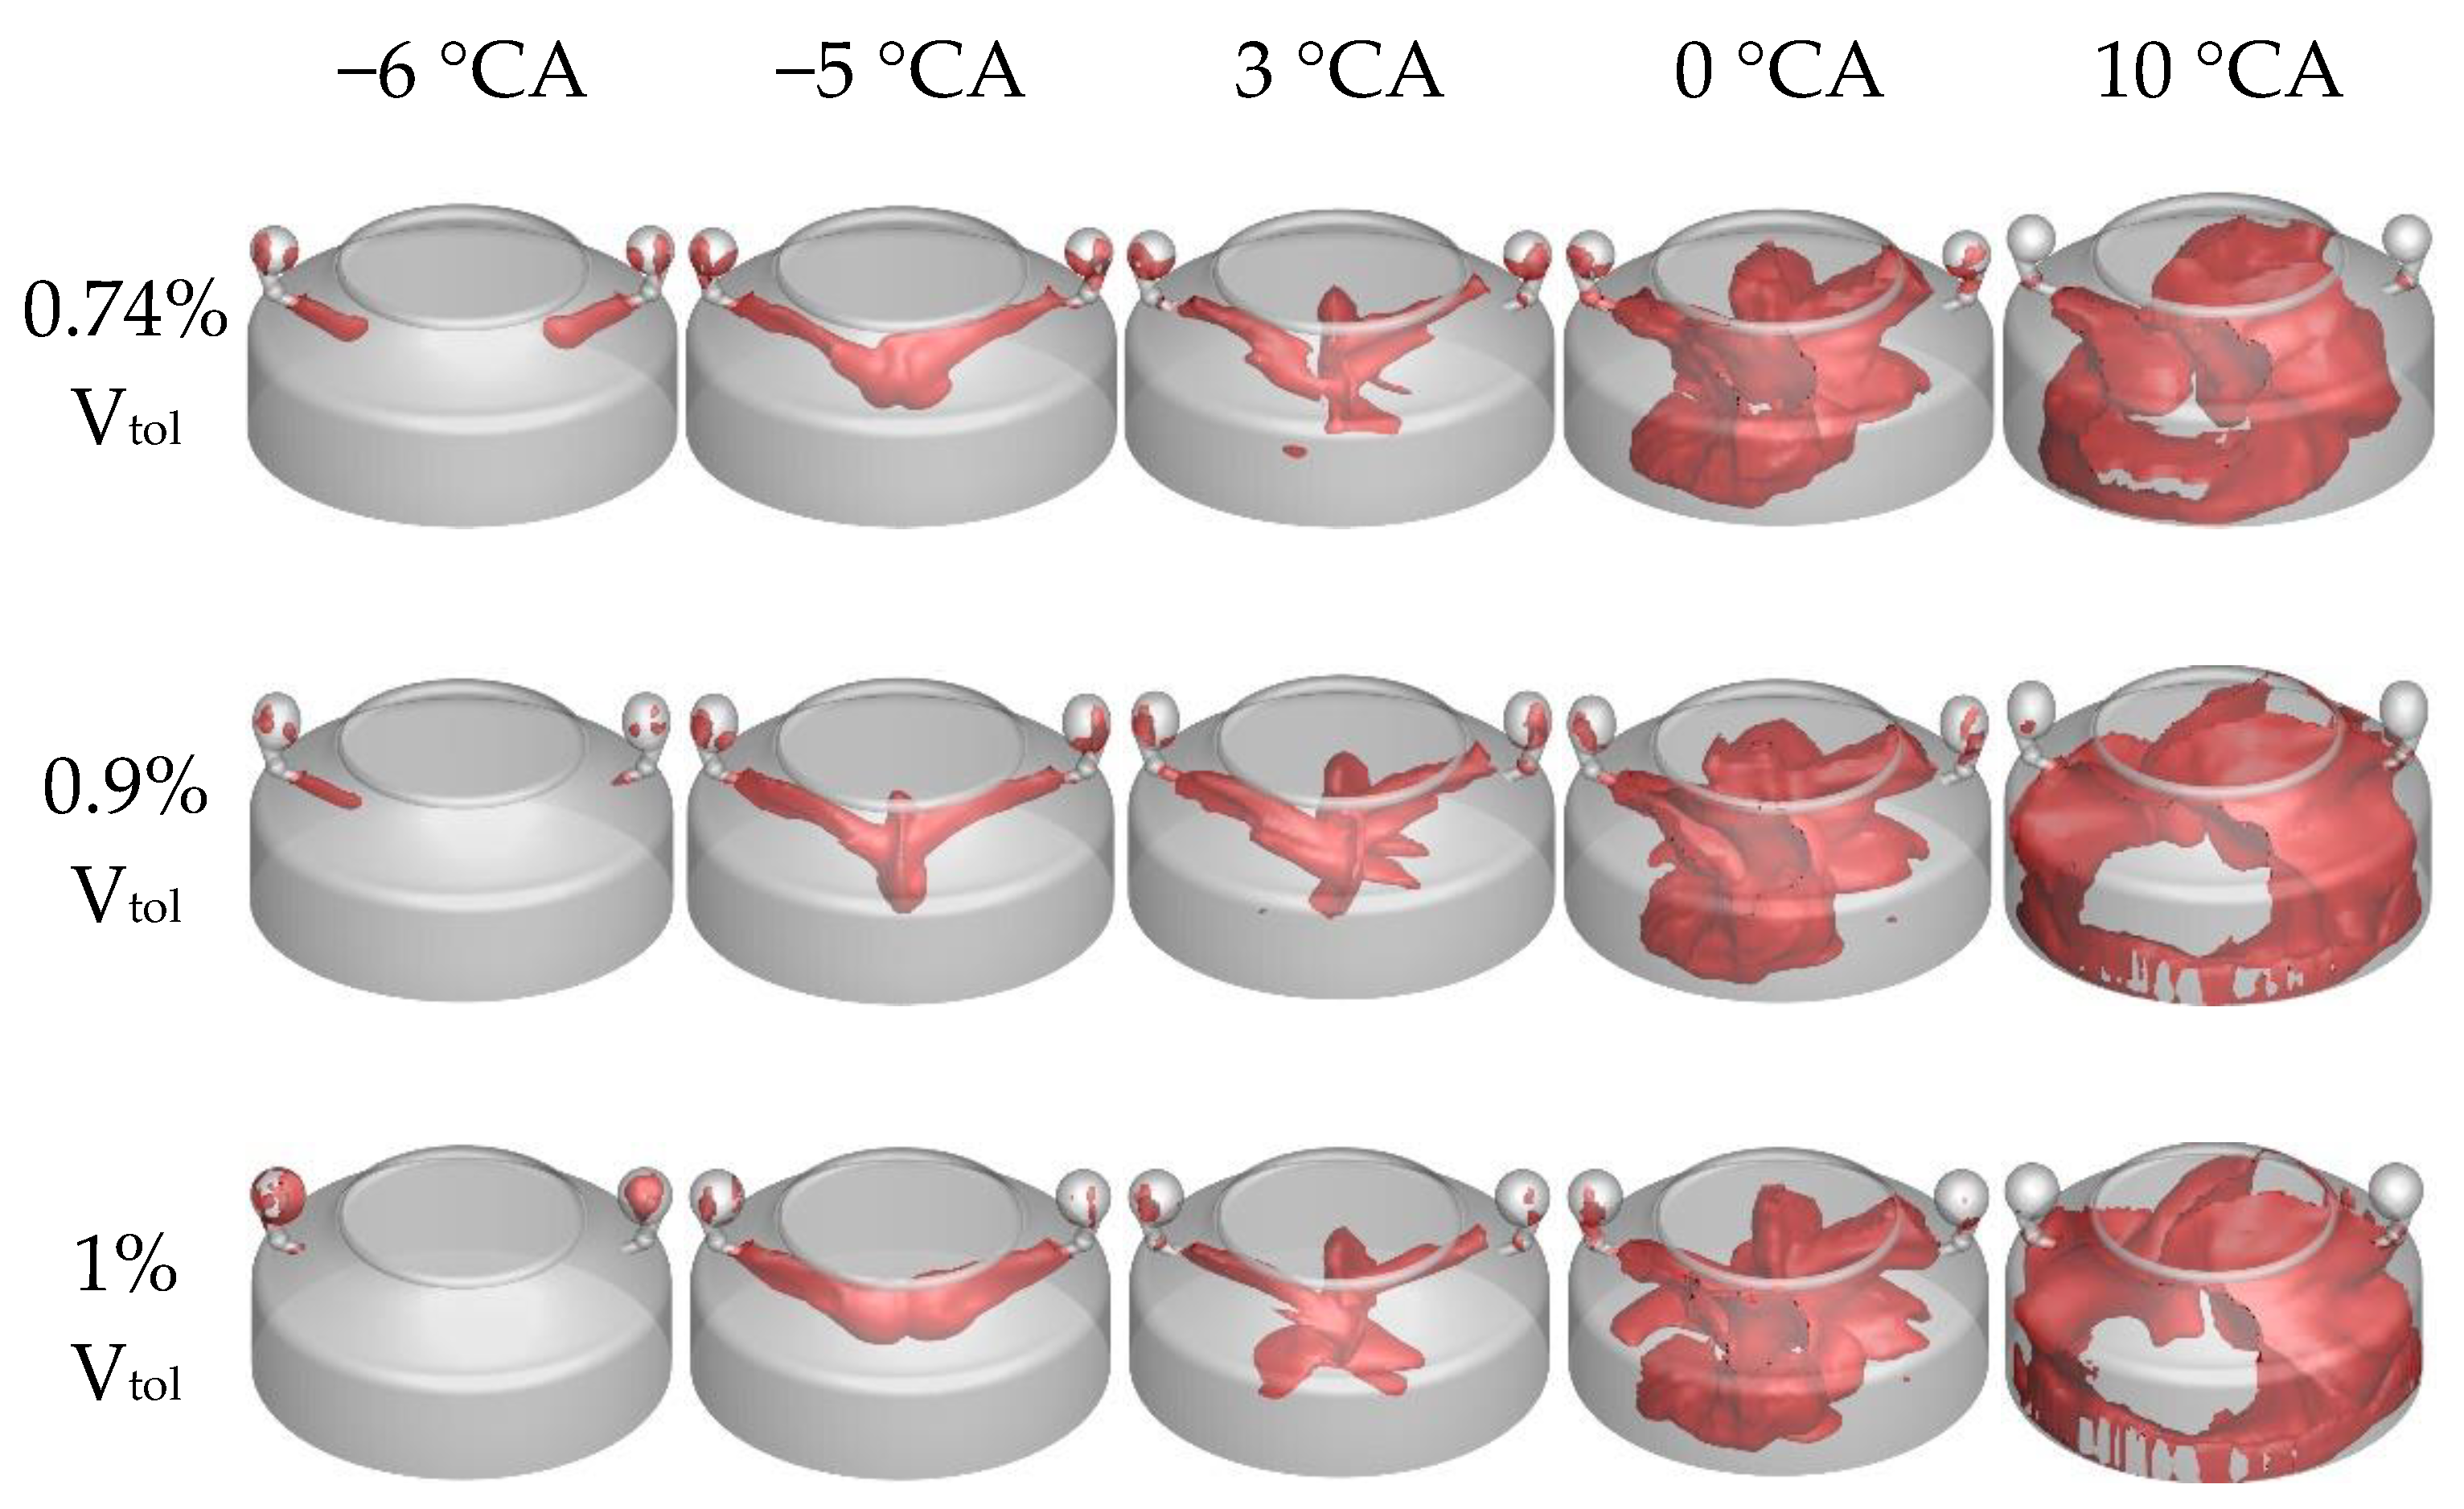
The 1800 K temperature iso-surface cloud diagram of the MCC under different PCC volume ratios is shown in Figure 12. It can be seen that different PCC volume ratios have a greater impact on the combustion process in the MCC. As the volume ratio of the PCC decreases, the high-temperature and high-pressure flame jet enters the MCC earlier. Under the three schemes in Figure 11, the flame jet can spread throughout the MCC at around 10 °CA ATDC. In contrast, under the 0.74%Vtol scheme, the flame jet spreads the fastest and the combustion duration is shorter due to the smaller volume of the PCC, and the combustion reaction process in the MCC is advanced.
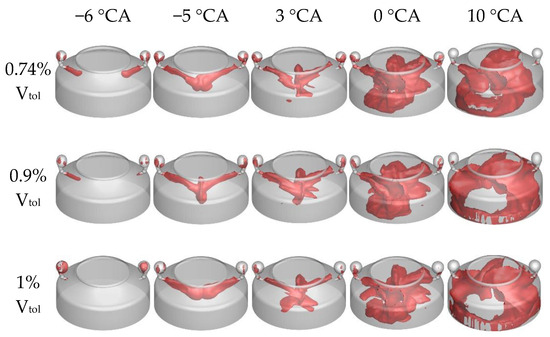
Figure 12.
Temperature iso-surface at 1800 K in the MCC with different PCC volume ratios.
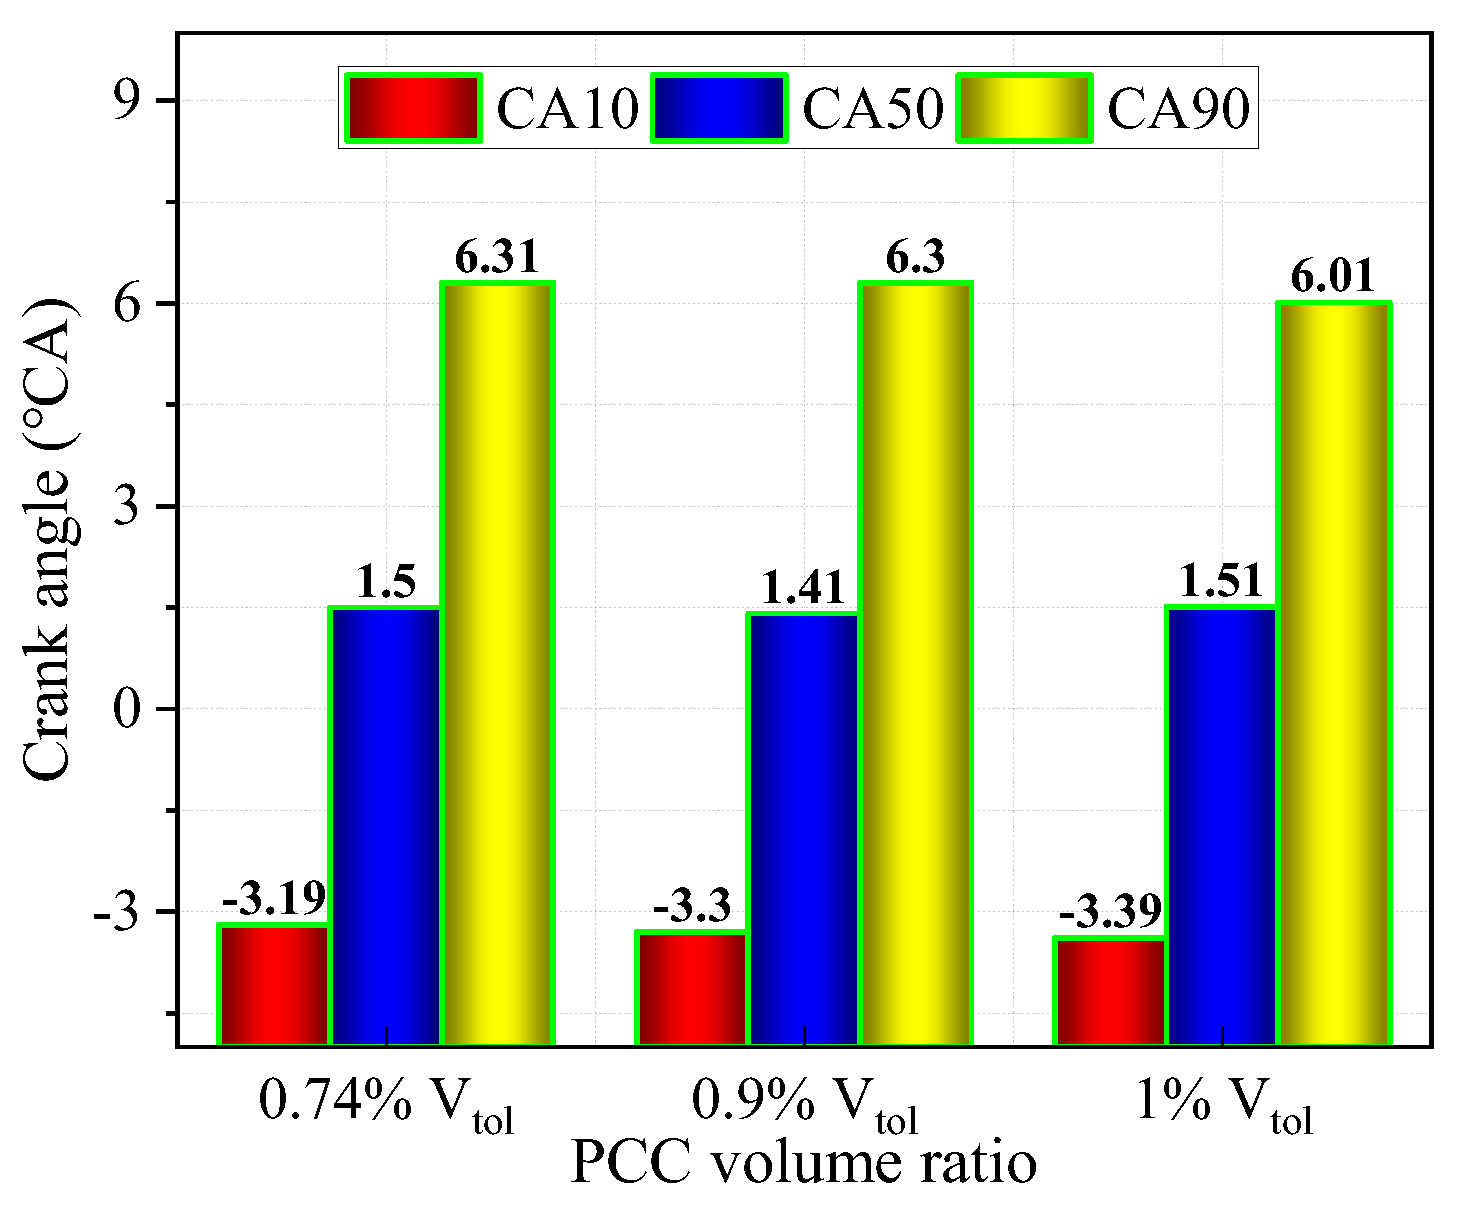
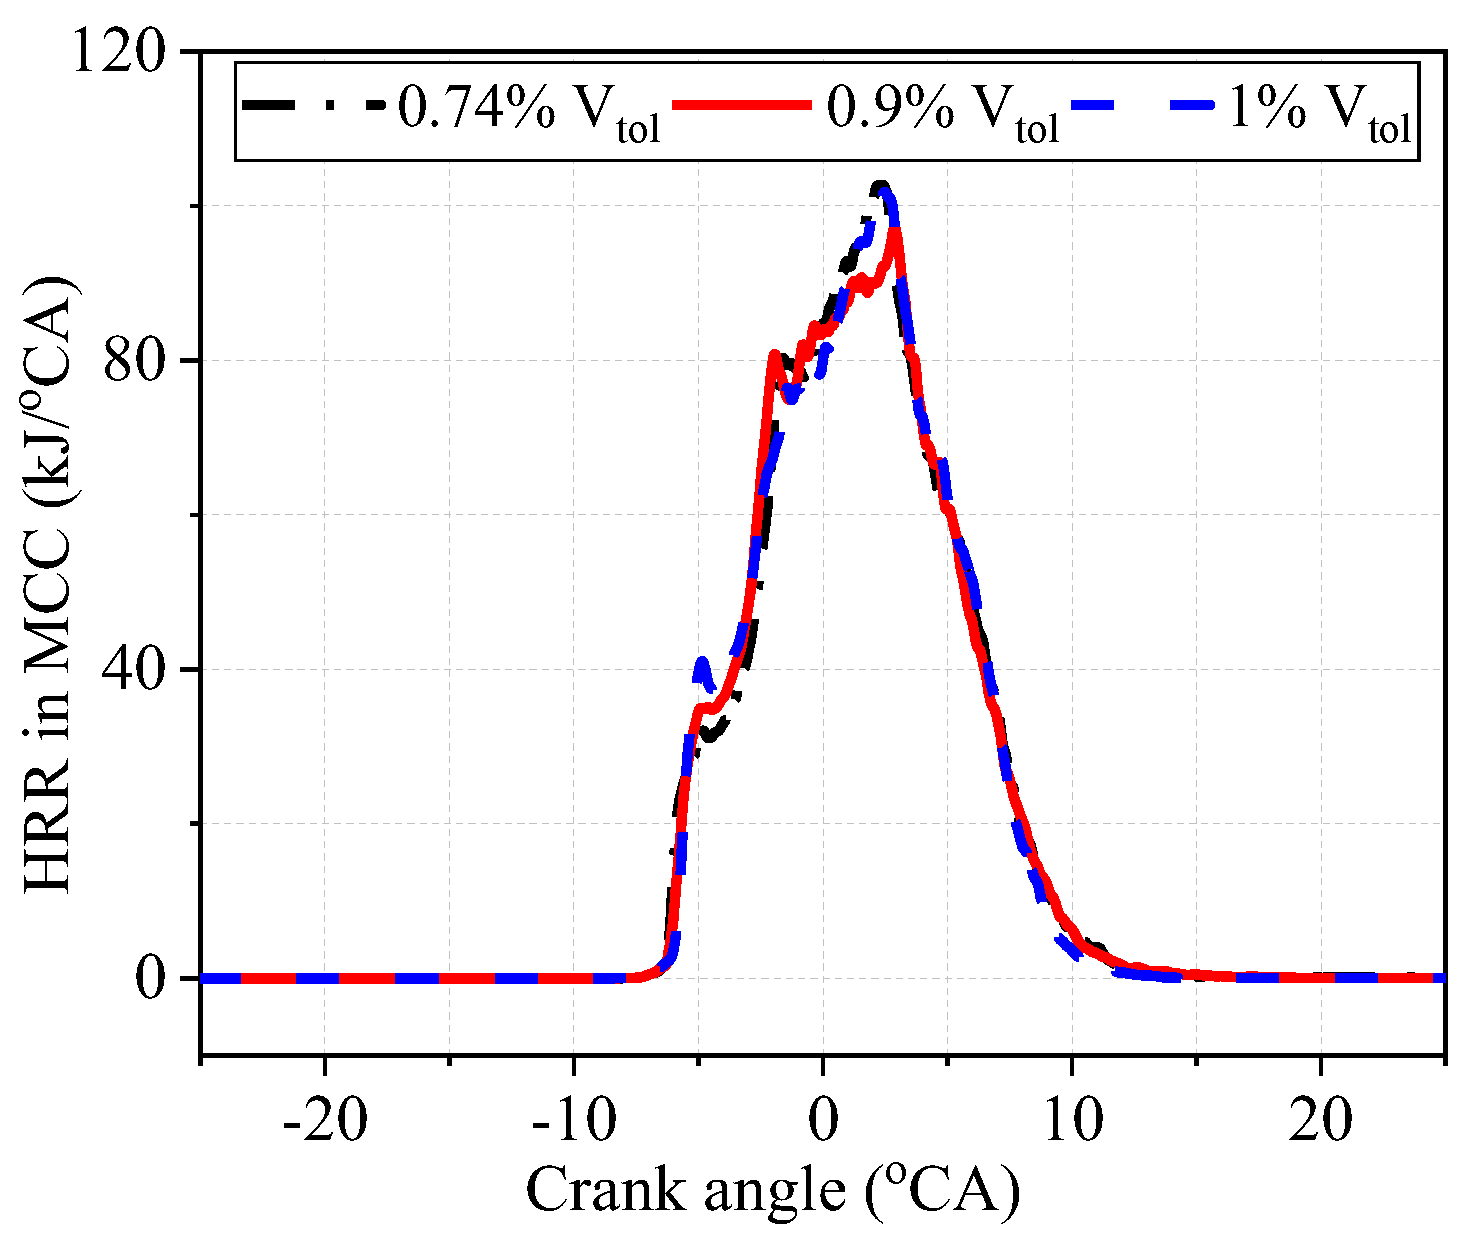
The variation in MCC characteristic parameters under different PCC volume ratios is shown in Figure 13. As the PCC volume ratio increases, the combustion characteristic parameters CA10, CA50, and CA90 of the MCC are reduced, but the change trend is slight. This is because as the volume of the PCC increases, more oxygen and methane are pressed into it, improving the overall reaction activity in the PCC and leading to earlier ignition and combustion in the MCC. Figure 14 shows the changes in the heat release rate inside the MCC under different PCC volume ratios, from which it can be seen that the HRR under the 0.74%Vtol and 1%Vtol PCC volume ratios is higher than the HRR under the 0.9%Vtol PCC volume ratio. The HRR of the MCC accelerates with the increase in the volume ratio of the PCC. The different PCC volume ratios have less influence on the combustion process of the MCC.

Figure 13.
Combustion characteristic parameters under different PCC volume ratios.

Figure 14.
The influence of different PCC volume ratios on the MCC HRR.
Figure 15 and Figure 16 show the NOx emissions and engine efficiency under different PCC volume ratios, respectively. It can be seen from Figure 14 that NOx generation in the PCC and MCC increases gradually with the increase in PCC volume ratio, but the combustion efficiency of the engine changes very little. When the volume of the PCC accounts for 1%Vtol, the NOx emissions are the highest, and the NOx generation in PCC reaches a peak value of 4.33 × 10⁻² g at 10.824 °CA ATDC. When the volume of the PCC accounts for 0.74%Vtol, the NOx generation is the lowest, reaching a value of 4.395 × 10⁻² g corresponding to the crankshaft angle of 4.5 °CA ATDC. When the volume of the PCC is 1%Vtol, the methane and oxygen return flow in the PCC is the highest, and the combustion of methane and diesel fuel together leads to the formation of high ignition energy inside the PCC, and the rich oxygen also creates favorable conditions for NOx generation. When the volume of the PCC is small, the combustion process inside the PCC is advanced, leading to the combustion reaction inside the MCC being advanced. This will also result in an earlier combustion reaction in the MCC and a shorter combustion duration. Under the three scenarios, the NOx specific emission increases gradually with the increase in the volume ratio, and the change in efficiency is not obvious.

Figure 15.
Effect of different PCC volume ratios on NOx emissions.
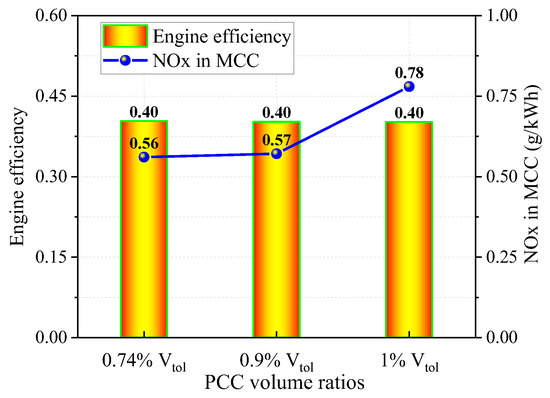
Figure 16.
Effect of different PCC volume ratios on engine efficiency and NOx emissions in MCC.
3.2. Effect of PCC Orifice/Diameter Ratio on an LP-DF Engine
The diameter of the PCC orifices has an important influence on the backflow characteristics and the jet flame propagation process in the PCC. In order to quantitatively investigate the effect of PCC orifice diameter on the performance and emission of the LP-DF engine, a new variable ωr (orifice diameter/engine cylinder bore ratio) is defined as the ratio of the PCC orifice diameter to the engine cylinder bore. Only the PCC orifice diameter is varied, and three scenarios with ωr of 2%, 3.2%, and 4.8% are considered, respectively. The three geometrical design parameters are shown in Figure 17. Keeping the other simulation parameters of the engine unchanged, the effect of the PCC orifice diameter on the performance of the LP-DF engine is investigated.
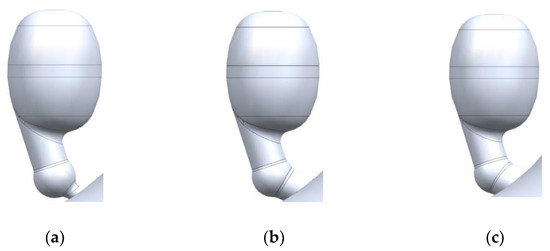
Figure 17.
Three different PCC ωr in simulation cases. (a) ωr = 2%. (b) ωr = 3.2%. (c) ωr = 4.8%.
3.2.1. Effect of PCC Orifice Diameter Ratio on Flame Propagation
Figure 18a shows the mean air–fuel ratio in PCC under different PCC orifice diameter ratios (ωr). It can be seen that minimum air–fuel ratio (λmin) inside the PCC under the ωr = 3.2% is obtained before the pilot fuel is injected. In addition, the operating parameters of the low-pressure dual-fuel engine remain unchanged under the three comparison schemes. The amount of natural gas mixture flowing back into the PCC is only affected by the pre-combustion chamber nozzle diameter ratio. Moreover, the lowest air–fuel ratio in the PCC indicates that the amount of natural gas mixture flowing back into the PCC is the largest. Figure 18b illustrates λmin in the PCC and the PCC temperature at the SOI moment under different PCC orifice diameter ratios (ωr). It can be seen that as the PCC nozzle diameter ratio increases, the minimum air–fuel ratio inside the PCC decreases and then increases, and the peak compression temperature in PCC decreases. This is because although the PCC orifice diameter is the largest in the ωr = 4.8% scheme, the probability of the main combustion chamber mixture backflowing into the pre-combustion chamber is higher. However, the natural gas mixture in the PCC is also more likely to flow out, and the amount of fresh mixture that can be retained in the PCC eventually decreases. Furthermore, when the PCC orifice diameter is larger, the total gas flow in the PCC is larger, and the natural gas mixture has a better cooling effect on the PCC, so the peak compression temperature in the PCC is reduced.
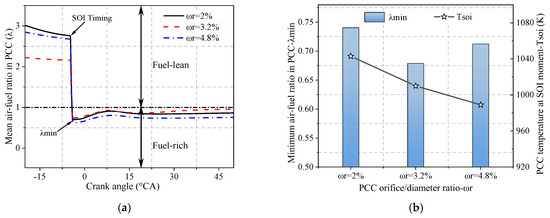
Figure 18.
Mean air–fuel ratio and in-cylinder temperature under different PCC orifice diameter ratios (ωr). (a) Mean air–fuel ratio in PCC. (b) Minimum air–fuel ratio and temperature at SOI moment in PCC.
Figure 19 shows the 1800 K temperature iso-surface distribution inside the combustion chamber at different moments under different PCC orifice diameter ratios. It can be seen that the size of the PCC orifice diameter not only affects the fuel mixing and backflow characteristics in the PCC, but also affects the flame propagation inside the MCC. Figure 18 also shows the 3D distribution of the flame’s front surface, where the flame jet is ejected from the PCC before the piston reaches the top-dead-center position. In addition, the flame jet is stronger once the orifice diameter ratio is 3.2%, while the flame jet in the PCC is stronger and weaker in the other two scenarios. At 5 °CA, the flame under the orifice diameter ratio of 3.2% has propagated to most of the combustion chamber with the fastest flame propagation. In contrast, the flame in the MCC under the orifice diameter ratio of 4.8% has the slowest flame propagation. At 10 °CA, the in-cylinder combustion process in the case of ωr = 3.2% has basically ended, the in-cylinder combustion in the case of ωr = 2% is intense, and the combustion response in the case of ωr = 4.8% is still weak, which indicates that there is a deterioration of combustion in the case of ωr = 4.8%. This is because the flame jet velocity in the PCC in the case of ωr = 4.8% is low, which is easily affected by the turbulence of the in-cylinder airflow disturbance, and cannot ignite the lean in-cylinder mixture in accordance with the PCC’s design angle.
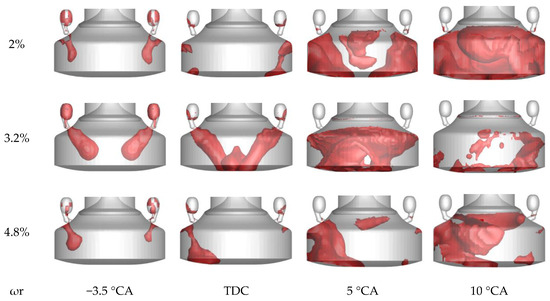
Figure 19.
Temperature iso-surface at 1800 K in the MCC with under different PCC orifice diameter ratios (ωr).
Figure 20a shows the heat release rate of the PCC under different orifice diameter ratios. From Figure 20a, the PCC’s peak combustion heat release rate is highest when ωr = 3.2%. However, when ωr = 4.8%, the peak heat release rate in the PCC is the lowest, and the ignition delay period is the longest. This is because, in the case of ωr = 3.2%, the compression temperature in the PCC is higher, the mixture return flow is moderate, and the air–fuel ratio in the PCC is suitable for combustion. When ωr = 4.8%, the lowest compression temperature in the PCC results in a richer mixture, thus causing a longer ignition delay period. Figure 20b shows the combustion characteristic parameter distributions in the MCC under different orifice diameter ratios. Under the condition that only the PCC geometry is changed and the operating parameters remain unchanged, the combustion characteristic parameters of CA10, CA50, and CA90 of the main combustion chamber are all advanced in the case of ωr = 3.2%, and the combustion duration is shorter. Suppose the pre-chamber orifice diameter ratio is increased or reduced based on the ωr = 3.2% scheme. In that case, the combustion duration will be delayed, indicating that there is an optimal value of the PCC orifice diameter ratio within a certain range.
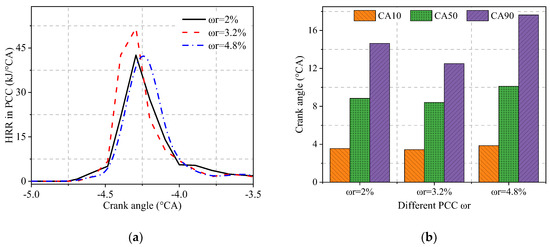
Figure 20.
HRR in PCC and combustion characteristic parameters under different PCC ωr. (a) HRR in PCC. (b) Combustion characteristic parameters of MCC.
As the jet flame enters the MCC through the PCC orifice after the pilot fuel is compressed and ignited, parameters such as the diameter of the PCC orifice, the angle of the orifice, and the shape of the orifice directly affect the flame width, the direction of flame propagation, and the speed of the flame when the flame enters the MCC. When the PCC orifice diameter ratio ωr is too small, the width of the jet flame from the PCC becomes narrower, and it takes longer for the flame to ignite the natural gas mixture in the MCC, thus prolonging the combustion duration.
3.2.2. Effect of PCC Orifice Diameter Ratio on Engine Performance
Figure 21 shows the mean in-cylinder pressure and the HRR of the MCC under different PCC orifice diameter ratios at 100% load. It can be seen that the highest pressure peak in the MCC decreases gradually with the increase in the PCC orifice diameter ratio. In contrast, the phase of the peak in-cylinder pressure that occurs is less affected by the PCC orifice diameter. This is because when the PCC orifice diameter ratio ωr is too large, the PCC jet flame width becomes coarser, but the jet flame speed decreases. This means that the flame needs more time to propagate within the MCC, resulting in a longer MCC combustion duration. As a result, the peak pressure inside the MCC decreases with the increase in the orifice diameter ratio of the PCC. In addition, the peak value of the MCC heat release rate curve is the highest when ωr = 3.2%, which corresponds to an advanced phase and an earlier combustion end time. The peak heat release rates corresponding to the PCC orifice diameter ratios of ωr = 2% and ωr = 3.2% are similar; however, the heat release rate in the case of ωr = 2% is slightly delayed. When ωr = 4.8%, the peak heat release rate is the lowest, the combustion duration is delayed by 4.73 °CA ATDC compared with that of ωr = 3.2%, and the in-cylinder combustion volume stability is poor.
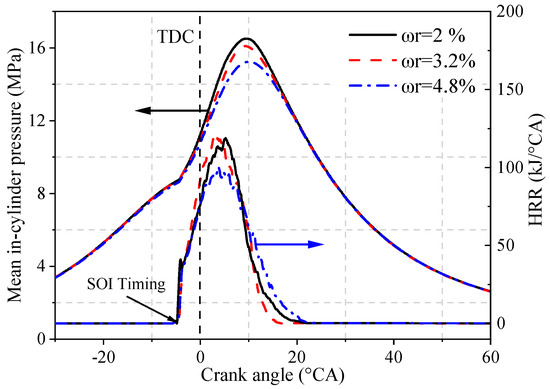
Figure 21.
Mean in-cylinder pressure and HRR under different PCC ωr.
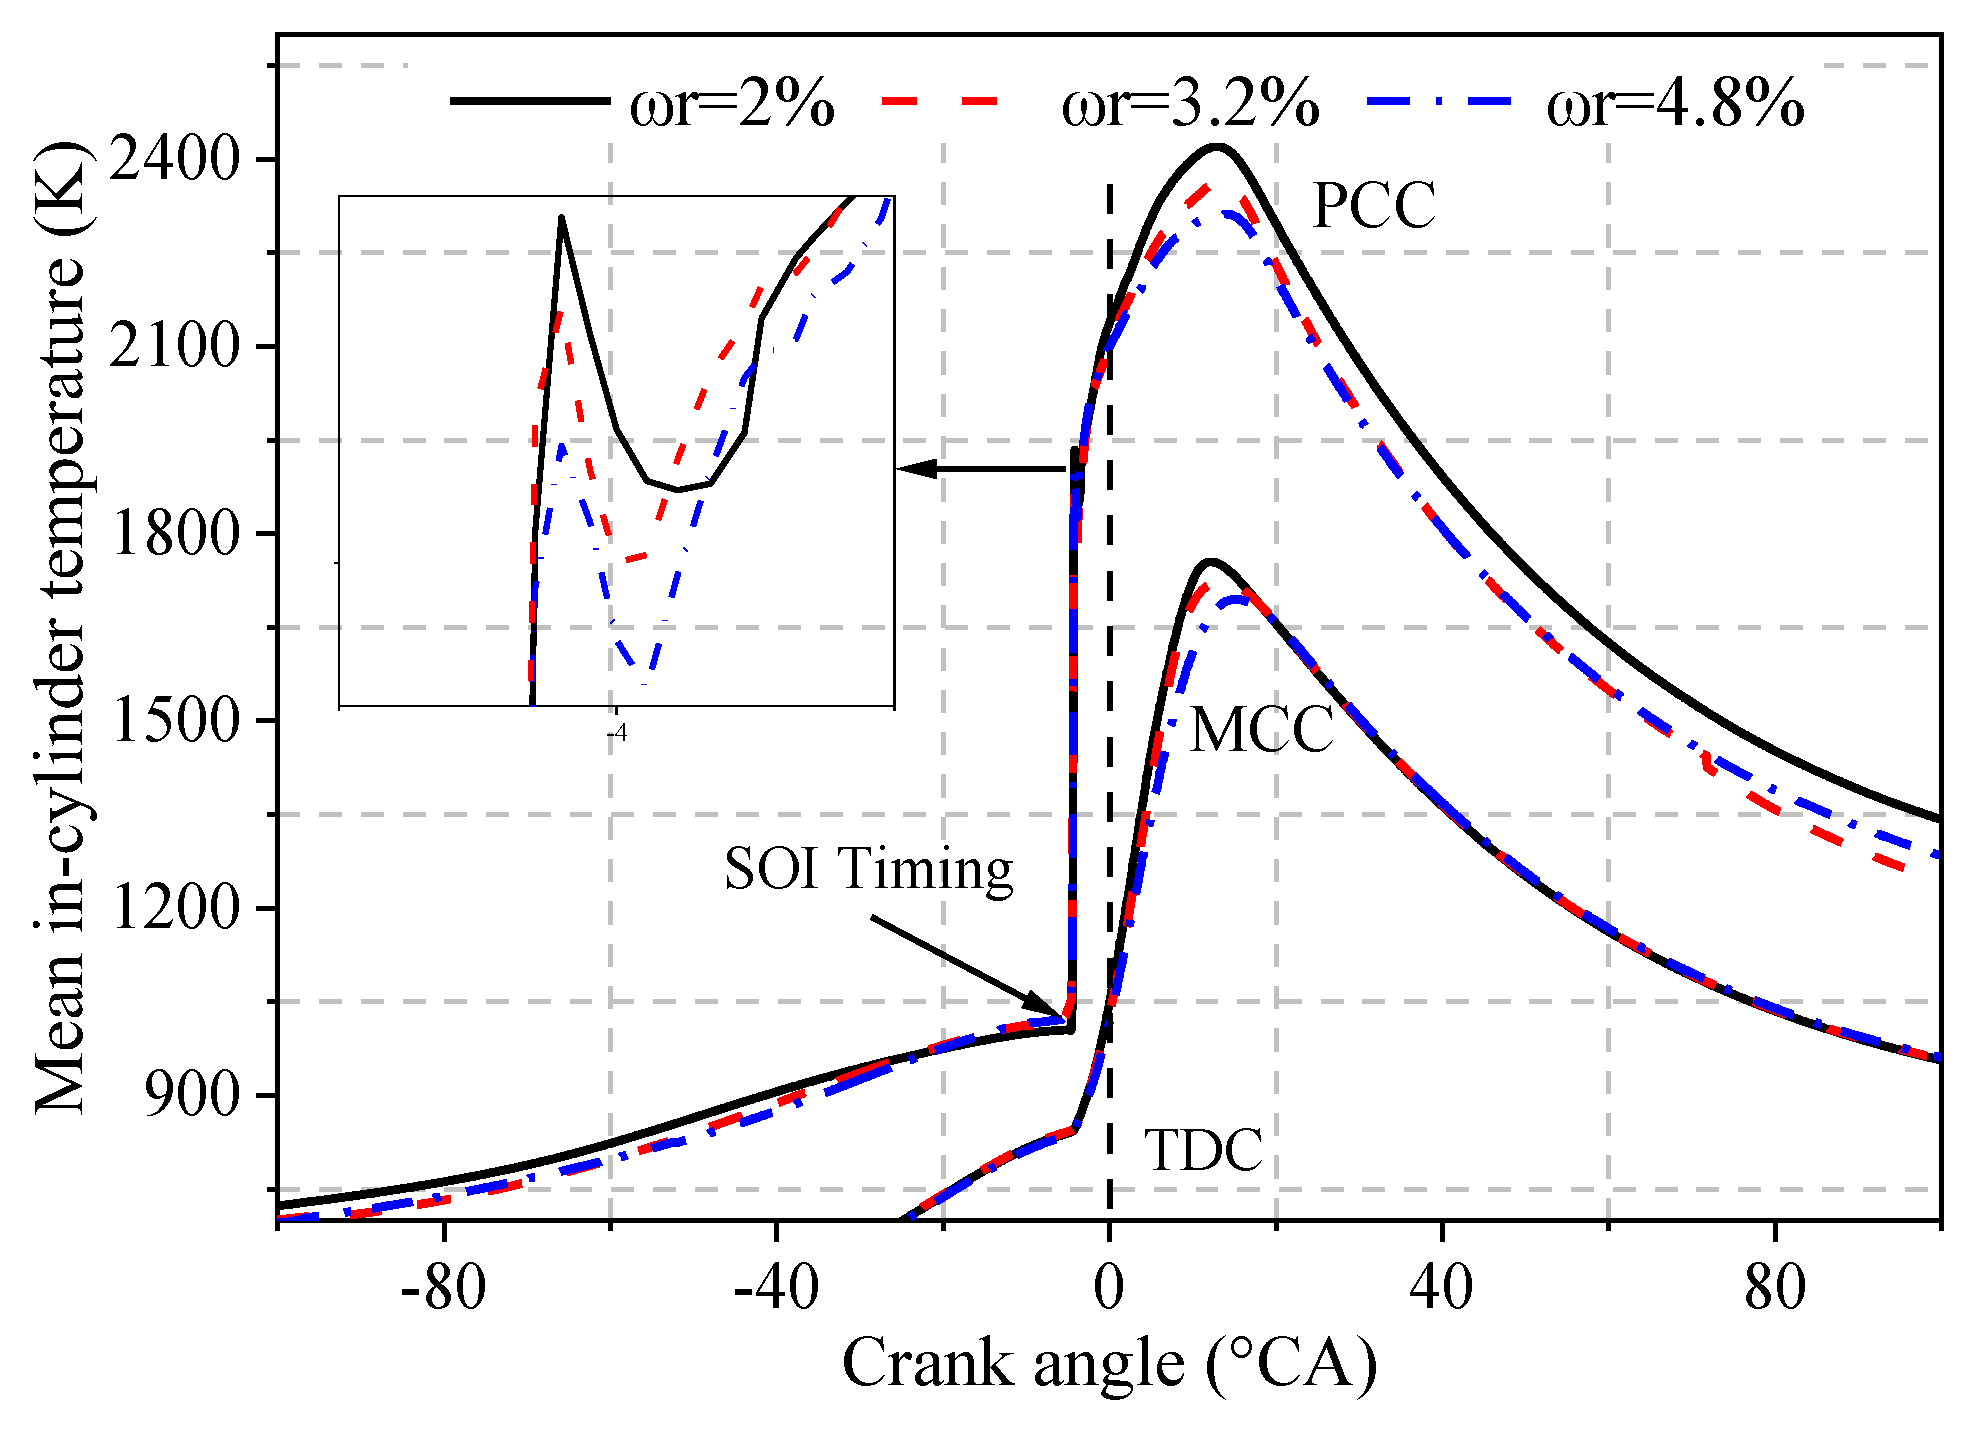
Figure 22 shows the mean in-cylinder temperature under different PCC orifice diameter ratios at 100% load. It can be seen that the maximum combustion temperatures of the MCC and the PCC gradually decrease as the PCC orifice diameter ratio ωr increases, and the decrease in the MCC temperature is smaller than the decrease in the PCC temperature. Under the same fuel injection conditions, the PCC orifice diameter has an important effect on the in-cylinder mixture flow and the engine fuel combustion process. The peak temperature in the pre-combustion chamber is the highest when ωr = 2% and the lowest when ωr = 4.8%. This is because when the PCC orifice diameter ratio is 2%, the PCC outlet is narrow, and the heat resulting from the combustion of the pilot fuel has no time to diffuse and remains inside the PCC, increasing the pre-combustion chamber heat load. Before the SOI moment, the average temperature inside the PCC was highest when ωr = 2% and lowest when ωr = 4.8%, and the temperature distribution pattern is shown in Figure 19.

Figure 22.
Mean in-cylinder temperature under different PCC ωr.
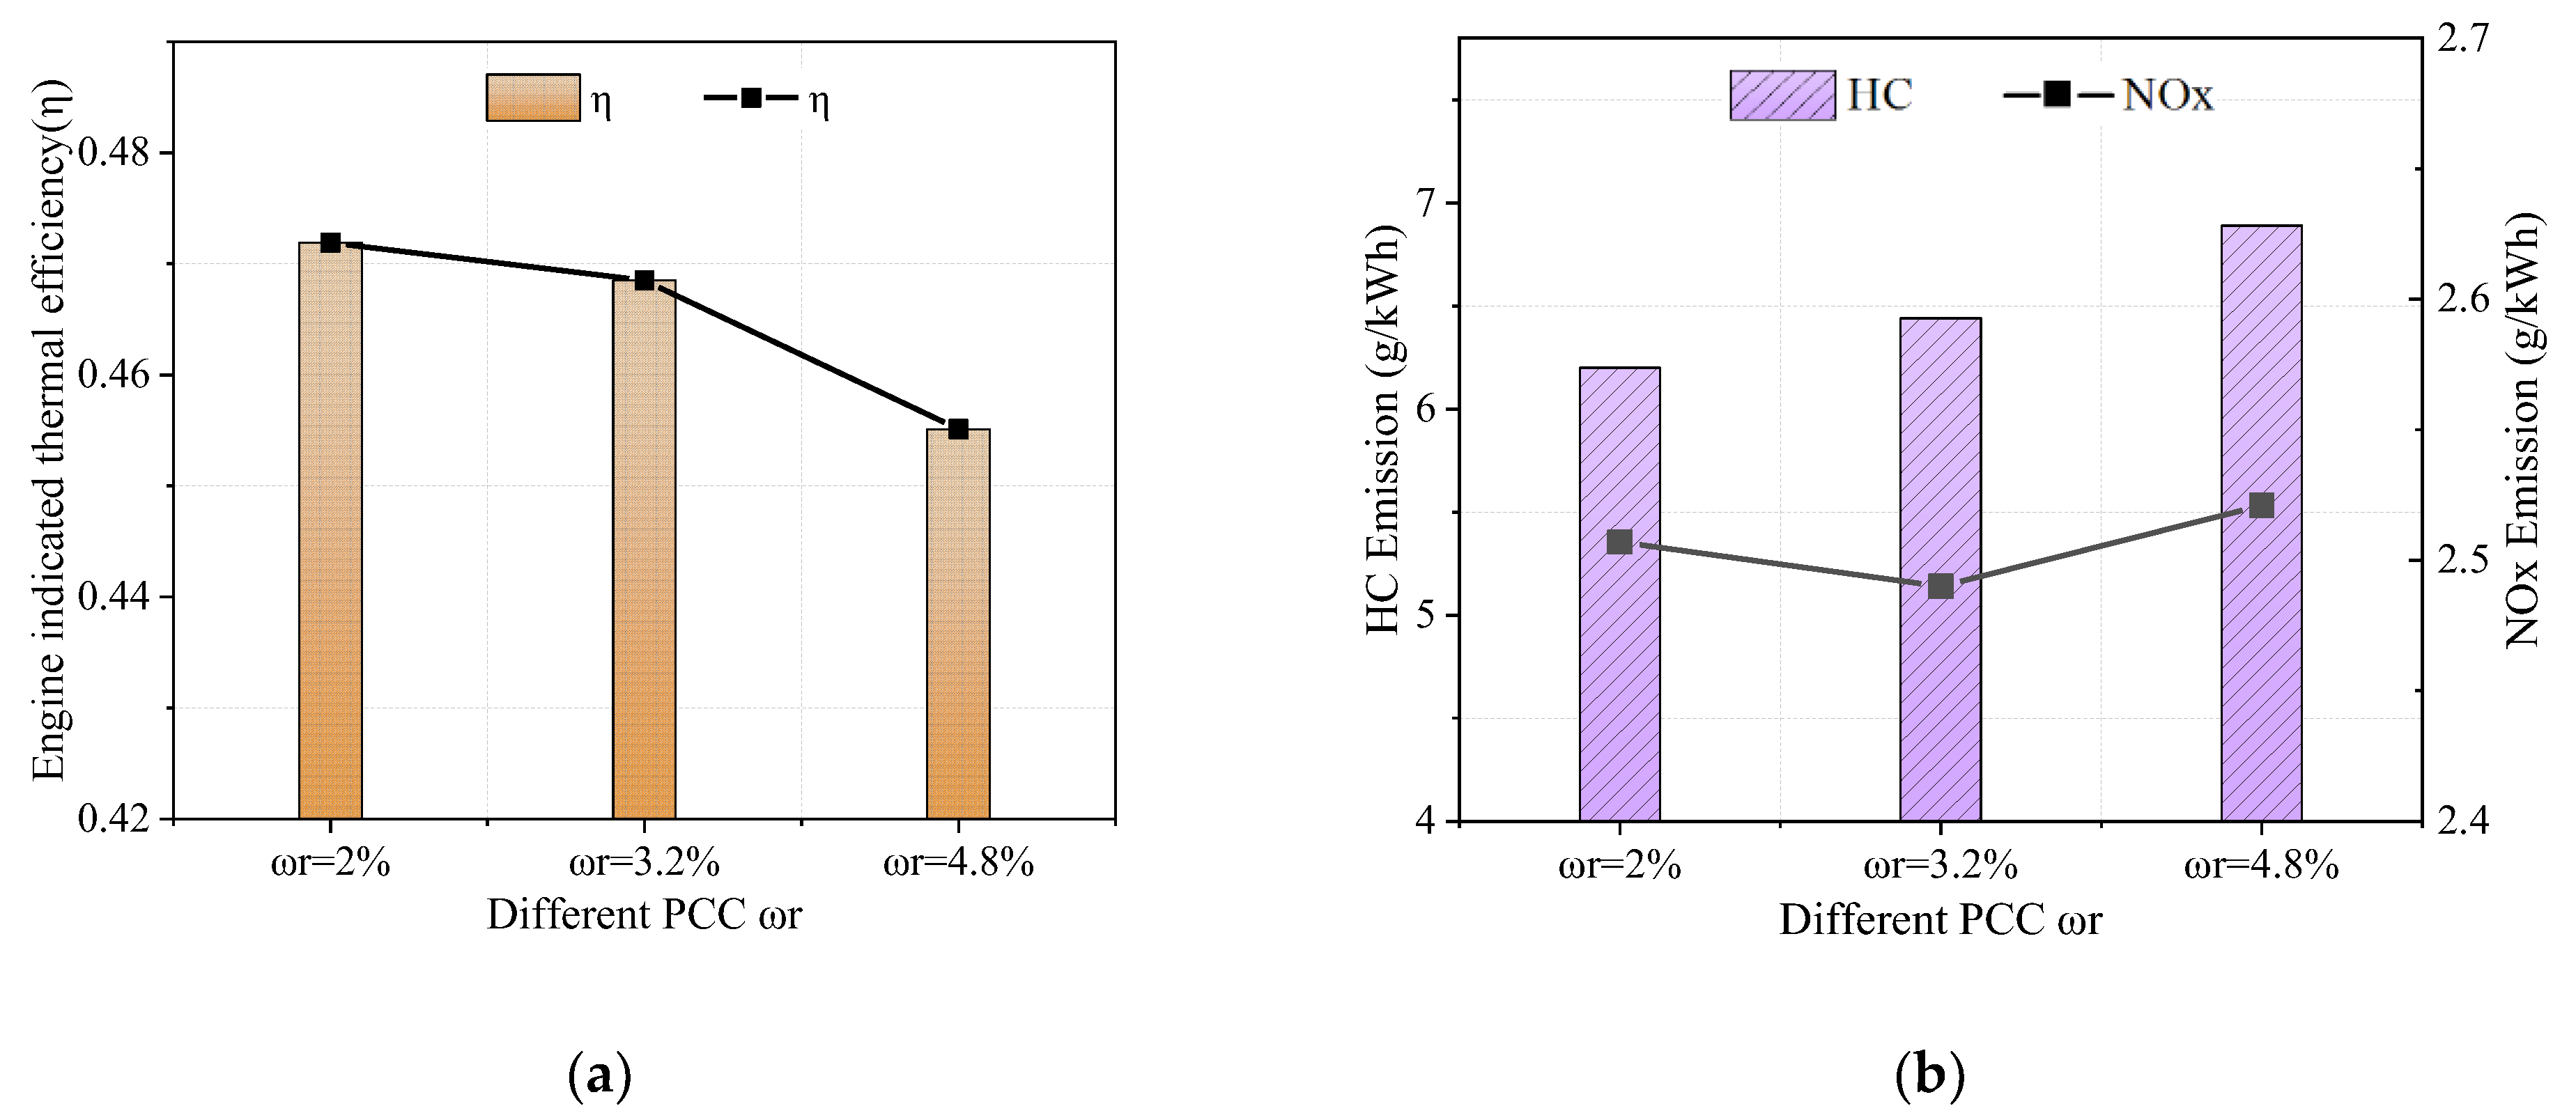
Figure 23a shows the engine indicated thermal efficiency under different PCC orifice diameter ratios. It can be seen that the highest indicated thermal efficiency is achieved under the PCC orifice diameter ratio ωr = 2%, while the lowest effective thermal efficiency is achieved when ωr = 4.8%. This is because when the PCC orifice diameter ratio is higher, the PCC flame jet is coarser, which results in a relatively slower jet igniting the mixture, thus leading to a longer combustion duration and a lower combustion efficiency. Figure 23b shows the HC and NOx emissions of the LPDF engine under different PCC orifice diameter ratios. It can be seen that NOx emissions are the lowest when ωr = 3.2%, while they increase slightly in the other two cases (ωr = 2% and 4.8%). This is because the flame propagation speed is the fastest in the case of ωr = 3.2%. Although the combustion temperature of the MCC is not the highest among the three cases, the combustion duration is very short, and the NOx emissions are the lowest. The HC emissions when ωr = 4.8% are higher than the HC emissions under the other two cases. If the diameter ratio of the PCC orifice is too high or too low, it will affect the reflow characteristics, the fuel’s heat release time, and the flame’s propagation speed in the combustion chamber. This is not conducive to the rapid combustion of the mixture and will lead to the deterioration of low-pressure dual-fuel engine emissions. The graphic data analysis indicates that a proper PCC orifice diameter ratio can improve engine performance and reduce emissions.
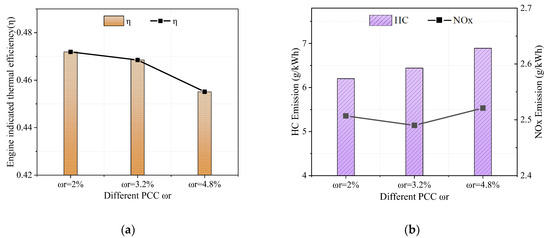
Figure 23.
Engine efficiency and emissions under different PCC ωr. (a) Engine indicated thermal efficiency. (b) NOx and HC emissions.
4. Conclusions
The working process of a two-stroke marine LP-DF engine under different PCC structure schemes based on 3D CFD model simulation calculations has been investigated in this paper. By changing the PCC volume ratio and the PCC orifice diameter, the changes in the mixture composition and air–fuel ratio inside the PCC and the changes in engine combustion and emission performance were studied under different PCC structural schemes. The main conclusions are as follows:
(1) When the PCC volume was small, the flame jet velocity was higher, the stagnation period was shortened, and the combustion process in the main combustion chamber was accelerated. The PCC volume has little effect on the combustion efficiency of the engine. When the PCC volume was large, more methane and oxygen entered into the PCC, and the combustion reaction in the MCC was more intense, which ultimately led to the elevation in the NOx ratio emission.
(2) The diameter of the PCC orifice had an important influence on the reflow characteristics and the jet flame propagation process in PCC. With the increase in PCC orifice diameter ratio (ωr), the minimum air–fuel ratio in the PCC first decreased and then increased, and the peak compression temperature in the PCC decreased. A smaller PCC orifice diameter ratio can increase the tendency of knocking, while an appropriate ratio can improve engine efficiency and reduce the probability of knocking.
Author Contributions
Conceptualization, H.G. and M.Z.; methodology, S.Z.; software, S.Z.; validation, H.G.; formal analysis, M.Z.; investigation, Z.W.; resources, H.G.; data curation, H.G.; writing—original draft preparation, H.G.; writing—review and editing, H.G.; visualization, H.G.; supervision, S.Z.; project administration, Z.W. Translation, M.S. All authors have read and agreed to the published version of the manuscript.
Funding
Supported by the National Key R&D program of China (Grant No. 2022YFB4300701, Dec. 2022–Nov. 2026) and National Key R&D program of China (Grant No. 2022YFB4300704, Dec. 2022–Nov. 2026).
Institutional Review Board Statement
Not applicable.
Informed Consent Statement
Informed consent was obtained from all subjects involved in the study.
Data Availability Statement
No additional data are available.
Conflicts of Interest
The author declares that there are no conflicts of interest regarding the publication of this paper.
References
- Wyer, K.E.; Kelleghan, D.B.; Blanes-Vidal, V.; Schauberger, G.; Curran, T.P. Ammonia emissions from agriculture and their contribution to fine particulate matter: A review of implications for human health. J. Environ. Manag. 2022, 323, 116285. [Google Scholar] [CrossRef]
- Karl, O.; David, R.; Terese, L. Combustion of liquid ammonia and diesel in a compression ignition engine operated in high-pressure dual fuel mode. Fuel 2024, 360, 130269. [Google Scholar] [CrossRef]
- United States Environmental Protection Agency. MARPOL Annex VI. Available online: http://www.epa.gov/enforcement/marpol-annex-vi (accessed on 30 November 2015).
- Park, Y.-K.; Kim, B.-S. Catalytic removal of nitrogen oxides (NO, NO2, N2O) from ammonia-fueled combustion exhaust: A review of applicable technologies. Chem. Eng. J. 2023, 461, 141958. [Google Scholar] [CrossRef]
- Niki, Y.; Nitta, Y.; Sekiguchi, H.; Hirata, K. Diesel Fuel Multiple Injection Effects on Emission Characteristics of Diesel Engine Mixed Ammonia Gas Into Intake Air. J. Eng. Gas Turbines Power 2019, 141, 061020. [Google Scholar] [CrossRef]
- Yousefi, A.; Guo, H.; Dev, S.; Liko, B.; Lafrance, S. Effects of ammonia energy fraction and diesel injection timing on combustion and emissions of an ammonia/diesel dual-fuel engine. Fuel 2022, 314, 122723. [Google Scholar] [CrossRef]
- Li, T.; Zhou, X.; Wang, N.; Wang, X.; Chen, R.; Li, S.; Yi, P. A comparison between low- and high-pressure injection dual-fuel modes of diesel-pilot-ignition ammonia combustion engines. J. Energy Inst. 2022, 102, 362–373. [Google Scholar] [CrossRef]
- Zhou, W.J.; Zhou, S.; Xi, H.Y.; Shreka, M.; Zhang, Z. Numerical study on the effect of fuel rich n-heptane on in-cylinder fuel reforming characteristics in an HCCI engine. Int. J. Chem. Eng. 2021, 2021, 1–14. [Google Scholar] [CrossRef]
- Duan, X.; Zhang, S.; Liu, Y.; Li, Y.; Liu, J.; Lai, M.-C.; Deng, B. Numerical investigation the effects of the twin-spark plugs coupled with EGR on the combustion process and emissions characteristics in a lean burn natural gas SI engine. Energy 2020, 206, 118181. [Google Scholar] [CrossRef]
- Guo, H.; Zhou, S.; Zou, J.X.; Majed, S. A numerical study on the pilot injection conditions of a marine 2-stroke lean-burn dual fuel engine. Processes 2020, 8, 1396. [Google Scholar] [CrossRef]
- Li, Y.; Chen, Y.; Wu, G. A new skeletal mechanism for diesel-n-butanol blends combustion in engine. Fuel 2020, 264, 116856. [Google Scholar] [CrossRef]
- Lebedevas, S.; Pukalskas, S.; Daukšys, V.; Rimkus, A.; Melaika, M.; Jonika, L. Research on Fuel Efficiency and Emissions of Converted Diesel Engine with Conventional Fuel Injection System for Operation on Natural Gas. Energies 2019, 12, 2413. [Google Scholar] [CrossRef]
- Liu, J.; Yang, F.; Wang, H.; Ouyang, M.; Hao, S. Effects of pilot fuel quantity on the emissions characteristics of a CNG/diesel dual fuel engine with optimized pilot injection timing. Appl. Energy 2013, 110, 201–206. [Google Scholar] [CrossRef]
- Raihan, M.S.; Guerry, E.S.; Dwivedi, U.; Srinivasan, K.K.; Krishnan, S.R. Experimental analysis of diesel-ignited methane dual-fuel low-temperature combustion in a single-cylinder diesel engine. J. Energy Eng. 2015, 141, C4014007. [Google Scholar] [CrossRef]
- Wu, Z.; Rutland, C.J.; Han, Z. Numerical evaluation of the effect of methane number on natural gas and diesel dual-fuel combustion. Int. J. Engine Res. 2019, 20, 405–423. [Google Scholar] [CrossRef]
- Kokabi, H.; Najafi, M.; Jazayeri, S.A.; Jahanian, O. Hydrogen and propane implications for reactivity controlled compression ignition combustion engine running on landfill gas and diesel fuel. Int. J. Hydrogen Energy 2021, 46, 31903–31915. [Google Scholar] [CrossRef]
- Kakaee, A.-H.; Rahnama, P.; Paykani, A. Influence of fuel composition on combustion and emissions characteristics of natural gas/diesel RCCI engine. J. Nat. Gas Sci. Eng. 2015, 25, 58–65. [Google Scholar] [CrossRef]
- Duan, X.; Wang, H.K.; Li, Y.; Guo, H.; Liu, J. Numerical simulation the effect of hydrogen addition on the flame propagation and emissions formation in a large-bore lean-burn natural gas SI engine. Energy 2020, 9, 62. [Google Scholar]
- Li, R.; Herreros, J.M.; Tsolakis, A.; Yanget, W. Chemical kinetic study on ignition and flame characteristic of polyoxymethylene di-methyl ether 3 (PODE3). Fuel 2020, 279, 118423. [Google Scholar] [CrossRef]
- Gong, Z.; Feng, L.; Wei, L.; Qu, W.; Li, L. Shock tube and kinetic study on ignition characteristics of lean methane/n-heptane mixtures at low and elevated pressures. Energy 2020, 197, 117242. [Google Scholar] [CrossRef]
- Maghbouli, A.; Saray, R.K.; Shafee, S.; Ghafouri, J. Numerical study of combustion and emission characteristics of dual-fuel engines using 3D-CFD models coupled with chemical kinetics. Fuel 2013, 106, 98–105. [Google Scholar] [CrossRef]
- Zhu, L.; Li, B.; Li, A.; Ji, W.; Qian, Y.; Lu, X.; Huang, Z. Effects of fuel reforming on large-bore low-speed two-stroke dual fuel marine engine combined with EGR and injection strategy. Int. J. Hydrogen Energy 2020, 45, 29505–29517. [Google Scholar] [CrossRef]
- Zheng, J.; Wang, J.; Zhao, Z.; Wang, D.; Huang, Z. Effect of equivalence ratio on combustion and emissions of a dual-fuel natural gas engine ignited with diesel. Appl. Therm. Eng. 2019, 146, 738–751. [Google Scholar] [CrossRef]
- Mavrelos, C.; Theotokatos, G. Numerical investigation of a premixed combustion large marine two-stroke dual fuel engine for optimising engine settings via parametric runs. Energy Convers. Manag. 2018, 160, 48–59. [Google Scholar] [CrossRef]
- Maghbouli, A.; Shafee, S.K.; Saray, R.; Yang, W. A multi-dimensional CFD-chemical kinetics approach in detection and re-duction of knocking combustion in diesel-natural gas dual-fuel engines using local heat release analysis. SAE Int. J. Engines 2013, 6, 777–787. [Google Scholar] [CrossRef]
- Zhou, W.J.; Xi, H.Y.; Zhou, S.; Zhang, Z.; Shreka, M. Numerical study on knock characteristics and mechanism of a heavy duty natural gas/diesel RCCI engine. Int. J. Hydrogen Energy 2022, 47, 37072–37089. [Google Scholar] [CrossRef]


Disclaimer/Publisher’s Note: The statements, opinions and data contained in all publications are solely those of the individual author(s) and contributor(s) and not of MDPI and/or the editor(s). MDPI and/or the editor(s) disclaim responsibility for any injury to people or property resulting from any ideas, methods, instructions or products referred to in the content. |
© 2024 by the authors. Licensee MDPI, Basel, Switzerland. This article is an open access article distributed under the terms and conditions of the Creative Commons Attribution (CC BY) license (https://creativecommons.org/licenses/by/4.0/).