Article

Numerical Study on the Anti-Sloshing Effect of Horizontal Baffles in a Cargo Hold Loaded with Liquefied Cargo

1
State Key Laboratory of Ocean Engineering, School of Naval Architecture, Ocean and Civil Engineering, Shanghai Jiao Tong University, Shanghai 200240, China
2
School of Naval Architecture and Maritime, Zhejiang Ocean University, Zhoushan 316022, China
3
Guangzhou Branch, China Classification Society, Guangzhou 510235, China
*
Author to whom correspondence should be addressed.
J. Mar. Sci. Eng. 2024, 12(7), 1234; https://doi.org/10.3390/jmse12071234
Submission received: 20 June 2024 / Revised: 11 July 2024 / Accepted: 19 July 2024 / Published: 22 July 2024

Abstract

:
Sloshing of liquefied bulk granular cargoes weakens the stability of cargo carriers when at sea. Using the horizontal rectangle baffle is a promising way to restrain its sloshing motion. But the location height and optimal baffle area rate to achieve a better anti-sloshing effect should be studied first. The discrete element method was adopted to establish the simulation model, and the direct shear test was used for verification. Through the static tilt tests, the definite relationship between the effects of moisture content on cargo motion and particle friction coefficients was acquired. Then, liquefied cargo motion in a cargo hold without baffles and with one and two pairs of horizontal baffles was simulated. Based on variations in the cargo gravity center offset and the sloshing-induced force on the cargo hold, the anti-sloshing effect of different settings of the baffles was compared. Results show that the baffles have the ability to restrain cargo sloshing, and this is important for sea transportation safety. The anti-sloshing effect is better when the baffle plane is right on the cargo top surface compared to the other location heights. Further, there is an optimal length–width combination, e.g., a single baffle plane with a length of 0.26 L and a width of 0.46 B, at which a better anti-sloshing effect could be achieved with the smallest baffle area rate. This study could be useful for the practical application of horizontal baffles for bulk granular cargo carriers.

1. Introduction

When transported by sea, liquefiable cargo such as iron ore or nickel ore is likely to liquefy and behave like a fluid in the cargo hold under the action of external loads [1]. Due to its high density and complicated rheological properties [2], it is hard to return such cargo fully once it has shifted to one side of the cargo hold. When cargo is piled up on one side, the carriers may list or even capsize in severe sea conditions [3]. The liquefaction of bulk granular cargoes during sea transportation is primarily related to the mechanical properties between the ore particles and the moisture content. When the frictional forces among the ore particles decrease to a certain extent, the particles lose their stability and form a flow state [4]. And so, liquefaction happens, which increases the risk of the ship capsizing [5,6]. For example, bulk carrier Nur Allya carrying nickel ore disappeared near Buru Island on 20 August 2019. All of the 27 seafarers onboard drowned. The likely root cause is reported as cargo liquefaction. The nickel ore when initially loaded and after being liquefied and the carrier capsizing accident are shown in Figure 1.
The liquefaction of granular bulk cargoes has attracted widespread attention. For example, to determine the TML (transportable moisture limit) of IOF (iron ore fines), the effect of particle size distribution has been investigated using flow table and proctor tests [8,9]. A parametric study of factors influencing cargo and ship stability has been carried out by using the developed fully coupled dynamic finite element analysis and constitutive model of unsaturated soils [10]. The liquefaction process of nickel ore has been studied by the Japan Classification Society (Class NK) with different water content levels under the action of horizontal harmonic cyclic loading. It indicates that there is a close relationship between liquefaction and water content [11]. Based on the discrete element method (DEM) and the UBCSAND constitutive model, the liquefaction process of liquefiable cargo has been simulated, and the key parameters that trigger cargo liquefaction have also been discussed [12]. Also using the DEM, the fluidization of iron concentrate was simulated by Zhou et al. [13]. They suggested that the DEM is a favorable way to analyze macro- and micro-mechanisms during liquefaction. The DEM divides the research object into a certain number of disc-shaped or spherical particle units so that the particle movement and the interaction between them can be analyzed from a microscopic view. Compared to solving the full relations between particles, pore water, and air, the DEM is a reasonable and available method to deal with saturated and unsaturated particle materials. But to achieve reliable and accurate simulation results, the calculation efficiency, particle size effect, and calibration of particle friction coefficients are still the key issues that should be dealt with carefully. Furthermore, the liquefied cargo is assumed to be a kind of fluid, and the computational fluid dynamics (CFD) method has also been well demonstrated to capture and track the complex surfaces of the sloshing of high-viscosity fluids. The sectional load and torsional moment of slurry cargo have been calculated with various cargo shifting scenarios [14]. By analyzing wave spectra and vessel motion and shear force on the cargo hold, the transportation risk of liquefiable cargo for different sea routes was analyzed quantitatively [15].
Anti-sloshing baffles are usually used to reduce the impact on hold structures induced by liquid sloshing so as to assure the safety of sea navigation. Following this idea, lots of research on the effect of anti-sloshing baffles has been carried out. The influence of baffle height and length for horizontal and vertical baffles on the structure response of the sloshing tank was studied [16]. The anti-sloshing effect of a vertical perforated baffle placed in the center of a rolling rectangular tank was investigated by the potential-based analytical solution [17]. The energy dissipation mechanism and efficient design of the porous baffle as an anti-sloshing device were all discussed. The baffle effect with different heights placed in the middle of a tank was investigated by numerical simulations [18]. The authors concluded that under some filling conditions, the sloshing at the resonant frequency could be alleviated effectively. But it may lead to more severe flows under other filling conditions. For liquid water sloshing, the dynamic pressure in a rotating cylindrical container was checked, and the relation between sloshing and swirling water was studied [19]. Molin and Fourest [20] have numerically studied a forward-wave suppression arrangement consisting of a series of grids placed vertically at certain distances. It was pointed out that the grid number and the spacing and ratio of grid plates are the main parameters affecting the wave elimination effect. Based on potential flow theory, Molin [21] established the hydrodynamic models of various open-hole structures applied in engineering practice. It was found that the open-hole structure is an effective method to reduce the inertial and the blasting loads, as well as to increase the damping of resonance response. Experimental and numerical tests have been carried out by Chu [22] to study the liquid sloshing motion when multiple baffles are mounted on the bottom of a tank. Compared with a single baffle, the anti-sloshing effect of multiple baffles was better. The numerical and experimental results of Miles [23] and Beam et al. [24] show that the liquid sloshing amplitude could be reduced regardless of whether the baffle is rigid or flexible, and the sloshing inhibition effect of a flexible annular baffle is more obvious than that of a rigid one. And so, a rotating baffle with open holes was proposed by Maltinsen and Tammokha [25] to reduce the sloshing impact. To change the dynamic characteristics of the oscillating fluid, porous media were placed in a tank by Tsao et al. [26]. It was shown that the delivery of porous media can also control the shaking. The Navier–Stokes equations were solved numerically by Celebi and Akyildiz [27]. The free liquid surface was captured by the VOF method, and the fluid motion of a partially filled rectangular tank was simulated. It is suggested that the anti-sloshing effect of vertical baffles is the most significant at a lower liquid load rate. To reduce the shaking effect, a vertical baffle was investigated by Wang et al. [28]. And it was shown that adjusting the baffle movement is an efficient way. Cho and Lee [29] have studied the sloshing problem of a two-dimensional rectangular tank with horizontal baffles mounted on both sides of the tank, considering simple harmonic horizontal excitation. For the fluid above the baffle, variations in its movement and dynamic pressure were more significant compared with the flow under the baffle. Further, multiple horizontal baffles were proposed [30], and the number, installation height, and opening width of the baffles have also been studied. But, considering the weight the baffle brings to a vessel, advanced materials, e.g., graphene, could be used to make a new-fashioned one [31].
In general, liquid sloshing in a tank has already been studied comprehensively, and various baffles have been adopted and studied. And the sloshing of liquid water is the issue of most concern at present. Different from liquid water, liquefiable cargo has three phases naturally; for example, the solid particle, the water, and the air exist in the particle pores. After being liquefied, its rheological properties are closer to non-Newtonian fluids. As already discussed above, the sloshing motion of the liquefied cargo has a larger impact on ship stability, and the anti-sloshing baffle is a promising method to suppress its movement. It is noted that the bulldozer enters the cargo hold to pile up cargo for unloading operations. To facilitate this, the baffle should be retracted during port operations. During sea voyages, the baffle should also be put down to suppress cargo motion. Considering both the motion characteristics of the liquefied cargo and the convenience of cargo operations, the horizontal baffle was recommended and its anti-sloshing effect was investigated in this research.
This research aims to improve sea transportation safety for bulk granular cargoes. So, horizontal rectangle baffles were proposed, and their location, height, and baffle plane sizes should be considered and investigated. By adopting the DEM, plenty of simulation and verification work was completed. And finally, considering both the anti-sloshing effect and the minimum baffle plane area rate, the optimal baffle length and width were suggested.
And the whole text is arranged as follows. In Section 2, the theoretical background and the rolling resistance linear model are primarily presented. In Section 3, sensitivity analysis of simulation time steps and particle sizes is carried out first. Results of the direct shear test are used for verification. To acquire the corresponding relations between moisture content and particle friction coefficients, the numerical static tilt tests are also used. And in Section 4, the sloshing motion of liquefied cargo in a cargo hold without baffles and with one and two pairs of horizontal baffles is simulated. The results under different baffle heights and baffle plane area rates are compared and discussed. Finally, the conclusions of this paper are summarized in Section 5.

2. Theoretical Background of DEM

In the DEM, particles are considered rigid, permitting soft contact between them. The particle motion is described by the motion equations. The position and velocity of each particle is updated during each time step. The contact behaviors and the corresponding forces and moments are calculated based on the rolling resistance linear model.

2.1. Particle Motion Equation

The particle motion equation describes the translational and rotational motion of a single particle. Its vector form is as follows [32].
F = m ( x ¨ g ) ,   translational   motion
L = I ω ,   r o t a t i o n a l   m o t i o n
M = L ˙ = I ω ˙ + ω × L
where   F is the join force, including gravity and contact forces ( F c ). m is the mass of a particle. x ¨ is the acceleration, and g represents the gravity. L is angular momentum, I is inertia tensor, and ω is the angular velocity of a particle. M is the resultant moment, which includes the gravity moment and the contact moment M c . The linear contact behavior of two particles and the forces are shown in Figure 2.
The behavior of an infinitesimal interface was included in this model. The contact force was divided into linear and damping components. The former provides linear elastic and frictional properties, while the latter offers viscous properties. The linear force is generated by linear springs with constant normal stiffness ( k n ) and shear stiffness ( k s ). The damper force is given in terms of normal and shear critical damping ratios, which are β n   and β s , respectively.
The contact force F c and moment M c are presented as below.
F c = F l + F d
M c = M r
where F l is the linear force and F d is the damping force. The contact model can directly act on the contacts of ‘ball-ball’ and ‘ball-wall’. When the surface gap ( g s ) between the entities is less than or equal to zero, the contact model is immediately activated. g s is defined by the difference in the contact gap ( g c ) and the reference gap ( g r ). M r is the rolling resistance moment and is provided by the following rolling resistance linear model.
The motion equation is solved by the Verlet algorithm [34], and the second accuracy is provided. Assuming that the equation was solved at time t in the previous cycle, the current cycle has a time step of t . Then, the values of the velocity x ˙ and the angular velocity ω are calculated at t + t / 2 , and the other variables (position x , acceleration x ¨ , angular acceleration ω ˙ , resultant force F , and resultant moment M ) are calculated at t + t . The rolling resistance linear model is also adopted in the present research and described below.

2.2. Rolling Resistance Linear Model

This model is a contact constitutive model developed by adding rolling resistance to the linear model. When effective contact occurs, there is not only contact force between the contact entities but also contact torque caused by the relative rotation between the entities. With the relative motion between entities, the contact force and moment are iteratively updated. For the actual motion of iron ore concentrate under external excitation, the individual particle includes three-dimensional rotation in addition to two-dimensional translation or sliding. Therefore, the rolling resistance linear model more reasonably fits this condition.
And F l   includes the linear normal force F n l and the linear shear force F s l based on the following equations.
F n l = k n g s ,   g s < 0 0 ,   g s 0
F s l = F s * , | | F s * | | F s μ   F s μ ( F s * / | | F s * | | ) , otherwise
where F s * is the trail shear force and F s μ is the shear strength. The contact starts to slide when the shear force reaches the shear strength. And the forms of F s * and F s μ are as below.
F s * = ( F s l ) 0 k s δ s F s μ = μ F n   l
where ( F s l ) o is the linear shear force at the beginning of the time step. δ s is the adjusted relative shear displacement increment, and μ is the particle friction coefficient. Substituting Equation (8) into Equation (7), the specific form of F s l is given as follows.
F s l = ( F s l ) o k s δ s ,   | | ( F s l ) o k s δ s | | μ F n l μ F n l [ F s l o k s δ s ) / | | F s l o k s δ s | | ] ,   otherwise
And the rolling resistance moment M r is updated through the following steps.
M r M r k r θ b
where θ b is the relative bend–rotation increment. k r is the rolling resistance stiffness and given as below.
k r = k s R ¯ 2
where R ¯ is the effective contact radius. The magnitude of the updated rolling resistance moment M r is then checked against a threshold limit:
M r = M r ,   | | M r | | M * M * ( M r / | | M r | | ) ,   otherwise
where M * is the limited torque limit value, defined as M * = μ r R ¯ F n l . μ r is the rolling friction coefficient.
In the DEM, the interaction between particles is regarded as a dynamic process. The contact forces and displacements between particles are obtained by tracking the movements of individual particles. The calculation of discrete elements adopts a time step algorithm. At the beginning of each time step, Newton’s second law of motion and force–displacement equation is used to calculate and iterate. The velocity and position of each particle are updated, as well as the velocity of the wall being specified and the position of the wall being updated. The rolling resistance linear model is used to update the contact force and moment between particles and the forces between particles and the wall. The Particle Flow Code (PFC3D) was adopted here to carry out the simulations [35].

3. DEM Model Setup and Numerical Verification

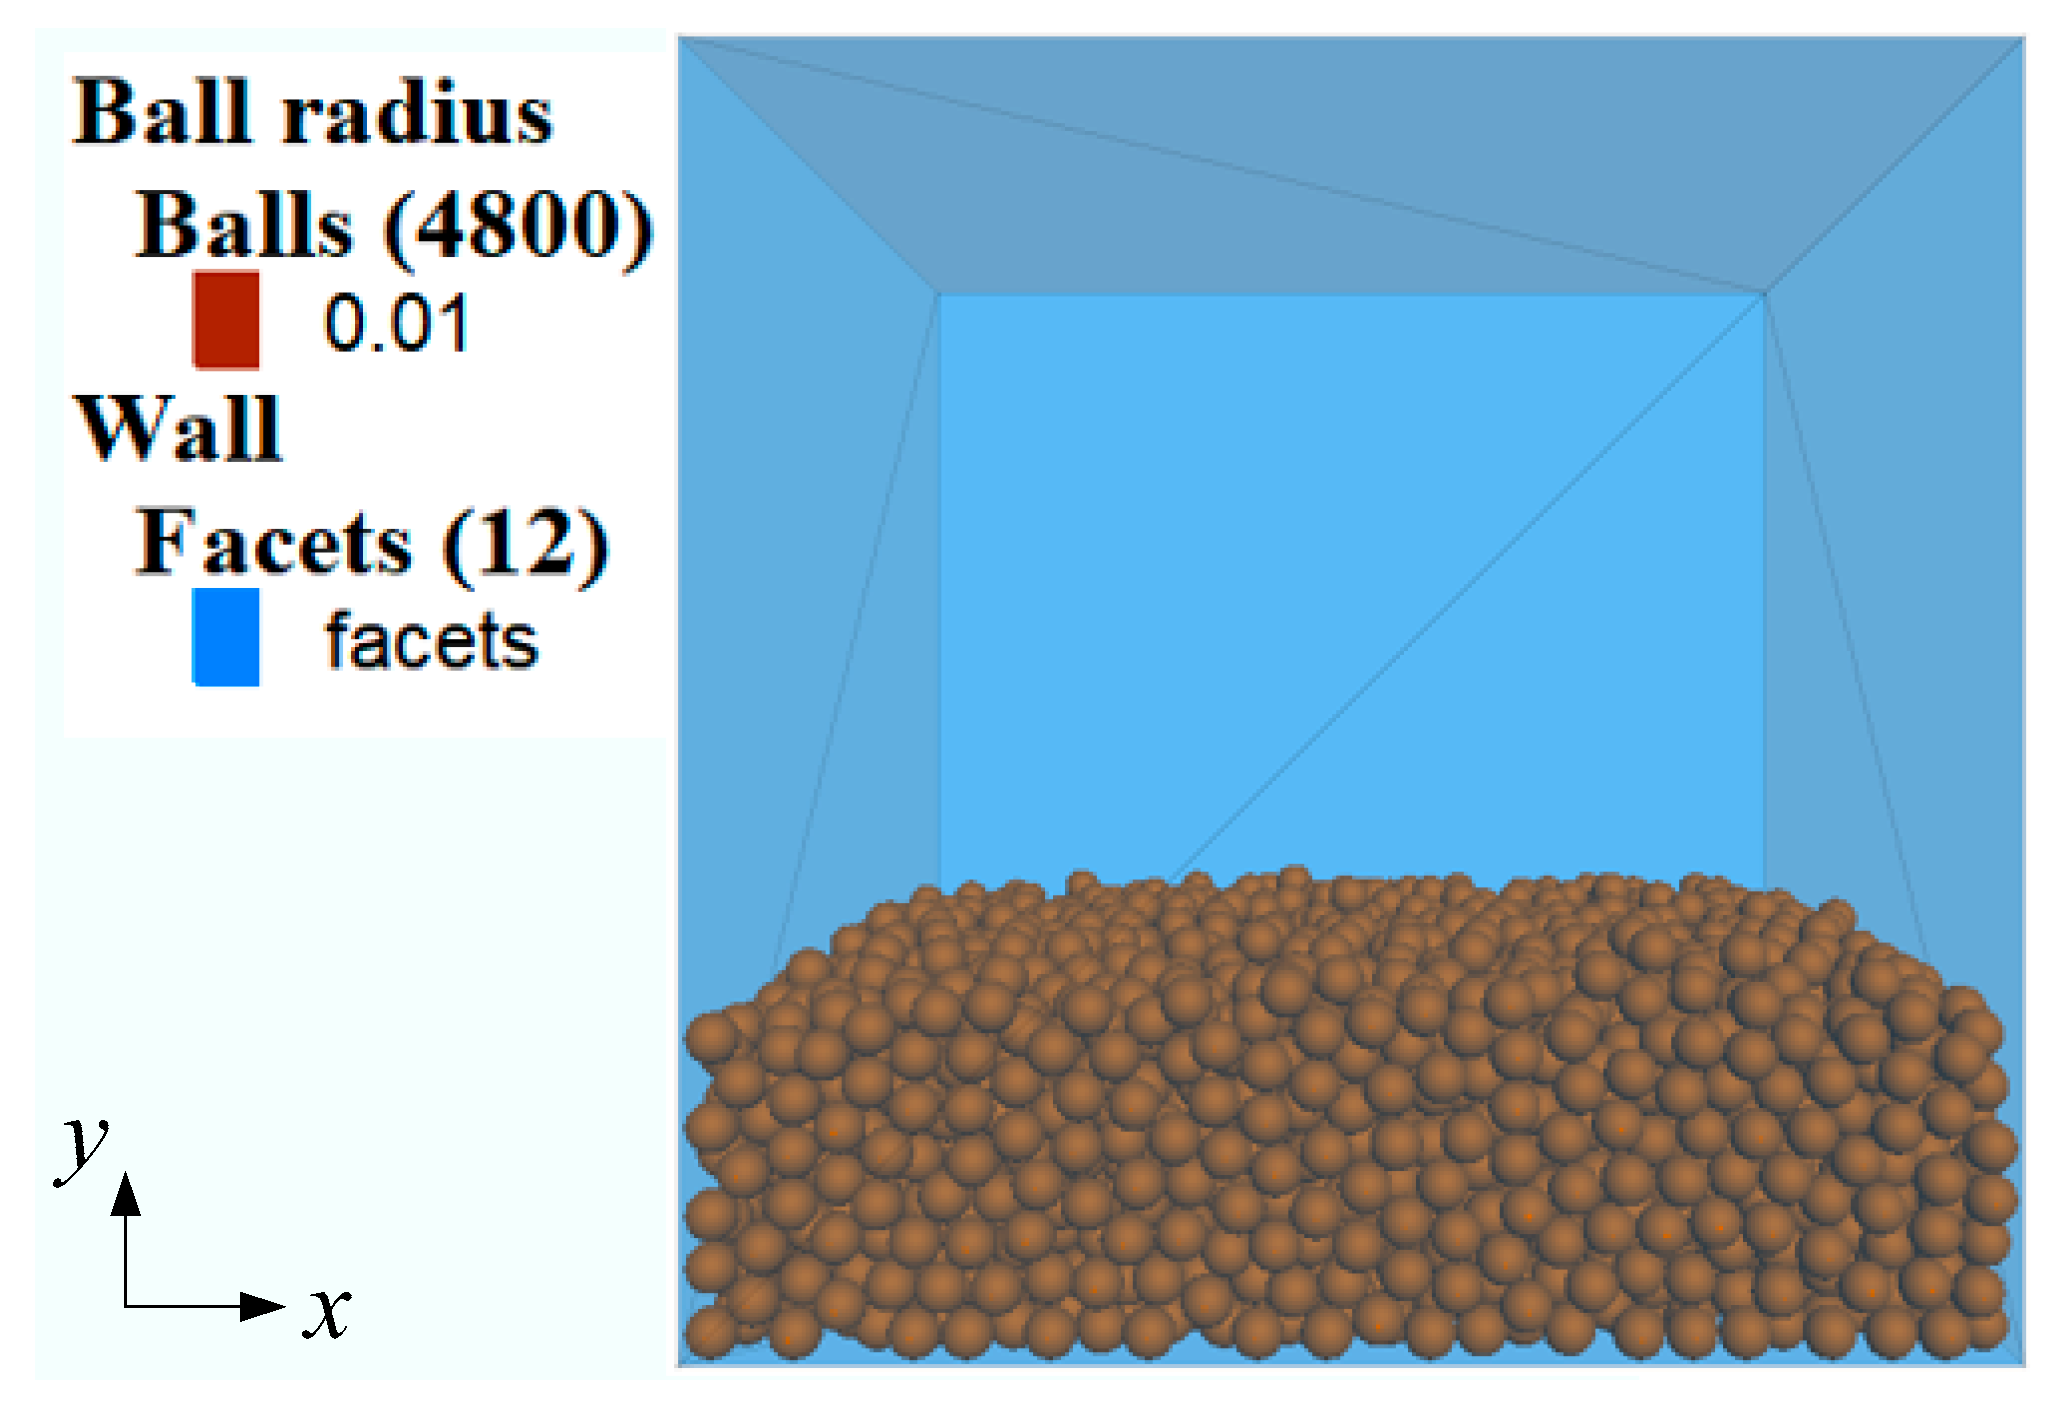
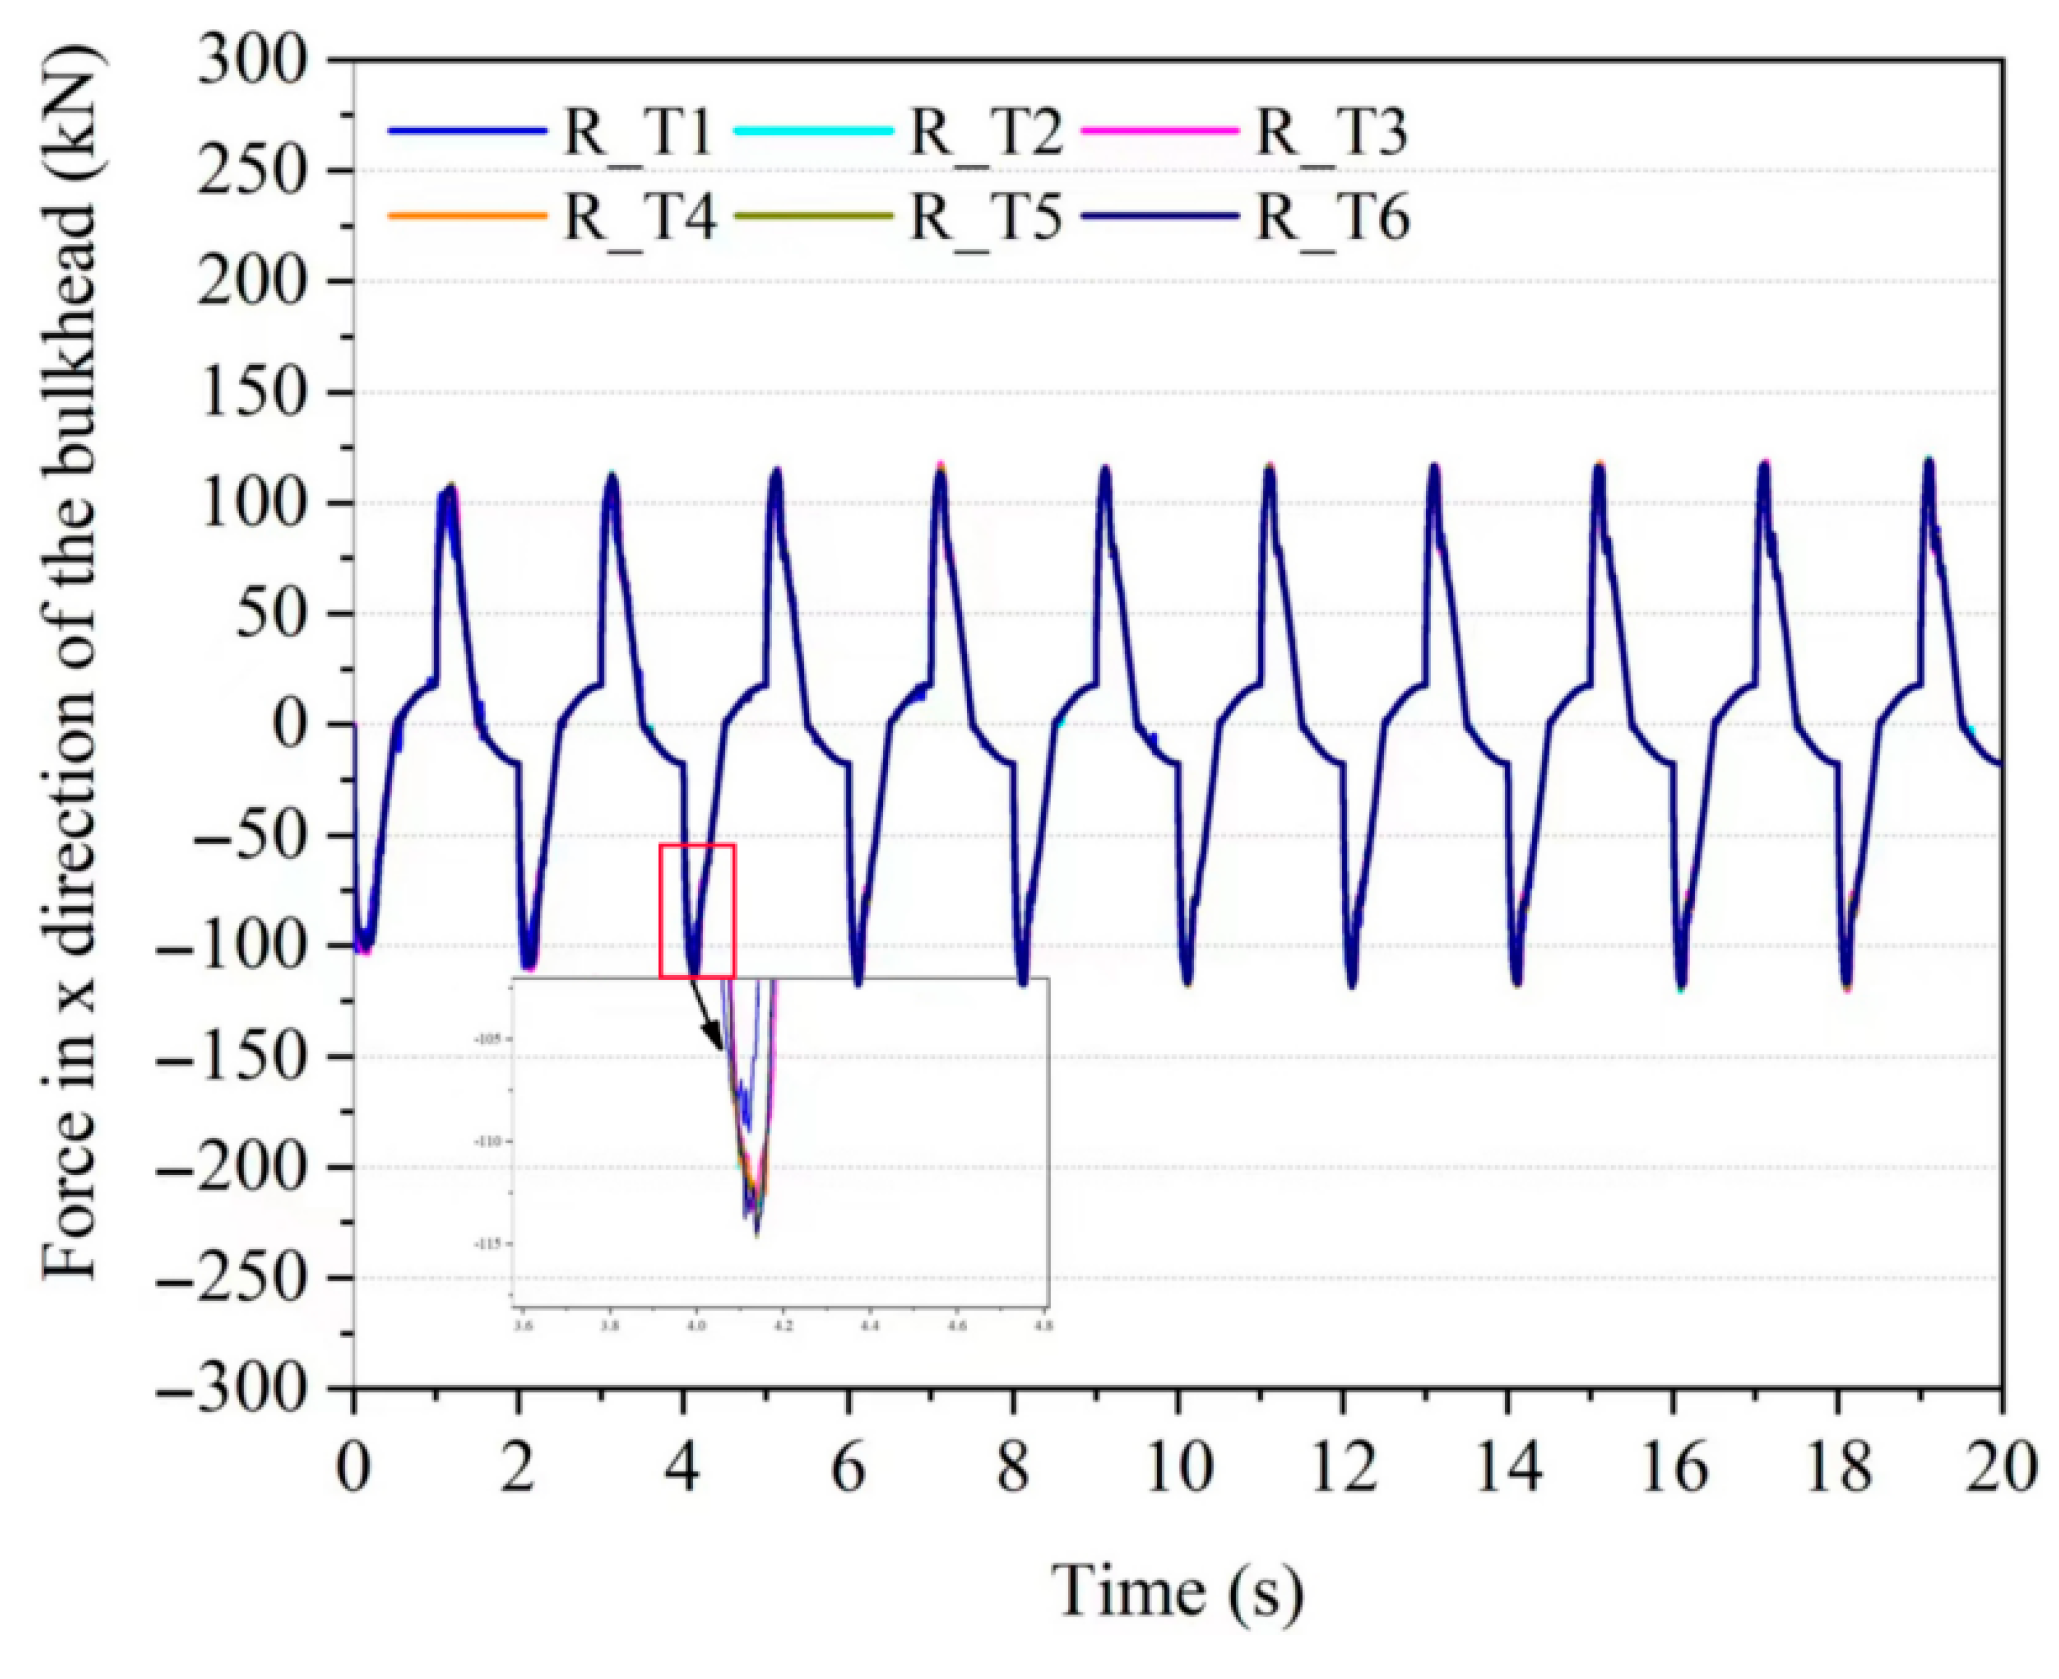
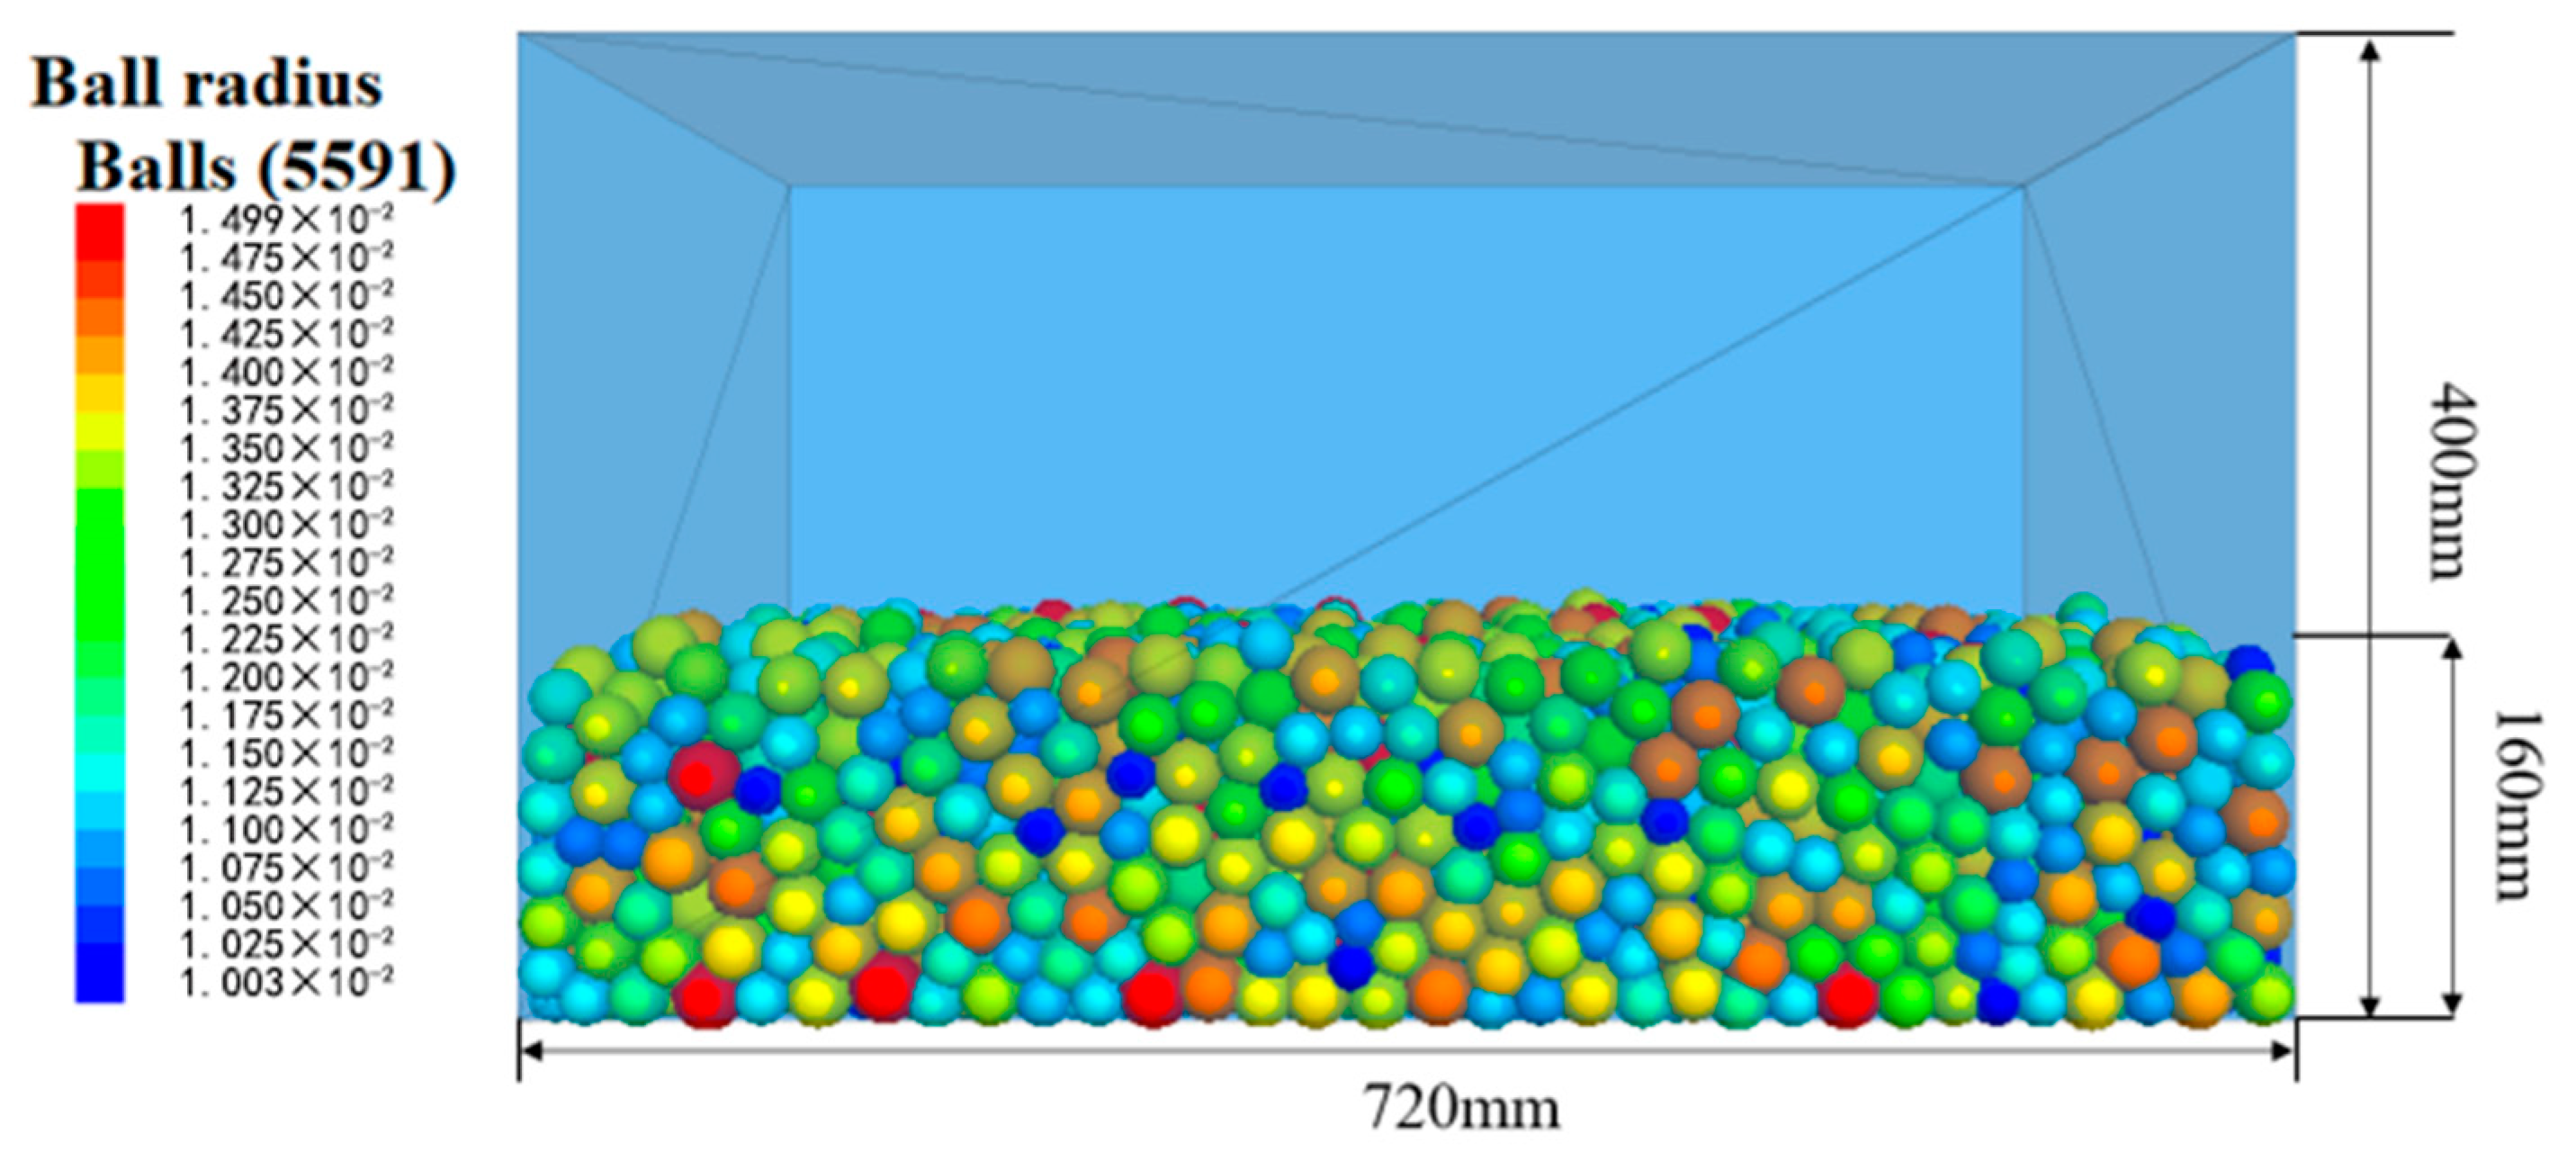
3.1. Sensitivity Analysis of Particle Radius and Time Steps

For DEM simulation, the particle radius and time steps during modeling have a great influence on the accuracy and efficiency of simulation results. Referring to the static tilt test model [36], a 500 × 500 × 500 mm model box was established. For the nickel ore used in the experiments, the particle density was set as 2500 kg/m3. The total loaded mass of the cargo was set as a fixed value of 52.265 kg. The simulation model of the cargo hold loaded with particles is shown in Figure 3. The discrete element built-in function was used to make the model box swing (see Equation (13)). The simple harmonic sway motion has an amplitude of 60 mm and a frequency of 0.5 Hz. And the sway motion lasts for 20 s, as shown in Figure 4.
v = V tsin 2 π f t ,
where t is the time and f is the motion frequency.   V is the amplitudes of the velocities.
For the liquefied cargo, its fluidity is mainly affected by its moisture content. In the present research, the moisture content and particle shapes are not considered directly, but their effect is estimated through the particle friction coefficients. Thus, the model utilizes the rolling resistance linear model to simulate cargo movement by iteratively adjusting the friction coefficient and rolling friction coefficient. Refer to the findings provided by Zhang et al. [37]. However, this operation does not take into account the interaction between particles and water directly. To be consistent with reality, it is still necessary to carry out research on the coupled model, for example, the method of CFD-DEM.
And parameters of the rolling resistance linear model are shown in Table 1. To check the effects of the particle radius and time steps on simulation results, six groups of simulation conditions were set and are shown in Table 2. The cargo sloshing-induced force on the cargo hold and the offset of the cargo gravity center relative to its original position were all recorded and compared. All of the calculations were carried out on an Inter(R) Core(TM) i5-9400F CPU @ 2.9 GHz & 2.9 GHz desktop PC with 8.0 GB of RAM. And it was produced by LENOVO, Shanghai, China. The cost computation time for the six simulation cases is also shown in Table 2.
Figure 5 and Figure 6, respectively, show the sloshing-induced force on the cargo hold in the x-direction and the offset of the cargo gravity center. It can be seen that variations in the force and cargo gravity center during the sway motion are basically consistent under different particle radii and time steps. The smaller the time step, the more stable the force. And when the particle radius is no more than 1/25 (represents 20 mm) compared to the cargo hold sizes during numerical modeling, the accuracy and stability of the numerical results could be guaranteed. So as to avoid the influence brought by the particle radius and considering the computational efficiency, a time step of 1 × 10⁻⁴ s and a particle radius less than 1/25 of the cargo hold size were selected for the subsequent numerical simulation.

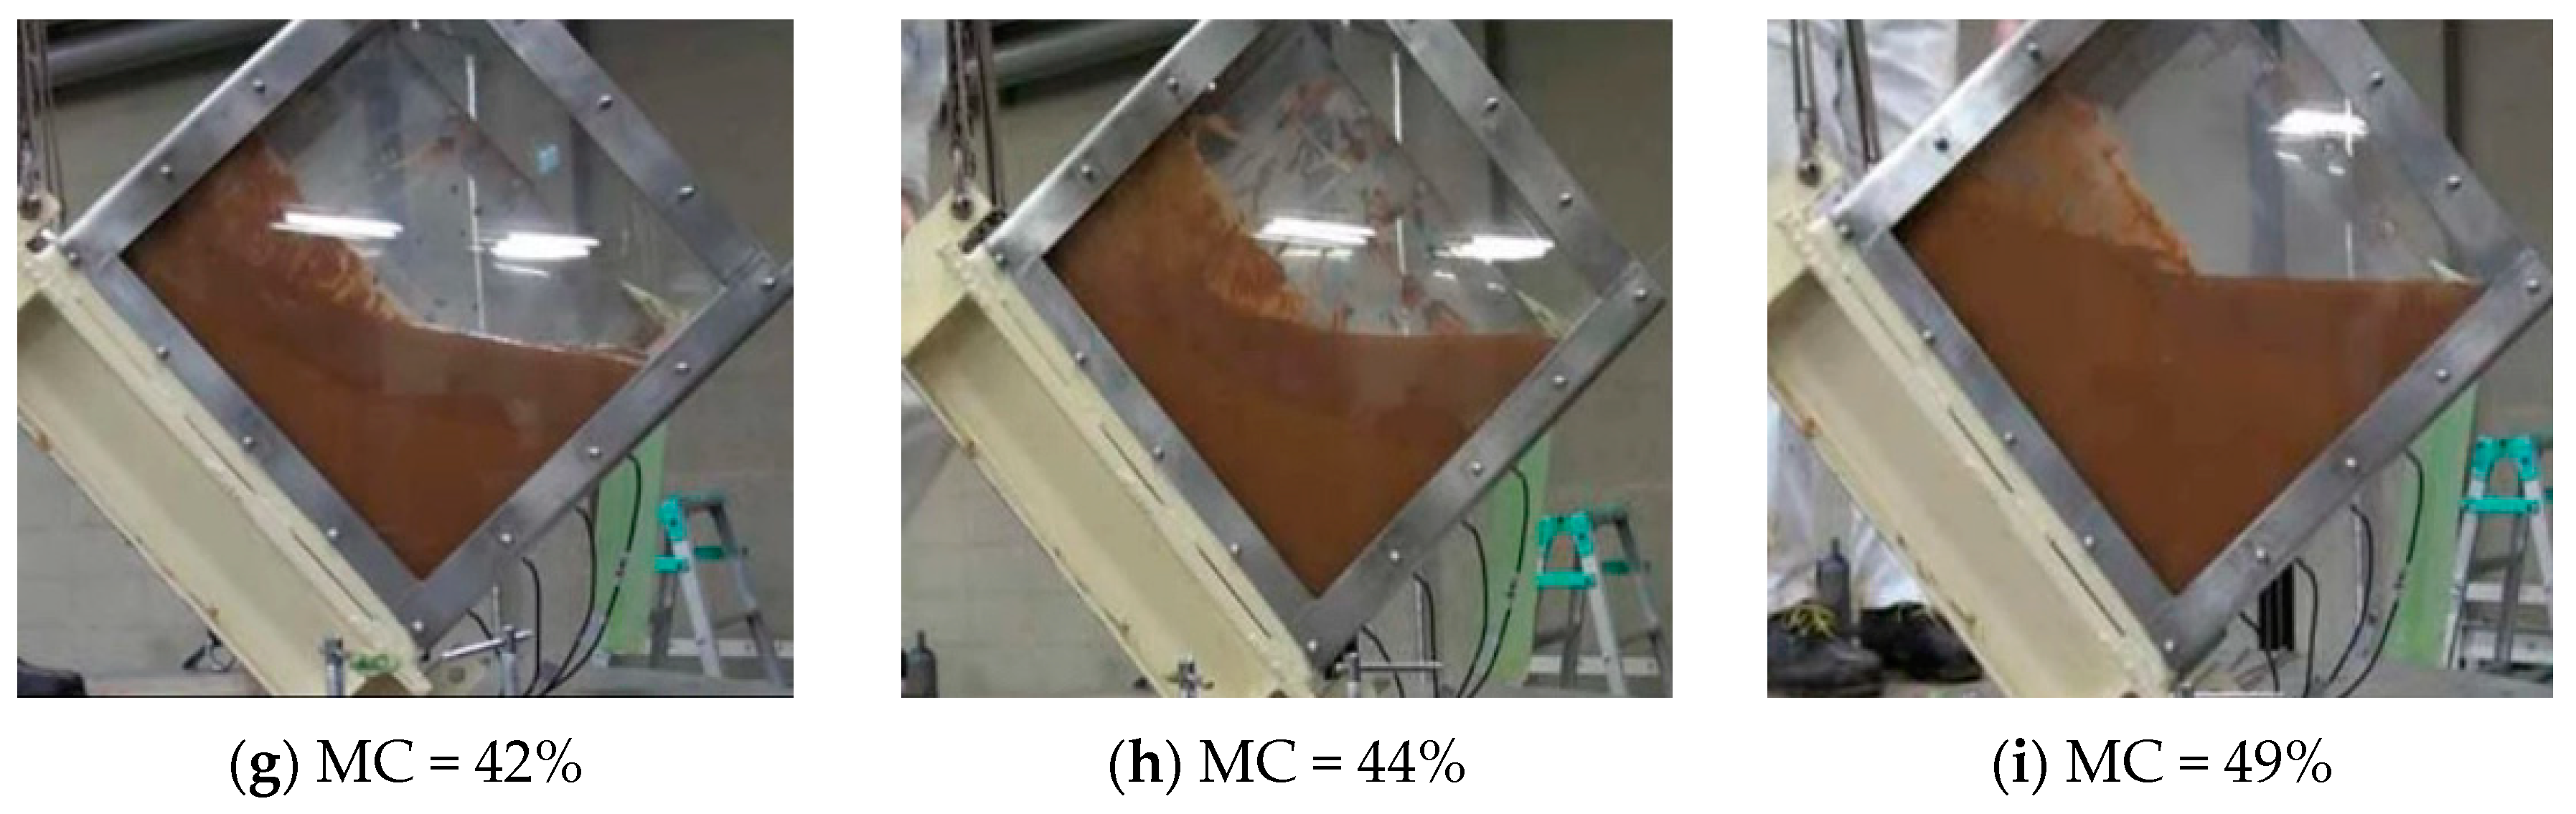
3.2. Verification of Direct Shear Test

In this section, the internal friction angle of the iron ore concentrate used in the experimental tests of Zhou [35] was used for verification. Spherical iron ore particles were generated by grading according to the particle sizes given in the literature. Referring to the laboratory model of the direct shear test, the numerical shear box had a size of 61.8 × 40 mm. For the bulk iron ore concentrate, the bonding force between the particles was not considered. The main parameters of iron ore materials were based on reference [13], and the particle and wall friction coefficients were obtained through trials. Therefore, the linear elastic contact model was adopted here, the input parameters are shown in Table 3.
As an important strength indicator of particle materials, the internal friction angle can be currently obtained by the direct shear test [36]. According to reference [35], the internal friction angle of the selected iron ore concentrate is 34.5°. With the model parameters shown in Table 1, numerical direct shear tests with confining pressures of 100 kPa, 200 kPa, 300 kPa, and 400 kPa were carried out. The shear strength is determined when the shear stress reaches its peak and the shear displacement is about 4 cm. According to the relationship between shear strength and confining pressure, the internal friction angle can be estimated. The initial and the completed shearing statuses are shown in Figure 7. The shear strength obtained under different confining pressures is shown in Table 4.
Figure 8 shows the relationship of shear and normal strength obtained in the numerical simulation. The internal friction angle was calculated as 36°, compared with 34.5° achieved by experiments, and the error was 4.17%. Consider that the spherical particles are assumed here and the particle size grading is not totally the same as the actual one, which would affect the internal friction angle accordingly. Based on this, the error could be accepted reasonably. Therefore, the assumption of spherical particles and the DEM could be adopted to carry out the following simulations.

3.3. Numerical Static Tilt Test

To estimate the effects of moisture content on cargo sloshing motion with different settings of particle friction coefficients, the numerical static tilt test was established by using the DEM. The numerical simulation mainly iterates the particle friction and rolling friction coefficients between particles to achieve the flow state of laterite nickel ore under different water contents. By comparing the simulation results with the experimental ones, the definite relationship between water content and friction coefficients was finally obtained. The results of the indoor static tilt test conducted by Class NK [11] are shown in Figure 9. The model parameters in Table 3 are used, and the present simulation results are shown in Figure 10.
After comparing and verifying the simulation results with the experimental results, the calibrated numerical model was established. And in Table 5, the relationship between moisture content and particle friction coefficients is shown. It is evident that there is a clear nonlinear correlation between moisture content and particle friction coefficients. With the increase in the moisture content, both the friction coefficient and the rolling friction coefficient decrease, and so, the liquefied cargo flows easier. Therefore, the method of regulating the fluidity of cargo under different moisture content levels based on iterative particle friction coefficients is reliable and could be used to solve the sloshing motion of liquefied cargo. The method has also been used in [38].

4. Simulation Results and Discussion

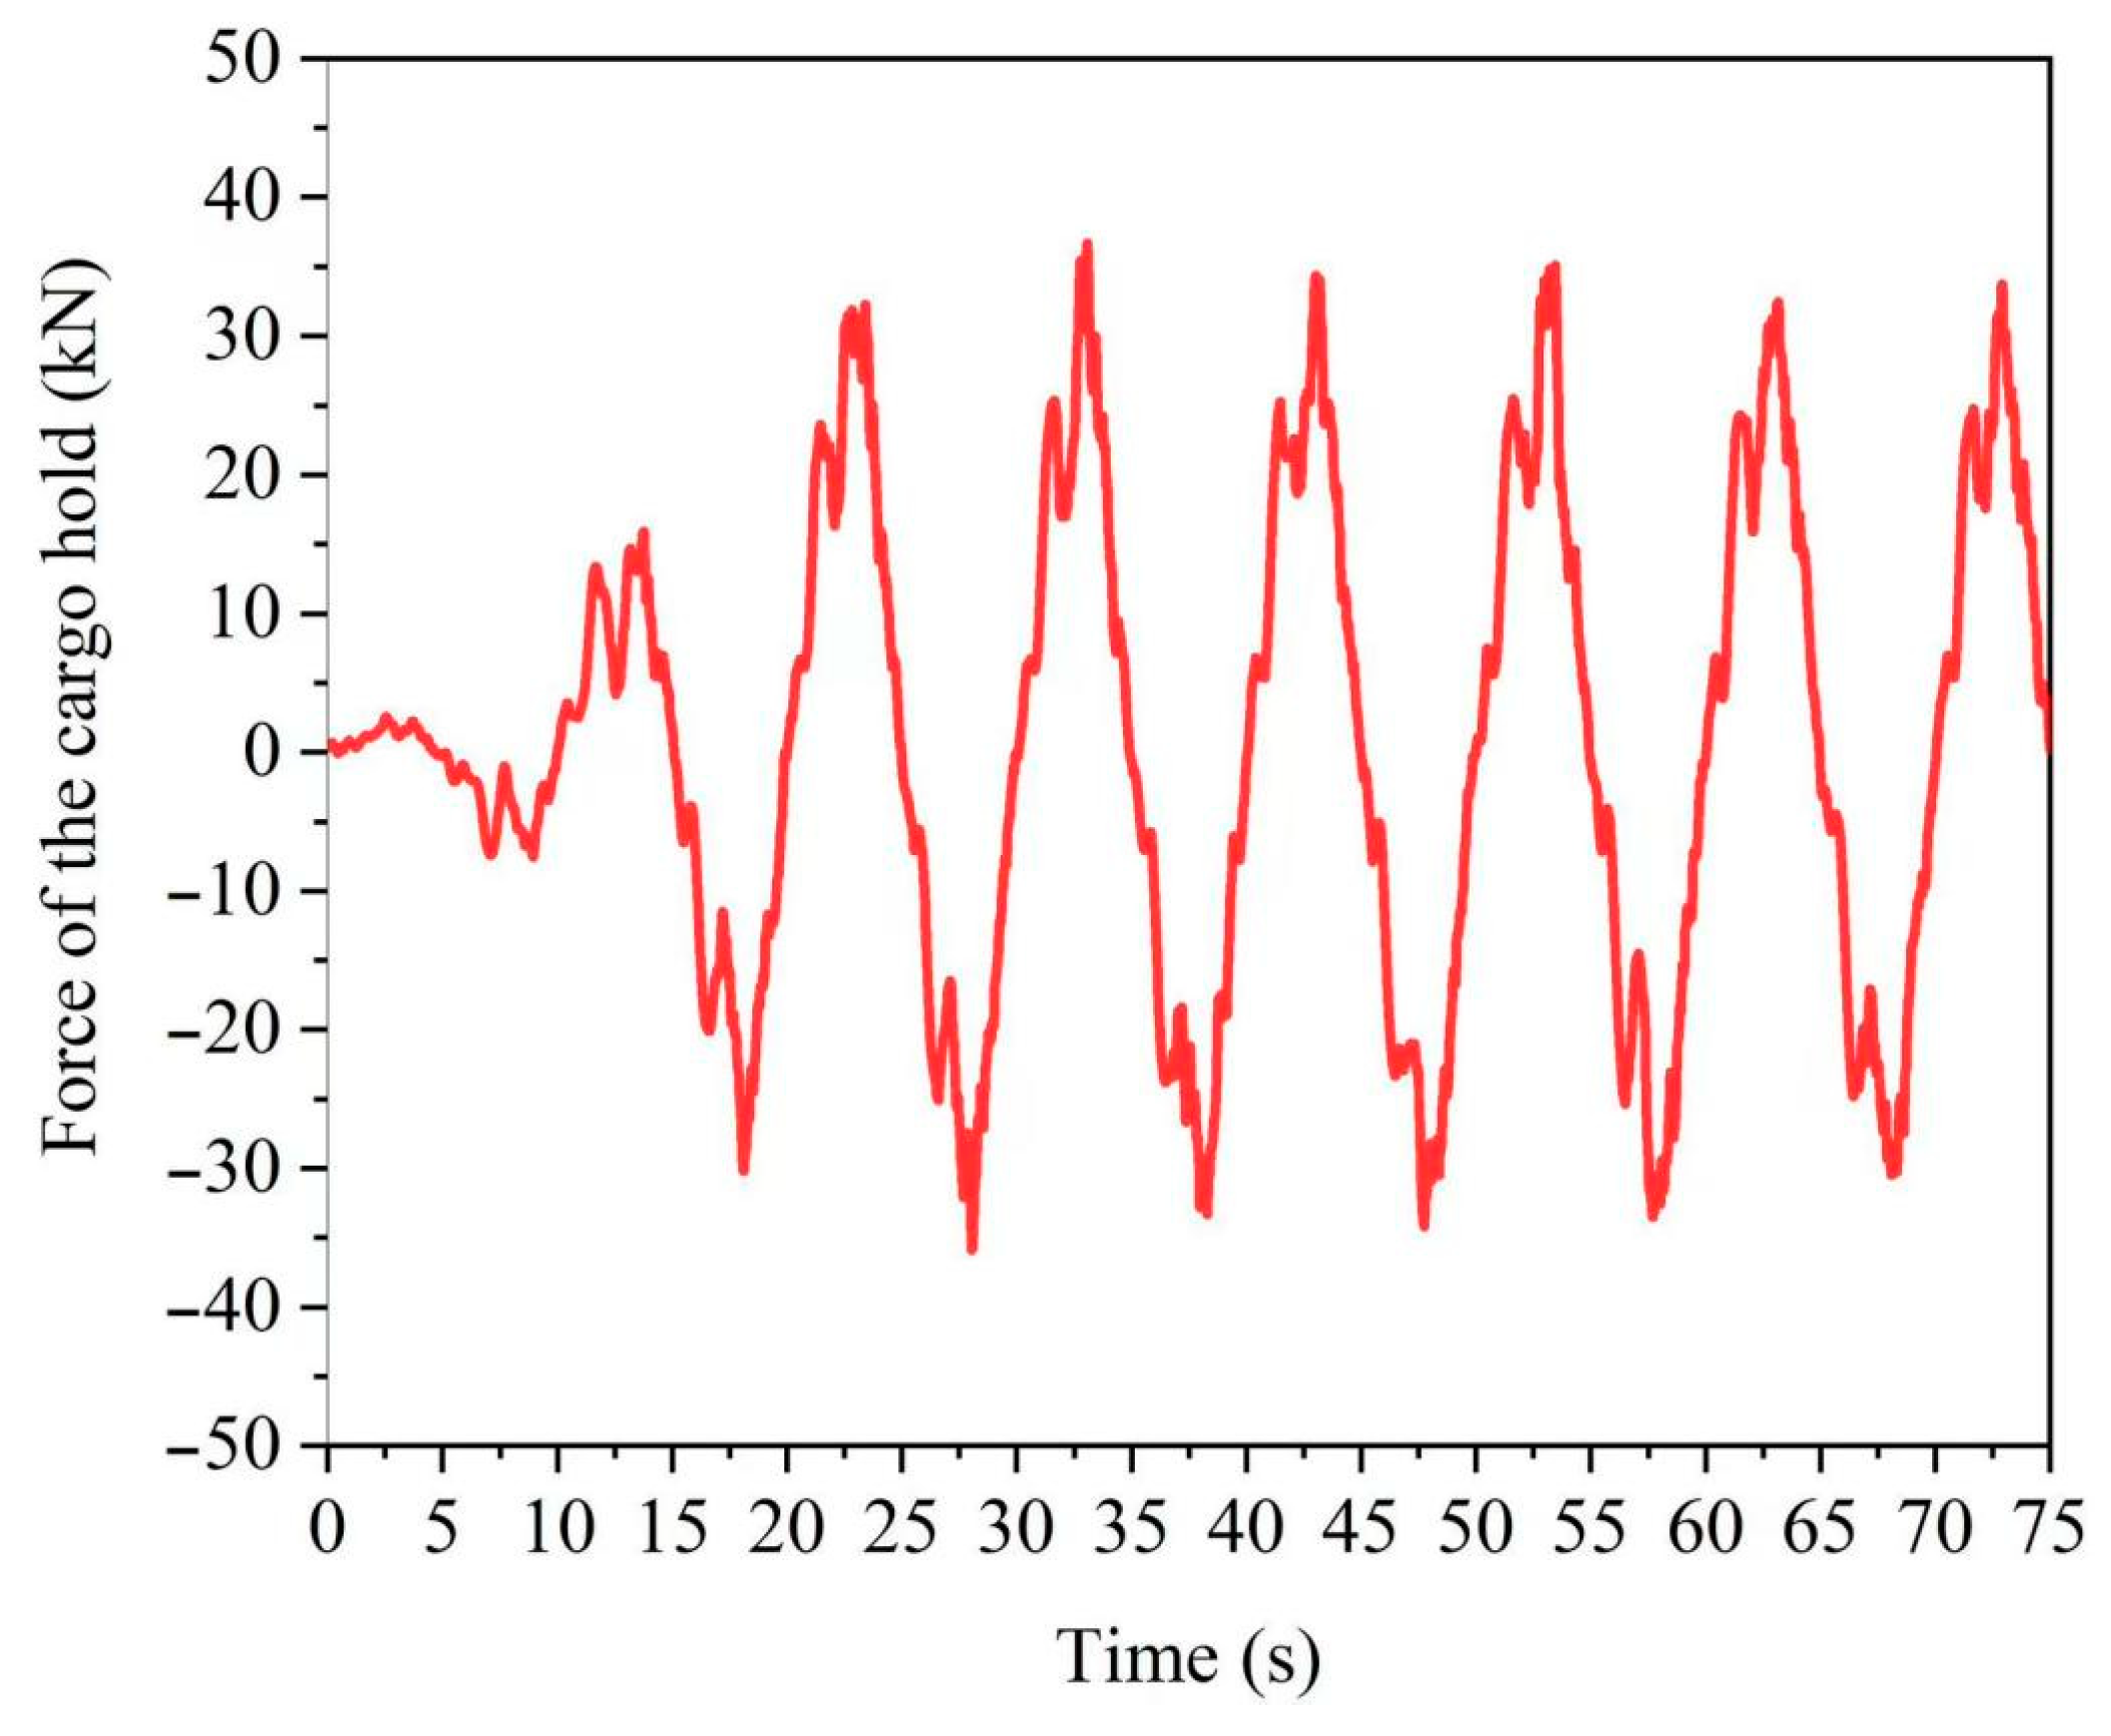
4.1. Without Baffles

The main object of this research is to investigate the anti-sloshing effect for different baffle arrangements. Zhou has pointed out that when the water content exceeds 37% [38], the laterite nickel ore can be fluidized under a small vibration acceleration. Therefore, the laterite nickel ore with a 40% water content was chosen for simulation in the present research. The corresponding particle friction coefficients are shown in Table 5. The loading depth of the cargo is set as 160 mm. The numerical model and its sizes (720 × 480 × 400 mm) are shown in Figure 11. Based on the verification and sensitivity analysis discussed above, in the process of establishing the numerical model, the particle radius should be set not exceeding 1/25 of the size of the cargo hold model, and the generated particle radius is determined to be between 0.01 mm and 0.015 mm.
For the cargo hold, it has a smooth rolling motion at a frequency of 0.1 Hz with an amplitude of 15°. The sloshing motion and the rheological behavior of the fluidized laterite nickel ore in the cargo hold were investigated first. The motion state of the cargo particles in the cargo hold during one motion period is presented in Figure 12. It can be seen that the liquefied cargo also moves along with the roll motion of the cargo hold. Moreover, when the cargo hold is restored to its original position, the cargo cannot be restored to its original state fully, and the phenomenon of cargo accumulation on one side of the cargo hold occurs. The same phenomenon has been pointed out by Zhang et al. [2] by using a CFD method. This is because of the complicated rheological properties of the liquefied cargo, and it tends to be a non-Newtonian fluid [8]. Its sloshing motion is more lagged than the cargo hold motion, and the free surface is more stable compared to the sloshing of liquid water. These reasons make it difficult for the liquified cargo to return completely after a movement. And this would bring threats to the safe transportation of this kind of cargo. In general, to ensure the reliability and accuracy of the present simulation results, three aspects were included here. Firstly, the results of the direct shear experiments were used for validation. As in the experiments carried out by Zhou et al. [35], the numerical shear box was established, and the linear elastic contact model was used. Through a comparison of the internal friction angle provided by the reference, reliability and reasonable numerical results were achieved. At the same time, for the DEM simulation, the particle size effect and particle friction coefficients were addressed carefully. The sensitivity analysis of particle size and time steps were all carried out. And the critical particle radius, e.g., no more than 1/25 of the size of the cargo hold, was provided. Compared to static tilt test results, the definite relationship between particle friction coefficients and moisture content was acquired to estimate the effects of different moisture content levels on the sloshing motion of liquefied cargo. Furthermore, the phenomenon of cargo accumulation on one side of the cargo hold was compared to the published results. In the present research, as shown in Figure 12a,c, the phenomenon also occurred. Characteristics of the liquefied cargo sloshing could be captured and assured. Based on the above three aspects considered in this research, validation of the sloshing motion simulation and also the baffle effect could be ensured and deduced.
To quantify the motion characteristics of liquefied cargo, the forces induced on the cargo hold in the x-direction and the offset of the whole cargo gravity center were also monitored and are shown in Figure 13 and Figure 14. It can be seen that the cargo also moves periodically along with the cargo hold. The gravity center of the whole cargo also fluctuates owing to the motion of the cargo. The maximum offset of the gravity center reaches about 90.8 mm, accounting for 12.61% of the length of the cargo hold. The liquefied cargo sloshing also causes a large impact on the bulkhead. The maximum force on the cargo hold is about 36.71 kN. Therefore, when the cargo is liquefied, it not only has a gravity center deviation but also brings a large force on the bulkhead. And these are the two main reasons for the capsizing of these kinds of ships.

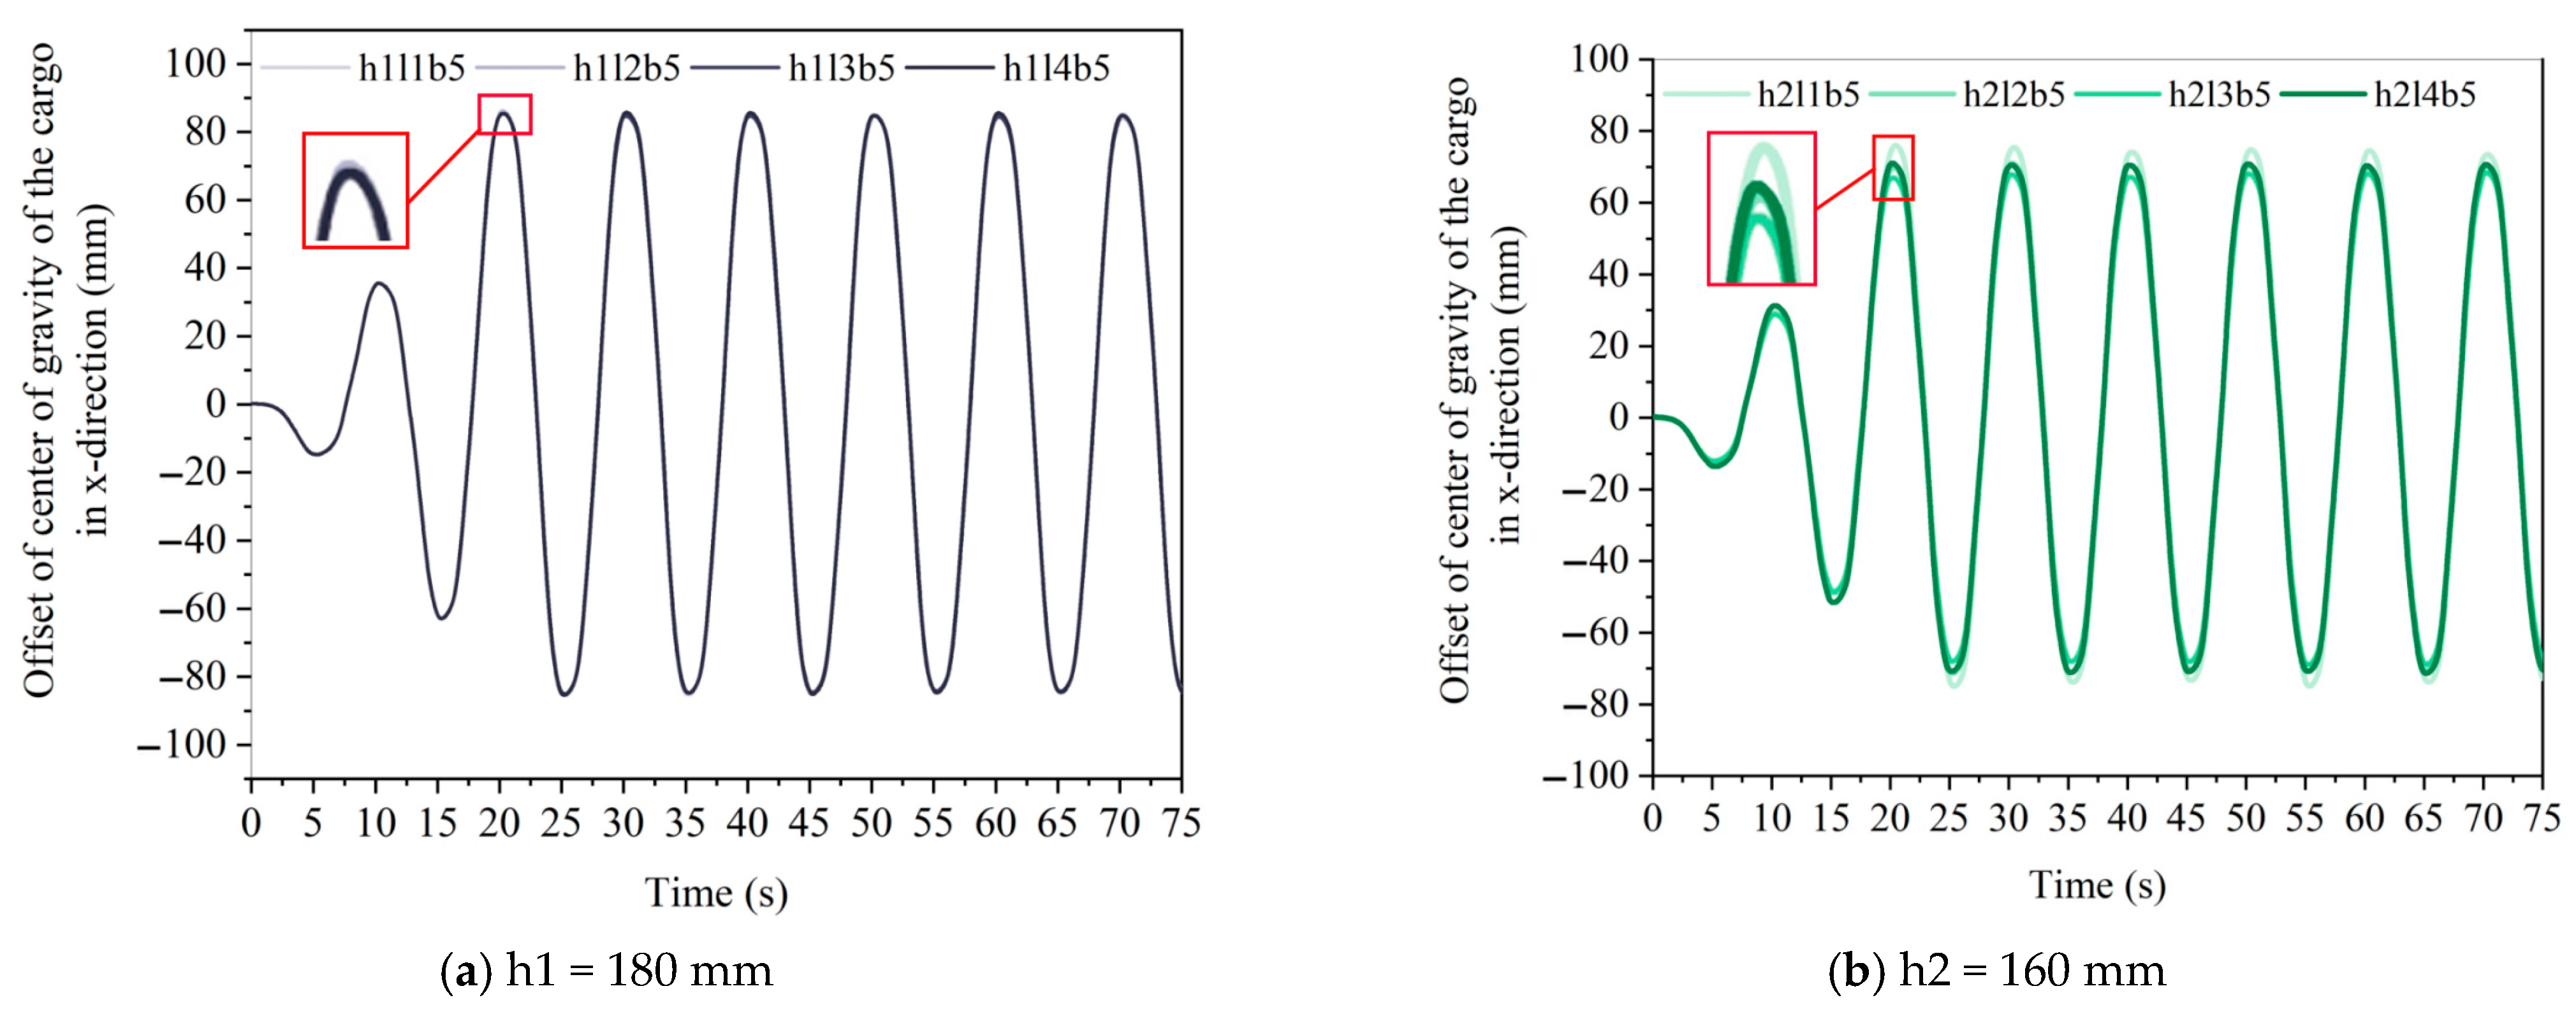
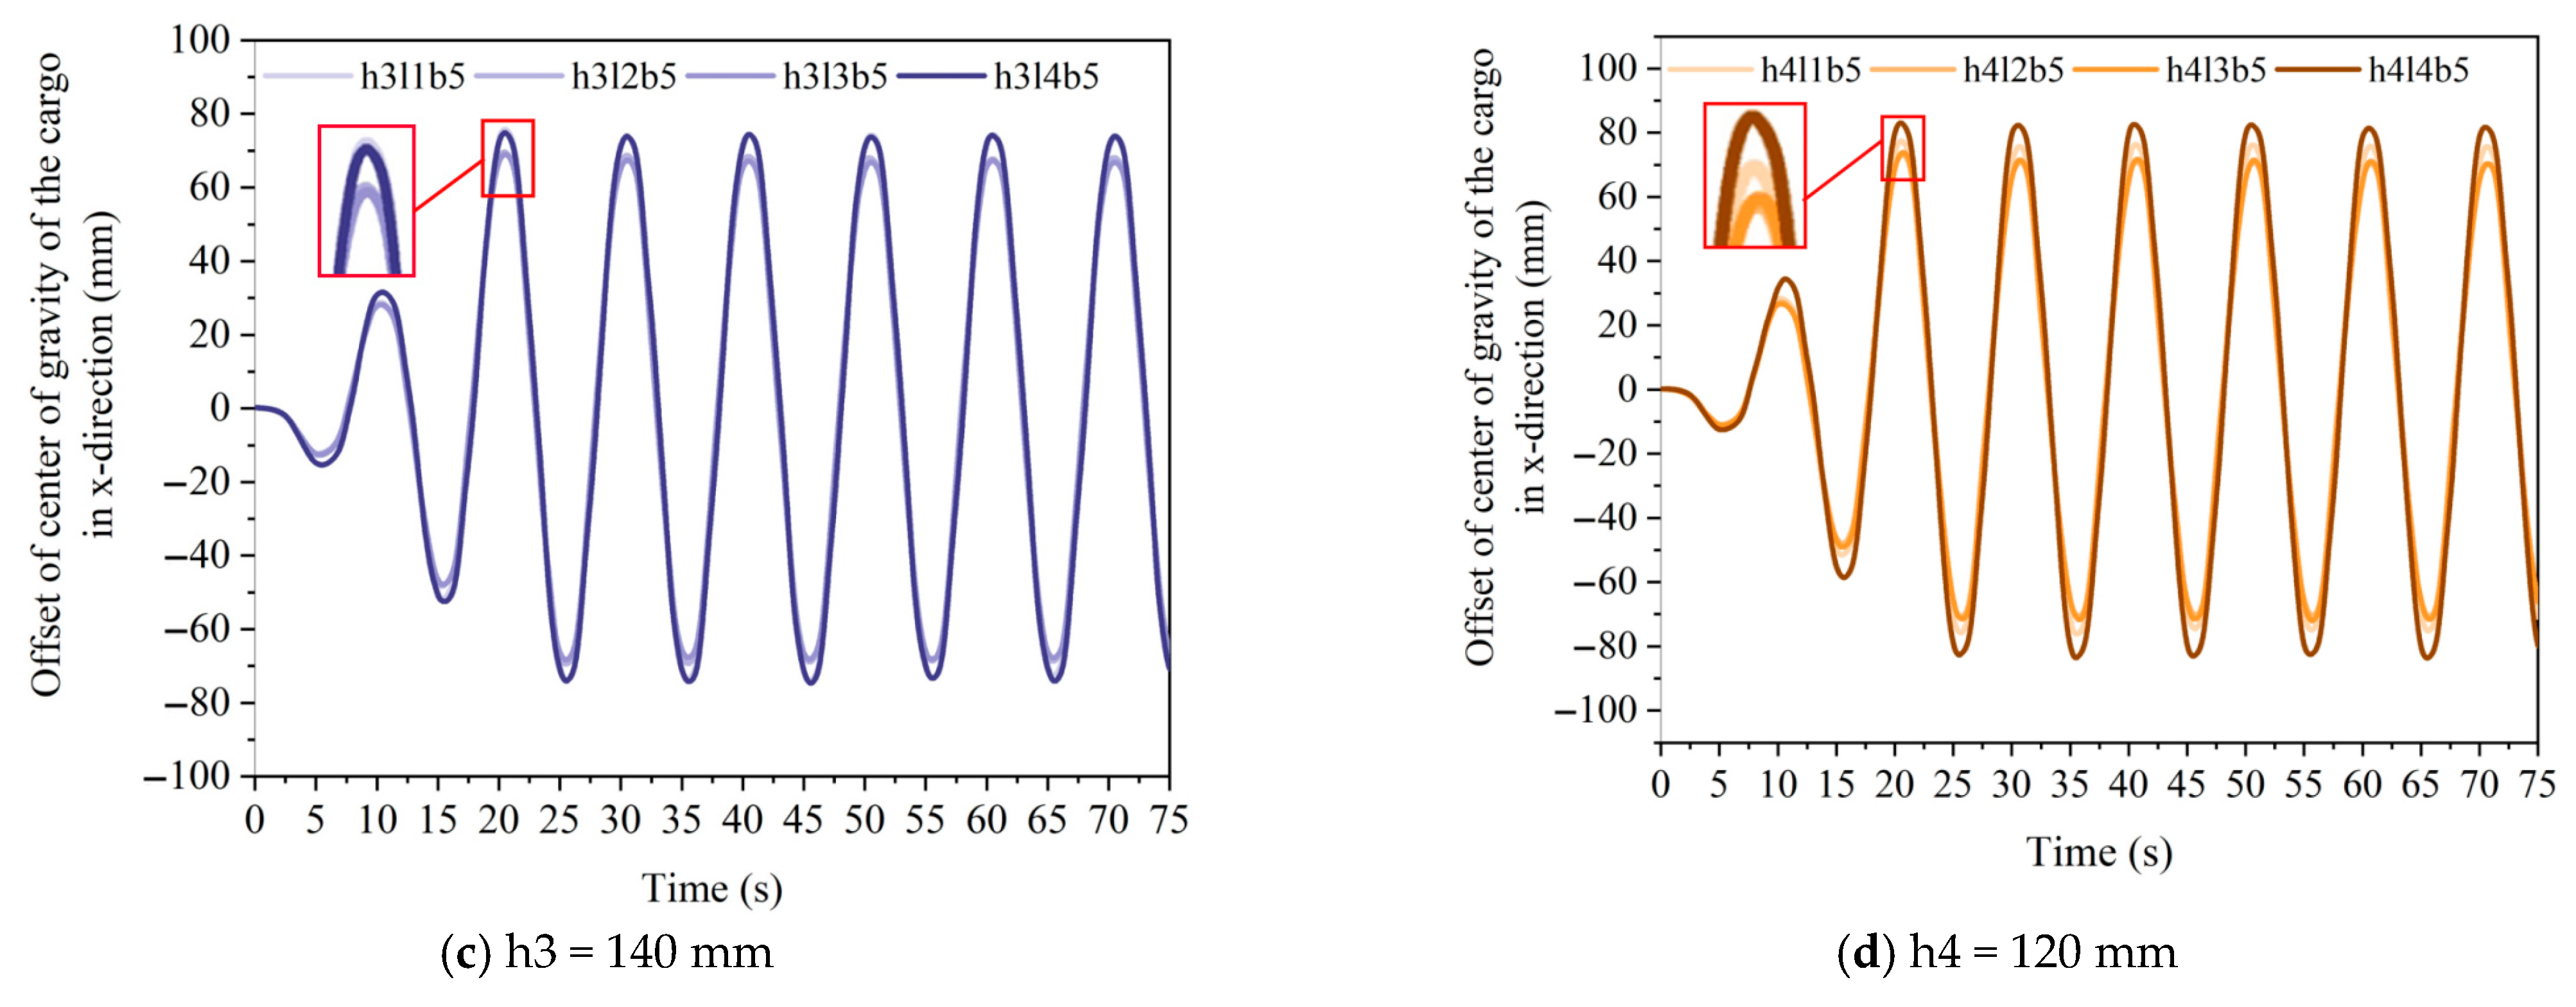
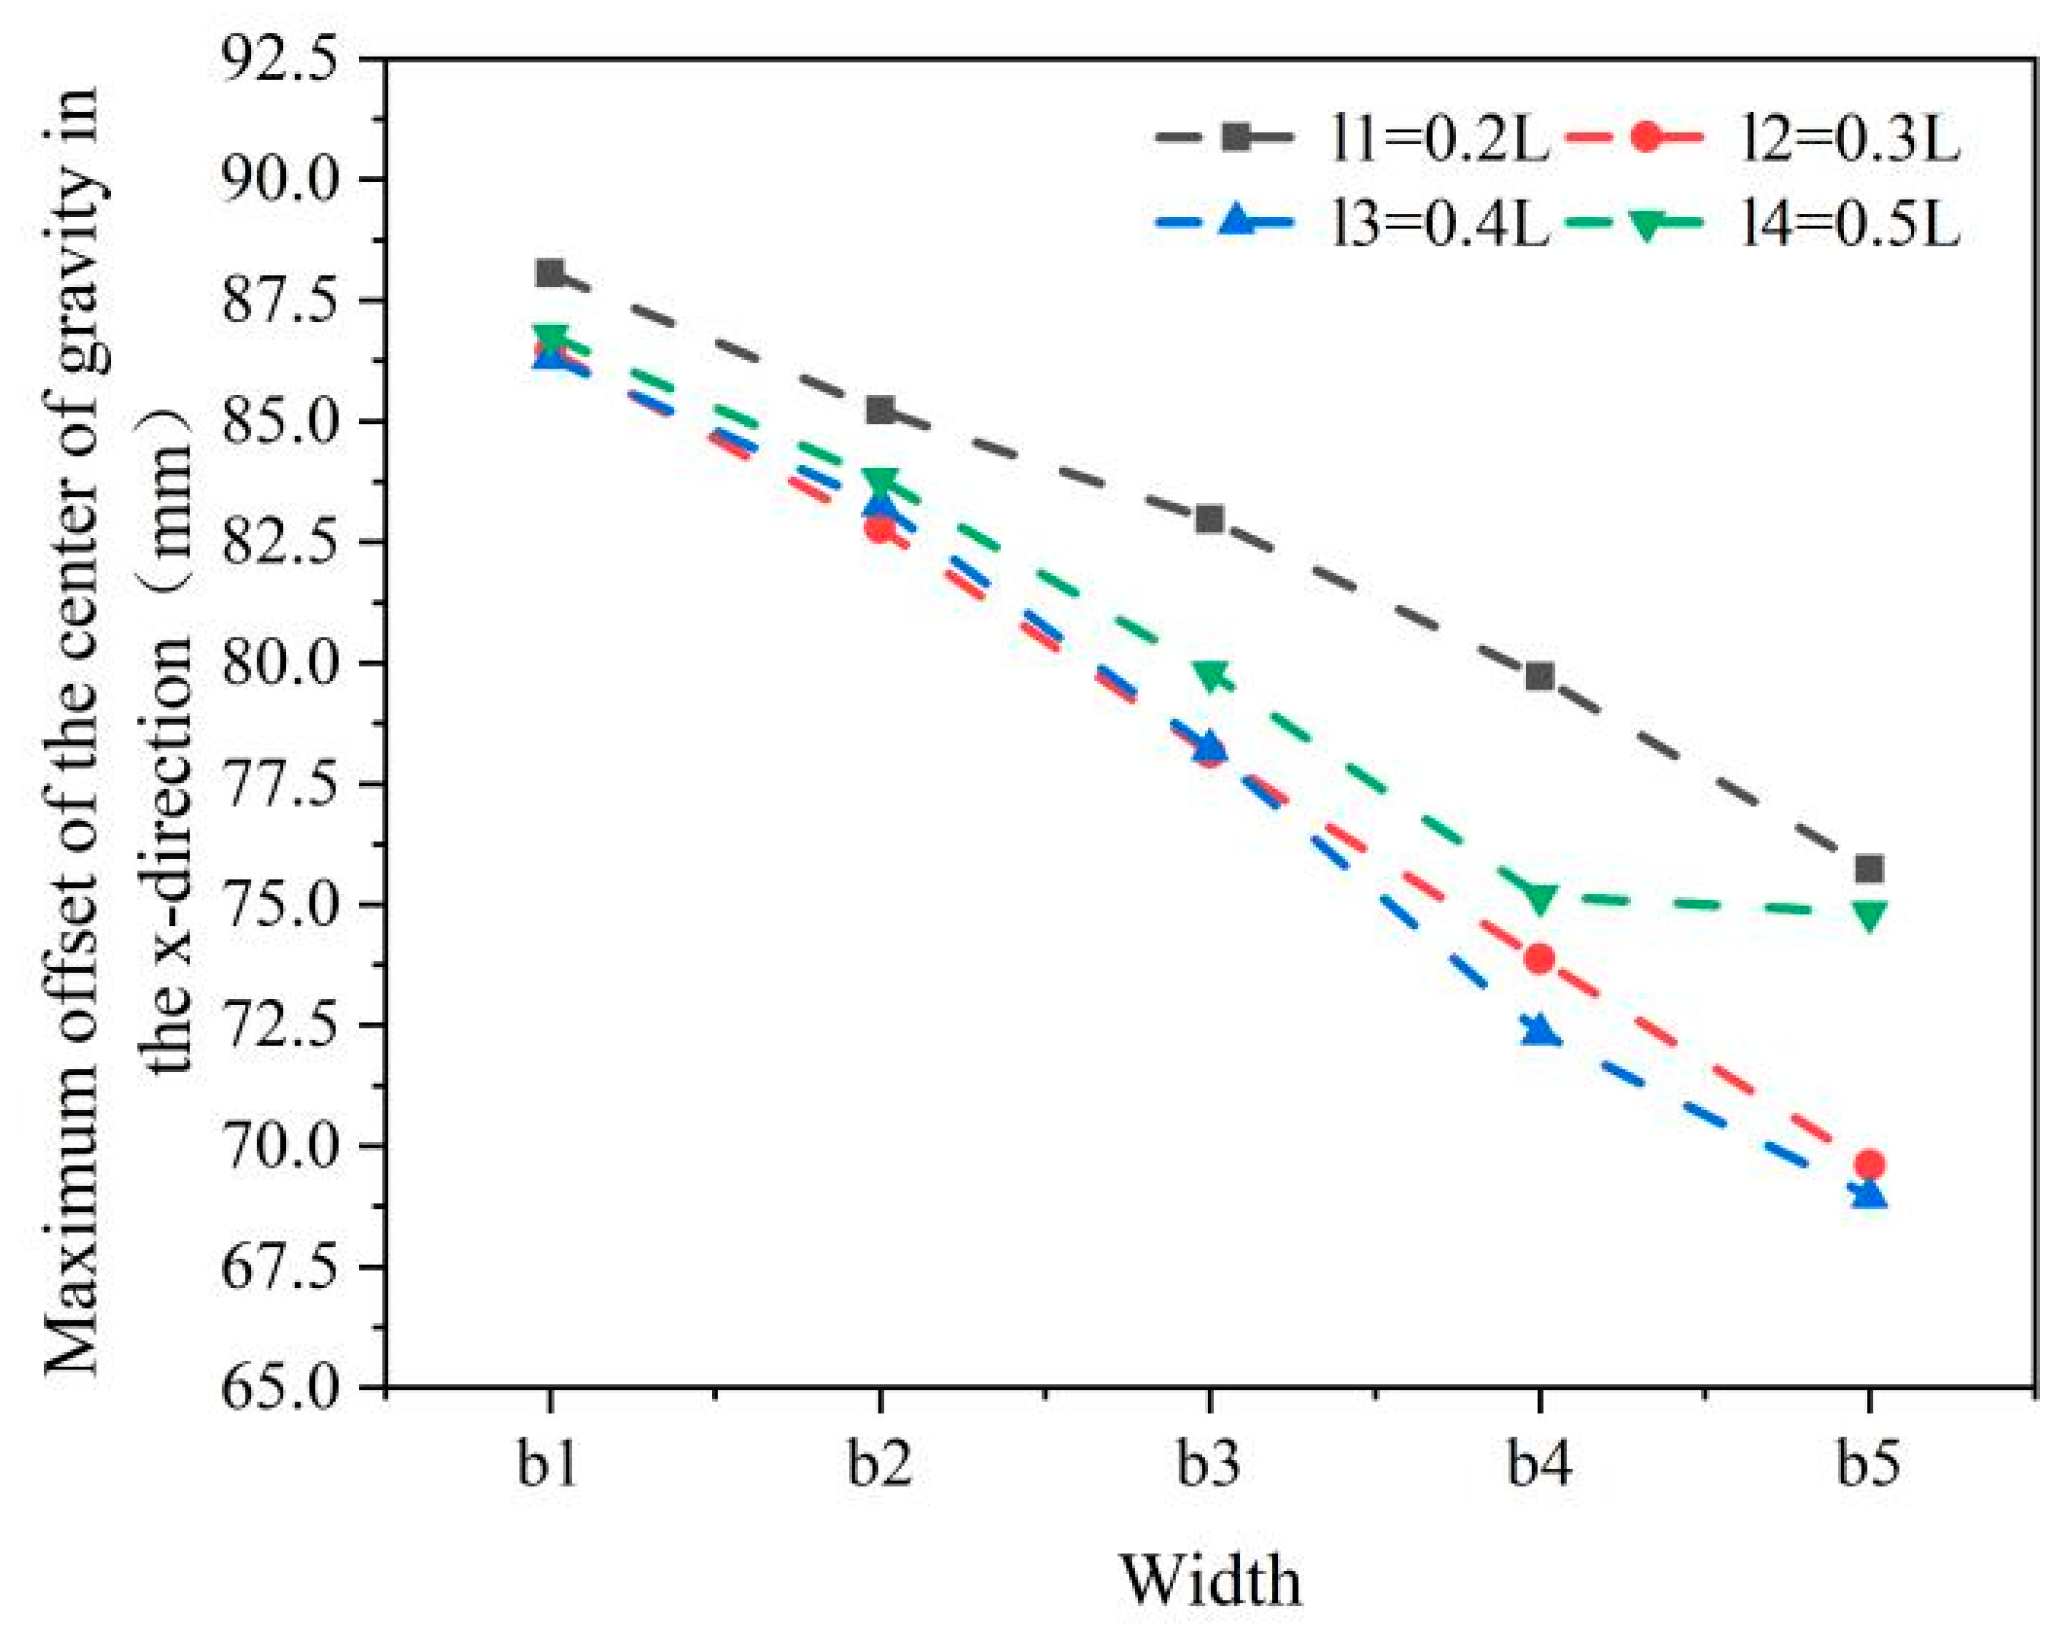
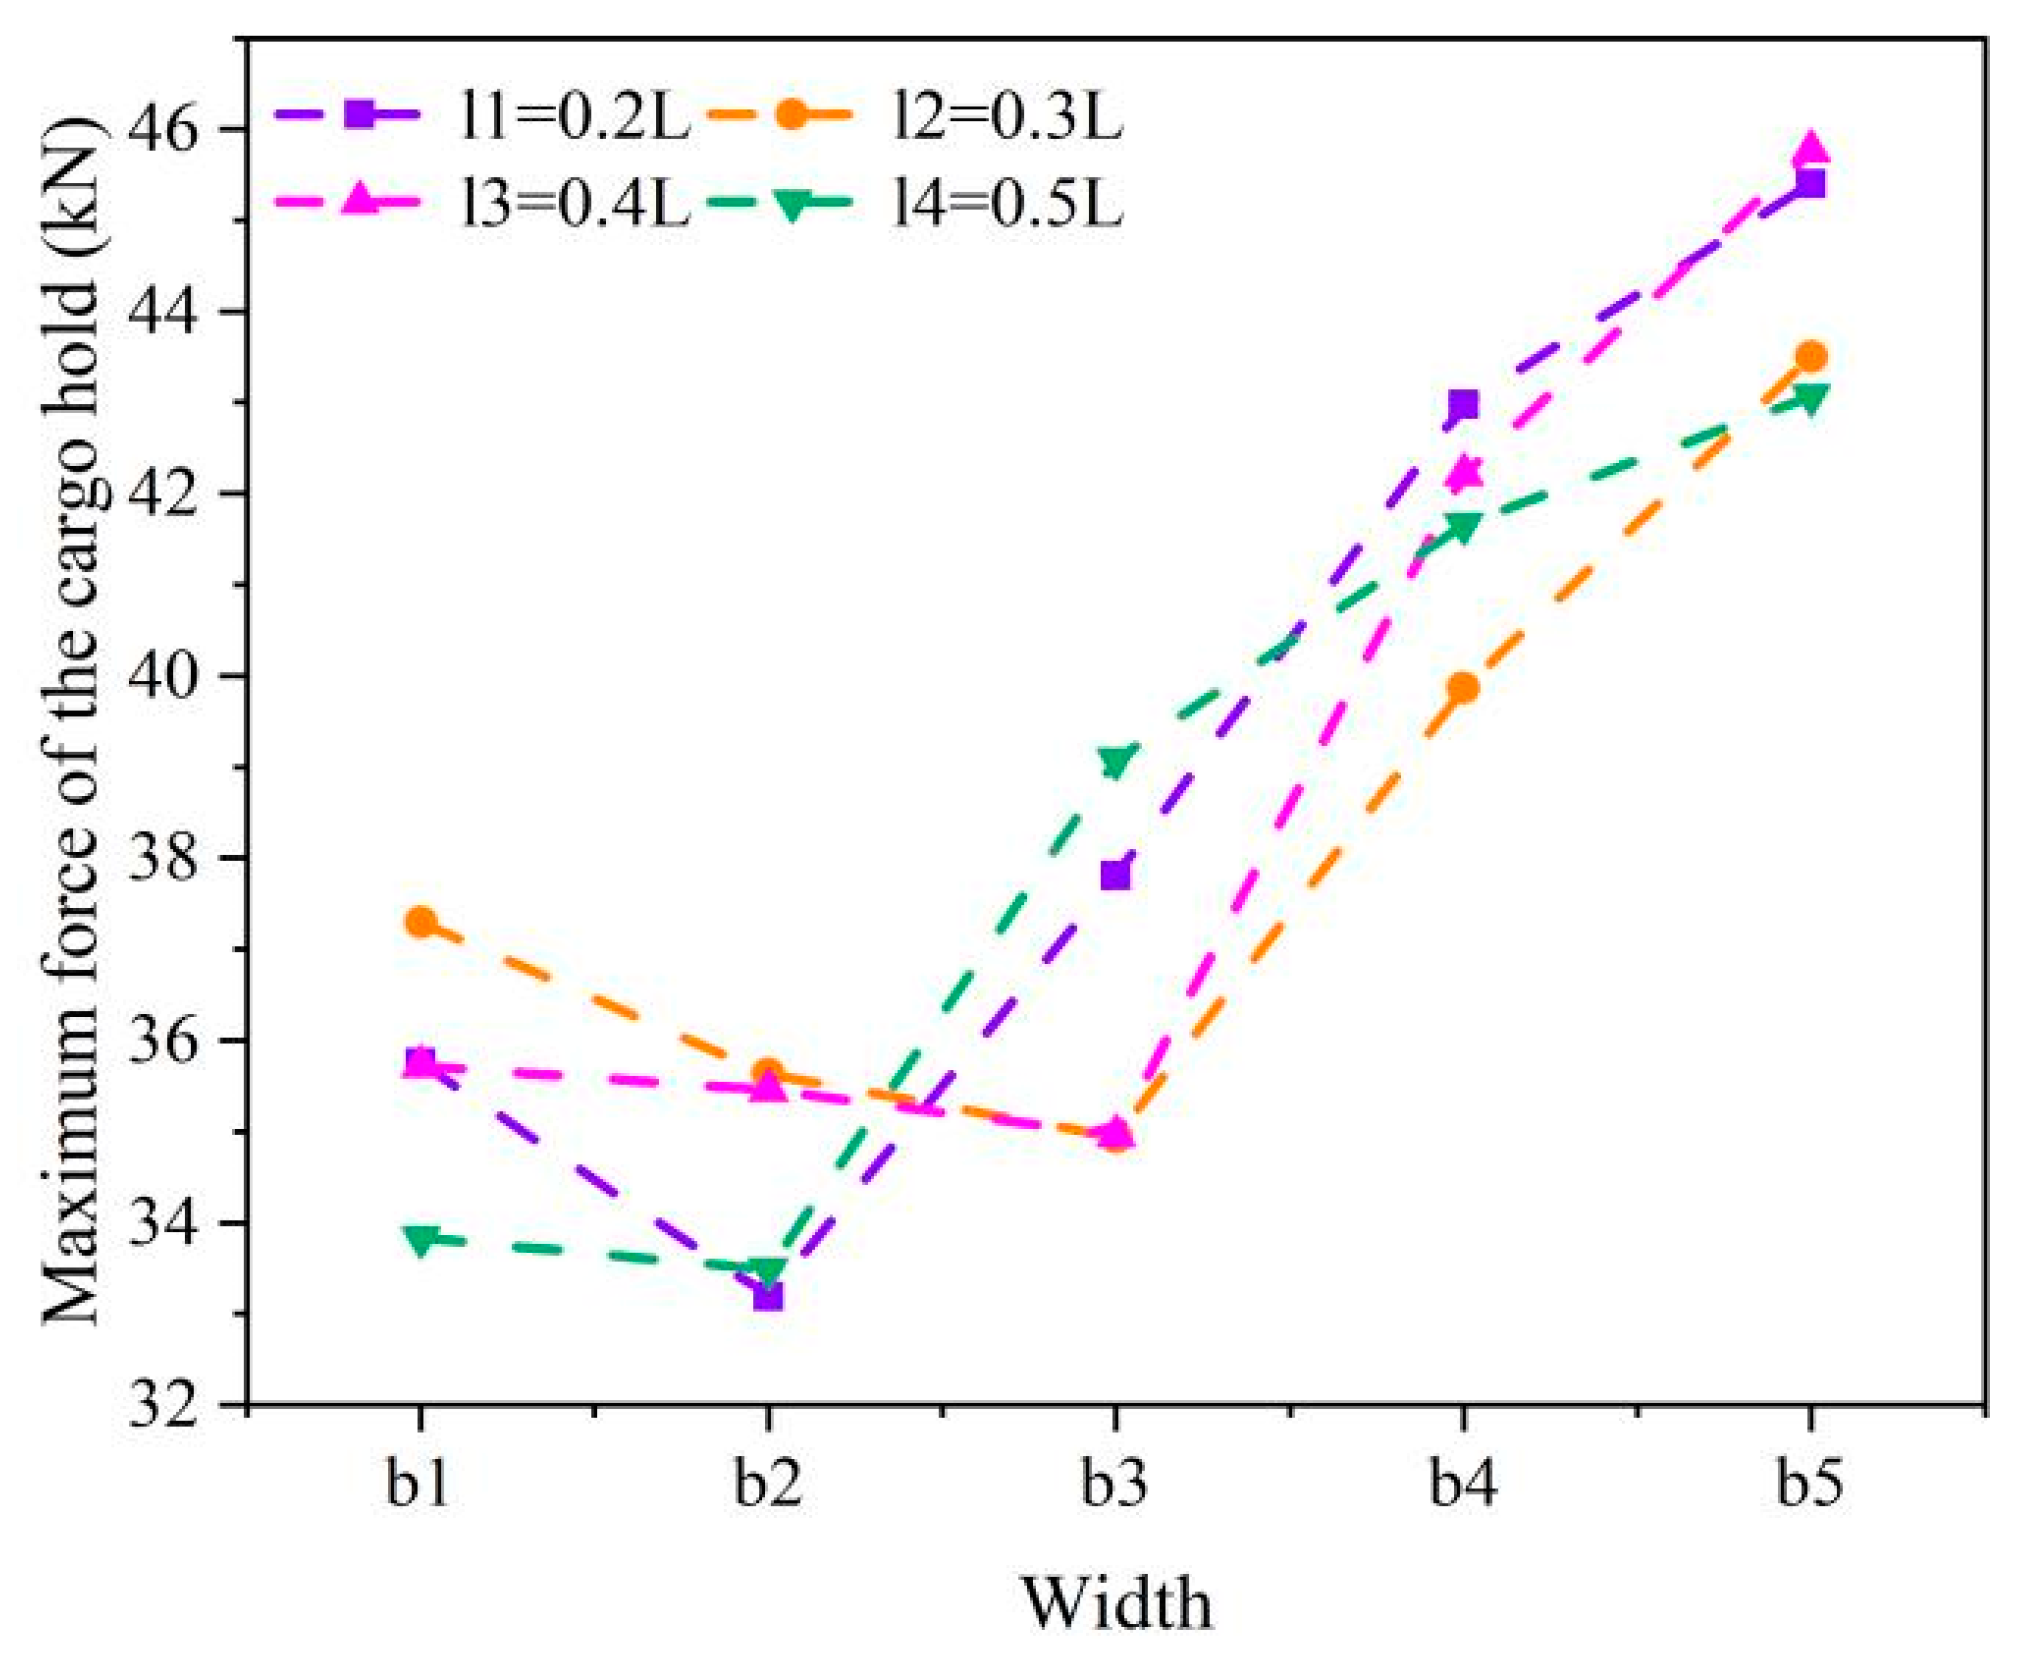
4.2. With One Pair of Horizontal Baffles

To reduce the impact of liquefied cargo sloshing, one pair of horizontal baffles was considered and investigated first. For the baffles, a single one was installed on the left cargo hold bulkhead and the other on the opposite side; see Figure 15. When in action, the baffle plane is parallel to the cargo hold bottom and rotates in the same way as the cargo hold. Different lengths l, widths b, and installation heights h of the baffle were investigated. The sizes of the baffle were designed based on the length and width of the cargo hold. For the installation height h, four cases were considered. For example, we considered one above the initial cargo top surface, one located right on the cargo top surface, and two inside the cargo. Specific sizes of the horizontal baffles and installation heights involved in the present simulations are shown in Table 6. And overall, 80 cases were conducted and simulated.
Take cases of h2l3b5, h2l4b5, and h4l4b5, for example; Figure 14 shows the motion of the liquefied cargo in the cargo hold mounted with one pair of horizontal baffles during one motion period. Compared to the results without baffles, the cargo motion can be effectively weakened. When the baffle is located right on the top surface of the cargo, the cargo motion becomes weaker. When the baffle is buried inside the cargo, the cargo gravity center still has a large amount of deviation. At this time, the inhibition effect of the baffle is not obvious.
Figure 16 and Figure 17, respectively, record the displacement of the cargo gravity center in the x-direction and the force on the cargo hold. It can be seen that variations in the cargo gravity center offset and the sloshing-induced force behaviors all occur basically periodically. To quantify the anti-sloshing effect of baffles with different sizes, the amplitude of the gravity center offset and the forces were compared.
The maximum offset of the cargo gravity center in the x-direction under different baffle sizes and heights is shown in Figure 18. When the baffle location is close to the initial cargo top surface, the anti-sloshing effect is most pronounced. And generally, with the increase in the baffle width, the baffle effect also becomes better. It is noticed that for the baffle height of h4, the number of cargo particles on the baffle plane increases, and it can move freely. Thus, the baffle effect becomes worse. Especially for the case of the smallest baffle height and the largest baffle plane area (case h4l4b5), the anti-sloshing effect is the worst; see Figure 18d.
Figure 19 shows variations in the maximum force on the cargo hold with one pair of horizontal baffles. When the baffle is located above or on the cargo surface, the sloshing-induced force varies little. And when the baffle is located inside the cargo, the force increases with a bigger baffle width. That is to say, the cargo under the baffle can be inhibited to some extent, and the cargo above still can move along with the cargo hold. The phenomenon of shallow water sloshing may happen, and the cargo sloshing-induced force becomes bigger accordingly. Based on the above results and analysis, it can be deduced that when the horizontal baffle is located right on the cargo top surface, it would exert the best inhibiting effect on liquefied cargo motion.
Further, assuming the baffle is right on the cargo top surface, the anti-sloshing effect for different baffle lengths and widths was then studied. The largest offset of the cargo gravity center in the x-direction and the maximum force on the cargo hold with different baffle sizes are shown in Figure 20 and Figure 21. With the same baffle length, the offset of the cargo gravity center decreases gradually when the baffle width increases. The sloshing-induced forces basically increase with a larger baffle width.
To present and compare more clearly, variations in the cargo gravity center and sloshing-induced force at different baffle lengths are shown in Figure 22 and Figure 23. For a smaller baffle width, the maximum of the cargo gravity center offset changes little. However, for a bigger baffle width, the offset decreases first and then increases. And there is an optimal combination of baffle length and width that has the best suppression effect on cargo motion. It should be noted that because of the initial porosity and rearrangement of particles, the cargo still has a sloshing motion, although the cargo is fully covered in the case of h4l4b5. The variation in the force amplitude fluctuates with different baffle lengths and widths. Overall, the force amplitude is larger with a bigger baffle plane area.
Therefore, a reasonable design of horizontal baffles has an important influence on the anti-sloshing effect. The simulation results of one pair of horizontal baffles with different installation heights and sizes are mainly achieved and discussed in this section. In view of the offset of the cargo gravity center, when the baffle is near the cargo top surface, the suppression effect on the cargo motion is better. The anti-sloshing effect is proportional to the baffle width. And there is a critical baffle length at which the anti-sloshing effect is also more obvious.

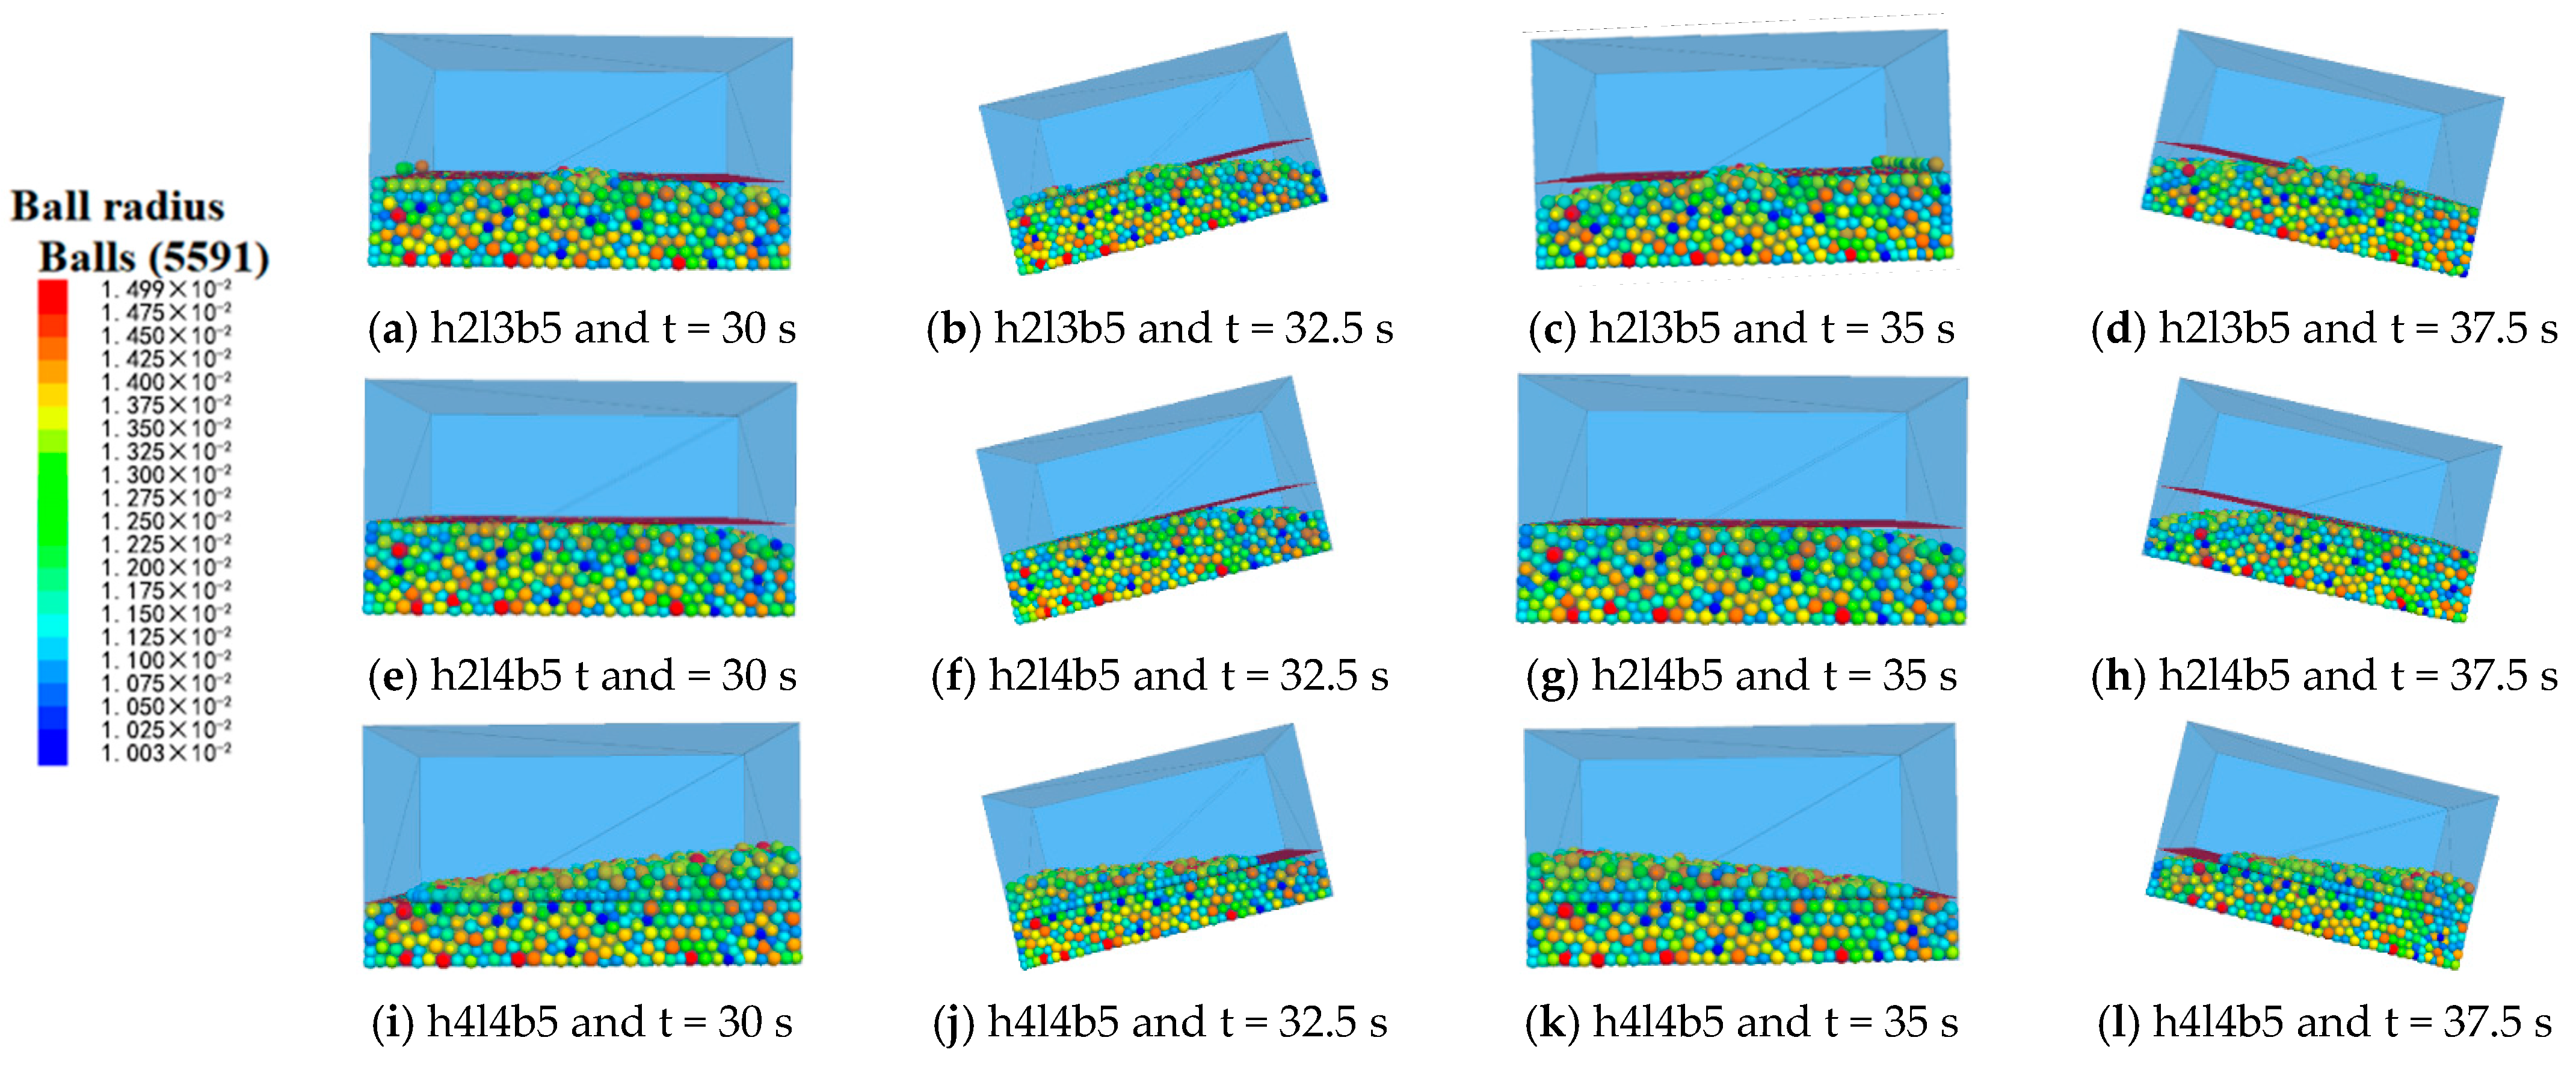
4.3. With Two Pairs of Horizontal Baffles

Based on the above discussion, for convenience of practical application, the modular horizontal baffles were further designed and investigated. Modular horizontal baffles mean that two or more pairs of baffles could be arranged on the cargo hold bulkhead. With a smaller baffle plane area, the ideal sloshing suppression effect can also be acquired. At present, two pairs of horizontal baffles are discussed first. The baffles were arranged symmetrically based on the longitudinal center line of the cargo hold. And six different baffle area rates were considered, which are 16%, 24%, 32%, 36%, 48%, and 64%. The area rate is the ratio of the total baffle plane area to the cargo hold bottom area. Assuming the modular horizontal baffles are right on the cargo top surface and according to the baffle area rates, nine cases with different baffle lengths and widths were designed, as shown in Table 7. A top view of the layout of the modular horizontal baffles of each case is shown in Figure 24.
Figure 25 and Figure 26 illustrate variations in cargo gravity center displacement and the sloshing-induced force on the cargo hold under different scenarios. Similarly, variations in such behavior occur periodically. And different baffle lengths and widths also have obvious effects on the maximum displacement of the cargo gravity center and the sloshing-induced forces.
Also, the maximum offset of the cargo gravity center in the x-direction and the maximum load on the cargo hold when one pair of horizontal baffles and modular horizontal baffles are installed are shown in Figure 27 and Figure 28. It can be seen that for the cargo gravity center offset and sloshing-induced force, the amplitude does not change linearly with the baffle area rate. Different combinations of baffle lengths and widths also have different suppression effects on cargo motion. For the modular horizontal baffles, the cargo gravity center offset can be weakened largely compared to one pair of baffles with the same area rate. For the sloshing-induced force, the weakened effect of modular horizontal baffles is not so obvious except in cases 3, 8, and 9 compared to one pair of baffles.
For the modular horizontal baffles, considering the cargo gravity center offset and the sloshing-induced force, cases 6 and 9 have a better anti-sloshing effect compared to the rest of the cases. And case 6 has a smaller baffle area compared to case 9. For case 6, the maximum deviation of the cargo gravity center in the x-direction is 66.452 mm, and the peak force on the cargo hold is 31.160 kN. Compared with the case without baffles, the cargo gravity center deviation is reduced by 26.815%, and the force is reduced by 15.114%.
To seek an optimal combination of baffle length and width for the present cargo hold model, more detailed simulations have also been carried out based on cases 6 and 9. For case 6 with an area rate of 48%, the baffle length changes from 0.24 L to 0.38 L with an increment of 0.02 L, and so the baffle width decreases accordingly. For case 9 with an area rate of 64%, the baffle length changes from 0.32 L to 0.48 L with an increment of 0.02 L, and so the baffle width decreases accordingly.
Figure 29 shows the cargo gravity center deviation in the x-direction when the baffles area rate is 48% and 64% under different combinations of baffle length and width. It can be seen that with the increase in the baffle length, the maximum offset of the cargo gravity center generally decreases first and then increases largely. With the same baffle area rate, there is a critical baffle length to restrain the cargo motion best. For the amplitude of the sloshing-induced force on the cargo hold, its variation under different baffle lengths is shown in Figure 30. And the force also increases with the increase in baffle length.
Based on the above results, with an area rate of 48% and when the baffle length is 0.26 L and the width is 0.46 B, the anti-sloshing effect is better. When the area rate is 64%, the baffle with a length of 0.34 L has a better suppression effect. And it is known that a bigger area rate means higher consumption. Considering both the cost and the anti-sloshing effect, the modular horizontal baffles with a length of 0.26 L and a width of 0.46 B would be an optimal choice.

5. Conclusions

In this research, the anti-sloshing effect of horizontal rectangle baffles for liquefied cargo sloshing has been studied in detail. The simulation model was established based on the DEM. The laterite nickel ore with a 40% moisture content was adopted for simulation. Based on the cargo gravity center offset and the sloshing-induced force on the cargo hold, the anti-sloshing effect of different baffles was compared and discussed. The main conclusions are drawn as follows.
(1)
Based on the verification of the direct shear test, the effect of moisture content on particle motion could be estimated by the particle friction coefficients. Characteristics of liquefied cargo sloshing could be captured, and the anti-sloshing effect of different baffles could be interpreted well by the present method.
(2)
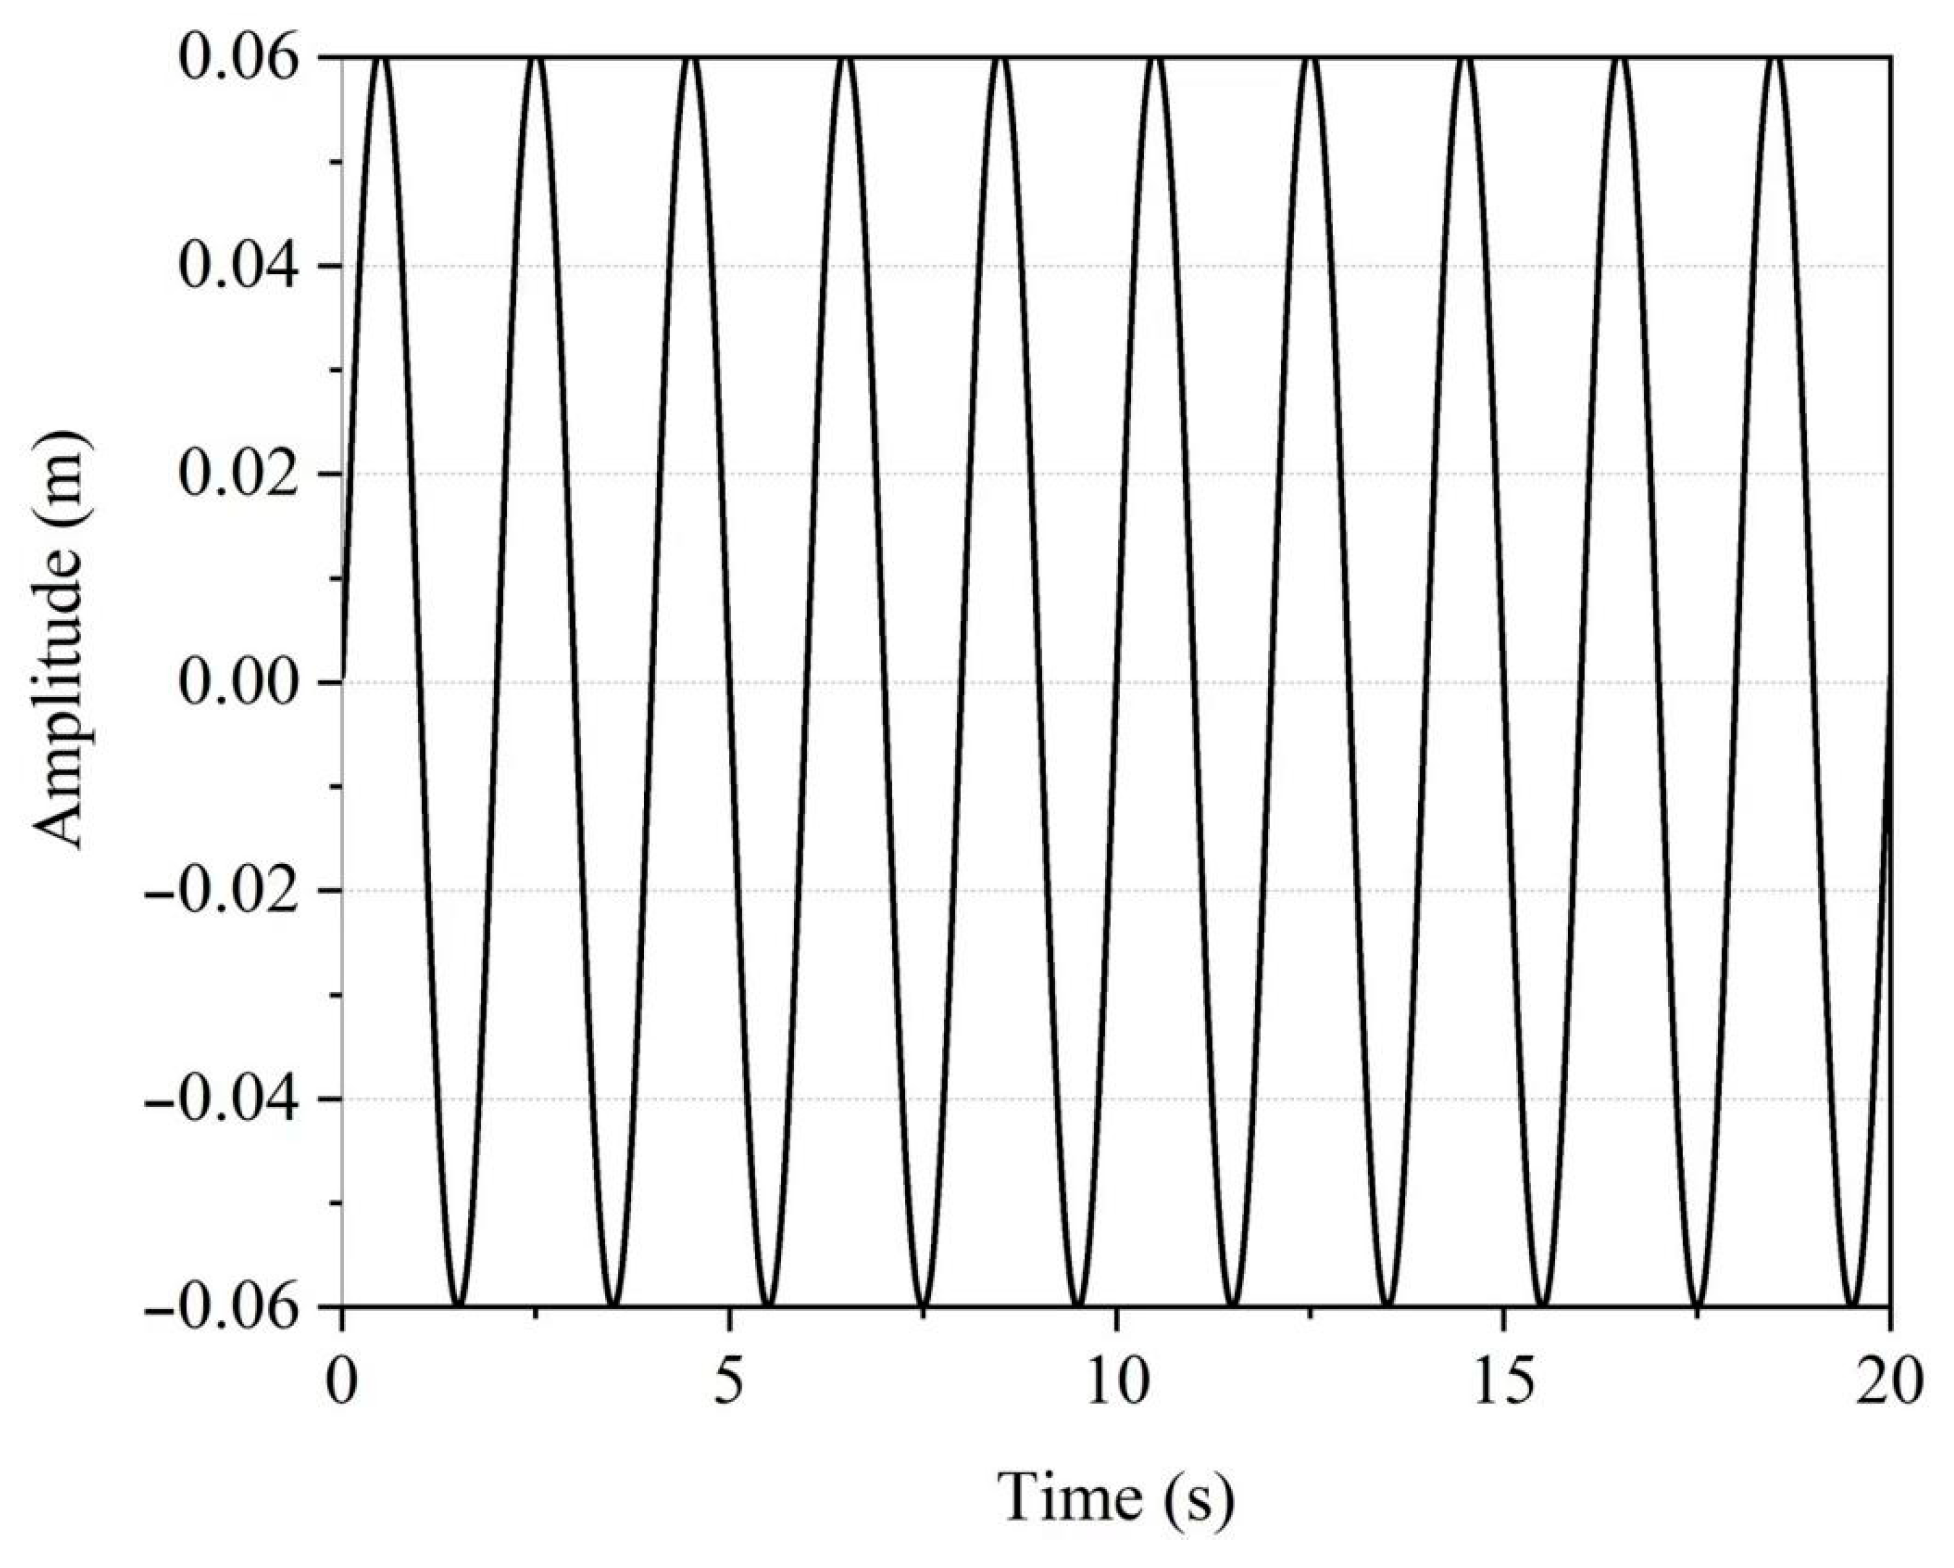
For liquefied cargo motion in the cargo hold without baffles, cargo accumulation on one side of the cargo hold also occurred. For the roll motion with a frequency of 0.1 Hz and amplitude of 15°, the maximum offset of the cargo gravity center reached about 90.8 mm, accounting for 12.61% of the length of the cargo hold. The maximum force on the cargo hold was about 36.71 kN. These are the two main reasons for the capsizing of these kinds of ships.
(3)
For one pair of horizontal baffles, when it is located close to the cargo top surface, the motion amplitude of the cargo and the force on the cargo hold could be reduced to the largest extent. The anti-sloshing effect is proportional to the baffle width, and there is a critical baffle length at which the baffle effect is better.
(4)
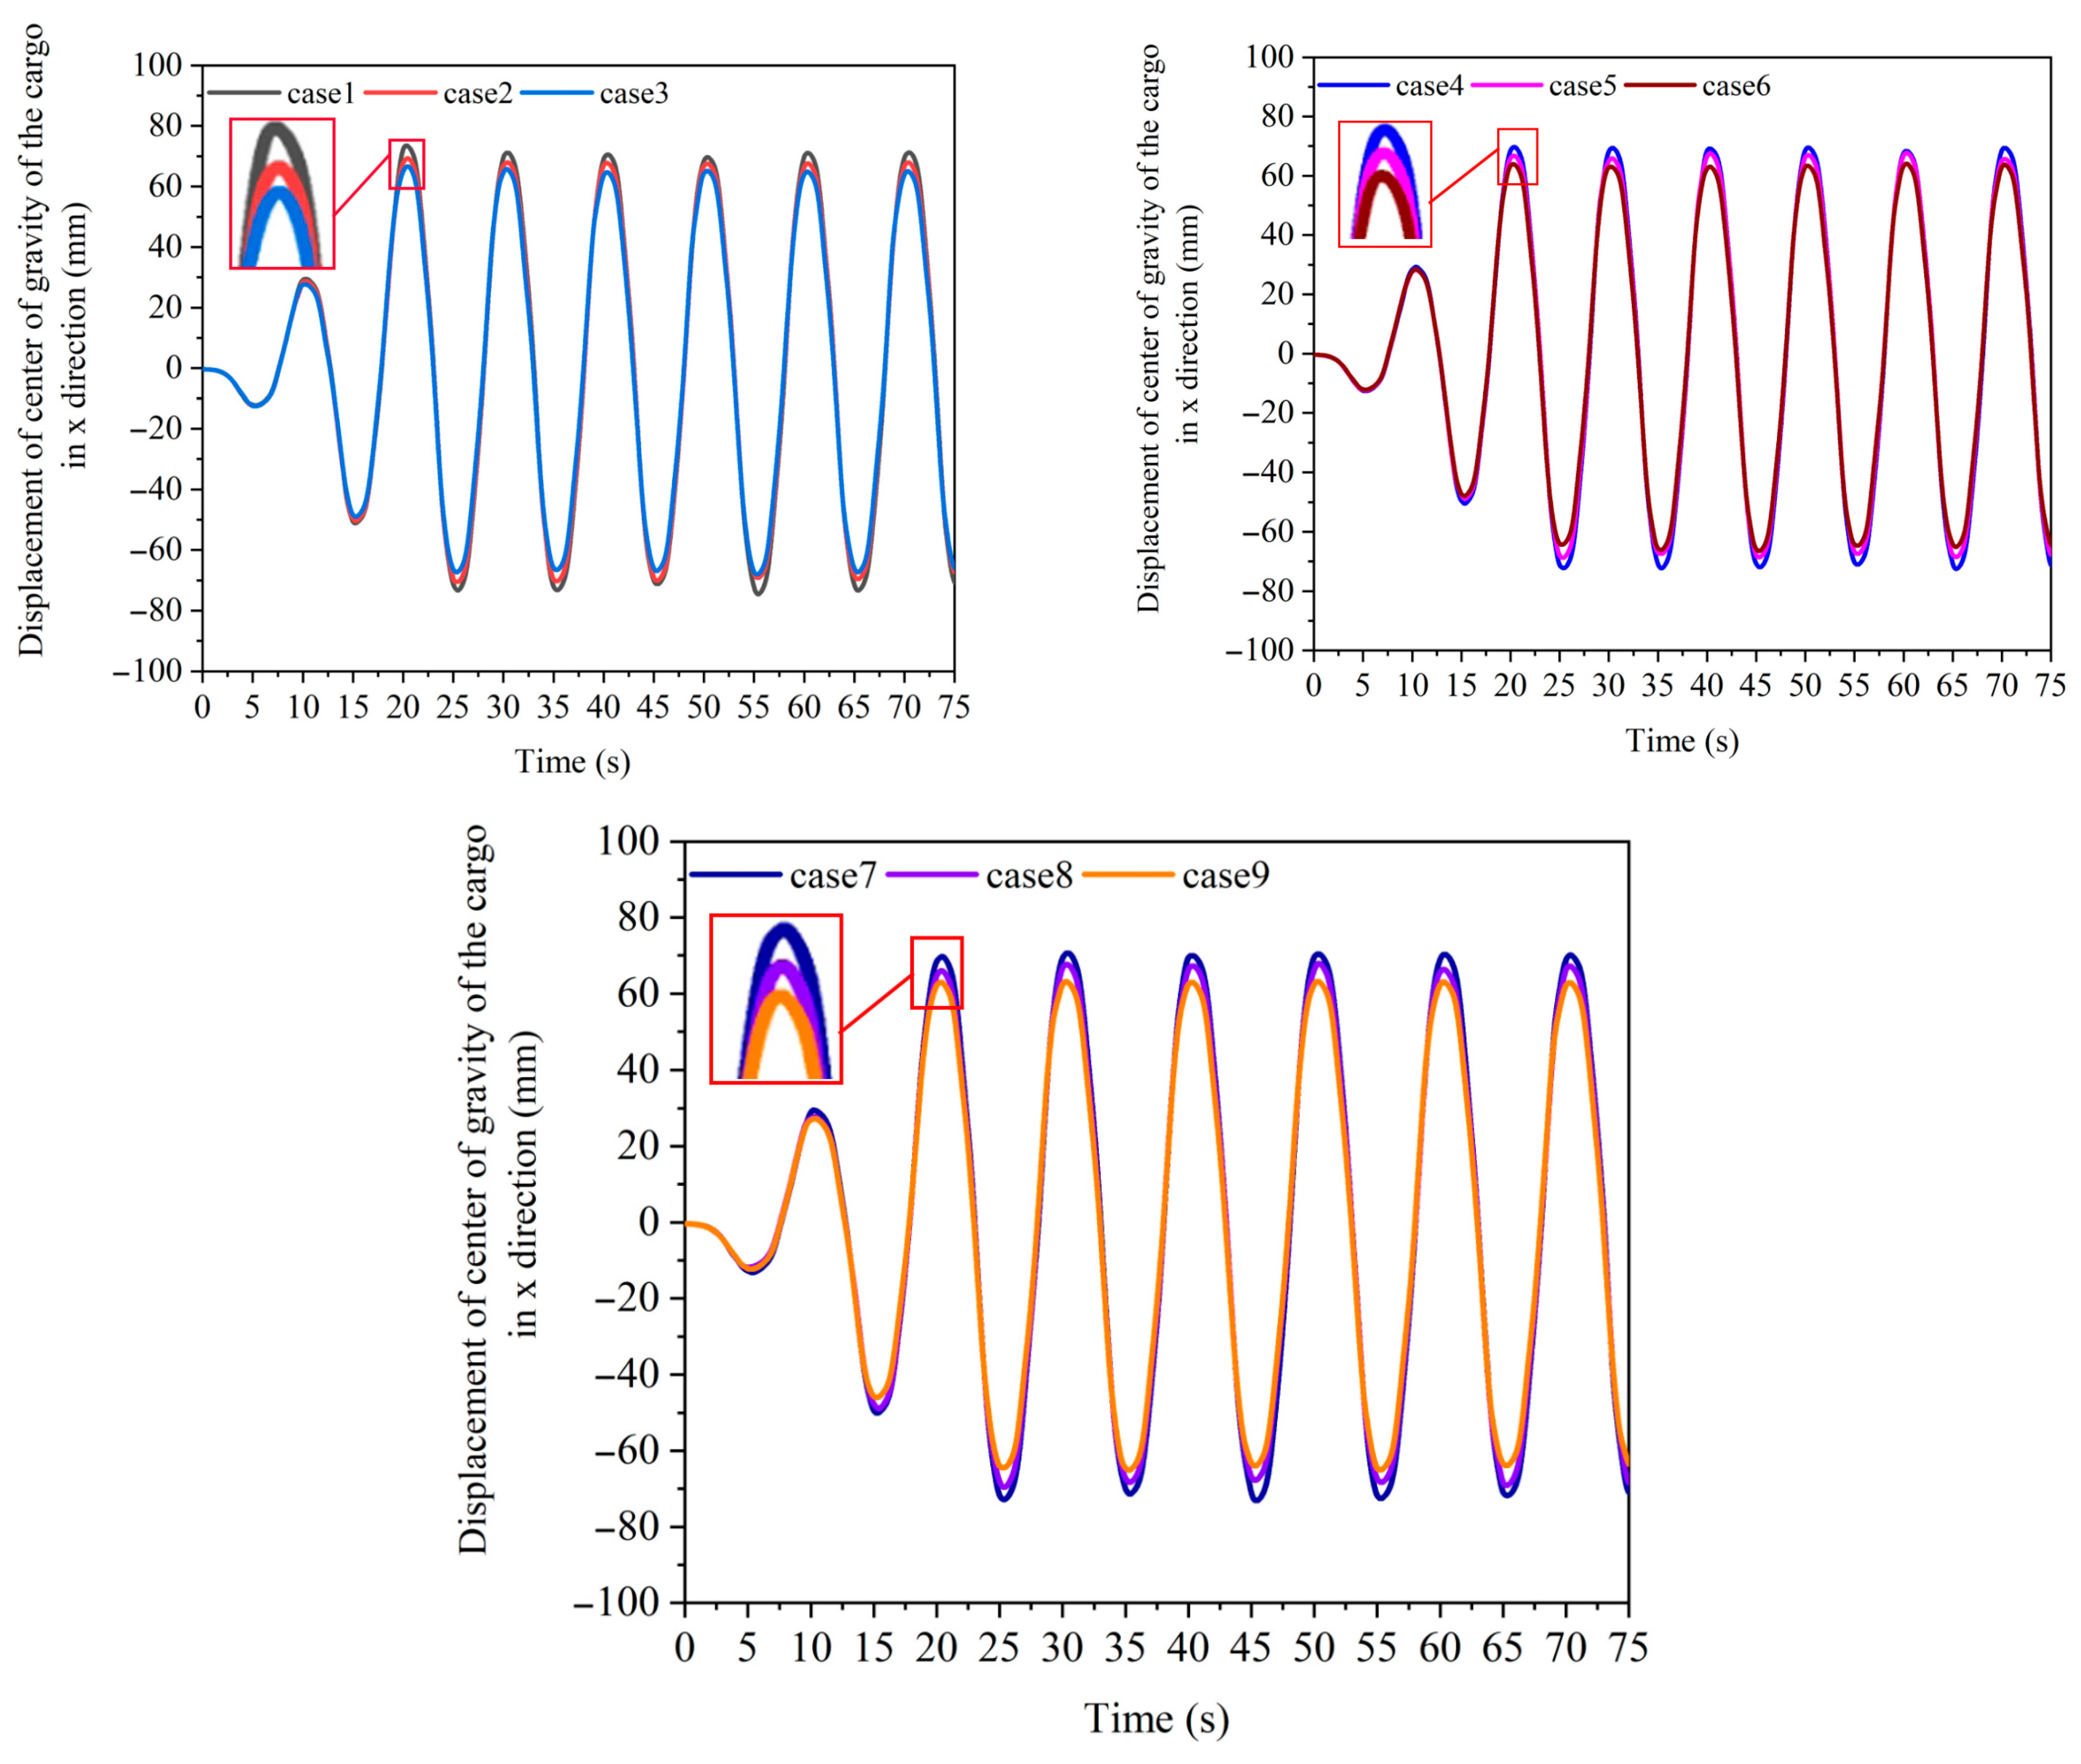
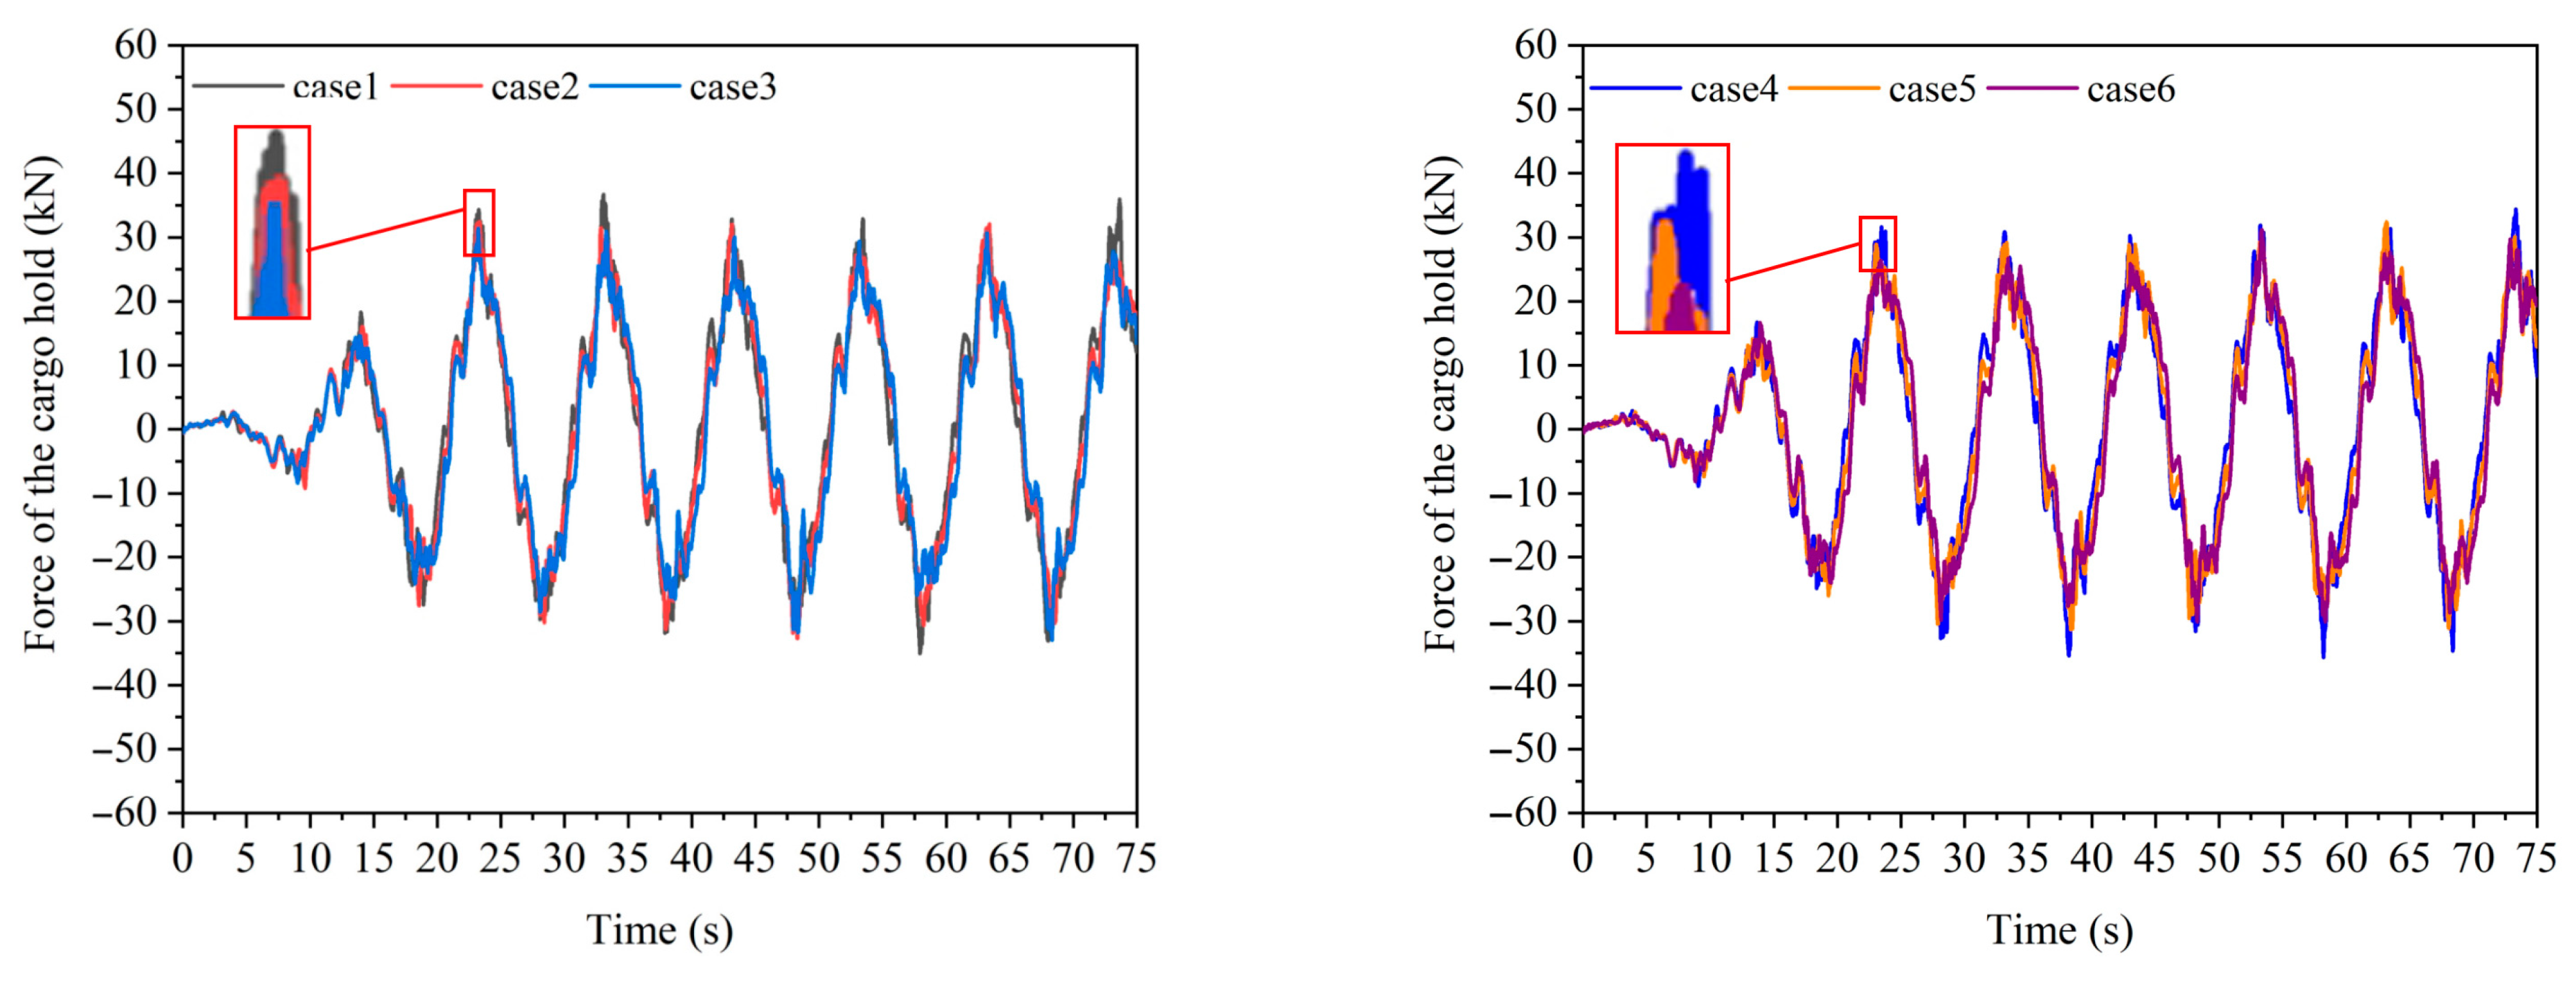
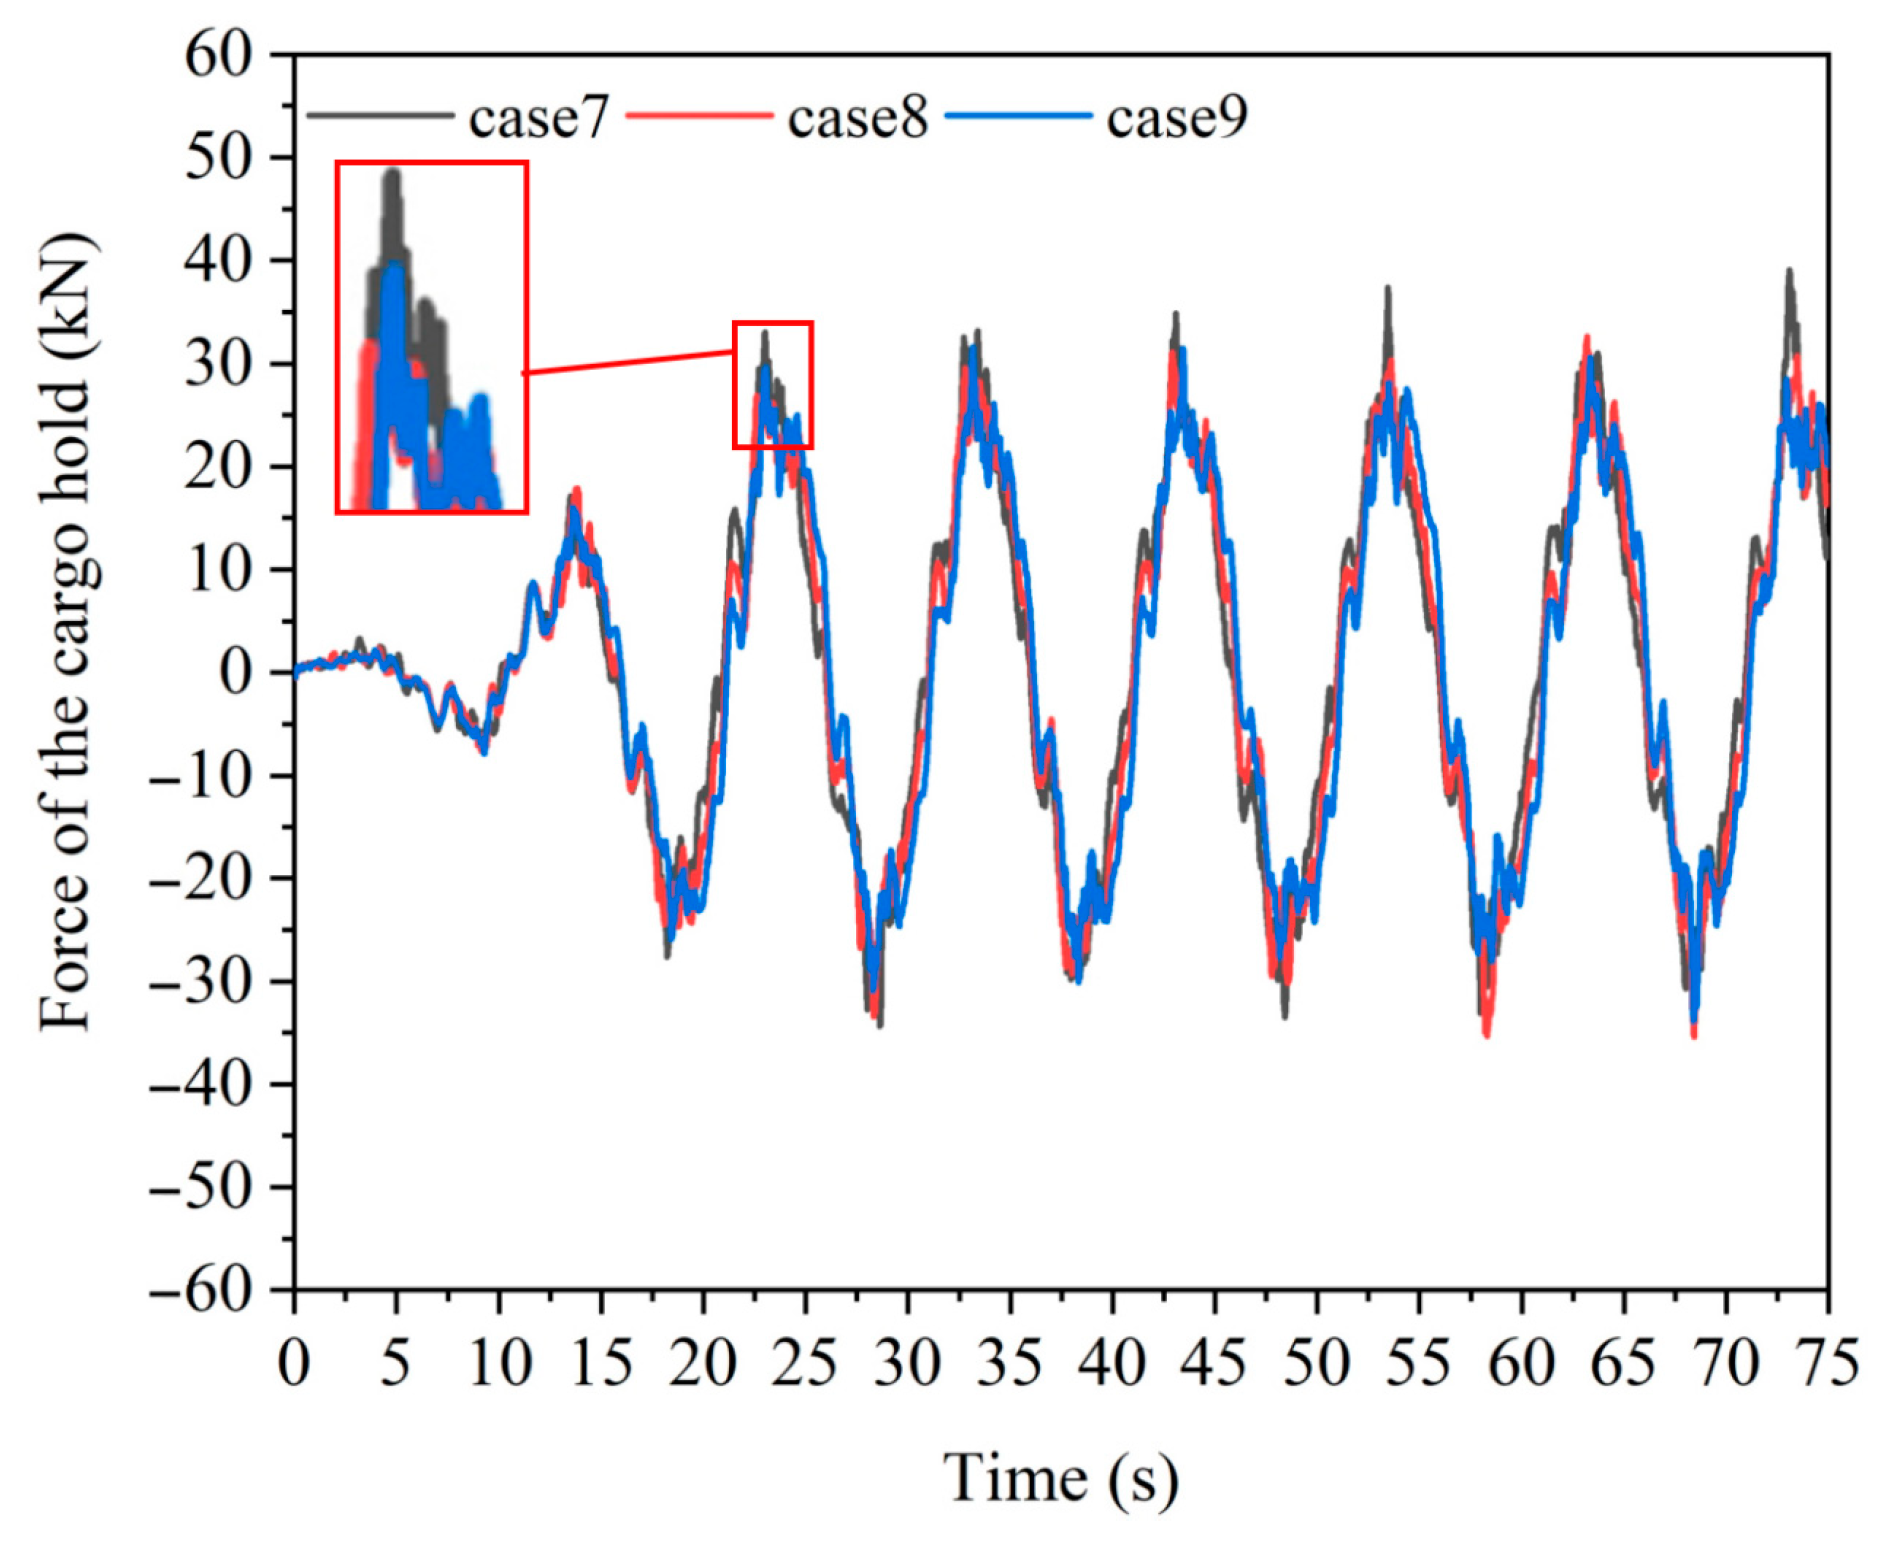
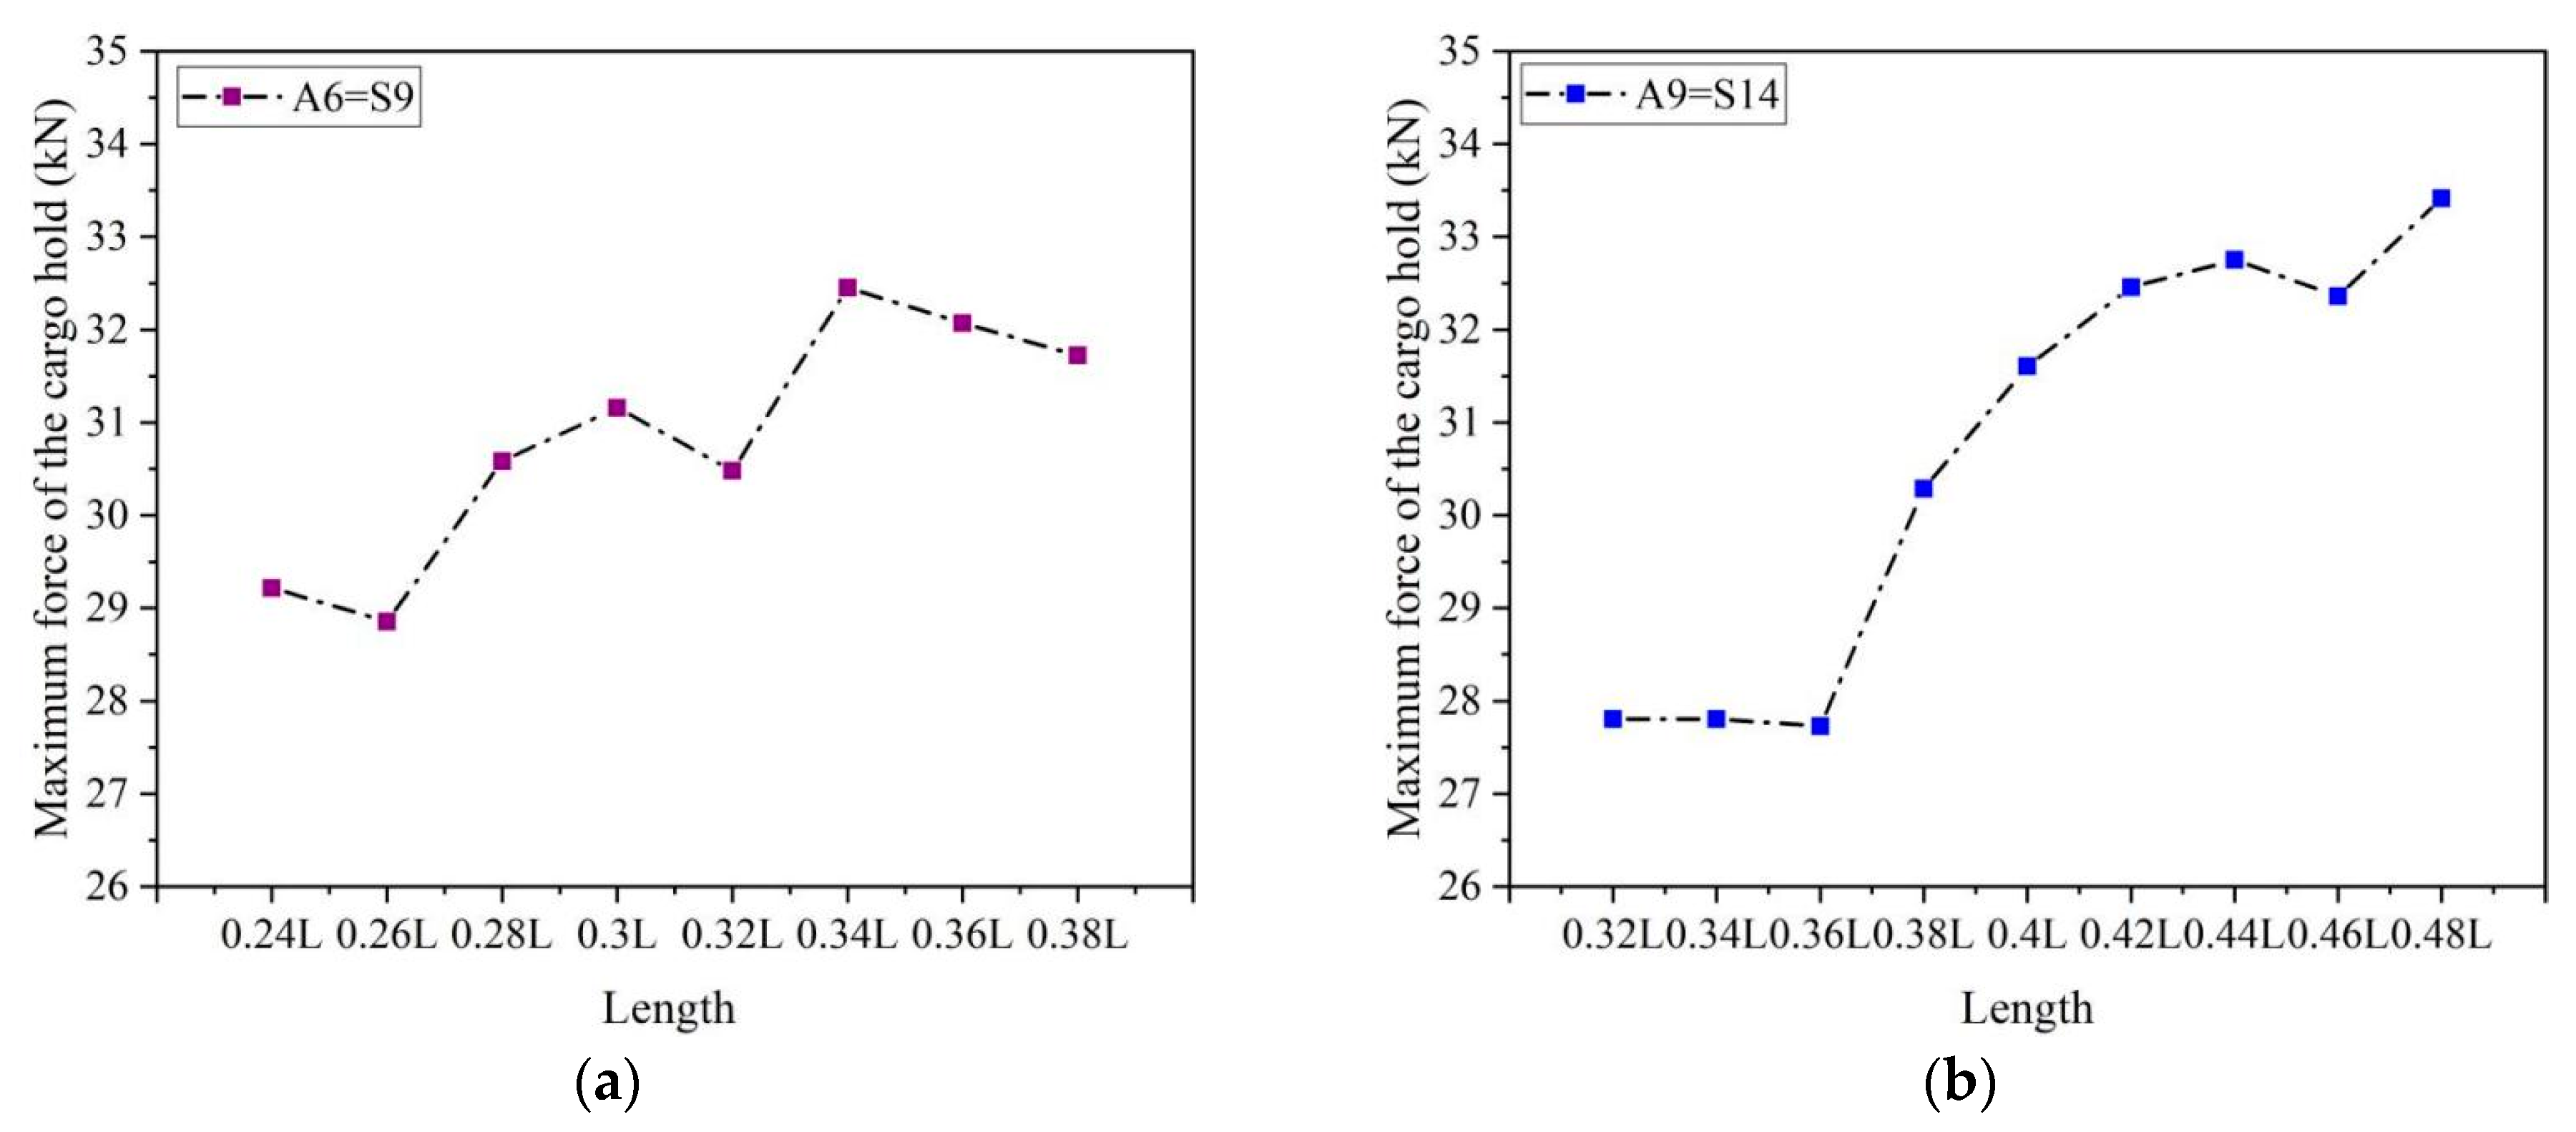
For two pairs of horizontal baffles, the anti-sloshing effect is better than for one pair of horizontal baffles at the same area rate. But the anti-sloshing effect does not have a linear correlation with the baffle area rate. There is an optimal combination of baffle length and width for a better cargo motion suppression effect. For the present research, the baffle located on the cargo top surface with a baffle length of 0.26 L and a width of 0.46 B had a better anti-sloshing effect and had the smallest baffle area rate.
This research could be meaningful for the application of anti-sloshing baffles for liquefiable cargo carriers to prevent their capsizing. Accordingly, some more issues should be solved to use the baffles on a carrier in practice. For example, the weight that the baffle brings to a ship and the strength of the baffle itself should be considered. So, under the premise of a better anti-sloshing effect, the lightweight, modular, high-strength, and low-cost baffles should be studied and proposed further.

Author Contributions

Methodology, J.Z. and D.Y.; software, A.W. and P.C.; investigation, J.L.; resources, J.L.; data curation, P.C.; writing—original draft preparation, J.Z. and A.W.; writing—review and editing, D.Y.; supervision, D.Y.; funding acquisition, J.Z. All authors have read and agreed to the published version of the manuscript.

Funding

This research was funded by [National Natural Science Foundation of China] grant number [51809237] and [Fundamental Research Funds for the Provincial Universities] grant number [2021J017].

Institutional Review Board Statement

Not applicable.

Informed Consent Statement

Not applicable.

Data Availability Statement

The data that support the findings of this study are available on request from the corresponding author.

Conflicts of Interest

The authors declare no conflict of interest.

References

  1. Xu, Y.; Zhang, J.; Liu, J. Review and prospects on research methods of strength failure for shipped bulk granular cargoes. Marine Georesour. Geotechnol. 2024, 1–19. [Google Scholar] [CrossRef]
  2. Zhang, J.; Wu, W.; Hu, J. A numerical study of the effects of the longitudinal baffle on nickel ore slurry sloshing in a prismatic cargo hold. Mar. Struct. 2016, 46, 149–166. [Google Scholar] [CrossRef]
  3. Zhang, J.; Wu, W.; Zhao, Z.; Chen, Y. Numerical study on coupled effect of a vessel loaded with liquefied nickel ore. J. Mar. Sci. Technol. 2020, 25, 520–535. [Google Scholar] [CrossRef]
  4. Seed, H.B.; Idriss, I.M. Simplified procedure for evaluating soil liquefaction potential. J. Soil Mech. Found. Div. 1971, 97, 1249–1273. [Google Scholar] [CrossRef]
  5. Munro, M.C.; Mohajerani, A. Bulk cargo liquefaction incidents during marine transportation and possible causes. Ocean Eng. 2017, 141, 125–142. [Google Scholar] [CrossRef]
  6. Intercargo. Bulk Carrier Casualty Report 2014–2023—Intercargo. 2023. Available online: https://www.intercargo.org/bulk-carrier-casualty-report-2014-2023/ (accessed on 10 July 2024).
  7. Mohajerani, A.; Dean, J.; Munro, M.C. An overview of the behaviour of iron ore fines cargoes, and some recommended solutions for the reduction of shifting incidents during marine transportation. Ocean Eng. 2019, 182, 451–474. [Google Scholar] [CrossRef]
  8. Moreira, D.D.; dos Santos, C.A.; Mesquita, A.L.; Moreira, D.C. Influence of particle size distribution of iron ore fines on liquefaction during marine transportation. Powder Technol. 2020, 373, 301–309. [Google Scholar] [CrossRef]
  9. Ferreira, R.F.; Lima RM, F. Relationship between particle size distribution and the PFD80 transportable moisture limit of iron ore fines. Powder Technol. 2023, 414, 118072. [Google Scholar] [CrossRef]
  10. Airey, D.W.; Ghorbani, J. Analysis of unsaturated soil columns with application to bulk cargo liquefaction in ships. Comput. Geotech. 2021, 140, 104402. [Google Scholar] [CrossRef]
  11. Guideline for the Safe Carriage of Nickel Ore, 2nd ed.; Nippon Kaiji Kyokai (ClassNK) Research Institute: Chiyoda-ku, Japan, 2012.
  12. Ju, L.; Vassalos, D.; Wang, Q.; Wang, Y.; Liu, Y. Numerical investigation of solid bulk cargo liquefaction. Ocean Eng. 2018, 159, 333–347. [Google Scholar] [CrossRef]
  13. Zhou, J.; Du, Q.; Jian, Q.W.; Li, C.; Zhang, Z.Q. Discrete element numerical simulation of model experiments of iron concentrate ore fluidization during shipping. J. Hohai Univ. (Nat. Sci.) 2016, 44, 219–225. [Google Scholar]
  14. Zou, Y.; Deng, J. Horizontal impact loads and torsional moment induced by partial cargo shifts. Ocean Eng. 2022, 252, 111260. [Google Scholar] [CrossRef]
  15. Wu, W.; Li, Y.; Zhao, Z.; Zheng, Q.; Zhang, C.; Ji, H.; Yu, X.; Yu, S. Quantitative analysis of liquefaction risk of liquefiable solid bulk cargoes during sea transport. Ocean Eng. 2022, 258, 111751. [Google Scholar] [CrossRef]
  16. Qin, H.; Mu, L.; Tang, W.; Hu, Z. Numerical study on structural response of anti-sloshing baffles of different configurations in a sloshing tank considering hydroelasticity. Ocean Eng. 2019, 188, 106290. [Google Scholar] [CrossRef]
  17. George, A.; Cho, I.H. Anti-sloshing effects of a vertical porous baffle in a rolling rectangular tank. Ocean Eng. 2020, 214, 107871. [Google Scholar] [CrossRef]
  18. Bellezi, C.A.; Cheng, L.Y.; Nishimoto, K. A numerical study on sloshing mitigation by vertical floating rigid baffle. J. Fluids Struct. 2022, 109, 103456. [Google Scholar] [CrossRef]
  19. Saito, Y.; Sawada, T. Dynamic pressure change in a rotating, laterally oscillating cylindrical container. J. Ocean Eng. Sci. 2018, 3, 91–95. [Google Scholar] [CrossRef]
  20. Molin, B. Hydrodynamic modeling of perforated structures. Appl. Ocean Res. 2011, 33, 1–11. [Google Scholar] [CrossRef]
  21. Molin, B.; Remy, F. Experimental and numerical study of the sloshing motion in a rectangular tank with a perforated screen. J. Fluids Struct. 2013, 43, 463–480. [Google Scholar] [CrossRef]
  22. Chu, C.R.; Wu, Y.R.; Wu, T.R.; Wang, C.Y. Slosh-induced hydrodynamic force in a water tank with multiple baffles. Ocean Eng. 2018, 167, 282–292. [Google Scholar] [CrossRef]
  23. Miles, J.W. Ring damping of free surface oscillations in a circular tank. J. Appl. Mech. 1958, 25, 274–276. [Google Scholar] [CrossRef]
  24. Liang, B.; Zhou, K. Experimental study on rigid and flexible anti-slosh plates in storage tank. J. Astronaut. 1993, 3, 83–89. Available online: https://www.cnki.com.cn/Article/CJFDTotal-YHXB199303011.htm (accessed on 10 July 2024).
  25. Faltinsen, O.M.; Timokha, A.N. Sloshing; Cambridge University Press: New York, NY, USA, 2009. [Google Scholar]
  26. Wang, J.H.; Sun, S.L. Study on liquid sloshing characteristics of a swaying rectangular tank with a rolling baffle. J. Eng. Math. 2019, 119, 23–41. [Google Scholar] [CrossRef]
  27. Celebi, M.S.; Akyildiz, H. Nonlinear modeling of liquid sloshing in a moving rectangular tank. Ocean Eng. 2002, 29, 1527–1553. [Google Scholar] [CrossRef]
  28. Tsao, W.H.; Chen, Y.C.; Kees, C.E.; Manuel, L. The effect of porous media on wave-induced sloshing in a floating tank. Appl. Sci. 2022, 12, 5587. [Google Scholar] [CrossRef]
  29. Cho, J.R.; Lee, H.W. Numerical study on liquid sloshing in baffled tank by nonlinear finite element method. Comput. Methods Appl. Mech. Eng. 2004, 193, 2581–2598. [Google Scholar] [CrossRef]
  30. Cho, J.R.; Lee, H.W.; Ha, S.Y. Finite element analysis of resonant sloshing response in 2-D baffled tank. J. Sound Vib. 2005, 288, 829–845. [Google Scholar] [CrossRef]
  31. Smaradhana, D.F.; Prabowo, A.R.; Ganda, A.N. Exploring the potential of graphene materials in marine and shipping industries—A technical review for prospective application on ship operation and material structure aspects. J. Ocean Eng. Sci. 2021, 6, 299–316. [Google Scholar] [CrossRef]
  32. Shi, C.; Zhang, Q.; Wang, S.N. Numerical simulation technology and application with particle flow code (PFC5.0). Rock Soil Mech. 2018, 39, 43. [Google Scholar]
  33. PFC Help Manual; ITASCA Consulting Group, Inc.: Minneapolis, MN, USA, 2016.
  34. Verlet, L. Computer “experiments” on classical fluids. I. Thermodynamical properties of Lennard-Jones molecules. Phys. Rev. 1967, 159, 98. [Google Scholar] [CrossRef]
  35. Zhou, J.; Jian, Q.W.; Wu, X.H.; Li, N.; Zhu, Y.M. Model experimental study of fluidization of iron concentrate ore in bulk. Chin. J. Rock Mech. Eng. 2013, 32, 2536–2543. [Google Scholar]
  36. Qian, J.G.; Yuan, J.Y.; Zhao, C.F. Soil Properties and Soil Mechanics; China Communications Press Co., Ltd.: Beijing, China, 2015. [Google Scholar]
  37. Zhang, J.; Wang, Z.; Lu, J.; Ju, L.; Chen, G. DEM modeling of the effects external loads and material properties on the stability of nickel ore in a cargo hold. Appl. Ocean Res. 2021, 117, 102949–102965. [Google Scholar] [CrossRef]
  38. Zhou, J.; Zhu, Y.M.; Jian, Q.W.; Jia, M.C.; Jin, Y.L. Modeling experiments on the fluidization of laterite nickel ore in bulk. Chin. J. Geotech. Eng. 2014, 8, 1515–1520. [Google Scholar]
Figure 1. The nicker ore cargo when initially loaded (left), after being liquefied (middle), and the carrier capsizing accident (right) [7].
Jmse 12 01234 g001
Figure 2. Linear contact behavior of two particles [33].
Jmse 12 01234 g002
Figure 3. Cargo hold model loaded with particles (particle radius is 0.01 m).
Jmse 12 01234 g003
Figure 4. Time history of the sway motion.
Jmse 12 01234 g004
Figure 5. Force in x-direction on the bulkhead for the 6 different cases.
Jmse 12 01234 g005
Figure 6. Offset of cargo gravity center in x-direction for the 6 different cases.
Jmse 12 01234 g006
Figure 7. Schematic diagram of direct shear test process (different colors represent different particle radii). (a) Initial shearing status. (b) Completed shearing status.
Jmse 12 01234 g007
Figure 8. Fitting curve of shear and normal strength.
Jmse 12 01234 g008
Figure 9. Static inclination test results by Class NK under different moisture content levels [11].
Jmse 12 01234 g009aJmse 12 01234 g009b
Figure 10. The present simulation results of static tilt test under different moisture contents.
Jmse 12 01234 g010
Figure 11. Numerical model of the cargo hold loaded with nickel ore particles.
Jmse 12 01234 g011
Figure 12. Motion status of liquefied nickel ore in the cargo hold during one motion period.
Jmse 12 01234 g012
Figure 13. Offset of cargo gravity center in the x-direction.
Jmse 12 01234 g013
Figure 14. Sloshing-induced force on the cargo hold.
Jmse 12 01234 g014
Figure 15. Motion of the liquefied nickel ore in the cargo hold during one motion period with one pair of horizontal baffles.
Jmse 12 01234 g015
Figure 16. Variation in cargo gravity center in the x-direction with one pair of horizontal baffles.
Jmse 12 01234 g016aJmse 12 01234 g016b
Figure 17. Variation in sloshing-induced force on the cargo hold with one pair of horizontal baffles.
Jmse 12 01234 g017
Figure 18. Maximum offset of the cargo gravity center in the x-direction with one pair of horizontal baffles. (a) h1 = 180 mm, (b) h2 = 160 mm, (c) h3 = 140 mm, (d) h4 = 120 mm.
Jmse 12 01234 g018
Figure 19. Maximum force on the cargo hold with one pair of horizontal baffles. (a) h1 = 180 mm, (b) h2 = 160 mm, (c) h3 = 140 mm, (d) h4 = 120 mm.
Jmse 12 01234 g019
Figure 20. Maximum offset of the center of gravity in the x-direction with different baffle width.
Jmse 12 01234 g020
Figure 21. Maximum force of the cargo hold with different baffle width.
Jmse 12 01234 g021
Figure 22. Maximum offset of the center of gravity in the x-direction with different baffle length.
Jmse 12 01234 g022
Figure 23. Maximum force of the cargo hold with different baffle length.
Jmse 12 01234 g023
Figure 24. Top view of arrangements of modular horizontal baffles.
Jmse 12 01234 g024
Figure 25. Displacement of gravity center of the cargo in x-direction of modular horizontal baffles.
Jmse 12 01234 g025
Figure 26. Force of the cargo hold under modular horizontal baffles.
Jmse 12 01234 g026aJmse 12 01234 g026b
Figure 27. Comparison of the maximum offset of the center of gravity of the cargo.
Jmse 12 01234 g027
Figure 28. Comparison of the maximum force on the cargo hold.
Jmse 12 01234 g028
Figure 29. Maximum offset of the cargo gravity center in the x-direction for different baffle lengths and widths. (a) when the area rate is 48%, (b) when the area rate is 64%.
Jmse 12 01234 g029
Figure 30. Maximum force on the cargo hold for different baffle lengths and widths. (a) when the area rate is 48%, (b) when the area rate is 64%.
Jmse 12 01234 g030
Table 1. Parameters of rolling resistance linear model.
ParametersValueParametersValue
Particle density ρ / k g / m 3 2500Acceleration of gravity g / m / s 2 9.8
Normal stiffness k n / P a 1 × 10⁵Shear stiffness k s / P a 5 × 10⁴
Equivalent elastic modulus E * / Pa 1 × 10⁶Stiffness ratio k = k n / k s 2
Friction coefficient μ 0.5Rolling friction coefficient μ r 0.5
Table 2. Simulation cases of different particle radii and time steps.
GroupsRadius/mParticle NumberSimulation Time/sTime Steps/sComputation Time/s
R_T10.02600201 × 10−41241
R_T20.014800201 × 10−49405
R_T30.0089375201 × 10−418,074
R_T40.014800202 × 10−44693
R_T50.014800208 × 10−511,666
R_T60.014800206 × 10−514,175
Table 3. Parameters of linear elastic contact model used in direct shear test.
ParametersValueParametersValue
Normal stiffness k n / P a 1 × 10⁸Particle density ρ / k g / m 3 2700
Shear stiffness k s / P a 1 × 10⁸Particle friction coefficient μ 1 0.5
Stiffness ratio k = k n / k s 1Wall friction coefficient μ 2 0.2
Table 4. Shear strength of iron ore under different confining pressures.
Confining Pressure (Normal Strength)/kPaShear Strength/kPa
10086
200159
300237
400291
Table 5. Relationship between moisture content and particle friction coefficients.
Moisture ContentFriction Coefficient (μ)Rolling Friction Coefficient ( μ r )Moisture ContentFriction Coefficient (μ)Rolling Friction Coefficient ( μ r )Moisture ContentFriction Coefficient (μ)Rolling Friction Coefficient ( μ r )
35%0.70.538%0.350.2242%0.080.02
36%0.60.439%0.20.0544%0.020.02
37%0.40.3540%0.10.0249%0.0050.005
Table 6. Sizes of one pair of horizontal baffles and the installation heights.
CasesBaffle Length/mmBaffle Width/mm Baffle   Plane   Area / m m 2 Installation Height/mm
l1b1l1 = 0.2 L = 144b1 = 0.2 B = 96
b2 = 0.4 B = 192
b3 = 0.6 B = 288
b4 = 0.8 B= 384
b5 = B = 480
S 1 = 27,648 h1 = 180
h2 = 160
h3 = 140
h4 = 120
l1b2 S 2 = 55,296
l1b3 S 3 = 82,944
l1b4 S 4 = 110,592
l1b5 S 5 = 138,240
l2b1l2 = 0.3 L = 216 S 6 = 41,472
l2b2 S 7 = 82,944
l2b3 S 8 = 124,416
l2b4 S 9 = 165,888
l2b5 S 10 = 207,360
l3b1l3 = 0.4 L= 288 S 11 = 55,296
l3b2 S 12 = 110,592
l3b3 S 13 = 165,888
l3b4 S 14 = 221,184
l3b5 S 15 = 274,480
l4b1l4 = 0.5 L= 360 S 16 = 69,120
l4b2 S 17 = 138,240
l4b3 S 18 = 207,360
l4b4 S 19 = 276,480
l4b5 S 20 = 345,600
Table 7. Sizes of the modular horizontal baffles.
CasesLength of a Single Baffle/mmWidth of a Single Baffle/mm Total   Area   of   Baffles / m m 2 Area Rate
Case 10.2 L = 1440.2 B = 96 A 1 = S 2 = 55,296 16%
Case 20.2 L = 1440.3 B = 144 A 2 = S 3 = 82,944 24%
Case 30.2 L = 1440.4 B = 192 A 3 = S 4 = 110,592 32%
Case 40.3 L = 2160.2 B = 96 A 4 = S 7 = 82,944 24%
Case 50.3 L = 2160.3 B = 144 A 5 = S 8 = 124,416 36%
Case 60.3 L = 2160.4 B = 192 A 6 = S 9 = 165,888 48%
Case 70.4 L = 2880.2 B = 96 A 7 = S 12 = 110,592 32%
Case 80.4 L = 2880.3 B = 144 A 8 = S 13 = 165,888 48%
Case 90.4 L = 2880.4 B = 192 A 9 = S 14 = 221,184 64%
Disclaimer/Publisher’s Note: The statements, opinions and data contained in all publications are solely those of the individual author(s) and contributor(s) and not of MDPI and/or the editor(s). MDPI and/or the editor(s) disclaim responsibility for any injury to people or property resulting from any ideas, methods, instructions or products referred to in the content.

