Article

Elucidating Temporal Patterns in Coral Health and Assemblage Structure in Papahānaumokuākea

by
Atsuko Fukunaga
1,2,*,
Kailey H. Pascoe
3,4,
Randall K. Kosaki
2,5 and
John H. R. Burns
3
1
Cooperative Institute for Marine and Atmospheric Research, University of Hawai‘i at Mānoa, Honolulu, HI 96822, USA
2
Papahānaumokuākea Marine National Monument, Office of National Marine Sanctuaries, National Ocean Service, National Oceanic and Atmospheric Administration, Honolulu, HI 96818, USA
3
MEGA Lab, College of Natural and Health Sciences, University of Hawai‘i at Hilo, Hilo, HI 96720, USA
4
Center for Global Discovery and Conservation Science—Hilo, Arizona State University, Hilo, HI 96720, USA
5
Center for the Exploration of Coral Reef Ecosystems (XCoRE), Bishop Museum, Honolulu, HI 96817, USA
*
Author to whom correspondence should be addressed.
J. Mar. Sci. Eng. 2024, 12(8), 1267; https://doi.org/10.3390/jmse12081267
Submission received: 18 April 2024 / Revised: 19 July 2024 / Accepted: 25 July 2024 / Published: 28 July 2024
(This article belongs to the Topic Conservation and Management of Marine Ecosystems)

Abstract

:
Coral reefs worldwide are under increasing levels of pressure due to global and local stressors. Long-term monitoring of coral reefs through repeated observations at fixed survey sites allows scientists to assess temporal patterns in coral-reef communities and plays important roles in informing managers of the state of the ecosystems. Here, we describe coral assemblages in Papahānaumokuākea, the largest contiguous fully protected marine conservation area in the United States, using long-term monitoring data collected from 20 permanent (fixed) sites at three islands/atolls, Lalo, Kapou and Manawai, between 2014 and 2021. Significant temporal shifts in coral colony composition were detected at some of the monitoring sites, which were attributed to the impact of a mass coral bleaching event in 2014 and Hurricane Walaka in 2018. In particular, the bleaching affected multiple sites at Kapou and one site at Manawai where coral assemblages shifted from the Montipora dilatata/flabellata/turgescens complex to M. capitata dominance; despite being the dominant species at multiple monitoring sites prior to the bleaching, the M. dilatata/flabellata/turgescens complex has not been recorded at any of our monitoring sites in recent years. Coral conditions, such as bleaching, predation, subacute tissue loss, Porites pigmentation response and trematodiasis, did not show differences in the occurrence among the three islands/atolls once the site and temporal variabilities, as well as environmental covariates for bleaching, were considered. Coral genera, however, exhibited different sensitivities to these conditions. These findings highlight the importance of continuing coral reef monitoring at the species level, covering a broad range of coral assemblage compositions and habitat types in Papahānaumokuākea.

1. Introduction

Reef-building corals are important ecosystem engineers that provide complex three-dimensional framework and serve as habitat for diverse reef organisms [1]. These reef organisms are important resources for coastal communities that depend on them for food and livelihood [2]. Coral reefs also protect coastlines from waves, flooding and erosion [3] and generate carbonate material that is essential to maintaining beaches and island shorelines [4]. As coral reefs worldwide are threatened by the impacts of climate change such as ocean warming, acidification and increased frequency and severity of extreme weather events, losses of the ecosystem services provided by coral reefs can have large economic impacts on coastal communities [5].
Long-term monitoring of coral reefs plays important roles in informing scientists and managers, detecting not only shifts or trends in coral-reef communities [6] but also impacts of pulse disturbances such as mass coral bleaching or storms [7,8]. Examining the composition of benthic communities and organismal abundance (e.g., live coral colony density per species) across time and space can reveal important insights into environmental factors, as well as different traits of coral, that influence the degrees of impacts from disturbance and subsequent recovery [6]. Coral diseases and conditions of reduced health are also important components of long-term monitoring as increases in the prevalence and severity of coral diseases have been linked to increased thermal stress and other anthropogenic stressors [9,10,11]. Disease outbreaks have often resulted in declines in coral abundance and richness and cause devastating impacts on the reef ecosystem [10,12].
Papahānaumokuākea Marine National Monument, the largest contiguous fully protected marine conservation area in the United States, is located northwest of the inhabited main Hawaiian Islands, encompassing approximately 1.5 million square kilometers of the area surrounding the Northwestern Hawaiian Islands. Due to its remoteness and protected status, Papahānaumokuākea offers a unique setting where researchers can investigate the reef ecosystems away from direct local impacts of anthropogenic activities, although such remoteness can also pose some limitations in terms of the consistency and frequency of monitoring surveys. Despite its protected status, coral reefs in Papahānaumokuākea experienced some disturbance events in recent years, including a mass coral bleaching event in 2014 [7], damage from Hurricane Walaka in 2018 [8,13] and spread of the mat-forming cryptogenic red alga Chondria tumulosa with invasive characteristics in 2019 [14]. Continuous monitoring is a critical ecological tool for investigating the state and recovery of these remote coral reefs.
Long-term monitoring of permanent (fixed) coral-reef sites in Papahānaumokuākea began in 2014 with site selection based on a list of historical survey sites throughout Papahānaumokuākea. The monitoring survey initially consisted of in-situ observations recording coral species identification and diseases/conditions. Other coral traits such as morphologies and colony sizes have been added to the survey since then. While other mid- and long-term analysis and metanalysis of coral assemblages often focused on coral cover as the metric of interest (e.g., [15,16,17]), our in-situ observations were originally designed for rapid assessments of coral reefs through recordings of coral colony counts and health conditions without the need for post-survey data processing of, for example, photographs or videos. The long-term monitoring aimed to survey the fixed sites annually in summer during a research expedition; this was not possible due to logistical challenges inherent to the remoteness of Papahānaumokuākea. The specific islands/atolls that were visited during research expeditions varied depending on the length and schedule of the expeditions, and the accessibility of the sites was dependent on weather conditions on a given day. Here we describe the state of coral assemblages in Papahānaumokuākea using monitoring data collected from 20 fixed sites that were surveyed between 2014 and 2021. Although the 20 sites represent a very small portion of coral reefs in Papahānaumokuākea considering its spatial extent, temporal analyses of the repeated observations at each site offer important insights into the structure of coral assemblages and their ecological state in Papahānaumokuākea.

2. Materials and Methods

2.1. Survey Design

Reef surveys were conducted annually in summer months during research expeditions to Papahānaumokuākea except for 2018 and 2020. Between 2014 and 2021, 20 fixed monitoring sites located at three islands/atolls, Lalo (French Frigate Shoals: 23°52′ N, 166°17′ W), Kapou (Lisianski Island: 26°04′ N, 173°58′ W) and Manawai (Pearl and Hermes Atoll: 27°56′ N, 175°44′ W), were relatively consistently surveyed (Table 1, Figure 1). All 20 sites were marked by GPS coordinates and compass headings for belt transect surveys and had permanent pins installed to guide transect tapes to facilitate long-term monitoring, although some pins have been lost over the years (Table 1).
Underwater survey methods slightly varied for the first few years. Surveyors laid a transect tape along permanent pins at each survey site or according to the compass heading for the site if pins could not be located after 15 min of searching. All scleractinian corals within 0.5 m on either side of the tape were identified to the lowest possible taxonomic level, and the health condition of each colony was recorded, including bleaching, Porites pigmentation response and trematodiasis, predation, subacute tissue loss and algal overgrowth/infection. Other diseases/conditions that were recorded but not used in the present study due to low frequencies of occurrence included endolithic fungal infection (4 colonies), Porites discolored swelling (3 colonies), skeletal growth anomalies (6 colonies) and white syndrome (3 colonies). In 2014, colony morphologies and sizes were not recorded due to adjustments to the standardized monitoring protocols. Transect lengths were also not recorded in 2014 and varied among the sites, from 10 m to 15 m at most, depending on dive profiles (e.g., allowable bottom time). Colony morphologies were recorded again starting in 2015, and the length of each transect was set to 10 m in 2016. Survey methodology was solidified in 2017 when surveyors also started measuring the size (maximum diameter) of each coral colony to the nearest half centimeter.

2.2. Coral Assemblage Analyses

Due to the changes in the survey methods over the years and unknown transect lengths in the first year, we focused on temporal changes in percent colony compositions of coral assemblages at the fixed monitoring sites using the software package PRIMER 7 with the PERMANOVA+ add-on (PRIMER-e, Auckland, New Zealand). Percent colony counts of each species per site (i.e., the number of colonies of a given species divided by the total number of coral colonies at the site recorded within a single belt transect) was obtained for each year from the colony count data. The dataset was then square-root transformed to reduce the effects of dominant species on the analyses. A formal analysis of overall patterns in colony composition was performed using permutational multivariate analysis of variance (PERMANOVA) [18,19] based on the Bray–Curtis dissimilarity, with 4999 permutations of residuals under a reduced model. The analysis consisted of three factors: Region (fixed with three levels: Lalo, Kapou and Manawai), Site (random with 20 levels, nested in Region) and Year (fixed with six levels: 2014, 2015, 2016, 2017, 2019, 2021). Note that some factor combinations were missing due to inconsistent survey efforts (Table 1) resulting from the limitation of accessing the extremely remote islands/atolls.
Because the formal PERMANOVA analysis showed statistically significant interaction effects between Region and Year (see results for details), we further analyzed the colony composition data separately for each island/atoll (Region) to investigate temporal changes at each monitoring site within each specific island/atoll. Hierarchical clustering was performed using the group-average option, and the grouping structures of the branches were tested using Type 1 similarity profile (SIMPROF) in order to identify groups of coral assemblages that were significantly different from one another but internally homogeneous [20,21]. Similarity percentage analysis (SIMPER) [22] was then used to determine coral species that typified each of the groups identified by the SIMPROF test.

2.3. Coral Health Condition Analyses

Due to many species accounting for less than 1% of surveyed coral colonies, we performed formal analyses of coral health conditions at the genus level focusing on the four genera, Porites, Montipora, Cyphastrea and Pocillopora, which accounted for approximately 90% of all coral colonies surveyed in situ in the present study. Univariate analysis of each coral health condition was performed using the brms package [23,24,25] in the statistical software R v. 4.3.3 (R Foundation for Statistical Computing, Vienna, Austria), which enables Bayesian generalized linear models with the C++ package Stan (mc-stan.org) using the Hamiltonian Monte Carlo method, and the Rcpp package [26,27,28]. The presence/absence of each condition recorded within a single transect at each site was separately modeled based on Bernoulli distribution with logit link function. Response variables for the analyses were the presence/absence (i.e., binary, 1 for presence and 0 for absence) of bleaching, predation, subacute tissue loss and Porites pigmentation response and trematodiasis. All four genera were used in the analysis for bleaching, but the genus Cyphastrea was excluded from all other analyses as there was no colony that exhibited subacute tissue loss and only one, out of 738 colonies, showed a sign of predation. Analyses of Porites pigmentation response and trematodiasis included only the genus Porites.
Explanatory variables for each of the univariate response variables were selected based on the leave-one-out cross-validation (LOO-CV) method using the LOO function in the brms package. Specifically, Site and Year were first included as grouping factors (i.e., random effects) to account for the repeated measures of coral conditions at each site across different years. Environmental covariates including sea surface temperature (Dataset ID: CRW_sst_v3_1), chlorophyll a concentrations (Dataset ID: aqua_chla_1d_2018_0) and ocean surface wind (Dataset ID: ccmp-daily-v2-0 and ccmp-daily-v2-1-NRT) were obtained from NOAA ERDDAP data server (https://oceanwatch.pifsc.noaa.gov/erddap/index.html, accessed on 14 August 2023) per site per year as 90-day average values leading up to the survey dates at the sites. The rationale for using 90 days as a time frame was the relevance to the degree heating week metric in the monitoring of coral bleaching by NOAA Coral Reef Watch that assesses accumulated heat stress over a three-month period. We also considered the time frame appropriate to capture the overall pattern of environmental conditions in terms of chlorophyll a concentrations and surface wind speed. These covariates were standardized by their mean values (sea surface temperature—26.42 °C, chlorophyll a—0.34 mg/m3, wind speed—6.21 m/s) and standard deviation values (sea surface temperature—1.41, chlorophyll a—0.13, wind speed—0.42), and after confirming that there was no issue of multicollinearity, the main and interaction terms up to the three-way interaction were fitted and evaluated based on LOO-CV and the principle of model parsimony. Finally, we evaluated whether adding other categorical variables as fixed effects improved the models. These included Region, with Site fitted as a random factor nested in Region, and Genus for bleaching, predation and subacute tissue loss. The occurrence (presence/absence) of algal overgrowth/infection was also included for subacute tissue loss and Porites pigmentation response as we occasionally observed these conditions together in the field.
For all analyses, default settings of the brm function were used for prior distributions and the sampling behavior of Stan, except for setting “max_treedepth” to 12 and “adapt_delta” to 0.99 to slow down the sampler and reduce the number of divergent transitions. For each final model selected based on LOO-CV, the bayes_R2 function in the brms package was used to calculate a Bayesian version of the R-squared value to estimate the proportion of deviance explained by the model. The estimated coefficients for the fixed effects (i.e., Region, Genus and the occurrence of algal overgrowth/infection), if any of them were in the final models, were interpreted as the logarithm of odds ratio for the factor level relative to the reference factor level. For example, the estimated coefficient for algal overgrowth/infection in the model for subacute tissue loss is the logarithm of odds ratio between the presence of algal overgrowth/infection and the absence of algal overgrowth/infection. Thus, exponentiating the coefficient allows us to interpret the odds of subacute tissue loss for the presence of algal overgrowth/infection to the odds for the absence of algal overgrowth.

3. Results

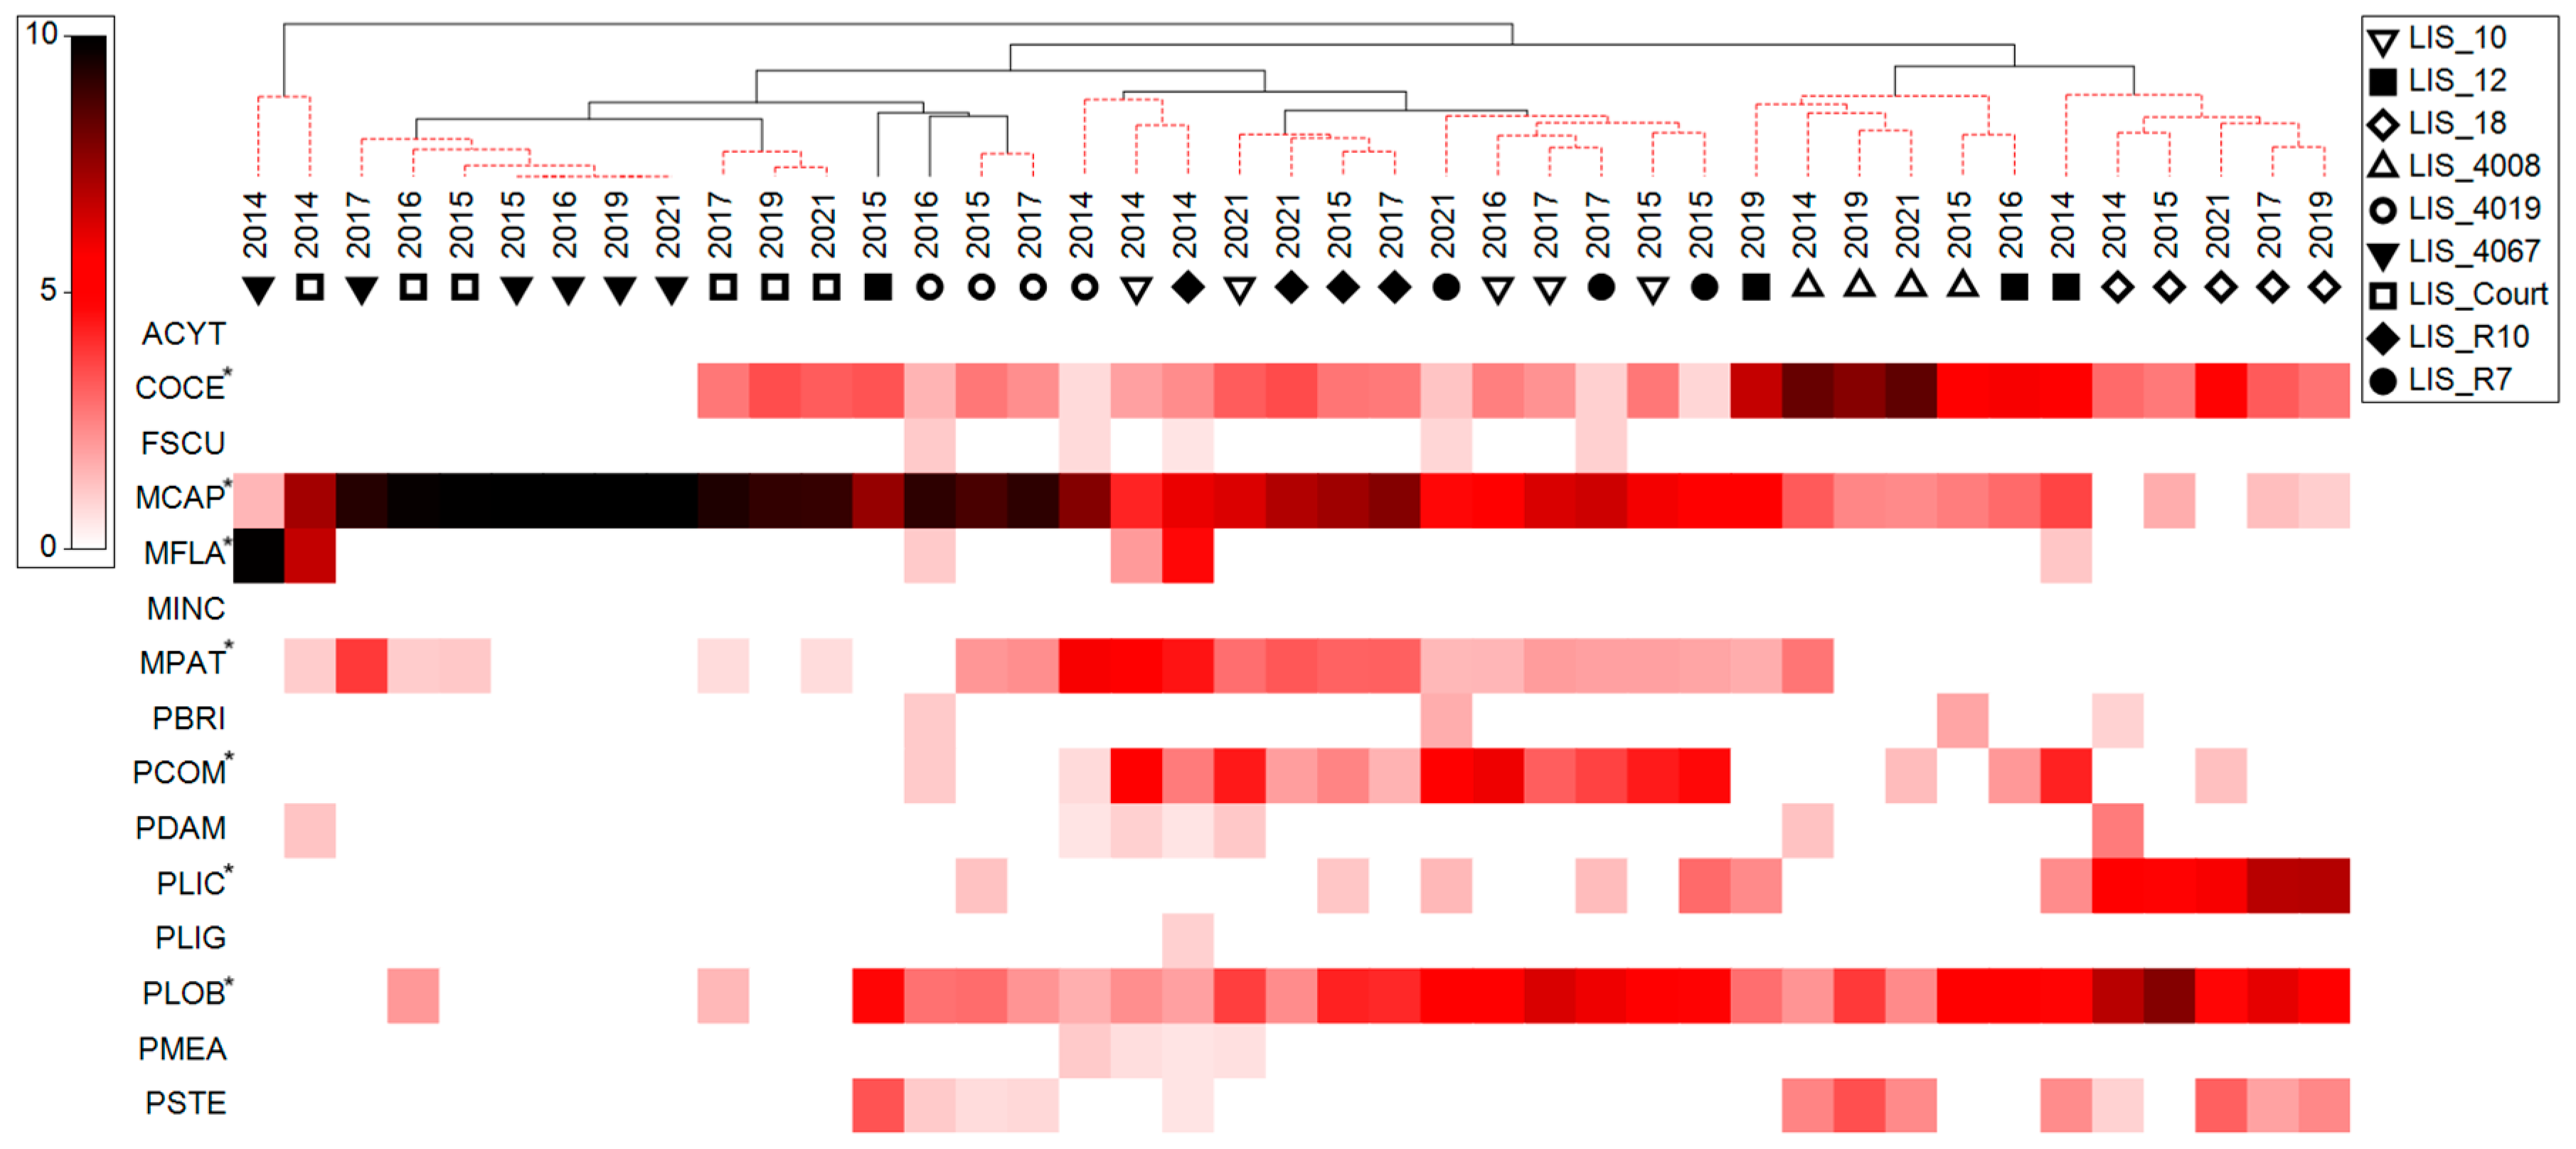
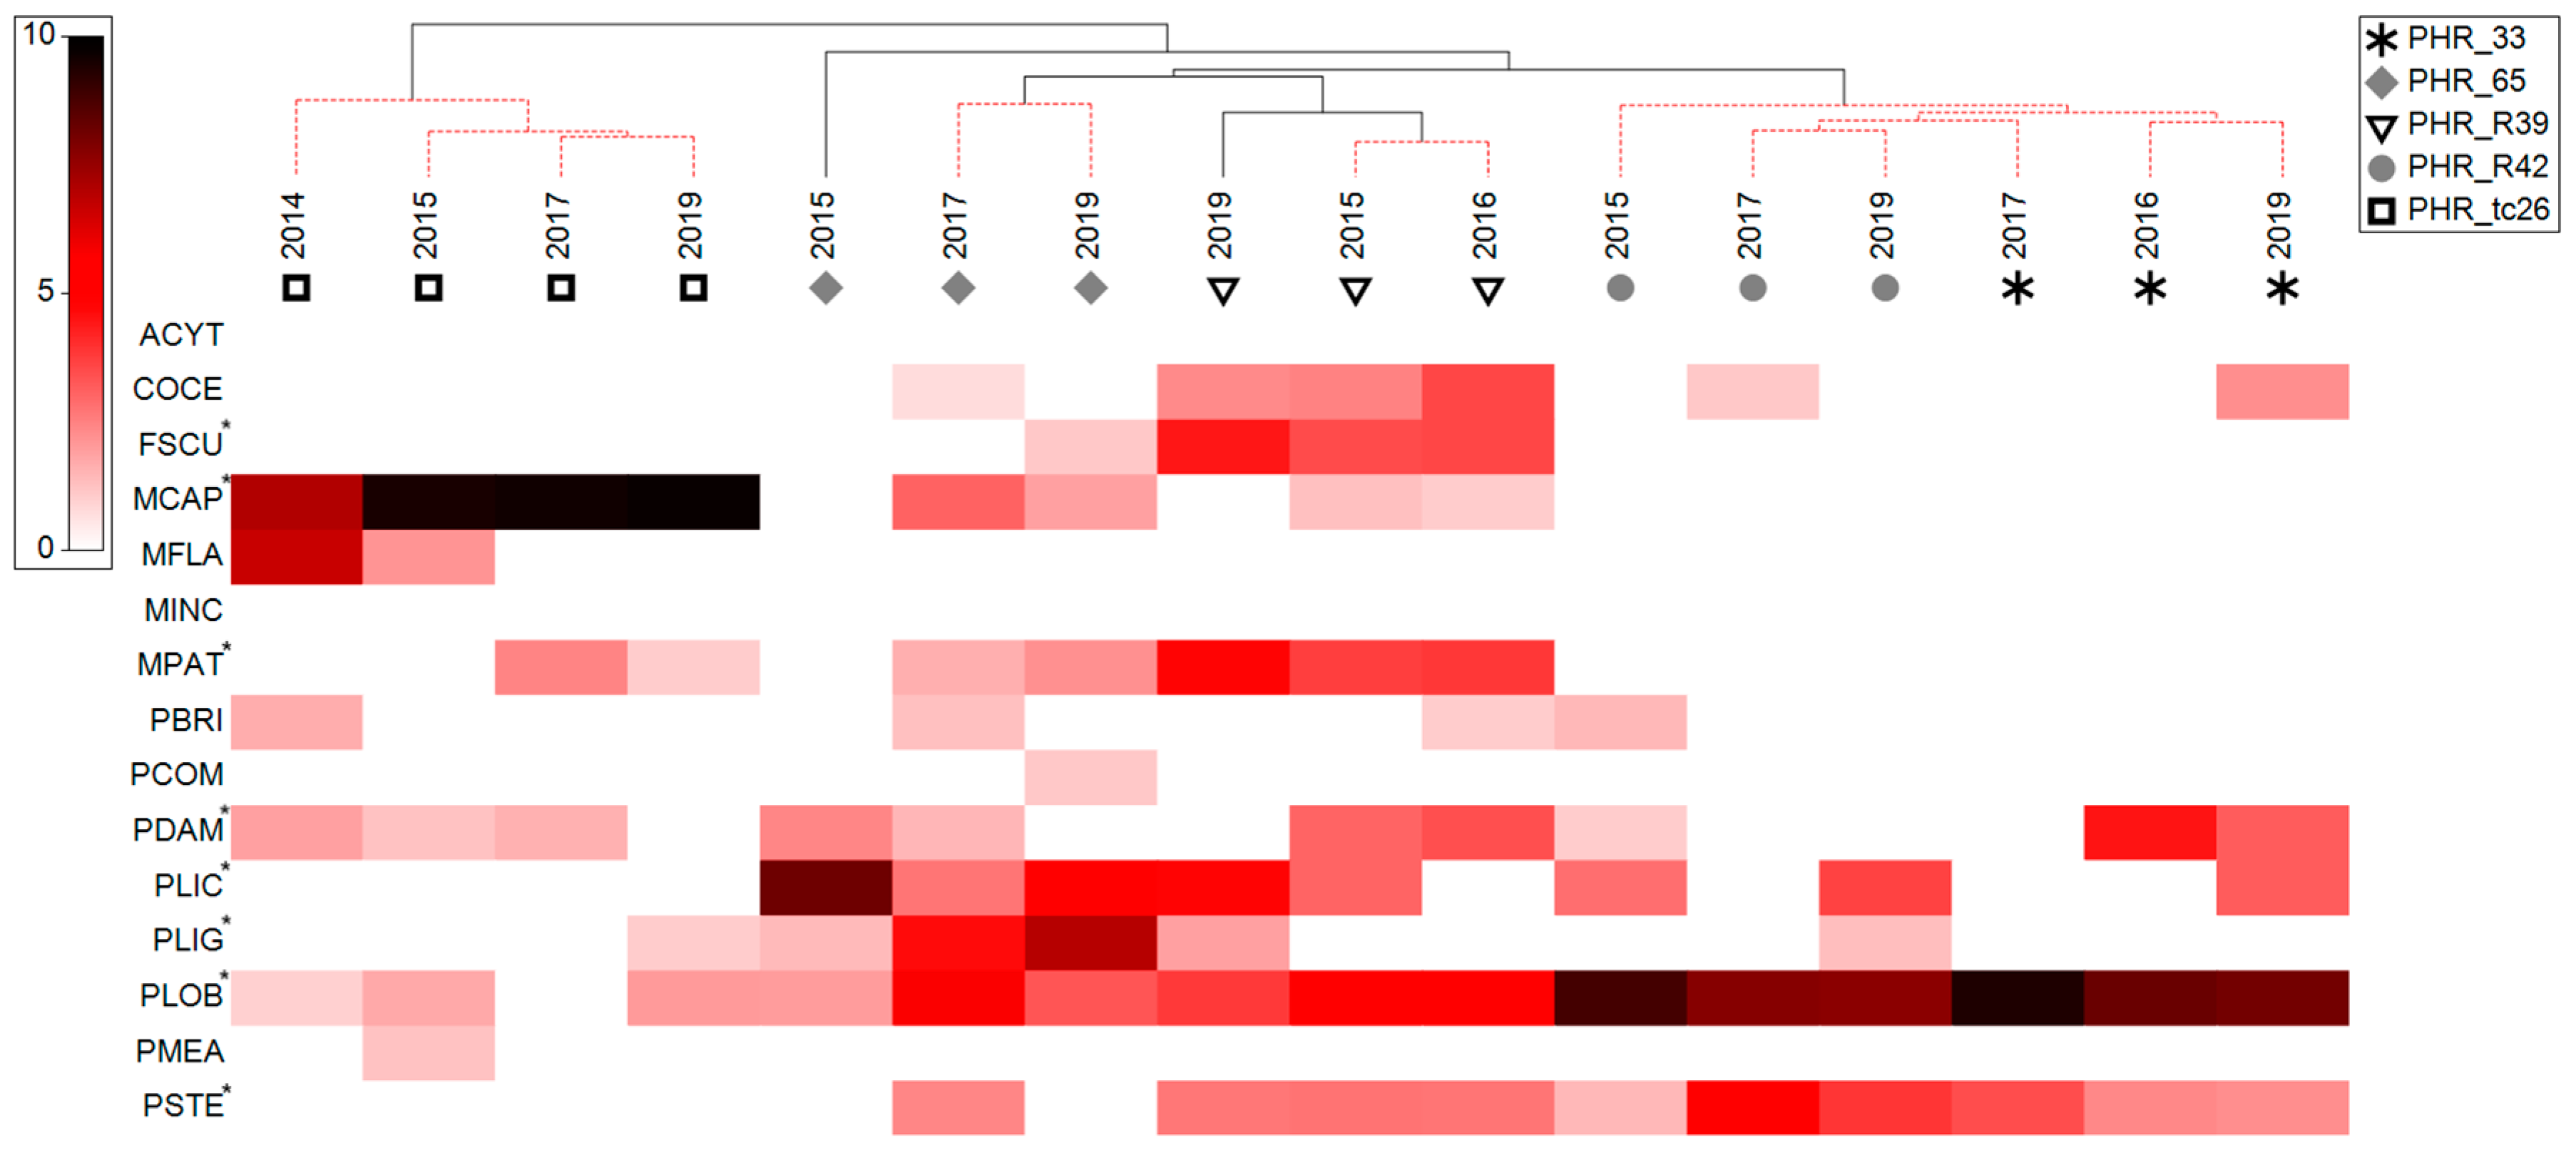
3.1. Coral Assemblage Composition—Percent Colony Count

There were 9948 colonies of scleractinian corals recorded in situ at the 20 fixed monitoring sites between 2014 and 2021. Montipora capitata was the most recorded species with 3072 colonies (30.9%) followed by Porites lobata (1991 colonies, 20.0%), Cyphastrea ocellina (738 colonies, 7.4%), Porites lichen (728 colonies, 7.3%), Porites compressa (717 colonies, 7.2%), Montipora patula (604 colonies, 6.1%), the Montipora dilatata/flabellata/turgescens complex (410 colonies, 4.1%) and Acropora cytherea (354 colonies, 3.6%). Coral assemblage compositions based on square-root transformed percent coral colony counts were significantly different among the islands/atolls across the survey years, with PERMANOVA test showing island/atoll-specific changes across years (Table 2, Region:Year interaction term P = 0.0026).
Coral assemblages at Lalo showed nine significantly different groups with four sites (FFS R29, FFS 32, FFS 33 and FFS 34) having stable coral assemblages over time (Figure 2). These four sites had distinct coral assemblages with FFS R29 characterized by C. ocellina, Pocillopora damicornis and P. compressa, FFS 32 by M. capitata and P. lobata, FFS 33 by P. lichen and P. lobata and FFS 34 by P. lobata and Pocillopora meandrina (Figure 2, Table S1a). Temporal changes in coral assemblages were observed at FFS 30 and FFS Rapture Reef. At FFS30, coral assemblages shifted from dominance by A. cytherea and P. lobata in earlier years to A. cytherea and P. lichen in 2021 (Figure 2, Table S1a). At FFS Rapture Reef, coral assemblage was dominated by A. cytherea and P. lobata in 2017, with no statistically significant difference with the assemblage at FFS 30 in 2017, it had no coral in 2019, and it was dominated by P. lobata and P. meandrina in 2021, with no statistically significant difference with the assemblage at FFS 34 (Figure 2, Table S1a).
Coral assemblages at Kapou varied across sites and over time, exhibiting 11 significantly different groups (Figure 3). LIS 10, LIS R10 and LIS 4019 all had coral assemblages dominated by M. patula and M capitata in 2014. At LIS 10, the coral assemblage shifted to one dominated by M. capitata, P. lobata and P. compressa between 2015 and 2017, which did not show a statistically significant difference from the assemblage at LIS R7 in all years, and eventually to one mostly dominated by M. capitata in 2021. LIS R10, on the other hand, shifted to this M. capitata dominance immediately after 2014 (Figure 3, Table S1b). Similarly, LIS 4067 and LIS Court had coral assemblages dominated by the M. dilatata/flabellata/turgescens complex in 2014, which shifted to M. capitata dominance for the remaining years (from 2015 to 2021) at LIS 4067 and in 2015 and 2016 at LIS Court. LIS Court then shifted to a M. capitata dominant assemblage with some C. ocellina from 2017 to 2021 (Figure 3, Table S1b). Two sites (LIS 4008 and LIS 18) had consistent coral assemblages over time, with LIS 4008 mostly supporting high abundances of C. ocellina and P. lobata and LIS 18 supporting high abundances of P. lobata and P. lichen, while the assemblage at LIS 12 shifted from one similar to LIS 18 to one similar to LIS 4008 over time (Figure 3, Table S1b).
Coral assemblages at Manawai showed six significantly different groups, with three of the monitoring sites having stable assemblages over time (Figure 4). PHR 33 and PHR R42 were characterized by high abundances of P. lobata colonies, while PHR tc26 was dominated by M. capitata (Figure 4, Table S1c). Some shifts in assemblages were observed at PHR 65 and PHR R39; PHR 65 was dominated by P. lichen in 2015 and shifted to high abundances of Pocillopora ligulata and P. lobata in 2017 and 2019, while PHR R39 shifted from dominance by P. lobata in 2015 and 2016 to M. patula and P. lichen in 2019 (Figure 4, Table S1c).

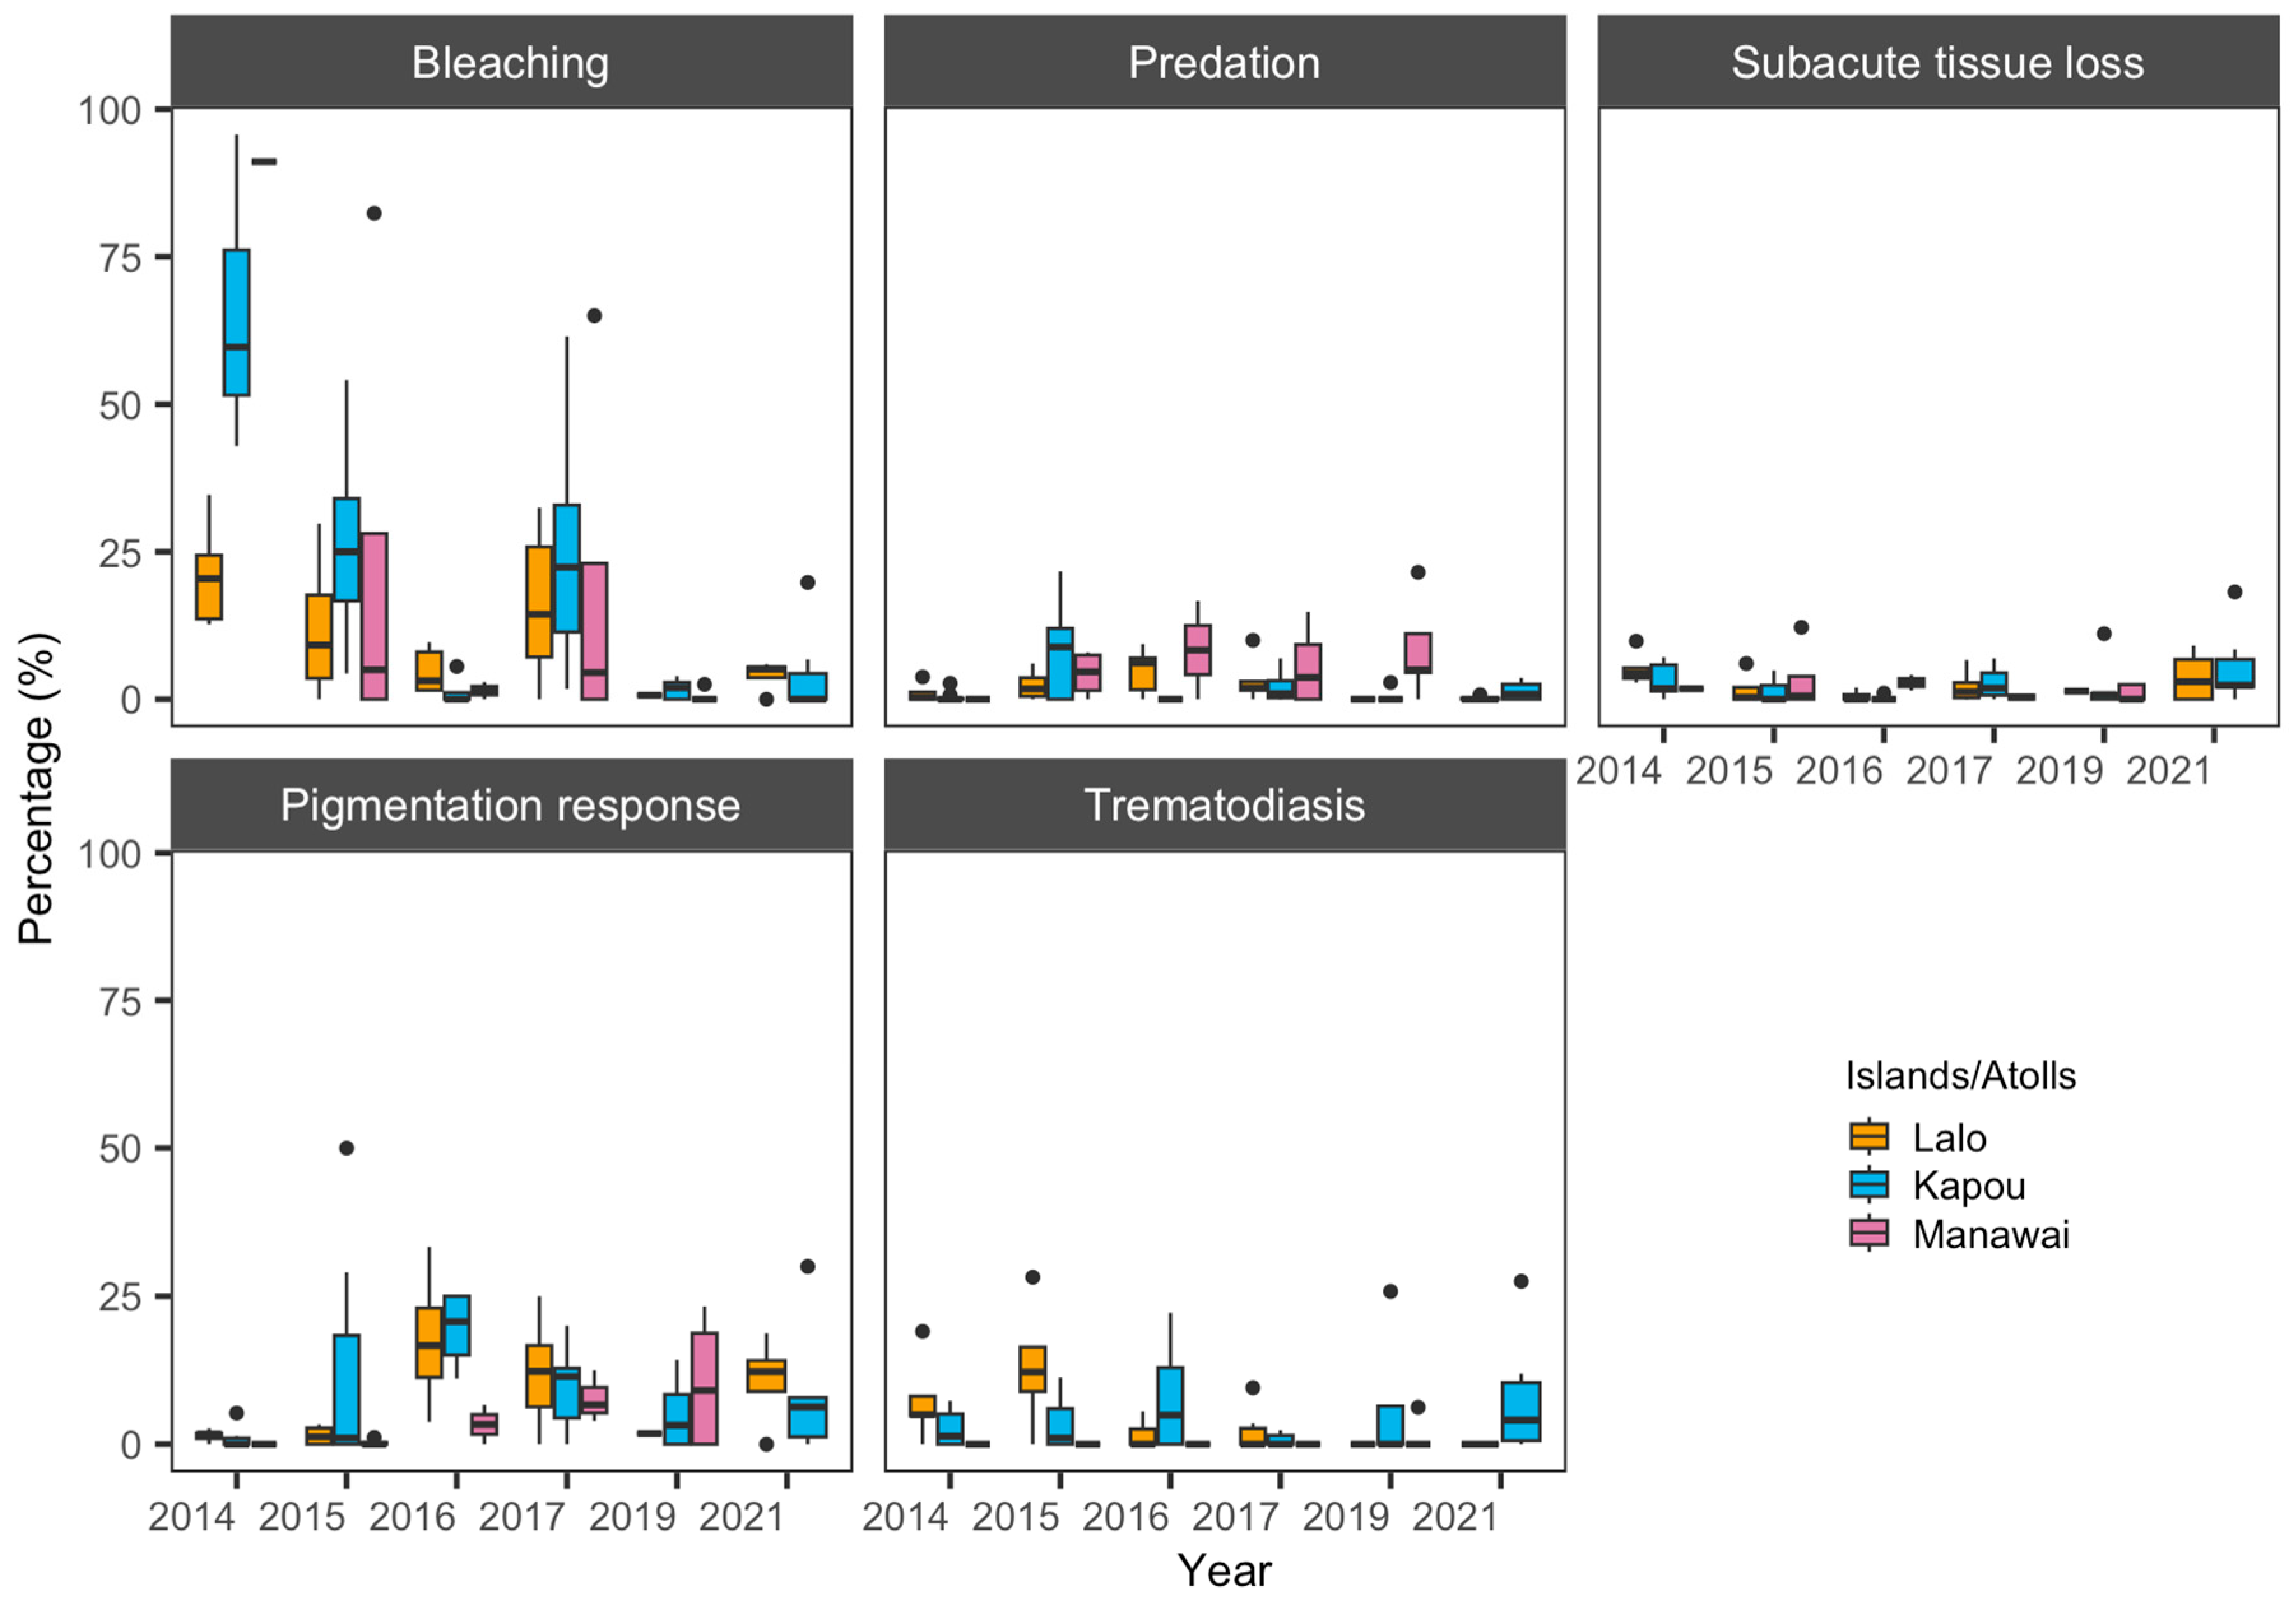
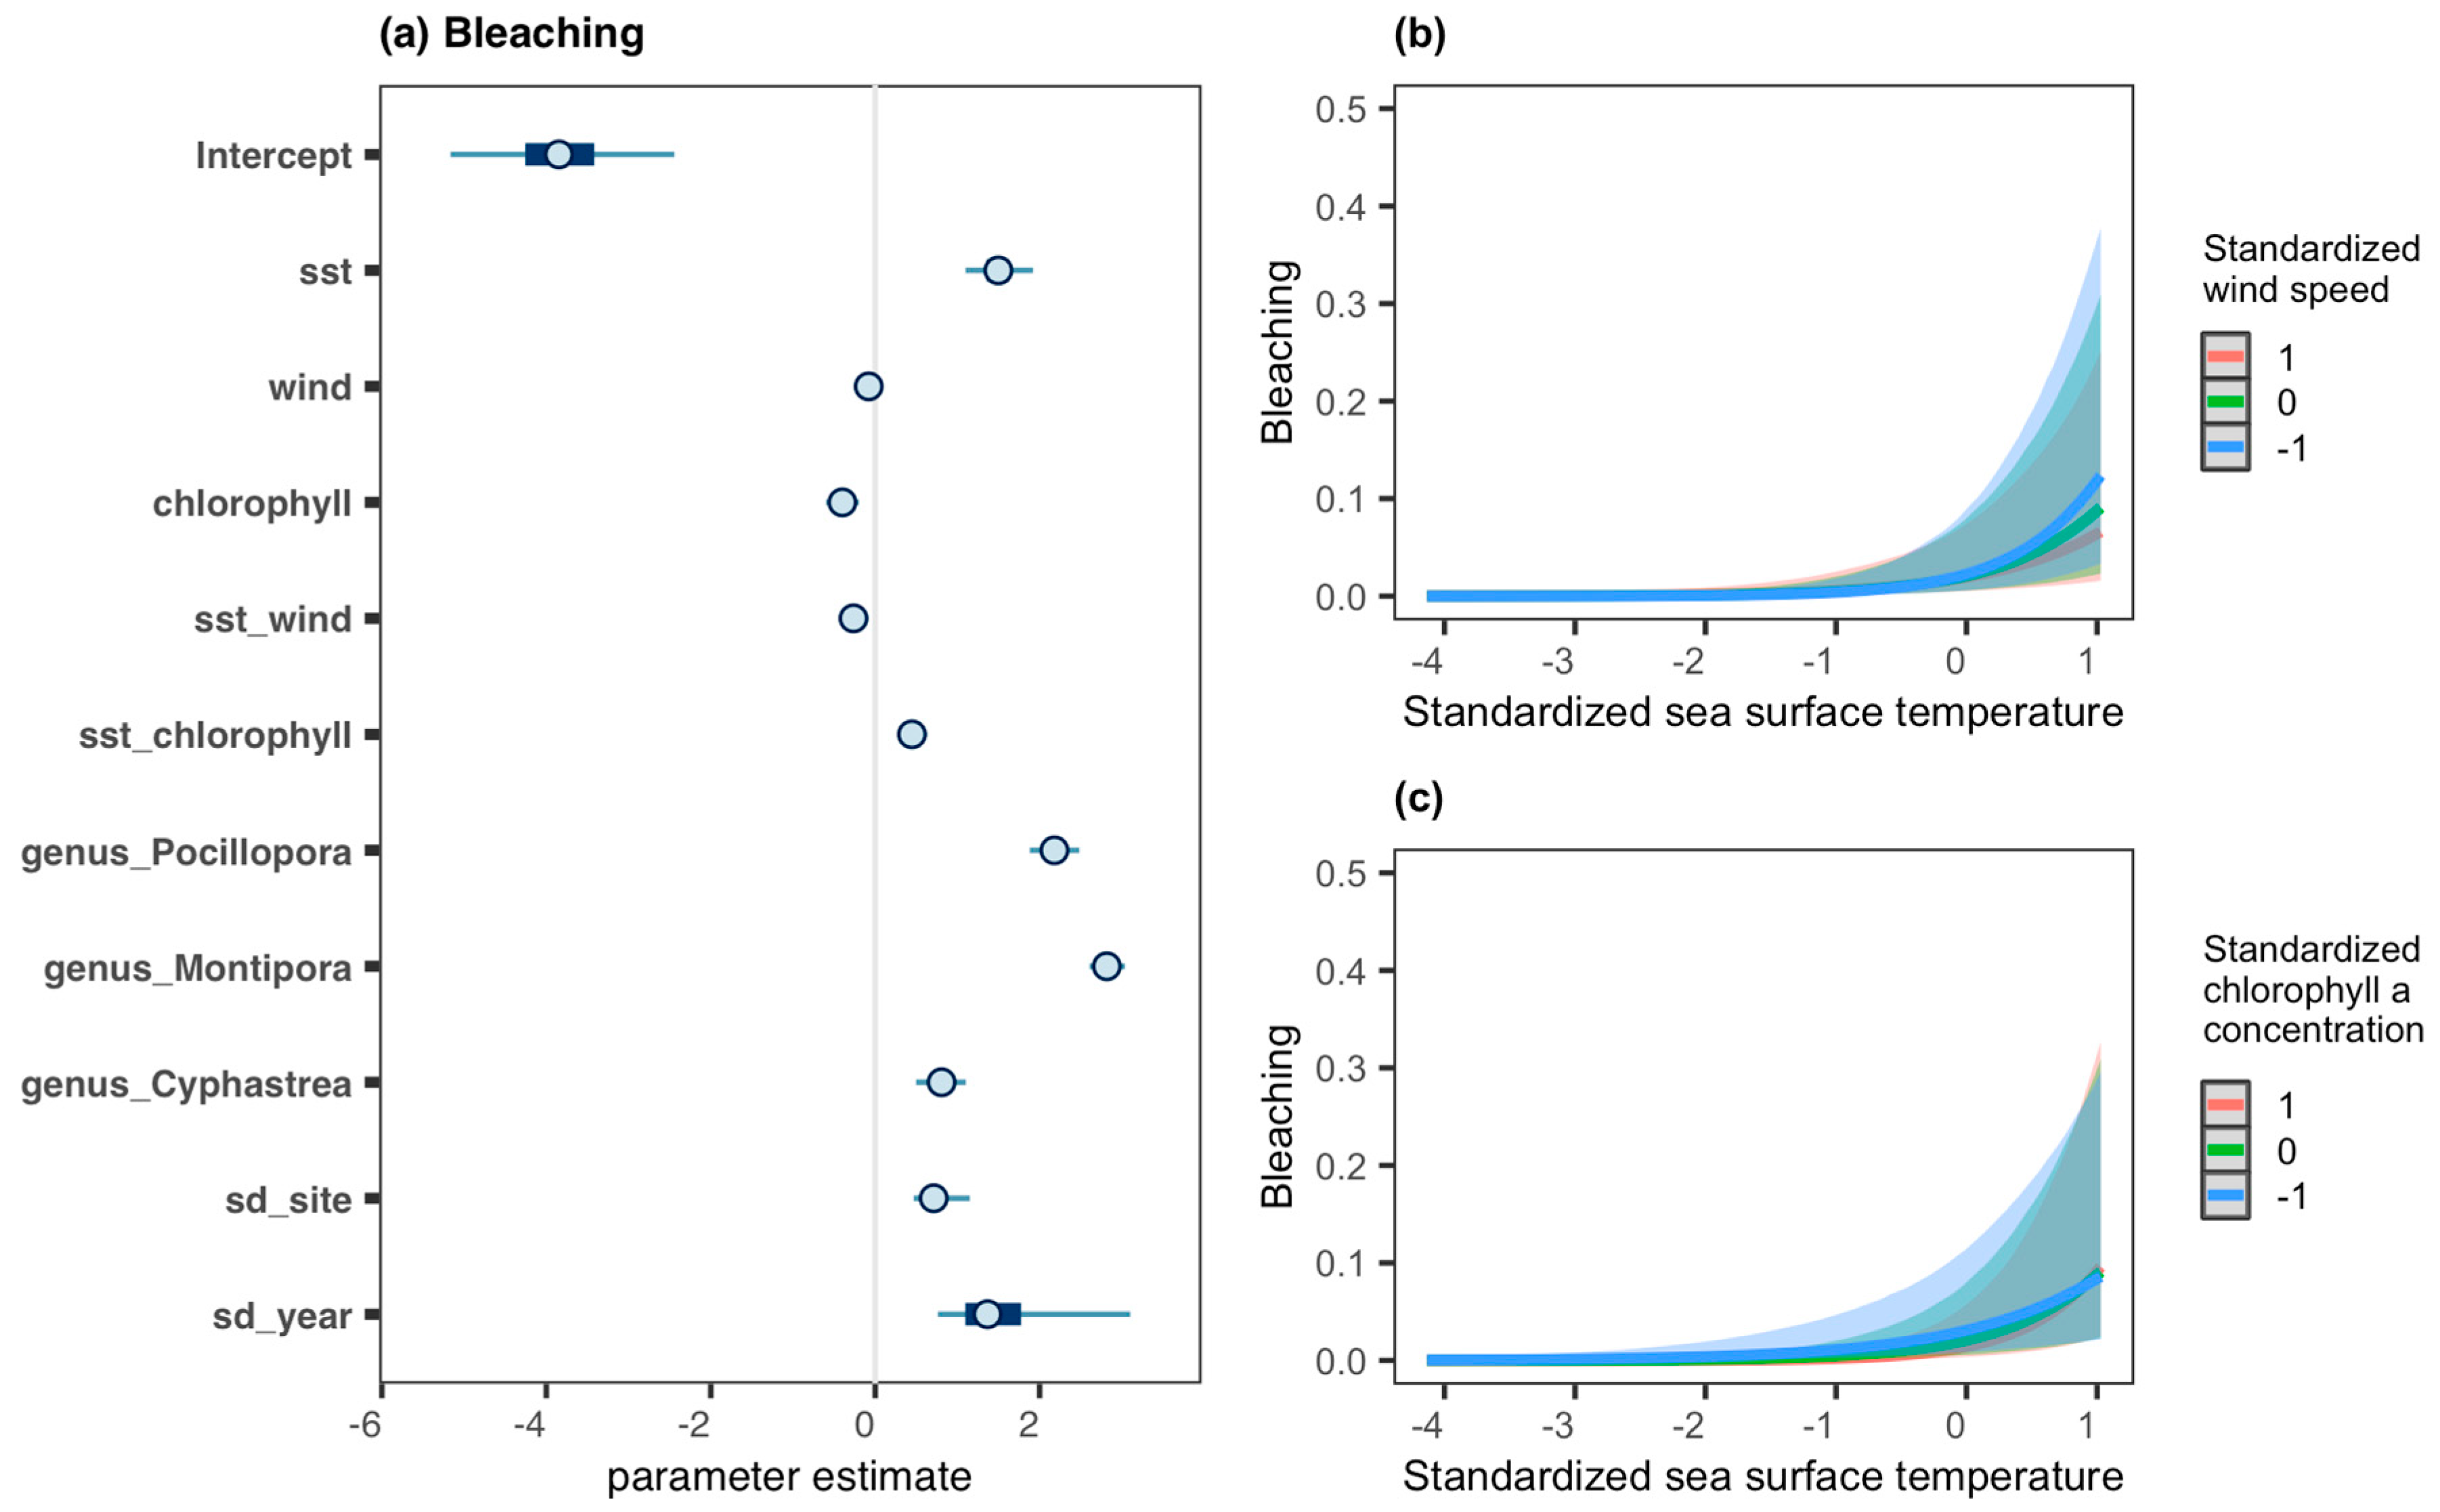
3.2. Coral Health Conditions

Bleaching was the most recorded coral health condition among the four genera, Porites, Montipora, Cyphastrea and Pocillopora (2371 out of 9076 colonies). Predation was recorded on 224 out of 8338 colonies among the three genera excluding Cyphastrea, and nearly 90% of the observations were by fish. Subacute tissue loss was recorded on 231 out of 8338 colonies. Porites pigmentation response and trematodiasis were recorded on 277 and 177 colonies respectively, out of 3711 colonies of Porites. Overall patterns in the presence/absence of the conditions across years and regions (islands/atolls) showed that there was considerable regional and temporal variability in bleaching occurrence in comparison to other conditions (Figure 5). In 2014, higher percentages of coral colonies bleached at Kapou and Manawai than Lalo. Note, however, that only one shallow site (PHR tc26, 2–3 m depths) was surveyed at Manawai in 2014. There were also moderate levels of bleaching in 2015 and 2017, with all three regions exhibiting similar percentages of bleached coral colonies.
Bleaching occurrence was correlated with environmental conditions including the interaction terms between sea surface temperature and surface wind and sea surface temperature and chlorophyll a (Figure 6a). For both interaction terms, there were increases in bleaching, from approximately 26 °C (standardized sea surface temperature ≈ 0) to 27.8 °C (≈+1 standard deviation), which was the upper limit observed in the present study (Figure 6b,c). Within this temperature range, a higher level of bleaching was observed with a lower wind speed (Figure 6b). For chlorophyll a concentration, a higher level of bleaching was also observed with a lower concentration, although this seems to be reversed at the upper limit (standardized sea surface temperature ≈ 1) of the present study (Figure 6c). There were differences in bleaching occurrence among the four genera. Montipora was the most sensitive genus, with the odds of bleaching for Montipora being 16.8 times higher than the odds for Porites, followed by Pocillopora (8.8 times higher) and Cyphastrea (2.2 times higher) (Figure 6a). Despite the observed regional differences in bleaching (Figure 5), there was no strong evidence of regional effects once the environmental covariates were considered. The final model including the site and year random factors, environmental covariates and genus fixed factor explained 41.9% of the variation in the occurrence of bleaching.
There was no strong evidence of environmental or regional effects on predation or the occurrences of subacute issue loss (Figure 7). The odds of predation for Pocillopora colonies were 8.6 time higher than the odds for Porites, while the odds for Montipora colonies were 0.3 times higher (i.e., reduced by 70%) than the odds for Porites (Figure 7a). The final model including the site and year random factors and genus fixed factor explained 11.0% of the variation in predation. Subacute tissue loss was most prevalent on Porites, although the odds for Pocillopora were very similar (0.98), and the odds for Montipora were reduced by 80% compared to the odds for Porites. The odds of subacute tissue loss for colonies with algal overgrowth were 2.9 times higher than the odds for those without algal overgrowth (Figure 7b). The rate of subacute tissue loss was overall relatively low (approximately 2.8% of observed colonies across the three genera), and the final model with the site and year random factors and genus fixed factor as well as the presence/absence of algal overgrowth only accounted for 4.2% of the variation in the occurrence of the condition.
There was no strong evidence of environmental or regional effects on the Porites pigmentation response or trematodiasis (Figure 8). The odds of Porites pigmentation response for colonies with algal overgrowth were 6.5 times higher than the odds for those without algal overgrowth (Figure 8a), while algal overgrowth did not have effects on trematodiasis (Figure 8b). The final model for Porites pigmentation response including the site and year random factors and the presence/absence of algal overgrowth as a fixed factor explained 12.7% of the variation in the occurrence of the condition. Similar to subacute tissue loss, the overall rate of Porites trematodiasis was relatively low (approximately 4.8% of observed Porites colonies), and the final model for trematodiasis accounting for the site and year random factors only explained 5.9% of the variation in the occurrence of the condition.

4. Discussion

This study provides useful ecological insight into temporal and spatial patterns in coral composition and the occurrence of reduced health conditions in Papahānaumokuākea. Coral assemblage composition (quantified by percent colony count) significantly varied among survey years across different regions (islands/atolls; Table 2). Overall, coral assemblages at Lalo were characterized by high abundances of Porites lobata and the presence (and sometimes dominance) of Acropora cytherea, while those at Kapou were mostly characterized by high abundances of montiporids (Table S1). Coral assemblages at Manawai showed a mixture of P. lobata and montiporid dominance (Table S1).
Detailed investigations for each region also revealed distinct coral assemblages across sites within the region, with some sites exhibiting stable coral assemblages. Such a stable pattern contradicts the general concern that coral reefs continue to undergo major changes that can result in degraded ecosystem services [5], and the observed pattern in Papahānaumokuākea can potentially be explained by its extreme remoteness and protected status without local anthropogenic activities. There were also other sites, however, showing significant temporal changes in their coral assemblages, particularly at Kapou (Figure 2, Figure 3 and Figure 4, Table S1). Some of these changes can be attributed to specific disturbance events that have been documented previously. During the global-scale coral bleaching events from 2014 to 2017 [29], varying degrees of coral bleaching were observed throughout Papahānaumokuākea in 2014, with montiporid-dominated coral reefs in Kapou being most severely affected [7,30]. Warming sea surface temperature and resulting coral bleaching being of particular concern for corals is consistent with a previous study in the Western Indian Ocean [17]. Rapture Reef at Lalo (FFS Rapture Reef) was also severely damaged by Hurricane Walaka in 2018 (for details, see Pascoe et al. (2021) [8] for the impact assessments and Fukunaga et al. (2022) [13] for the initial recovery), and the coral assemblage shifted from Acropora cytherea and Porites lobata in 2017 to no coral in 2019 and P. lobata and Pocillopora meandrina in 2021 (Figure 2). Overall, localized and taxa-specific impacts of these disturbance events are consistent with monitoring studies from other parts of the world (e.g., U.S. Virgin Islands [15] and French Polynesia [16]).
Patterns in the occurrence of reduced coral health conditions showed different susceptibility of coral genera to bleaching in Papahānaumokuākea, as well as associations between coral bleaching and environmental factors. While elevated sea surface temperature is a well-known major trigger of coral bleaching, our study indicates that coral reefs in areas with generally lower wind speeds can be more susceptible to bleaching, likely due to reduced capacities of cooling in sea-bottom temperature through wind-driven evaporation [31]. Overall, Montipora showed the highest susceptibility to bleaching among the four genera examined in this study, and this susceptibility of Montipora is consistent with the previous study by Kenyon et al. (2006) [32] that documented bleaching in 2002 on shallow reefs of Kuaihelani (Midway Atoll) and Hōlanikū (Kure Atoll) in Papahānaumokuākea, as well as the previous study by Bahr et al. (2016) [33] using Montipora capitata. As approximately 78% of Montipora in the present study were recorded from Kapou, the temporal changes in coral assemblages at Kapou is likely a direct impact of the bleaching event. For example, the M. dilatata/flabellata/turgescens complex and Montipora patula, to a lesser extent, were compositionally, and sometimes numerically, dominant at some sites in Kapou prior to the bleaching event, but the assemblages shifted to ones dominated by M. capitata after bleaching (Figure 3, Table S1). The same pattern was also observed at one site (PHR tc26) at Manawai (Figure 4) although the shift was not statistically significant. It is important to note that the M. dilatata/flabellata/turgescens complex has not been recorded at any of our permanent monitoring sites in recent years (Figure 2, Figure 3 and Figure 4).
While Montipora showed the highest susceptibility to bleaching (Figure 6a), they also had a lower level of subacute tissue loss than either Porites or Pocillopora (Figure 7b). As mentioned above, 78% of Montipora in the present study were recorded from Kapou where mass coral bleaching occurred in 2014 (i.e., the first year of our study). Subacute tissue loss is partial mortality of a coral colony and unlikely to be recorded during mass coral bleaching events where colonies were recorded as 100% bleached, so that may be a factor affecting the low level of subacute tissue loss. However, M. capitata, which became a dominant component of the coral assemblages at some sites at Kapou after the bleaching event (Figure 3) and one site at Manawai (Figure 4), also has the ability to switch to heterotrophy during bleaching and subsequent recovery and quickly replenish energy reserves [34]. This could indicate the resiliency of M. capitata and explain their speedy recovery and the shifts in the coral assemblage composition after the bleaching event. The ability of coral to switch to heterotrophy may also, at least partially, explain the increased occurrences of bleaching in oligotrophic (i.e., lower chlorophyll a concentrations) waters (Figure 6c) although further investigations are required to understand the interactive effect of sea surface temperature and chlorophyll a concentration on bleaching. Contrary to M. capitata, the disappearance of the M. dilatata/flabellata/turgescens complex shows different levels of sensitivity to bleaching within the same genus and highlights the importance of continuous species-level monitoring efforts in Papahānaumokuākea.
Pocillopora colonies exhibited the highest rate of predation among the four genera in the present study. As most (~90%) of the predation was by fish, this is consistent with previous studies in the main Hawaiian Islands where P. meandrina received the greatest predation pressure among P. meandrina, P. lobata and Porites compressa from corallivorous fishes, potentially due to its high energy content and ease of handling [35,36]. The hierarchy of feeding preferences among corallivorous fishes thus seems to be consistent across the entire Hawaiian archipelago. However, composition of pocilloporids change along the archipelago with the occurrence of P. meandrina declining toward northwest [37]. In our study, for example, P. meandrina was one of the species that characterized a site (FFS 34) at Lalo, while Pocillopora ligulata was abundant at a site (PHR 65) at Manawai (Table S1). Investigations into predation on specific species of Pocillopora may offer further insights into feeding patterns of corallivorous fishes in Papahānaumokuākea.
Porites pigmentation response is considered an immune response in coral tissues due to wounding or competition with epibiotic animals [38]. It has previously been reported to be caused by infections by trematods [39] or competition with epibionts, cyanobacteria, algae, crustose coralline algae and predation [40,41,42]. Note that our survey design and training on coral conditions/diseases required surveyors to separate pink pigmentation responses by trematode infection (i.e., trematodiasis) from Porites pigmentation response, so we analyzed our data separately. Our analysis confirmed that the presence of algal overgrowth was a strong factor affecting Porites pigmentation response in Papahānaumokuākea, with the odds of the condition for colonies with algal overgrowth being 6.5 times higher than the odds for those without algal overgrowth (Figure 8a), while this was not the case for trematodiasis.
The occurrences of subacute tissue loss and Porites trematodiasis were overall low in Papahānaumokuākea (2.8% for subacute tissue loss and 4.8% for Porites trematodiasis), and the explanatory variables investigated in the present study explained very little variation in the data. As warm temperature anomalies have been linked to outbreaks of coral diseases potentially due to impaired immunity of corals [43,44], and the three islands/atolls investigated in the present study have different sea surface temperature due to their latitudes [45], it was somewhat surprising not to detect effects of the sea surface temperature covariate or region on the occurrence of these conditions. Although direct comparisons are difficult due to differences in the survey design, in a previous study by Aeby et al. (2011) [46], the average percentage of Porites colonies with trematodiasis per survey site was 1.1% in the main Hawaiian Islands and 10.7% in Papahānaumokuākea, while tissue loss was recorded, on average, on <1% of Porites colonies per survey site and none of Pocillopora colonies. In that study, host abundance as measured by coral cover was an important factor affecting the occurrences of both conditions, although, being consistent with our study, the overall unexplained variability in their statistical models was relatively high after considering various environmental factors. These findings highlight the complex nature of the coral health conditions and the importance of considering both biotic and abiotic factors such as the host density and the mechanisms that affect transmission and distribution of parasites/pathogens in future studies.
The present study examined the coral composition and occurrence of reduced health conditions in Papahānaumokuākea through repeated surveys of the same sites in three different islands/atolls over time. This repeated survey design treats each survey site as a sampling unit, and accordingly, our data analyses focused on elucidating the overall patterns of coral compositions and health conditions at the islands/atoll level, as well as for Papahānaumokuākea. Site-level assessments of coral composition utilizing hierarchical clustering and SIMPROF ensuing from the results of PERMANOVA statistical analysis were exploratory but helpful to find potential contributors to the changes detected in the statistical analysis. Coral reefs can sustain localized impacts from various disturbance events, and although site-level assessments can offer insights into the responses and recovery of a reef to such an event, assessing the overall state of coral reefs at a larger spatial scale will provide us with information about overall temporal patterns of the survey domain (i.e., population of interest). Such information can contribute to capturing overall temporal trends of coral reef ecosystems at a regional or global scale, thus is critical to coral-reef ecologists and managers when considering the future of the ecosystems under global climate change.

5. Conclusions

Coral assemblages in Papahānaumokuākea have been relatively stable for the past decade, but the localized effects of Hurricane Walaka and the effects of the global-scale coral bleaching on montiporid-dominated reefs were detected in our in-situ monitoring data. After accounting for site variability, there was no effect of the islands/atolls (i.e., Region effects) on coral health conditions while different sensitivities of coral genera were detected for multiple conditions. This highlights the importance of coral reef monitoring covering a broad range of coral assemblage compositions and habitat types in Papahānaumokuākea. The differential responses of Montipora corals after the bleaching also highlights the importance of species-level monitoring efforts; if the monitoring was carried out at the genus level, we would have detected re-colonization and recovery of Montipora, not a shift in assemblages from the M. dilatata/flabellata/turgescens complex to M. capitata. While the present study was limited to analyses based on percent colony composition for the coral assemblage data due to the changes in the survey methods in early years, our long-term monitoring is an ongoing project that now consistently utilize the method that was solidified in 2017, with an added component of photogrammetric techniques for 3D reconstruction of each monitoring site at the time of the survey. The present study also focused on the occurrence (presence/absence) of reduced coral health conditions, but the severity of these conditions has also been consistently recorded since 2017. These additional components allow for detailed investigations into coral colony density, live coral cover, coral traits, such as morphology and size, structural complexity of the survey sites and the severity of coral health conditions both individually and collectively (i.e., co-occurrence and severity of multiple health conditions), greatly increasing the capacity to track and inform the management of the state of coral reefs in Papahānaumokuākea. This study highlights the value of detailed long-term ecological monitoring for spatiotemporally tracking changes and identifying drivers of coral health and assemblage composition in valuable coral reef ecosystems.

Supplementary Materials

The following supporting information can be downloaded at: https://www.mdpi.com/article/10.3390/jmse12081267/s1, Table S1: Results of SIMPER for the grouping structure of coral assemblages at Lalo, Kapou and Manawai based on hierarchical clustering and Type 1 SIMPEROF test.

Author Contributions

Conceptualization, A.F. and J.H.R.B.; methodology, A.F. and J.H.R.B.; formal analysis, A.F.; investigation, A.F., K.H.P. and J.H.R.B.; resources, R.K.K. and J.H.R.B.; data curation, A.F., K.H.P. and J.H.R.B.; writing—original draft preparation, A.F.; writing—review and editing, A.F., K.H.P., R.K.K. and J.H.R.B.; visualization, A.F. and K.H.P.; funding acquisition, R.K.K. and J.H.R.B. All authors have read and agreed to the published version of the manuscript.

Funding

This study was funded by NOAA’s Office of National Marine Sanctuaries through Papahānaumokuākea Marine National Monument, by the National Science Foundation Award No. 2149133, RII Track-1: Change Hawai‘i: Harnessing the Data Revolution for Island Resilience granted to J.H.R. Burns and by the National Fish and Wildlife Foundation under Award #NFWF-UHH-059023 granted to J.H.R. Burns.

Institutional Review Board Statement

Not applicable.

Informed Consent Statement

Not applicable.

Data Availability Statement

The raw data supporting the conclusions of this article will be available upon request to the corresponding author or NOAA Papahānaumokuākea Marine National Monument.

Acknowledgments

We thank officers and crew of the NOAA ships Hi‘ialakai and Rainier and NOAA Papahānaumokuākea Marine National Monument for their support and field assistance. We also thank C. Couch, T.N. Cunanan, K. Steward, K. Bahr, M. Sudek, B. Craig and A. Wills for their assistance in the field surveys, and the two anonymous reviewers who improved the manuscript through their input.

Conflicts of Interest

The authors declare no conflicts of interest. The scientific results and conclusions, as well as any views or opinions expressed herein, are those of the authors and do not necessarily reflect the views of NOAA or the Department of Commerce.

References

  1. Jones, C.G.; Lawton, J.H.; Shachak, M. Organisms as ecosystem engineers. Oikos 1994, 69, 373–386. [Google Scholar] [CrossRef]
  2. Hoegh-Guldberg, O.; Mumby, P.J.; Hooten, A.J.; Steneck, R.S.; Greenfield, P.; Gomez, E.; Harvell, C.D.; Sale, P.F.; Edwards, A.J.; Caldeira, K.; et al. Coral reefs under rapid climate change and ocean acidification. Science 2007, 318, 1737–1742. [Google Scholar] [CrossRef] [PubMed]
  3. Quataert, E.; Storlazzi, C.; van Rooijen, A.; Cheriton, O.; van Dongeren, A. The influence of coral reefs and climate change on wave-driven flooding of tropical coastlines. Geophys. Res. Lett. 2015, 42, 6407–6415. [Google Scholar] [CrossRef]
  4. Perry, C.T.; Edinger, E.N.; Kench, P.S.; Murphy, G.N.; Smithers, S.G.; Steneck, R.S.; Mumby, P.J. Estimating rates of biologically driven coral reef framework production and erosion: A new census-based carbonate budget methodology and applications to the reefs of Bonaire. Coral Reefs 2012, 31, 853–868. [Google Scholar] [CrossRef]
  5. Hoegh-Guldberg, O.; Pendleton, L.; Kaup, A. People and the changing nature of coral reefs. Reg. Stud. Mar. Sci. 2019, 30, 100699. [Google Scholar] [CrossRef]
  6. Moritz, C.; Brandl, S.J.; Rouzé, H.; Vii, J.; Pérez-Rosales, G.; Bosserelle, P.; Chancerelle, Y.; Galzin, R.; Liao, V.; Siu, G.; et al. Long-term monitoring of benthic communities reveals spatial determinants of disturbance and recovery dynamics on coral reefs. Mar. Ecol. Prog. Ser. 2021, 672, 141–152. [Google Scholar] [CrossRef]
  7. Couch, C.S.; Burns, J.H.R.; Liu, G.; Steward, K.; Gutlay, T.N.; Kenyon, J.; Eakin, C.M.; Kosaki, R.K. Mass coral bleaching due to unprecedented marine heatwave in Papahānaumokuākea Marine National Monument (Northwestern Hawaiian Islands). PLoS ONE 2017, 12, e0185121. [Google Scholar] [CrossRef]
  8. Pascoe, K.H.; Fukunaga, A.; Kosaki, R.K.; Burns, J.H.R. 3D assessment of a coral reef at Lalo Atoll reveals varying responses of habitat metrics following a catastrophic hurricane. Sci. Rep. 2021, 11, 12050. [Google Scholar] [CrossRef] [PubMed]
  9. Bruno, J.F.; Petes, L.E.; Harvell, C.D.; Hettinger, A. Nutrient enrichment can increase the severity of coral diseases. Ecol. Lett. 2003, 6, 1056–1061. [Google Scholar] [CrossRef]
  10. Walton, C.J.; Hayes, N.K.; Gilliam, D.S. Impacts of a regional, multi-year, multi-species coral disease outbreak in southeast Florida. Front. Mar. Sci. 2018, 5, 323. [Google Scholar] [CrossRef]
  11. Burke, S.; Pottier, P.; Lagisz, M.; Macartney, E.L.; Ainsworth, T.; Drobniak, S.M.; Nakagawa, S. The impact of rising temperatures on the prevalence of coral diseases and its predictability: A global meta-analysis. Ecol. Lett. 2023, 26, 1466–1481. [Google Scholar] [CrossRef] [PubMed]
  12. Alvarez-Filip, L.; Estrada-Saldívar, N.; Pérez-Cervantes, E.; Molina-Hernández, A.; González-Barrios, F.J. A rapid spread of the stony coral tissue loss disease outbreak in the Mexican Caribbean. PeerJ 2019, 7, e8069. [Google Scholar] [CrossRef] [PubMed]
  13. Fukunaga, A.; Pascoe, K.H.; Pugh, A.R.; Kosaki, R.K.; Burns, J.H.R. Underwater photogrammetry captures the initial recovery of a coral reef at Lalo Atoll. Diversity 2022, 14, 39. [Google Scholar] [CrossRef]
  14. Sherwood, A.R.; Huisman, J.M.; Paiano, M.O.; Williams, T.M.; Kosaki, R.K.; Smith, C.M.; Giuseffi, L.; Spalding, H.L. Taxonomic determination of the cryptogenic red alga, Chondria tumulosa sp. nov., (Rhodomelaceae, Rhodophyta) from Papahānaumokuākea Marine National Monument, Hawai‘i, USA: A new species displaying invasive characteristics. PLoS ONE 2022, 15, e0234358. [Google Scholar] [CrossRef] [PubMed]
  15. Bythell, J.C.; Bythell, M.; Gladfelter, E.H. Initial results of a long-term coral reef monitoring program: Impact of Hurricane Hugo at Buck Island Reef National Monument, St. Croix, US. Virgin Islands. J. Exp. Mar. Biol. Ecol. 1993, 172, 171–183. [Google Scholar] [CrossRef]
  16. Adjeroud, M.; Chancerelle, Y.; Schrimm, M.; Perez, T.; Lecchini, D.; Galzin, R.; Salvat, B. Detecting the effects of natural disturbances on coral assemblages in French Polynesia: A decade survey at multiple scales. Aquat. Living Resour. 2005, 18, 111–123. [Google Scholar] [CrossRef]
  17. Obura, D.; Gudka, M.; Samoilys, M.; Osuka, K.; Mbugua, J.; Keith, D.A.; Porter, S.; Roche, R.; van Hooidonk, R.; Ahamada, S.; et al. Vulnerability to collapse of coral reef ecosystems in the Western Indian Ocean. Nat. Sustain. 2022, 5, 104–113. [Google Scholar] [CrossRef]
  18. Anderson, M.J. A new method for non-parametric multivariate analysis of variance. Austral Ecol. 2001, 26, 32–46. [Google Scholar]
  19. McArdle, B.H.; Anderson, M.J. Fitting multivariate models to community data: A comment on distance-based redundancy analysis. Ecology 2001, 82, 290–297. [Google Scholar] [CrossRef]
  20. Clarke, K.R.; Somerfield, P.J.; Gorley, R.N. Testing of null hypotheses in exploratory community analyses: Similarity profiles and biota-environment linkage. J. Exp. Mar. Biol. Ecol. 2008, 366, 56–69. [Google Scholar] [CrossRef]
  21. Somerfield, P.J.; Clarke, K.R. Inverse analysis in non-parametric multivariate analyses: Distinguishing groups of associated species which covary coherently across samples. J. Exp. Mar. Biol. Ecol. 2013, 449, 261–273. [Google Scholar] [CrossRef]
  22. Clarke, K.R.; Warwick, R.M. Change in Marine Communities: An Approach to Statistical Analysis and Interpretation, 2nd ed.; PRIMER-E: Plymouth, UK, 2001. [Google Scholar]
  23. Bürkner, P.-C. Brms: An R package for Bayesian multilevel models using Stan. J. Stat. Softw. 2017, 80, 1–28. [Google Scholar] [CrossRef]
  24. Bürkner, P.-C. Advanced Bayesian multilevel modeling with the R package brms. R J. 2018, 10, 395–411. [Google Scholar] [CrossRef]
  25. Bürkner, P.-C. Bayesian item response modeling in R with brms and Stan. J. Stat. Softw. 2021, 100, 1–54. [Google Scholar] [CrossRef]
  26. Eddelbuettel, D.; François, R. Rcpp: Seamless R and C++ integration. J. Stat. Softw. 2011, 40, 1–18. [Google Scholar] [CrossRef]
  27. Eddelbuettel, D. Seamless R and C++ Integration with Rcpp; Springer: New York, NY, USA, 2013; p. 220. [Google Scholar]
  28. Eddelbuettel, D.; Balamuta, J.J. Extending R with C++: A brief introduction to Rcpp. Am. Stat. 2018, 72, 28–36. [Google Scholar] [CrossRef]
  29. Eakin, C.M.; Sweatman, H.P.A.; Brainard, R.E. The 2014–2017 global-scale coral bleaching event: Insights and impacts. Coral Reefs 2019, 38, 539–545. [Google Scholar] [CrossRef]
  30. Fukunaga, A.; Burns, J.H.R.; Pascoe, K.H.; Kosaki, R.K. A remote coral reef shows macroalgal succession following a mass bleaching event. Ecol. Indic. 2022, 142, 109175. [Google Scholar] [CrossRef]
  31. Paparella, F.; Xu, C.; Vaughan, G.O.; Burt, J.A. Coral Bleaching in the Persian/Arabian Gulf is modulated by summer winds. Front. Mar. Sci. 2019, 6, 205. [Google Scholar] [CrossRef]
  32. Kenyon, J.C.; Aeby, G.S.; Brainard, R.E.; Chojnacki, J.D.; Dunlap, M.J.; Wilkinson, C.B. Mass coral bleaching on high-latitude reef in the Hawaiian Archipelago. In Proceedings of the 10th International Coral Reef Symposium, Okinawa, Japan, 28 June–3 July 2006; Japanese Coral Reef Society: Okinawa, Japan, 2006; pp. 631–643. [Google Scholar]
  33. Bahr, K.D.; Jokiel, P.L.; Rodgers, K.S. Relative sensitivity of five Hawaiian coral species to high temperature under high-pCO2 conditions. Coral Reefs 2016, 35, 729–738. [Google Scholar] [CrossRef]
  34. Grottoli, A.G.; Rodrigues, L.J.; Palardy, J.E. Heterotrophic plasticity and resilience in bleached corals. Nature 2006, 440, 1186–1189. [Google Scholar] [CrossRef] [PubMed]
  35. Tricas, T.C. Prey selection by coral-feeding butterflyfishes: Strategies to maximize the profit. Environ. Biol. Fish. 1989, 25, 171–185. [Google Scholar] [CrossRef]
  36. Jayewardene, D.; Donahue, M.J.; Birkeland, C. Effects of frequent fish predation on corals in Hawaii. Coral Reefs 2009, 28, 499–506. [Google Scholar] [CrossRef]
  37. Maragos, J.E.; Potts, D.C.; Aeby, G.S.; Gulko, D.; Kenyon, J.; Siciliano, D.; VanRavenswaay, D. 2000–2002 Rapid Ecological Assessment of corals (Anthozoa) on shallow reefs of the Northwestern Hawaiian Islands. Part 1: Species and distribution. Pac. Sci. 2004, 58, 211–230. [Google Scholar] [CrossRef]
  38. D’Angelo, C.; Smith, E.G.; Oswald, F.; Burt, J.; Tchernov, D.; Wiedenmann, J. Locally accelerated growth is part of the innate immune response and repair mechanisms in reef-building corals as detected by green fluorescent protein (GFP)-like pigments. Coral Reefs 2012, 31, 1045–1056. [Google Scholar] [CrossRef]
  39. Palmer, C.V.; Roth, M.S.; Gates, R.D. Red fluorescent protein responsible for pigmentation in trematode-infected Porites compressa tissues. Biol. Bull. 2009, 216, 68–74. [Google Scholar] [CrossRef]
  40. Kubomura, T.; Wee, H.B.; Reimer, J.D. Investigating incidence and possible causes of pink and purple pigmentation response in hard coral genus Porites around Okinawajima Island, Japan. Reg. Stud. Mar. Sci. 2021, 41, 101569. [Google Scholar] [CrossRef]
  41. Benzoni, F.; Galli, P.; Pichon, M. Pink spots on Porites: Not always a coral disease. Coral Reefs 2010, 29, 153. [Google Scholar] [CrossRef]
  42. Ravindran, J.; Raghukumar, C. Pink line syndrome (PLS) in the scleractinian coral Porites lutea. Coral Reefs 2002, 21, 252. [Google Scholar] [CrossRef]
  43. Bruno, J.F.; Selig, E.R.; Casey, K.S.; Page, C.A.; Willis, B.L.; Harvell, C.D.; Sweatman, H.; Melendy, A.M. Thermal stress and coral cover as drivers of coral disease outbreaks. PLoS Biol. 2007, 5, e124. [Google Scholar] [CrossRef]
  44. Kuta, K.; Richardson, L. Ecological aspects of black band disease of corals: Relationships between disease incidence and environmental factors. Coral Reefs 2002, 21, 393–398. [Google Scholar] [CrossRef]
  45. Rooney, J.J.; Wessel, P.; Hoeke, R.; Weiss, J.; Baker, J.; Parrish, F.; Fletcher, C.H.; Chojnacki, J.; Garcia, M.; Brainard, R.; et al. Geology and geomorphology of coral reefs in the Northwestern Hawaiian Islands. In Coral Reefs of the USA; Riegl, B.M., Dodge, R.E., Eds.; Springer: Dordrecht, The Netherlands, 2008; pp. 519–571. [Google Scholar]
  46. Aeby, G.S.; Williams, G.J.; Franklin, E.C.; Kenyon, J.; Cox, E.F.; Coles, S.; Work, T.M. Patterns of coral disease across the Hawaiian Archipelago: Relating disease to environment. PLoS ONE 2011, 6, e20370. [Google Scholar] [CrossRef] [PubMed]
Figure 1. Map of the Hawaiian Archipelago (bottom right) and the locations of Manawai, Lalo, Kapou, and aerial imagery of Manawai (top left), Lalo (top right) and Kapou (bottom left) showing the 20 permanent monitoring sites.
Jmse 12 01267 g001
Figure 2. Hierarchical clustering with Type 1 SIMPROF test identifying the grouping structure of coral assemblages at Lalo. Dotted red branches show internally homogeneous structures. Square-root transformed percent coral colony compositions (red gradient ranging from 0 to 10) are shown for all coral species that were identified to characterize the grouping structure using SIMPER analyses, including those for Kapou and Manawai. Those specific to Lalo are mark by “*”. Species abbreviations are ACYT—Acropora cytherea, COCE—Cyphastrea ocellina, FSCU—Lobactis scutaria, MCAP—Montipora capitata, MFLA—Montipora dilatata/flabellata/turgescens complex, MINC—Montipora incrassate, MPAT—Montipora patula, PBRI—Porites brighami, PCOM—Porites compressa, PDAM—Pocillopora damicornis, PLIC—Porites lichen, PLIG—Pocillopora ligulata, PLOB—Porites lobata, PMEA—Pocillopora meandrina and PSTE—Psammocora stellata.
Jmse 12 01267 g002
Figure 3. Hierarchical clustering with Type 1 SIMPROF test identifying the grouping structure of coral assemblages at Kapou. Dotted red branches show internally homogeneous structures. Square-root transformed percent coral colony compositions are shown for all coral species that were identified to characterize the grouping structure using SIMPER analyses, including those for Lalo and Manawai. Ones specific to Kapou are mark by “*”. See Figure 2 for species abbreviations.
Jmse 12 01267 g003
Figure 4. Hierarchical clustering with Type 1 SIMPROF test identifying the grouping structure of coral assemblages at Manawai. Dotted red branches show internally homogeneous structures. Square-root transformed percent coral colony compositions are shown for all coral species that were identified to characterize the grouping structure using SIMPER analyses, including those for Lalo and Kapou. Ones specific to Manawai are mark by “*”. See Figure 2 for species abbreviations.
Jmse 12 01267 g004
Figure 5. Plots showing the percentage of coral colonies exhibiting bleaching, predation, subacute tissue loss, Porites pigmentation response or trematodiasis at each region (island/atoll) each year. The percentage values were calculated for each site within each region. Note that the sites that were surveyed each year varied (see Table 1). In Manawai, there was only one site (PHR tc26) surveyed in 2014, and no surveys were done in 2021.
Jmse 12 01267 g005
Figure 6. Interval plot (a) showing the estimated coefficients for the final bleaching occurrence model selected based on LOO-CV and conditional effect plots for (b) the interaction between standardized sea surface temperature and standardized wind speed and (c) the interaction between standardized sea surface temperature and standardized chlorophyll a concentration. The interval plot shows the median estimates (circles) and 50 and 95 percentiles (thick and thin lines) of the coefficients including standardized sea surface temperature (sst), standardized surface wind speed (wind), standardized chlorophyll a concentration (chlorophyll), their interactions and the fixed factor of genus. For the fixed factor of genus, Porites was treated as the reference factor level. The standardized sea surface temperature of 0 corresponds to 26.42 °C with 1 unit of change corresponding to a difference in 1.41 °C (see Methods).
Jmse 12 01267 g006
Figure 7. Interval plot showing the estimated coefficients for the final models based on LOO-CV for (a) predation and (b) subacute tissue loss. For the fixed effects of genus, Porites was treated as the reference factor level.
Jmse 12 01267 g007
Figure 8. Interval plot showing the estimated coefficients for the final models based on LOO-CV for (a) Porites pigmentation response and (b) trematodiasis.
Jmse 12 01267 g008
Table 1. List of permanent monitoring sites in the present study. The first three letters of each site denote the site’s location: FFS—Lalo, LIS—Kapou and PHR—Manawai. Sites are marked by “x” if a benthic survey was completed in a given year. Surveyors could not locate pins guiding transect lines at the sites marked with “?” in recent years and relied on the site coordinates and compass heading to complete surveys in those years.
SiteDepths (m)Pins201420152016201720192021
FFS 306–8 xxxx x
FFS 326–8 xxxx
FFS 339–10 xxxx x
FFS 349–10 xxxx x
FFS R2910–11 x xxx
FFS Rapture Reef23–26 xxx
LIS 108–9 xxxx x
LIS 127–10 xxx x
LIS 187–9 xx xxx
LIS 40087–8?xx xx
LIS 401914–17?xxxx
LIS 40671–5 xxxxxx
LIS Court4–7 xxxxxx
LIS R710–11 x x x
LIS R1012–14 xx x x
PHR 3312 xxx
PHR 6513–21? x xx
PHR R3911–14 xx x
PHR R4214–15 x xx
PHR tc262–3 xx xx
Table 2. Results of PERMANOVA on the bases of the Bray–Curtis dissimilarity on square-root transformed percent colony composition data.
SourcedfSSMSPseudo-FP
Region226,97513,4872.900.0050
Year5847016943.050.0002
Site (Region)1797,132571410.290.0002
Region:Year9960510671.920.0026
Disclaimer/Publisher’s Note: The statements, opinions and data contained in all publications are solely those of the individual author(s) and contributor(s) and not of MDPI and/or the editor(s). MDPI and/or the editor(s) disclaim responsibility for any injury to people or property resulting from any ideas, methods, instructions or products referred to in the content.

