Article

Ontogenetic Variation in the Trophic and Mercury Levels of Japanese Anchovy in the High Seas of the Northwestern Pacific Ocean

1
College of Marine Living Resource Sciences and Management, Shanghai Ocean University, Shanghai 201306, China
2
Key Laboratory of Sustainable Exploitation of Oceanic Fisheries Resources, Ministry of Education, Shanghai Ocean University, Shanghai 201306, China
3
National Engineering Research Center for Oceanic Fisheries, Shanghai Ocean University, Shanghai 201306, China
4
Key Laboratory of Ocean Fisheries Exploitation, Ministry of Agriculture and Rural Affairs, Shanghai 201306, China
*
Author to whom correspondence should be addressed.
J. Mar. Sci. Eng. 2024, 12(8), 1274; https://doi.org/10.3390/jmse12081274
Submission received: 18 June 2024 / Revised: 17 July 2024 / Accepted: 24 July 2024 / Published: 29 July 2024
(This article belongs to the Section Marine Biology)

Abstract

:
The aim of this study was to explore the connection between growth and feeding ecology and mercury (Hg) levels in Japanese anchovy (Engraulis japonicus). We measured the amounts of Hg and stable carbon and nitrogen isotopes in the muscle of 143 Japanese anchovy specimens obtained from the open seas of the Northwest Pacific Ocean (39°2′ N~42°30′ N, 154°02′ E~161°29′ E) between June and July 2021. The results showed that there were significant differences (p < 0.05) in the δ13C and δ15N values of Japanese anchovies across all body length groups. As individuals grew, δ13C tended to decrease first and then increase, and δ15N tended to gradually increase. The standard ellipse corrected area showed an increasing and subsequently decreasing pattern with growth. It reached its greatest value (0.80) in the 111–120 mm group. Compared to the body length group of 91–120 mm, the niche overlap decreased for the 121–140 mm group in Japanese anchovy. Hg levels increased gradually with body length. Linear regression models revealed a positive correlation between Hg levels and δ13C in fish. Hg levels increased gradually, while δ15N remained relatively constant in the 7–9‰ range. In our study, a distinct shift in diet was observed for Japanese anchovy with increasing body length, and the differences in diet among life stages could be responsible for the changes in Hg levels.

1. Introduction

The concentration of mercury (Hg) in the Northwest Pacific Ocean has increased mainly via anthropogenic contributions since the 19th-century Industrial Revolution [1]. There are different modes of Hg transport away from emission sources to the Northwest Pacific; for example, the Kuroshio Current transports nutrients rich in Hg from the Japanese coast to the open ocean [2]. Furthermore, the high-salinity warm water Kuroshio Current and low-salinity cold Oyashio Current converge in this area. Eddies, jets, and filaments merge in the confluence region, transporting large amounts of Hg-rich nutrient debris from the seafloor to pelagic habitat strata [3]. Hg can be methylated to methylmercury (MeHg) by microorganisms such as sulfate- and iron-reducing bacteria or methanogens [4,5], which are easily taken up by zooplankton and biomagnified along trophic chains [6]. Biomagnification is a cause of increased Hg levels in pelagic fish such as Japanese anchovy [1]. Small pelagic fishes play a significant role in connecting the lower and upper trophic levels [7,8].
The Northwest Pacific has rich fishing potential. The Japanese anchovy (Engraulis japonicus), a small pelagic fish, is the most common fish species caught in the Northwest Pacific, and anchovy represent 9.06% of the total capture production worldwide [9]. The Japanese anchovy plays an important role in biomagnification. There is a phenomenon of a gradual increases in mercury concentrations with increasing trophic levels in consumers. This is a bioaccumulative process. The level can be influenced by a variety of factors, including the metabolic rate of the species, food choice, growth rate and environmental conditions [10]. Morel et al. [11] reported that Hg levels differed among the life history stages of fish, possibly because they may encounter prey items with different Hg concentrations from different food webs [12,13]. Diet may be a major factor contributing to the bioaccumulation of this contaminant [14]. Bioaccumulated Hg was excreted from muscle tissue very slowly, which led to an increase in Hg in Japanese anchovy over time [1]. However, there are still knowledge gaps concerning the feeding ecology and biological effects on Hg accumulation, which warrants further studies.
In general, Hg levels in biota are influenced by life history traits and food web processes [15]. The use of stable isotopes has become a common approach for determining the long-term feeding status of Japanese anchovy and investigating the food sources of marine food webs [16]. The carbon stable isotope ratio (δ13C) is generally used to distinguish food sources and analyze Hg bioaccumulation in different feeding habitats [16]. The nitrogen stable isotope ratio (δ15N) reflects the trophic position of the studied species [17]. Briefly, heavier isotopes of naturally occurring elements (such as carbon and nitrogen) are retained to a greater extent than lighter isotopes, and stable isotopes are thus widely used to investigate the relationship between feeding and Hg levels [16,18]. Yoshino et al. [1] suggested that gradual increases in Hg levels occurred in pelagic fish during ontogenesis. We anticipated that this phenomenon may also occur in Japanese anchovy. Furthermore, the food web of Japanese anchovy changed significantly with growth, which was also the main factor in the bioaccumulation of Hg [1,16].
So, we used the stable isotope approach to explore whether life history traits and food web processes had an effect on Hg levels. First, we investigated the feeding ecology of Japanese anchovy at different growth stages using carbon and nitrogen stable isotopes. Second, body length, δ13C, and δ15N were used to explain the Hg variability among the ontogenetic stages of Japanese anchovy.

2. Materials and Methods

2.1. Sample Collection and Preparation

The 143 samples used in this study were collected from June 2021 to July 2021 in the Northwest Pacific Ocean (39°2′ N~42°30′ N, 154°02′ E~161°29′ E) (Figure 1). They were stored in a freezer at −20 °C to prevent tissue degradation and lipid oxidation [19]). Muscle samples were collected, and biological data were collected. Samples were measured after thawing in the laboratory, including body length (BL, ±1 mm); 2 g of muscle tissue was extracted and dried in a freeze dryer at −55 °C for 24 h and then ground into powder (≤5 μm in diameter) using a freezing mixer ball mill (Retsch MM400; Retsch, Haan, Germany). The samples were divided into 5 body length groups with a group spacing of 10 mm (Table 1).

2.2. Stable Isotope Analysis

To extract the lipids from each tissue sample, 1.0 mg of muscle powder was weighed, 12 mL of chloroform and methanol (2:1, v/v) were added, and the mixture was left to stand for 24 h [20,21]. The powder mixture was then centrifuged at 4000 r/min for 3 min, and the lower layer of the powder was removed and oven-dried at 40 °C for 24 h. Finally, the powder was loaded in a 2 mL centrifuge tube.
The powder was fed into a stable isotope mass spectrometer (ISOPRIME100, IsoPrime Corporation, Lisle, IL, USA) and elemental analyzer (Vario ISOTOPE Cube, Elementar Americas Inc., New York, NY, USA) for stable isotope measurements. The δ13C and δ15N values were calculated using the following formula:
δ X = R s a m p l e R s t a n d a r d 1 × 1
where X is 13C or 15N and Rsample and Rstandard are the atomic ratios of 13C/12C or 15N/14N in the sample and standard substance, respectively. Rstandard is the standardized sample value of carbon and nitrogen stable isotopes; the PDB (PeeDeeBelemnie) and N2−atm international standards were used as reference standards (protein δ13C = −26.98‰, δ15N = 5.96‰), respectively.

2.3. Analysis of Hg Levels

The samples that were dried for stable isotope analysis were used to measure Hg levels. The samples intended for Hg analysis were lipid-free. Hg levels of all samples were determined via thermal decomposition (combustion), amalgamation, and atomic absorption spectrometry using a calibrated Direct Hg Analyzer (DMA-80, Milestone, Shelton, CT, USA). Approximately 0.05 g of crushed sample was put into the DMA-80 analyzer and then dried and burned at 650 °C in an oxygen atmosphere. The tissue measurements were conducted as follows: drying time: 100 s; decomposition time: 150 s; and waiting time: 10 s. Quality control procedures included analysis of laboratory blanks, duplicate tissue samples, and certified reference materials (DORM-4). The average precision for duplicate samples was ±6.56%, and the recovery for the certified reference materials ranged from 95 to 108%.

2.4. Data Analysis

One-sample Kolmogorov–Smirnov and Levene tests were performed to check for a normal distribution and homogeneity of variances of the isotopic values [22]. Analysis of variance (ANOVA) was used to analyze the differences in δ13C and δ15N values among the five body length groups. Next, post hoc Tukey’s honestly significant difference (HSD) test was performed with δ13C and δ15N data.
In our study, δ13C and δ15N were used to evaluate the trophic niche. The trophic niche width and overlap were calculated using the standard ellipse corrected area (SEAc), which can reduce the influence of the number of samples on the results [23]. According to this method, the SEAc was obtained without overestimating the area for small sample sizes. The stable isotope Bayesian ellipses in the R (SIBER) package was used to calculate the SEAc overlap rate and SEAc overlap area among the five body length groups [23,24]. Statistical analyses were carried out in R Version 3.5.0 [24].
The trophic level (TP) was determined by the δ15N values via the following equation [22]:
T P = δ 15 N s a m p l e δ 15 N b a s e l i n e / n + λ ,
where δ15Nsample represents the δ15N value of the measured sample and δ15Nbaseline represents the δ15N value of the baseline organism. δ15Nbaseline is the isotopic value of a herbivorous copepod species common to the study area (Neocalanus cristatus), and the value was 6.3‰ [25,26]. In addition, previous studies have shown that the basic trophic level of λ is 2.3 [27], and n represents the trophic enrichment value of one trophic level or 3.4‰ [25].

3. Results

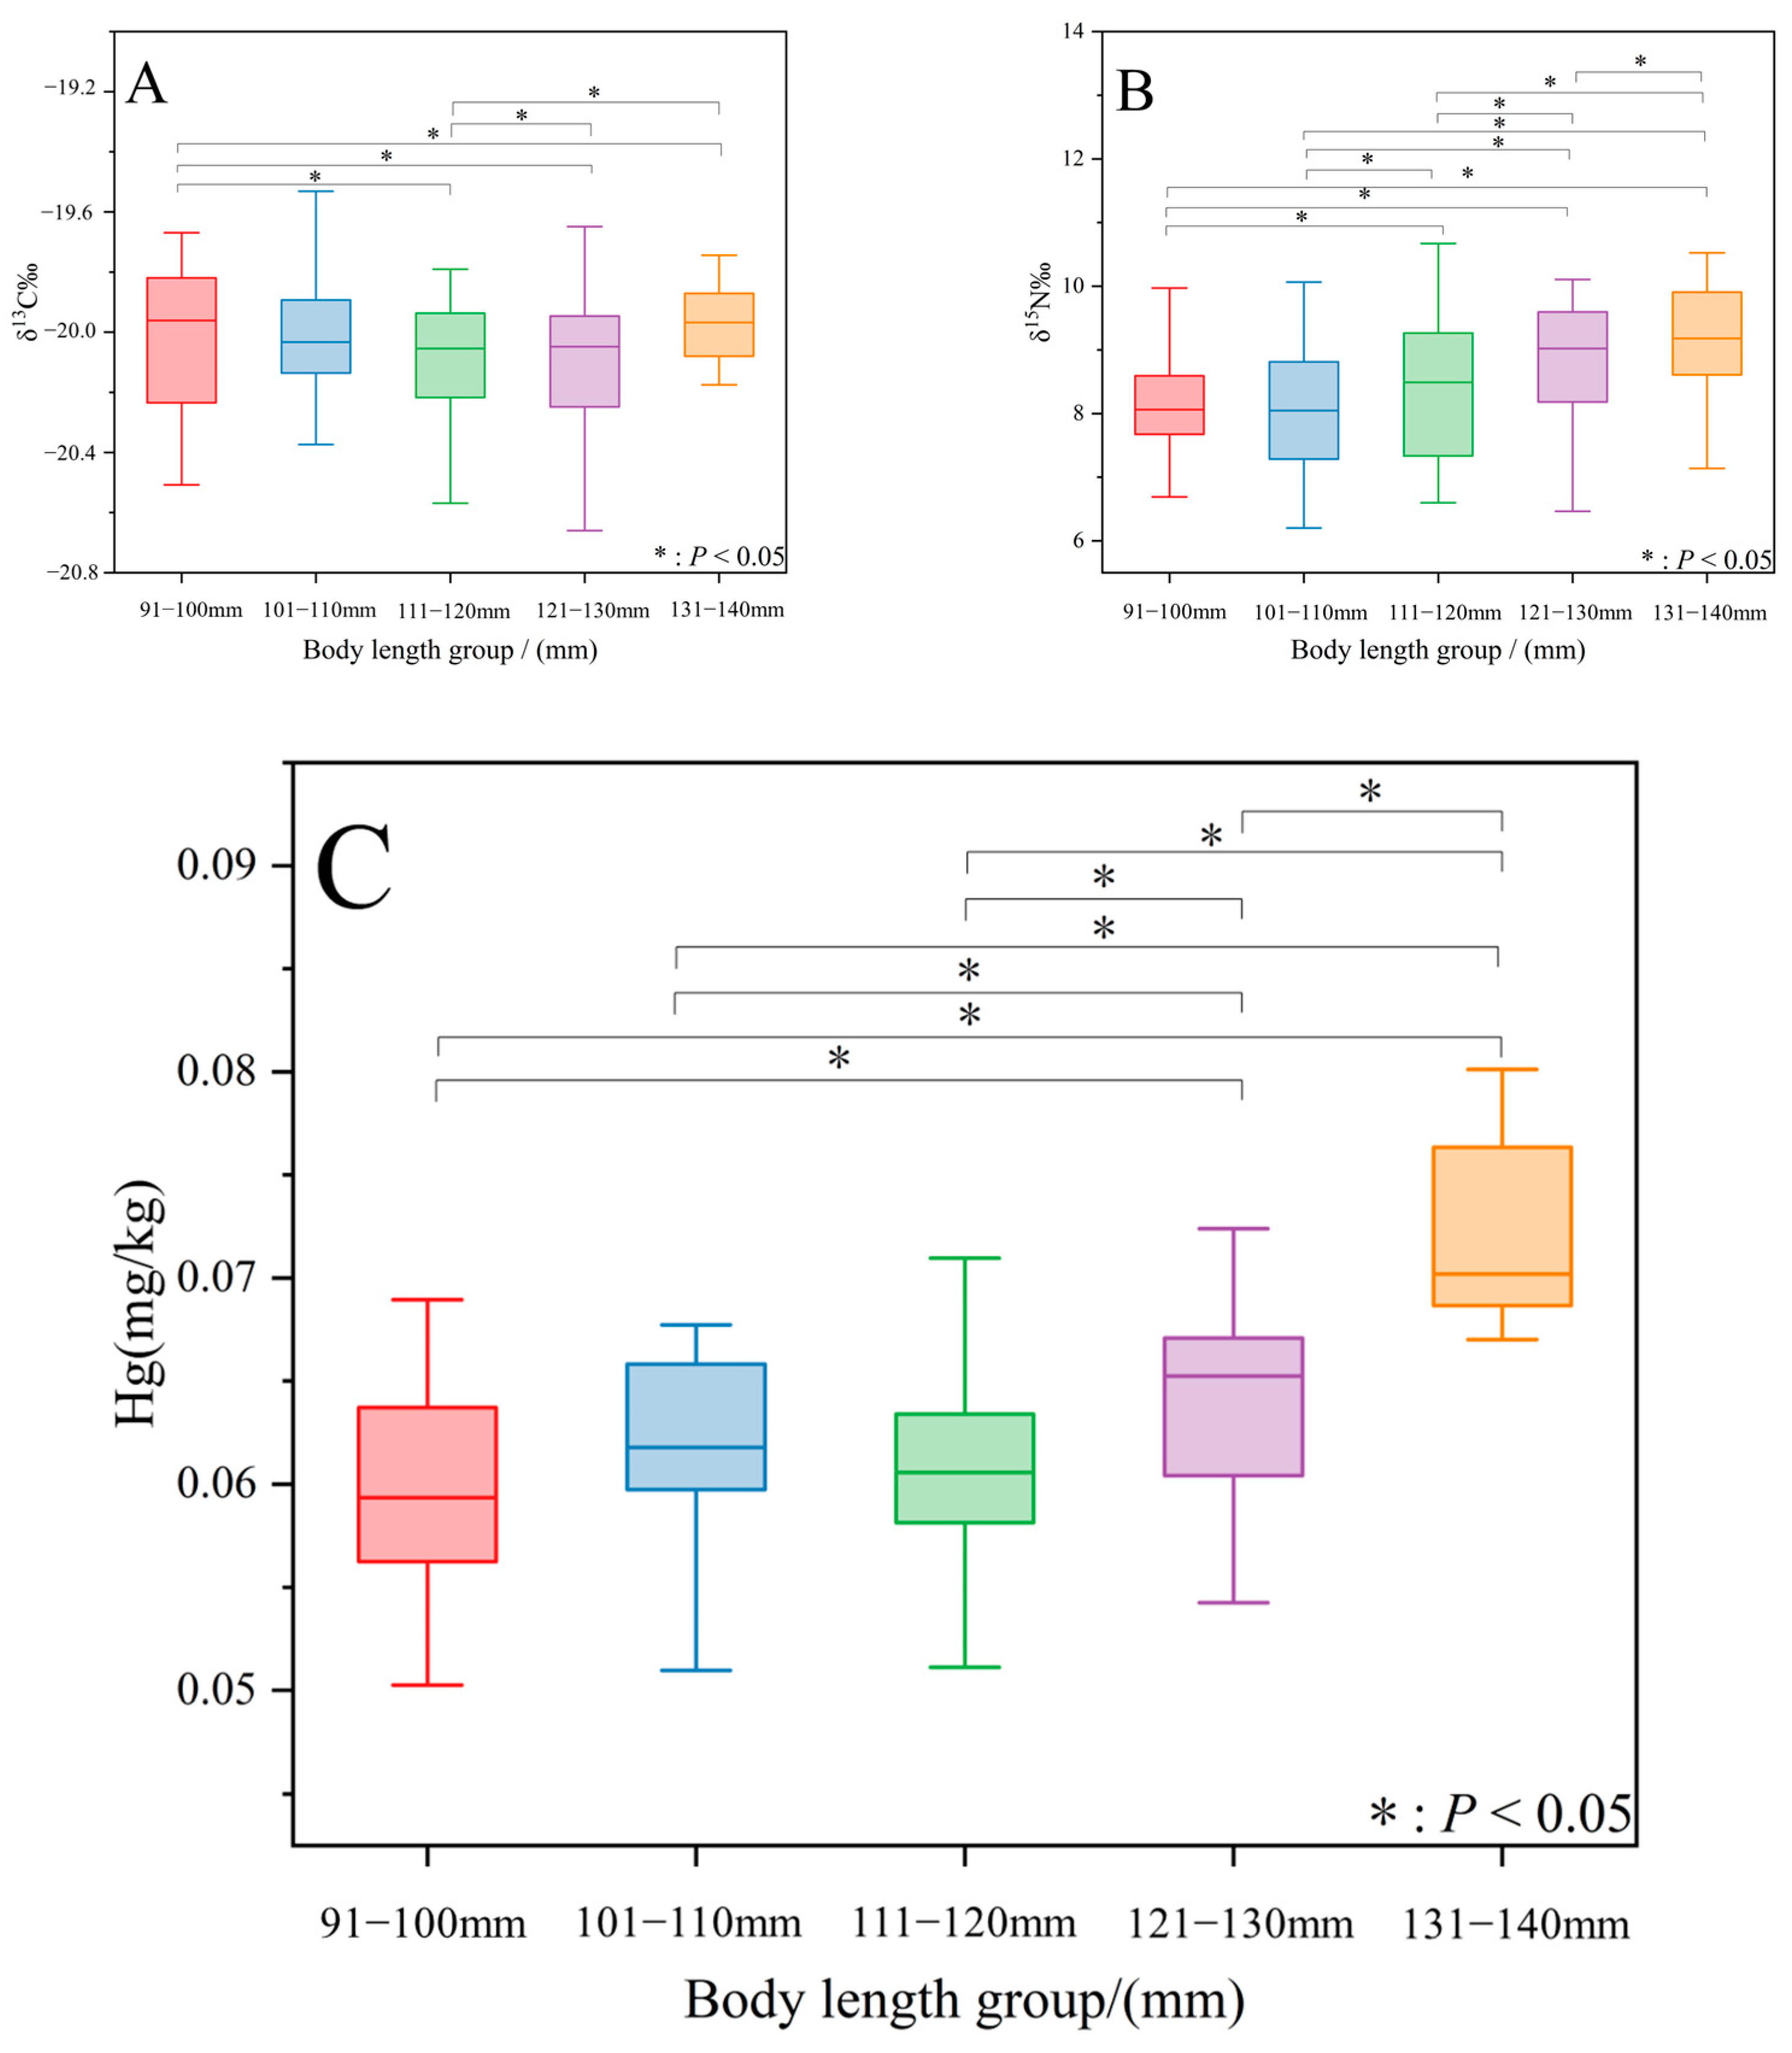
3.1. Differences in Isotopic Values and Hg Levels among Body Length Groups

We found that the δ13C value decreased and then subsequently increased with the growth of the Japanese anchovy. The average δ13C value for the 111–120 mm group was the lowest, and the average δ13C value for the 91–100 mm group was the highest (Figure 2A). The δ13C values of the 91–100 mm group were significantly greater than those of the 121–130 and 131–140 mm groups (p < 0.05), and the δ13C values of the 91–100, 121–130 and 131–140 mm groups were significantly greater than those of the 111–120 mm group (p < 0.05). The δ15N value showed a gradual increasing trend with the growth of the Japanese anchovy (Figure 2B). The δ15N values of the 111–120 mm, 121–130 and 131–140 mm groups were significantly greater than those of the 91–100 and 101–120 mm groups (p < 0.05). The Hg levels in muscle showed a gradual increasing trend with the growth of Japanese anchovy (Figure 2C). Hg levels did not differ among the 91–100, 101–110 and 111–120 mm groups (p > 0.05), while the Hg levels of these three groups were significantly lower than those of the 121–130 and 131–140 mm groups (p < 0.05). See also Tables S1–S3 in the Supplementary Materials.

3.2. Trophic Levels and Trophic Niche

The trophic level tended to gradually increase with the growth of Japanese anchovy. The trophic level of the 91–110 mm group stabilized at approximately 2.85. However, the trophic level reached the highest in the 131–140 mm group at 3.11 (Table 1).
The trophic niches of the five body length groups were constantly changing. The SEAc increased and then decreased with the growth of Japanese anchovy, and the 111–120 mm group had the largest SEAc (0.8) (Table 2). Compared to the body length group of 91–120 mm (71–83%), the niche overlap decreased for the 121–140 mm group in Japanese anchovy (53%) (Figure 3 and Table 3).

3.3. Correlations between δ15N and δ13C Stable Isotopes and Hg Levels

According to Figure 4, Hg levels increased slightly with increasing δ13C values (R2 = 0.15, p = 0.32; Figure 4B). Hg was positively correlated with δ15N and increased gradually, while it remained relatively constant at a δ15N of 7–9 ‰ (R2 = 0.21, p = 0.17; Figure 4A). Hg was positively correlated with body length and increased gradually (R2 = 0.45, p = 0.002; Figure 4B). The correlation between δ15N and Hg was greater than that between δ13C and Hg (δ15N: R2 = 0.21 > δ13C: R2 = 0.15).

4. Discussion

4.1. Differences in Isotope Values among Body Length Groups

In marine ecosystems, since δ13C values change by only a small amount at each trophic level (i.e., <1‰), δ13C can be used to estimate migration routes and identify foraging habitats [28]. δ15N enrichment is relatively stable and is used to determine the trophic level of organisms [29].
We found that the δ13C values decreased from body lengths of 91–120 mm and then increased from body lengths of 121 to 140 mm. We inferred that this phase reflected the habitat changes in the habitat of Japanese anchovy. This is because the oxygen content varies across different habitats, and the respiratory activity of fish is influenced by the oxygen levels in their environment. During respiration, the heavier carbon isotope 13C in the muscle tends to combine with oxygen to form carbon dioxide, thereby reducing the δ13C values. The anchovies of 91–120 mm migrated to deeper waters with low oxygen during the summer spawning season; decreasing respiration in Japanese anchovy resulted in a decrease in the δ13C value for body lengths of 91–120 mm [30]. As the swimming ability of Japanese anchovy with body lengths of 121–140 mm improved, they had the ability to migrate to oceans where primary productivity and oxygen is abundant, which allowed large individuals to graze on dominating zooplankton [28,31]; elevated trophic levels of ingested species resulted in increased δ13C values for body lengths of 121 to 140 mm. This result was consistent with observations from the same areas where Cololabis saira and Sardinella clupeoides had been studied [32], which may be a general pattern of changes in the habitat migrations of pelagic fish in this area.
The δ15N values showed a gradual increasing trend with the growth of the Japanese anchovy. An increase in fish length and the size of feeding organs allows Japanese anchovy to capture higher-trophic-level species, which is likely a general tendency observed in common fish species. The presence of large plankton may affect the feeding of small fish species like the Japanese anchovy. Due to the relatively large size of these plankton organisms compared to the body size of juvenile Japanese anchovy, they may not be able to efficiently prey on these large organisms. This situation could lead the Japanese anchovy to adopt an inefficient particulate feeding mode with the growth of the Japanese anchovy, meaning they might have to expend more energy and time to catch and digest these larger food particles. The change in the feeding leads to an increase in δ15N [33,34]. Tanaka et al. [33] reported similar findings in Japanese anchovy on the coasts of northern and western Kyushu and hypothesized that noticeable ontogenetic feeding shifts were caused by increasing feeding organ size [33]. The δ15N values of Japanese anchovy with body lengths of 91–110 mm in our study were more stable and lower than those of Japanese anchovy with body lengths of 111 to 140 mm. We suggested that Japanese anchovy that inhabited the same sea area early in life did not have powerful feeding organs and fed on similar primary producers (baseline phytoplankton) [35]. These findings support the hypothesis that δ15N variance in Japanese anchovy is primarily caused by dietary sources and biogeochemical processes [36].

4.2. Trophic Levels and Trophic Niches

Trophic niche overlap reflects the degree of overlap in diet composition among species, and the overlap represents the presence of bait competition [37]. The higher the overlap, the stronger the competition for decoys [38]. The SEAc reflects the extent to which fish utilize resources [38]. Compared to the body length of 91–120 mm, the niche overlap decreased for the body length of 121–140 mm in Japanese anchovy. The SEAc increased from 91 to 120 mm and then decreased from 121 to 140 mm in the Japanese anchovy. This suggests that the trophic niches of Japanese anchovy changed with growth, and differences in resource use were observed. This could be because Japanese anchovy with body lengths of 91–120 mm selected different low-trophic-level foods in similar habitats [17,35]. This pattern could also result in a larger isotopic niche width in Japanese anchovy since they might have a wider prey size spectrum. The increase in SEAc in Japanese anchovy at 91–120 mm and then the subsequent decrease were mainly driven by the spectrum of prey and habitats. As the Japanese anchovy grow to 121–140 mm, they dove into deeper water to feed on food at higher trophic levels [35]. It is hypothesized that Japanese anchovy from 121 to 140 mm in body length with strong swimming ability will preferentially feed on higher-trophic-level organisms than Japanese anchovy from 91 to 120 mm in body length and ultimately maximize feeding success on larger prey or prey at higher trophic levels [31]. A decrease in prey variety was the major factor in the decrease in SEAc and trophic niche overlap [38,39].
Our study revealed that the trophic level gradually increased with the growth of Japanese anchovy. Japanese anchovy that were 91–110 mm in length competed for similar small prey or prey at lower trophic levels, which was reflected in strongly overlapping trophic niches [35]. The chances of competition may decrease for Japanese anchovies that are 111–140 mm in length, and these individuals strongly wish to select high-trophic-level prey [7]. Increased trophic levels resulted in rapid increases in the Japanese anchovy trophic level. These findings somewhat resemble the results of Post et al. [40], who reported that feeding shifts commonly caused changes in the trophic level of Chinese offshore water fish.

4.3. Factors Explaining the Variation in Hg Levels

Our results revealed a positive correlation between Hg levels and δ13C for Japanese anchovy. Spatial variability in δ13C may be driven not only by baseline values but also by the strength of currents in the high sea. The primary producers with high Hg levels were elevated to the Japanese anchovy perched water layer as a result of powerful currents such as fronts, eddies, and other strong water bodies [5]. The Hg levels of Japanese anchovy increased with increase eddies, jets, and filaments [2].
Hg levels in fish muscle were found to be positively correlated with δ15N. An increase in δ15N indicated an increase in trophic position. Hg is biomagnified (i.e., it increases with trophic level) within marine food webs [13]. Meng et al. [34] and Yasue et al. [37] noted that Japanese anchovy juveniles mainly had lower trophic levels and mainly fed on zooplankton and phytoplankton. Biomagnification was the accumulation of mercury in the food chain through the predatory relationships of organisms, resulting in higher levels in organisms higher up the food chain [13]. Since small anchovies mainly fed on zooplankton, they were at a lower level of the food chain and therefore had relatively low Hg levels in their bodies [41,42]. The adults were voracious predators who preferred prey from higher trophic levels [35]. Variations in prey trophic level during fish ontogeny are important factors driving Hg levels [41,42]. Similar to previous findings, Hg levels increased with increasing fish trophic level [13].
Our results showed that the Hg levels in muscles gradually increased with the growth of Japanese anchovy. Body length is strongly related to the metabolism of metals and the dilution of fat [43,44]. The metabolism of metals decreased with growth in Japanese anchovy [45]. Japanese anchovy that were 91–120 mm in length usually had lower Hg levels, which could be attributed to a high metabolic rate. The physiological mechanisms of fish from 91 to 120 mm were different, resulting in high levels of Hg, which is regulated by Hg and has a significant affinity for and binding to thiol-containing amino acids in proteins; it is slowly expelled by marine predators and heavily absorbed. In contrast, the levels of Hg in fish that were 121 to 140 mm in length were greater, which could be due to the metabolic capability to excrete excess metals from digestive gland-related tissues being lower. We found that Hg levels increased with the growth of Japanese anchovy, as was the case for Oreochromis niloticus studied by Wang et al. [46,47]. Bioaccumulation increases with growth in fish because of the growth dilution of muscle and digestive gland-related tissues, weakening their ability to excrete heavy metals [46,47].

5. Conclusions

In this study, we used stable isotope analysis to examine whether life history traits and food web processes affect Hg levels in the high seas of the Northwest Pacific Ocean. We found that the stable carbon and nitrogen isotopes of Japanese anchovy changed significantly with individual growth, which was attributed to differences in diet and changes in feeding grounds during different life history stages. Hg levels increased gradually with increasing nitrogen isotopes, probably because of the dietary shift from phytoplankton to prey at higher trophic levels, which led to higher trophic levels and Hg levels. Our study improved the understanding of the trophic and Hg levels of Japanese anchovy.

Supplementary Materials

The following supporting information can be downloaded at: https://www.mdpi.com/article/10.3390/jmse12081274/s1, Table S1: The p-value of Analysis of variance (ANOVA) in δ13C among the five body length groups; Table S2: The p-value of Analysis of variance (ANOVA) in δ15N among the five body length groups; Table S3: The p-value of Analysis of variance (ANOVA) in Hg levels among the five body length groups.

Author Contributions

L.C.: Conceptualization, writing—original draft, methodology, data curation, software, visualization, investigation. G.H.: conceptualization, writing—review and editing, methodology, funding acquisition. Z.Z.: methodology, investigation. B.L.: methodology, investigation. X.C.: conceptualization, writing—review and editing. Y.C.: methodology. All authors have read and agreed to the published version of the manuscript.

Funding

This work was supported by the National Key Research and Development Program (2023YFD2401305), the Program on Comprehensive Scientific Survey of Fisheries Resources on the High Seas sponsored by the Ministry of Agriculture and Rural Affairs, the Key Laboratory of Sustainable Exploitation of Oceanic Fisheries Resources (Shanghai Ocean University), the Ministry of Education (A1-2006-23-200206), and the Startup Foundation for Young Teachers of Shanghai Ocean University (A2-2006-23-200308).

Institutional Review Board Statement

Not applicable.

Informed Consent Statement

Not applicable.

Data Availability Statement

The data will be made available upon request.

Acknowledgments

This is a contribution of the Distant Squid Fisheries Sci-Tech Group, SHOU. We thank the staff members of the Key Laboratory of Sustainable Exploitation of Oceanic Fisheries Resources, Ministry of Education, Shanghai Ocean University, for providing assistance in the laboratory.

Conflicts of Interest

The authors declare that they have no known competing financial interests or personal relationships that could have appeared to influence the work reported in this paper.

References

  1. Yoshino, K.; Mori, K.; Kanaya, G.; Kojima, S.; Henmi, Y.; Matsuyama, A.; Yamamoto, M. Food sources are more important than biomagnification on mercury bioaccumulation in marine fishes. Environ. Pollut. 2020, 262, 113982. [Google Scholar] [CrossRef] [PubMed]
  2. Fan, X.Y. A Master’s Thesis on the Process of Small Zooplankton Feeding Rates in Response to Mesoscale Cyclonic Eddies in the Northwestern Pacific Ocean. Master’s Thesis, Xiamen University, Xiamen, China, 2021. Available online: https://link.cnki.net/doi/10.27424/d.cnki.gxmdu.2021.002352 (accessed on 17 June 2024).
  3. Clayton, S.; Nagai, T.; Follows, M.J. Fine scale phytoplankton community structure across the Kuroshio Front. J. Plankton Res. 2014, 36, 1017–1030. [Google Scholar] [CrossRef]
  4. Liu, J.X.; Gao, T.X.; Zhuang, Z.M.; Yokogawa, K.; Zhang, Y.P. Late Pleist-ocene divergence and subsequent population expansion of two closely related fish spe-cies, Japanese anchovy (Engraulis japonicus) and Australian anchovy (Engraulis austr-alis). Mol. Phylogenetics Evol. 2006, 40, 712–723. [Google Scholar] [CrossRef] [PubMed]
  5. Landry, M.R.; Brown, S.L.; Rii, Y.M.; Selph, K.E.; Bidigare, R.R.; Yang, E.J.; Simmons, M.P. Depth-stratified phytoplankton dynamics in Cyclone Opal, a subtropical mesoscale eddy. Deep. Sea Res. Part II Top. Stud. Oceanogr. 2008, 55, 1348–1359. [Google Scholar] [CrossRef]
  6. Cossa, D.; Coquery, M.; Gobeil, C.; Martin, J.M. Mercury Fluxes at the Ocean Margins. In Global and Regional Mercury Cycles: Sources Fluxes and Mass Balances; 1996; pp. 229–247. Available online: https://www.usualwant.com/chapter/10 (accessed on 5 January 1997).
  7. Meng, T.X. Studies on the feeding of Japanese anchovy (Engraulis japonicus) post larva in the spawning ground in the Southern waters of Shandongpeninsula. Mar. Fish. Res. 2001, 22, 21–25. [Google Scholar]
  8. AMAP Assessment. Hg in the Arctic; Arctic Monitoring and Assessment Programme (AMAP): Oslo, Norway, 2011; 193p. [Google Scholar]
  9. FAO. FAO Yearbook. In Fishery and Aquaculture Statistics 2018/FAO Annuaire; FAO: Rome, Italy, 2020. [Google Scholar] [CrossRef]
  10. Streets, D.G.; Devane, M.K.; Lu, Z.; Bond, T.C. All-time releases of mercury to the atmosphere from human activities. Environ. Sci. Technol. 2011, 45, 10485–10491. [Google Scholar] [CrossRef] [PubMed]
  11. Morel, F.M.; Kraepiel, A.M.; Amyot, M. The chemical cycle and bioaccumulation of mercury. Annu. Rev. Ecol. Syst. 1998, 29, 543–566. [Google Scholar] [CrossRef]
  12. Takahashi, M.; Watanabe, Y.; Kinoshita, T.; Watanabe, C. Growth of larval and early juvenile Japanese anchovy, Engraulis japonicus, in the Kuroshio Oyashio transition region. Fish. Oceanogr. 2001, 10, 235–247. [Google Scholar] [CrossRef]
  13. Le Croizier, G.; Schaal, G.; Point, D.; Le Loc’h, F.; Machu, E.; Fall, M. Stable isotope analyses revealed the influence of foraging habitat on mercury accumulation in tropical coastal marine fish. Sci. Total Environ. 2019, 650, 2129–2140. [Google Scholar] [CrossRef] [PubMed]
  14. McKinney, M.A.; Dean, K.; Hussey, N.E.; Cliff, G.; Wintner, P.; Dudley, S.F. Global versus local causes and health implications of high mercury concentrations in sharks from the east coast of South Africa. Sci. Total Environ. 2016, 541, 176–183. [Google Scholar] [CrossRef]
  15. Mintzer, V.J.; Gannon, D.P.; Barros, N.B.; Read, A.J. Stomach contents of massstranded short-finned pilot whales (Globicephala macrorhynchus) from North Carolina. Mar. Mammal. Sci. 2008, 24, 290–302. [Google Scholar] [CrossRef]
  16. Perissinotto, R.; Pakhomov, E.A. Feeding association of the copepod Rhincalanus gigas with the tunicate salp Salpa thompsoni in the southern ocean. Mar. Biol. 1997, 127, 479–483. [Google Scholar] [CrossRef]
  17. Wang, J.; Jiang, R.J.; Hu, C.L. Feeding ecology of anchovy based on stomach contents analysis and stable isotope techniques. J. Appl. Ecol. 2021, 2035–2044. [Google Scholar]
  18. Storelli, M.M.; Barone, G.; Piscitelli, G.; Marcotrigiano, G.O. Mercury in fish: Concentration vs. fish size and estimates of mercury intake. Food Addit. Contam. 2007, 24, 1353–1357. [Google Scholar] [CrossRef] [PubMed]
  19. Phillips, K.L.; Nichols, P.D.; Jackson, G.D. Lipid and fatty acid composition of the mantle and digestive gland of four Southern Ocean squid species: Implications for food-web studies. Antarct. Sci. 2002, 14, 212–220. [Google Scholar] [CrossRef]
  20. Folch, J.; Lees, M.; Stanley, G. A simple method for the isolation and purification of total lipides from animal tissues. J. Biol. Chem. 1957, 226, 497–509. [Google Scholar] [CrossRef] [PubMed]
  21. Li, Z.; Pethybridge, H.R.; Wu, F.; Li, Y. Mercury bioaccumulation in thresher sharks from the eastern tropical Pacific: Influences of body size, maturation stage, and feeding habitat. Sci. Total Environ. 2023, 872, 162248. [Google Scholar] [CrossRef] [PubMed]
  22. Zar, J.H. Biostatistical Analysis, 4th ed.; Prentice Hall: Hoboken, NJ, USA, 1999. [Google Scholar]
  23. Jackson, A.L.; Inger, R.; Parnell, A.C.; Bearhop, S. Comparing isotopic niche-widths among and within communities: SIBER–Stable Isotope Bayesian Ellipses in R. J. Anim. Ecol. 2011, 80, 595–602. [Google Scholar] [CrossRef]
  24. R Core Team. R: A Language and Environment for Statistical Computing, Version 3.5.0; R Foundation for Statistical Computing: Vienna, Austria, 2018. [Google Scholar]
  25. Zhang, J.; Liu, B.; Hu, S.; Gong, Y. Trophic structure of micronekton in the Northwest Pacific Ocean. Front. Mar. Sci. 2022, 9, 971649. [Google Scholar] [CrossRef]
  26. Aita, M.N.; Tadokoro, K.; Ogawa, N.O.; Hyodo, F.; Ishii, R.; Smith, S.L.; Saino, T.; Kishi, M.J.; Saitoh, S.-I.; Wada, E. Linear relationship between carbon and nitrogen isotope ratios along simple food chains in marine environments. J. Plankton Res. 2011, 33, 1629–1642. [Google Scholar] [CrossRef]
  27. Gorbatenko, K.M.; Lazhentsev, A.E.; Kiyashko, S.I. Seasonal dynamics of the trophic status of zooplankton in the Sea of Okhotsk (based on data from stable carbon and nitrogenisotope analysis). Russ. J. Mar. Biol. 2014, 40, 519–531. [Google Scholar] [CrossRef]
  28. Zhang, B.; Yan, W.; Dai, W.F. Application of stable isotope techniques to study the feeding ecology of summer fish communities in Laoshan Bay. J. Aquat. Fish. 2016, 40, 585–594. [Google Scholar]
  29. DeNiro, M.J.; Epstein, S. Influence of diet on the distribution of nitrogen isotopes in animals. Geochim. Cosmochim. Acta 1981, 45, 341–351. [Google Scholar] [CrossRef]
  30. Cui, P.D.; Zhang, Y.X. Distribution characteristics of anchovy spawning grounds and their influencing factors in the offshore waters of Liaoning in the northern Yellow Sea. Adv. Fish. Sci. 2023, 31–45. [Google Scholar]
  31. Akahashi, K.; Wada, E.; Sakamoto, M. Relationship between Carbon Isotope Discrimination and the Specific Growth Rate of Green Alga Chlamydomonas reinhardtii. Jpn. J. Limnol. 1991, 52, 105–112. [Google Scholar] [CrossRef]
  32. Yang, N.; Hua, C.X.; Zhu, Q.C. Carbon and nitrogen stable isotope characterization of fallfish from the high seas of the Northwest Pacific Ocean. Ocean. Lakes 2023, 54, 412–423. [Google Scholar]
  33. Tanaka, H.; Aoki, I.; Ohshimo, S. Feeding habit and gill raker morphology of three planktivorous pelagic fish species off the coast of northern and western Kyushu in summer. J. Fish Biol. 2006, 68, 1041–1061. [Google Scholar] [CrossRef]
  34. Meng, T.X. Studies on the feeding of Japanese anchovy (Engraulis japonicus) at different life stages on zooplankton in the Middle and Southern Waters ofthe Yellow Sea. Mar. Fish. Res. 2003, 24, 1–9. [Google Scholar]
  35. Tanaka, H.; Ohshimo, S.; Takagi, N.; Ichimaru, T. Investigation of the geographical origin and migration of anchovy Engraulis japonicus in Tachibana Bay, Japan: A stable isotope approach. Fish. Res. 2010, 102, 217–220. [Google Scholar] [CrossRef]
  36. Gong, Y.; Li, Y.; Chen, X.J. Trophic niche and diversity of a pelagic squid (Dosidicus gigas): A comparative study using stable isotope, fatty acid, and feeding apparatuses morphology. Front. Mar. Sci. 2020, 7, 642. [Google Scholar] [CrossRef]
  37. Han, D.Y.; Xue, Y. Trophic and spatial ecological niche of five goby species in Jiaozhou Bay. Chin. Aquat. Sci. 2013, 20, 148–156. [Google Scholar]
  38. Zhao, Z.; Hu, G.; Fang, Z.; Li, J.; Liu, B.; Chen, X. Feeding Strategie and Trophic Niche Divergence of Three Groups of Dosidicus gigas off Peru: Based on Stable Carbon and Nitrogen Isotopes and Morphology of Feeding Apparatuses. Mar. Biotechnol. 2023, 25, 328–339. [Google Scholar] [CrossRef] [PubMed]
  39. Katsumi, M.; Makoto, S.; Yukio, N. Food density and rate of feeding larvae of anchovy and sardine in patchy distribution. Jpn. J. Fish. Sci. 1988, 54, 401–411. [Google Scholar] [CrossRef]
  40. Post, D.M. Using stable isotopes to estimate trophic position: Models, methods as-sumptions. Ecology 2002, 83, 703–718. [Google Scholar] [CrossRef]
  41. Yasue, N.; Doiuchi, R.; Yoshimoto, Y.; Takeuchi, T. Diet of late larval Japanese anchovy Engraulis japonicus in the Kii Channel, Japan. Fish. Sci. 2010, 76, 63–73. [Google Scholar] [CrossRef]
  42. Yasunaka, S.; Nojiri, Y.; Nakaoka, S.I.; Ono, T.; Mukai, H.; Usui, N. Monthly maps of sea surface dissolved inorganic carbon in the North Pacific: Basin-wide distribution and seasonal variation. J. Geophys. Res. Ocean. 2013, 118, 3843–3850. [Google Scholar] [CrossRef]
  43. Loseto, L.L.; Stern, G.A.; Deibel, D.; Connelly, T.L.; Prokopowicz, A.; Lean, D.R.S.; Ferguson, S.H. Linking mercury exposure to habitat and feeding behaviour in Beaufort Sea beluga whales. J. Mar. Syst. 2008, 74, 1012–1024. [Google Scholar] [CrossRef]
  44. Loseto, L.L.; Stern, G.A.; Ferguson, S.H. Size and biomagnification: How habitat selection explains beluga mercury levels. Environ. Sci. Technol. 2008, 42, 3982–3988. [Google Scholar] [CrossRef]
  45. Kim, D.I. Metabolic Rates of Japanese Anchovy (Engraulis japonicus) during Early Development Using a Novel Modified Respirometry Method. Animals 2023, 13, 1035. [Google Scholar] [CrossRef]
  46. Wan, R.; Wu, Y.; Huang, L.; Zhang, J.; Gao, L.; Wang, N. Fatty acids and stable isotopes of a marine ecosystem: Study on the Japanese anchovy (Engraulis japonicus) food web in the Yellow Sea. Deep. Sea Res. Part II Top. Stud. Oceanogr. 2010, 57, 1047–1057. [Google Scholar] [CrossRef]
  47. Wang, R.; Wang, W.X. Diet-specific trophic transfer of mercury in tilapia (Oreochromis niloticus): Biodynamic perspective. Environ. Pollut. 2018, 234, 288–296. [Google Scholar] [CrossRef] [PubMed]
Figure 1. Map of the sampling location of Japanese anchovy in the Western Pacific.
Jmse 12 01274 g001
Figure 2. Boxplots of (A) δ13C and (B) δ15N isotopic compositions, as well as (C) Hg levels, of Japanese anchovy from different body length groups. The box represents the interquartile range, and the horizontal line within each box represents the median value. Whiskers indicate minimum and maximum values. * indicates a significant difference at the 0.05 level (ANOVA followed by Tukey’s HSD test).
Jmse 12 01274 g002
Figure 3. Estimation of trophic niches scaled by δ13C and δ15N values of Japanese anchovy sampled from the waters of the Western Pacific.
Jmse 12 01274 g003
Figure 4. (A) δ13C, (B) δ15N and (C) body length vs. Hg levels of Japanese anchovy. The 95% confidence intervals are shown as solid lines and shades.
Jmse 12 01274 g004
Table 1. Data from body length of Japanese anchovy in the Western Pacific.
LocationsDateNumberMinMaxMean
(SD)
39.23° N; 155.66° EJuly 20218121110115.23 ± 4.21
39.37° N; 154° EJune 2021119310597.17 ± 2.32
40.35° N; 156° EJuly 20211796125112.55 ± 5.32
40.97° N; 155.5° EJuly 20211291115100.73 ± 4.43
41.00° N; 161.50° EJuly 202122117140132.02 ± 8.43
41.32° N; 160.03° EJuly 202120105140120.36 ± 8.39
41.68° N; 156.00° EJuly 20218105131117.22 ± 5.39
42.00° N; 160.57° EJuly 202111111129119.67 ± 4.93
42.00° N; 157.00° EJuly 20211398131112.41 ± 3.27
42.50° N; 155.58° EJuly 20212195134125.83 ± 8.12
Table 2. Trophic level (TL) and δ13C and δ15N values of Japanese anchovy at different developmental stages in the Western Pacific.
Body Length GroupNumberδ15N (‰)δ13C (‰)TL
MaxMinMean ± SDMaxMinMean ± SD
91–100 mm279.976.698.17 ± 0.76−19.67−20.43−19.99 ± 0.212.85
101–110 mm3010.066.208.06 ± 1.04−19.53−20.37−19.97 ± 0.212.82
111–120 mm3010.676.608.44 ± 1.13−18.68−20.57−20.00 ± 0.332.93
121–130 mm2710.116.468.77 ± 0.99−19.65−20.66−20.01 ± 0.213.03
131–140 mm2810.536.659.03 ± 1.06−19.16−20.40−19.92 ± 0.223.11
The values are the means ± SDs (except for the isotopes, which are reported as the means per thousand ± SDs), and the TLs are reported as percentages.
Table 3. Niche overlap at different growth stages of Japanese anchovy in the Western Pacific.
Group91–100 mm101–110 mm111–120 mm121–130 mm131–140 mmSEAc
91–100 mm83.01%73.80%45.91%31.11%0.52
101–110 mm78.81%45.14%35.94%0.68
111–120 mm70.62%46.79%0.80
121–130 mm52.77%0.59
131–140 mm0.69
The areas of the ellipses (calculated with the SEAc) represent the isotopic trophic niches of different body length groups.
Disclaimer/Publisher’s Note: The statements, opinions and data contained in all publications are solely those of the individual author(s) and contributor(s) and not of MDPI and/or the editor(s). MDPI and/or the editor(s) disclaim responsibility for any injury to people or property resulting from any ideas, methods, instructions or products referred to in the content.

