Article

Enhancing Wave Energy Converters: Dynamic Inertia Strategies for Efficiency Improvement

by
Aleix Maria-Arenas
1,*,
Aitor J. Garrido
2 and
Izaskun Garrido
2
1
Wedge Global SL, 35107 Las Palmas de Gran Canaria, Spain
2
Automatic Control Group—ACG, Institute of Research and Development of Processes—IIDP, Department of Automatic Control and Systems Engineering, Engineering School of Bilbao, University of the Basque Country (UPV/EHU), 48012 Bilbao, Spain
*
Author to whom correspondence should be addressed.
J. Mar. Sci. Eng. 2024, 12(8), 1285; https://doi.org/10.3390/jmse12081285
Submission received: 7 July 2024 / Revised: 26 July 2024 / Accepted: 28 July 2024 / Published: 31 July 2024
(This article belongs to the Special Issue Energy Optimization of Ship and Maritime Structures)

Abstract

:
Wave energy conversion is a promising field of renewable energy, but it still faces several technological and economic challenges. One of these challenges is to improve the energy efficiency and adaptability of Wave Energy Converters to varying wave conditions. A technological approach to solve this efficiency challenge is the negative spring mechanisms illustrated in recent studies. This paper proposes and analyzes a novel negative spring technological concept that dynamically modifies the mass and inertia of a Wave Energy Converter by transferring seawater between its compartments. The added value of the presented technology relies on interoperability, ease of manufacturing and operating, and increased energy efficiency for heterogeneous sea states. The concept is presented in two analyzed alternatives: a passive one, which requires no electrical consumption and is purely based on the relative motion of the bodies, and an active one, which uses a controlled pump system to force the water transfer. The system is evaluated numerically using widely accepted simulation tools, such as WECSIM, and validated by physical testing in a wave flume using decay and regular test scenarios. Key findings include a relevant discussion about system limitations and a demonstrated increase in the extracted energy efficiency up to 12.7% while limiting the maximum power extraction for a singular wave frequency to 3.41%, indicating an increased adaptability to different wave frequencies because of the amplified range of near-resonance operation of the WEC up to 0.21 rad/s.

1. Introduction

The wave energy sector, particularly concerning wave energy converters (WECs) and their development and optimization, is currently experiencing considerable advances and growing interest because power captured from waves could play a significant role in the renewable energy mix. This is an encouraging field in the alternative energy sector in which one can resort to harnessing ocean waves’ kinetic and potential energies for the generation of electricity.
Newer research works and projects in the area bring to focus the increasing diversity of approached technologies applied to maximize the efficiency and effectiveness of wave energy conversion. In such a way, alternative WEC design configurations aim to fulfill this goal, including the following: the proposed point absorber with a hinged arm and mechanical drive power take-off with a promising capture width ratio of 36.5% [1]; a self-powered smart wave energy converter (SS-WEC) utilizing a two-arm mechanism, which converts the oscillatory motion of waves into unidirectional rotary motion for electrical power generation [2]; the use of air volumes to provide a compressible spring effect, which can improve wave power capture by adjusting system stiffness and offering short-term energy storage [3]; the novel concept of built-in WEC (BIWEC) design that can be integrated with existing floating platforms to form a robust system for efficient wave energy utilization [4]; or incorporating a coupled linear-bistable mechanism, a system that combines linear and bistable behaviors to enhance the efficiency of wave energy converters [5].
Other strategies under study to improve the techno-economic viability of WEC technology are constructive interaction between WECs in an array, which can lead to enhanced power absorption compared to isolated WECs if PTO control is optimized for the array configuration [6]; WEC array wave refraction analysis alongside attenuation to avoid underpredicting array power, highlighting the potential for further improvements in WEC array performance [7]; synergies between aquaculture cages and WECs as an effective strategy for both reducing structural vibrations and energy harvesting [8]; or synergies between floating offshore wind turbines and WECs, where wave power production can significantly contribute to the overall energy production, and platform pitch oscillation and tower base damage equivalent load (DEL) can be optimized through PTO control [9].
Technical research in the marine energy area is additionally complemented by best practices, benchmarking, and methodologies to improve the quality of the WEC design and analysis process. This includes the research on the scalability of WECs and their ability to achieve cost parity with other renewables and analyzing practical performance data to show that point absorbers work more efficiently than terminators and attenuators, with hydrodynamic efficiencies up to 80% [10]; the challenge posed by the harsh marine environment, which can lead to malfunctions and reliability issues, and the necessity for fault diagnosis and fault-tolerant control algorithms to identify and accommodate faults, thereby enhancing the resilience and minimizing maintenance operations of WECs [11]; the novel hybrid multi-criteria decision-making (MCDM) methodology using probabilistic single-valued neutrosophic hesitant fuzzy sets (SVNPHFS) for WEC benchmarking, where point absorbers rank first as the most suitable wave-to-energy converter power plant due to their high electricity generation compared to other alternatives [12]; or the water depth impact study on key WEC indicators, such as normalized wave power, efficiency index, capacity factor, capture width, and energy production per unit of rated power [13].
Despite all these technological leaps, however, the commercial use of wave energy converters is still very low because there exist challenges that lie not only in technology but also in resource characterization and system integration. Increasing awareness and investment in wave energy technology is necessary to improve the global proportion of contribution to this energy type [14].
Research and development in wave energy demonstrate strong and innovative activities in the effort to overcome the barriers of wave energy conversion. It is hoped that with innovation and continued collaboration, the wave energy sector will provide a source of contribution towards the land and sustainability in meeting global energy demand.
To support these efforts, this manuscript presents a study on a novel technological approach for dynamically varying the mass and inertia properties of a specific two-body Wave Energy Converter (WEC) configuration. We propose a technological approach to improve the mechanical and electrical efficiency of a point absorber WEC, aligned with the ideas proposed in recent studies discussed in the previous paragraphs. The novelty of our approach is related to the design, material, and control strategy for inertial control that is proposed. The objective is to assess the impact of this technology on WEC efficiency using relevant energy conversion indicators. Two alternatives are analyzed: (I) the Natural Hydro System (NHS), which operates passively without electrical consumption, proposed as a resilient and energy-independent model; and (II) the Forced Hydro System (FHS), which operates actively with control mechanisms, offering optimization possibilities.
To achieve the proposed objective, a variety of tools and methodologies will be employed. MATLAB will be utilized for data analysis and simulation tasks. WECSIM, an open-source code for simulating wave energy converters, will be used to model and simulate the WEC systems. WAMIT, a software tool for analyzing wave interactions with offshore structures, will provide detailed hydrodynamic data. Additionally, experimental tests will be conducted in the Santiago de Compostela University Hydrodynamic Flume to validate the simulation results and further refine the models. These combined approaches will ensure a comprehensive evaluation of the proposed technology.
The manuscript is divided into the following sections: Section 2 provides a detailed description of the concept to be analyzed and the tools used. This includes a general overview, the numerical model, the characteristics of the test flume, and the prototype design. It sets the foundation for understanding the technological approach and its components. Section 3 outlines the sequential methodology used for the analysis, along with the relevant indicators. This section explains the step-by-step process followed to evaluate the technology, ensuring clarity and reproducibility of the study. Section 4 presents the results obtained at various key stages of the analysis up to the objective performance indicators of the Wave Energy Converter (WEC) under different configurations; all of the results in this section are presented to facilitate the comparisons between the Base WEC system and the two novel alternatives, the Natural Hydro System (NHS) and the Forced Hydro System (FHS), especially on the objective-related indicators, such as the impact on energy conversion efficiency. Finally, Section 5 and Section 6 offer a discussion of the findings related to the objectives of the work and outline the next steps for further research. These sections interpret the results, address any limitations, and suggest future directions to enhance the technology and its application.

2. Background

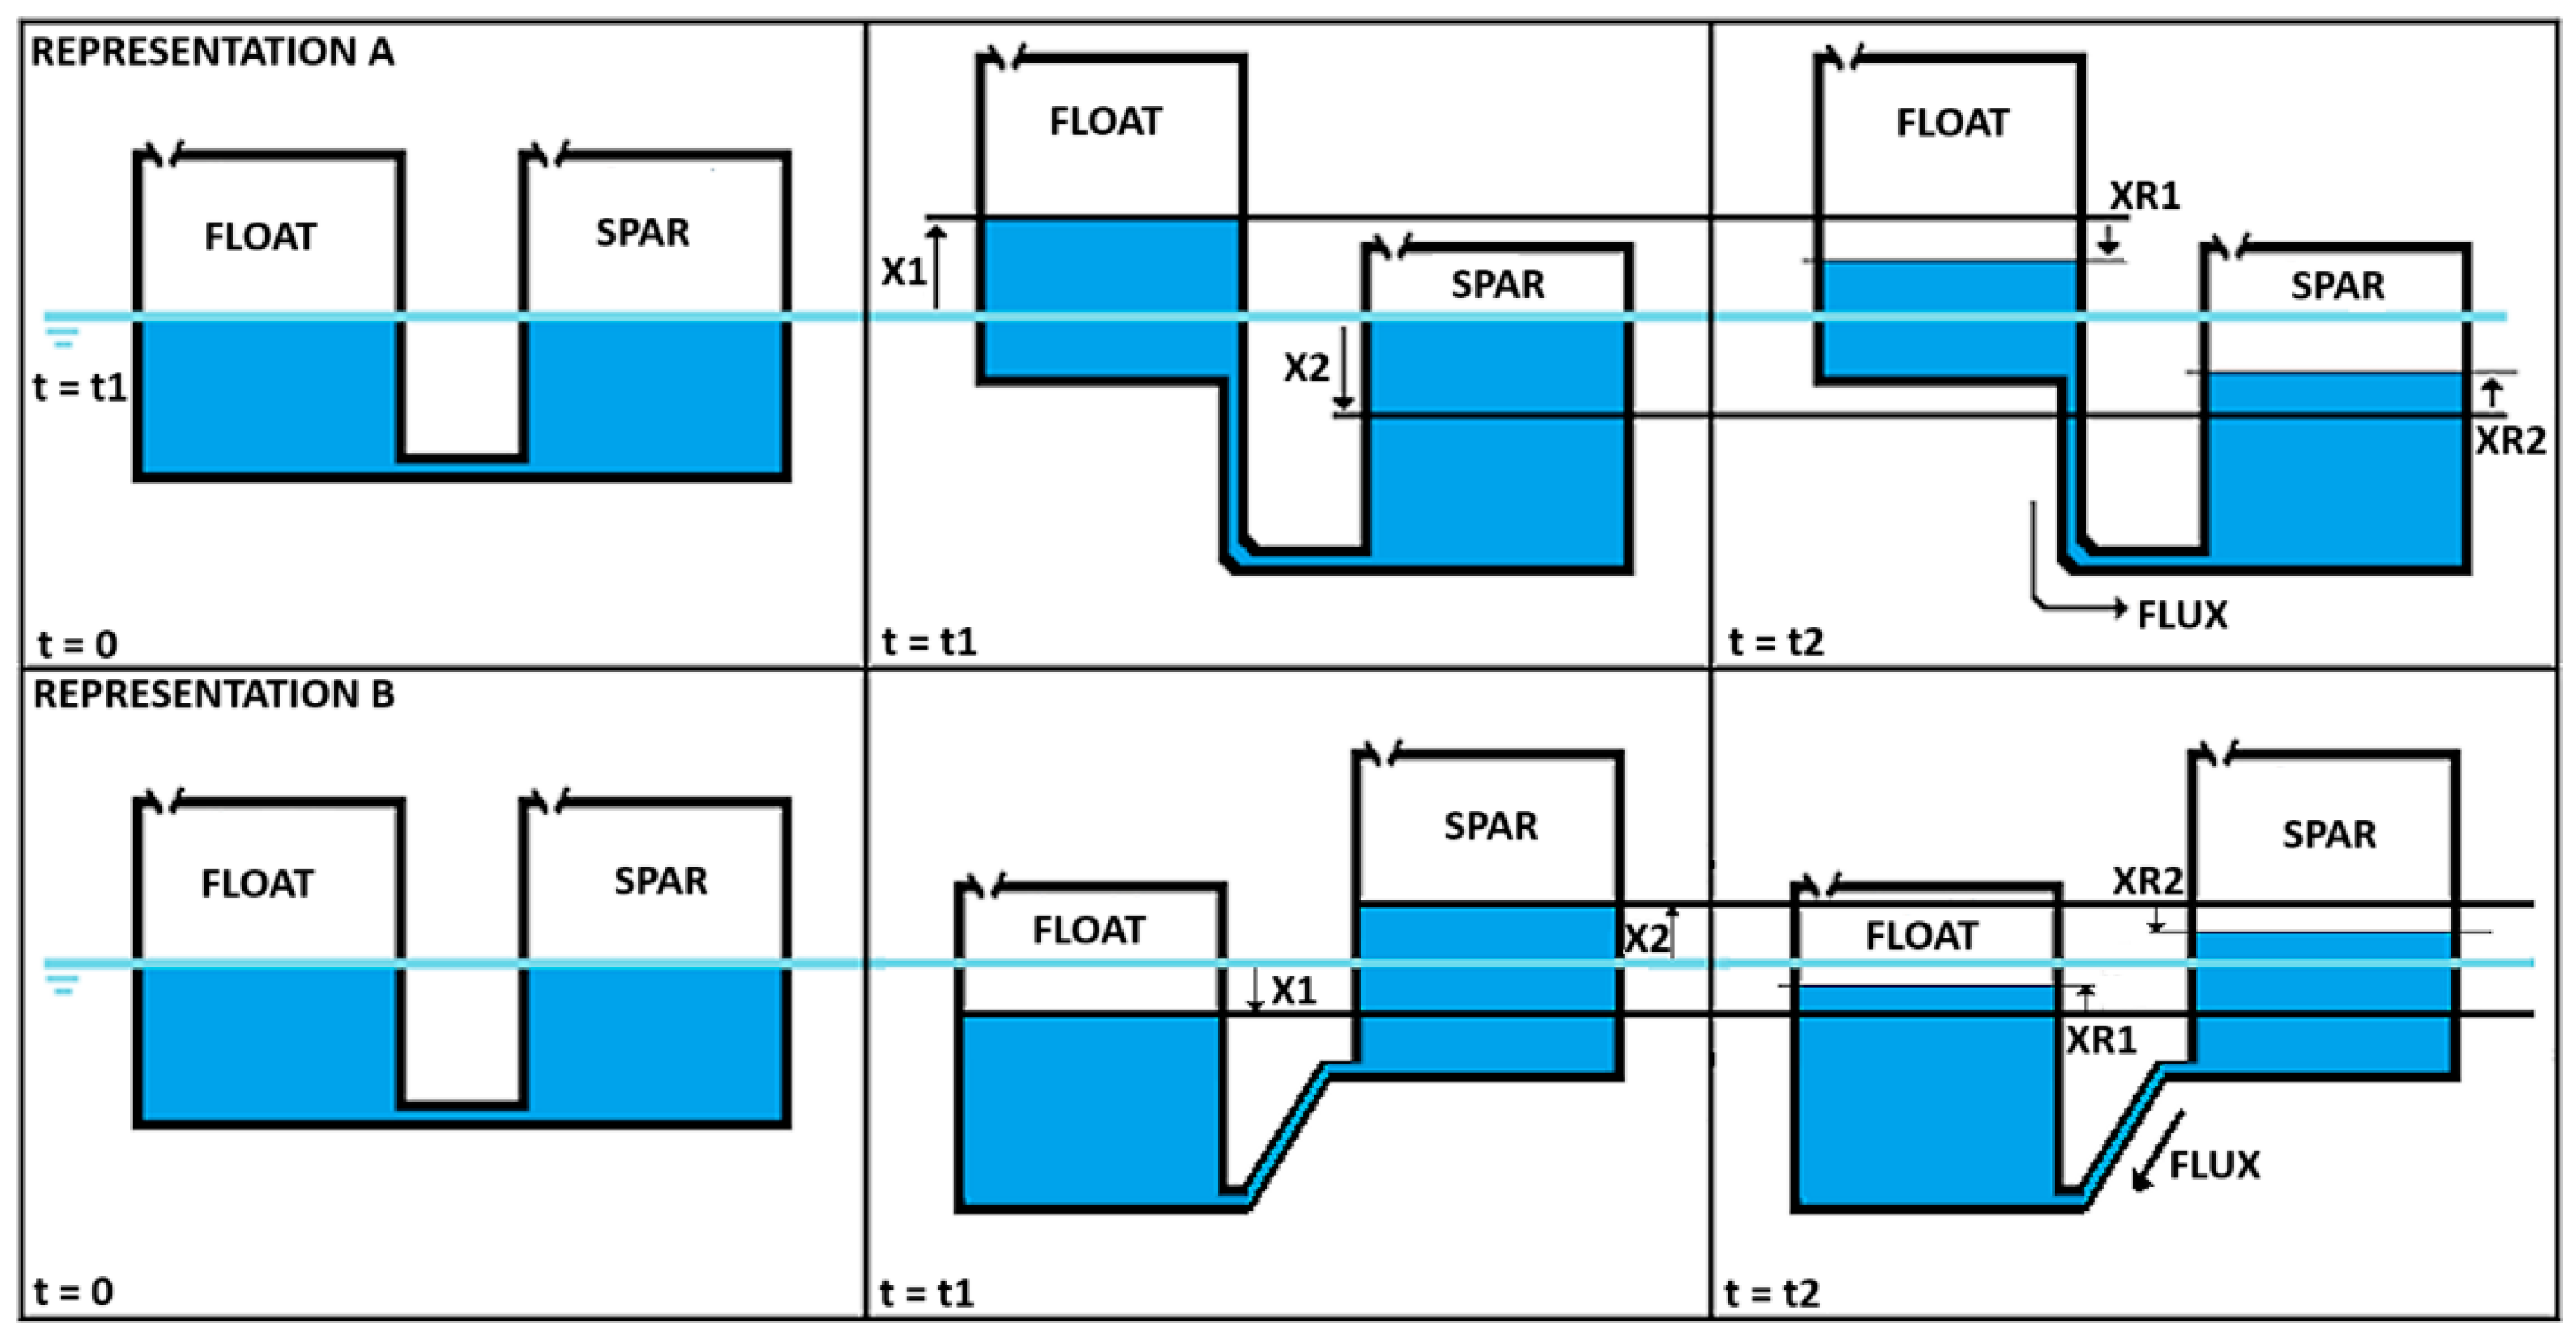
2.1. Conceptual Approach

For the purpose of this study, the base WEC configuration is built on one particular category: point absorber WECs, such as Wedge Global W1 [15], OPT PB3 [16], or C·Power L10 [17], among many others. Point absorbers are suitable for a wide range of sea states and locations because of their ability to harness heave motion energy from any direction (omnidirectional) while capable of being compact and modular. Heaving buoys are the most extended wave energy converter technology when categorized by working principle [18]; in particular, point absorption represents 97 out of 181 wave technology developments (54%) listed in the PRIMRE database [19], standing on top of any other marine renewable energy technology, including tidal developments.
The following components of the WEC will be discussed in relevant parts of this study: (I) prime mover [20], the structural body responsible for capturing the wave motion, also referred to as body 1 or floater in this manuscript; (II) primary structure [21], the main structural body responsible for safekeeping the system together with the foundation, floating or fixed, also referred to as body 2 or spar in this manuscript; (III) electric generator or Power Take Off (PTO), capable of transforming mechanical energy into electrical energy; and (IV) Negative Spring System, referred to as Natural/Forced Hydro System (N/FHS), the main topic for this investigation.
The proposed concept is initially inspired by CorPower Ocean’s WaveSpring Technology [22]; it is designed with a passive pneumatic machinery element acting between main bodies, which improves energy conversion efficiency by introducing a negative spring destabilization force. Negative spring-related concepts can be found among other recent developments, proposing alternative technical solutions such as an adjustable-stiffness magnetic torsion spring designed to enhance WEC performance, particularly in low-frequency waves where negative PTO stiffness is often required [23]; compressed air acting similarly to a spring effect in floating coaxial-duct oscillating-water-column WECs, revealing that air compressibility can either positively or negatively affect the energy performance of the device in regular waves, depending on the frequency’s alignment with critical values [24]; an analysis on spacing ratio impact on the energy conversion of three interacting floating bodies, revealing that as the distance increases, the interaction between the floating bodies decreases [25]; a methodology to correct physical model testing results of oscillating-water-column WECs that accounts for the air compressibility effect, finding that air compressibility can either negatively or positively affect power conversion, depending on the wave period in relation to a critical value predicted by the theory [26]; an adaptable mechanism for broadband energy harvesting, finding that a bistable mechanism introduces both negative and positive stiffness to the device, which affects its power capture capability, and this stiffness variation is dependent on the wave frequencies, with negative stiffness at low frequencies and positive at high frequencies [27]; and a negative spring mechanism acting directly on the rotary gear generator system for phase control, finding that a negative spring mechanism, when used in parallel with the power take-off machinery, can increase the average converted power [28].
Several factors may limit the effective implementation of these technologies. Magnetic springs could face issues with magnetic field strength and energy loss from eddy currents. Air-compressed springs might deal with inconsistent pressure and leakage, affecting efficiency. Synchronization and energy transfer can be difficult for spaced prime movers, while reaction masses might pose problems due to their size, weight, and complexity. Bistable mechanisms risk stability and control challenges in varying sea conditions. Electrical phase control systems are potentially limited by the accuracy and speed of electronics and energy losses during conversion. These potential limitations are significant when attempting to surpass the efficiency barrier essential for implementing Wave Energy Converters.
When tackling the energy efficiency challenge of WEC technology, there are numerous reasonable strategies. As seen before, the diversity within the sector suggests the potential for innovation and the necessity for diverse, complementary, and interoperable technical solutions to cater to the unique demands of each type of Marine Renewable Energy Converter. Therefore, our approach to the solution starts by identifying limitations and opportunities to be explored, as follows: (I) A self-contained system for broad interoperability with various WECs; our solution is composed of water reservoirs and hoses, which are easily removed and installed in different configurations, avoiding the need for system synchronization or specific interconnectivity or integration with other singular systems. The NHS can enhance the efficiency and performance of a wide range of WECs without requiring significant modifications or adjustments. This also reduces the complexity and cost of the system, as well as the potential risks of failure or malfunction. (II) Environmental and operational sustainability, using eco-friendly materials such as seawater, steel, and composite and sustainable operation methods reduces the environmental impact of the wave energy conversion system, as well as the operational and maintenance costs. By avoiding the use of chemical solutions, oils, or other substances that might leak or contaminate the seawater, the system preserves the marine ecosystem and avoids potential fines or penalties. By using seawater as the main working fluid, the system also reduces the need for additional components or materials that might increase the weight, complexity, or cost of the system. Furthermore, by adopting sustainable operation methods, such as passive operation, the system minimizes the energy consumption and the wear and tear of the components, extending the lifespan and reliability of the system.
As a result, the proposed NHS leverages the concept of reaction masses and a bistable mechanism, as a system composed of a pair of seawater masses being transferred passively between structural steel components of the WEC and designed to dynamically alter the natural movements of a specific WEC component or components under external forces, aiming to expand the operational resonance frequency range.
Additionally, we explore the possibility of enhancing the performance by using water pumps to control the flow velocity of the seawater masses (FHS). This would allow us to optimize the timing and magnitude of the mass transfer, as well as to overcome the effects of friction and inertia that might reduce the efficiency of the passive operation. While outside of our design criteria, as water pumps are an active and failure-prone system, we cannot discard an active system that supports our solution without any metrics on performance.

2.2. Relevance of the System

One of the main challenges in wave energy conversion is achieving a high efficiency over a wide range of wave frequencies. A common way to measure the performance of a Wave Energy Converter (WEC) is by its capture width ratio (CWR), which is the ratio of the absorbed power to the incident wave power per unit width. The capture width ratio depends on the hydrodynamic characteristics of the WEC, such as its shape, size, and mass distribution, as well as the wave conditions, such as the wave height, period, and direction. Ideally, a WEC should have a high capture width ratio for all possible wave frequencies, but this is not feasible in practice due to physical limitations and economic constraints.
Therefore, it is important to design a WEC that can adapt to the varying wave frequencies and maximize its energy extraction. One way to do this is by tuning the natural frequency of the WEC to match the dominant wave frequency, which results in a resonance phenomenon that amplifies the WEC motion and power output. The natural frequency of a WEC is determined by its stiffness and mass, which are inherent properties of the device that depend on its geometry and material. However, these properties can also be modified by external factors, such as the presence of a Power Take-Off (PTO) system, a control strategy, or an auxiliary system that can alter the effective stiffness and mass of the WEC.
Therefore, the objective of the system under evaluation is to widen the resonance band of a given WEC to a particular range, ultimately seeking an increase in power performance. For clarity reasons, we will refer to Figure 1; this figure is the representation of an ideal system operation. Blue columns refer to the right vertical axis and represent the number of events as a percentage; a particular wave peak period occurs as a summation of all wave height combinations. This information is relevant because we want the predominant wave frequency to match the natural frequency of the base WEC to achieve the so-called resonance operation; this design process is what gives us a power peak at 0.97 rad/s.
The orange area in Figure 1 represents the energy generated (kWh) for the base WEC, and the green area, which sums to the previous one, represents the energy generated (kWh) for the same WEC with an additional negative spring system. It is relevant to remark on the following characteristics and limitations: (I) While the maximum power (70 kW) can be enhanced, an increase in the maximum rated power may imply a PTO substitution, and this may go against cost effectiveness and limit the interoperability of the proposed system for existing WECs. (II) The resonance tuning adjust the natural frequency of the WEC to bring it closer to that of the waves—between 1.26 and 0.60 rad/s, the near-resonance operation is no longer limited to 0.97 rad/s, and the power extracted is increased as a result. (III) While the near-resonance operation range can be widened, it is still limited to a certain number of frequencies in the depicted situation, −0.37 to 0.29 rad/s; this provides evidence for a limitation in the interoperability given that the base WEC needs to be designed according to the relevant wave scenarios.
Therefore, our goal is to develop a system that is resilient (passive control, simple mechanism), interoperable (self-contained), and economic (materials, components). This system should enhance the energy efficiency of a base WEC while minimizing capital (material) and operational (resilient) expenditures, ultimately lowering the levelized cost of energy (LCOE) for wave energy technology, a crucial indicator of any energy technology’s market readiness.
In summary, this research presents a novel N/FHS design that enables real-time adjustments to a Wave Energy Converter’s natural frequency during operation. This is achieved by varying the device’s effective mass through transferring seawater between its compartments. The active management of water movement alters the effective mass and, thus, the natural frequency of the system:
ω n t = k m + m ˙ i t
where “k” is the stiffness of the system, and “m” is the mass of the analyzed body. This equation illustrates how slight variations in mass distribution can significantly affect ω n , thereby tuning the system’s natural frequency. Achieving an optimized resonance condition, where ω n = ω w a v e s , enables the system to maximize energy extraction efficiency. Such alignment is essential for the WEC to dynamically adapt its response to varying sea states, thereby enhancing energy capture efficiency and improving overall system performance.

3. System Description

3.1. Model Statement

To model the dynamics of a floating body under wave excitation, we need to consider the effects of both hydrostatic and hydrodynamic forces on the body’s motion. Hydrostatic forces are the result of gravity and buoyancy, while hydrodynamic forces include added mass, radiation damping, wave excitation, and viscous drag [29]. These forces depend on the body’s shape, size, orientation, and position relative to the water surface. A common approach to simplify the analysis is to decompose the body’s motion into six degrees of freedom: heave, surge, sway, roll, pitch, and yaw. Each degree of freedom can be represented by a second-order differential equation that relates the displacement, velocity, and acceleration of the body with the external forces acting on it.
Equation (2) shows an example of such an equation for a given degree of freedom. By solving these equations for each degree of freedom, we can obtain the response of the body to the wave input and the power output of the system.
m i + m r , i ω η ¨ i + R r , i ω η ˙ i + S η i = F e x t , i
where m i is the mass of the floating body “ i ”; ω is the frequency of the external waves; m r ω is the added mass; η i is the displacement from a reference position; R r ω is the radiation damping coefficient; S is the hydrostatic stiffness of the system; and F e x t are external forces acting on the system.
Nonetheless, for an effective initial assessment of this method during the early conceptual phases, some baseline assumptions about the model must be made: (I) regular wave input of angular frequency: this assumption reduces the complexity of the wave spectrum and allows for a linear analysis of the wave-body interaction; (II) disregard drag and wave drift: these effects are usually small compared to other represented forces, and they can be neglected for a preliminary design or analysis of the system; (III) disregard other external forces, such as current, mooring, and PTO, because they either have a negligible impact on the body’s motion or can be compensated by the control force. For example, current can be considered as a constant force that does not affect the resonance condition, mooring can be designed to minimize the restriction on the body’s movement, and PTO can be adjusted to match the optimal damping for maximum power extraction.
Additionally, a Wave Energy Converter (WEC) with variable mass involves dynamic interactions between the floating bodies and the seawater within their storage units. This system exhibits coupled degrees of freedom—the heave motion of the floater and spar and the transfer of water affecting the mass distribution dynamically. Following the framework provided by Livija Cveticanin [30], the fundamental equations of motion for a body with variable mass can be represented by:
d d t M ( t ) v ( t ) = F e x t + F r e a c t i v e
where M(t) is the variable mass of the system, changing as water moves between compartments; v ( t ) is the velocity of the center of mass of the system; and F r e a c t i v e is the reactive force due to the mass variation given by F r e a c t i v e = M ˙ ( t ) u , where u is the velocity at which mass is added or removed.
In the context of our WEC system, the equations of motion adapt to the mass flow between the floater and the spar, as well as the variable mass dynamics of the water. Hence, the modified motion Equation (1) incorporating these aspects is:
d d t m i ( t ) + m r , i ω , t η ¨ i + R r , i ω , t η i ˙ + S i t η i = F e x t , i + m ˙ t η ˙ i
where m ˙ ( t ) is the mass flow rate of the system with respect to time. This term arises due to the mass transfer between components in the system.
The N/FHS operation principle amplifies movements in the direction of the WEC body’s motion, thus enhancing its movement. This ‘Hydro’ system utilizes seawater and works by shifting a specific water mass between two tanks with distinct shapes and capacities through a physical interface. The water transfer happens when ocean waves or another external force creates a relative motion that leads to a height disparity between water levels in the system.
To explain the model better, Figure 2 shows how the float and spar seawater reservoirs work under two scenarios. Representation A shows the float reservoir moving upwards and the spar reservoir moving downwards following the wave, while representation B shows the opposite situation, with the floater moving downwards and the spar moving upwards.
Based on representation A, the next steps are formulated using the difference in water levels caused by the float’s upward movement with the wave to drive the water flow in the system:
Δ h t = η 1 x R 1 η 2 x R 2
where η 1 and η 2 are the vertical displacements of the floater and spar, respectively; and x R 1 and x R 2 are the height variations of the water sheet in the floater and spar storages, respectively.
According to hydrostatic principles, this height difference results in a pressure gradient along the hose, which, in turn, induces water flow. This movement is further influenced by the accelerations of the floater and spar, which dynamically alter the effective pressure exerted on the water columns:
P d y n a m i c = ρ g e f f h t = ρ ( g + η ¨ f η ¨ s ) h t
The acceleration of water in the hose is derived from Newton’s second law:
x ¨ h = P d y n a m i c ρ A h = ( g + η ¨ f η ¨ s ) h t A h
where A h is the cross-sectional area of the hose. The velocity of the water in the hose is an immediate outcome:
x ˙ h t = 0 t x ¨ h τ d τ
Additionally, the fluid—water—is assumed to be incompressible; therefore, the magnitude of the mass flow rate is the same for the entire system, and water sheet variation velocity can be easily calculated as:
m ˙ h = m ˙ R i = m ˙ R i i
x ˙ h ρ H 2 O A h = x ˙ R i ρ H 2 O A R i = x ˙ R i i ρ H 2 O A R i i
x ˙ R i = A h A R i i x ˙ h
From this point on, we need to integrate the velocities calculated from (11) along with the cross-sectional areas to find the mass flow rates from (4):
m ˙ i t = ρ H 2 O A R i 0 t A h A R i   x ˙ h   d τ = ρ H 2 O A R i x R i t  
This outcome is an important dynamic interplay to optimize the WEC operational efficiency, related and included within the overall mathematical model governing the behavior of the WEC, particularly regarding the foundational dynamic equilibrium Equation (4):
d d t m i ( t ) + m r , i ω , t η ¨ i + R r , i ω , t η i ˙ + S i t η i = F e x t , i + ρ H 2 O A R i x R i ( t ) η ˙ i

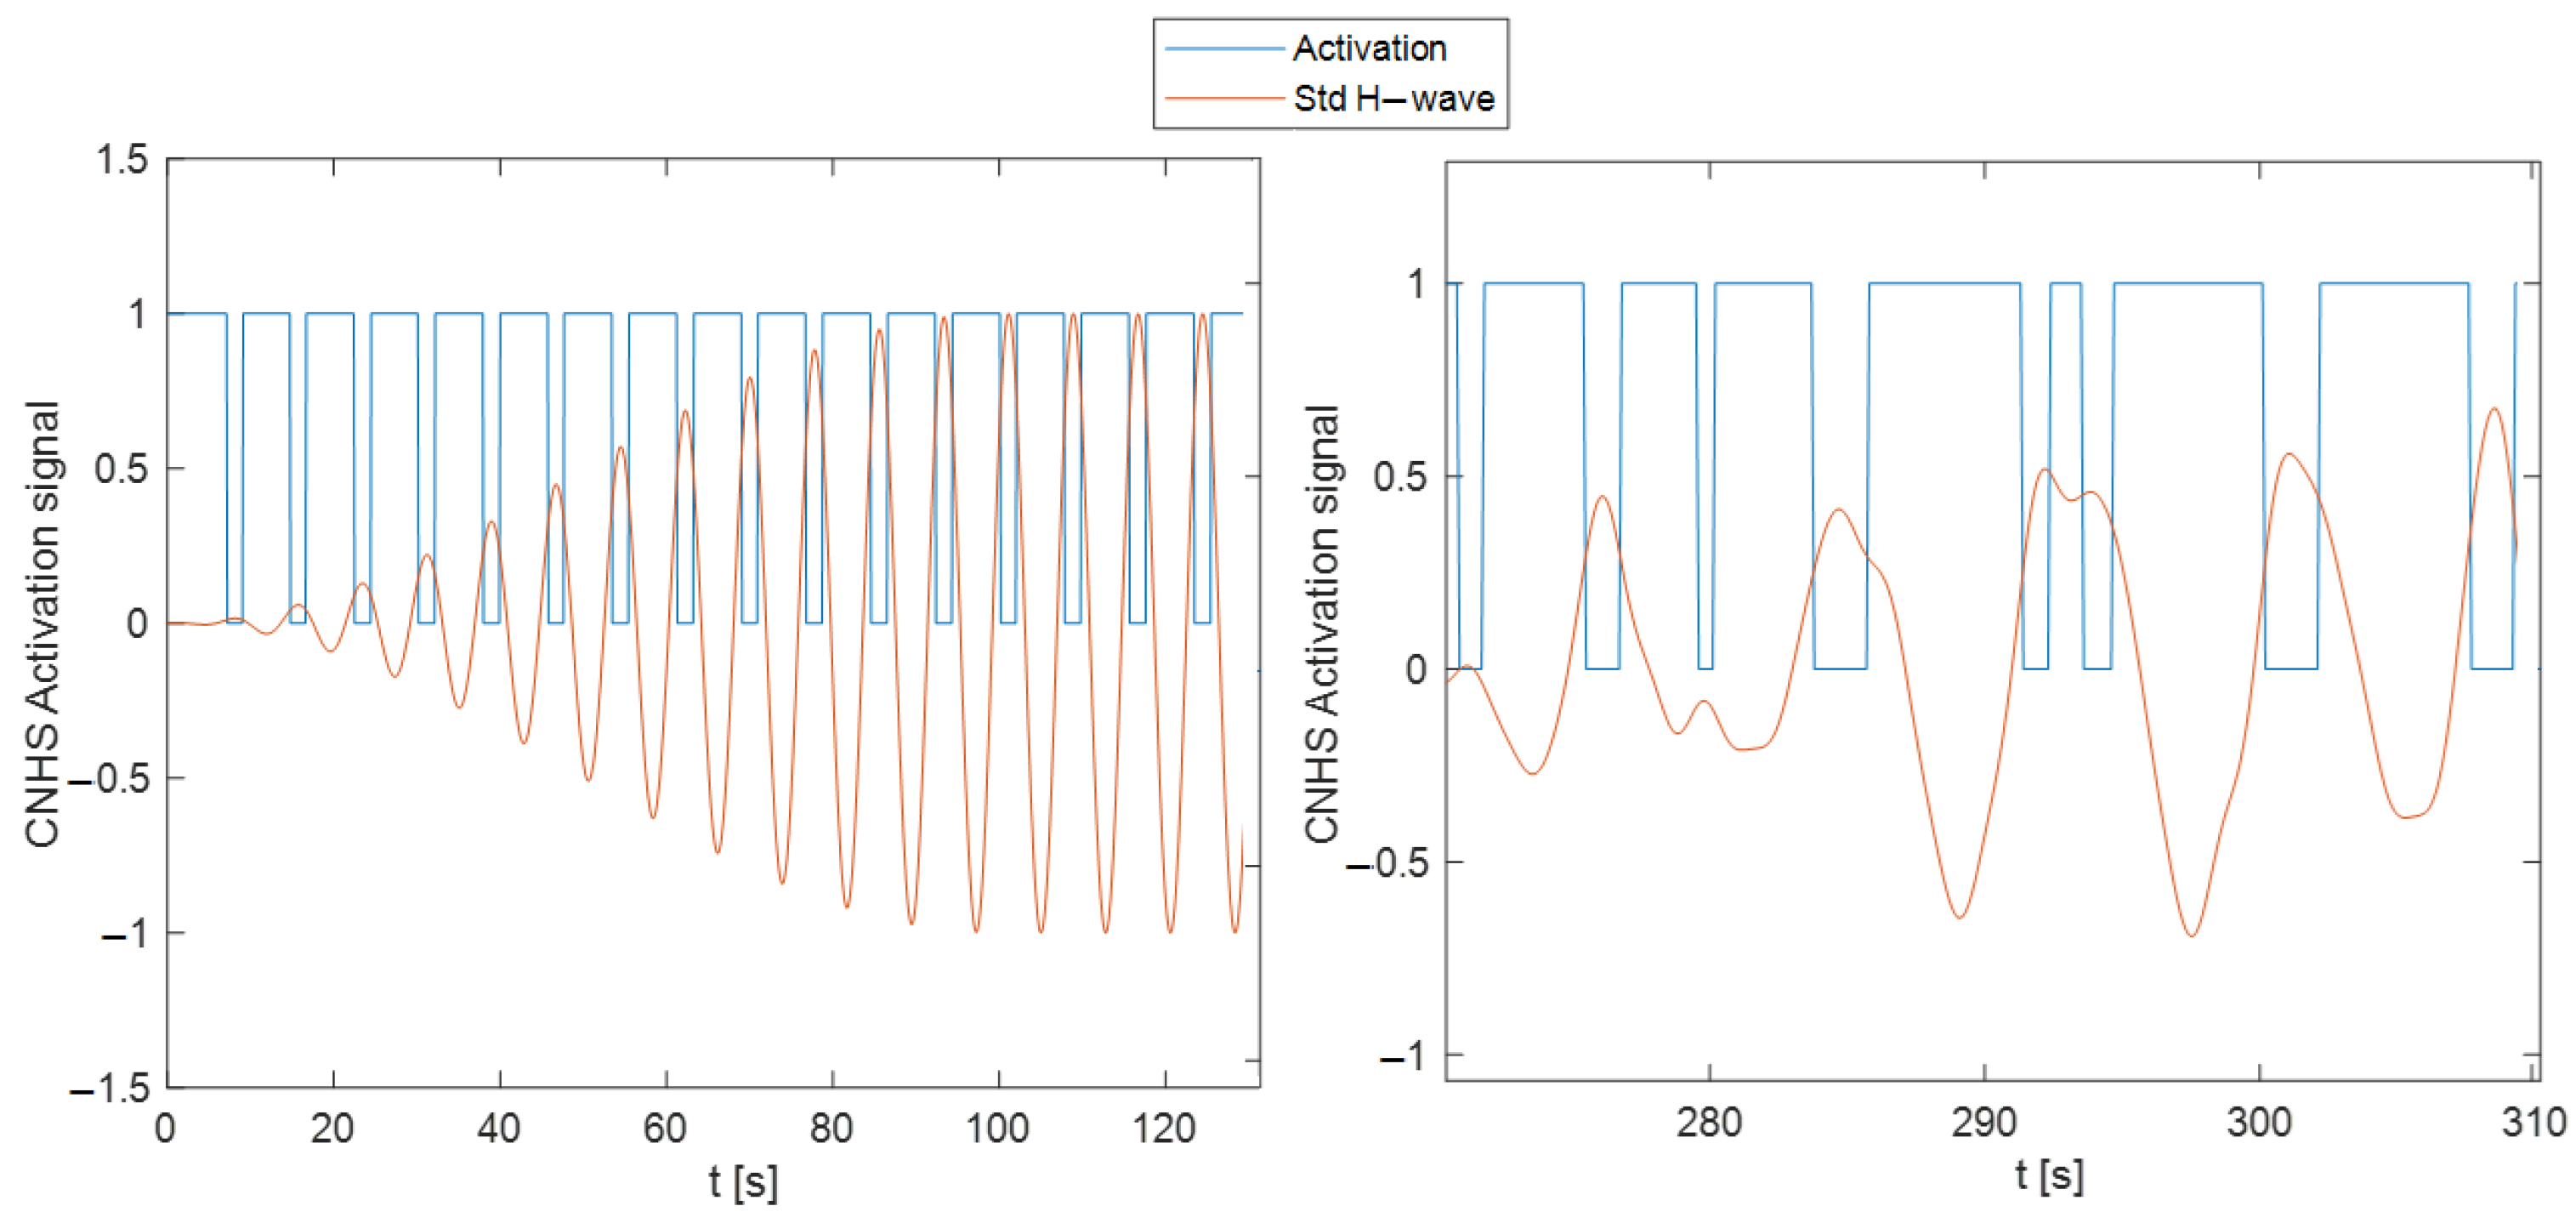
3.2. Model Implementation
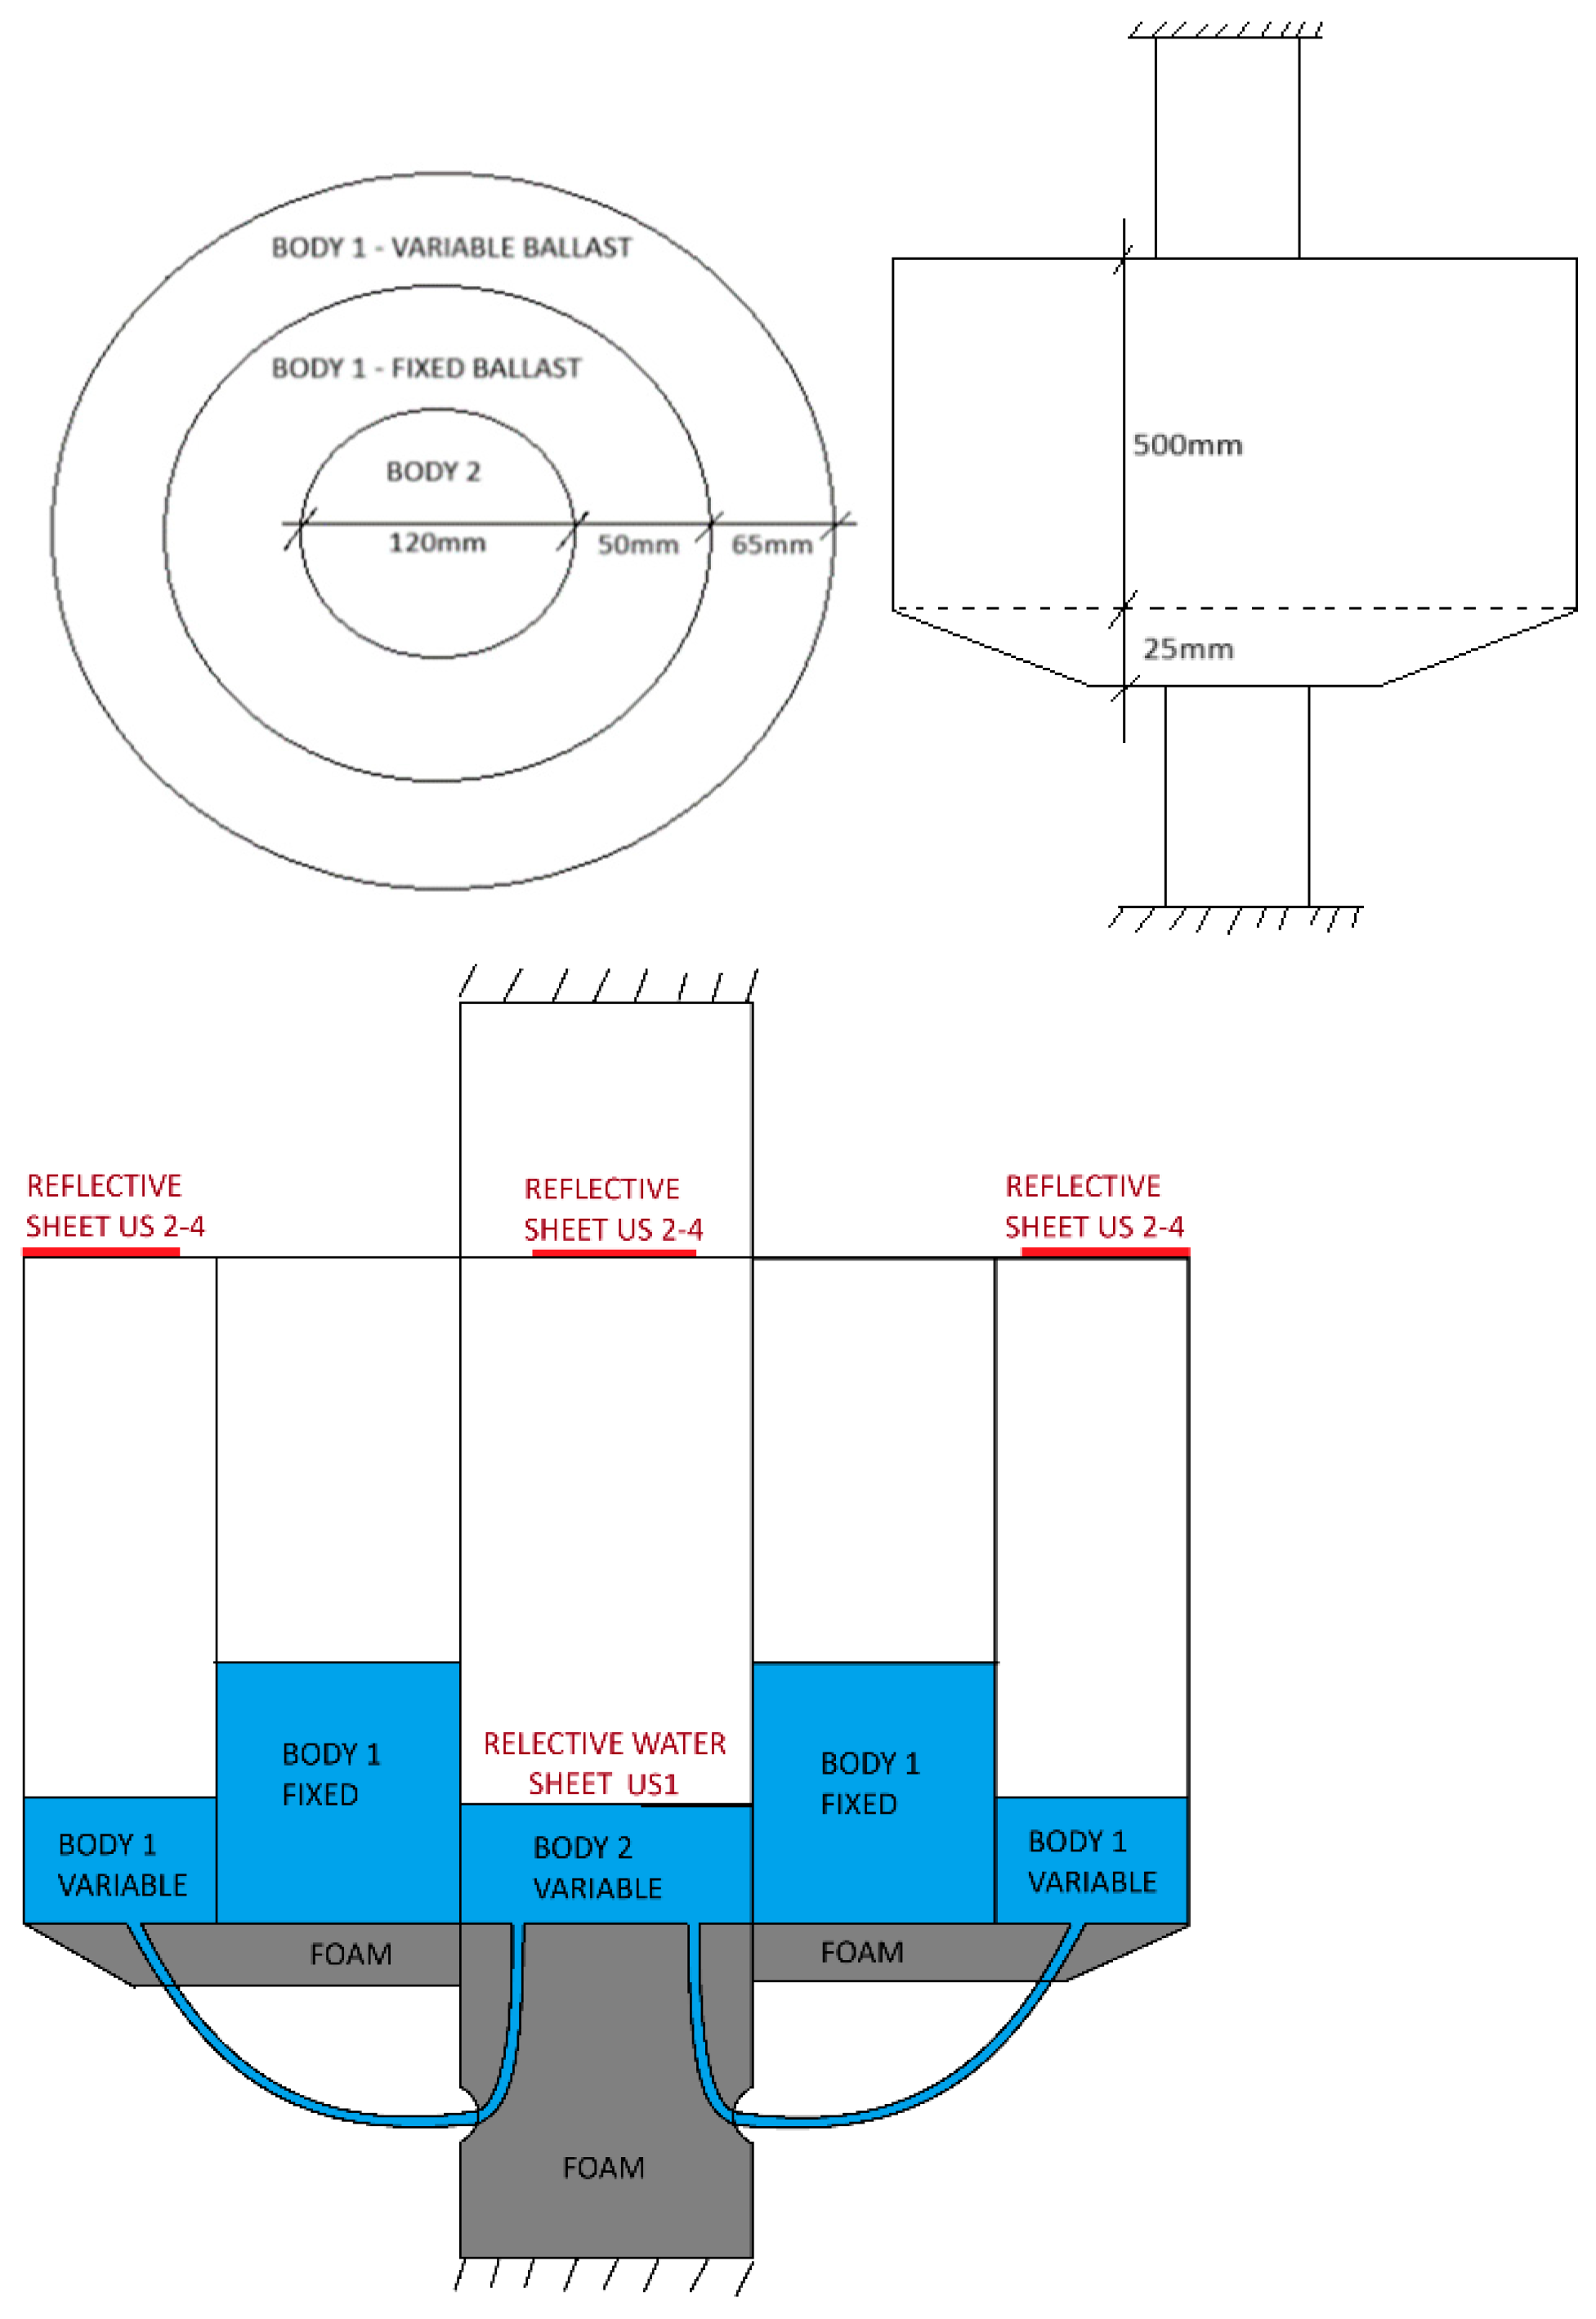
The numerical model has been implemented by means of the well-known simulation tool WECSIM, developed within the MATLAB/SIMULINK environment [31]. The objective of the numerical model is twofold: firstly, to compute complete power matrices for irregular seas using a JONSWAP spectrum (gamma 3.3), enabling us to assess the efficiency gains in our specific case study. Secondly, it is to validate scaled floater dynamics for regular wave patterns and decay tests, allowing for the correlation of the numerical model against experimental data.
The parameters outlined in Table 1 have been chosen to reflect standard wave conditions to ensure that any energy efficiency outcomes are straightforward to interpret. Meanwhile, the parameters detailed in Table 2 consider the physical constraints of the wave flume to facilitate direct validation of the dynamic responses.
To test the proposed strategies, the N/FHS model assumes no head losses. The hydrodynamic parameters of the WEC prototype floater geometry, required as an input for the MATLAB model, are calculated with Boundary Element Method (BEM) software. Hydrodynamic parameters are determined separately for both proposed scenarios: (I) analyzing efficiency impact with the full-size floater solution and (II) validating physical testing with the scaled prototype, which includes manufacturing deviations over the model.
To account for the NHS force in the SIMULINK numerical model, we resort to the law of conservation of volume. Additionally, we assume x R i η i for each time step, which allows us to linearly relate the displacement of the body to changes in the water level. This approach is commonly utilized in WEC analysis [32] due to the nonlinear complexities involved, especially in early modeling, reducing the complexity of the coupled system dynamics while maintaining a focus on the primary hydrodynamic interactions:
η i = A i i A i x R i
The NHS operation does not require any form of activation protocol, presenting a smooth wave-induced transfer between the main WEC bodies, as can be seen in Figure 3, which is a randomized visual representation of regular (left) and irregular (right) numerical tests during the initial stages of NHS modeling, where the height of body 1 (red) and applied load on body 1 (blue) values have been standardized between [−1, 1] to facilitate visual interpretation.
For the FHS, we need to consider a couple of additional assumptions: (I) Instant water mass or force transmission between bodies. A large number of water pump solutions can already be found in the market, so it is considered reasonable that a pump with sufficient power can be found to achieve a situation close to the one proposed here; the extreme case (infinite power) is analyzed in order to establish a contour limit. (II) Wave prediction. The pump control system needs to operate under real-time wave parameter information; this particular simplification is not solved yet by any commercial solution, and it is not the purpose of this work to analyze a wave predictor, so the wave generation seed is fed to the model as a prediction seed. As such, the activation in FHS is assumed as a binary step function based on relative position and velocity. The system is prepared to detect the direction of the movement, imposing the complete force on the corresponding body when a certain amount of the complete wave cycle is reached. This behavior can be seen in Figure 4, following the same color and standardization criteria as in Figure 3; in this figure, the activation binary step is clearly present and acting as expected.
The associated SIMULINK model is composed of typical WECSIM modules, including one global reference, one fixed spar body (constrained to global reference), one translational PTO (constrained to spar), and one heaving floater (constrained to PTO). Additionally, the negative spring model connects spar and floater bodies, imposing the destabilizing force exchange between the bodies.
Finally, to evaluate the effect of the model on the wave energy conversion efficiency (power matrices), it is mandatory to analyze an energy-related indicator in the later stages of the study. The electrical generator will be represented numerically from a prototype-calibrated model provided by a recently finished H2020 project, the SEA-TITAN project [33]. The model considers the relative bodies’ force and velocity output information, and the electrical generator control system is considered Constant Damping Control [18] for simplification purposes:
f p t o t = B p t o v ( t )
P p t o t = f p t o t   v ( t )
where B is the constant damping control parameter set at 2 × 10⁵ N/(m/s) for this research purpose, and P p t o is the power extracted.

3.3. NHS Prototype

The prototype prepared for this study is based on a 1:20 scale model of Wedge Global W1 Floater; the reason for this selection is the amount of geometric and mass data available for the researchers directly from the manufacturer company. We included additional height in the portion of the floater not in contact with the water to provide extra protection against water splash and to offer more options for sensor installation. This additional height does not affect the model’s performance, as the material used has low density (PLA), and the added geometry does not come into contact with the water.
The testing prototype is constructed from three main components: (I) water interfaces, including hoses and connectors between the floater and spar ballast tanks; (II) the floater, which is the main body internally divided into two sections—one for variable ballast connected to the spar’s ballast tank and the other for fixed ballast to ensure stability; (III) the spar, which is the main body featuring an internal water tank connected to the variable ballast tank in the floater, also incorporating a linear guiding system for the floater.
The main bodies were 3D-printed in green PLA prior to assembly. Due to size constraints, the floater had to be divided into quarters, and the joints were made waterproof and secured to prevent any water leaks or infiltration into the system. One of the floater’s quarters was printed in transparent PLA to allow the movement of the water sheet to be visually monitored. The prototype is represented in relevant 2D views in Figure 5 and final installation in Figure 6 to facilitate visual interpretation of the final model prototype operated during the testing phase.
The final prototype included some additional materials: PVC clear hoses as the interface carrying the water between the prime mover and a PVC pipe for additional spar support and prototype-flume fixation.

4. Results and Discussion

4.1. Testing Conditions

We defined three different configurations based on the amount of water stored in the prototype water tanks, referred to as follows: (I) fixed ballast: water secured in the floater fixed ballast tank, included to provide an adjustable stability (through modifications in the inertia) across configurations, and (II) variable ballast: water dynamically transferred between floater variable tank and spar tank, affecting in real time the inertia of the main body (floater).
For the definition of testing configurations, we conducted a set of initial regular tests in the physical model with different parameters of fixed and variable ballast to identify limitations and expected outcomes; this preliminary step helps us understand the impact of ballast variations on the system’s behavior, ensuring that the selected testing configurations are both representative and efficient. We found a relevant limitation: any of the model alternatives are heavily influenced by the natural damping of the system. This damping is represented by the static ballast—the more reactive (unstable) the WEC is, the more impact the new model will have on the WEC. As such, if we do not have static ballast, we can theoretically maximize the energy conversion efficiency. Nevertheless, this finding is limited by the buoyancy and stability of the WEC, as we found in some tentative configurations where it became unstable when aggressively modifying the variable and fixed ballast parameters.
For clarity reasons during the discussion, we define the reactive indicator in Table 3 as the inverse relation between the variable ballast and the complete ballast (variable and fixed). The base configuration is defined as the selected WEC (Section 3.3) without the new model, serving as a baseline to measure the energy efficiency improvement. Extreme configuration is characterized by a low amount of fixed ballast (resulting in low inertia, high responsiveness to waves, and low stability) and a high amount of variable ballast and aims to assess how well the new model performs when the prime mover is already highly responsive. Finally, we defined the mild configuration as a balanced approach for stability purposes and the new model to improve the dynamic responsiveness of the floater.
Following the proposed model configurations, a total of 68 different regular wave scenarios are defined for testing. Some of them are made equivalent across different configurations to facilitate direct comparisons and assess the consistency and reliability of the results. These scenarios in Table 4, Table 5 and Table 6 are selected based on several factors: the limited time available for access to the wave flume, physical constraints, the wave generation capacities of the flume, and the anticipated outcomes from initial simulations. Specifically, the extreme configuration showed better functionality at higher periods, the mild configuration at lower periods, and the base configuration needs representation at both ends for comparison purposes. By prioritizing the most relevant scenarios and maintaining some consistency across tests, we ensured that the comparisons are meaningful and informative.

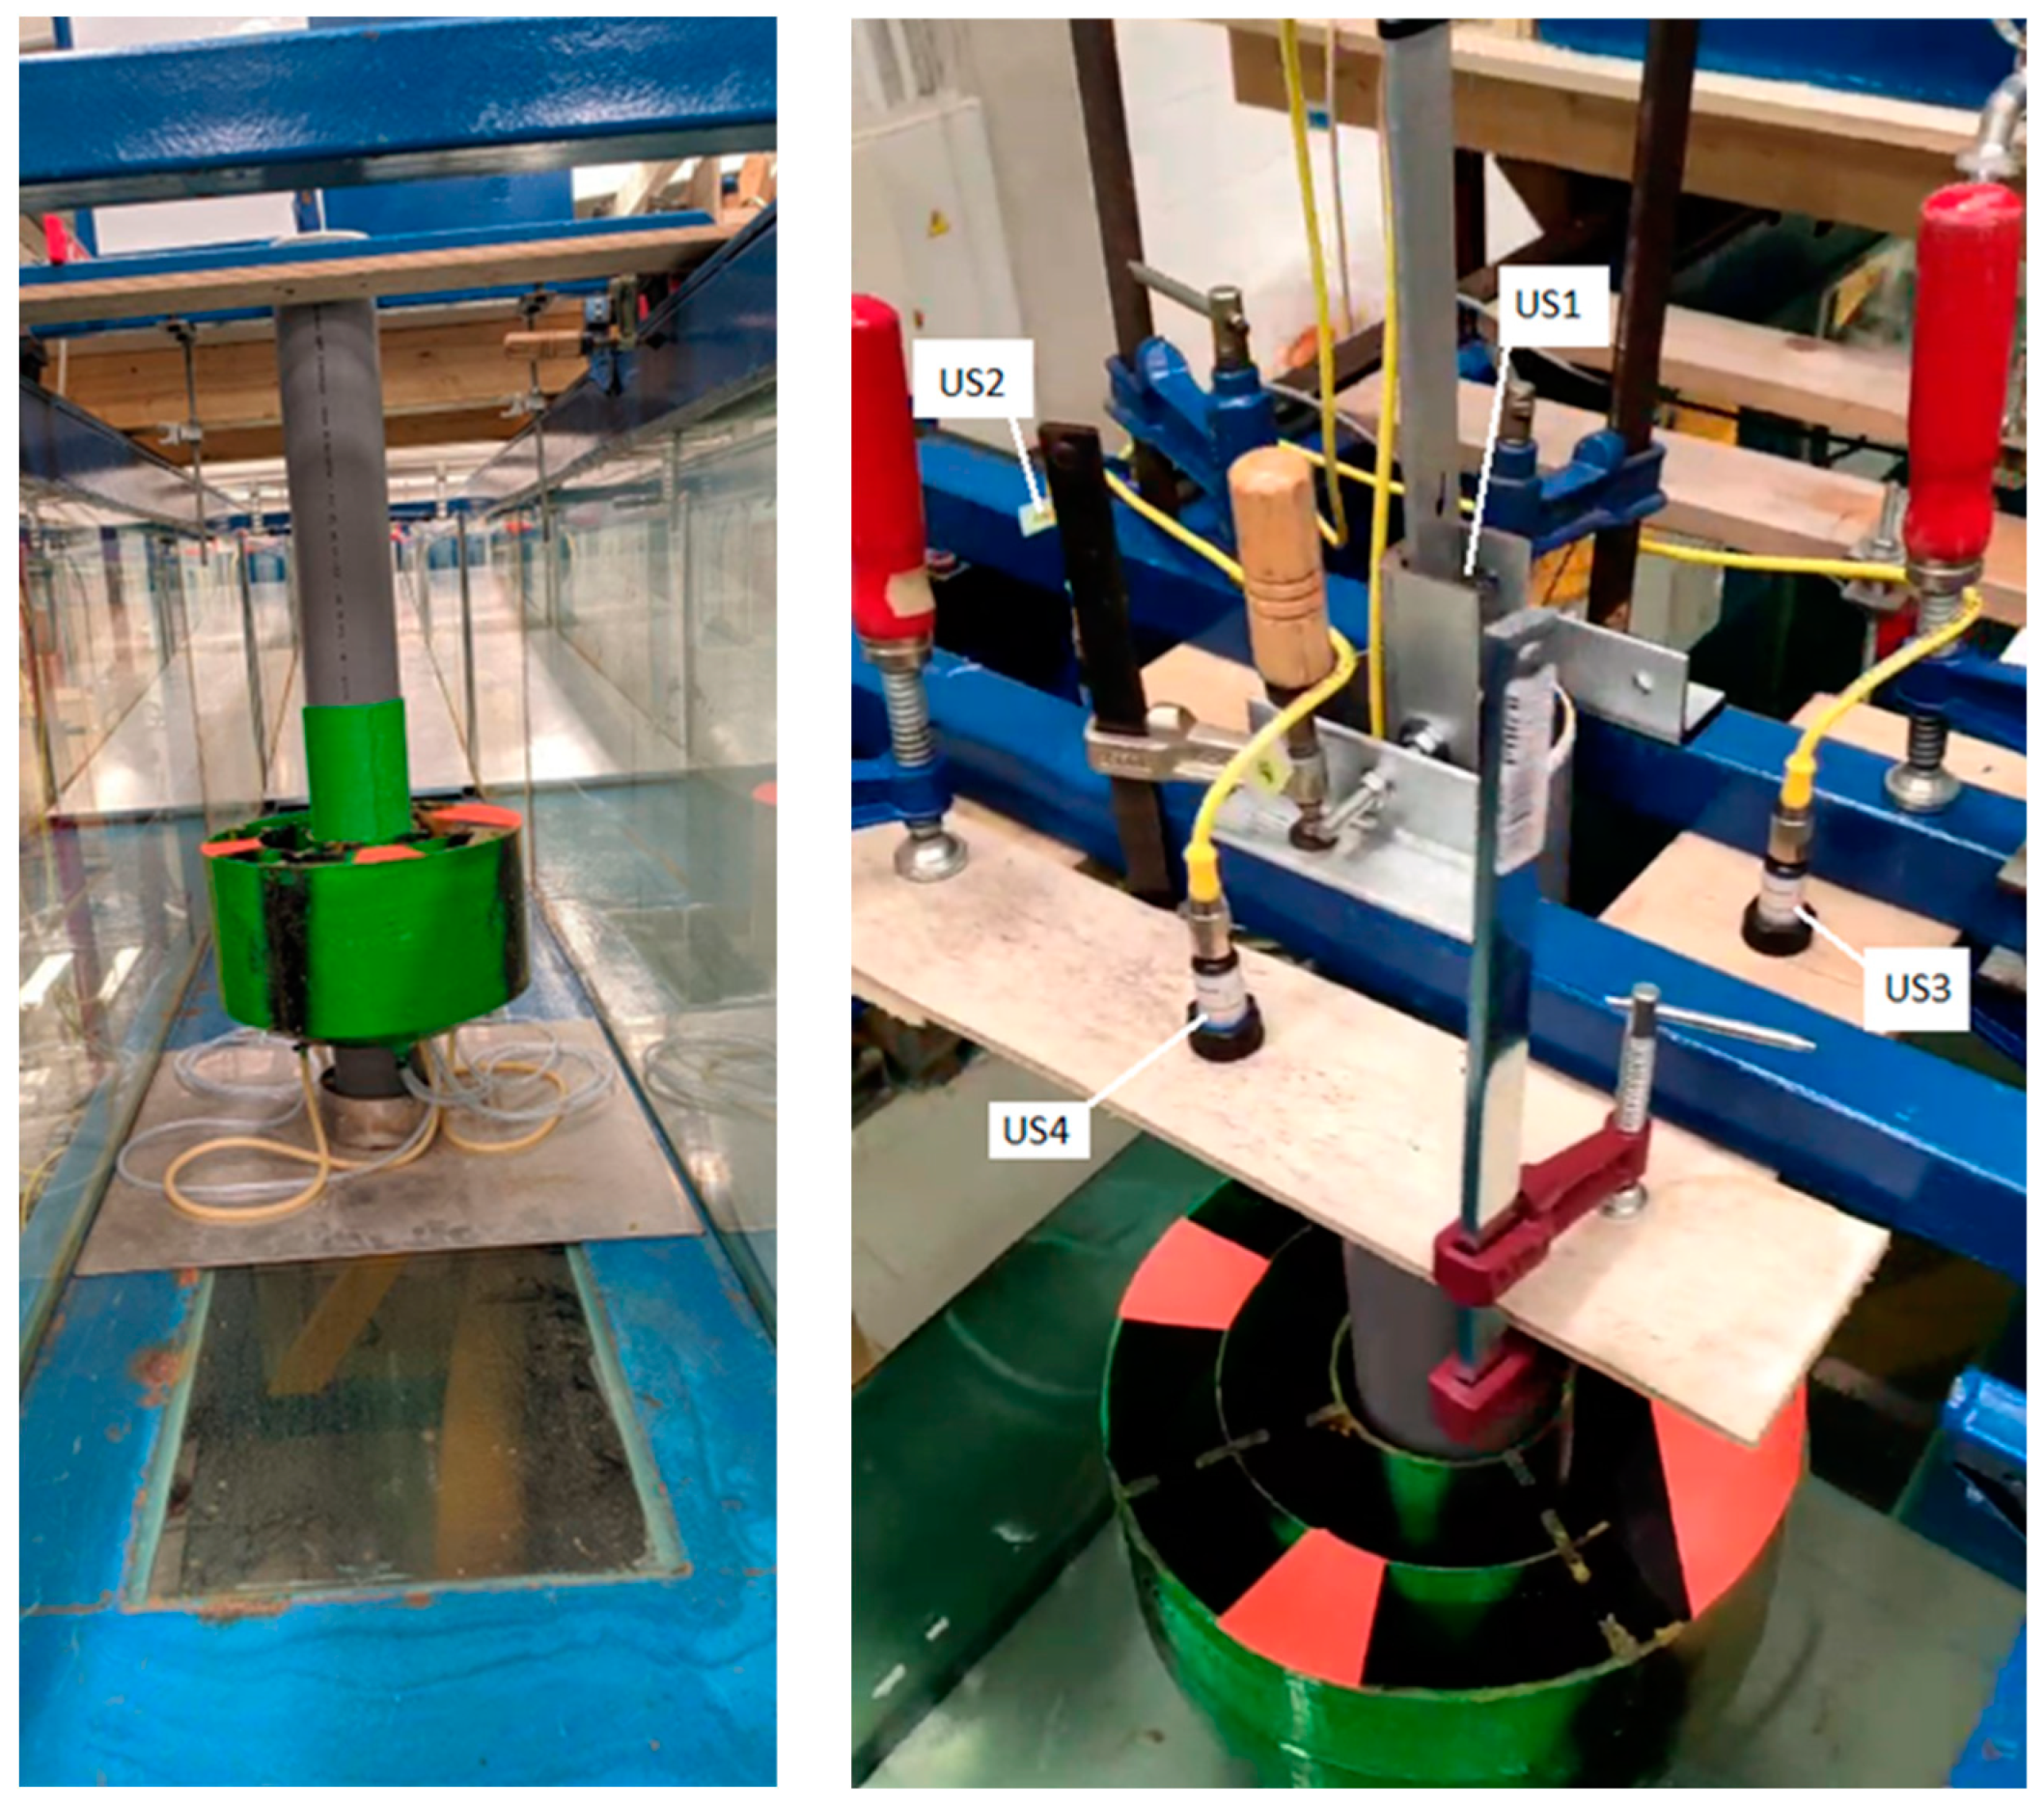
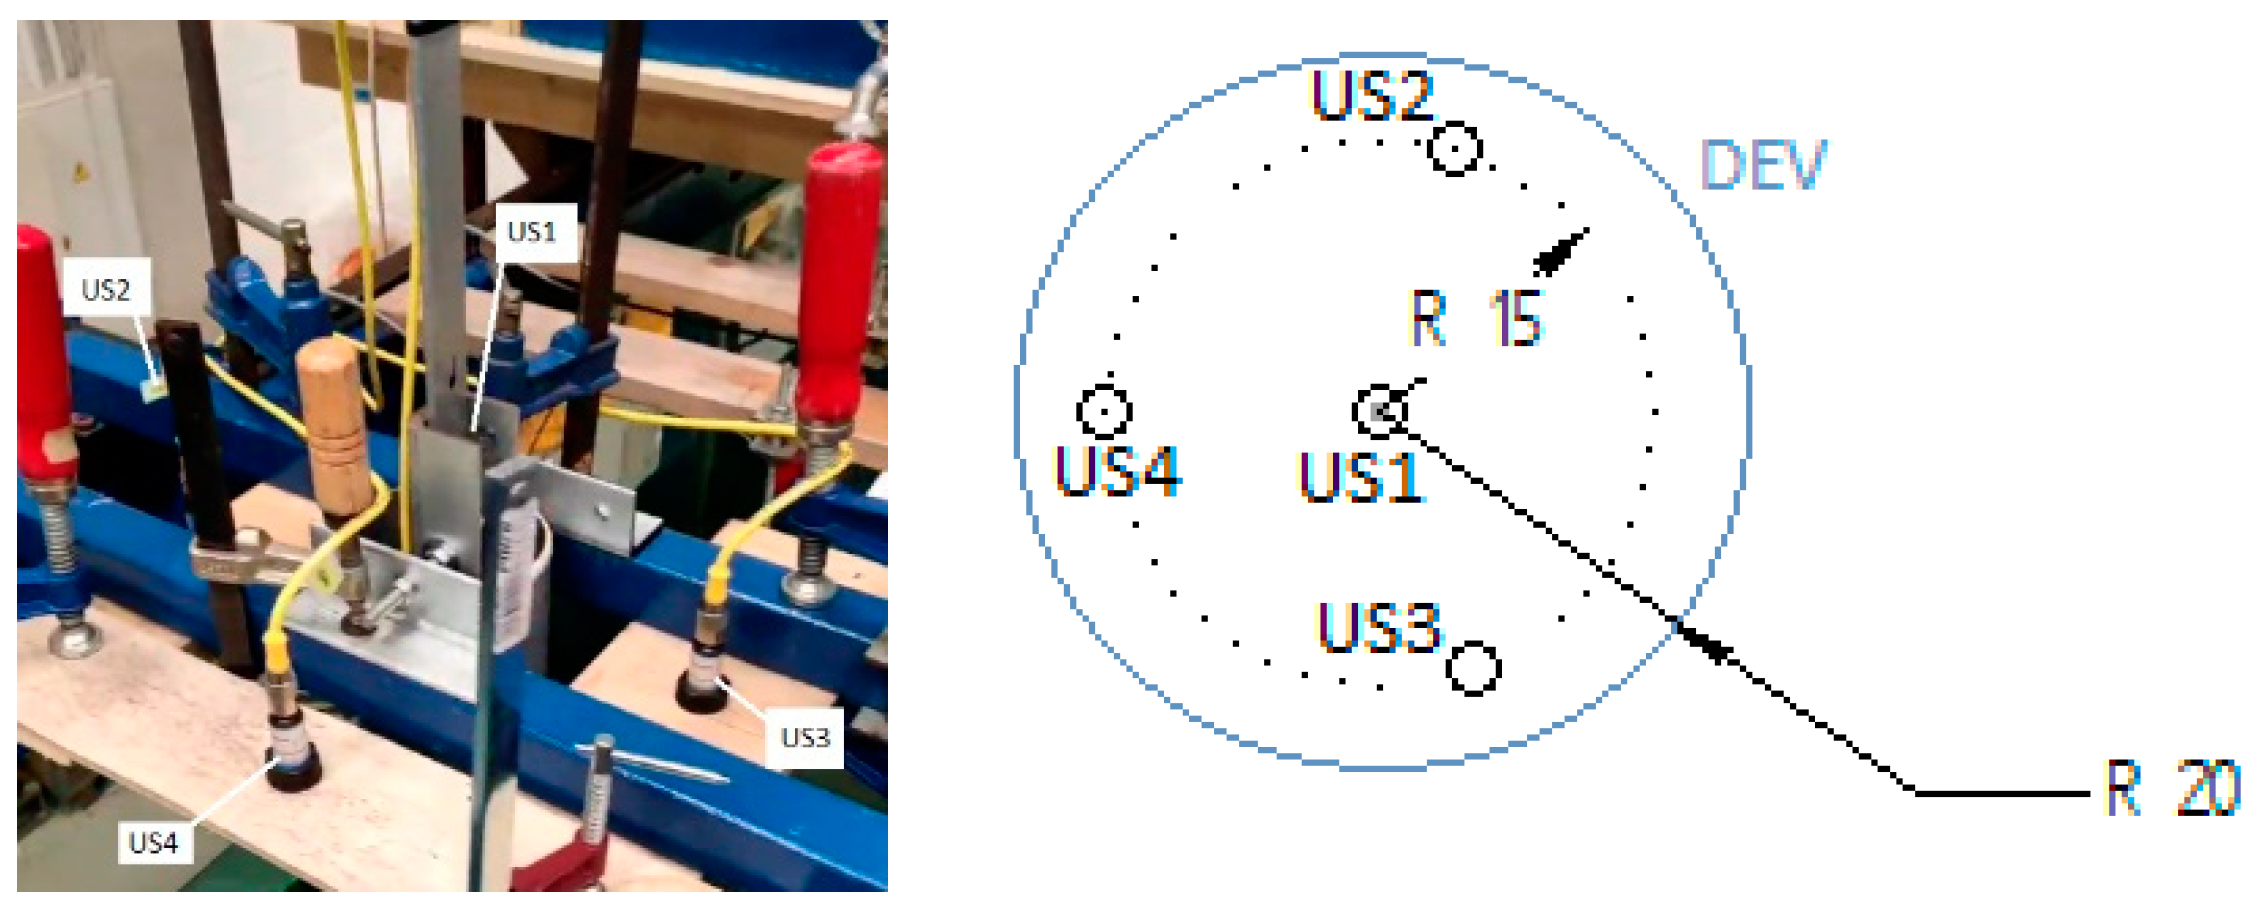
4.2. Wave Flume Facility and Instrumentation

Testing of the prototype has been carried out in the “Universidad de Santiago de Compostela” (USC) wave flume [34]; the overall dimensions of the equipment are 20 × 1.20 × 0.65 m, and it is equipped with a piston-type paddle capable of generating regular and irregular waves with the following instrumentation:
  • Conductivity wave gauges (WGs) measuring wave height
  • Ultrasonic level sensors (USs) measuring prime mover (2–4) and spar water sheet (1) position
  • Active reflected wave absorption and transverse wave absorption system avoids, to some degree, non-linear effects such as reflections
  • Remote monitoring video system
The experimental setup is represented in Figure 7 and Figure 8 to facilitate any replicability of the study and a better understanding of the conditions under which the testing was conducted. The prototype spar is fixed to the wave flume with clamps at the top and a screwed metal sheet at the bottom; the total distance to the paddle is 10.23 m. Behind the device, the absorption system can be found, reducing the number and effect of the wave reflection. The monitoring system registers and controls the paddle activation parameters and all the instrumentation metrics.
The USC instrumentation collects the following information for each test: Wave Gauge 1–6 records the instantaneous wave height in different positions; US1 records the instantaneous water level in the spar water tank; and US2–4 records the instantaneous position of the floater. We chose to have redundant US instrumentation so we can calculate a more precise position, even if one of the instruments goes out of place or fails.

4.3. Decay Test

The decay test is a simplified method used to determine the hydrodynamic coefficients, such as added mass and damping, by observing the natural oscillation of the device in still water. While this method provides valuable insights into the natural periods and damping characteristics, it introduces certain simplifications: (I) Linear Damping Assumption: The decay test assumes linear damping, which may not fully capture the nonlinearities present in actual sea conditions. This can lead to discrepancies between the test results and real-world performance. (II) Exclusion of Wave–Wave Interactions: The decay test does not account for complex wave–wave interactions and other dynamic effects that occur in irregular wave conditions. This simplification can affect the accuracy of the hydrodynamic response in more realistic scenarios.
Despite these simplifications, the decay test provides a robust initial estimate for calibrating the numerical model. To mitigate the effects of these simplifications, we additionally included regular waves for subsequent refinement in our study.
For our study purposes, the natural period of oscillation is calculated as the initial check of the system for the basic identification of any abnormal behavior, either in the prototype or the numerical models. Additionally, we identify a damping calibration factor so the numerical model represents reality as closely as possible despite any simplifications made.
Each test configuration is repeated three times to avoid an outlier result for any given scenario. For each configuration and test, we calculate the natural period ( T n ), logarithm decrement ( δ ), and damping ratio ( ζ ) in n = 2 as defined in [35]:
T n = 2 π m + M a , 0   δ g A w p
δ = 1 n l n ( x 0 / x n )
ζ = 1 1 + 2 π δ 2
where m is mass of water, M a , 0 is the added mass, g is the acceleration of gravity, A w p is the area in the water plane, n is the number of oscillation cycles, x 0 is the initial amplitude of oscillation, and x n is the amplitude after n cycles. Test results can be seen in Table 7.
The results show that variation in mass (variable and fixed) leads to fluctuations in the added mass across different scenarios (Base, Extreme, and Mild). These parameters significantly influence the natural period. Therefore, the experimental results are coherent with the theoretical framework (Equations (17)–(19)) when accounting for these variations, underscoring the importance of considering these factors in the analysis.

4.4. NHS Regular Waves

Building on the classification of tank testing objectives by A. Pecher et al. [35], our focus is on determining the ‘hydrodynamic response’ of various body configurations, which includes analyzing natural oscillation periods and response amplitude operators. As advised, we utilize regular waves at the initial phase for numerical model calibration. Subsequently, irregular waves will be employed in advanced stages to evaluate power performance or load measurements.
To this end, we calculate the calibration factor (CF) for our numerical model in the following manner:
C F i = H e i g h t   r e s p o n s e   f r o m   p r o t o t y p e   ( H p t i ) H e i g h t   r e s p o n s e   f r o m   n u m e r i c a l   m o d e l   ( H n m i )
where “i” is a wave test scenario defined by wave height (H) and period (T).
The examined scenarios present uniform CF close to 89.70%, indicating that the numerical model consistently shows increased dynamics compared to the prototype model. For this preliminary analysis, due to the minor fluctuations between scenarios, we are adopting a constant calibration parameter for the numerical model that is equal to the calculated mean CF and presented in Table 8.
The consistent overestimation of dynamic responses by the numerical model can be attributed to several physical factors. Simplifications and assumptions in the model, such as idealized boundary conditions and linearized wave–body interactions, often lead to discrepancies. Scale effects from physical tank tests, where certain forces do not scale linearly, also contribute. Additionally, the numerical model may not fully capture complex wave–structure interactions, including non-linear effects like wave breaking and turbulence, or accurately represent all sources of hydrodynamic damping, such as energy dissipation and structural damping. These factors collectively result in higher predicted responses in the numerical model compared to the physical prototype.

4.5. FHS Regular Waves

The objective of this part of the study is to compare and correlate the NHS and FHS models. The information obtained will be significant in assessing the benefit-difference between the two models. For this purpose, a synthetic study will be conducted with the MATLAB 2023b tool calibrated with the coefficients obtained from the previous parts of the study (decay and NHS regular).
The selected indicator for this analysis is velocity amplification:
R e s p o n s e   A m p l i f i c a t i o n   R A i = V e l o c i t y m a x   f r o m   F H S   H F H S i V e l o c i t y m a x   f r o m   N H S   H N H S i 1
where “i” is a wave test scenario defined by wave height (H) and period (T). While we could follow the previous criteria—height amplification—instead of velocity, we chose to go with velocity, as it is directly related to energy extraction (Equation (15)); as such, it is a more representative value for the next steps of the study.
The results indicate that our solution is significantly affected by two main factors, with the first being the reactive indicator (Table 3). A higher level of reactivity in a negative spring led to greater potential velocity, as evidenced by the increased averages seen in the extreme scenario, with a higher reactive indicator compared to the milder scenario. Although this finding is encouraging and an important factor to consider, it is necessary to acknowledge the limitations in increasing the reactive indicator due to the WEC’s stability requirements. Several trial-and-error attempts were made with different configurations before identifying the one that was extreme yet feasible.
Secondly, for the FHS variant, the activation and reverse commands of the water transfer significantly affected our solution. These commands are defined as a percentage of the wave cycle in seconds after every wave crest and valley. After some trial-and-error calibrations, an optimum activation–deactivation time was found for our selected configurations. We found out this factor is critical to such a degree that it could alter the function of the negative spring into a negative damper under circumstances where the activation and deactivation commands impose the movement of seawater, exerting a stabilizing force contrary to the motion.
The geometric design and mass distribution of any Wave Energy Converter influence its hydrodynamic parameters. Our study does not directly modify the WEC design, as it focuses on a specific case study, but the relevance of these factors is also critical. We consider it good practice to design any WEC specifically for its operational environment prior to adding a negative spring system. This matters because the effect of resonance amplification is confined by how close the WEC’s natural frequency is to the prevailing wave frequency at the site. Results are presented in Table 9.
Looking at relevant results and extreme and mild configurations, it is concluded that the forced model provides additional velocity to the floater, which may result in additional electrical energy generation, which is the desired outcome for any WEC. Additionally, it is found that any additional mass provided by the static ballast greatly impacts the capacity to improve the outcomes of the forced model.

4.6. Irregular Wave Analysis

The last step of the study is to evaluate the power performance of the models in a real maritime scenario. To obtain this result, we will apply the scatter diagram as a representation of the available wave energy resource in the area and the power matrix as a representation of the capability of the different WEC configurations to generate energy for each wave scenario. This section of the analysis is evaluated by numerical modeling (as described in Section 3.2). Specifically, we will focus on the forced model (FHS) for extreme and mild configurations, given that the relationship between natural (NHS) and forced was already found in Section 4.5, and we want to find and discuss the higher end of the outcomes.
For that purpose, we will analyze the wave climate and WEC performance for a particular set of coordinates in the north of the United Kingdom (Longitude −8.77258, Latitude 44.07971). The raw wave data are obtained from ERA5, which is the fifth-generation European Centre for Medium-Range Weather Forecasts (ECMWF) reanalysis tool for global climate and weather, using information from 1979 to 2021. The data are processed with a custom-made MATLAB algorithm to generate the wave scatter diagram in % in Table 10.
The power matrices, on the other hand, are calculated in MATLAB with the calibrated tool based on WECSIM from the previous steps; hydrodynamic parameters are calculated specifically for this analysis. The Sea Titan PTO efficiency and damping control model is included to obtain relevant power performance indicators. The wave spectrum for the simulations is assumed, using JONSWAP, as a good approximation for the North Sea [36]. The power matrix is a common representation of the electrical generation capacity for a particular WEC technology; as such, Table 11, Table 12 and Table 13 presents the three power matrices generated as a result of each scenario under study (base, mild, and extreme) to facilitate any further study based on these results.
We can draw one significant conclusion by comparing the power matrices: the optimal resonance operation of the WEC device occurs at a frequency of 1.14 rad/s, as indicated by the peak power value in any row of the PM-Base. In contrast, the peak values in PM-Extreme and PM-Mild shift within the range of 1.05 to 1.26 rad/s. This shift is a direct outcome of the conceptual mass transfer approach, which not only enhances the relative velocity of the prime mover (as presented in Table 9 from Section 4.5), which is directly related to the power efficiency (Equation (16)), but also broadens the range of available resonance frequencies.
Single bins of the power matrix cannot be compared between configurations to extract conclusions, given the irregular nature of the analyzed waves; despite this limitation, we can still analyze global and average values to extract complementary and valuable information. Results are presented in Table 14.
The analysis of irregular waves demonstrates that the forced model (FHS) significantly enhances the WEC’s energy generation capabilities. The physical basis for this improvement lies in the dynamic mass transfer approach, which increases the relative velocity of the prime mover and broadens the resonance frequency range. Additionally, the power matrix analyses provide valuable insights into the WEC’s performance across different wave conditions, reinforcing the potential benefits of the FHS model in real maritime scenarios.
These findings suggest that combining the dynamic inertia strategy with other complementary solutions, such as optimal PTO control, colocation, energy storage, predictive maintenance, or new materials, could further enhance the energy capture efficiency of wave energy converters as a way forward to commercialization.

5. Conclusions

In this paper, we have presented a novel model of negative spring for wave energy converters, which consists of modifying the inertial properties of the device by means of an internal seawater transfer system. We have developed a theoretical model and physical model prototype to analyze the impact on energy performance of the concept using a case study point absorber (base configuration).
We have conducted numerical simulations using realistic sea states to evaluate the energy production and the effect of different parameters (seawater trigger control, reactive indicator, and wave frequencies) in the WEC body dynamics and extracted energy. To support the numerical model, a comprehensive physical testing campaign was carried out using a 1:20 scale model prototype of Wedge Global’s W1 floater in a wave flume, allowing us to validate and calibrate the numerical model with decay and regular wave scenarios.
The resonance bandwidth of the device shifts from −0.09 to +0.12 rad/s relative to the natural frequency of the base model to which it is applied, demonstrating that the proposed concept can enhance the energy extracted by up to 12.70% in the forced model and 8.54% in the natural model. While the forced model presents additional energy efficiency, it also presents a set of particular challenges over the natural model, such as the sensitivity to parameter variations (activation–deactivation triggers), the need for a wave prediction system for the control system, and a safe gate-system mechanism to transfer the seawater in substitution of the hose system, which is not feasible given the technical restrictions on rigidity when scaling up.
The results demonstrate a 3.41% increase in maximum power output. Even with a high-rated power PTO of 1 MW operating at full load, the additional 34.1 kW typically falls within tolerances, eliminating the need for any PTO enhancement; this results in cost savings and easier installation without negative effects on other systems. Based on this result, we maintain our initial assumption on interoperability.
Additionally, the relationship between maximum power increase (minor) and energy extraction (major) illustrates the system’s ability to enhance the energy efficiency of a given WEC by broadening the range of near-resonance operation rather than solely maximizing power output at a specific frequency. This approach ensures more consistent energy extraction across diverse wave conditions. However, this advantage comes with a notable drawback. If the system is installed in a WEC designed for locations with consistent sea conditions, the effectiveness may be significantly compromised. In such environments, there are minimal frequency variations available to tune the device effectively. This underscores the importance of accurately characterizing wave scenarios and developing diverse technologies tailored to multiple conditions.
For example, a WEC designed for the North Atlantic, with its highly variable wave conditions, would need a different tuning strategy compared to one designed for the more consistent wave patterns of the Mediterranean. Unlike wind or solar energy, marine energy faces unique challenges due to the variability of ocean conditions. Therefore, it is crucial to design WECs that can adapt to a wide range of wave frequencies and intensities to maximize efficiency and reliability. This adaptability is essential for optimizing energy extraction in diverse marine environments, ensuring that WECs are effective in both highly variable and relatively stable wave climates.
The proposed system components are seawater, steel, and simple mechanisms, ensuring low manufacturing and installation costs, which leads to minimal capital expenses. The proposed system increases a given WEC energy output, especially with the forced model. However, we prefer the natural model due to its resilience (no pumps) and ease of operation (no need for wave prediction and activation commands).
Achieving energy increases of up to 12.70% with minimal additional expenses results in a significant reduction in the Levelized Cost of Energy (LCOE), aligning with our initial expectations. This reduction in LCOE enhances the commercial viability of wave energy by offering a higher return on investment and a shorter payback period, making it more attractive to investors and developers. However, a CWR of around 10–11% indicates that while our solution represents a substantial improvement, it is not a standalone fix. It should be viewed as a complementary advancement within the broader context of ongoing efforts to enhance WEC technology.
Finally, the adaptability of our concept to various types of WECs enhances its flexibility and applicability across different wave climates and market conditions. This versatility not only broadens the potential market but also increases the technology’s resilience to diverse marine environments. In summary, our innovative approach shows promising capabilities to advance wave energy toward commercial viability, driving the industry toward more sustainable and profitable outcomes.

6. Future Work

As the next steps, we plan to extend our analysis to other types of wave energy converters, such as submerged pressure differential devices, and explore the potential benefits of dynamic inertia for them. We also aim to design and test a 1:10–1:20 prototype for the laboratory to assess the feasibility and robustness of the proposed gate-system mechanism. Furthermore, we intend to investigate the wave predictor concept and extend its conclusion to an optimum PTO control strategy, considering the trade-off between maximizing power output and minimizing structural loads and PTO losses. Finally, we will conduct a techno-economic analysis of the concept and compare its cost-effectiveness with other wave energy technologies.

Author Contributions

Conceptualization, A.M.-A., A.J.G. and I.G.; methodology, A.M.-A.; software, A.M.-A.; validation, A.M.-A.; formal analysis, A.M.-A.; investigation, A.M.-A.; resources, A.M.-A.; data curation, A.M.-A.; writing—original draft preparation, A.M.-A.; writing—review and editing, A.M.-A., A.J.G. and I.G.; visualization, A.M.-A.; supervision, A.J.G. and I.G.; project administration, A.M.-A.; funding acquisition, A.M.-A., A.J.G. and I.G. All authors have read and agreed to the published version of the manuscript.

Funding

The authors would like to thank the Basque Government for partially funding their research work through Grant IT1555-22 and they thank MICIU/AEI/10.13039/501100011033 and ERDF/EU for partially funding their research work through Grants PID2021-123543OB-C21, PID2021-123543OB-C22.

Institutional Review Board Statement

Not applicable.

Informed Consent Statement

Not applicable.

Data Availability Statement

The data presented in this study are available on request from the corresponding author.

Acknowledgments

We would like to express our gratitude to the Universidad de Santiago de Compostela for providing us access to their state-of-the-art testing facilities. This support has been crucial in advancing our research objectives. We would also like to express our thanks to the team at Wedge Global, whose transparency and in-depth understanding of the electrical generator went far beyond sharing and enriched our study with practical knowledge. These collaborative efforts not only advanced our project but also reinforced our understanding of the importance of community and collaboration in advancing scientific knowledge.

Conflicts of Interest

Author Aleix Maria-Arenas was employed by Wedge Global SL. The remaining authors declare that the research was conducted in the absence of any commercial or financial relationships that could be construed as a potential conflict of interest.

References

  1. Avalos, G.O.G.; Peña, J.C.U.; Rodríguez, C.L.M. Preliminary study of the performance of a new wave energy converter. J. Ocean Eng. Mar. Energy 2024, 10, 125–136. [Google Scholar] [CrossRef]
  2. Li, H.; Wu, J.; Shi, X.; Kong, L.; Kong, W.; Zhang, Z.; Pan, Y.; Luo, D.; Yan, J. A self-powered smart wave energy converter for sustainable sea. Mech. Syst. Signal Process. 2024, 220, 111641. [Google Scholar] [CrossRef]
  3. Cotten, A.; Kurniawan, A.; Neary, V.; Coe, R.; Bacelli, G. A compressible degree of freedom as a means for improving the performance of heaving wave energy converters. Renew. Energy 2024, 227, 12. [Google Scholar] [CrossRef]
  4. Li, J.; Rong, S.; Yang, H.; Zheng, X. Experimental and numerical study on the integration of a built-in wave energy converter (BIWEC) and floating platform. Ocean Eng. 2024, 299, 117408. [Google Scholar] [CrossRef]
  5. Gao, Y.; Liu, K.; Ke, L.; Zhang, X.; Jiang, W.; Gao, Z. Application of a coupled linear-bistable system in point absorber wave energy converter. Ocean Eng. 2024, 299, 117090. [Google Scholar] [CrossRef]
  6. Vervaet, T.; Quartier, N.; Moreno, E.; Fernandez, G.; Ferri, F.; Stratigaki, V.; Troch, P. System identification and centralised causal impedance matching control of a row of two heaving point absorber wave energy converters. Ocean Eng. 2024, 309, 118399. [Google Scholar] [CrossRef]
  7. Zou, S.; Robertson, B.; Roach, A.; Mundon, T.; Rosenberg, B.; Penalba, M. Wave energy converter arrays: A methodology to assess performance considering the disturbed wave field. Renew. Energy 2024, 229, 120719. [Google Scholar] [CrossRef]
  8. Gharechae, A.; Abazari, A.; Soleimani, K. Performance assessment of a combined circular aquaculture cage floater and point absorber wave energy converters. Ocean Eng. 2024, 300, 117239. [Google Scholar] [CrossRef]
  9. Chen, Z.; Sun, J.; Yang, J.; Sun, Y.; Chen, Q.; Zhao, H.; Qian, P.; Si, Y.; Zhang, D. Experimental and numerical analysis of power take-off control effects on the dynamic performance of a floating wind-wave combined system. Renew. Energy 2024, 226, 120353. [Google Scholar] [CrossRef]
  10. Jin, S.; Zheng, S.; Greaves, D. On the scalability of wave energy converters. Ocean Eng. 2022, 243, 110212. [Google Scholar] [CrossRef]
  11. Papini, G.; Faedo, N.; Mattiazzo, G. Fault diagnosis and fault-tolerant control in wave energy: A perspective. Renew. Sustain. Energy Rev. 2024, 199, 114507. [Google Scholar] [CrossRef]
  12. Kang, D.; Suvitha, K.; Narayanamoorthy, S.; Sandra, M.; Pamucar, D. Evaluation of wave energy converters based on integrated ELECTRE approach. Expert Syst. Appl. 2024, 242, 15. [Google Scholar] [CrossRef]
  13. Majidi, A.G.; Bingölbali, B.; Akpinar, A.; Rusu, E. Wave power performance of wave energy converters at high-energy areas of a semi-enclosed sea. Energy 2021, 220, 119705. [Google Scholar] [CrossRef]
  14. Aderinto, T.; Li, H. Ocean Wave Energy Converters: Status and Challenges. Energies 2018, 11, 1250. [Google Scholar] [CrossRef]
  15. Wedge Global SL. Available online: https://wedgeglobal.com/ (accessed on 18 March 2024).
  16. Ocean Power Technologies. Available online: https://oceanpowertechnologies.com/platform/opt-pb3-powerbuoy/ (accessed on 18 March 2024).
  17. Columbia Power History. Available online: https://cpower.co/about/#history (accessed on 18 March 2024).
  18. Maria-Arenas, A.; Garrido, A.J.; Rusu, E.; Garrido, I. Control Strategies Applied to Wave Energy Converters: State of the Art. Energies 2019, 12, 3115. [Google Scholar] [CrossRef]
  19. OpenEI PRIMRE, Marine Energy Technologies. Available online: https://openei.org/wiki/PRIMRE/Databases/Projects_Database/Technologies (accessed on 21 July 2024).
  20. IEC Technical Specification 62600-1, Marine Energy—Wave, Tidal and Other Water Current Converters—Part 1: Vocabulary. 2020. Available online: https://cdn.standards.iteh.ai/samples/102989/5a3d1ae0242c45be99b961a6ad876eab/IEC-TS-62600-1-2020.pdf (accessed on 18 March 2024).
  21. IEC Technical Specification 62600-2, Marine Energy—Wave, Tidal and Other Water Current Converters—Part 2: Marine Energy Systems—Design Requirements. 2019. Available online: https://webstore.iec.ch/en/publication/62399 (accessed on 18 March 2024).
  22. Todalshaug, J.H.; Ásgeirsson, G.S.; Hjálmarsson, E.; Maillet, J.; Möller, P.; Pires, P.; Guérinel, M.; Lopes, M. Tank testing of an inherently phase-controlled wave energy converter. Int. J. Mar. Energy 2016, 15, 68–84. [Google Scholar] [CrossRef]
  23. Grasberger, J.; Bird, J.; Coe, R.; Bacelli, G.; Ströfer, C.; Hagmuller, A. Maximizing Wave Energy Converter Power Extraction by Utilizing a Variable Negative Stiffness Magnetic Spring. In Proceedings of the 15th European Wave and Tidal Energy Conference (EWTEC 2023) 2023, Bilbao, Spain, 3–7 September 2023. [Google Scholar] [CrossRef]
  24. Portillo, J.; Gato, L.; Henriques, J.; Falcão, A. Implications of spring-like air compressibility effects in floating coaxial-duct OWCs: Experimental and numerical investigation. Renew. Energy 2023, 212, 478–491. [Google Scholar] [CrossRef]
  25. Li, B.; Li, C.; Zhang, B.; Deng, F.; Yang, H. The effect of the different spacing ratios on wave energy converter of three floating bodies. Energy 2023, 268, 16. [Google Scholar] [CrossRef]
  26. Falcao, A.; Henriques, J.; Gomes, R.; Portillo, J. Theoretically based correction to model test results of OWC wave energy converters to account for air compressibility effect. Renew. Energy 2022, 198, 41–50. [Google Scholar] [CrossRef]
  27. Zhang, X.; Tian, X.; Xiao, L.; Li, X.; Lu, W. Mechanism and sensitivity for broadband energy harvesting of an adaptive bistable point absorber wave energy converter. Energy 2019, 188, 37. [Google Scholar] [CrossRef]
  28. Tetu, A.; Ferri, F.; Kramer, M.; Todalshaug, J. Physical and Mathematical Modeling of a Wave Energy Converter Equipped with a Negative Spring Mechanism for Phase Control. Energies 2018, 11, 2362. [Google Scholar] [CrossRef]
  29. Todalshaug, J.H. Hydrodynamics of WECs. In Handbook of Ocean Wave Energy; Ocean Engineering & Oceanography Book Series; Pecher, A., Kofoed, J., Eds.; Springer: Cham, Switzerland, 2017; Volume 7. [Google Scholar] [CrossRef]
  30. Cveticanin, L. Dynamics of Bodies with Time-Variable Mass; Springer: Cham, Switzerland, 2016. [Google Scholar] [CrossRef]
  31. WEC-Sim. Available online: https://wec-sim.github.io/WEC-Sim/master/index.html (accessed on 18 March 2024).
  32. WEC-Sim Formulation. Available online: https://wec-sim.github.io/WEC-Sim/main/theory/theory.html (accessed on 22 June 2024).
  33. European Comission CORDIS: SEA-TITAN. Available online: https://cordis.europa.eu/project/id/764014 (accessed on 18 March 2024).
  34. USC Facilities and Equipment. Available online: https://www.usc.gal/en/investigacion/grupos/gicema/instalacions.html (accessed on 20 January 2022).
  35. Pecher, A. Experimental Testing and Evaluation of WECs. In Handbook of Ocean Wave Energy; Springer Open: Cham, Switzerland, 2017; pp. 221–260. [Google Scholar]
  36. Folley, M. The Wave Energy Resource. In Handbook of Ocean Wave Energy; Springer Open: Cham, Switzerland, 2017; pp. 43–79. [Google Scholar]
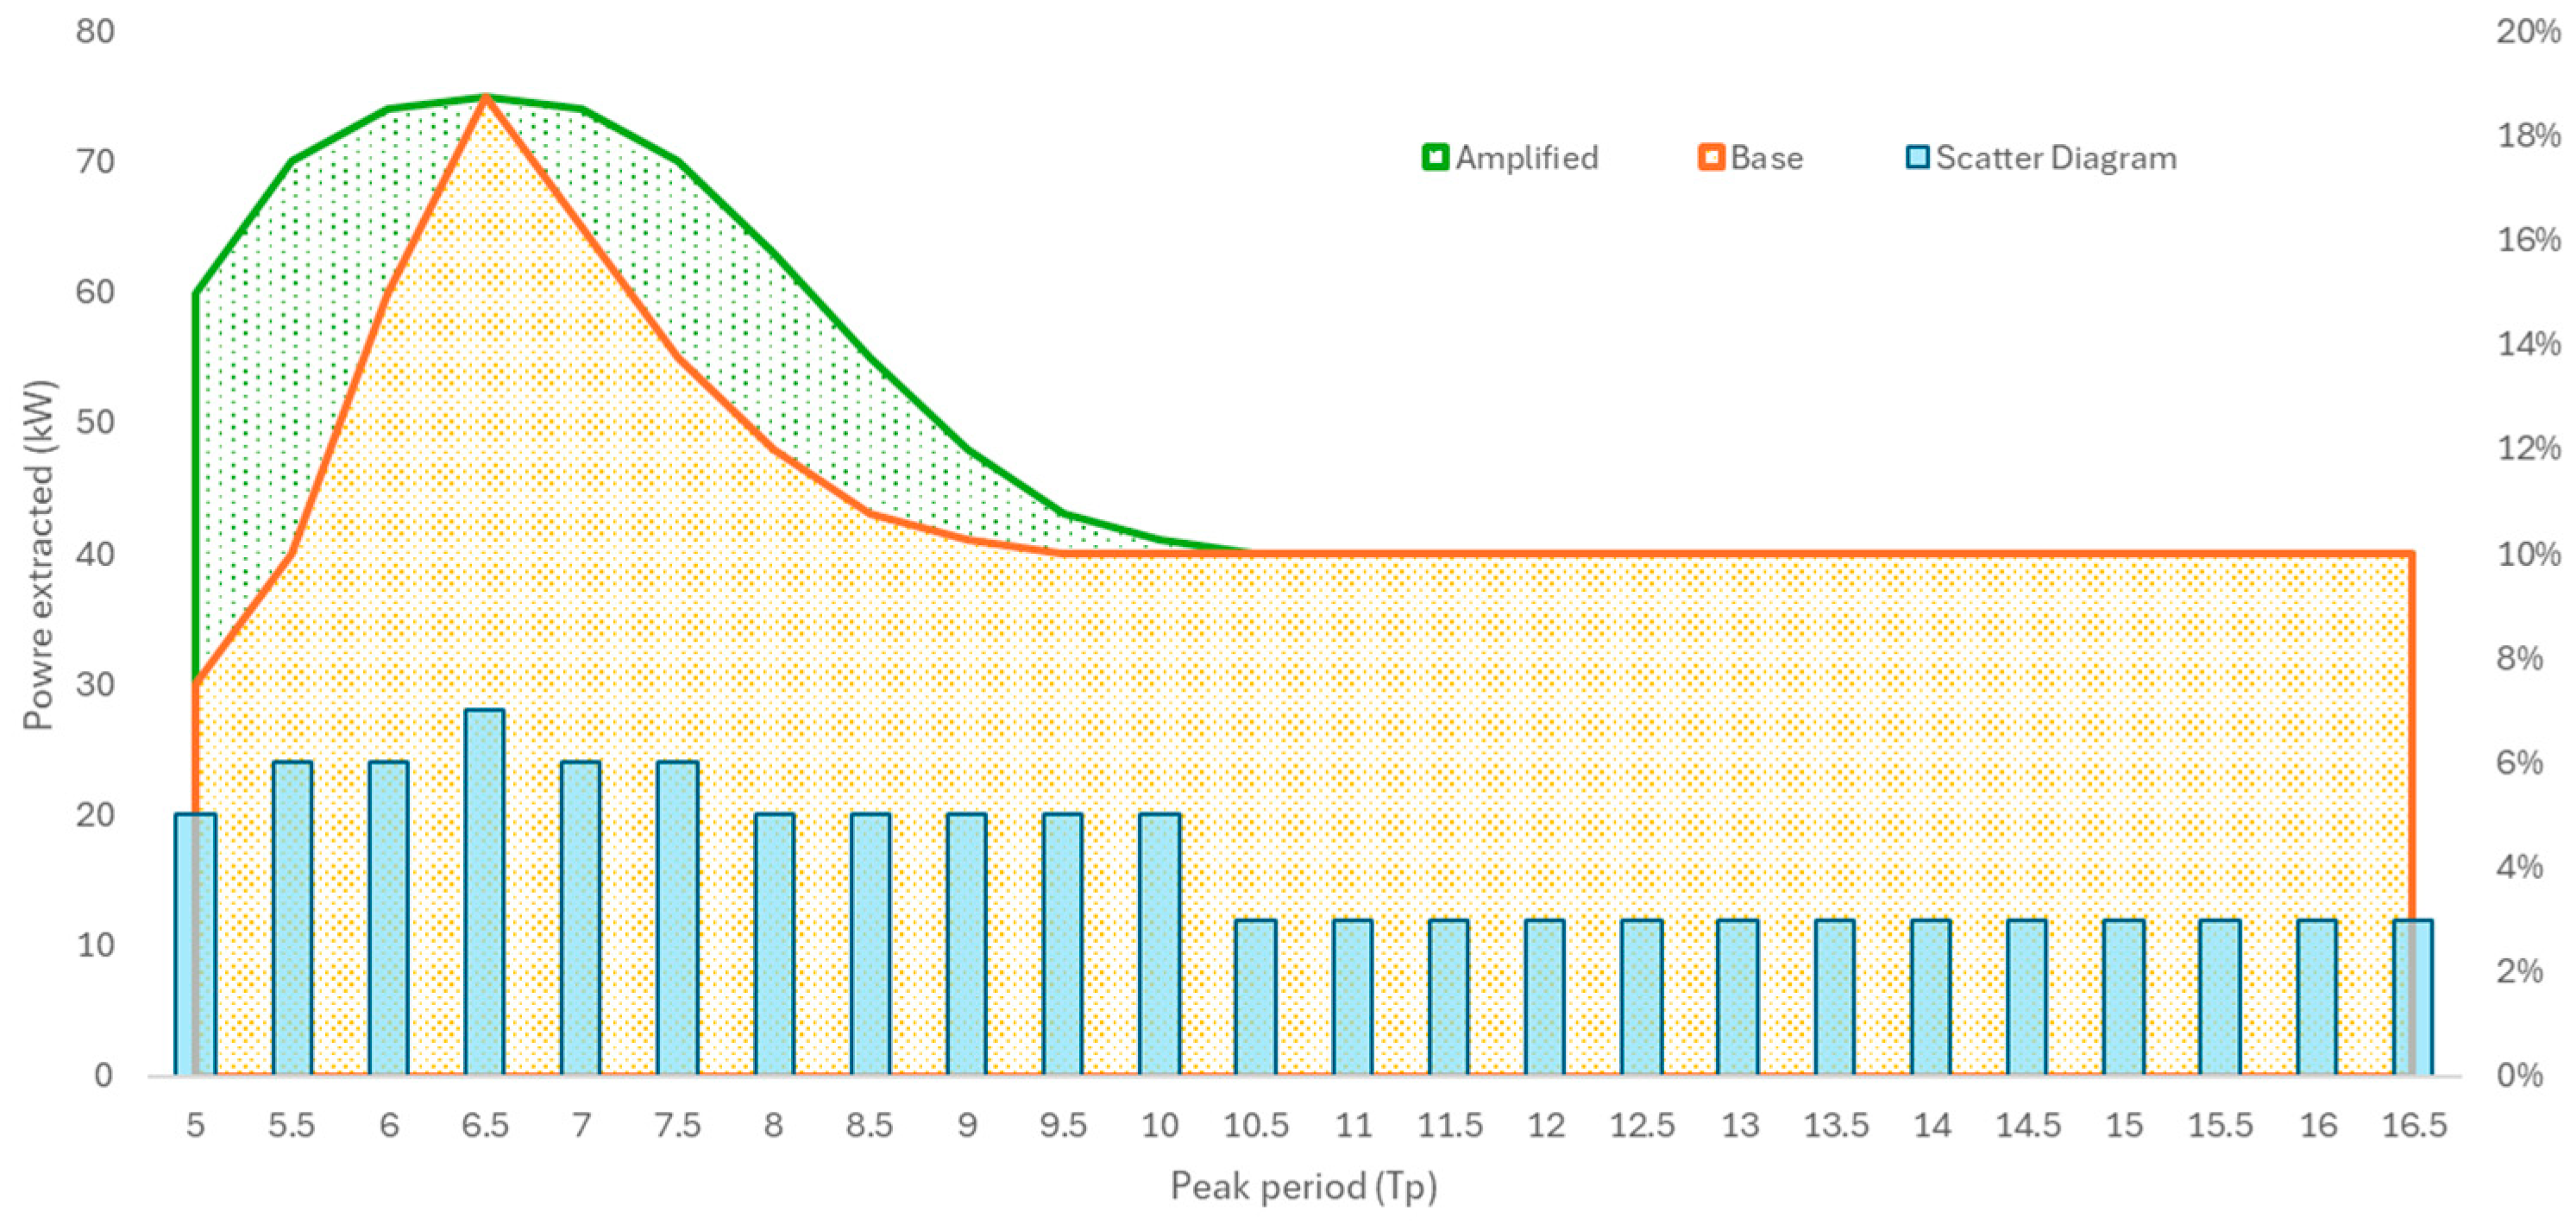
Figure 1. Relevance of a negative spring system.
Jmse 12 01285 g001
Figure 2. NHS working principle.
Jmse 12 01285 g002
Figure 3. Standardized numerical model test results. (left) Regular waves (right) Irregular waves.
Jmse 12 01285 g003
Figure 4. Example of FHS activation cycle with regular waves (left) and irregular waves (right).
Jmse 12 01285 g004
Figure 5. Prototype top view (top left), elevation view (top right), and section (bottom), blue represents water; dimensions in mm.
Jmse 12 01285 g005
Figure 6. Physical prototype installed in the wave flume (left). Instrumentation position (right) is marked as US1–US4, and high-contrast reflective sheets are installed on top of the floater for US2–4. US1 measures the position of the variable water sheet in the spar body.
Jmse 12 01285 g006
Figure 7. General overview. Dimensions in dm. Wave gauge (WG) and prototype device (DEV) position.
Jmse 12 01285 g007
Figure 8. Ultrasonic sensor (US) position on top of prototype. Dimensions in cm.
Jmse 12 01285 g008
Table 1. Full-size geometry numerical model parameters.
Significant Wave height range (m)[0.5–5.5]
Significant Wave height step (m)0.50
Peak period range (s)[5–16.5]
Peak period step (s)0.50
Water depth (m)40
Table 2. Scaled prototype numerical model parameters.
Wave height range (m)[0.03–0.14]
Wave height step (m)0.01
Period range (s)[0.80–3.60]
Period step (s)0.20
Water depth (m)0.5
Table 3. Testing configurations; dimensions in cubic centimeters.
ConfigurationFixed Ballast (cm3)Variable Ballast (cm3)Reactive Indicator
Base3000.000.000.00
Extreme3000.00800.000.21
Mild9000.00400.000.04
Table 4. Base regular wave scenarios.
Test IDH (m)T (s)
10.031.45
20.031.57
30.031.68
40.031.79
50.051.45
60.051.57
70.051.68
80.051.79
90.063
100.063.2
110.063.6
120.081.45
130.081.57
140.081.68
150.081.79
160.083
170.083.5
180.093.4
190.11.79
200.11.9
210.13
220.123.1
230.123.3
240.131.9
250.132.01
260.143.1
270.143.2
Table 5. Extreme regular wave scenarios.
Test IDH (m)T (s)
10.051.57
20.051.79
30.055.00
40.063.00
50.063.10
60.063.20
70.063.60
80.083.00
90.083.50
100.101.90
110.102.50
120.103.00
130.103.40
140.104.50
150.106.00
160.123.10
170.123.30
180.132.12
190.135.00
200.143.10
210.143.20
220.143.40
230.143.60
Table 6. Mild regular wave scenarios.
Test IDH (m)T (s)
10.030.84
20.0.31.45
30.031.57
40.031.68
50.031.79
60.050.84
70.051.45
80.051.57
90.051.68
100.051.79
110.081.45
120.081.57
130.081.68
140.081.79
150.11.79
160.11.9
170.131.9
180.132.01
Table 7. Results from prototype decay test and numerical model.
Natural
Period (s)
Logarithmic
Decrement
Damping
Ratio
MeanVariancen = 2-
Physical testBase0.66730.00080.15600.0248
Extreme0.70210.00510.25240.0401
Mild0.83640.00150.33110.0526
Numerical model
Before calibration
Base0.68710.14600.0232
Extreme0.75480.23100.0336
Mild0.85410.30010.0477
Numerical model
After calibration
Base0.66640.15430.0246
Extreme0.70170.25280.0402
Mild0.83600.33070.0526
Table 8. Numerical model calibration factors.
MeanStd. Variation
Base86.22%2.66%
Extreme90.69%7.53%
Mild90.91%9.44%
Table 9. Response amplification and control triggers.
Amplification
Average
Amplification
Std. Variation
FHS Optimum
Activation Trigger
FHS Optimum
Deactivation Trigger
BaseN/AN/AN/AN/A
Extreme32.74%6.87%21.43%78.12%
Mild7.48%4.14%27.51%77.48%
Table 10. Maritime coordinates wave scatter diagram, relevant extract (88.86%).
SD_UKHs (m)
0.511.522.533.544.555.5
Tp (s)50.01%0.23%0.54%0.04%0.00%0.01%0.02%0.01%0.01%0.00%0.00%
5.50.03%0.29%1.06%0.46%0.02%0.00%0.01%0.01%0.00%0.00%0.00%
60.03%0.37%0.59%1.26%0.21%0.01%0.00%0.00%0.00%0.00%0.00%
6.50.04%0.37%0.46%0.98%0.96%0.13%0.01%0.00%0.00%0.00%0.00%
70.04%0.50%0.44%0.50%1.01%0.66%0.10%0.01%0.00%0.00%0.00%
7.50.06%0.80%0.61%0.40%0.46%0.65%0.31%0.05%0.00%0.00%0.00%
80.06%0.93%0.85%0.49%0.34%0.33%0.30%0.11%0.02%0.00%0.00%
8.50.02%1.11%1.21%0.71%0.43%0.34%0.28%0.30%0.10%0.03%0.01%
90.02%1.27%1.92%0.81%0.40%0.26%0.21%0.15%0.11%0.04%0.01%
9.50.00%0.81%1.77%1.05%0.52%0.29%0.20%0.16%0.11%0.07%0.04%
100.01%0.71%2.41%1.72%0.82%0.45%0.23%0.19%0.11%0.05%0.04%
10.50.00%0.28%1.34%1.42%0.73%0.44%0.22%0.16%0.10%0.06%0.04%
110.01%0.24%1.50%2.05%1.30%0.74%0.44%0.26%0.16%0.10%0.05%
11.50.00%0.10%0.68%1.46%1.18%0.65%0.42%0.24%0.17%0.09%0.06%
120.00%0.11%0.70%1.62%1.72%1.13%0.71%0.39%0.24%0.14%0.07%
12.50.00%0.06%0.30%0.92%1.19%1.12%0.68%0.42%0.24%0.15%0.08%
130.00%0.06%0.28%0.74%1.18%1.10%0.81%0.47%0.32%0.18%0.09%
13.50.00%0.04%0.19%0.45%0.90%1.06%0.80%0.60%0.40%0.24%0.14%
140.00%0.02%0.10%0.21%0.40%0.56%0.52%0.41%0.29%0.19%0.13%
14.50.00%0.02%0.12%0.24%0.35%0.49%0.55%0.50%0.35%0.27%0.18%
150.00%0.01%0.05%0.10%0.14%0.23%0.33%0.34%0.30%0.20%0.14%
15.50.00%0.01%0.03%0.06%0.10%0.14%0.17%0.19%0.20%0.14%0.09%
160.00%0.00%0.04%0.07%0.09%0.11%0.13%0.16%0.16%0.17%0.11%
16.50.00%0.00%0.01%0.03%0.04%0.04%0.04%0.06%0.07%0.08%0.09%
Table 11. Power matrix results: base. Dimensions in kilowatts (kW).
PM
Base
Hs (m)
0.511.522.533.544.555.5
Tp (s)51.686.7415.1626.9542.1160.6482.54107.80136.44168.44203.81
5.51.897.5717.0430.2947.3368.1692.77121.16153.35189.32229.08
61.877.4616.7929.8546.6467.1691.42119.40151.12186.57225.75
6.51.827.2816.3829.1245.5065.5289.18116.48147.42181.99220.21
71.777.0615.8928.2544.1363.5586.50112.98142.99176.53213.60
7.51.676.7015.0726.7941.8660.2882.05107.17135.64167.46202.62
81.495.9613.4223.8637.2853.6873.0695.43120.78149.11180.42
8.51.425.6912.8022.7635.5751.2269.7191.05115.24142.27172.15
91.365.4312.2221.7333.9548.8866.5386.90109.98135.78164.30
9.51.265.0511.3520.1831.5445.4161.8180.73102.17126.14152.63
101.204.8010.8019.2029.9943.1958.7976.7997.18119.98145.18
10.51.134.5110.1418.0328.1740.5755.2272.1291.28112.69136.35
111.064.259.5717.0226.5938.2852.1168.0686.14106.35128.68
11.51.004.019.0216.0425.0636.0849.1164.1481.18100.22121.27
120.953.818.5815.2523.8234.3046.6960.9877.1895.29115.30
12.50.913.628.1514.4922.6432.6044.3757.9573.3490.55109.56
130.843.387.6013.5121.1130.3941.3754.0368.3884.42102.15
13.50.793.167.1212.6619.7728.4738.7650.6264.0779.1095.71
140.742.956.6311.7818.4126.5136.0847.1259.6473.6389.10
14.50.702.806.3111.2217.5225.2434.3544.8656.7870.1084.82
150.662.645.9410.5616.5023.7632.3542.2553.4766.0179.88
15.50.622.495.609.9615.5622.4130.5139.8450.4362.2675.33
160.592.365.319.4514.7621.2528.9337.7847.8259.0471.44
16.50.562.245.038.9413.9720.1227.3835.7745.2755.8967.62
Table 12. Power matrix results: FHS extreme. Dimensions in kilowatts (kW).
PM
Extreme
Hs (m)
0.511.522.533.544.555.5
Tp (s)51.947.4818.3630.7646.1167.06100.35126.77141.22205.94223.23
5.52.218.6517.1732.9552.2285.84111.98142.87184.88213.24236.90
61.999.0217.1535.2252.9171.38102.73135.62166.65213.87255.88
6.52.048.8018.7733.8555.3874.5496.83129.84151.12206.38251.36
72.027.8617.2731.6148.8271.5390.96111.63152.20198.93230.98
7.51.808.1516.6329.6446.5863.5297.28112.39145.74190.43218.55
81.715.8915.2927.2838.3256.8983.08100.67132.55165.95217.63
8.51.786.6614.9025.8043.3557.3079.7094.82139.83170.59192.95
91.596.2613.3726.8841.3252.2977.89100.43117.78159.26200.17
9.51.526.2211.2624.8935.3854.1171.0290.49119.45132.80176.67
101.545.7212.7922.1633.7945.2768.3880.41107.28148.09174.74
10.51.425.2012.1421.0530.4845.9361.1384.5899.75141.85159.04
111.154.9810.5318.5828.1841.7758.5374.2295.64129.29152.79
11.51.204.6711.5616.4626.1342.1554.2573.6491.43113.67138.93
121.084.709.0817.1430.0638.2252.4572.4988.63102.99144.37
12.51.044.109.3516.7325.2335.0248.6466.8078.85109.41126.28
131.053.859.3817.3123.0532.8843.3662.0879.02102.43109.82
13.50.923.708.0613.3920.2930.1743.8958.8871.8284.71114.76
140.893.407.7213.5220.7027.6439.3752.1662.4586.08104.51
14.50.903.456.9012.7220.2231.8540.1350.3966.5977.3889.30
150.833.145.8913.0620.1126.4836.0546.6758.3172.1398.60
15.50.672.876.6312.2818.9425.0732.7744.7657.9069.1394.82
160.712.776.3610.9116.5622.7333.0841.4156.8566.5086.85
16.50.642.615.5410.4415.7423.9832.0537.2552.1864.1876.69
Table 13. Power matrix results: FHS mild. Dimensions in kilowatts (kW).
PM
Mild
Hs (m)
0.511.522.533.544.555.5
Tp (s)51.767.0615.8327.8842.6665.0684.65109.23139.93169.68213.20
5.51.947.7517.4131.6848.7569.4896.46123.43157.81193.29234.70
61.917.6517.1331.7847.3269.0493.43121.84157.37192.36233.68
6.51.877.3516.8929.7246.6467.7490.97117.02150.96188.25221.46
71.777.3616.4629.1845.9065.2288.21117.44148.36182.10225.12
7.51.706.8615.2827.4643.6062.1284.63108.92136.71175.45207.52
81.566.1414.0824.3737.4855.0175.8096.79123.63153.20193.90
8.51.536.1313.2924.0238.0650.6575.6697.48117.80151.46175.43
91.435.5412.8122.6535.1751.4767.2692.93110.02144.48166.21
9.51.345.3511.8421.1733.0048.0164.3484.21105.55130.21153.53
101.304.9811.5520.1030.6844.2860.9280.44101.37124.05156.65
10.51.224.6010.5718.8727.8641.0157.6075.2393.02116.21139.36
111.114.5010.2318.2128.0039.8554.5972.4687.14107.94134.82
11.51.064.169.5216.6226.5037.3950.2068.2581.66105.79124.88
121.033.958.9415.9624.4236.7246.7162.9583.2896.03117.19
12.50.983.798.5514.8224.5734.8645.8459.9275.5393.79113.88
130.903.518.1314.6621.5830.9741.6956.2671.3689.72103.86
13.50.833.317.3812.8019.7828.8040.1552.9566.1280.31101.26
140.783.086.9412.2619.0226.6736.8848.4160.0877.1793.49
14.50.762.996.4511.6318.2827.2335.9946.3359.5871.9485.61
150.712.795.8711.3117.5724.4733.3143.3754.6467.5085.45
15.50.632.605.9010.6516.5623.1131.0141.1552.5064.0381.20
160.622.485.619.8615.2421.5730.0738.6850.4361.0375.98
16.50.582.345.169.3714.4421.2428.7135.9747.2058.1970.08
Table 14. FHS impact on wave energy conversion.
Energy (MWh/yr.)Δ Base EnergyMean Power Matrix
Bin Variation
Std. Deviation Power
Matrix Bin Variation
Capture Width Ratio (CWR)
Base234.11N/AN/AN/A10.03%
Extreme263.8512.70%13.90%6.20%11.31%
Mild242.883.74%3.80%2.10%10.41%
Disclaimer/Publisher’s Note: The statements, opinions and data contained in all publications are solely those of the individual author(s) and contributor(s) and not of MDPI and/or the editor(s). MDPI and/or the editor(s) disclaim responsibility for any injury to people or property resulting from any ideas, methods, instructions or products referred to in the content.

