Article

Assessing the Influence of the Benthic/Pelagic Exchange on the Nitrogen and Phosphorus Status of the Water Column, under Physical Forcings: A Modeling Study

by
José Fortes Lopes
1,2
1
Departamento de Física, Universidade de Aveiro, 3810-193 Aveiro, Portugal
2
Centro de Estudos do Ambiente e do Mar (CESAM), Universidade de Aveiro, 3810-193 Aveiro, Portugal
J. Mar. Sci. Eng. 2024, 12(8), 1310; https://doi.org/10.3390/jmse12081310
Submission received: 2 July 2024 / Revised: 29 July 2024 / Accepted: 30 July 2024 / Published: 2 August 2024

Abstract

:
The main purpose of this study is to set up a biogeochemistry model for the Ria de Aveiro ecosystem and evaluate the relative importance of the main parameters and the processes occurring at the interface between the water column and the upper layer of the bottom sediment. It addresses a gap in modeling the interactions between the biogeochemical status of the water column and the upper sediment layer in the Ria de Aveiro lagoon ecosystem. Traditional modeling studies treated the bottom sediment as a rigid boundary, ignoring significant biogeochemical interactions at the interface between the water column and the upper layer of the bottom sediment. Therefore, the model integrates, besides the main biogeochemical processes within the water column, those occurring at the upper benthic layer, focusing on nitrogen (N) and phosphorus (P) cycles. This approach aims to enhance the accuracy of model predictions and understanding of the Ria de Aveiro lagoon’s biogeochemical dynamics. The study will be focused on the following coupled state variables: TN/IN and TP/IP, for total and inorganic nitrogen (N) and total and inorganic phosphorus (P), respectively, where total stands for the sum of organic and inorganic components of those elements. The model was set up and validated for some water quality stations of the Ria de Aveiro. Analysis has identified key parameters influencing TN and TP, such as nitrification, denitrification rates, and oxygen penetration. TN was found sensitive to nitrate and ammonium diffusion coefficients, while TP was influenced by iron–phosphate interactions and phosphorus mineralization. Concerning the model validation, the results demonstrated that the RMSE and MAPE values for the main variables fall within an acceptable range, given the uncertainty related to data. The model was applied to assess the impact of the following physical forcing: river flow, water temperature, and salinity on N and P status of the water column. The results clearly demonstrate that bottom layer and water column interactions play an important role in the N and P status of the water column and contribute to the N and P concentration changes of the water. The influence of river flows alone led to contrasting behaviors among the lagoon stations, with significant increases in TP levels, which may be attributed to sediment release from the sediment layer. Nevertheless, the combination of high river flows and elevated nutrient levels at the river boundaries has led to significantly increased nitrogen (N) and phosphorus (P) levels, underscoring the influence of river flow on the interaction between bottom layer sediment and the water column. High water temperatures typically lead to an increase in total phosphorus (TP) levels, indicating a possible release from the sediment layer. Meanwhile, TN levels remained stable. Salinity changes had a minor impact compared to river flow and temperature. The study emphasizes the importance of understanding interactions between the water column and sediment, particularly in shallow intertidal areas. Overall, the inclusion of biogeochemical interactions between the benthic and pelagic layers represents progress in ecosystem modeling of the Ria de Aveiro.

1. Introduction

Sediment biogeochemistry plays a crucial role in aquatic ecosystems through the recycling of organic matter [1,2,3]. The benthic environment is a key component of marine systems, serving as a transfer zone between the biosphere and geosphere. It modulates the biogeochemical cycles of carbon, macro- and micronutrients, and other trace elements. The benthic components of the aquatic ecosystems, which reside in the upper sediment layer, have the potential to contribute to the overall system maintenance and functioning through benthic/pelagic coupling, which involves the exchange between the sediment layer and water column, particularly in shallow-water ecosystems. Nutrients like nitrogen and phosphorus are recycled through processes such as mineralization and denitrification, influencing primary productivity and ecosystem dynamics. It can be, therefore, a source of matter for the water column (e.g., the releasing or burial of nutrients from mineralization of organic matter) as well as a temporary or permanent sink [4,5,6,7,8,9].
The processes controlling the interaction between the benthic and pelagic layers tend to be restricted to the surface layer of the benthic sediment–water interface, a few centimeters deep, where most of the main chemical and biological processes occur [10,11]. In fact, the biological characteristics of the top sediment layer may have a significant impact on how the bed reacts to outside influences. Wijsman et al. [12] found that the rate of benthic mineralization often decreases significantly with depth into the sediment. In some cases, oxygen depletion may occur below a few millimeters of the sediment layer, leading to the cessation of organic material remineralization [1,13,14,15,16]. By incorporating and more accurately quantifying the interactions between the benthic and pelagic layers, our understanding of coastal water ecosystems can be enhanced.
Mathematical models that address the primary biogeochemical processes occurring in both the benthic and pelagic layers can accurately replicate coastal ecosystems. One significant advantage of this modeling approach is that once the system’s processes are understood, the impacts of changing initial and boundary conditions can be, in principle, well simulated [1]. However, a prerequisite for this modeling approach is a proper understanding of the processes being modeled. Meanwhile, processes occurring within benthic systems are typically under-represented in marine ecosystem models, both in regional and global applications. They are often simplified and presented as simple closure terms for mass conservation [1,17,18,19,20,21]. In the past, most modeling studies of coastal water ecosystems rarely considered the upper layer of benthic sediment as an active layer. Instead, it was often treated as a static and rigid boundary that only interacted mechanically with the flow through momentum and heat exchanges. This interaction was influenced by factors such as local bottom topography, wave climate, and sediment supply. This approach is sometimes justified because marine hydrodynamic models and pelagic biogeochemistry or plankton models typically operate at spatial and temporal scales that are compatible over larger scales (kilometers) in two or three dimensions, under unsteady-state assumptions. In contrast, benthic models are typically one-dimensional (vertical) and tend to be applied over smaller spatial scales (millimeters to meters), assuming steady-state conditions [1,3,6,8]. As the knowledge of sediment biogeochemistry and reactive processes continues to improve [22,23,24,25,26,27], pelagic/benthic models have become increasingly effective and reliable. Indeed, fully coupled regional 3D pelagic/benthic models are now widely available and applied in several aquatic and marine systems. These models forecast system responses to changes in the water column’s status and/or oxygen supply, considering factors such as environmental temperature variations, the annual cycle of organic matter accumulation, or long-term eutrophication. They are grounded in a mechanistic understanding of sediment processes. These are called ‘one-way’ coupled physical–biogeochemical dynamics, wherein the influence of simulated biogeochemistry on physics is disregarded, enabling the physical component to operate independently of the biogeochemical model [28,29,30,31,32,33,34,35].
The present study introduces a novel approach in modeling the Ria de Aveiro ecosystem by incorporating a coupled pelagic/benthic model. This model is centered on the nitrogen (N) and phosphorus (P) cycles within the upper layer of the bottom sediment, integrating biogeochemical processes occurring in both the water column and sediment interface [36,37,38,39]. Unlike previous studies, which typically focused solely on either water column or sediment processes, this approach recognizes the bottom sediment layer as an active component influencing nutrient recycling (specifically N and P) between the water column and sediment interface. By incorporating the sediment layer into the model, it is expected to better simulate the dynamics of nutrient cycling within the water ecosystem and therefore improve the modeling accuracy. Specifically, it will seek to assess whether this novel approach enhances the existing understanding of the lagoon’s biogeochemical processes. The study will, therefore, provide insights into the importance of sediment biogeochemistry in the status of the water column nutrient and overall ecosystem functioning.

The Study Area

The Ria de Aveiro (Riav) is a well-studied estuarine system which is located at the Northwest Atlantic coast of Portugal (40°38′ N, 8°45′ W). Spanning 45 km in length and 10 km in width, it exhibits an area ranging from 66 to 83 km2 during low and high tides, respectively [40,41]. Its shallow nature characterizes this lagoon, with an average depth of approximately 1 m. The Ria de Aveiro lagoon is semi-diurnal, experiencing two high tides and two low tides each day. The average tidal range near the inlet is around 2 m. However, the tidal range can vary significantly, from approximately 0.6 m during neap tides to up to 3.2 m during spring tides. The morphology of the Riav comprises several branching channels that converge towards the lagoon mouth, which is connected to the ocean by a single tidal channel [40,41]. Its central regions consist of a network of smaller channels interspersed with shallow tidal flats. These features contribute to the lagoon’s dynamic hydrodynamics, sediment transport processes, and biogeochemical cycling. Tidal currents and fluctuations significantly influence salinity patterns in the Ria de Aveiro. The lagoon exhibits a well-mixed and tidal-dominant status. During high tides, seawater enters the lagoon, leading to rapid increases in salinity levels, often approaching oceanic values, particularly when river flow is small to moderate. Conversely, low tides facilitate the mixing of seawater with freshwater primarily at the far end reaches, resulting in localized salinity gradients. This situation, however, changes during periods of high runoff, where the salinity values decrease [42,43,44,45,46,47,48].
The Riav ecosystem has been extensively studied using multidisciplinary approaches encompassing physical and biogeochemical investigations. Research within this system has focused on understanding various aspects of its hydrodynamics, sediment dynamics, nutrient cycling, and ecological interactions. Such studies have provided valuable insights into the functioning of lagoon ecosystems and their response to natural and anthropogenic influences. Overall, the lagoon serves as an important model system for studying ‘estuarine’ processes, offering opportunities to advance knowledge in coastal science and contribute to the management and conservation of similar ecosystems worldwide [42,43,44,45,46,47,48].
During the study period from October 2000 to June 2001, there were significant increases in freshwater flow into the lagoon system, primarily driven by high rainfall levels. The wet season, spanning from autumn 2000 to mid-spring 2001, experienced a continuous rise in precipitation, peaking at around 350 mm in both December 2000 and March 2001. With observed rainfall reaching peak values of around 350 mm in December 2000 and March 2001, given the correlation between rainfall and river flows, and based on the knowing average flow rates for the Vouga river ([25–50 m3/s]) and Antuã river ([5–10 m3/s]), it is reasonable to expect that the increased precipitation would have led to high river flows, and exceeding the typical average flow rates by a significant margin or several times. This has contributed to a notable increase in freshwater input into the system, significant changes in the salinity patterns, and a high level of nutrient inflow. Conversely, the summer of the same period was characterized by typically drier conditions, despite occasional precipitation. In June 2000, for instance, the minimum observed precipitation was less than 10 mm, with a maximum of 50 mm. These dry conditions contrasted sharply with the elevated rainfall of the study period [43,44,45,46,47,48].
Table 1 presents the salinity, the temperature, and the nutrient concentration values as observed during 2000–2001 at the river boundaries of the Riav. A range of salinity values of [0–33] PSU characterizes the lagoon between the river boundaries and the ocean boundaries. While typical salinity values at the lagoon mouth range within (30, 34) PSU during a dry season, extremely low salinity values of 6 PSU were observed during the 2000–2001 wet period. The water temperature experiences seasonal fluctuations, ranging from 13 °C to 24 °C throughout the year. In late autumn, winter, and early spring, temperatures vary from 11 °C to 18 °C. Specifically, along the ocean boundary, temperatures range from 11 °C to 17 °C, while within the main lagoon body, they remain between 11 °C and 13 °C. Conversely, during summer, the temperature rises, typically ranging between 18 °C and 24 °C. Along the ocean boundary, temperatures range from 18 °C to 20 °C, while within the main lagoon body, they range between 20 °C and 24 °C. The nutrient concentrations underwent significant changes during the same period. Within the river boundaries, there were notable peaks in N-total and P-total concentrations, encompassing both inorganic and organic phases, ranging between 0.5 and 12.0 mg/L and 0.1 and 1.5 mg/L, respectively. Particularly, the Antuã river exhibited the highest concentrations, reaching values up to 12.0 mg/L for N-total and 1.2 mg/L for P-total, whereas lower values were seen for the Vouga river, with N-total and P-total up to 0.3 mg/L. Organic nitrogen constitutes, in general, a smaller proportion of the N-total. Notably, during the autumn of 2000, the concentration of N-total reached 3.0 mg/L in Mira, while inorganic nitrogen (IN) accounted for only 0.1 to 0.3 mg/L. It is worth noting that during the wet period, the organic nitrogen concentration was found to be abnormally high in some areas, reaching concentrations up to 90% of the total nitrogen concentration. Regarding dissolved oxygen (DO) levels, they ranged within the range of 6.5 to 12 mg/L. The highest DO values were recorded at the ocean boundaries, averaging around 11 mg/L, as well as at the farthest reaches of the Vouga river, where levels peaked at 12 mg/L. Seston, which refers to particulate organic and inorganic matter suspended in water, shows wide-ranging values in the Ria de Aveiro, but no clear patterns were found. These values can vary based on factors such as water movement, biological activity, and the presence of organic and inorganic material. During the study period, the concentration values ranged from 8.1 mg/L, typical of transparent waters, to 56.9 mg/L, depicting productive or turbid environments [43]. Benthic microalgae, or microphytobenthos, play a crucial role in the ecological dynamics of sediment and nutrient exchange in the Ria de Aveiro. Their presence and activity can significantly impact sediment quality and the overall health of the aquatic system. Their productivity and biomass exhibit spatiotemporal variability, influenced by factors such as light availability, nutrient concentrations, and tidal regimes [49]. When they die or are taken up, nutrients are released back into the sediment or the water column, contributing to nutrient cycling and highlighting the role of sediment exchange in the nutrient budget of the water column.

2. Material and Methods

2.1. The Main Model

The main model used in this study is a biogeochemistry model very similar to the one used in earlier research, Mike3-EU [50,51], particularly focusing on the lower trophic levels of the pelagic web as evidenced by Lopes et al. [46,47]. However, a key departure from the previous model lies in the incorporation of a benthic biogeochemistry module (the upper layer), specifically addressing the nitrogen (N) and phosphorus (P) cycles at the interface between the water column and the upper layer of bottom sediments.
The core pelagic model (for the water column) consists of four functional groups: chlorophyll, phytoplankton, zooplankton, and benthic vegetation and detritus, alongside organic matter (detritus), organic and inorganic nutrients, dissolved oxygen, area-based biomass of benthic vegetation, total nitrogen, and phosphorus.
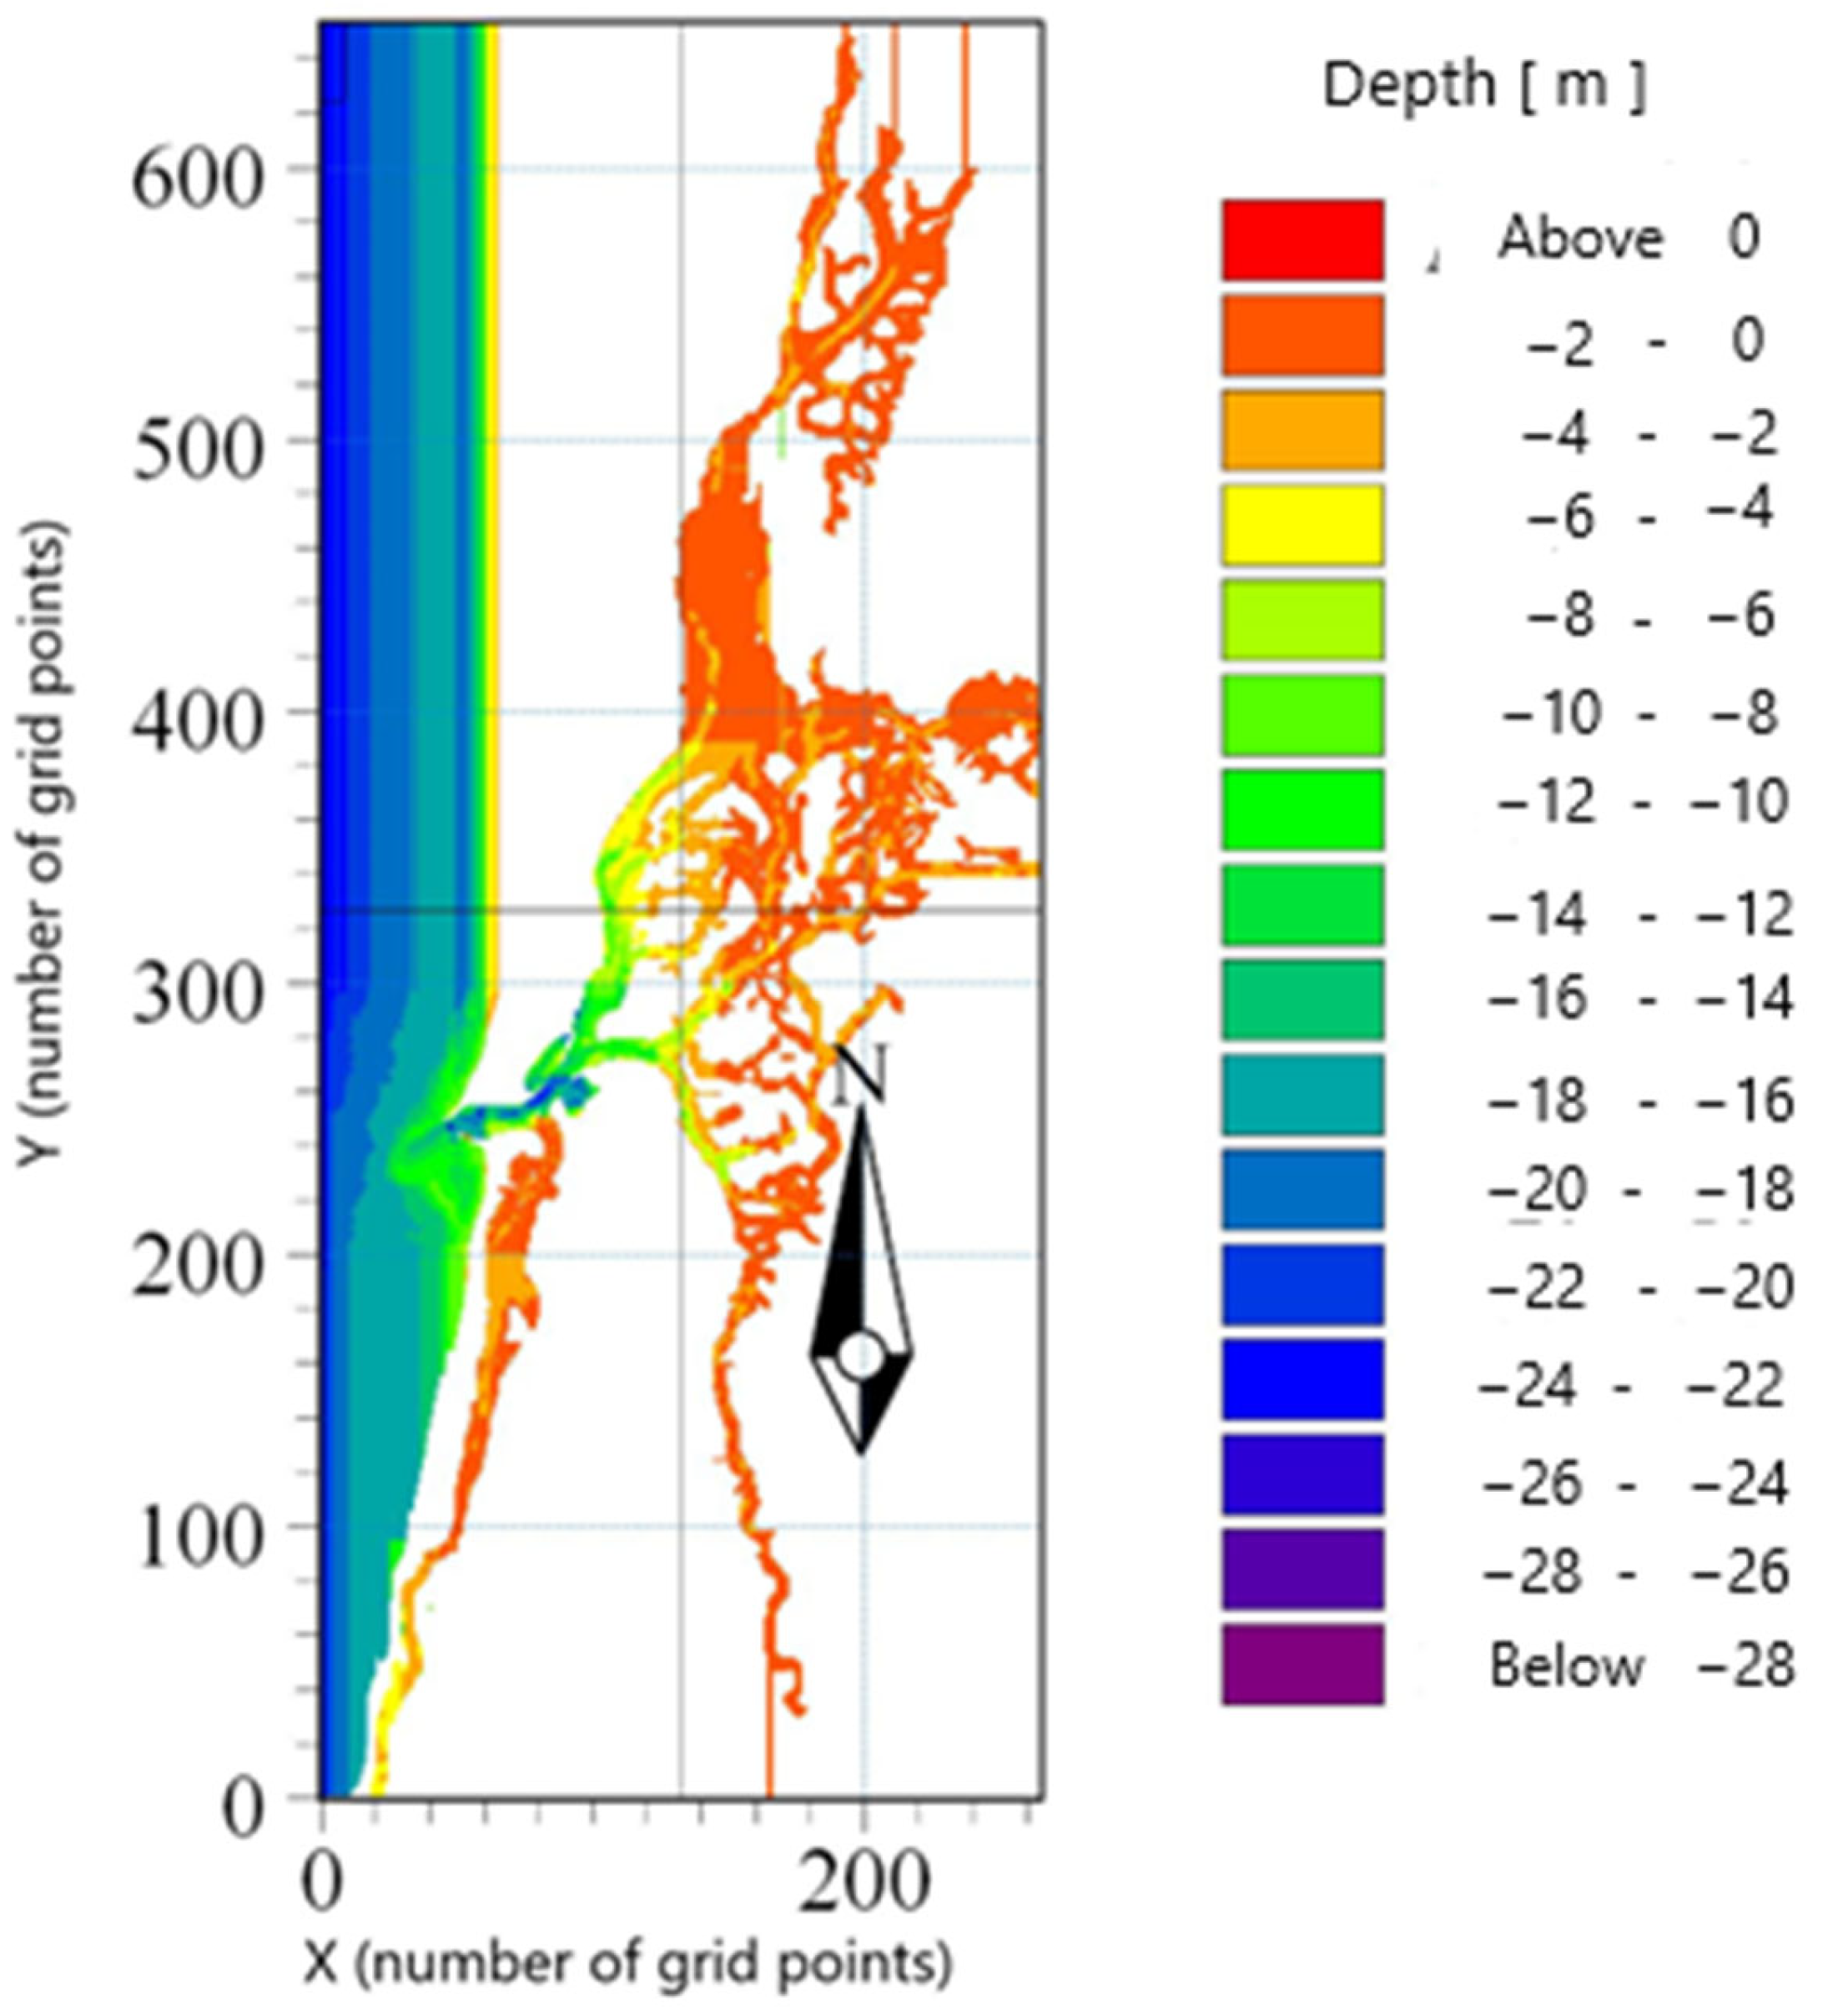
This biogeochemistry module is integrated with a 3D hydrodynamic/transport model [50]. This comprehensive framework solves the three-dimensional incompressible Reynolds-averaged Navier–Stokes equations, employing Boussinesq and hydrostatic pressure approximations. Furthermore, it addresses the computation of water temperature, salinity, and trace elements within the Riav system (Figure 1). The computational modeling system aimed to solve the hydrodynamics and transport equations and uses a rectangular horizontal computational grid composed of 265 (x-direction) by 655 cells (y-direction) (Figure 2). This figure represents the true boundaries of the computational domain when compared to Figure 1. In the vertical direction (z-direction), due to the shallowness of the domain, a 3-layer sigma coordinate is utilized. These coordinates are often used in hydrodynamic models to represent the vertical water profile more accurately, especially in shallow areas where depth variation is significant. The time and spatial steps are, respectively, 1.5 s and 60 m. This configuration enables absolute stability conditions for the integration of hydrodynamics and transport equations, making it well-suited to perform hydrodynamic and transport simulations in a stable and precise manner. This is particularly beneficial considering the complex characteristics of the study area and the phenomena being modeled.

2.2. The Pelagic Biogeochemistry Module

This section describes the nitrogen (N) and phosphorus (P) cycles which occur at the interface between the sediment layer and the water column [50,51]. It integrates the main model (biogeochemistry) and shares some baseline state variables and input processes with it. The exchanges with the water column involve the release of N and P by the sediment, which is depicted as a fraction of the settled N and P, subsequently returning to the sediment, and re-entering the water column. Figure 3 summarizes the conceptual diagram of the pelagic model.

2.3. The Benthic Biogeochemistry Module

2.3.1. The Nitrogen Cycle in the Sediment Layer

The processes involving N in the sediment layer in the model are described by the following state variables, as described in [50,51,52,53,54,55,56,57,58], and summarized in Figure 4:
-
SON for organic N in sediment;
-
SNH representing total NH4-N in sediment pore water;
-
SN03 indicating total NO3 in sediment;
-
SNIM for immobilized N in sediments.
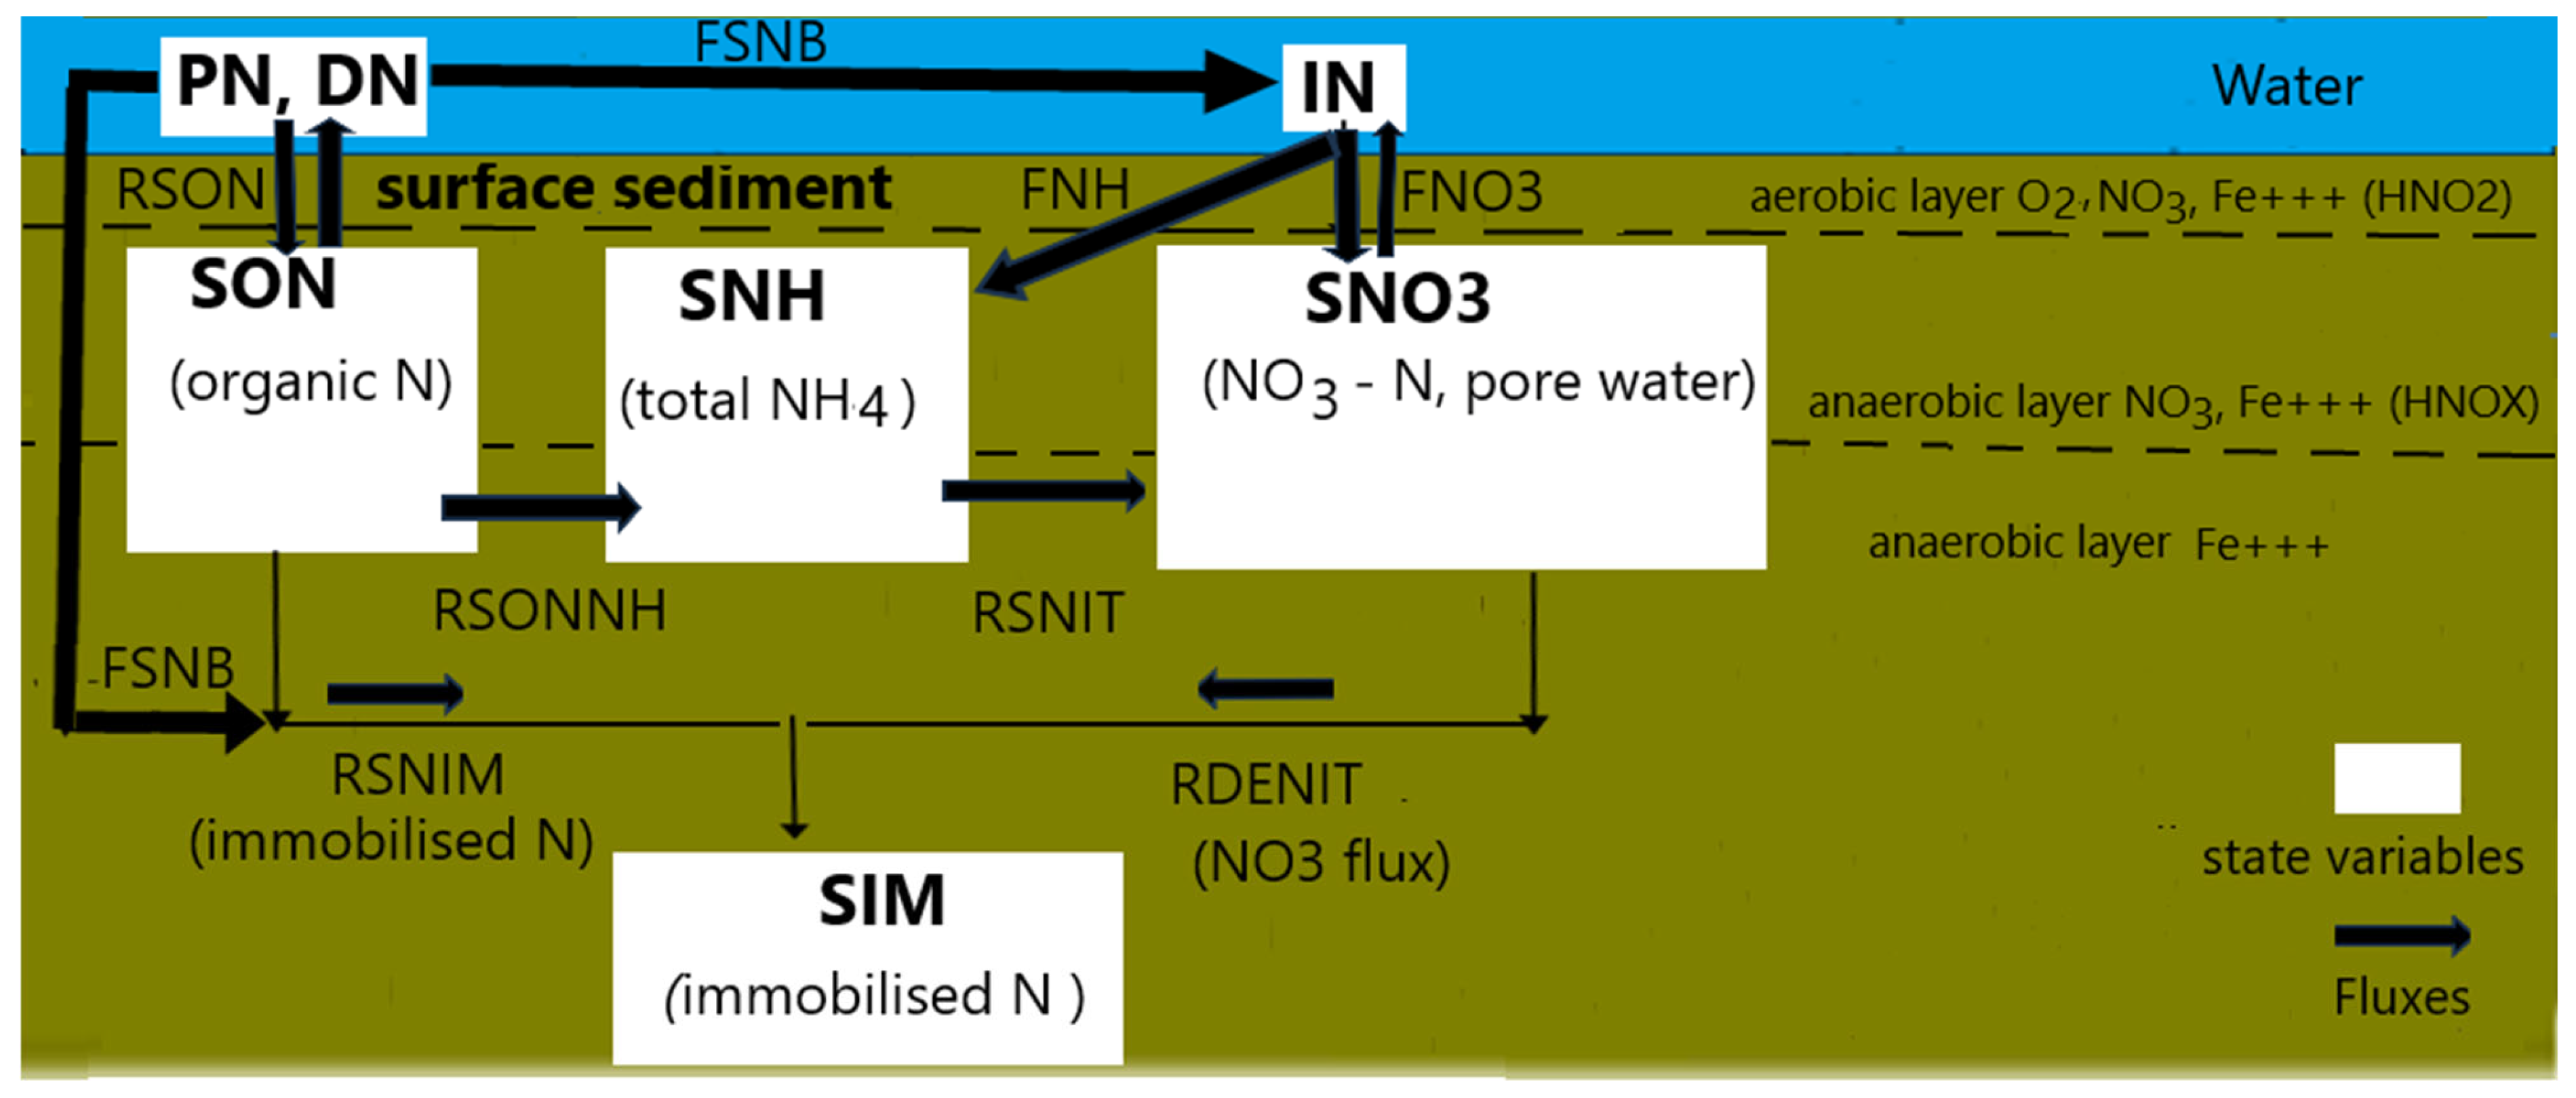
Figure 4. The N-cycle in the sediments.
Jmse 12 01310 g004
Within the sediment, N can undergo mineralization into NH4, while NO3 may be denitrified or exchanged with inorganic N in the water column. NH4 and NO3 are considered inorganic N (IN), with the assumption that the ratio of NH4 to NO3 in the water column just above the sediment surface mirrors that of the sediment. Additionally, NH4 in sediment may undergo exchange with inorganic N or be nitrified into NO3 in the uppermost sediment layer with the presence of O2. It is assumed that a fraction is available for nitrification and for flux across the sediment surface. Given that nitrification is an aerobic process, it is confined to the sediment layer with O2.
The processes involving the N-cycle in the sediments are depicted in Figure 3 and described by differential equations. For instance, SON is described by the following equation:
d     S O N d t = R S O N R S O N N H R S N I M
where RSON, RSONNH, and RSNIM represent processes accounting for, respectively:
-
the remaining organic N in the sediment that contributes to the SON pool;
-
the fraction of SON, which is mineralized into NH4;
-
the fraction of the settled nitrogen which is assumed to be buried into the sediment layer.
The remaining state variables (SNH, SN03 NO3, and SNIM) are described by similar differential equations and summarized in Supplementary Material S1.

2.3.2. The Phosphorus Cycle in the Sediment Layer

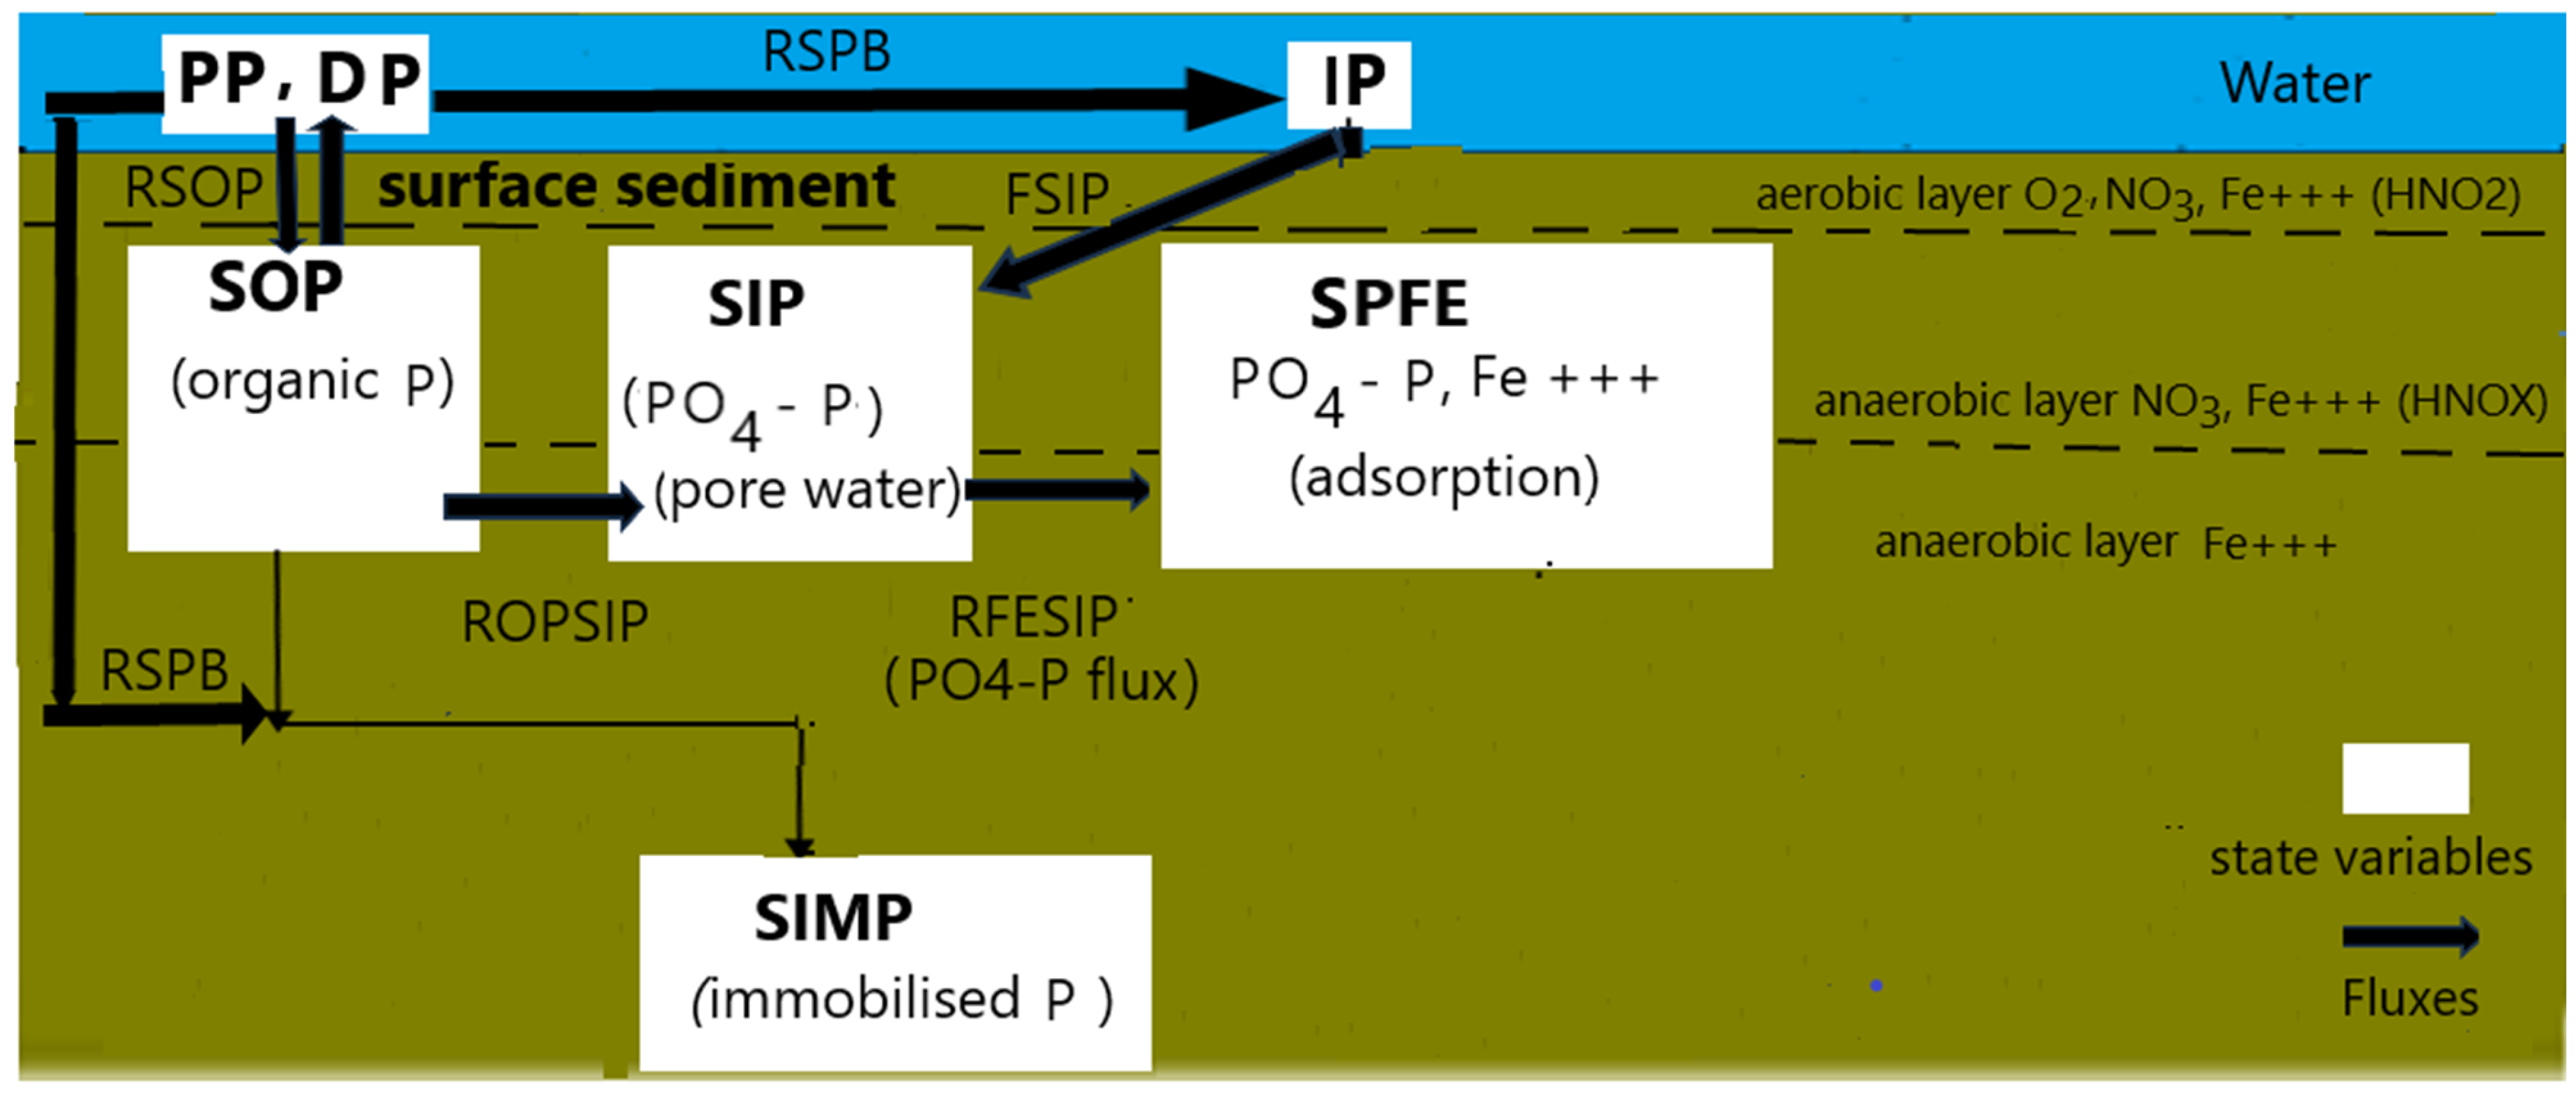
Phosphorus interacts with solid interfaces in various ways, including exchanges occurring at the solid–liquid interface, and precipitation/dissolution reactions involving solid-phase elements such as iron, calcium, and aluminum as described in [50,51,52,53,54,55,56,57], and summarized in Figure 5.
The processes involving P in the sediment layer are described by the following state variables:
-
SOP, which accounts for the organic P in sediment, which is mineralized into PO4. The exchanges of SOP through the sediment surface occur through sedimentation of algae and detritus P. A fraction of the settled SOP can be as well mineralized into PO4 on the sediment surface;
-
SIP, which accounts for the total PO4-P in sediment pore water;
-
SPFE, which accounts for the sediment PO4-P adsorbed to Fe+++; and SPIM, which accounts for the immobile P in the sediment.
The processes involving the P-cycle in the sediments are depicted in Figure 4 and described by differential equations. For instance, SOP is described by the following equation:
d   SOP dt =   RSOP + ROPSIP - SPIM
where RSOP, ROPSIP, and SPIM represent processes accounting for, respectively:
-
the remaining organic in the sediment P which flows into the organic P pool;
-
the fraction of the organic P in the sediment, SOP, which is mineralized into PO4, and is released into the pore water pool of PO4 (SIP);
-
the flux of PO4 between sediment and water which accounts for the sorption and desorption of PO4 to Fe+++.
The remaining state variables (SIP, SPFE NO3, and SPIM) are described by similar differential equations and summarized in Supplementary Material S1. (in blue, the water column; in greenish brown, the sedimentary layer).

2.4. The Statistical Tools

Model’s ability to accurately capture underlying data patterns and trends is crucial for its validation and predictive power. This process is, in general, achieved with the help of baseline or more advanced statistical metrics. The statistical tools presented hereafter have the goal of providing qualitative and quantitative insight into a model predictive skill.

2.4.1. Baseline Metrics

The error metrics for time series prediction are assessed using the Mean Absolute Percentage Error (MAPE) and the Root Mean Squared Error (RMSE), defined as follows:
  • MAPE (Mean Absolute Percentage Error): It measures the average absolute percentage difference between predicted values and observed values/mean values. It is calculated as the average of the absolute differences between predicted and observed values, divided by the observed values, and multiplied by 100.
M A P E = 1 N k = 0 N | x y ¯ y ¯ | × 100
  • RMSE (Root Mean Squared Error): It measures the square root of the average of the squared differences between predicted and observed values. It provides an overall measure of the model’s error, with higher values indicating larger errors:
R M S E = 1 N k = 0 N ( x y ¯ ) 2 1 / 2
where x is the predicted value and y ¯ a mean value.

2.4.2. Taylor Diagrams

Taylor diagrams allow for graphically illustrating model predictions relative to observation or to the baseline parameters, by summarizing into a diagram information about the magnitude and the sign of the baseline statistical metrics [59]. They can help in assessing the relative merits of various models or parameters through the analysis of the diagram.
They are based on the following relationship between the statistical metrics:
R M S D 2 = σ m 2 + σ r 2 2 σ m σ r R
where RMSD’ is defined as the unbiased RMSD,
R M S D 2 = 1 N n = 1 N m n m ¯ r n r ¯ 2
σ m is the standard deviations of the model field,
σ m 2 = 1 N n = 1 N m n m ¯ 2
σ r is the standard deviations of the observation (or the reference) field,
σ r 2 = 1 N n = 1 N r n r ¯ 2
and R is the Pearson correlation coefficient,
R = 1 N n = 1 N m m ¯ r n r ¯ σ m σ r
where the overbar indicates the mean value
m ¯ = 1 N n = 1 N m n    

3. Results

3.1. The Model Setup and Application

The model was set up and validated for the water quality stations of Figure 1 ([46,47,48]). The study focused on the coupled state variables TN/IN and TP/IP, for, respectively, total and inorganic nitrogen, N, and total and inorganic phosphorus, P, where total stands for the sum of organic and inorganic components of those elements. Data are related to monthly mean values for the ebbing and the flooding phase of the tidal cycle. Given this situation, some uncertainties regarding data simulation are to be expected.

Model Validation

The first stage prior to the model setup and validation is to identify the parameters that have the most significant impact on the model’s performance and to fine-tune their values for better results. In this respect, Taylor diagrams were performed for some parameter associated to the N and P processes (see Table S2_1 and S2_2, in Supplementary Section S2) to assess their sensitivity to a defined range of parameter variations. The results are available in Supplementary Section S2 and summarized here. TN seems to be significantly sensitive to the diffusion coefficient of the NO3 and NH4 into sediment, to the fraction of the settle N to mineralization and immobilization, and to the coefficients related to the oxygen penetration into the sediment constant. TP seems to be significantly sensitive to Fe-P sorption and the desorption of PO4 to Fe++ into sediment, to the fraction of the settled P to mineralization and immobilization, and to the coefficients related to oxygen penetration into sediment. Nevertheless, the RMSE for TN ranges between 3.0 × 10⁻² mg/L to 0.3 mg/L, for a very wide range of the parameter values (e.g., Diffu_coef (Sens4) was let to vary between 2.4 × 10⁻⁵ and 5.0 × 10⁻⁴ m2/day; see Table S2_2, Supplementary Section S2), is compared to a typical mean value of 3.0 × 10⁻¹ mg/L. Likewise, TP ranges from 2.0 × 10⁻² mg/L to 3.0 × 10⁻² mg/L, compared to a typical mean value of 2.0 × 10⁻² mg/L. Therefore, given the moderate range of the outputs and the fact that parameter variability is of the same order as the typical parameter values, we can conclude that the biogeochemical processes are relatively stable with respect to the main model parameter. Even so, given this fact, there remain some uncertainties about the parameter values.
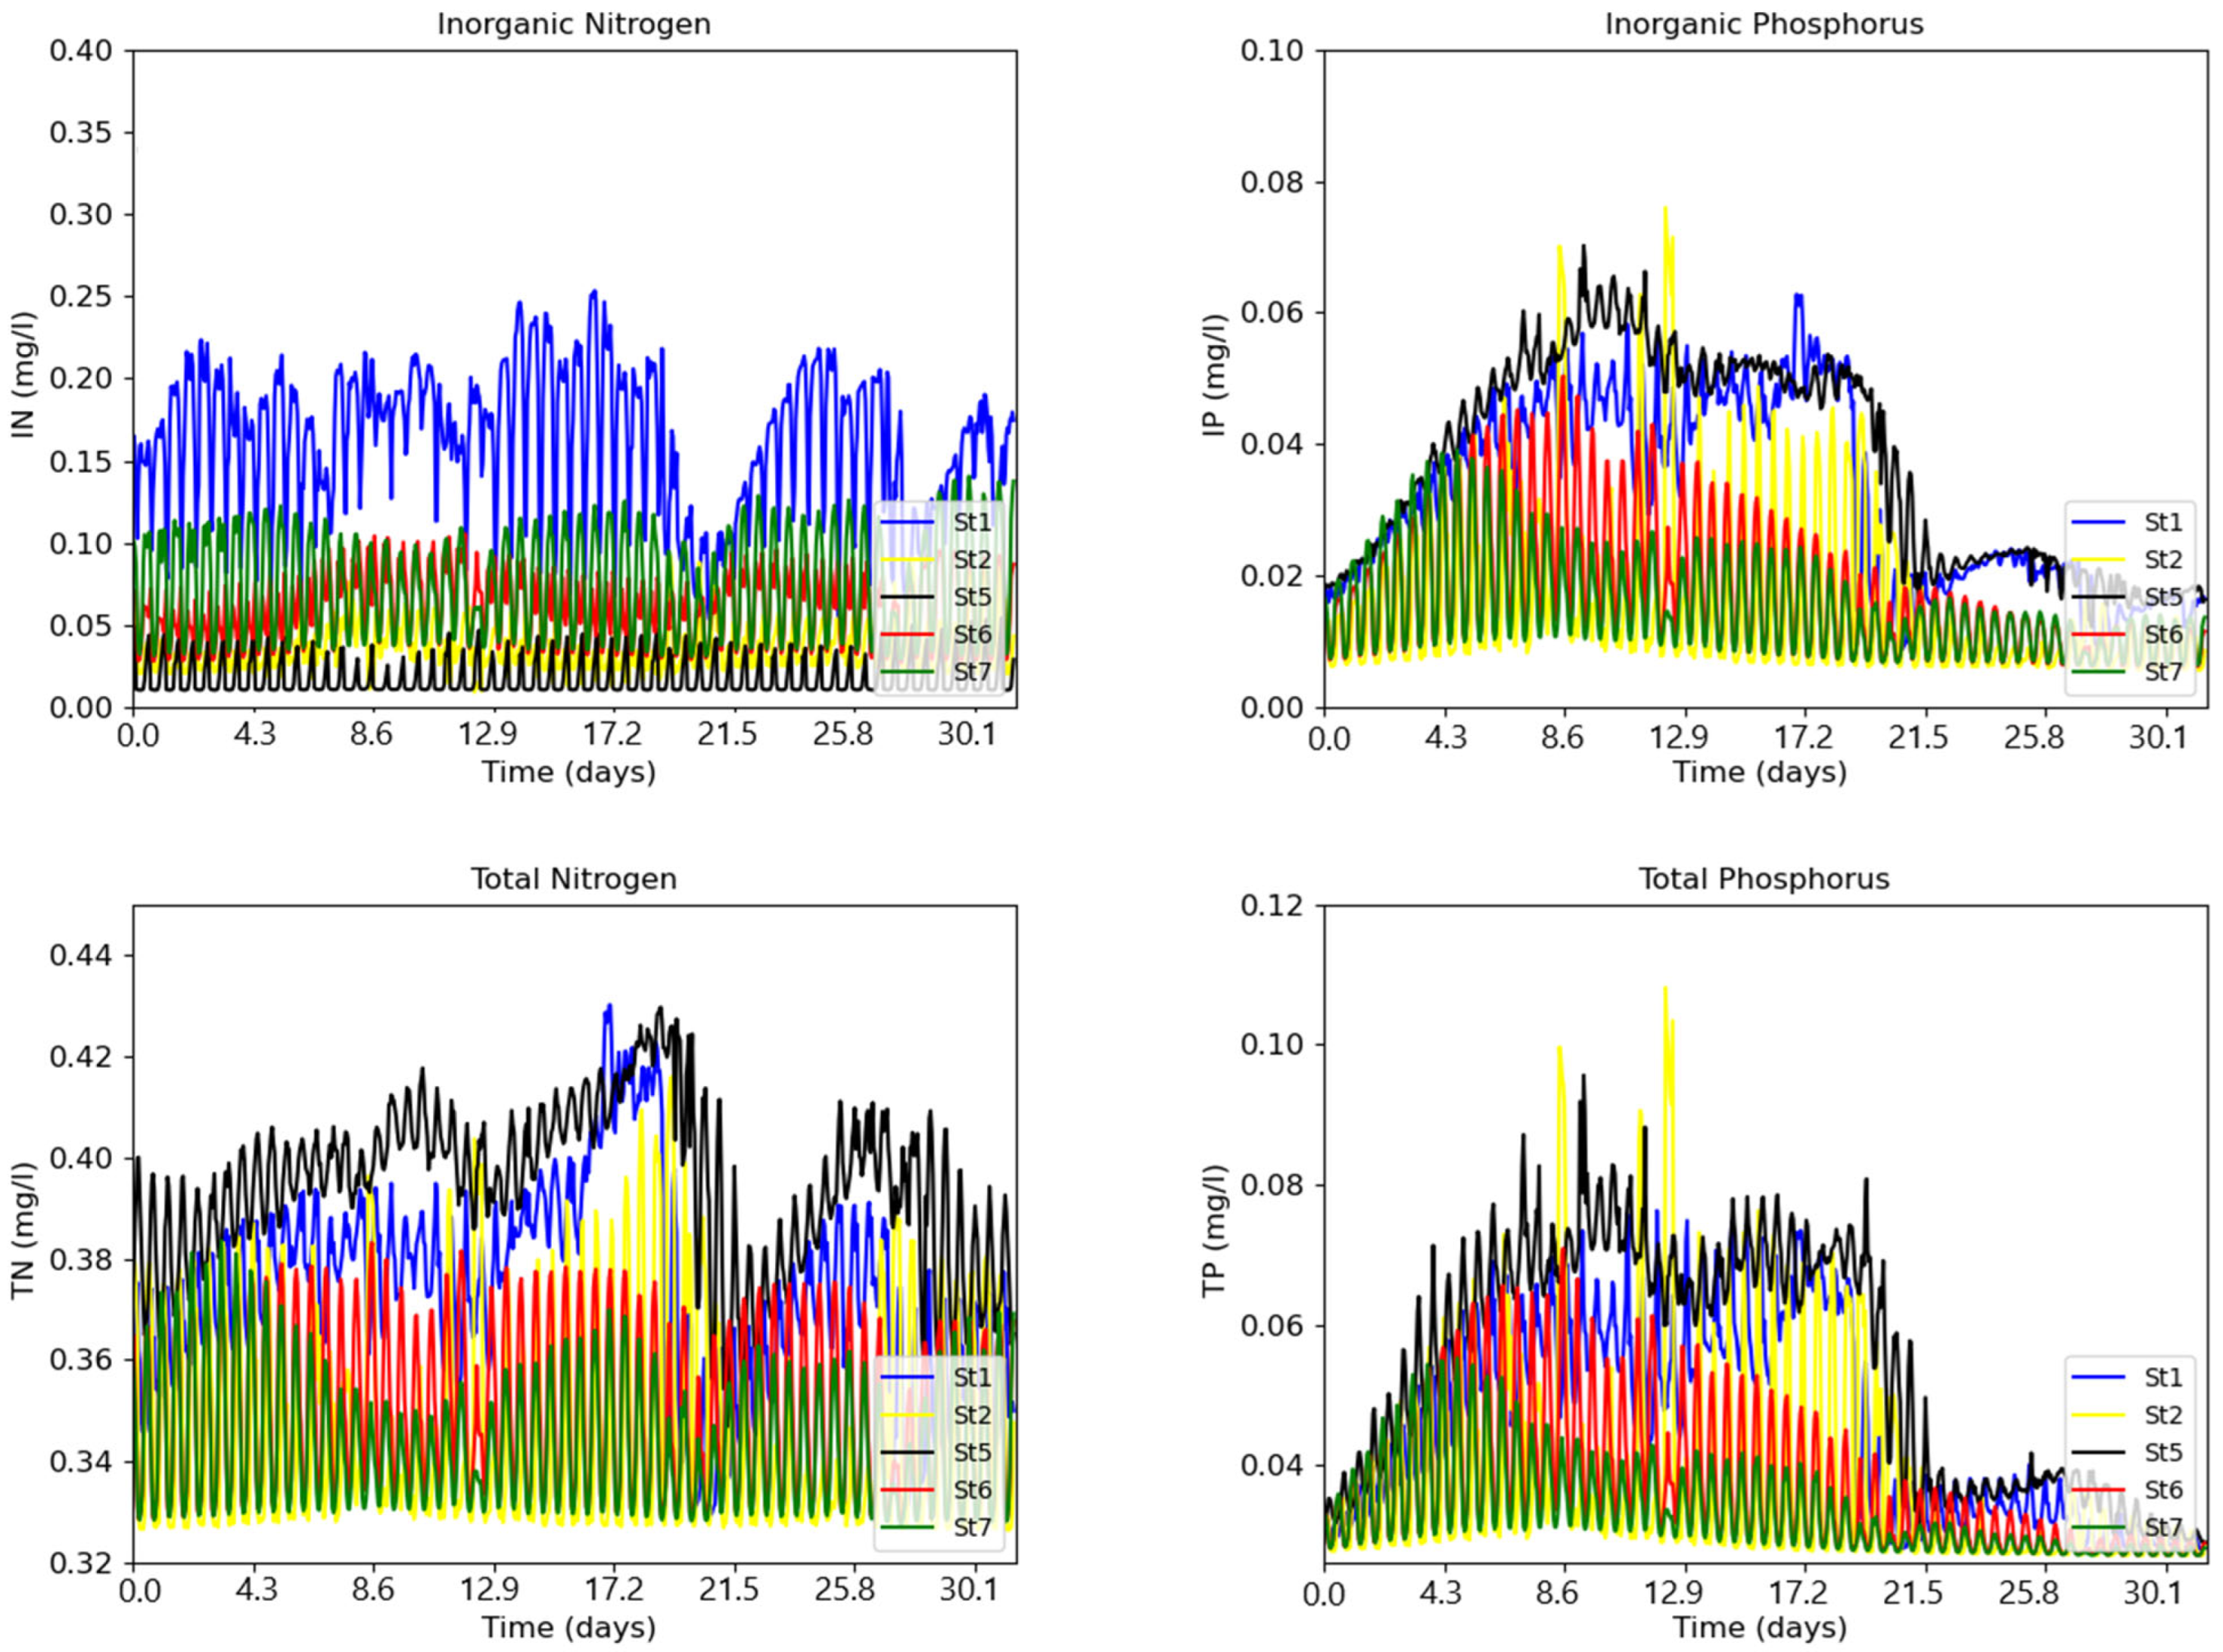
Figure 6 depicts the monthly time series of TN/IN and TP/IP, as simulated by the model under typical early summer conditions, considering moderate river runoff (the minimum values of Table 1) as defined in Section 2.1. To enhance clarity, only five out of the eight monitoring stations in Figure 1 are displayed.
The plot reveals that both pairs of state variables exhibit strong semi-diurnal variability. However, unlike TN/IN, TP/IP display a continuous increase in concentration over time, reaching peak values followed by a sharp decline towards the end of the simulation. This divergence reflects distinct behaviors between nitrogen (N) and phosphorus (P) in response to the physical and biogeochemical conditions of the water column. Namely, TN and TP exhibit significantly higher concentration values compared to their respective inorganic counterpart, IN and IP, as the former two encompass both organic and inorganic fractions. Moreover, TN demonstrates significantly higher concentration values than TP. Indeed, further examination of Table 1 and Table 2 indicate that the simulation and observed data fall within the same range for both variables. TN and IN values range within the range of [0.3, 0.4] mg/L and [0.01, 0.2] mg/L, respectively, while TP and IP values lie within the range of [0.03, 0.09] mg/L and [0.01, 0.06] mg/L, respectively. Notably, the concentrations of the two elements differ by one order of magnitude.
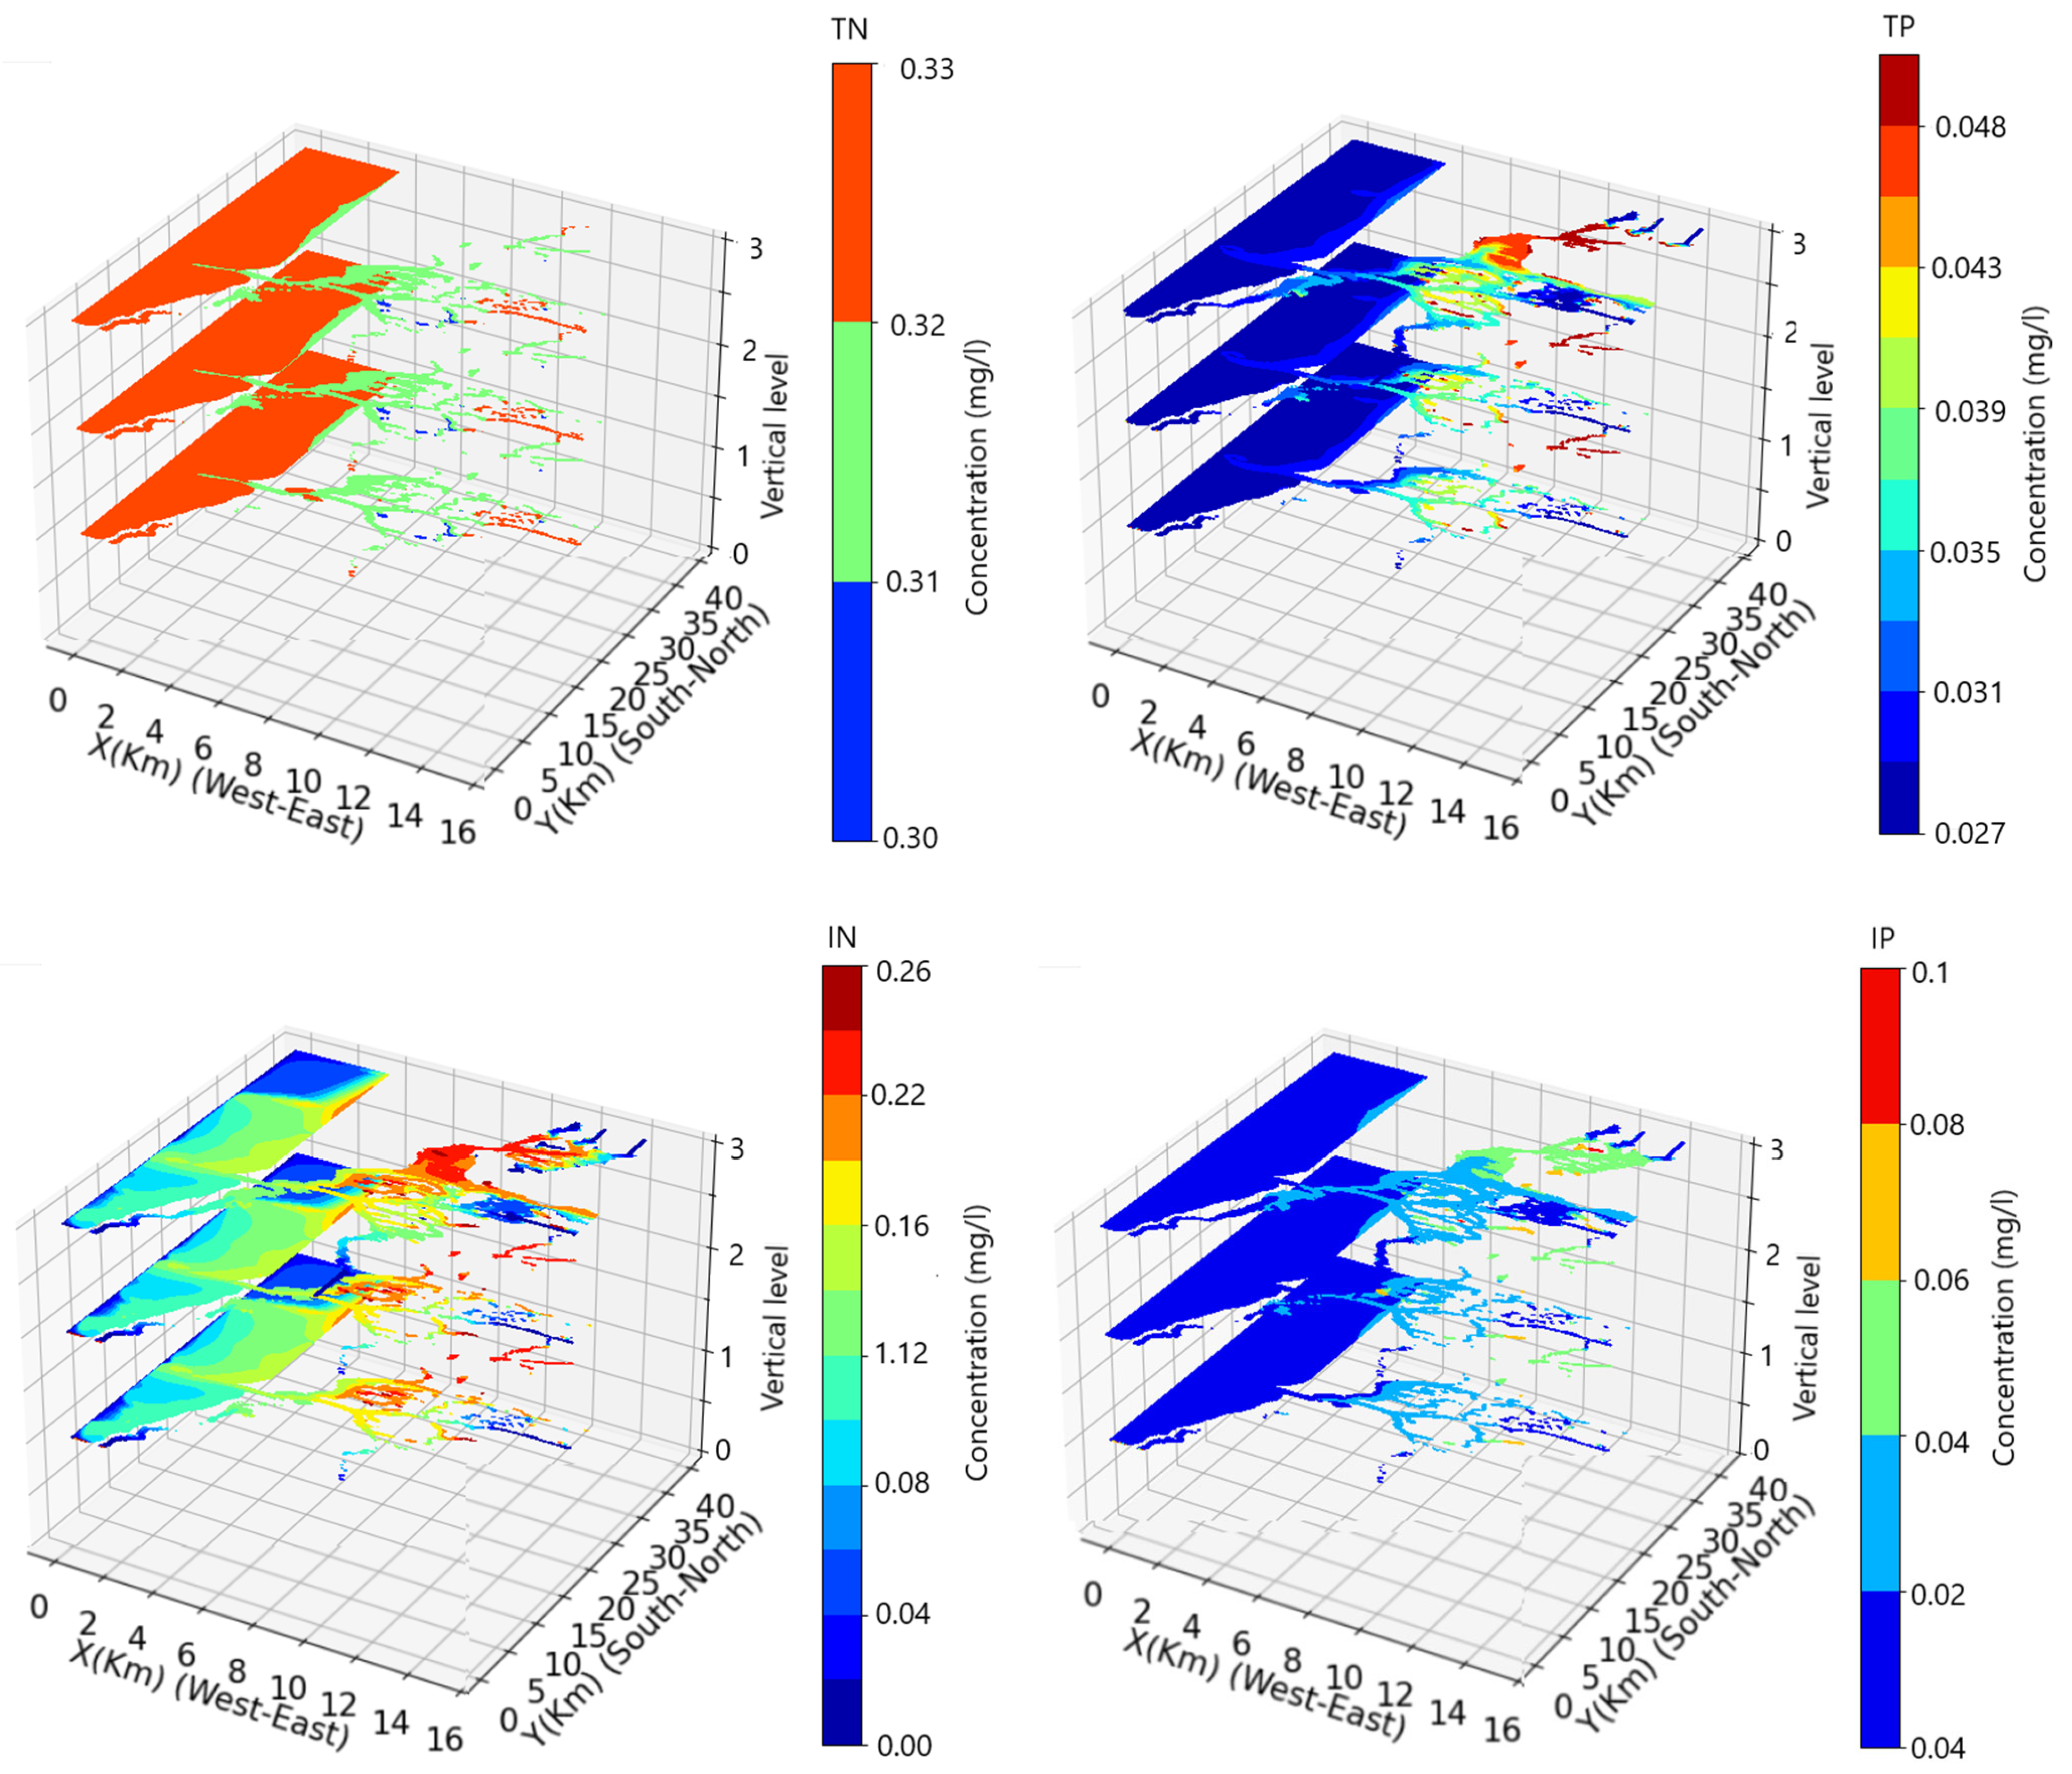
Figure 7 displays horizontal and vertical snapshots for TN, TP, IN, and IP, according to the Riav’s bathymetry in Figure 2. On the vertical axis, sigma coordinates are dimensionless. This means they are non-dimensional and represent a fraction of the total water depth in each layer. Therefore, in the vertical axis, the numbers correspond to layers (3 for the surface layer, 1.5 for the mid-layer, 0 for bottom layer). The horizontal concentration distributions exhibit a typical lagoon gradient between the mouth and the far ends of the lagoon, while the vertical distributions depict a typical well-mixed situation of a shallow water system.
Table 3 collects TN, IN, TP, and IP metrics (RMSE and MAPE) of the simulation for the eight stations of Figure 1, according to relations (11) and (12), for a typical summer situation. While y denotes the simulations, y ¯ represents data mean values for summer 2000 as shown in Table 2 (above). It is worth noting that the data only cover the ebbing and flooding phases of the tidal cycle, posing a significant constraint on the model validation process.
The RMSE values for TN range from 0.02 to 0.07 mg/L, except for stations 5, 7, and 8, where the values are close to 0.1 mg/L. Meanwhile, IN exhibits higher RMSE values, ranging from 0.07 to 0.1 mg/L, except for St1, which is approximately 0.05 mg/L. Similarly, RMSE values for TP and IP fall within the range of 0.003 to 0.009 mg/L and 0.001 to 0.13 mg/L, respectively.
Regarding MAPE, for TN and IN, the values are around 30%, except for St7 and 8, where they reach 42% and 51% for TN. For TP and IP, the values range from 5% to 30%, except for St6, 7, and 8, where they reach values higher than 50% for TP.
To further assess the model’s validity, a simulation was conducted for a typical spring situation, considering the average river flows, as defined in Section 2.1. Table 4 presents TN, IN, TP, and IP simulation metrics for the eight stations. The RMSE values for TN range from 0.016 to 0.10 mg/L, with typical values falling within [0.1, 0.2] mg/L, except for St3 (0.6 mg/L). Meanwhile, the MAPE values range within [6%, 57%], with higher values observed at St1, 5, 7, and 8. IN exhibits RMSE values within [0.026, 0.550] mg/L, while MAPE demonstrates higher values ([45%, 70%]), particularly noticeable at St5, 6, 7, and 8.
The RMSE values for TP range from 0.005 to 0.02 mg/L, with typical values in the range of [0.04, 0.07] mg/L, whereas MAPE values fall within [15%, 67%], with higher values observed at St1, 5, and 8 (>40%). IP presents RMSE values of a comparable order, generally higher overall, while MAPE displays extremely high values ([45%, 88%]) across all stations.
As concluding remarks, concerning the results, the deviation between the simulation and data for nitrogen (N) and phosphorus (P), as indicated by both RMSE and MAPE values, despite some discrepancies, namely high MAPE values, depicts some divergence between the simulated and observed data. Nevertheless, the results can be considered acceptable, as they fall within an acceptable range of values, given the uncertainty of the data, which can be attributed to the low time resolution of the sampling. Additionally, the simulated time series reveal significant tidal oscillations over daily and fortnightly cycles, requiring high-resolution data for verification. Therefore, there is still room for further improving the model validation to increase confidence in its predictions and to ensure that it is robust enough to handle a variety of scenarios. Despite this, the current model configuration can be used for further proceedings.

3.2. The Influence of the Physical Forcing on the Nitrogen and Phosphorus State of the Water Column

The model was applied to investigate the impact of the following physical forcings on the status of TN and TP. The baseline situation corresponds to the wet 2001 spring situation, corresponding to the maximum values of river flows (Table 1), leading to high salinity spatial and temporal variability (0, 34). The water temperature varied within (13, 16) °C, for, respectively, the ocean and the river boundaries. To focus exclusively on the interaction between the water column and the sediment layer, N and P concentrations at all the boundaries were set as constants for all of the simulations, including the baseline, and, respectively, 0.01 mg/L and 0.001 mg/L, which are minimal values considering the typical values of Figure 6. This choice was aimed at minimizing the influence of boundary conditions on the state of the water column and highlighting the potential effects of the bottom layer and water column interactions.
The simulation results are compared to the baseline simulation. For this, a residual is computed by subtracting the simulation from the baseline. The time series for the baseline simulation are similar to those of Figure 6 and, therefore, are not presented. Instead, Figure 8 gives a snapshot of the surface salinity, the surface temperature, the surface TN and the surface TP, taken on the 23rd day of the simulation, for the maximum river flow situation (corresponding to the baseline simulation). It can be observed that, excluding the ocean boundary, the salinity inside the lagoon shows low values, falling within the interval of (0–20) psu, well below typical values of (25–34) psu. Indeed, comparing Figure 8a with Figure 9a, which was taken under the minimum river flow situation (for a scenario which will be applied in Section 3.2.1), it turns out that there is a big difference between the two situations: in the case of weak river flows, the salinity influence is confined to the far end of the lagoon, and the values are almost close to that of the ocean salinity, except for the salinity near the river boundaries. The temperature snapshots (Figure 8b) do not show marked gradients as salinity, since the most significant variations are localized near the river boundaries. The maximum values for TN and TP for the baseline (Figure 8c,d) of 0.3 mg/L and 0.05 mg/L, respectively, are slightly lower than those of Figure 6, but of the same order. Even so, these values are very significant, since the N and P concentration values imposed at the river boundaries were minimal. The results clearly demonstrate that bottom layer and water column interactions play an important role in the N and P status of the water column. The following sections will focus exclusively on residual outputs.

3.2.1. The River Flow Influence

This experiment aimed to assess the influence of river flow on the N and P status of the water column. The river flows were set to the minimum values (Table 1), while the remaining physical and biogeochemical conditions remained unchanged relative to the baseline.
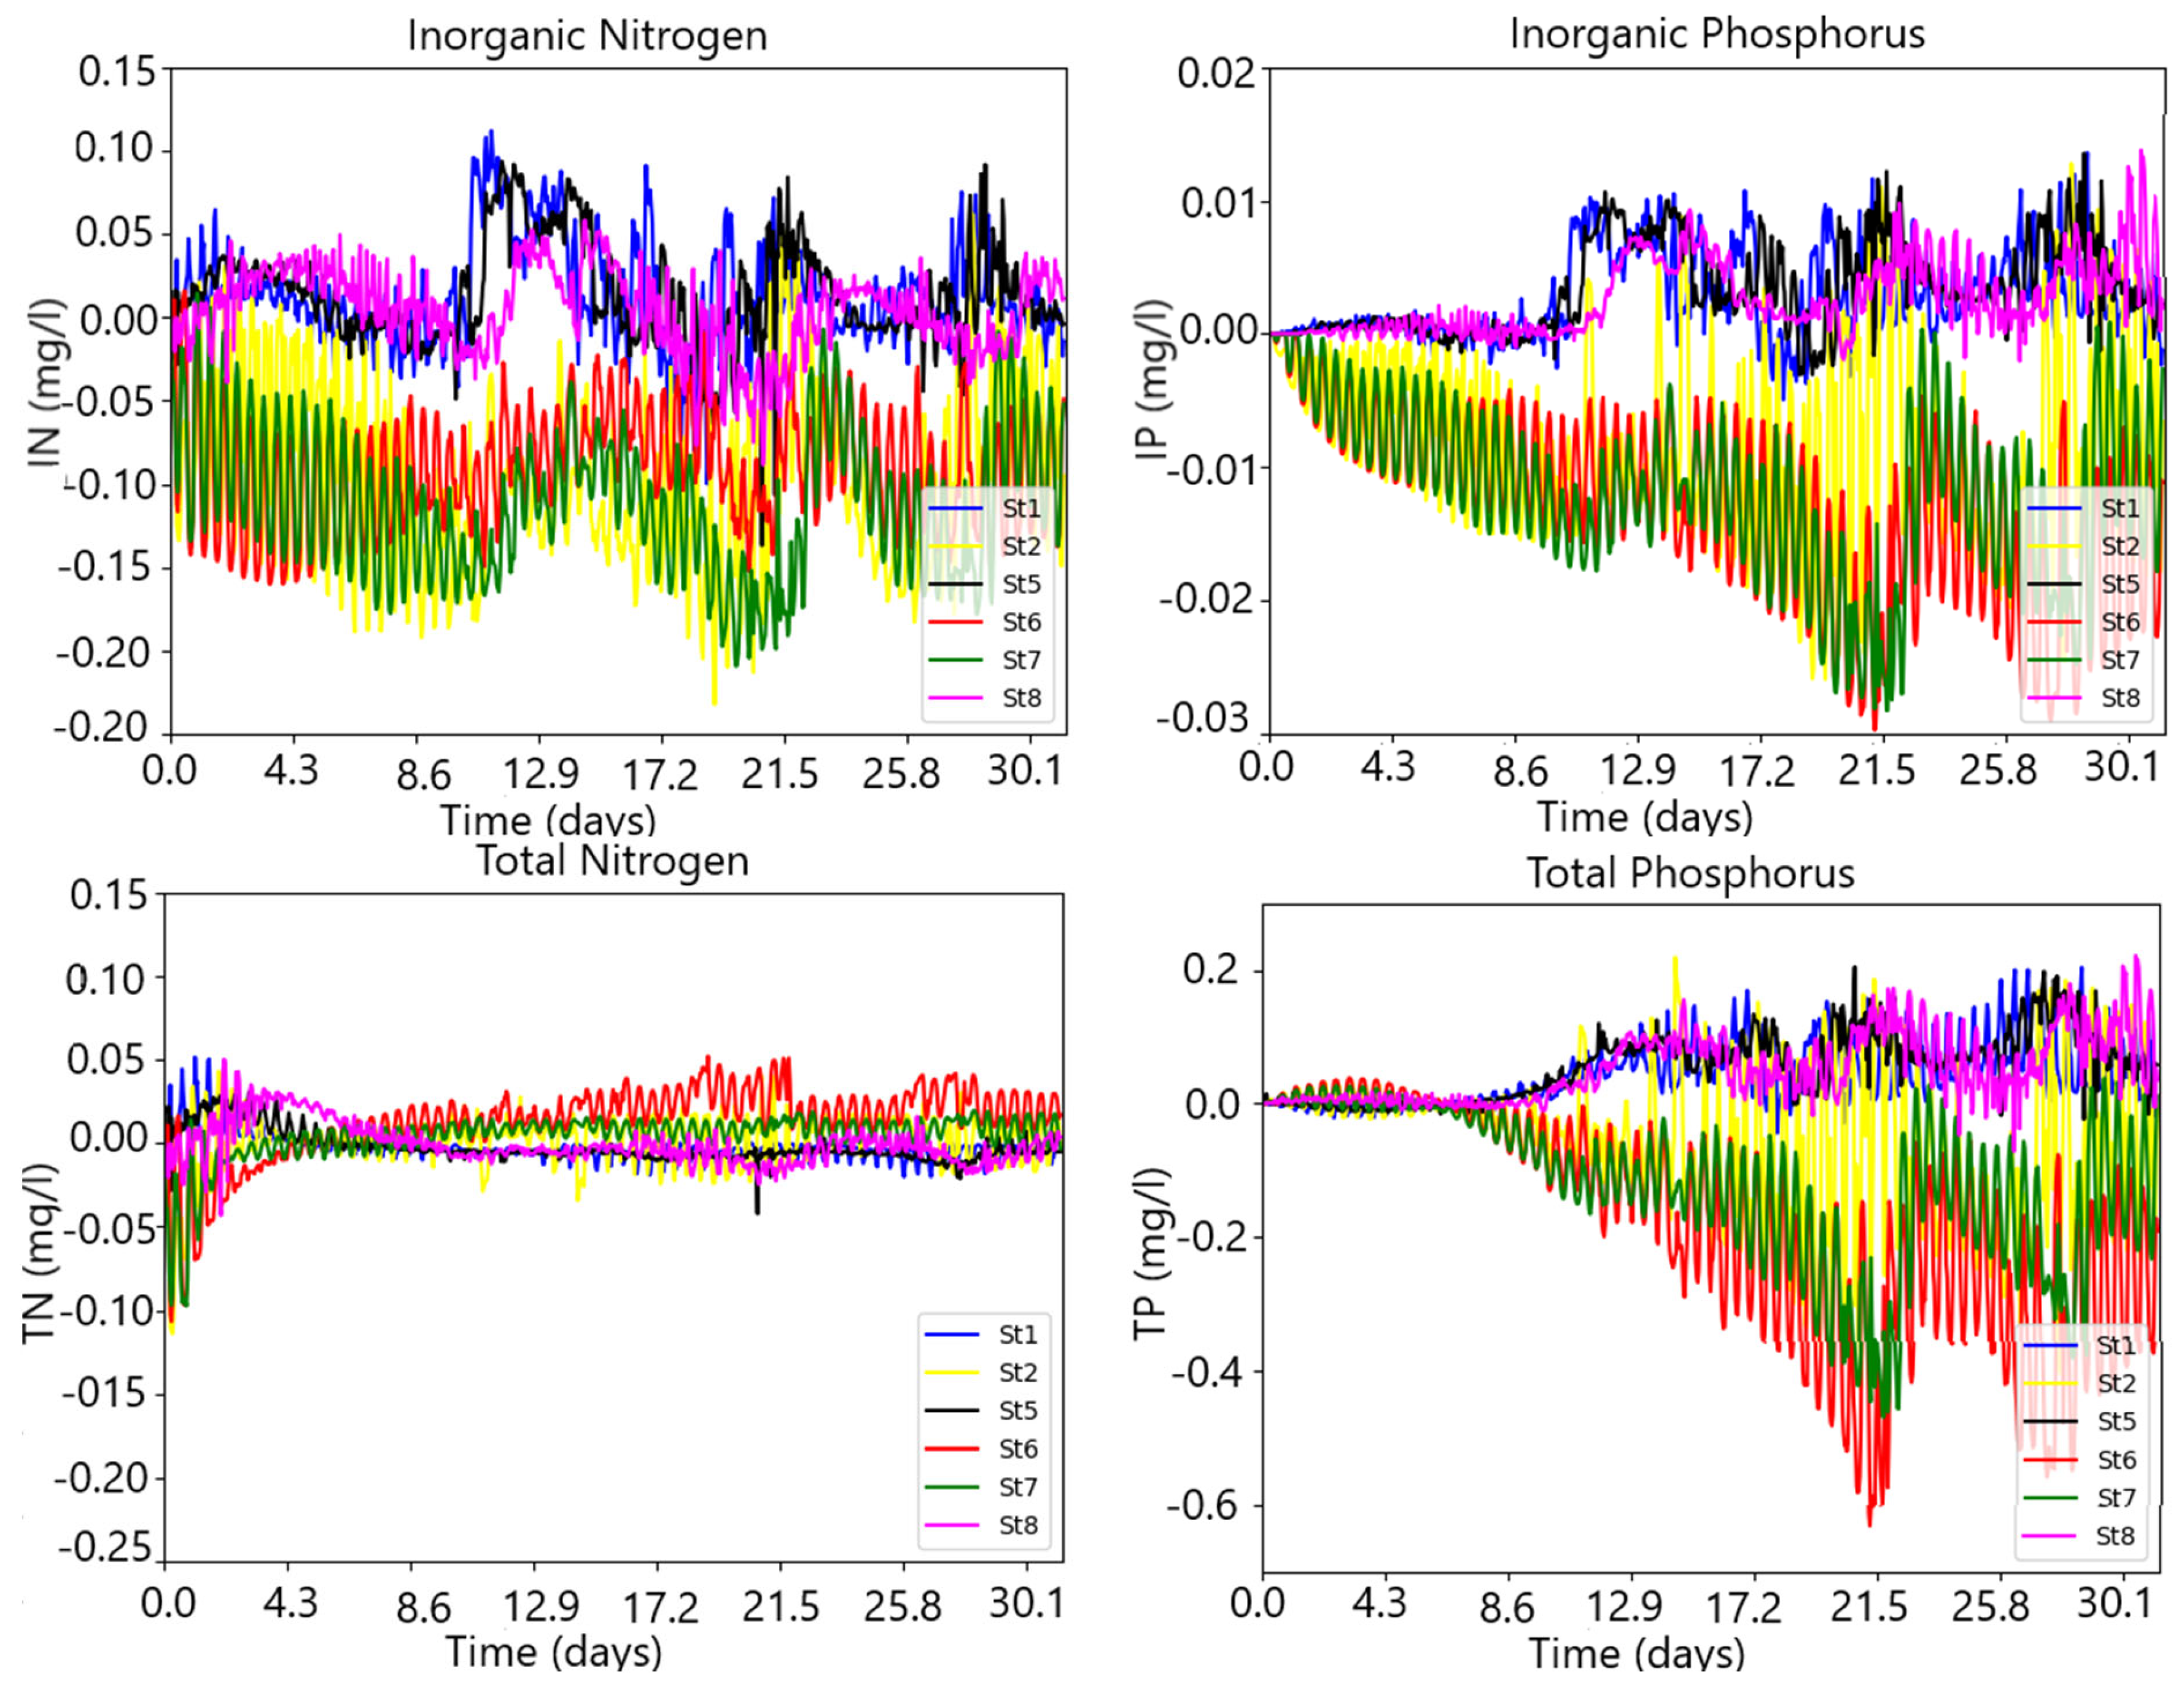
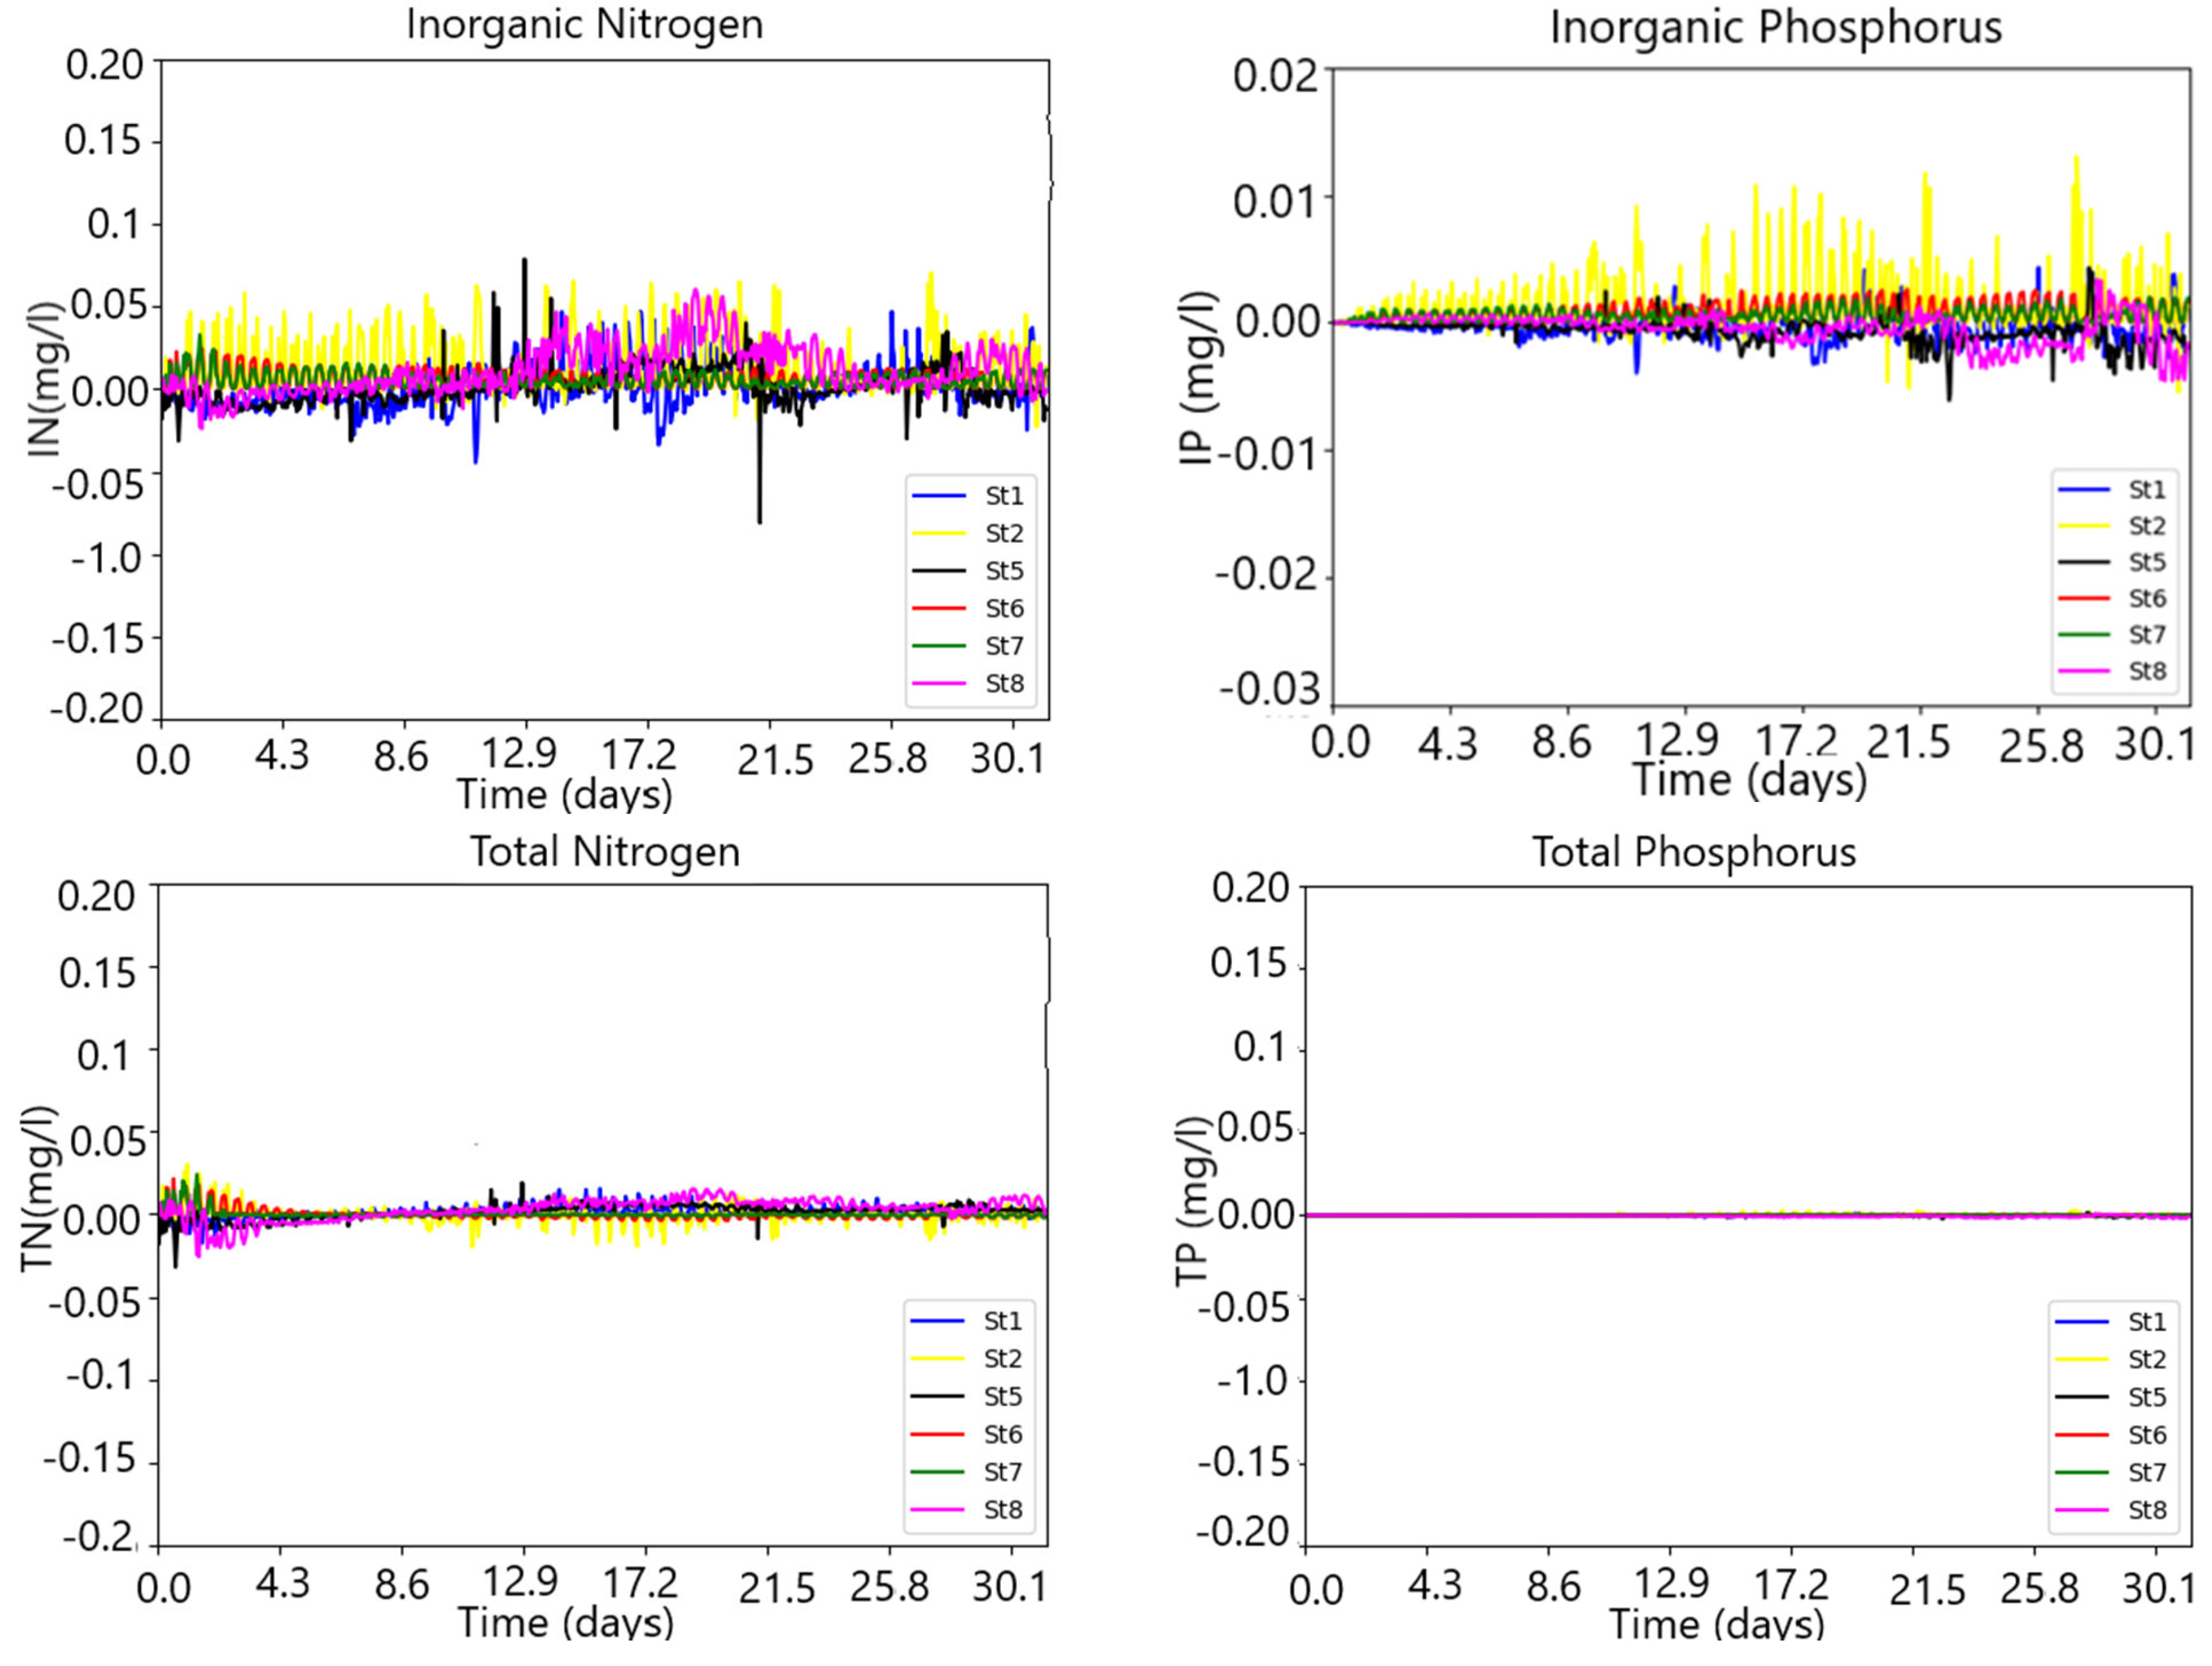
Figure 10 presents the IN, TN, IP, and TP time series for the baseline and the residuals, respectively. St2, St6, and St7 present minimum and negative IN residual values (between −0.05 and −0.15 mg/L). The absolute values reach maximum values that are of the same order as the baseline values (between 0.1 and 0.15 mg/L). St1, St5, and St8 present positive residual values (between 0.0 and 0.1 mg/L), although St8 presents negative values at the end of the simulation. When comparing the absolute values of the residuals with the baseline maximum values, it can be observed that both are of the same order for St2, St6, and St7 (ranging between 0.05 and 0.15 mg/L), while they are one order lower for St1, St5, and St8 (0.00 to 0.05 mg/L against 0.15 to 0.25 mg/L). Similarly, IP presents minimum and negative residual values (between 0 and −0.02 mg/L) for St2, St6, and St7, while positive values (between 0.0 and 0.01 mg/L) for St1, St5, and St8. When comparing the maximum values of the absolute residuals with the baseline maximum values, both are of the same order, even though the former show higher values (between 0.01 and 0.04 mg/L against 0.00 and 0.01 mg/L). TP residual values seem to have the same behavior as the inorganic counterparts but are one order of magnitude higher than the baseline maximum values. Minimum and negative values (between 0 and −0.6 mg/L) are observed for St2, St6, and St7, while maximum and positive values for St1, St5, and St8 (between 0 and 0.2 mg/L). TN does not present significant residual values, as they are almost positive and below 0.05 mg/L, and well below the baseline values (~0.3 mg/L).
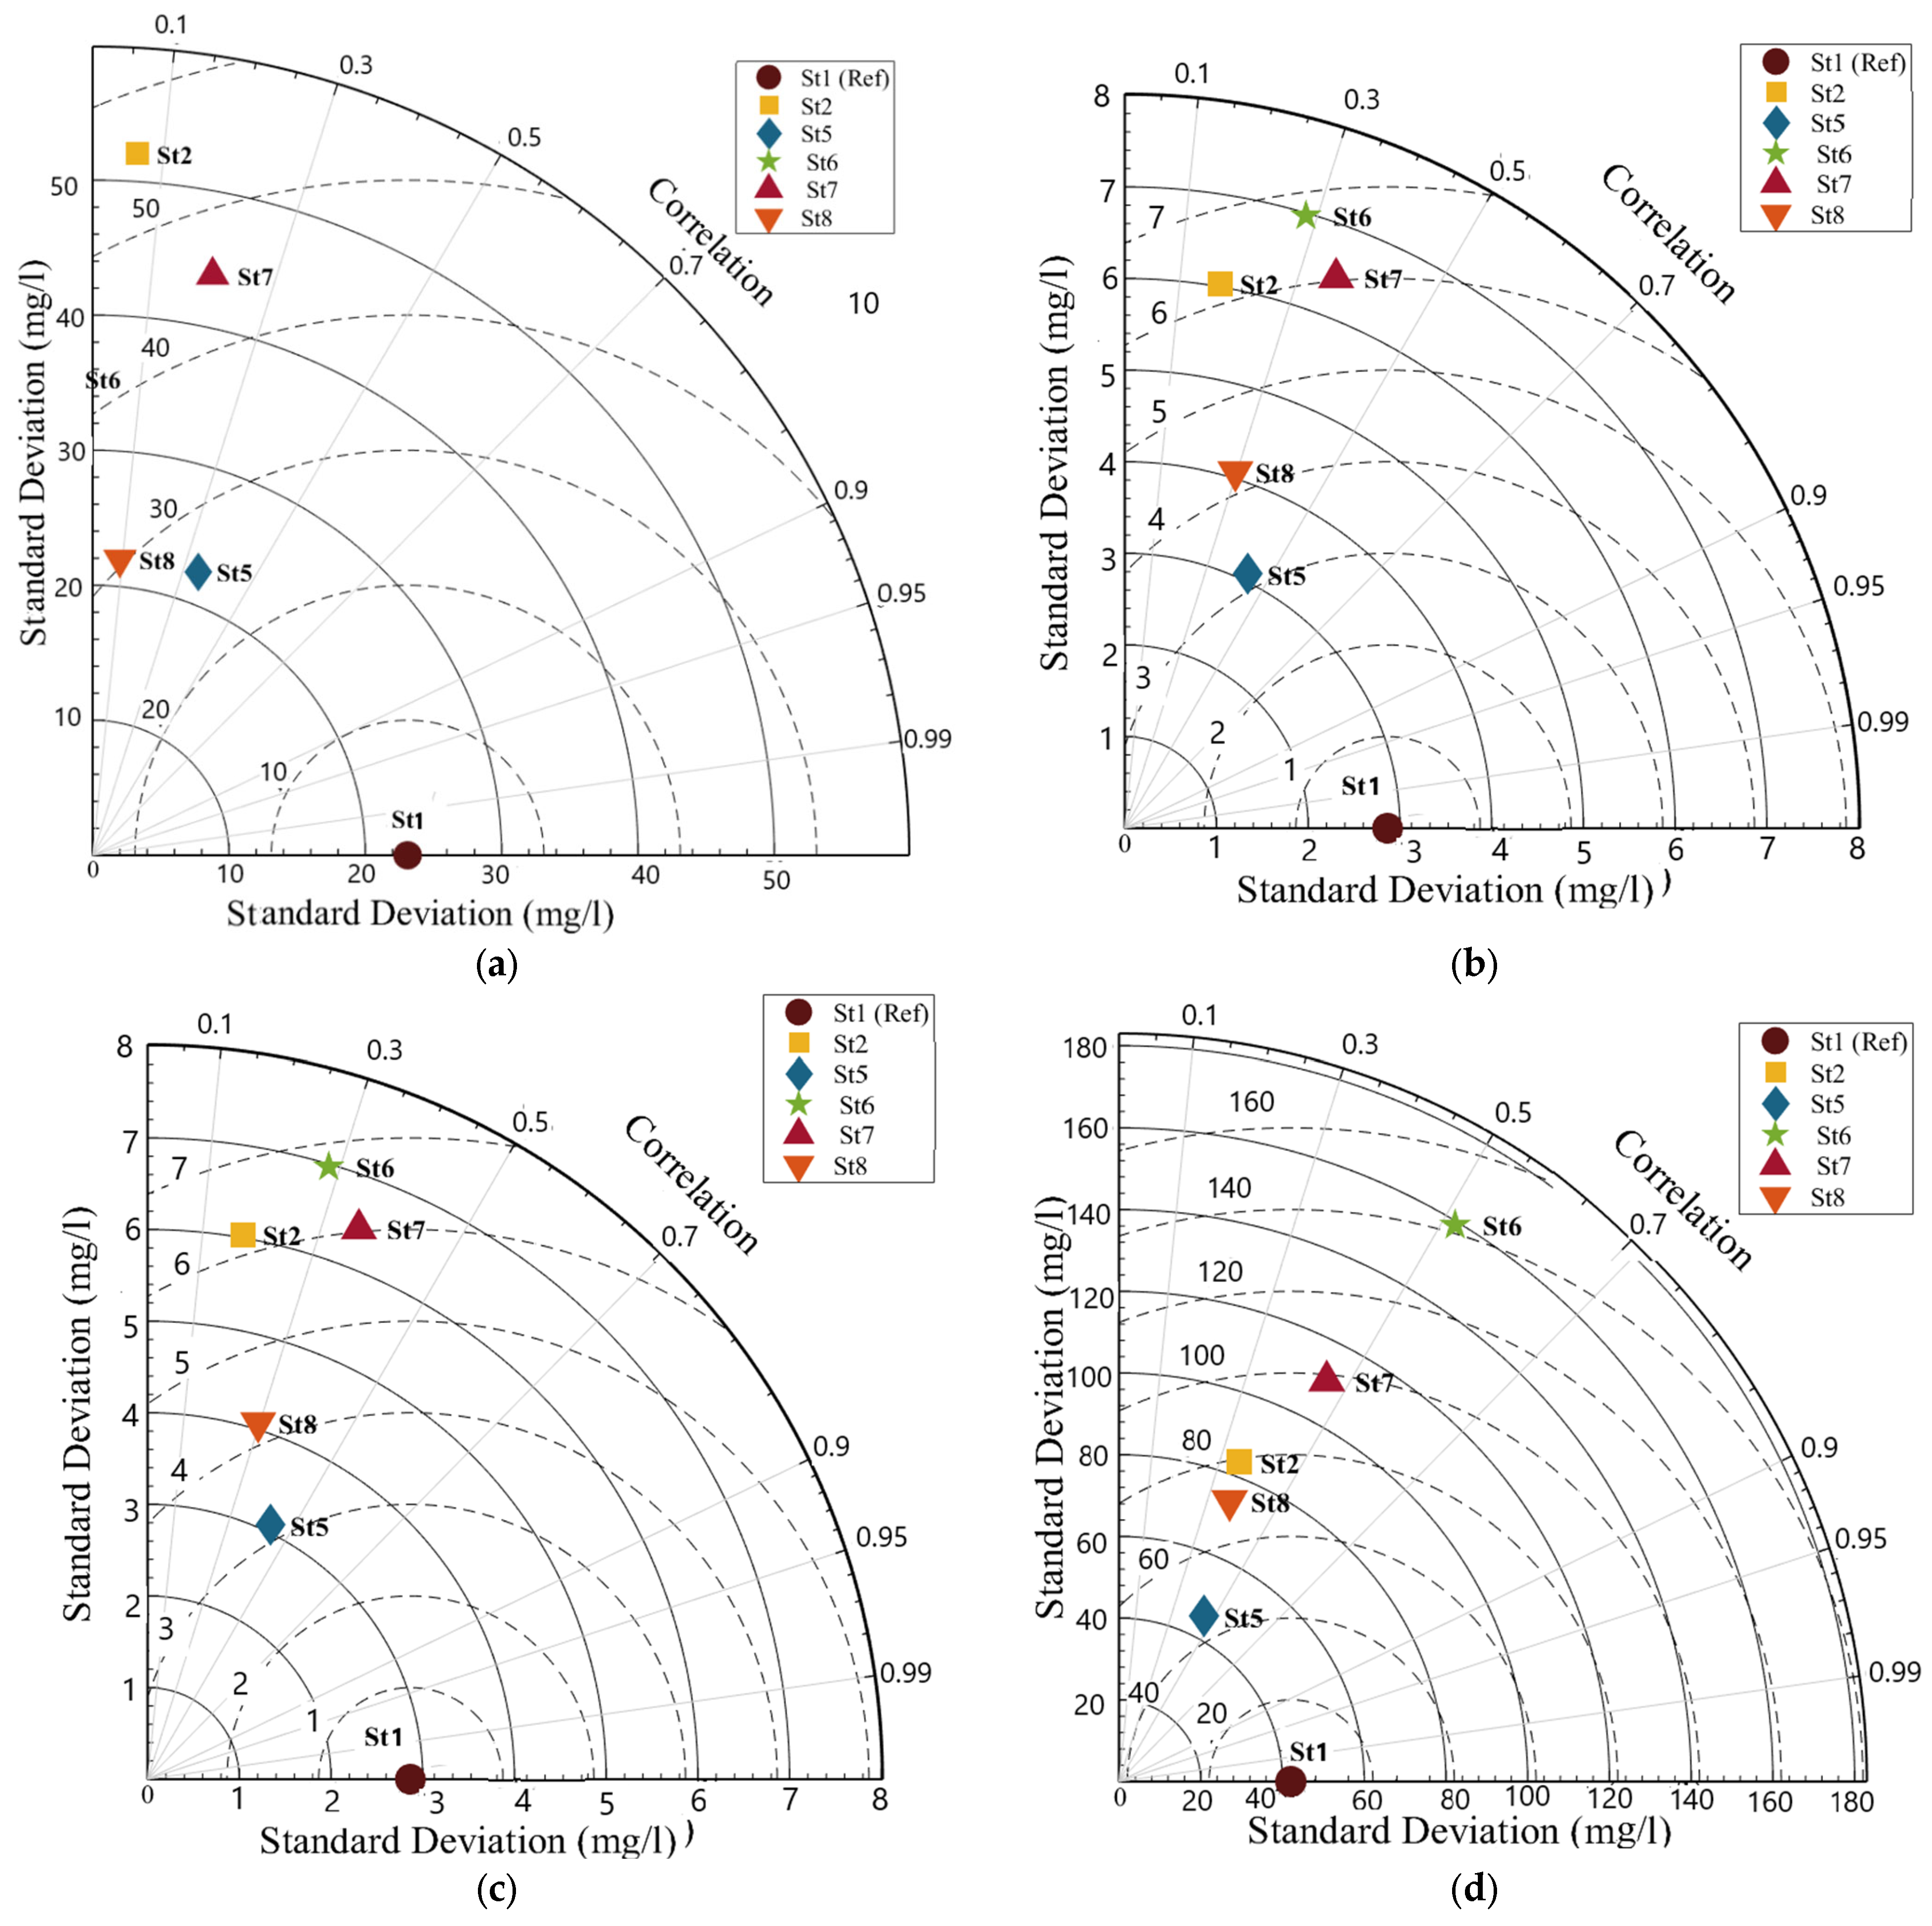
Figure 11 presents the Taylor diagrams of the absolute values of the residuals for the same variables as in Figure 12. The diagrams visually illustrate the standard deviation (SD) and the correlations (CR) between the stations, which can explain some spatial variability between them. The stations appear to be grouped into two clusters with similar SD and CR: St1, St5, and St8 form one cluster, while St2, St6, and St57 form the other. In each diagram, the first cluster is less correlated with St1 (CR < 0.5) and shows the highest SD values, approximately 0.05 mg/L, 0.006 mg/L, 0.006 mg/L, and 0.12 mg/L for IN, IP, TN, and TP, respectively.
The results lead to the conclusion that there was a net increase of IN, IP, and TP concentrations at the water column at St2, St6, and St7 of the simulation compared to the baseline, while the contrary occurred at St1, St5, and St8. When compared to TN, the absolute values of the residuals for TP are significantly high, reaching values as important as 0.6 mg/L. Therefore, it can be concluded that there was a net balance of total nitrogen, and net increase of total phosphorus in the water column. Concerning phosphorus, the increase in the concentration may be explained by an enhanced release from the sediment bed into the water column. When comparing the first group of stations (St1, St5, and St8) with the second one (St2, St6, and St7), the contrasting results between them may be explained by the competing influence of oceanic and riverine waters. Indeed, the former stations are situated along the St. Jacinto channel, which is dominated by strong tidal currents and characterized by ocean/brackish water influence, while the latter are under the riverine/brackish water influence. The stations appear to be grouped into two clusters with similar SD and CR: St1, St5, and St8 form one cluster, while St2, St6, and St57 form the other. This result corroborates well with the description of clusters and with the standard deviation values obtained with the Taylor diagrams. This effect seems to be very relevant for TP and less relevant for TN.

3.2.2. The Water Temperature Influence

This experiment aims to assess the influence of water temperature on the TN and TP status of the water column. Compared to the baseline situation, the water temperatures at the ocean and the river boundaries were increased to the interval (19 °C to 23 °C), for the ocean and the river boundaries, respectively, while the remaining physical and biogeochemical conditions remained unchanged relative to the baseline.
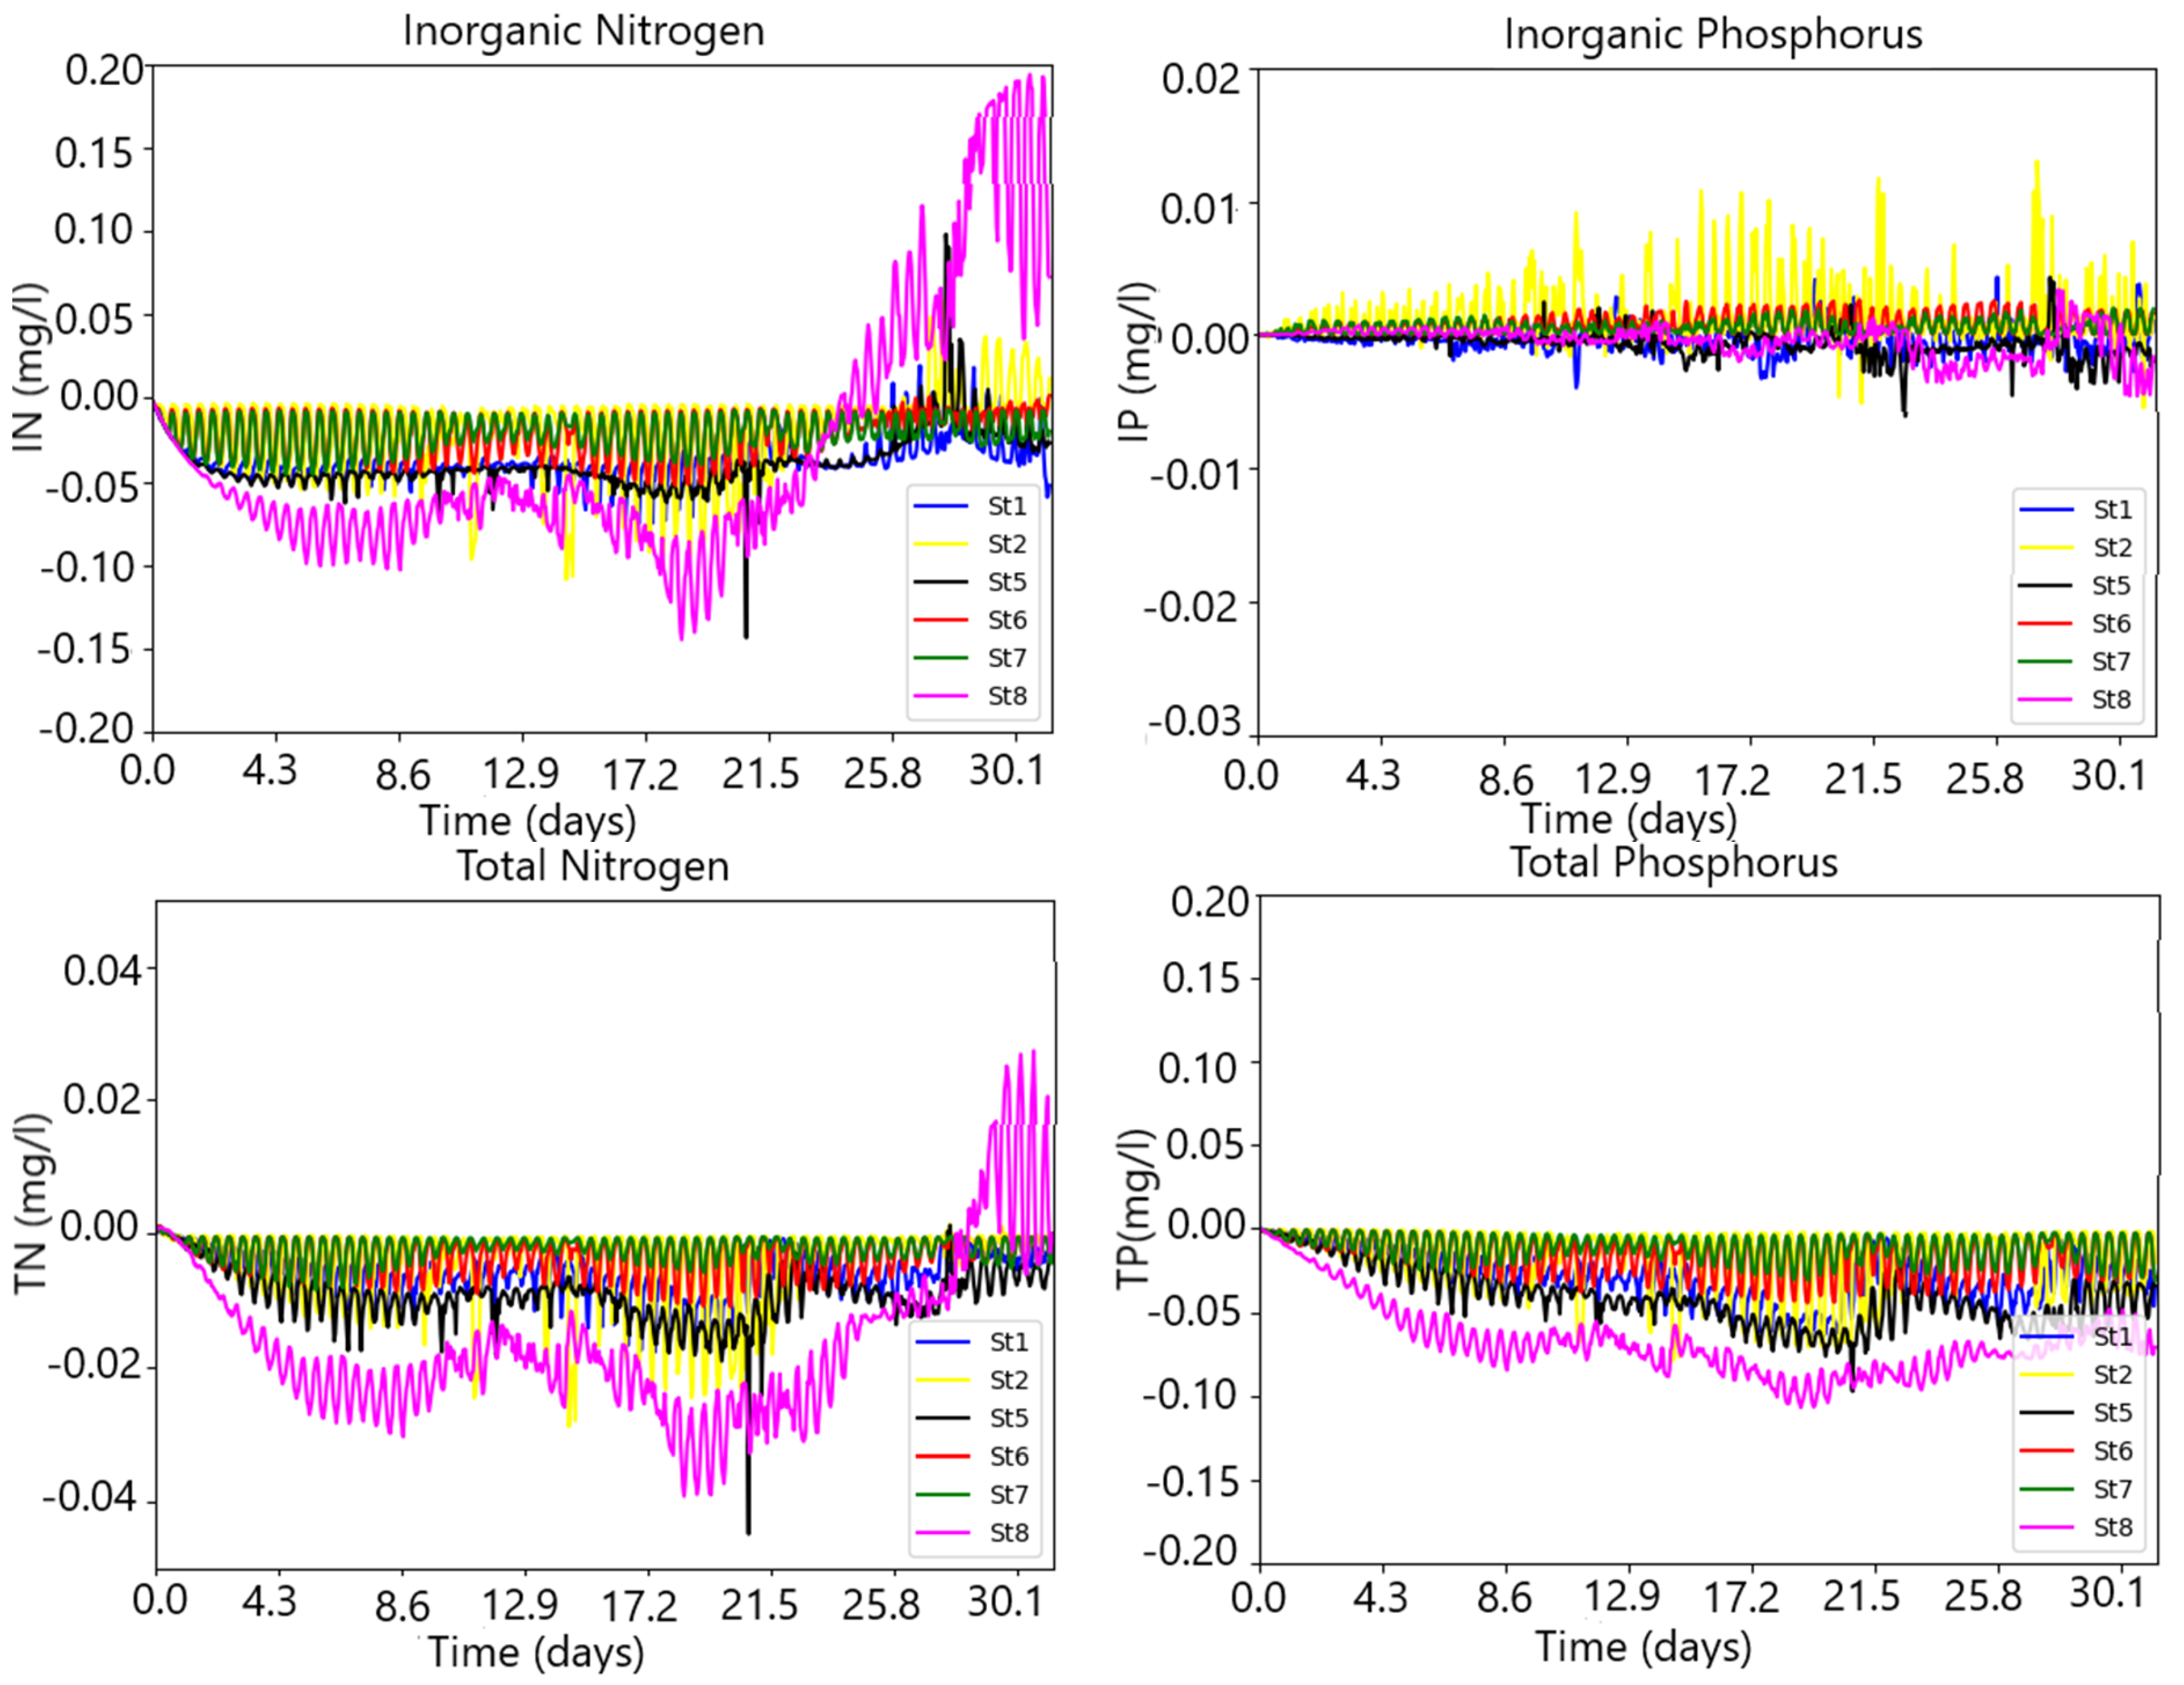
Figure 12 presents the residual time series for IN, TN, IP, and TP. Except for St8, IN residual values for the remaining stations are consistently negatives (between −0.05 and 0 mg/L), corresponding to absolute values significantly below the baseline values (between 0.1 and 0.2 mg/L), corresponding to a decrease in the simulation concentrations relative to the baseline. St8 shows the lowest and negative residual values during most of the simulations (up to day 23) reaching the minimum value of 0.15, followed by a sharp increase up to the end of the simulation to 0.2 mg/L. IP presents moderate absolute residual values (between 0 and 0.01 mg/L), except again for St8, which shows higher absolute values (between 0 and 0.01 mg/L), with St2, St5, and St7 showing positive values and St1, St6, and St8 negative values. TN residuals exhibit a similar trend as IN, but the values are one order below, between −0.02 and 0.02 mg/L. In contrast, TP shows significantly negative residual values, ranging between −0.05 and 0 mg/L, with St8 showing the lowest values, ranging between −0.1 and 0 mg/L. It is worth noting that the maximum absolute values of the residuals for TP are of the same order of magnitude as the baseline maximum values, ranging between 0 and 0.05 mg/L, whereas for TN residuals, they are insignificant in comparison.
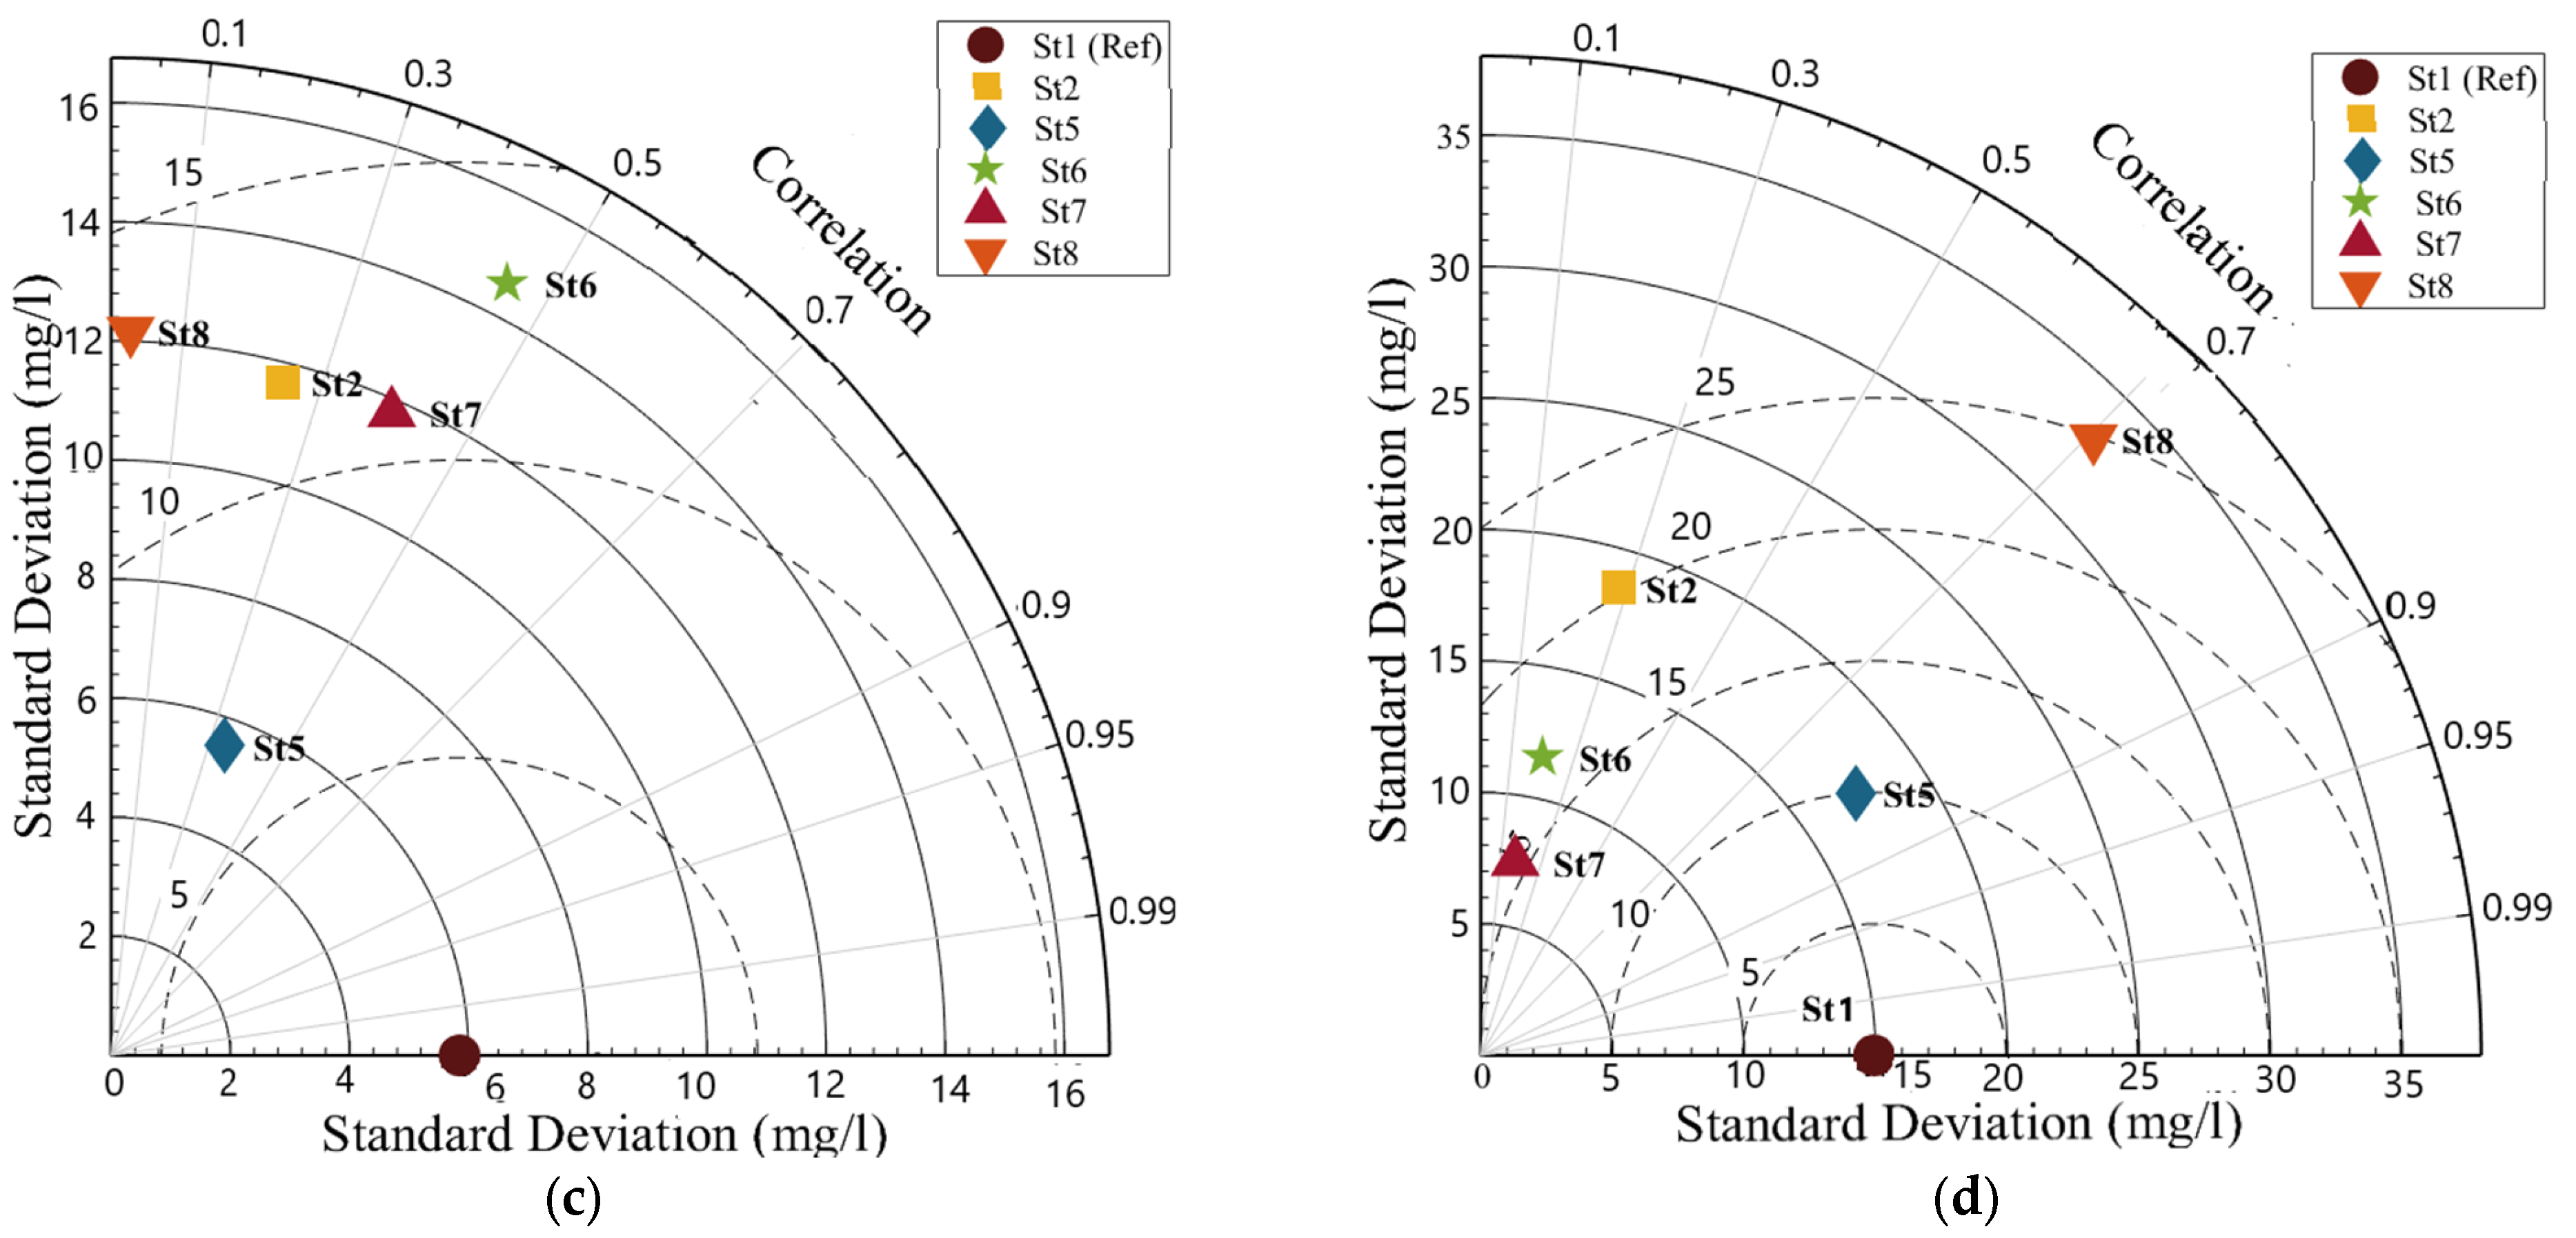
Figure 13 presents the Taylor diagrams of the absolute values of the residuals for the same variables as for Figure 14. St5, St6, and St7 seem to form a cluster with similar SD and CR for IN and IP, while the remaining stations appear to be less consistently grouped, forming clusters for some variables and not for others. St58 seems rather isolated from the other stations, and together with St2, shows the highest SD values (>0.0010 mg/L for IN, IP and >0.010 for TN and TP). In general, it can be observed that all stations are low correlated with St1 (CR < 0.5).
If we, therefore, exclude St8, the results show a decrease in the residual values for all variables, corresponding to a net increase in the simulation’s concentration compared to the baseline, and thus a release from the bed to the water column of both N and P organic and inorganic phases. St8 exhibits a singular behavior compared to the other stations because of the significant increase in residual values at the end of the simulation for IN, IP, and TP, which corresponds to a net decrease in the simulation concentration. This may indicate a net reduction of the inorganic nitrogen and the phosphorus release from the bed into the water column for this station, in contrast to the others. It is worth noting again that TN shows tiny residual values, indicating no significant response of total nitrogen content in the water column to the temperature forcing. As in the previous case (the river flow influence), there is a balance of total nitrogen in the water column, while there is a net release of phosphorus from the sediment layer. This effect is relevant for St8, attesting the high values of the residual concentrations.

3.2.3. The Salinity Influence

This experiment aimed to assess the influence of salinity on the TN and TP status of the water column. Compared to the baseline situation, the water salinity inside the lagoon was set to vary within a higher range of the boundary conditions (25 to 34 PSU) for the river and the ocean boundaries, respectively, while the remaining physical and biogeochemical conditions remained unchanged relative to the baseline.
Figure 14 presents the IN, TN, IP, and TP residual time series. TN and TP show small residual values. Indeed, while TP residuals are nearly null, TN is well below 0.05 mg/L and, therefore, significantly lower than the baseline concentration values, which are of the order of 0.3 mg/L. Although IN and IP still present small residual values and fluctuate around zero, they cannot be neglected. Indeed, IN and IP reach maximum absolute values of 0.5 mg/L and 0.01 mg/L, respectively, which are comparable to the baseline concentration values. While IN presents positive residual values, IP does so only for St2, St6, and St7, with St2 reaching values as high as 0.01 mg/L, i.e., of the same order as the baseline concentration values. Neglecting TN and TP residual values, the results lead to the conclusion that the total nitrogen and phosphorus of the water column did not change significantly between the simulation and the baseline, and are, therefore, practically unresponsive to salinity changes when compared to the influences of river flow or water temperature. However, a closer look at the results reveals a tendency for a slightly increased concentrations with the salinity of both IN and IP in the water column, if disregarding the slight IP decrease at St7, St5, and St8 at the end of the simulation. Due to the small values of the residuals, no Taylor diagrams for this case are shown.

3.3. Simulating the Nitrogen and Phosphorus State of the Water Column under River Flow and Nutrient Pulses

It is worth examining the 2001 spring situation in which the nutrient concentrations reached significant peaks at the river boundaries, as depicted in Table 1. Figure 15 presents the residual time series for IN, TN, IP, and TP for this scenario. For clarity, St8 has been omitted as it produces similar results to St6 and St7. Since the simulation values are higher than the baseline, and to get positive residuals, the last one was computed by subtracting the baseline from the simulation. The hydrodynamic conditions at the river boundaries were the same as the baseline (high river runoff, Table 1), and the nutrient concentrations were set at their maximum values.
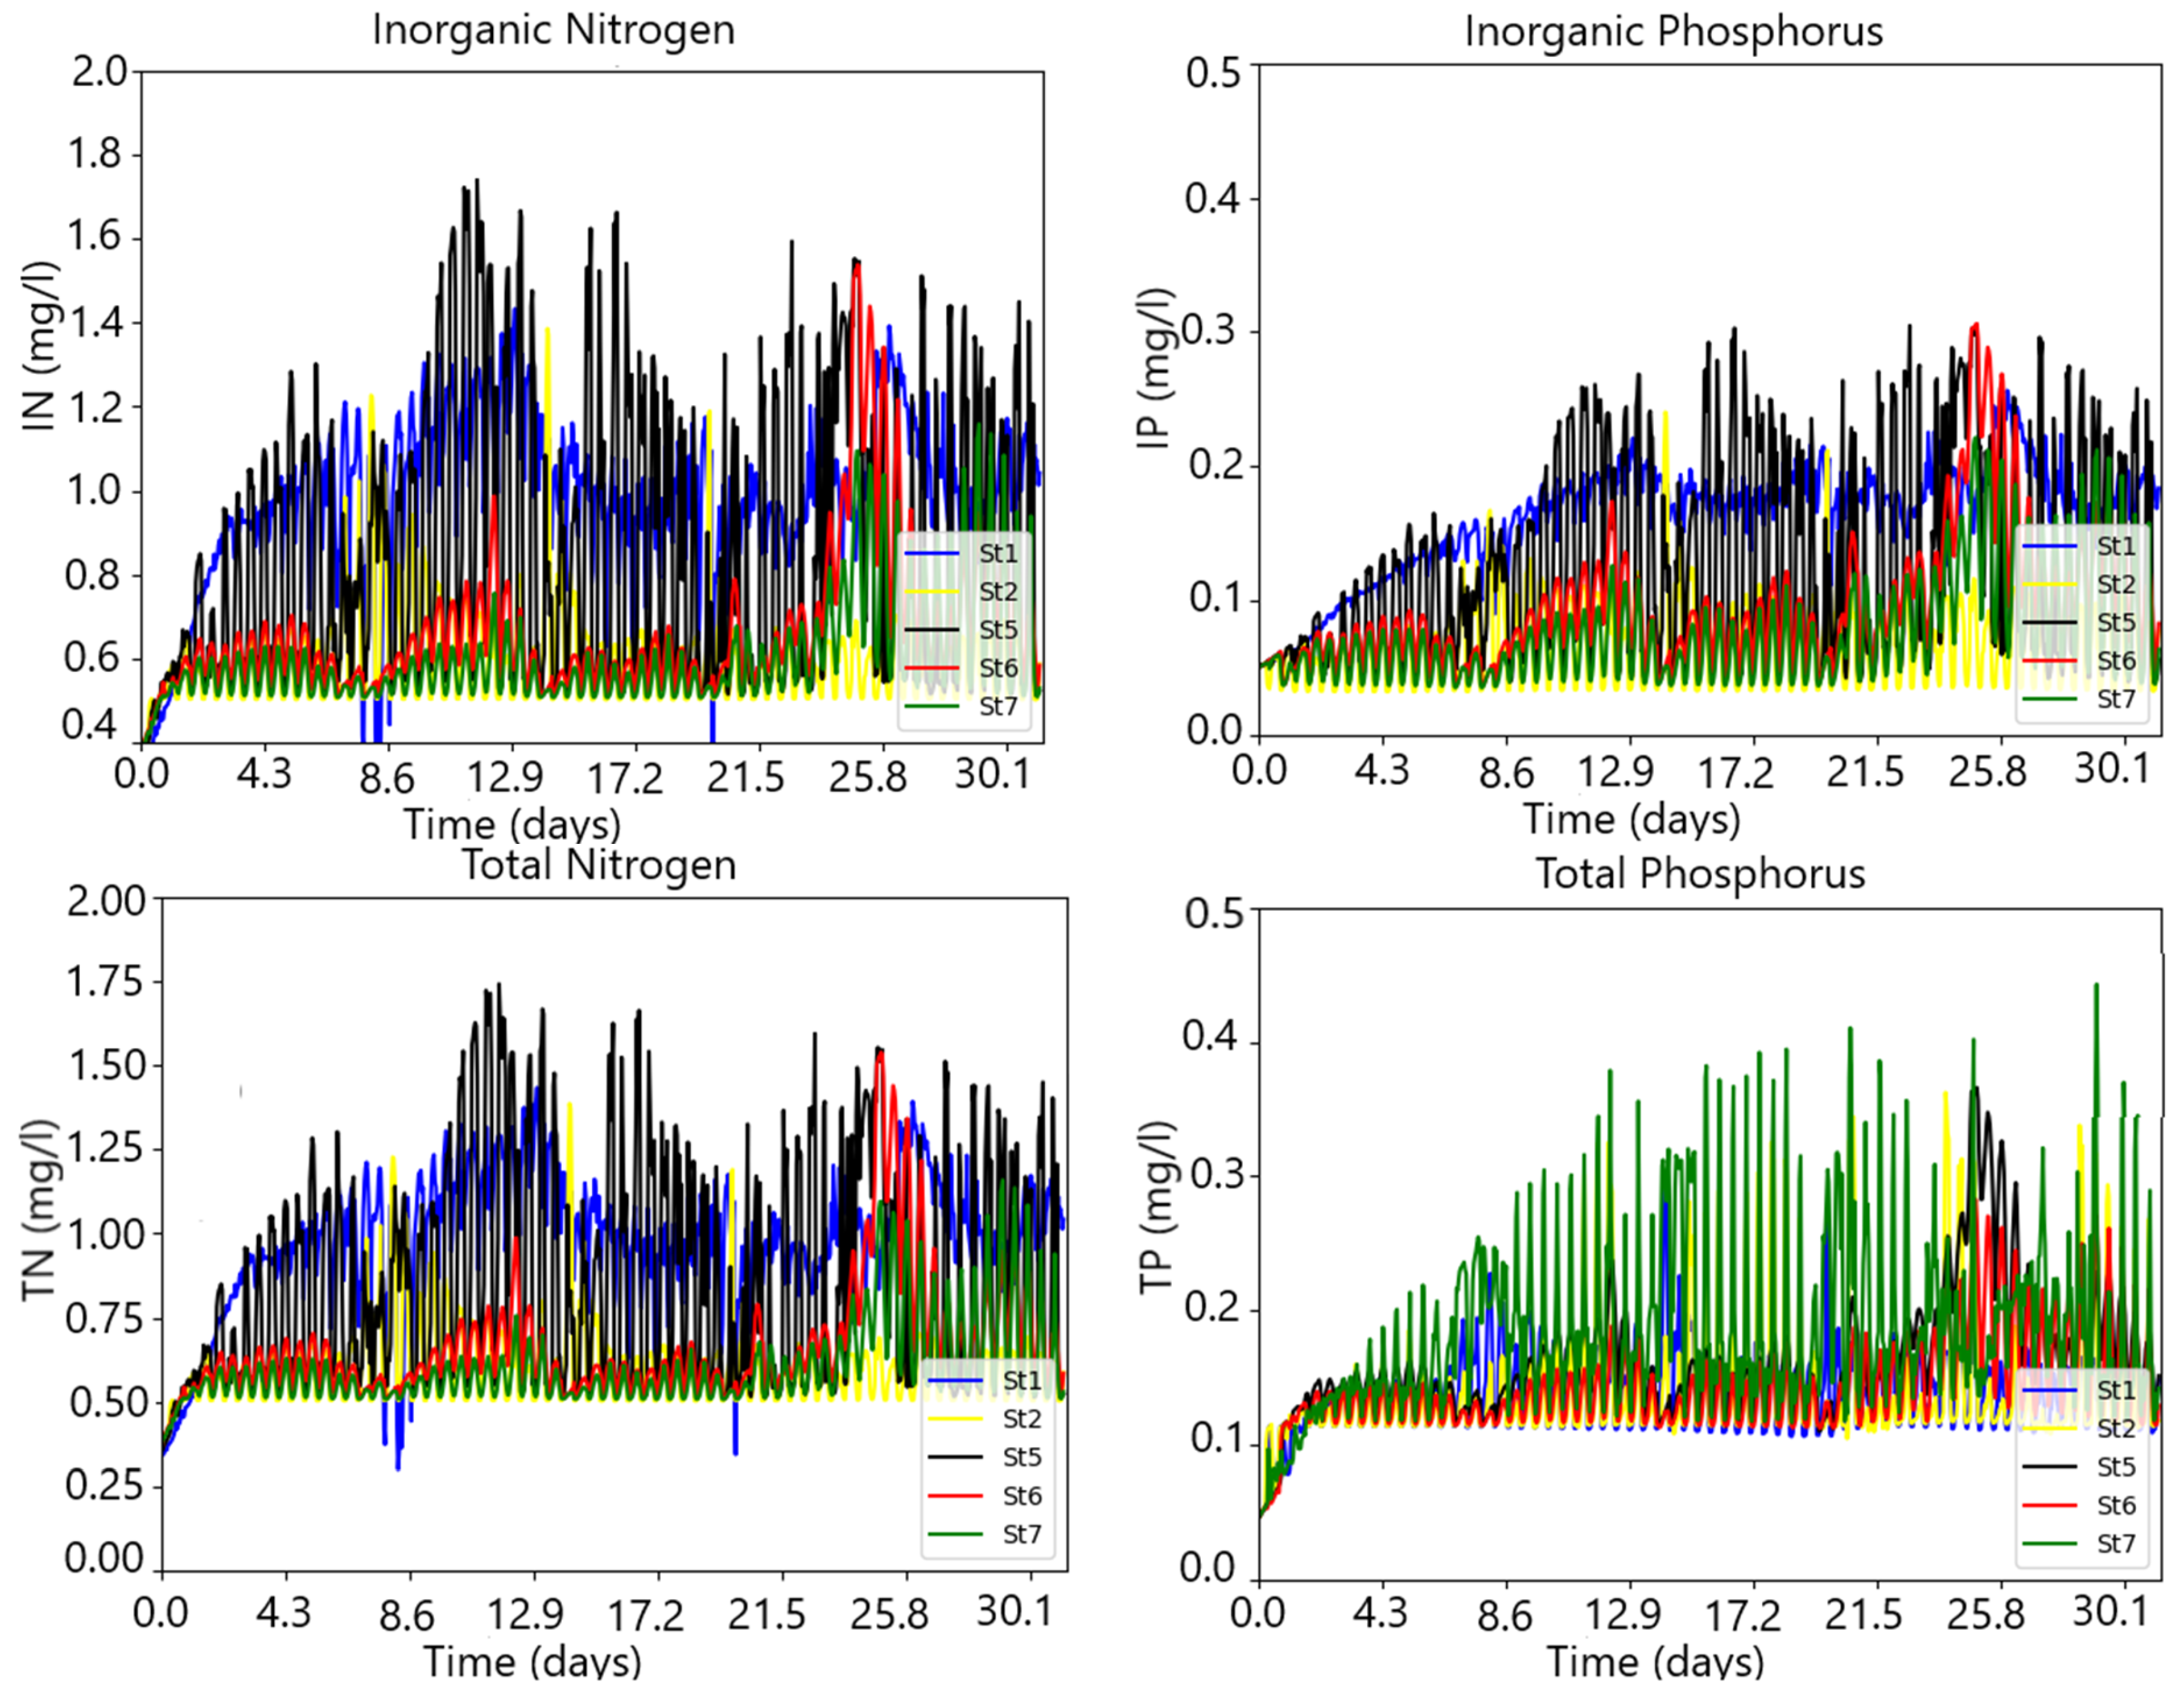
It can be observed that, compared to the influence of salinity and water temperature, the residual values are higher by two orders of magnitude. Indeed, the concentrations of total phosphorus (TP) and total nitrogen (TN) more than tripled, from 0.1 mg/L and 0.4 mg/L to 0.4 mg/L and 1.8 mg/L, respectively. In other words, in a situation resulting from a conjunction of high river runoff and nutrient pulses at its boundaries, the biogeochemical status of the water column is significantly affected, potentially leading to a significant increase in N and P concentrations. Therefore, the results suggest that a combined situation of intense river runoff and nutrient pulses at the river boundaries can completely overshadow the effect of the interaction between the water column and the sediment layer.

4. Discussion and Conclusions

Until now, few, if any, modeling studies have delved into the relationship between the biogeochemical status of the water column and the upper layer of sediment in the Riav lagoon ecosystem. Typically, models treated the bottom as a rigid boundary, isolated from the water column, thus overlooking any biogeochemical activity in the upper sediment layer. This study seeks to bridge this gap, to have a tool that enables assessing the significance of biogeochemical processes occurring in the surface sediment layer on water column biogeochemistry and looking into their impact in the water column. The model version utilized in this study is a pelagic model that integrates the upper layer of benthic processes, specifically focusing on the nitrogen (N) and phosphorus (P) cycles within the upper layer of bottom sediment. In theory, this approach is anticipated to improve the accuracy of the model predictions and the comprehension of the Riav biogeochemical functioning. The model outputs considered in this study include the following state variables: TN (total nitrogen) and TP (total phosphorus), which encompass both organic and inorganic forms of nitrogen and phosphorus.
Assessing the influence of river flow alone, on the nitrogen (N) and phosphorus (P) levels in the water column, in the scenario of a significant reduction in river flows compared to the baseline, allowed us to reveal some contrasting behavior between TN and TP and the tendency of the station group or clusters of stations for IN, IP, and TP. One group of stations experienced a relative concentration increase while the other did the opposite. The tendency of the spatial variability among the stations was confirmed by Taylor diagrams which showed the same stations clustered based on similar standard deviation (SD) and correlation (CR) values. This alignment highlights the distinct and competing influences of oceanic and riverine/brackish waters on nutrient dynamics, particularly impactful for TP rather than TN. Furthermore, the combined effects of high nutrient levels and river runoff provided key insights into this result. Indeed, increasing nutrient concentrations at the river boundaries led to a significant rise in both nitrogen and phosphorus levels of the water column, especially IN, which clearly indicates that this effect significantly boosts nutrient concentrations of the water column, underscoring the major influence of river runoff on nutrient status, which, in cases of nutrient pulses, may significantly exceed the contributions from interactions between the water column and the sediment layer. Salinity and water temperature are important in the long-term average flow patterns of the lagoon, such as residual circulation within most of the lagunar systems. Indeed, salinity and temperature play a crucial role in the circulation of the lagoon, particularly under conditions of high river runoff [43,44,48]. The results evidence a net increase of N and P concentrations (both inorganic and total) with the increasing the water temperature, but it is worth emphasizing the contrasting trend between TP and TN, which points out that TN seems to weakly response to the water temperature changes, corresponding to a balance situation in the water column, unlike TP. A less consistent cluster organization was observed for the temperature when compared to the river flow. Concerning salinity, the results point out a limited responsiveness of N and P to salinity changes compared to the river flow or the water temperature influences. However, a closer examination reveals a slight tendency of the concentrations increase in the water column, for both the inorganic nitrogen and the inorganic phosphorus, while total nitrogen and total phosphorus concentrations remained quite unchanged.
The influence of biogeochemical fluxes between the water column and sediment on total nitrogen (TN) and total phosphorus (TP) can be better understood by assessing the predicted rates of nitrogen (N) and phosphorus (P) released from the water column. These rates are often influenced by factors such as temperature, water turbulence, and biological activity. Typical rates for nitrogen and phosphorus release from the water column can range from 0.5 to 3 mg/m2/day and from 0.01 to 0.2 mg/m2/day, respectively [60]. In contrast, the mineralization rates for organic N and P in sediment range from 0 to 0.1/day. Furthermore, typical values for the oxygen penetration rate are on the order of 0.1/day, while the diffusion coefficients for NO3, NH4, and SIP range from 10−3 to 10−5 m2/day [61]. Consequently, the time scales of these processes should be in the order of several days, considering the vertical fluxes at the water/sediment interface. Indeed, comparing those values to the typical tidal time scales values [40,41], we can conclude that the time scales of the biogeochemistry processes are very large compared to the tidal ones. This significance becomes more apparent when considering the turbulent time scales of horizontal turbulent fluxes which are smaller, which typically operate over minutes or hours for shallow water like that of the Riav. Consequently, turbulence is the effective mechanism for transporting suspended and dissolved matter, and, therefore, dominates over biogeochemical processes. Nevertheless, shallow water systems like the Riav, which are composed by wide intertidal areas and characterized by high residence times [46,47,60], can have localized processes in time and space where the biogeochemistry may assume a crucial role over the long term. These areas can serve as reservoirs of nutrients, particularly for the regenerated fraction.
The study highlighted several aspects: First, under the river influence, two distinct groups of stations emerged: one with increased nutrient concentrations and higher variability, and another with decreased concentrations and lower variability. Total nitrogen (TN) remained stable, while total phosphorus (TP) showed a significant increase due to sediment release. These contrasting behaviors were attributed to the influence of oceanic and riverine waters. The rising water temperature led to increased phosphorus levels, with minimal changes in nitrogen levels. This suggests a release of phosphorus from the sediment into the water column, while the total nitrogen level remained relatively stable. Salinity had a limited impact on nutrient concentrations compared to the two physical factors, depicting only slight observed increases in inorganic nitrogen and phosphorus. Overall, the results highlight the significant influence of river flow and temperature on nutrient dynamics in the lagoon. The inclusion of biogeochemistry interactions between the benthic and pelagic layers represents significant progress in simulating the complexity of ecosystems like the Ria de Aveiro lagoon. Although the results have shown that sediment bed and water column interaction play an important factor in the N and P states of the water column, in a situation of high river runoffs and nutrient pulse at the river boundaries, those effects seem completely overshadowed by the latter.
The present modeling study aimed to introduce this novel approach rather than simply simulating the local ecosystem to assess how changes in conditions within the water column and at the bottom can significantly affect ecosystem processes. Indeed, it is crucial to deepen the understanding from an integrated perspective of the functioning of the water column/bottom in shallow intertidal systems like the Riav. The original approach of the present study lies in the fact that it considers the bottom sediment an active layer, considering factors such as nutrient fluxes and the transfer between different compartments of the aquatic ecosystem. The study underscores the necessity of implementing new integrated monitoring programs to track environmental parameters, including water quality, temperature, salinity, nutrients, and sediments, like the 2000 Modelria program [48]. This comprehensive monitoring approach is essential for a continuous assessment of how conditions in the water column interact with those running at the bottom and for validating alternative modeling approaches. There is a crucial need to understand and quantify the interactions between the water column and the bottom sediment from the multidisciplinary process approach and parameter estimations. This entails investigating the composition and dynamics of sediments at the bottom of the water body, encompassing processes such as sedimentation, resuspension, and bioturbation, and elucidating how these processes are influenced by activities in the water column, including those occurring in tidal flats and salt marshes. By combining various methodological approaches, such as field studies, modeling, and monitoring programs, it is possible to obtain a more comprehensive understanding of the influence of the interaction between the water column and the bottom on aquatic ecosystems like the Riav. This integrated approach is essential for future studies and for effective ecosystem modeling, management, and conservation.

Supplementary Materials

The following supporting information can be downloaded at: https://www.mdpi.com/article/10.3390/jmse12081310/s1, Figure S1_1. The N-cycle in the sediments. Figure S1_2. The P-cycle in the sediments. Table S2_1. Main parameters for the N and P cycle in the sediment 107 = 58. Table S2_2. The sensitivity parameter for the experiments. (a) Baseline (calibrated values); (b) Experiment. Figure S2_1. Taylor diagrams for TN parameter’s sensitivity analysis. Figure S2_2. Taylor diagrams for TP parameter’s sensitivity analysis. Additionally, references [62,63,64,65,66,67,68,69,70,71,72,73,74,75] are included in the text of this Supplementary section.

Funding

This research received no external funding.

Institutional Review Board Statement

Not applicable.

Informed Consent Statement

Not applicable.

Data Availability Statement

No new data were created or analyzed in this study. Data sharing is not applicable to this article. The raw data supporting the conclusions of this article will be made available by the authors on request.

Conflicts of Interest

The author declares no conflicts of interest.

References

  1. Jilbert, T.S. Understanding mud: The importance of sediment biogeochemistry. Geologi 2016, 68, 80–87. [Google Scholar]
  2. Canfield, D.E.; Thamdrup, B.; Kristensen, E. Aquatic Geomicrobiology; Elsevier: Amsterdam, The Netherlands, 2005; 640p. [Google Scholar]
  3. Lessin, G.; Artioli, Y.; Almroth-Rosell, E.; Blackford, J.C.; Dale, A.; Glud, R.; Middelburg, J.J.; Pastres, R.; Queiros, A.M.; Rabouille, C.; et al. Modelling marine sediment biogeochemical: Current knowledge gaps, challenges and some methodological advice for advancement. Front. Mar. Sci. 2018, 5, 19. [Google Scholar] [CrossRef]
  4. Arndt, S.; Jørgensen, B.; LaRowe, D.; Middelburg, J.; Pancost, R.; Regnier, P. Quantifying the degradation of organic matter in marine sediments: A review and synthesis. Earth-Sci. Rev. 2013, 123, 53–86. [Google Scholar] [CrossRef]
  5. Sin, S.; Banerjee, A.; Rakshit, N.; Raman, A.; Bhadury, P.; Ray, S. Importance of benthic-pelagic coupling in food-web interactions of Kakinada Bay, India. Ecol. Inform. 2021, 61, 101208. [Google Scholar] [CrossRef]
  6. Sohma, A.; Imada, R.; Nishikawa, T.; Shibuki, H. Modeling the life cycle of four types of phytoplankton and their bloom mechanisms in a benthic-pelagic coupled ecosystem. Ecol. Model. 2022, 467, 109882. [Google Scholar] [CrossRef]
  7. Yakubov, S.; Wallhead, P.; Protsenko, E.; Yakushev, E.; Pakhomova, S.; Brix, H. A 1-Dimensional Sympagic–Pelagic–Benthic Transport Model (SPBM): Coupled Simulation of Ice, Water Column, and Sediment Biogeochemistry, Suitable for Arctic Applications. Water 2019, 11, 1582. [Google Scholar] [CrossRef]
  8. Boudreau, B.P. Diagenetic Models and Their Implementation; Springer: Berlin/Heidelberg, Germany, 1997. [Google Scholar]
  9. Berner, R.A. Early Diagenesis: A Theoretical Approach; Princeton University Press: Princeton, NJ, USA, 1980; 241p. [Google Scholar]
  10. Lohse, L.; Malschaert, J.; Slomp, C.; Helder, W.; Van Raaphorst, W. Nitrogen cycling in North Sea sediments: Interaction of denitrification and nitrification in offshore and coastal areas. Mar. Ecol. Prog. Ser. 1993, 101, 283–296. [Google Scholar] [CrossRef]
  11. Xia, X.; Dong, J.; Wang, M.; Xie, H.; Xia, N.; Li, H.; Zhang, X.; Mou, X.; Wen, J.; Bao, Y. Effect of water-sediment regulation of the Xiaolangdi Reservoir on the concentrations, characteristics, and fluxes of suspended sediment and organic carbon in the Yellow River. Sci. Total Environ. 2016, 571, 487–497. [Google Scholar] [CrossRef]
  12. Wijsman, J.; Herman, P.; Gomoiu, M. Spatial distribution in sediment characteristics and benthic activity on the northwestern Black Sea shelf. Mar. Ecol. 1999, 181, 25–39. [Google Scholar] [CrossRef]
  13. Boynton, W.; Kemp, W. Nutrient regeneration and oxygen consumption by sediments along an estuarine salinity gradient. Mar. Ecol. Prog. Ser. 1985, 23, 45–55. [Google Scholar] [CrossRef]
  14. Sweerts, J.-P. Oxygen Consumption, Mineralization and Nitrogen Cycling at the Sediment–Water Interface of North Temperate Lakes. Ph.D. Thesis, University of Groningen, Groningen, The Netherlands, 1990; 136p. [Google Scholar]
  15. Sweerts, J.-P.R.A.; St Louis, V.; Cappenberg, T.E. Oxygen concentration profiles and exchange in sediment cores with circulated overlying water. Freshw. Biol. 1990, 21, 401–409. [Google Scholar] [CrossRef]
  16. Sweerts, J.-P.R.A.; Bar-Gilissen, M.-J.; Coruelese, A.A.; Cappenberg, T.E. Oxygen-consuming processes at the profundal and littoral sediment-water interface of a small mesoeutrophic lake (Lake Vechten, The Netherlands). Limnol. Oceaonogr. 1991, 36, 1124–1133. [Google Scholar] [CrossRef]
  17. Cai, W.J.; Sayles, F.L. Oxygen penetration depths and fluxes in marine sediments. Mar. Chem. 1996, 52, 123–131. [Google Scholar] [CrossRef]
  18. Soetaert, K.; Herman, P.; Middelburg, J. A model of early diagenesis processes from the shelf to abyssal depths. Geochim. Cosmochim. Acta 1996, 60, 1019–1040. [Google Scholar] [CrossRef]
  19. Soetaert, K.; Middelburg, J. Modeling eutrophication and oligotrophication of shallow-water marine systems: The importance of sediments under stratified and well-mixed conditions. Hydrobiologia 2009, 629, 239–254. [Google Scholar] [CrossRef]
  20. Soetaert, K.; Middelburg, J.; Herman, P.; Buis, K. On the coupling of benthic and pelagic biogeochemical models. Earth Sci. Rev. 2000, 51, 173–201. [Google Scholar] [CrossRef]
  21. Hülse, D.; Arndt, S.; Wilson, J.; Munhoven, G.; Ridgwell, A. Understanding the causes and consequences of past marine carbon cycling variability through models. Earth Sci. Rev. 2017, 171, 349–382. [Google Scholar] [CrossRef]
  22. Moriarty, J.; Harris, C.; Fennel, K.; Friedrichs, M.; Kehui, X.; Rabouille, C. The roles of resuspension, diffusion and biogeochemical processes on oxygen dynamics offshore of the Rhône River, France: A numerical modeling study. Biogeosciences 2017, 14, 1919–1946. [Google Scholar] [CrossRef]
  23. Laurent, A.; Fennel, K.; Wilson, R.; Lehrter, J.; Devereux, R. Parameterization of biogeochemical sediment-water fluxes using in situ measurements and a diagenetic model. Biogeosciences 2016, 13, 77–94. [Google Scholar] [CrossRef]
  24. Wilson, R.; Fennel, K.; Paul, J. Simulating sediment–water exchange of nutrients and oxygen: A comparative assessment of models against mesocosm observations. Cont. Shelf Res. 2013, 63, 69–84. [Google Scholar] [CrossRef]
  25. Baretta, J.; Ebenhöh, W.; Ruardij, P. The European regional seas ecosystem model, a complex marine ecosystem model. Neth. J. Sea Res. 2005, 33, 233–246. [Google Scholar] [CrossRef]
  26. Brigolin, D.; Lovato, T.; Rubino, A.; Pastres, R. Coupling early-diagenesis and pelagic biogeochemical models for estimating the seasonal variability of N and P fluxes at the sediment-water interface: Application to the northwestern Adriatic coastal zone. J. Mar. Syst. 2011, 87, 239–255. [Google Scholar] [CrossRef]
  27. Testa, J.; Kemp, W. Hypoxia-induced shifts in nitrogen and phosphorus cycling in Chesapeake Bay. Limnol. Oceanogr. 2012, 57, 835–850. [Google Scholar] [CrossRef]
  28. Fennel, K.; Brady, D.; DiToro, D.; Fulweiler, R.; Gardner, W.; McCarthy, M.; Rao, A.; Seitzinger, S.; Thouvenot-Korppoo, M.; Tobias, C. Modelling denitrification in aquatic sediments. Biogeochemical 2009, 93, 159–178. [Google Scholar] [CrossRef]
  29. Testa, J.; Brady, D.; Toro, D.; Boynton, W.; Cornwell, J.; Kemp, W. Sediment flux modeling: Nitrogen, phosphorus and silica cycles. Estuar. Coast. Shelf Sci. 2013, 131, 245–263. [Google Scholar] [CrossRef]
  30. Testa, J.; Li, Y.; Lee, Y.; Li, M.; Brady, D.; Di Toro, D.; Kemp, W. Quantifying the effects of nutrient loading on dissolved O2 cycling and hypoxia in Chesapeake Bay using a coupled hydrodynamic–biogeochemical model. J. Mar. Syst. 2013, 139, 139–158. [Google Scholar] [CrossRef]
  31. Testa, J.; Kemp, W. Spatial and temporal patterns in winter-spring oxygen depletion in Chesapeake Bay bottom waters. Estuar. Coasts 2014, 37, 1432–1448. [Google Scholar] [CrossRef]
  32. Paraska, D.; Hipsey, M.; Salmon, S. Sediment diagenesis models: Review of approaches, challenges and opportunities. Environ. Model. Softw. 2014, 61, 297–325. [Google Scholar] [CrossRef]
  33. Bruggemann, J.; Bolding, K. A general framework for aquatic biogeochemical models. Environ. Model. Softw. 2014, 61, 249–265. [Google Scholar] [CrossRef]
  34. Gehlen, M.; Barciela, R.; Bertino, L.; Brasseur, P.; Butenschön, M.; Chai, F.; Crise, A.; Drillet, Y.; Ford, D.; Lavoie, D. Building the capacity for forecasting marine biogeochemistry and ecosystems: Recent advances and future developments. J. Oper. Oceanogr. 2015, 8 (Suppl. S1), s168–s187. [Google Scholar] [CrossRef]
  35. Ford, D.; Kay, S.; McEwan, R.; Totterdell, I.; Gehlen, M. Marine Biogeochemical Modelling and Data Assimilation for Operational Forecasting, Reanalysis, and Climate Research. In New Frontiers in Operational Oceanography; 2018; pp. 625–652. Available online: https://diginole.lib.fsu.edu/islandora/object/fsu%3A602120 (accessed on 1 July 2024).
  36. Akbarzadeh, Z.; Laverman, A.; Rezanezhad, F.; Raimonet, M.; Viollier, E.; Shafei, B.; Van Cappellen, P. Benthic nitrite exchanges in the Seine River (France) An early diagenetic modeling analysis. Sci. Total Environ. 2018, 628–629, 580–593. [Google Scholar] [CrossRef] [PubMed]
  37. Billen, G.; Lancelot, C. Modelling benthic nitrogen cycling in temperate coastal ecosystems. In Nitrogen Cycling in Coastal Marine Environments; Blackburn, T.H., Sorensen, J., Eds.; Wiley and Sons: New York, NY, USA, 1988; pp. 341–378. [Google Scholar]
  38. Berg, P.; Rysgaard, S.; Thamdrup, B. General dynamic modelling of early diagenesis and nutrient cycling, Applied to an Arctic marine sediment. J. Am. Sci. 2003, 303, 905–955. [Google Scholar] [CrossRef]
  39. Wijsman, J.; Herman, P.; Middelburg, J.; Soetaert, K. A model for early diagenesis processes in sediments of the continental shelf of the Black Sea. Estuar. Coast. Shelf Sci. 2002, 54, 403–421. [Google Scholar] [CrossRef]
  40. Dias, J.M. Contribution to the Study of the Ria de Aveiro Hydrodynamics. Ph.D. Thesis, Universidade de Aveiro, Aveiro, Portugal, 2001; 288p. [Google Scholar]
  41. Dias, J.; Lopes, J.; Dekeyser, I. Hydrological characterisation of Ria de Aveiro lagoon, Portugal, in early summer. Oceanol. Acta 1999, 22, 473–485. [Google Scholar] [CrossRef]
  42. Moreira, M.H.; Queiroga, H.; Machado, M.M.; Cunha, M.R. Environmental gradients in a southern estuarine system: Ria de Aveiro, Portugal, implication for soft bottom macrofauna colonization. Aquat. Ecol. 1993, 27, 465–482. [Google Scholar] [CrossRef]
  43. Almeida, M.A.; Cunha, M.A.; Alcântara, F. Relationship of bacterioplankton production with primary production and respiration in a shallow estuarine system, Ria de Aveiro, NW Portugal. Microbiol. Res. 2005, 160, 315–328. [Google Scholar] [CrossRef] [PubMed]
  44. Lopes, C.B.; Lillebø, A.I.; Dias, J.M.; Pereira, E.; Vale, C.; Duarte, A.C. Nutrient dynamics and seasonal succession of phytoplankton assemblages in a Southern European Estuary: Ria de Aveiro, Portugal. Estuar. Coast. Shelf Sci. 2007, 71, 480–490. [Google Scholar] [CrossRef]
  45. Génio, L.; Sousa, A.; Vaz, N.; Dias, J.M.; Barroso, C. Effect of low salinity on the survival of recently hatched veliger of Nassarius reticulatus (L.) in estuarine habitats: A case study of Ria de Aveiro. J. Sea Res. 2008, 59, 133–143. [Google Scholar] [CrossRef]
  46. Lopes, J.F.; Almeida, M.A.; Cunha, M.A. Modelling the ecological patterns of a temperate lagoon in a very wet spring season. Ecol. Model. 2010, 221, 2302–2322. [Google Scholar] [CrossRef]
  47. Lopes, J.F.; Vaz, N.; Ferreira, J.A.; Dias, J.M. Assessing the state of the lower level of the trophic web of a temperate lagoon, in situations of light or nutrient stress: A modelling study. Ecol. Model. 2015, 313, 59–76. [Google Scholar] [CrossRef]
  48. ModelRia. Modelação da Qualidade da Água na Laguna da Ria de Aveiro; Final Report; Universidade de Aveiro-Centro das Zonas Costeiras e do Mar, Instituto Superior Técnico—Centro de Ambiente e Tecnologias Marítimos and Hidromod: Aveiro, Portugal, 2023. [Google Scholar]
  49. Serôdio, J.; Paterson, D.M.; Méléder, V.; Vyverman, W. Advances and challenges in microphytobenthos research: From cell biology to coastal ecosystem function. Front. Mar. Sci. 2020, 7, 608729. [Google Scholar] [CrossRef]
  50. MIKE 3 Flow Model. Hydrodynamic Module. User Guide. Scientific Documentation. 2017. Available online: https://manuals.mikepoweredbydhi.help/2017/Coast_and_Sea/MIKE_FM_HD_3D.pdf (accessed on 1 July 2024).
  51. MIKE 3 Flow Model ECO Lab Module. Eutrophication Model Incl. Sediment and Benthic Vegetation. User Guide. Scientific Documentation. 2017. Available online: https://www.dhigroup.com/technologies/mikepoweredbydhi/mike-eco-lab (accessed on 1 July 2017).
  52. Williams, P.J.L. Aspects of dissolved organic material in sea water. In Chemical Oceanography; Chapter 1; Riley, J.P., Skirrow, G., Eds.; Academic Press: New York, NY, USA, 1975; pp. 301–363. [Google Scholar]
  53. Nyholm, N. A simulation model for phytoplankton growth and nutrient cycling in eutrophic, shallow lakes. Ecol. Model. 1978, 4, 279–310. [Google Scholar] [CrossRef]
  54. Henriksen, K. Measurement of in situ rates of nitrification in sediment. Microb. Ecol. 1981, 6, 329–337. [Google Scholar] [CrossRef] [PubMed]
  55. Jørgensen, B.B. Mineralization of organic matter in the seabed—Role of sulphate reduction. Nature 1982, 296, 643–645. [Google Scholar] [CrossRef]
  56. Henriksen, K.; Hansen, J.I.; Blackburn, T.H. Rates of nitrification, distribution of nitrifying bacteria, and nitrate fluxes in different types of sediments from Danish waters. Mar. Biol. 1981, 61, 299–304. [Google Scholar] [CrossRef]
  57. Henriksen, K.; Kemp, W. Nitrification in estuarine and coastal marine sediments. In Nitrogen Cycling in Coastal Marine Environments; Blackburn, T.H., Sorensen, J., Eds.; John Wiley and Sons, Inc.: New York, NY, USA, 1988; pp. 201–249. [Google Scholar]
  58. Nixon, S.; Arnmerman, J.; Atkinson, L.; Berounsky, V.; Billen, G.; Boicourt, W.; Boynton, W.; Church, T.; DiToro, D.; Ehgren, R.; et al. The fate of nitrogen and phosphorus at the land-sea margin of the North Atlantic Ocean. Biogeochemical 1996, 35, 141–180. [Google Scholar] [CrossRef]
  59. Taylor, K.E. Summarizing multiple aspects of model performance in a single diagram. J. Geophys. Res. 2001, 106, 7183–7192. [Google Scholar] [CrossRef]
  60. Vaz, N.; Dias, J.M. Hydrographic characterization of an estuarine tidal channel. J. Mar. Syst. 2008, 70, 168–181. [Google Scholar] [CrossRef]
  61. Hayn, M.; Howarth, R.; Marino, R.; Ganju, N.; Berg, P.; Foreman, K.; Giblin, A.; McGlathery, K. Exchange of Nitrogen and Phosphorus Between a Shallow Lagoon and Coastal Waters. Estuaries Coasts 2014, 37 (Suppl. S1), 63–73. [Google Scholar] [CrossRef]
  62. Blackburn, T.; Henriksen, K. Nitrogen cycling in different types of sediments from Danish Waters. Limnol. Oceanogr. 1983, 28, 477–493. [Google Scholar] [CrossRef]
  63. Bocci, M.; Coffaro, G.; Bendoricchio, G. Modelling biomass and nutrient dynamics in eelgrass (Zostera marina): Applications to Lagoon of Venice (Italy) and Øresund (Denmark). Ecol. Model. 1997, 102, 67–80. [Google Scholar] [CrossRef]
  64. Lomstein, B.; Blackburn, T.H.; Blackburn, N.D.; Lomstein, E.; Hansen, L.S.; Therkildsen, M.S.; King, G.M.; Holmer, M. Decomposition of Organic Nitrogen in Marine Sediments. Marine Research from the Danish Environmental Protection Agency. 1995. 58p. Available online: https://www2.mst.dk/Udgiv/publikationer/1995/87-7810-489-0/pdf/87-7810-489-0.pdf (accessed on 1 July 2024).
  65. Bendoricchio, G.; Coffaro, G.; De Marchi, C. A trophic model for Ulva rigida in the Lagoon of Venice. Ecol. Model. 1994, 75–76, 485–496. [Google Scholar] [CrossRef]
  66. Ruadij, P.; Raaphorst, W. Benthic nutrient regeneration in the ERSEM ecosystem model of the North Sea. Neth. J. Sea Res. 1995, 33, 453–483. [Google Scholar] [CrossRef]
  67. Coffaro, G.; Bocci, M. Resources competition between Ulva rigida and Zostera marina: A quantitative approach applied to the Lagoon of Venice. Ecol. Model. 1997, 102, 81–95. [Google Scholar] [CrossRef]
  68. Iziumi, H.; Hattori, A. Growth, and organic production of eelgrass (Zostera marina) in temperate waters of the pacific coast of Japan. III The kinetics of nitrogen uptake. Aquat. Bot. 1982, 12, 245–256. [Google Scholar] [CrossRef]
  69. Jensen, H.; Mortensen, P.; Andersen, F.Ø.; Rasmussen, E.K.; Jensen, A. Phosphorus cycling in coastal marine sediment. Limnol. Oceanogr. 1995, 40, 908–917. [Google Scholar] [CrossRef]
  70. Mortensen, P.; Jensen, H.; Rasmussen, E.K.; Østergaard, P. Phosphorus Turnover in the Sediment in Aarhus Bay. Marine Research from the Danish Environmental Protection Agency. 1992. Cited by Mike 3. Available online: https://manuals.mikepoweredbydhi.help/2017/MIKE_3.htm (accessed on 1 July 2024).
  71. Jacobsen, O. Sorption, adsorption and chemosorption of phosphate by Danish Lake sediments. Vatten 1978, 4, 230–241. [Google Scholar]
  72. Jacobsen, O. Sorption of phosphate by Danish Lake Sediments. Vatten 1997, 3, 290–298. [Google Scholar]
  73. Gundresen, K.J.; Glud, R.N.; Jørgensen, B.B. Oxygen Turnover of the Seabed. Marine Research from the Danish Environmental Protection Agency. 1995. 57p; Cited by Mike 3. Available online: https://manuals.mikepoweredbydhi.help/2017/MIKE_3.htm (accessed on 1 July 2024).
  74. Sweerts, J.-P.; Carol, A.; Rudd, J.; Hesslein, R.; Cappenberg, T. Similarity of whole-sediment molecular diffusion coefficients in freshwater sediments of low and high porosity. Limnol. Oceanogr. 1991, 36, 336–341. [Google Scholar] [CrossRef]
  75. Windolf, J.; Jeppesen, E.; Jensen, J.; Kristensen, P. Modelling of seasonal variation in nitrogen retention and in-lake concentration: A four-year mass balance study in 16 shallow Danish Lakes. Biogeochemistery 1996, 33, 25–44. [Google Scholar] [CrossRef]
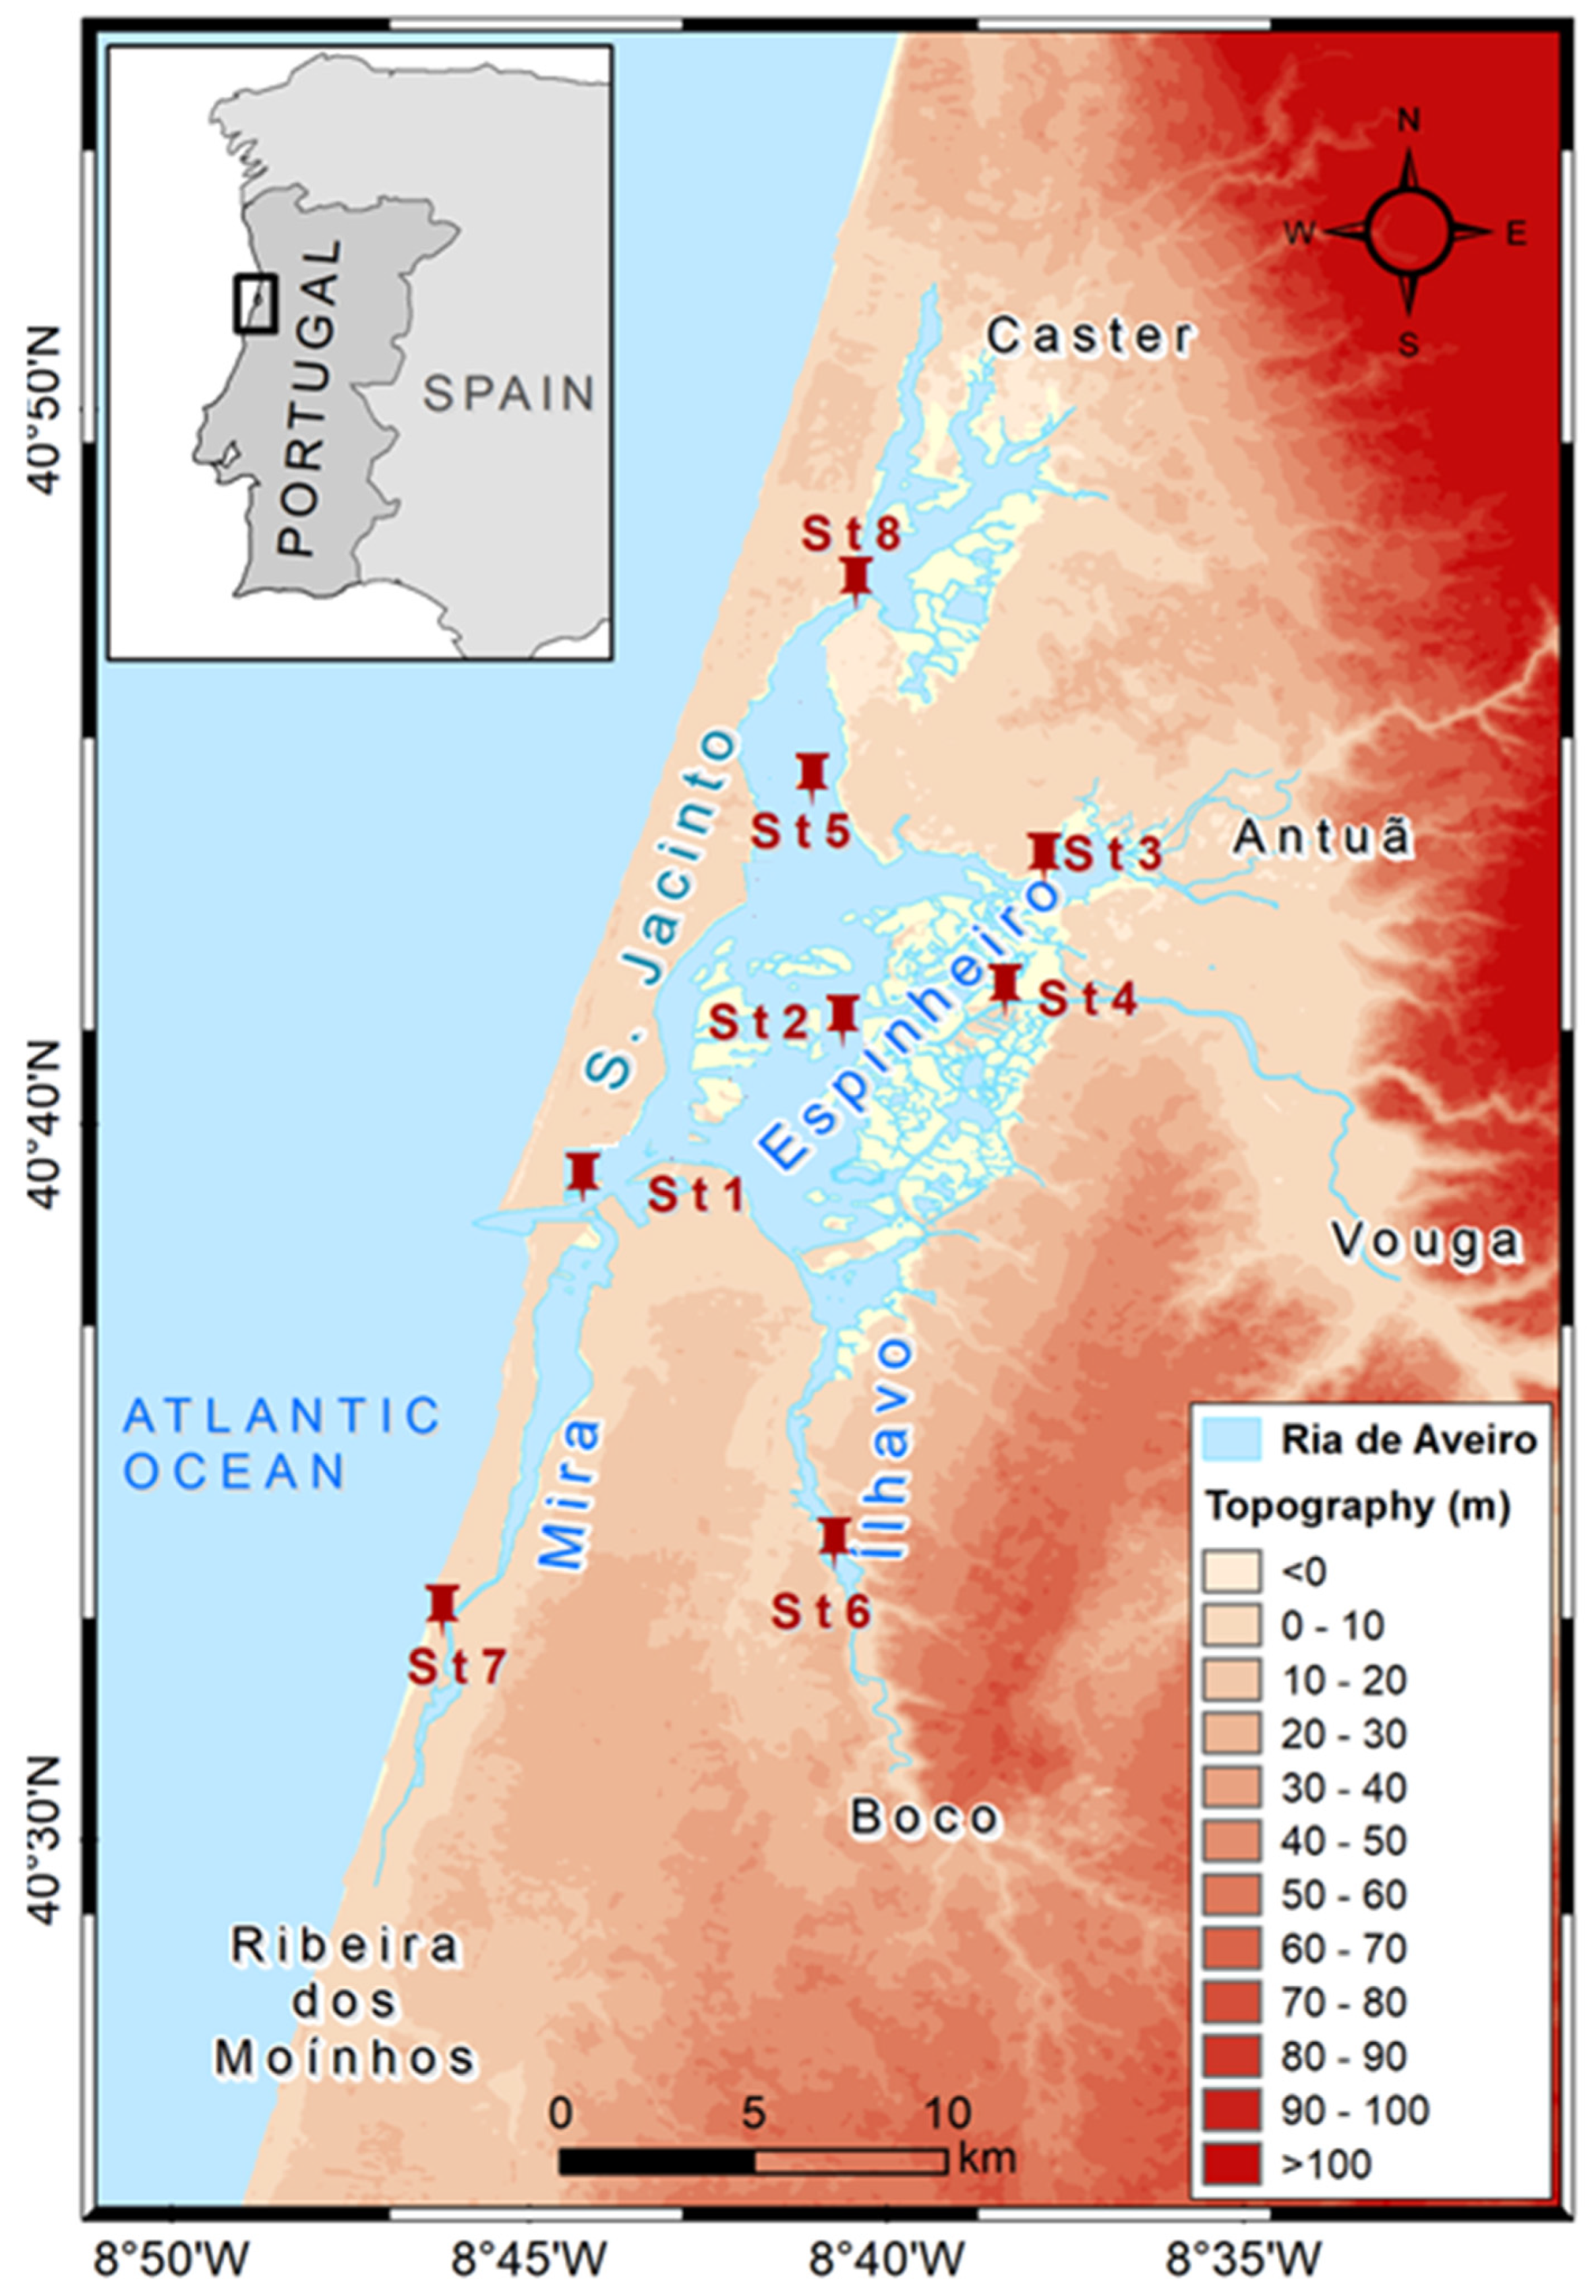
Figure 1. The study area: the Ria de Aveiro lagoon, with the location of the stations (St1St8).
Jmse 12 01310 g001
Figure 2. Riav’s bathymetry and the model grid points.
Jmse 12 01310 g002
Figure 3. The conceptual diagram for the pelagic model (in blue, the water column; in greenish brown, the sediment layer).
Jmse 12 01310 g003
Figure 5. The P-cycle in the sediments. (in blue, the water column; in greenish brown, the sedimentary layer).
Jmse 12 01310 g005
Figure 6. Simulated IN/IP and TN/TP monthly time series for a typical summer situation (June 2000).
Jmse 12 01310 g006
Figure 7. Horizontal and vertical distribution snapshots for TN, TP, IN, and IP for a typical summer situation (June 2000). In the vertical axis, the numbers correspond to layers (3 for the surface layer, 1.5 for the mid-layer, 0 for the bottom layer).
Jmse 12 01310 g007
Figure 8. Snapshots of salinity (a), temperature (b), TN (c), and TP (d), taken under maximum river flow situation, on 23rd day of simulation.
Jmse 12 01310 g008
Figure 9. Snapshots of the salinity and temperature, taken under the minimum river flow situation, on the 23rd day of the simulation.
Jmse 12 01310 g009
Figure 10. IN, IP, TN, and TP time series for the residuals at St1, St2 St5, St6, St7, and St8 under the river flow influence.
Jmse 12 01310 g010
Figure 11. The Taylor diagrams of the residuals for IN (a), TN (b), IP (c), and TP (d), at St1, St2, St5, St6, St7, and St8 under the river flow influence. The standard deviations are multiplied by 1000. For convenience, St1 was considered the reference station.
Jmse 12 01310 g011
Figure 12. IN, IP, TN, and TP time series for the residuals at St1, St2 St5, St6, St7, and St8 under the temperature influence.
Jmse 12 01310 g012
Figure 13. The Taylor diagrams of the residuals for IN (a), TN (b), IP (c), and TP (d), at St1, St2 St5, St6, St7, and St8 under the temperature influence. The standard deviations are multiplied by 1000. For convenience, St1 was considered the reference station.
Jmse 12 01310 g013aJmse 12 01310 g013b
Figure 14. IN, IP, TN, and TP time series for the residuals at St1, St2 St5, St6, St7, and St8 under the salinity influence.
Jmse 12 01310 g014
Figure 15. IN, IP, TN, and TP time series for the residuals at St1, St2 St5, St6, and St7 under the nutrient pulse scenario at the river boundaries.
Jmse 12 01310 g015
Table 1. Minimum and maximum values of the freshwater discharge, water temperature, salinity, and nutrient concentrations (total) at the river and ocean boundaries, observed from the summer of 2000 to the spring of 2001.
BoundariesDischarge
(m3/s)
Salinity
(PSU)
Water
Temp.
(°C)
N
(mg/L)
P
(mg/L)
DO
(mg/L)
Vouga river50–300013–191.4–3.70.1–0.28.0–12.0
Antuã river20–5001.3–234.0–120.1–1.26.5–9.5
Mira0–10016–231.5–5.00.1–0.68.0–9.2
Other rivers0–10013–221.0–100.1–0.96.5–9.0
Ocean-6–3413–220.1–1.30.03–0.068.0–11.0
Table 2. Minimum and maximum concentration values for TN, TP, Chl, and DO at the lagoon station observed for June 2000.
St1St2St3St4St5St6St7St8
TN (mg N/L)0.03–0.20.27–0.320.31–0.650.26–0.320.10–0.200.37–0.600.37–0.600.10–0.60
TP (mg P/L)0.03–0.030.03–0.030.03–0.030.03–0.030.03–0.030.05–0.070.05–0.080.05–0.08
PC (mg/L)0.10–0.200.10–0.200.10–0.300.10–0.300.10–0.200.10–0.200.10–0.300.10–0.30
Chl (mg/L)2–31–14–64–52–42–62–62–6
DO (mg/L)9–109–109–99–109–108–108–108–10
Table 3. The metrics for TN/IN and TP/IP for a typical summer situation. RM = RMSE; MP = MAPE (Mean Absolute Percentage Error).
St1St2St3St4St5St6St7St8
TN RM (mg N/L)7.41 × 10−25.24 × 10−27.85 × 10−22.76 × 10−29.44 × 10−25.42 × 10−21.45 × 10−12.12 × 10−1
TN MP (%)201520924164251
IN RM (mg N/L)5.93 × 10−21.31 × 10−11.21 × 10−11.46 × 10−17.79 × 10−21.14 × 10−11.06 × 10−11.43 × 10−1
IN MP (%)1533303520292536
TP RM (mg P/L)9.09 × 10−34.53 × 10−36.64 × 10−34.41 × 10−39.47 × 10−33.13 × 10−33.33 × 10−34.02 × 10−3
TP MP (%)3015221532525667
IP RM (mg P/L)8.11 × 10−31.35 × 10−21.45 × 10−31.64 × 10−31.08 × 10−35.25 × 10−34.48 × 10−33.92 × 10−3
IP MP (%)2745564181513
Table 4. The metrics for TN and IN and TP and IP for a typical spring situation. RM = RMSE; MP = MAPE (Mean Absolute Percentage Error).
St1St2St3St4St5St6St7St8
TN RM (mg N/L)5.34 × 10−22.17 × 10−21.22 × 10−15.28 × 10−14.53 × 10−21.59 × 10−21.14 × 10−19.16 × 10−2
TN MP (%)542220645165746
IN RM (mg N/L)2.65 × 10−24.84 × 10−21.48 × 10−15.48 × 10−13.97 × 10−24.61 × 10−21.44 × 10−11.33 × 10−1
IN MP (%)274925640477165
TP RM (mg P/L)2.68 × 10−27.45 × 10−35.73 × 10−31.37 × 10−22.09 × 10−21.03 × 10−28.65 × 10−31.64 × 10−2
TP MP (%)6719151952262141
IP RM (mg P/L)1.82 × 10−23.27 × 10−23.53 × 10−24.78 × 10−22.65 × 10−23.79 × 10−22.93 × 10−22.35 × 10−2
IP MP (%)4682886453637359
Disclaimer/Publisher’s Note: The statements, opinions and data contained in all publications are solely those of the individual author(s) and contributor(s) and not of MDPI and/or the editor(s). MDPI and/or the editor(s) disclaim responsibility for any injury to people or property resulting from any ideas, methods, instructions or products referred to in the content.