Abstract
The flow characteristics of methane and water in sedimentary layers are important factors that affect the beneficial exploitation of marine hydrates. To study the influencing factors of methane drive-off water processes in porous media, we constructed nonhomogeneous geometric models using MATLAB 2020a random distribution functions. We developed a mathematical model of gas–water two-phase flow based on the Navier–Stokes equation. The gas-driven water processes in porous media were described using the level-set method and solved through the finite element method. We investigated the effects of the nonhomogeneous structure of pore media, wettability, and repulsion rate on gas-driven water channeling. The nonhomogeneity of the pore medium is the most critical factor influencing the flow. The size of the throat within the hydrophilic environment determines the level of difficulty of gas-driven water flow. In regions with a high concentration of narrow passages, the formation of extensive air-locked areas is more likely, leading to a decrease in the efficiency of the flow channel. In the gas–water drive process, water saturation changes over time according to a negative exponential function relationship. The more hydrophilic the pore medium, the more difficult the gas-phase drive becomes, and this correlation is particularly noticeable at higher drive rates. The significant pressure differentials caused by the high drive-off velocities lead to quicker methane breakthroughs. Instantaneous flow rates at narrow throats can be up to two orders of magnitude higher than average. Additionally, there is a susceptibility to vortex flow in the area where the throat connects to the orifice. The results of this study can enhance our understanding of gas–water two-phase flow in porous media and help commercialize the exploitation of clean energy in the deep ocean.
1. Introduction
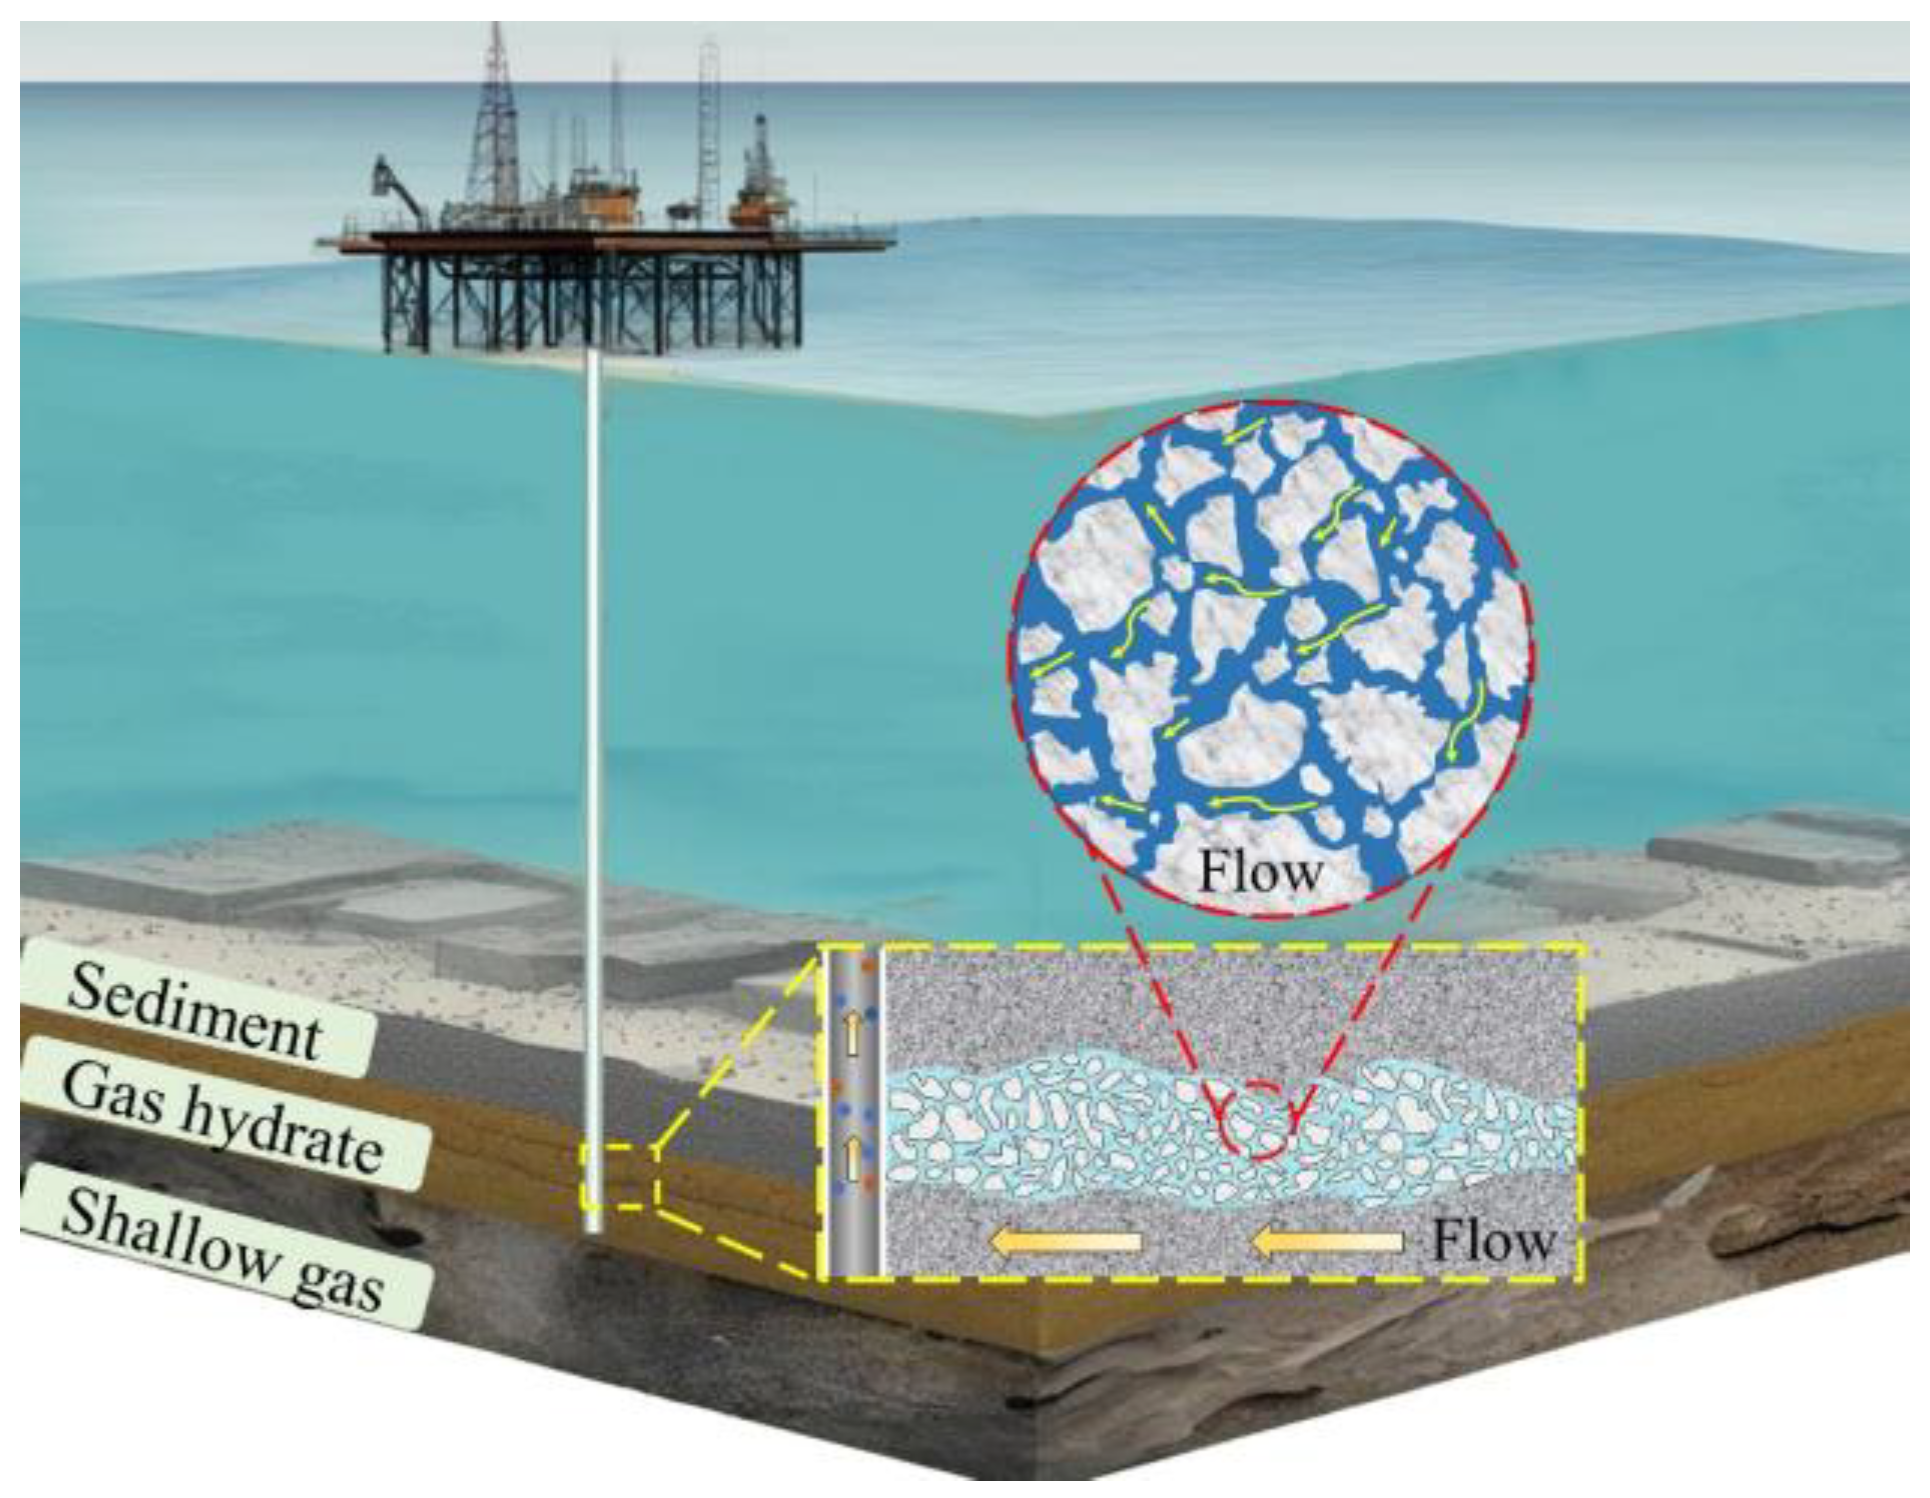
The world’s energy consumption structure is transitioning from fossil fuels to clean energy sources [1]. Over the past 20 years, the primary energy consumption structure has shown a decreasing trend in the proportion of traditional fossil energy sources like oil and coal, while the share of clean and renewable energy has significantly increased [2]. Natural gas hydrate (CH4-nH2O) has remarkable characteristics such as wide distribution, large reserves, high density, and high calorific value [3], and the development of the natural gas hydrate industry serves as a bridge to promote the transformation of the energy consumption structure from high-carbon fossil energy to low-carbon/non-carbon new energy sources [4]. Submarine gas hydrates account for more than 90% of the total amount of gas hydrates in the world and are primarily stored in the seafloor sediments at the edge of the continental shelf, distributed at water depths between 300 and 3000 m [5]. Submarine gas hydrates have garnered significant attention due to their vast energy potential, but the rapid decline in gas production is a crucial factor that hinders the commercial exploitation of submarine gas hydrates [6,7]. Seafloor hydrate extraction typically utilizes a range of methods (thermal method, depressurization method, carbon dioxide replacement, etc. [8]) to disrupt the in situ pressure state of seafloor sediments and convert solid natural gas hydrates into gaseous methane and liquid water. The pores of the seafloor hydrate deposits are filled with a significant amount of water. The released methane propels the flow of saturated water to the production wells under differential pressure [9]. This process is manifested as a gas–liquid two-phase flow state within a porous medium [10], and the periplasmic flow process during mining is illustrated in Figure 1. Influenced by the geometry, physical properties, and two-phase flow behavior of the sedimentary layer, the effective gas-producing channels are diminished, leading to a decrease in the conductivity of the sedimentary layer [11]. Therefore, an in-depth study of the gas–liquid two-phase flow law in pore medium is of great significance for the efficient development of natural gas hydrate resources and ensuring a clean energy supply [12]. Clarifying the characteristics of gas-driven water flow in the pore scale of seafloor hydrate sedimentary layers is crucial for advancing the stable testing of marine natural gas mining and the marine economy [13].
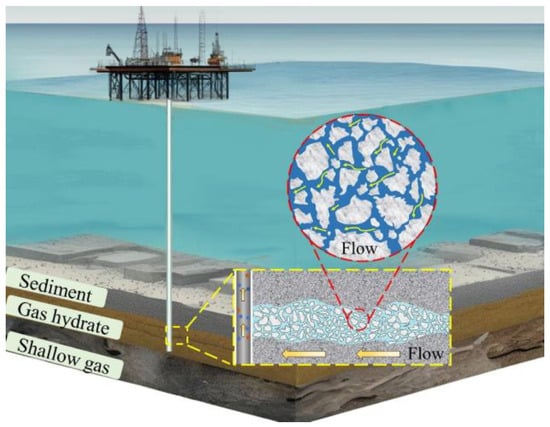
Figure 1.
Hydrate mining and pore-scale two-phase flow characterization.
Indoor tests typically involve using simulated reservoir conditions of hydrate aquifers to examine the differential pressure changes within the reservoir [14,15]. This is performed to investigate the flow patterns of methane and water. Jiang et al. [16] developed a series of multi-dimensional hydrate mining simulation test systems, conducted direct pressure drop mining tests, established the relationship between gas production per unit of pressure drop and the average gas production rate, and explained the mechanism behind the difference in peak gas production rate between vertical and horizontal wells. Liu et al. [17] used nuclear magnetic resonance (NMR) technology to monitor the distribution characteristics of water flooding in deep-sea sandstone reservoirs. They quantified the repulsive capacity of the aqueous phase in the pore-scale medium, explored the mathematical model of repulsive efficiency concerning porosity, and analyzed the sensitivity of reservoir geometry to permeability properties. Zhang et al. [18] carried out high-pressure microfluidic visualization experiments, realized the visual observation of gas hydrate generation and decomposition phase transitions at the pore scale, investigated the evolution of bubble size over time, and examined how the warming rate affects the variation of methane bubbles at the pore scale. Limited by the conditions for conducting indoor experiments, many scholars have investigated the pore-scale gas–liquid two-phase flow through numerical simulation. Zhao et al.’s [19] deep-sea bubble migration model was developed to study the main factors affecting bubble motion under variable pressure conditions during hydrate decomposition. A mathematical relationship between bubble size change and drag coefficient was established. Ju et al.’s [20] numerical simulation of two-phase flow was conducted on a two-dimensional pore scale using a multicomponent lattice Boltzmann model (LBM) to compute the variations in pressure and velocity fields during the two-phase repulsion process. The study aimed to explore the relationship between the dominant flow path and the distribution of pore-throat sizes, as well as to elucidate how the non-uniformity of pore shapes affects flow capacity. Kamaljit et al. [21] studied the two-phase repulsion process dominated by capillary forces in porous media, analyzed the degree of sensitivity of the repulsion mode to wettability and the geometric structure of porous media, investigated the influencing factors of the repulsion interface instability, and established the rule governing the change of the dominant path of the repulsion phase. Accurately characterizing the structure of hydrate deposits is essential for studying the two-phase flow of methane and water. Wang et al.’s [22] splicing method was developed to characterize the full-size pore-size distribution (PSD) and throat-size distribution (TSD) structures. The effect of the cross-scale inhomogeneity of the reservoir structure on the two-phase flow was assessed. It was found that the more concentrated the full-size pore-size distribution (PSD), the greater the hydraulic conductivity of the reservoir. Lu et al. [23] simulated the transport characteristics of the gas–liquid repellent interface using the level set method and performed calculations in the finite element software COMSOL Multiphysics5.6 to investigate the impact of the pore–throat ratio on the shape, location, and repellent efficiency of the water–gas interface.
In this paper, we develop a nonhomogeneous pore model using a stochastic algorithm and employ the finite element method to analyze the flow characteristics of methane decomposed from hydrates in a saturated water environment. The aim is to investigate the distribution patterns of the effective flow channel for gas-phase drive-off at the pore scale, the factors affecting the time of the tail breakthrough, and the rule of change of the bound water. Providing strong theoretical and technical support is essential for conducting an in-depth study of reservoir conductivity and gas recovery rate during hydrate aquifer mining.
2. Geometric Model Description
2.1. Random Reconstruction Algorithm of Pore Structure
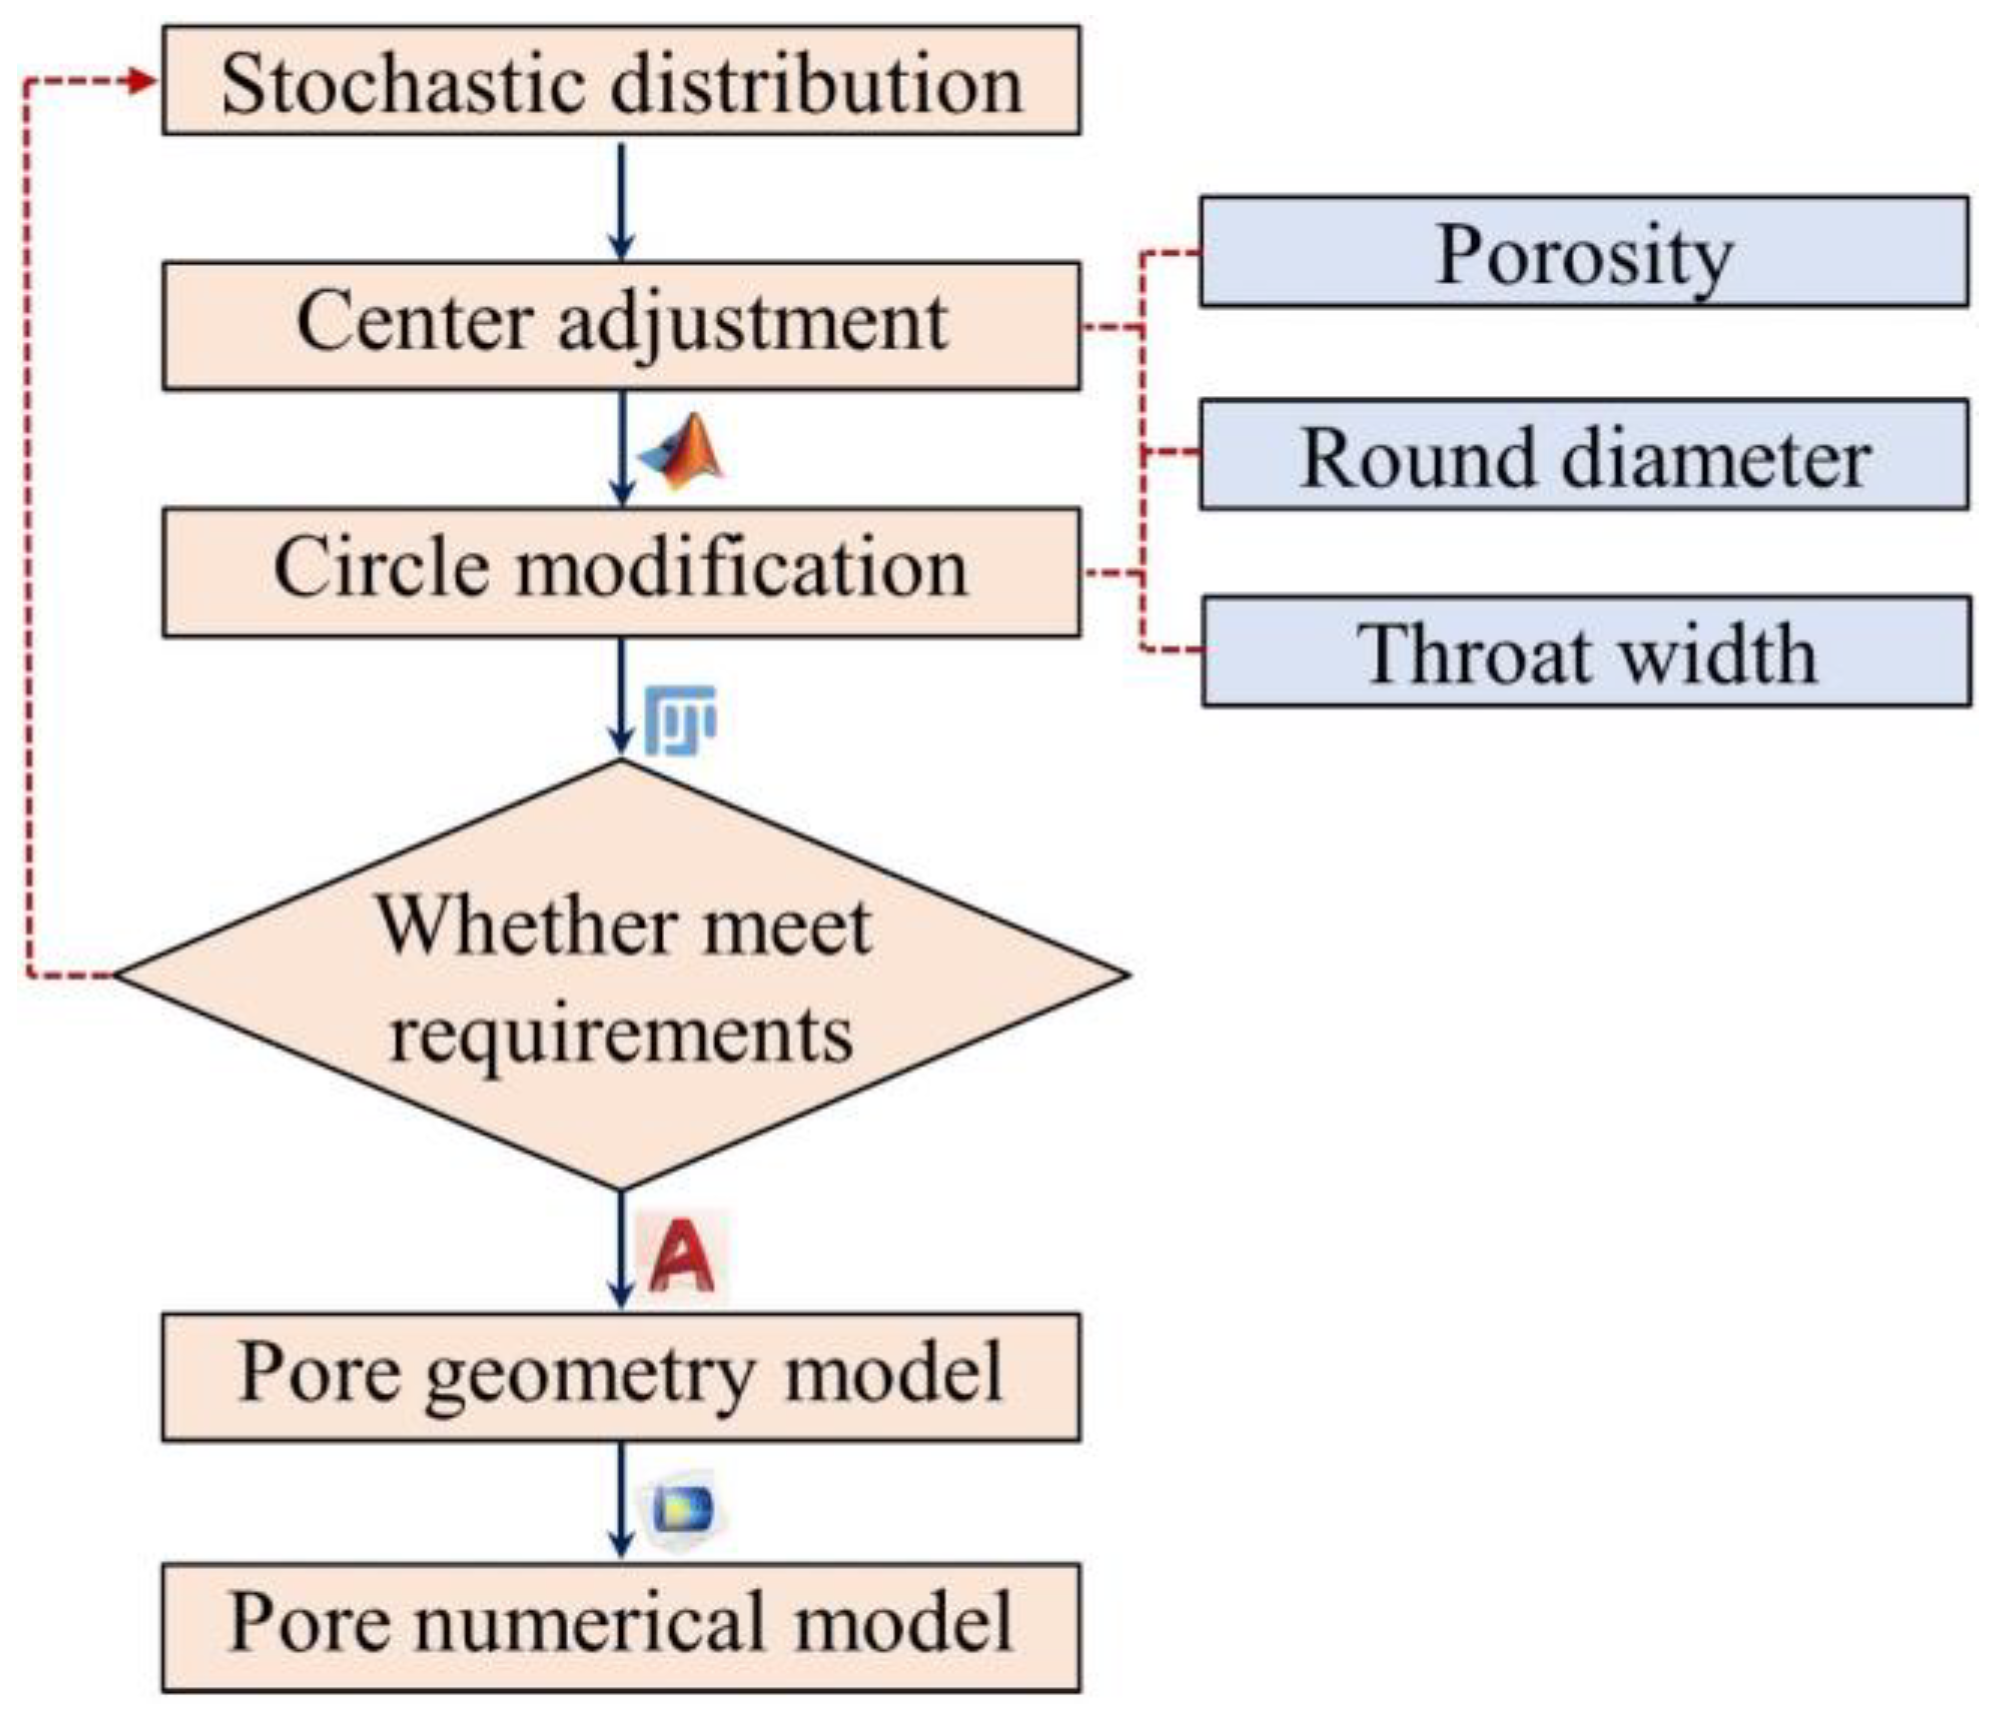
In pore-filled and particle-cemented hydrate deposits, the pores between rock particles constitute the main fluid transport space. We enhanced the random distribution algorithm in MATLAB by utilizing the Mersenne rotation algorithm [24]. This was achieved by generating random numbers uniformly distributed in a rectangular range using the rand function [25]. We input basic information such as pre-studied porosity, diameter of the matrix circle, and width of the throat into the program. Then, we generate a circular matrix, with the area between the circular media serving as the flow channel. It is worth mentioning that the pore structure generated in this manner is unique. We compare the multiple geometric models generated to select the model for further study. We obtained a series of two-dimensional random coordinates based on the specified particle radius and particle density. Circular particles that can overlap and be distributed are arranged to characterize the nonhomogeneous pore structure of the hydrate sedimentary layer. The voids between the units are represented by the circular, overlapping portions, symbolizing the rock particles, while the area between the circles represents the pore medium. The pore medium was generated by entering the circular diameter (100 μm) and porosity, followed by circular position adjustment and overlapping circular modification. By determining the maximum and minimum widths of the throat, we can assess if they meet the requirements of the proposed model. The model will be output in Drawing Exchange Format in AutoCAD 2014 software, and then a two-dimensional pore medium model will be constructed in COMSOL. The complete processing flow is shown in Figure 2.
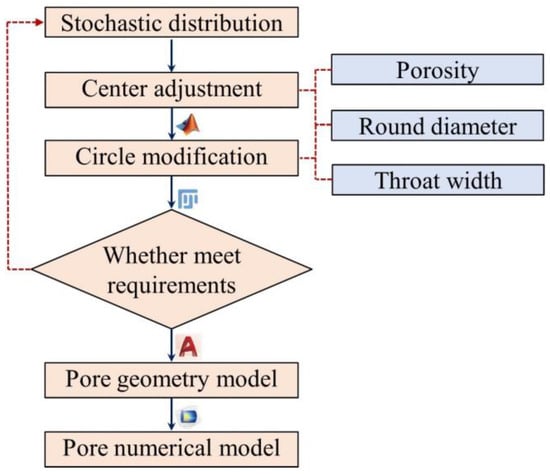
Figure 2.
The construction process of random distribution pore model.
2.2. Characteristic Analysis of Heterogeneous Model
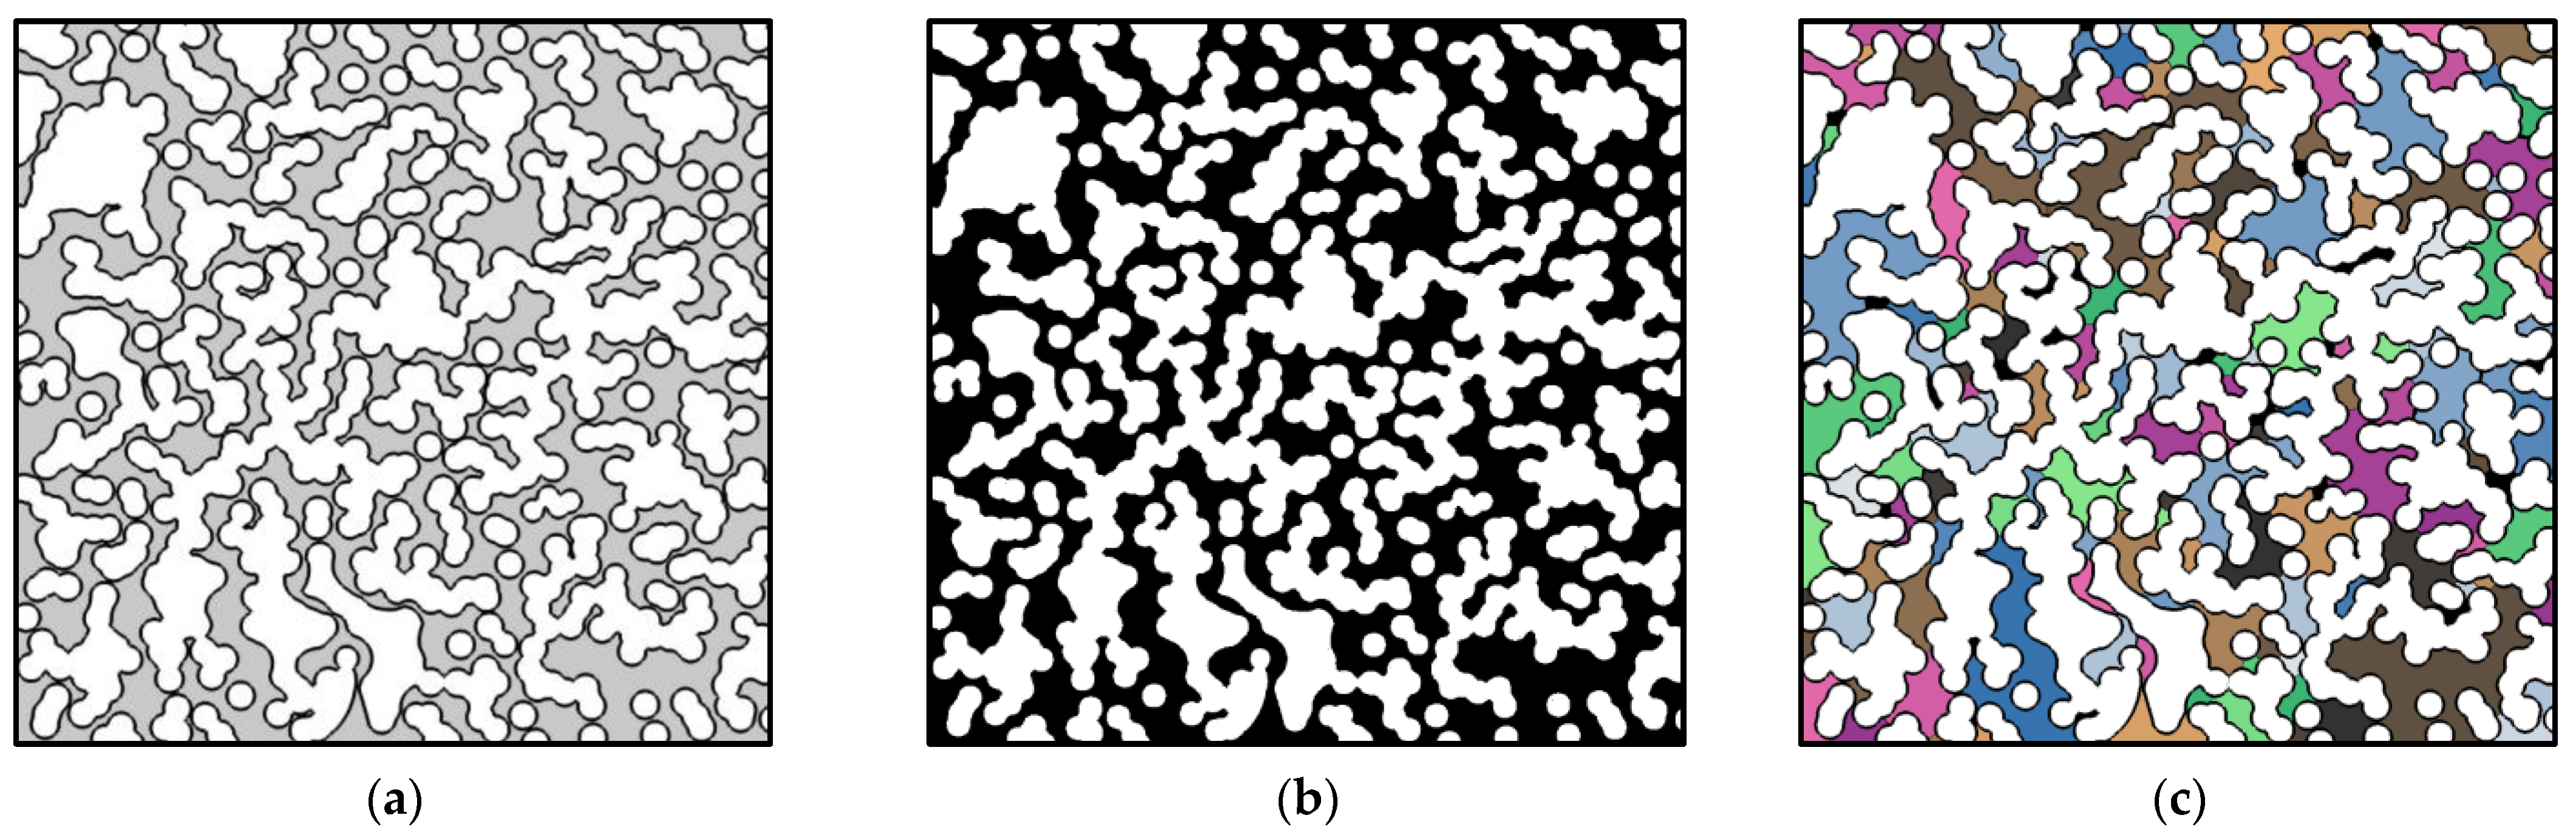
A detailed quantitative description of the two-dimensional porous media model forms the foundation of this study. In this paper, PCAS v2.3 software is utilized to identify the pore structure in the model. The fracture image is binarized using the threshold segmentation method. Various geometric and statistical parameters of the pore system are obtained through matrix computation. The colored part represents the pore region, and different pore spaces are segmented based on the pore diameter plunge. The space without a range in pore diameter is considered the same pore and is distinguished by different colors. From the pore network structure’s connectivity characteristics, it can be observed that there are a total of 109 small pore spaces, each with an average profile coefficient of 0.37. The self-similarity of the profile is described using the box dimension method. The fractal dimension of the pore network is calculated to be 1.45. The processing procedure is illustrated in Figure 3.
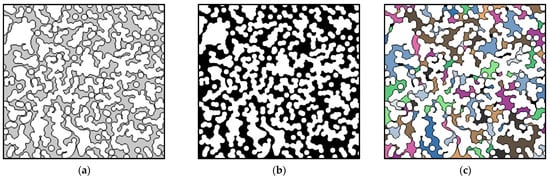
Figure 3.
Extraction of geometric feature information of porous media: (a) Pore-scale heterogeneous geometric model; (b) binarization processing; and (c) geometric characteristics of pore structure.
2.3. Distribution Characteristics of Throat Opening
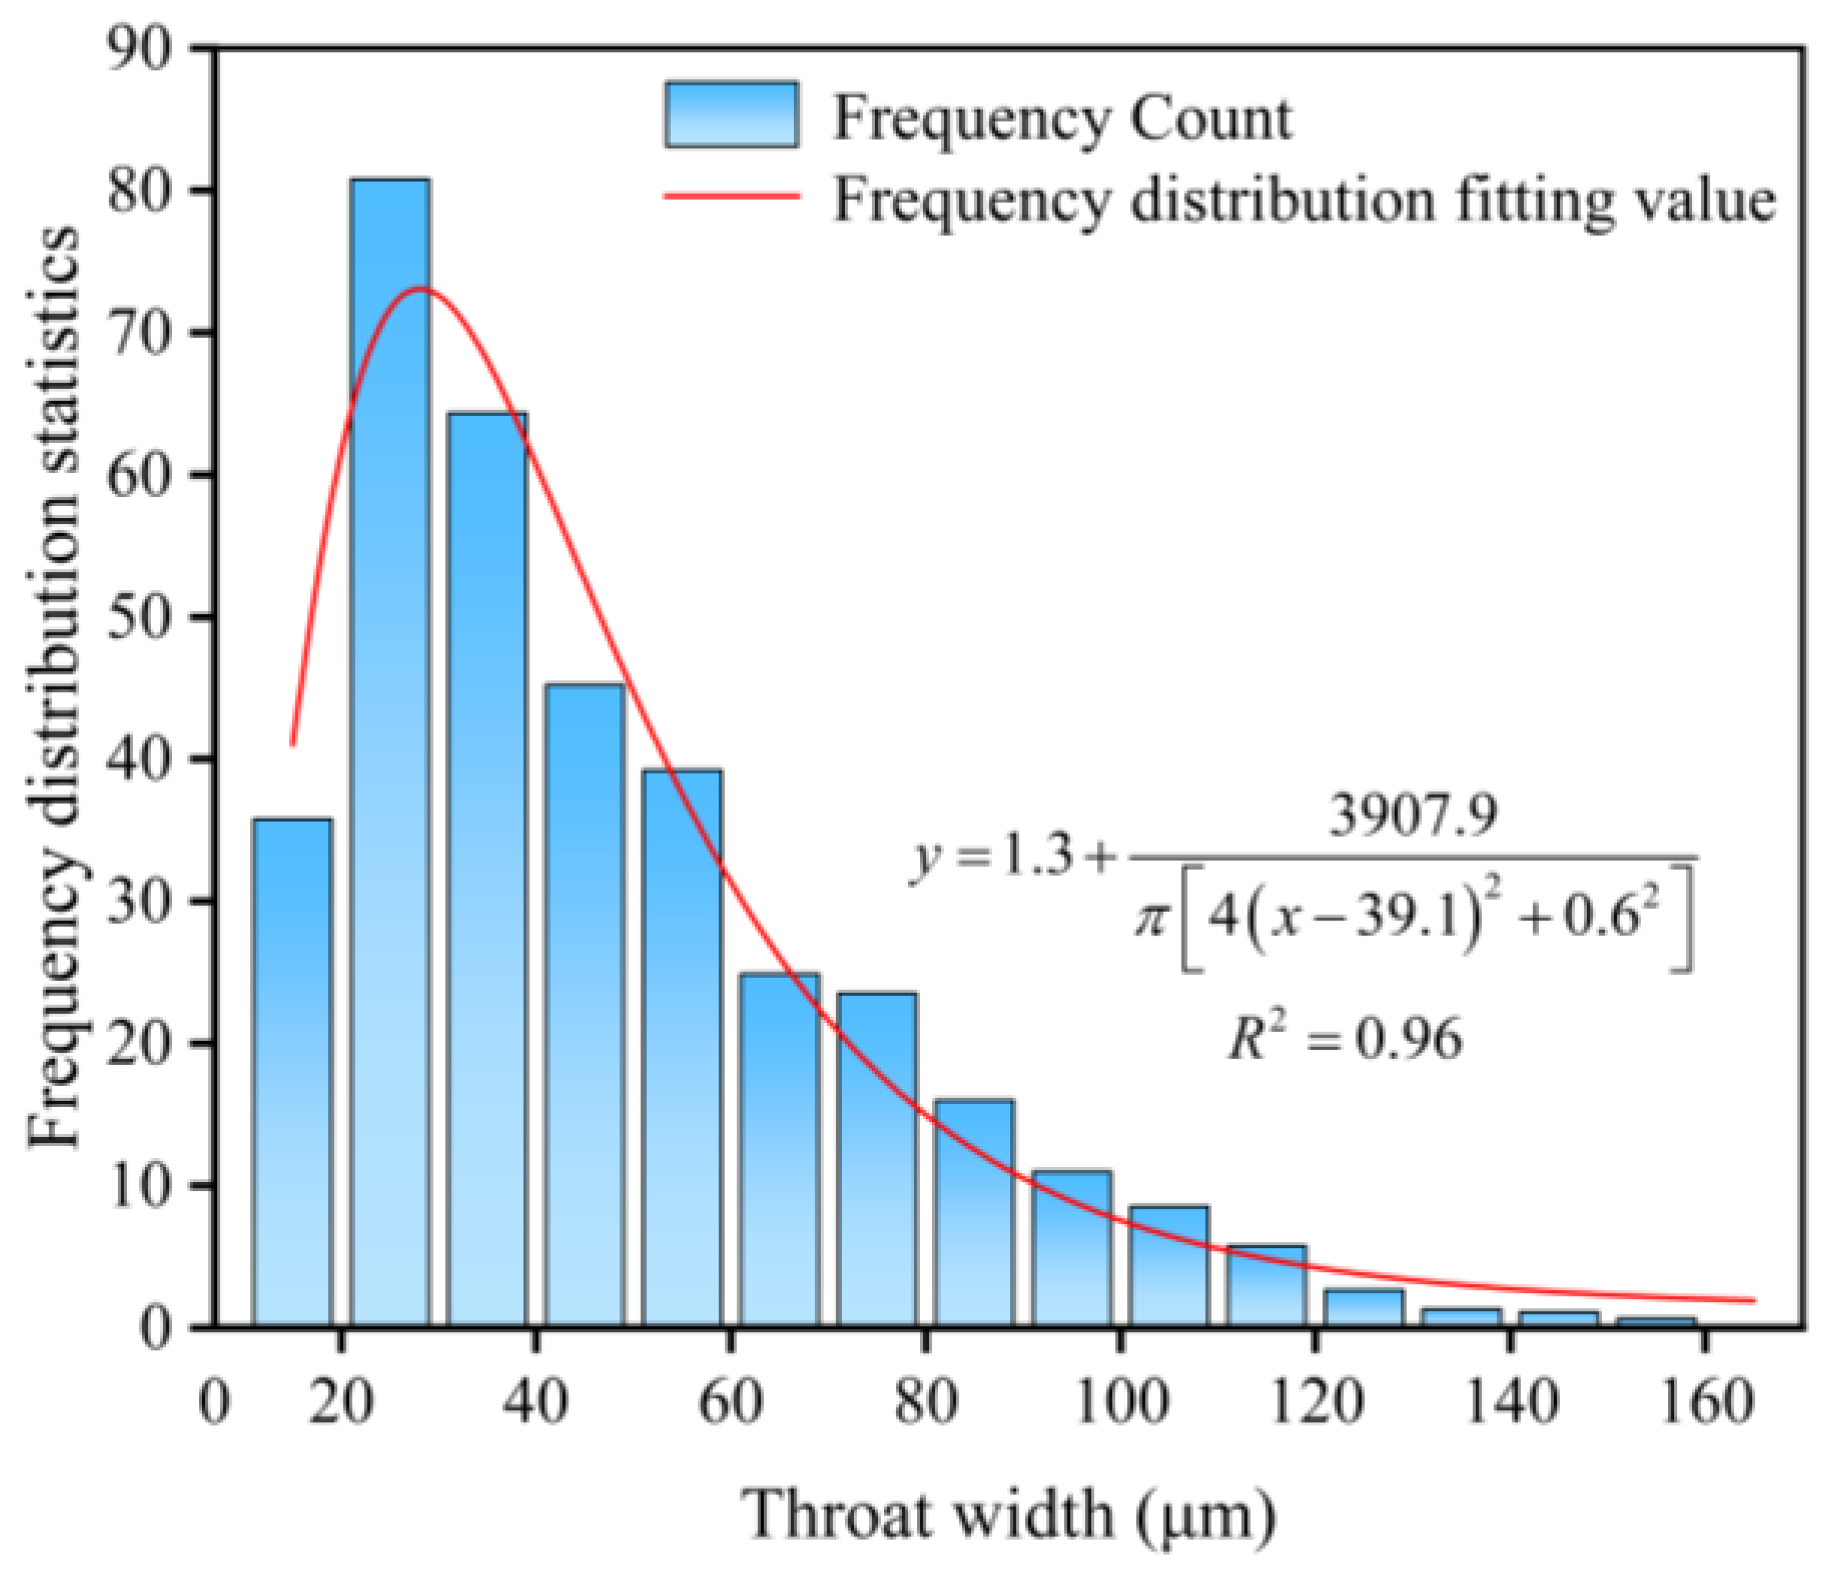
To characterize the distribution of the throat width, the model network structure was imported into ImageJ version 1.54j, and the image was randomly segmented and delineated using the Watershed algorithm based on the grayscale changes [26]. The fissure delineation opening was calculated using the built-in Analyze Particles function of ImageJ. The complete image of the fissure opening is captured, and the frequency distribution of the opening data is analyzed. The distribution interval is set at 10 μm for the frequency histogram. The histogram displaying the frequency distribution of the fissure openings and the corresponding fitted curves are illustrated in Figure 4. The model network structure is predominantly characterized by a microchannel structure. The area with local openings ranging from 10 to 40 μm constitutes 50.11% of all fissures, while the area with local openings ranging from 10 to 60 μm represents 73.5% of the total fissures.
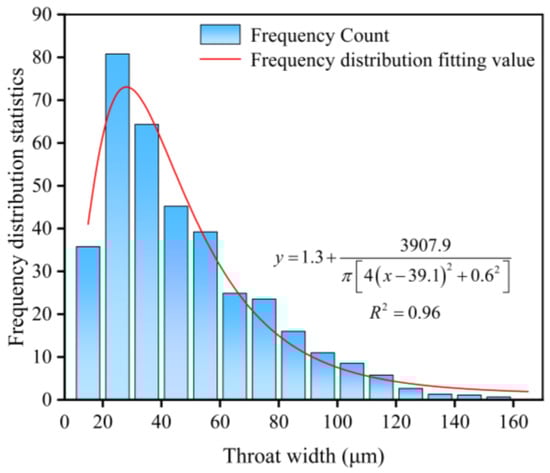
Figure 4.
Hydrate mining and pore frequency distribution.
3. Numerical Model Description
3.1. Governing Equation
To visualize the constrained behavior of the two phases within the microchannel, simulation operations have been conducted in COMSOL using the level-set method. Tracking the shape and position of the interface is accomplished by the time evolution of the level-set function. The model incorporates interfacial tension as a mass force into the Navier–Stokes equations, which are utilized to depict mass and momentum transfer in the two-phase methane and water fluids [27].
where ρ is expressed as the density of the fluid, kg/cm3. μ represents the dynamic viscosity of the fluid, Pa-s. u is the speed, m/s. p represents the inlet pressure, Pa. I is the unit matrix. Fst is the surface tension of the two phases, N/m.
The flow velocity at the minimum opening of the simulated process in this paper is small, and the Reynolds number is much less than 1, which can ignore the inertial term of the flow. In this way, the fluid flow problem is transformed into solving the Navier–Stokes equations under specific conditions. The above equations can be rewritten as follows [28]:
where p is expressed as pressure, Pa. u is expressed as the flow velocity, m/s. μ is denoted as the dynamic viscosity of the fluid, Pa·s. ρ is expressed as the density of the fluid, kg/m3.
The respective volume fractions of the gas–water two-phase flow are defined in a separated two-phase flow by the level-set function φ, where 0 ≤ φ ≤ 1. In the two-phase flow simulation process, φ = 0 indicates the aqueous phase, and φ = 1 indicates the gas phase. When 0 < φ < 1, φ is used to describe a phase interface with a certain thickness. It is a value that presents a gradient change from 0 to 1. A contour surface with φ = 0.5 is typically considered the phase interface in post-processing. The two-phase flow interface is tracked using the reinitialized level-set function φ values to study the dynamic characteristics of the gas–water two-phase flow interface. The kinematic equation of the level-set method for tracking the interface of the gas–water two-phase flow can be expressed as follows [29]:
where γ is the reinitialization parameter; ε is the interfacial thickness control parameter; denotes an accumulation term over time; and denotes a convective term.
The right-hand side of the level-set equation represents the diffusion term. The choice of both γ and ε affects the astringency of the model. To improve astringency when calculating the level-set equations, ε = hc/2 is usually used, where hc is the grid size of the interface region, and γ is the maximum velocity occurring in the model. A uniform mesh size is more conducive to computational convergence, and an appropriate increase in ε can accelerate the model. Since the level-set function is a smooth step function, the density (ρ) and the dynamic viscosity (μ) of the two-phase mixing parameters can be determined by the following equation [30]:
When the level-set equations are coupled with the flow equations, the velocities in the level-set equations are obtained from the laminar flow. The value of the level-set function (φ) is used in the computation of the flow field properties (ρ, μ) and then exported to the flow equations. The space between the substrates can be divided into pores and throats, with the throats being the key factor affecting the seepage performance of the pore medium. Assuming that the pore throat is saturated with the gas phase initially, the throat radius suddenly decreases during the water drive process, leading to an increase in local capillary forces. In hydrophilic environments, capillary forces act as power while in hydrophobic environments, capillary forces function as resisting forces.
The capillary force in a single capillary tube can be expressed as follows [31]:
where Pc is the capillary force; Pnw is the gas-phase pressure, Pw is the water-phase pressure, and Rh is the characteristic scale of the pore throat. The simulation of two-phase flow under different wettability involves setting two parameters, slip length β and contact angle θw, in the level-set method. The value of the slip length β is defined in terms of the minimum grid length factor when β = fhmin. To prevent the interface from moving too fast, the surface friction Ffr is introduced to constrain the slip length [32]:
The contact angle θw is the angle at the interface between the wall and the fluid, pointing from the aqueous phase to the gas phase. The contact angle is specified by Young’s equation.
where σ denotes the surface tension coefficient, N/m; γsw and γsg are the surface energy densities of the aqueous phase, the gas phase, and the solids.
The surface tension at the interface of the two-phase flow can be expressed as follows [33]:
where n is denoted as the unit vector perpendicular to the interface; δ(φ) is the Dirac function, 1/m.
The Dirac function is 0 only at the phase interface and can be derived from the following smooth function approximation [34]:
3.2. Model Verification
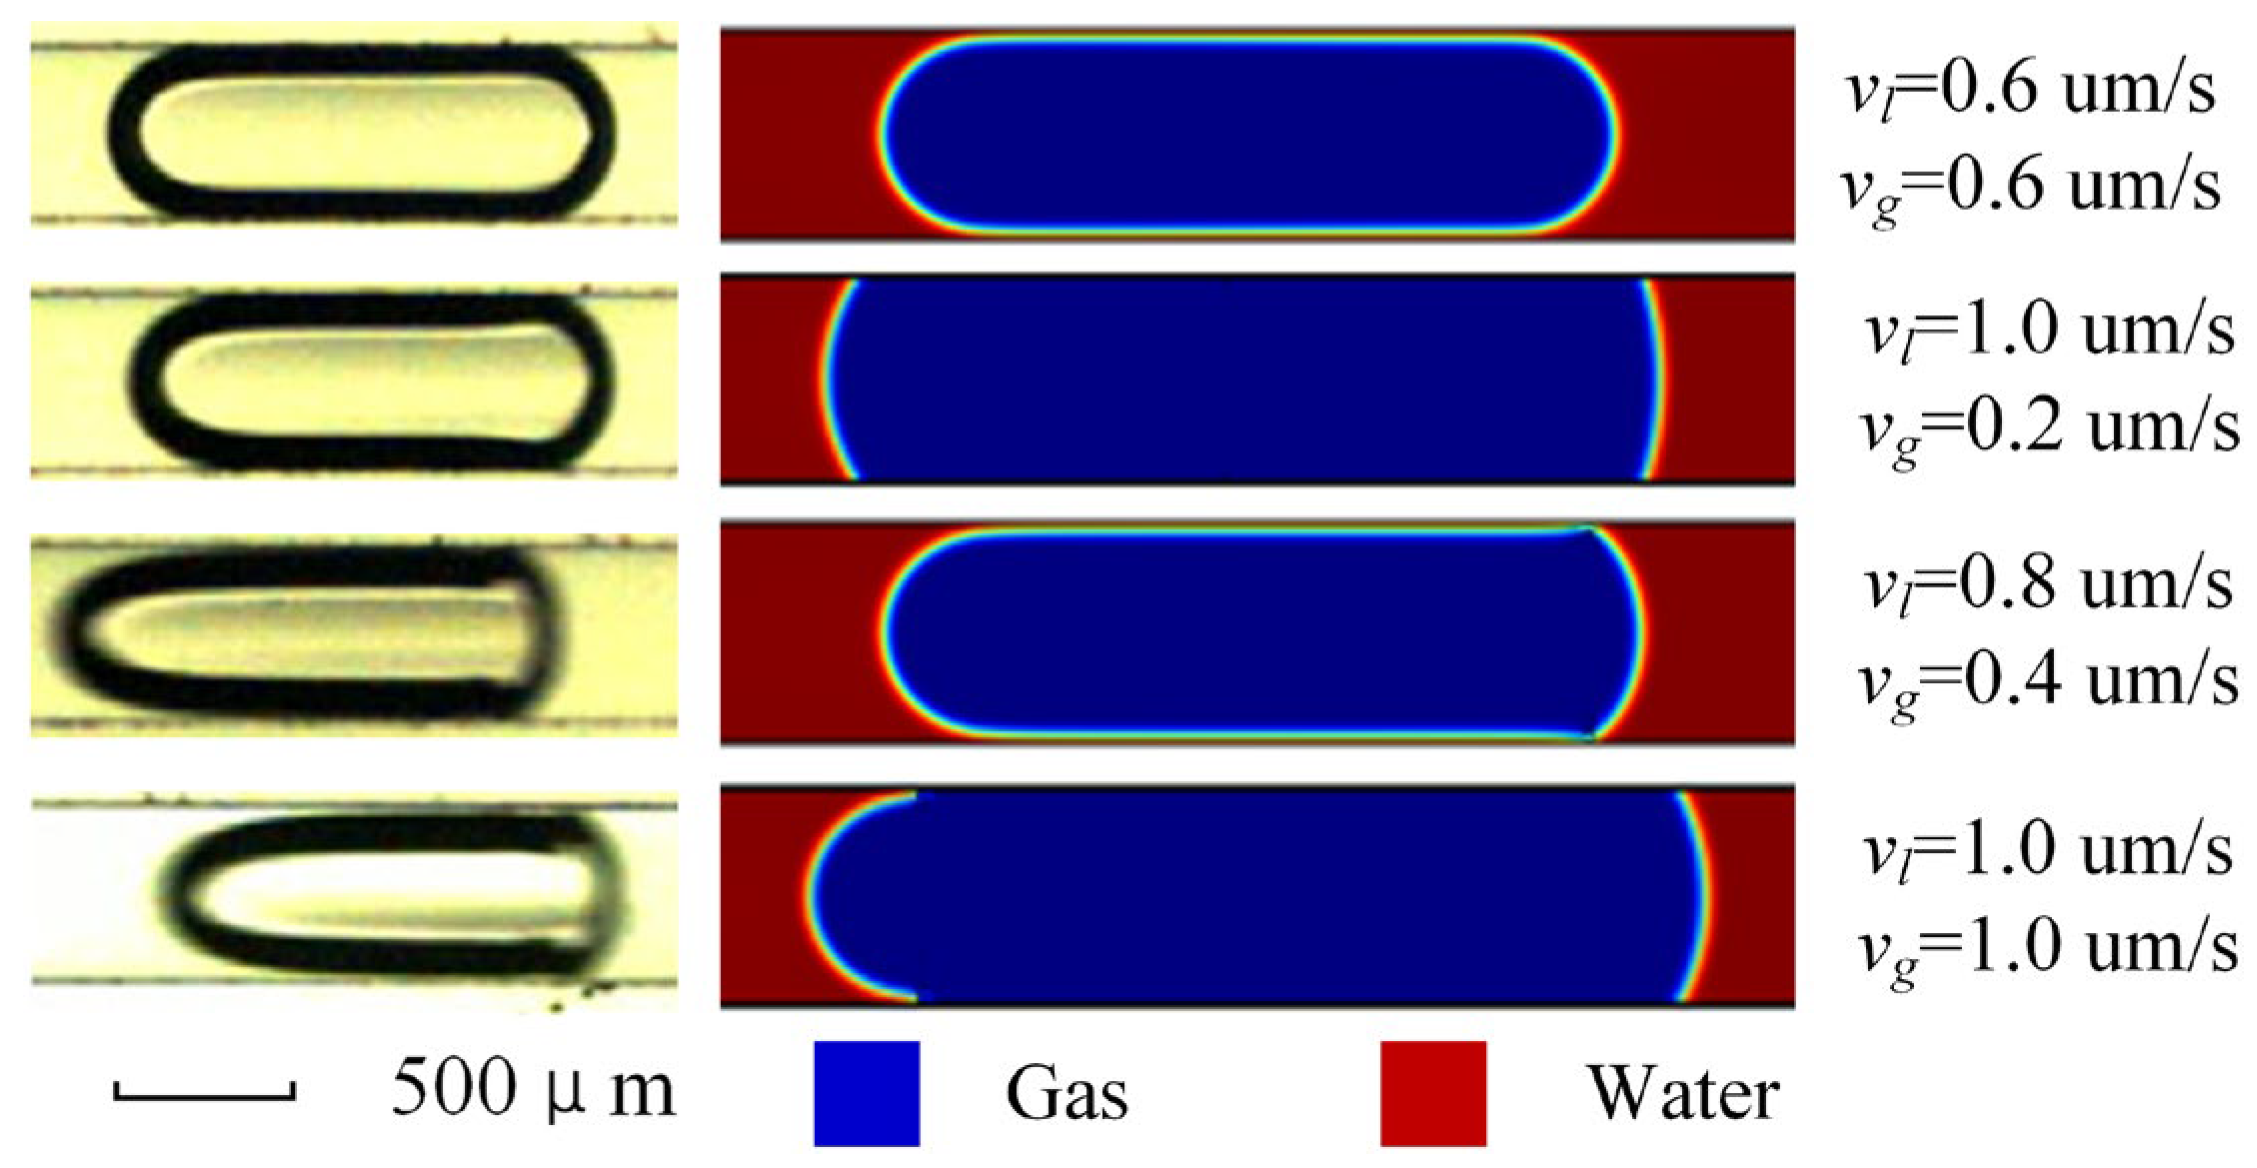
Interfacial interactions are often characterized by dynamic contact angles as the two phases of gas–water flow in microchannels. In this section, the level-set method will be utilized to simulate the gas–liquid flow in a single microchannel at various flow velocities [35]. The numerical simulation results will be compared with the experimental findings conducted by Choi to validate the model’s accuracy [36]. In the simulation, we set the same boundary conditions as those in the experimental setup. The experimental setup parameters are presented in Table 1, and the comparison results between the test and simulation are illustrated in Figure 5. From the comparison of experimental measurements and numerical simulation calculations, it is known that the gas-phase advancing contact angle, the receding contact angle, and the liquid-film thickness match the simulation using the level-set method. This verifies the reliability of the level-set method for such applications.

Table 1.
Experimental parameters and conditions.
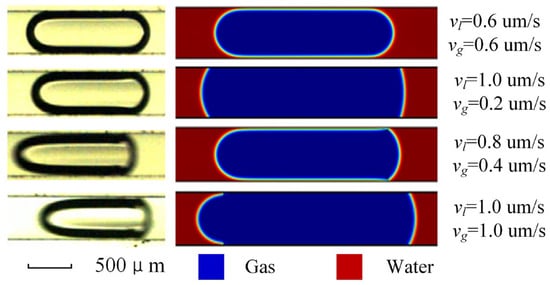
Figure 5.
Comparison of dynamic contact angle with simulation results.
3.3. Model Construction
3.3.1. Model Assumption
This paper aims to investigate the influence of the nonhomogeneity of the hydrate deposit on the gas-driven water process and the role played by the wettability and the interfacial mobility velocity during the flow process. The reservoir microstructure is simplified to a homogeneous porous medium consisting of rounded particles and pores, and the following assumptions are made for the model:
- The porous media structure is assumed to be a uniformly distributed circular media structure, without considering the nonhomogeneity of the geometry (e.g., rectangular structure, rhombic structure, etc.);
- It is assumed that no dissolution, phase change, etc., occurs between the liquid and gas phases during two-phase displacement;
- It is assumed that, in a porous medium, both phases flow at low velocities and fall within the scope of laminar flow;
- It is assumed that the gas phase being studied satisfies the ideal gas equation of state and that both phases of the fluid are incompressible;
- The two-phase fluid flow is driven by differential pressure while ignoring the effects of gravity.
3.3.2. Numerical Model
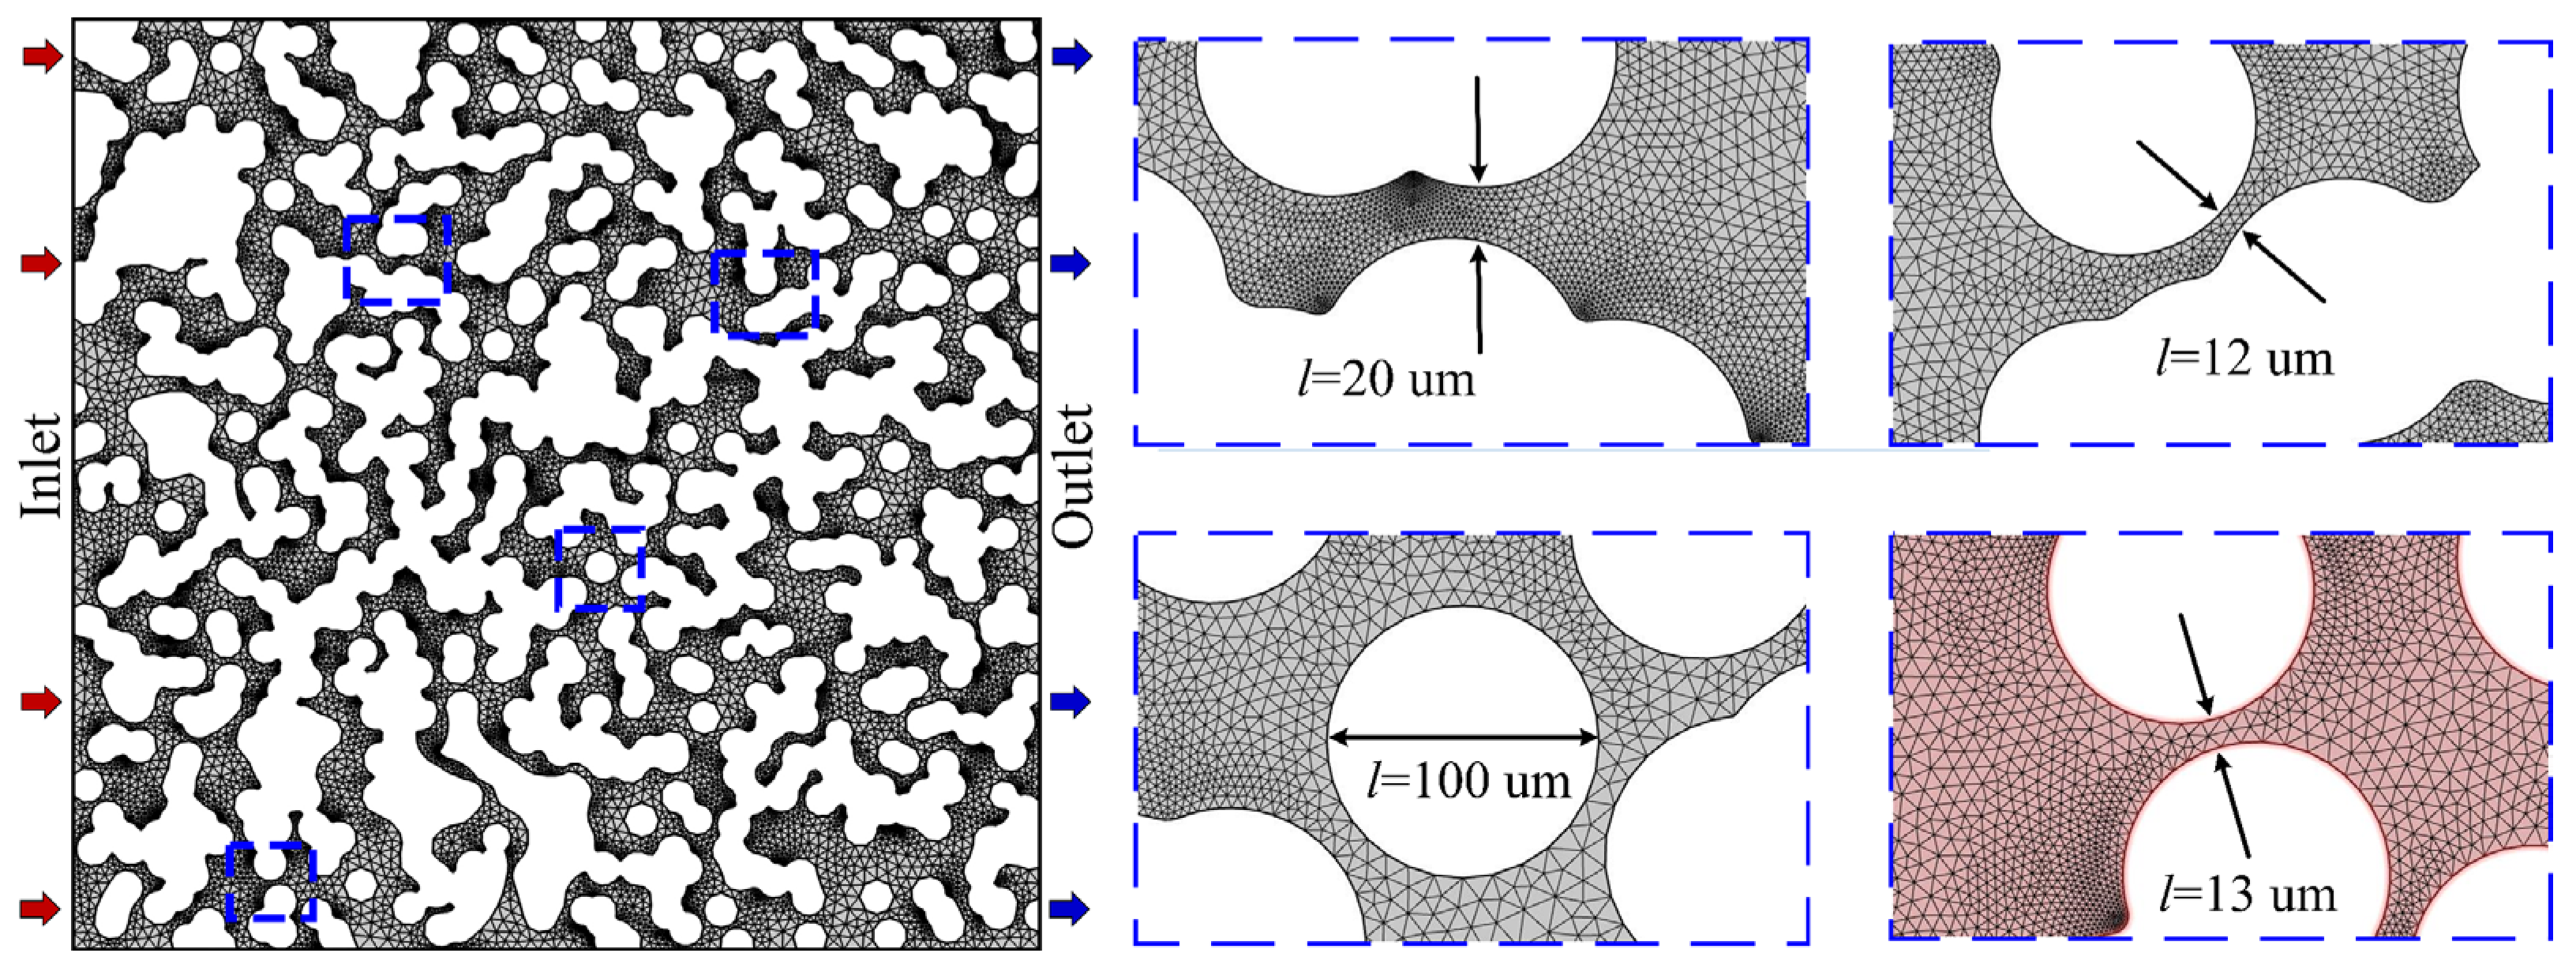
To convert the geometric structure image of the 2D porous media model into a COMSOL geometric model, we first converted it into a DXF file and then imported it into the software. The left end of the model represents the injection end, with injection velocities of 0.2 m/s, 1 m/s, and 5 m/s, while the right end represents the extraction end, with a pressure boundary condition of 0 Pa and no-slip boundaries on the upper and lower walls. For a coupled solution of Navier–Stokes and level-set equations using COMSOL Multiphysics coupling software, the interface thickness is set to one-third of the maximum grid cell size, the initial time length is 10–11 s, and the backward difference method is used to determine the computational time step. The PARADISO solver was used to solve the equations. The Delaunay triangular mesh is used to dissect the porous medium. In the constructed model, we calculated the mesh division with varying degrees of sparsity. When the mesh division is sparse, the calculation results are inaccurate. The gas–liquid interfacial repulsion of a calculation step will lack many details. With the mesh refinement, the calculation results in COMSOL tend to become more accurate. However, as the mesh division precision continues to increase, the improvement in calculation accuracy becomes less significant, while the calculation time increases exponentially. After verifying mesh independence, the mesh with 70,182 elements meets the accuracy requirements for the solution. First, the entire fracture channel is saturated with a liquid phase, and the gas phase is injected from the inlet at the left end of the model to displace the liquid within the pore, while the liquid exits through the outlet. Under the experimental conditions, it is assumed that no heat is absorbed or dissipated during the flow. In addition, the liquid phase is considered incompressible, and the effect of capillary forces during flow is taken into account. The nature of the fluid is assumed to be isotropic. The interior of the rift is a fully connected, contact-free spatial structure. The pore space varies greatly in different regions of the model, so in the mesh generation, the COMSOL embedded mesh method is used to refine the mesh in different pores by adjusting the grid number of the narrow region resolution. The meshing in the throat area should be compact enough to ensure the accuracy of the calculation, and the appropriate coarsening of the mesh in the pore area can reduce the calculation time. To adapt to the boundary of circular pores, the triangular mesh shape is selected, and a total of about 106,811 mesh elements and 1222 boundary cells are divided. The comparison of experimental groups is shown in Table 2. The schematic flow of a nonhomogeneous model and local meshing is shown in Figure 6.
Table 2.
Numerical simulation research group.
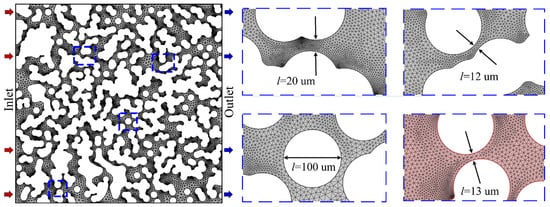
Figure 6.
Flow diagram and local mesh division of heterogeneous model.
4. Results and Analysis
4.1. Flow Characteristics of Methane Flooding at the Pore Scale
4.1.1. Structure of Heterogeneous Medium
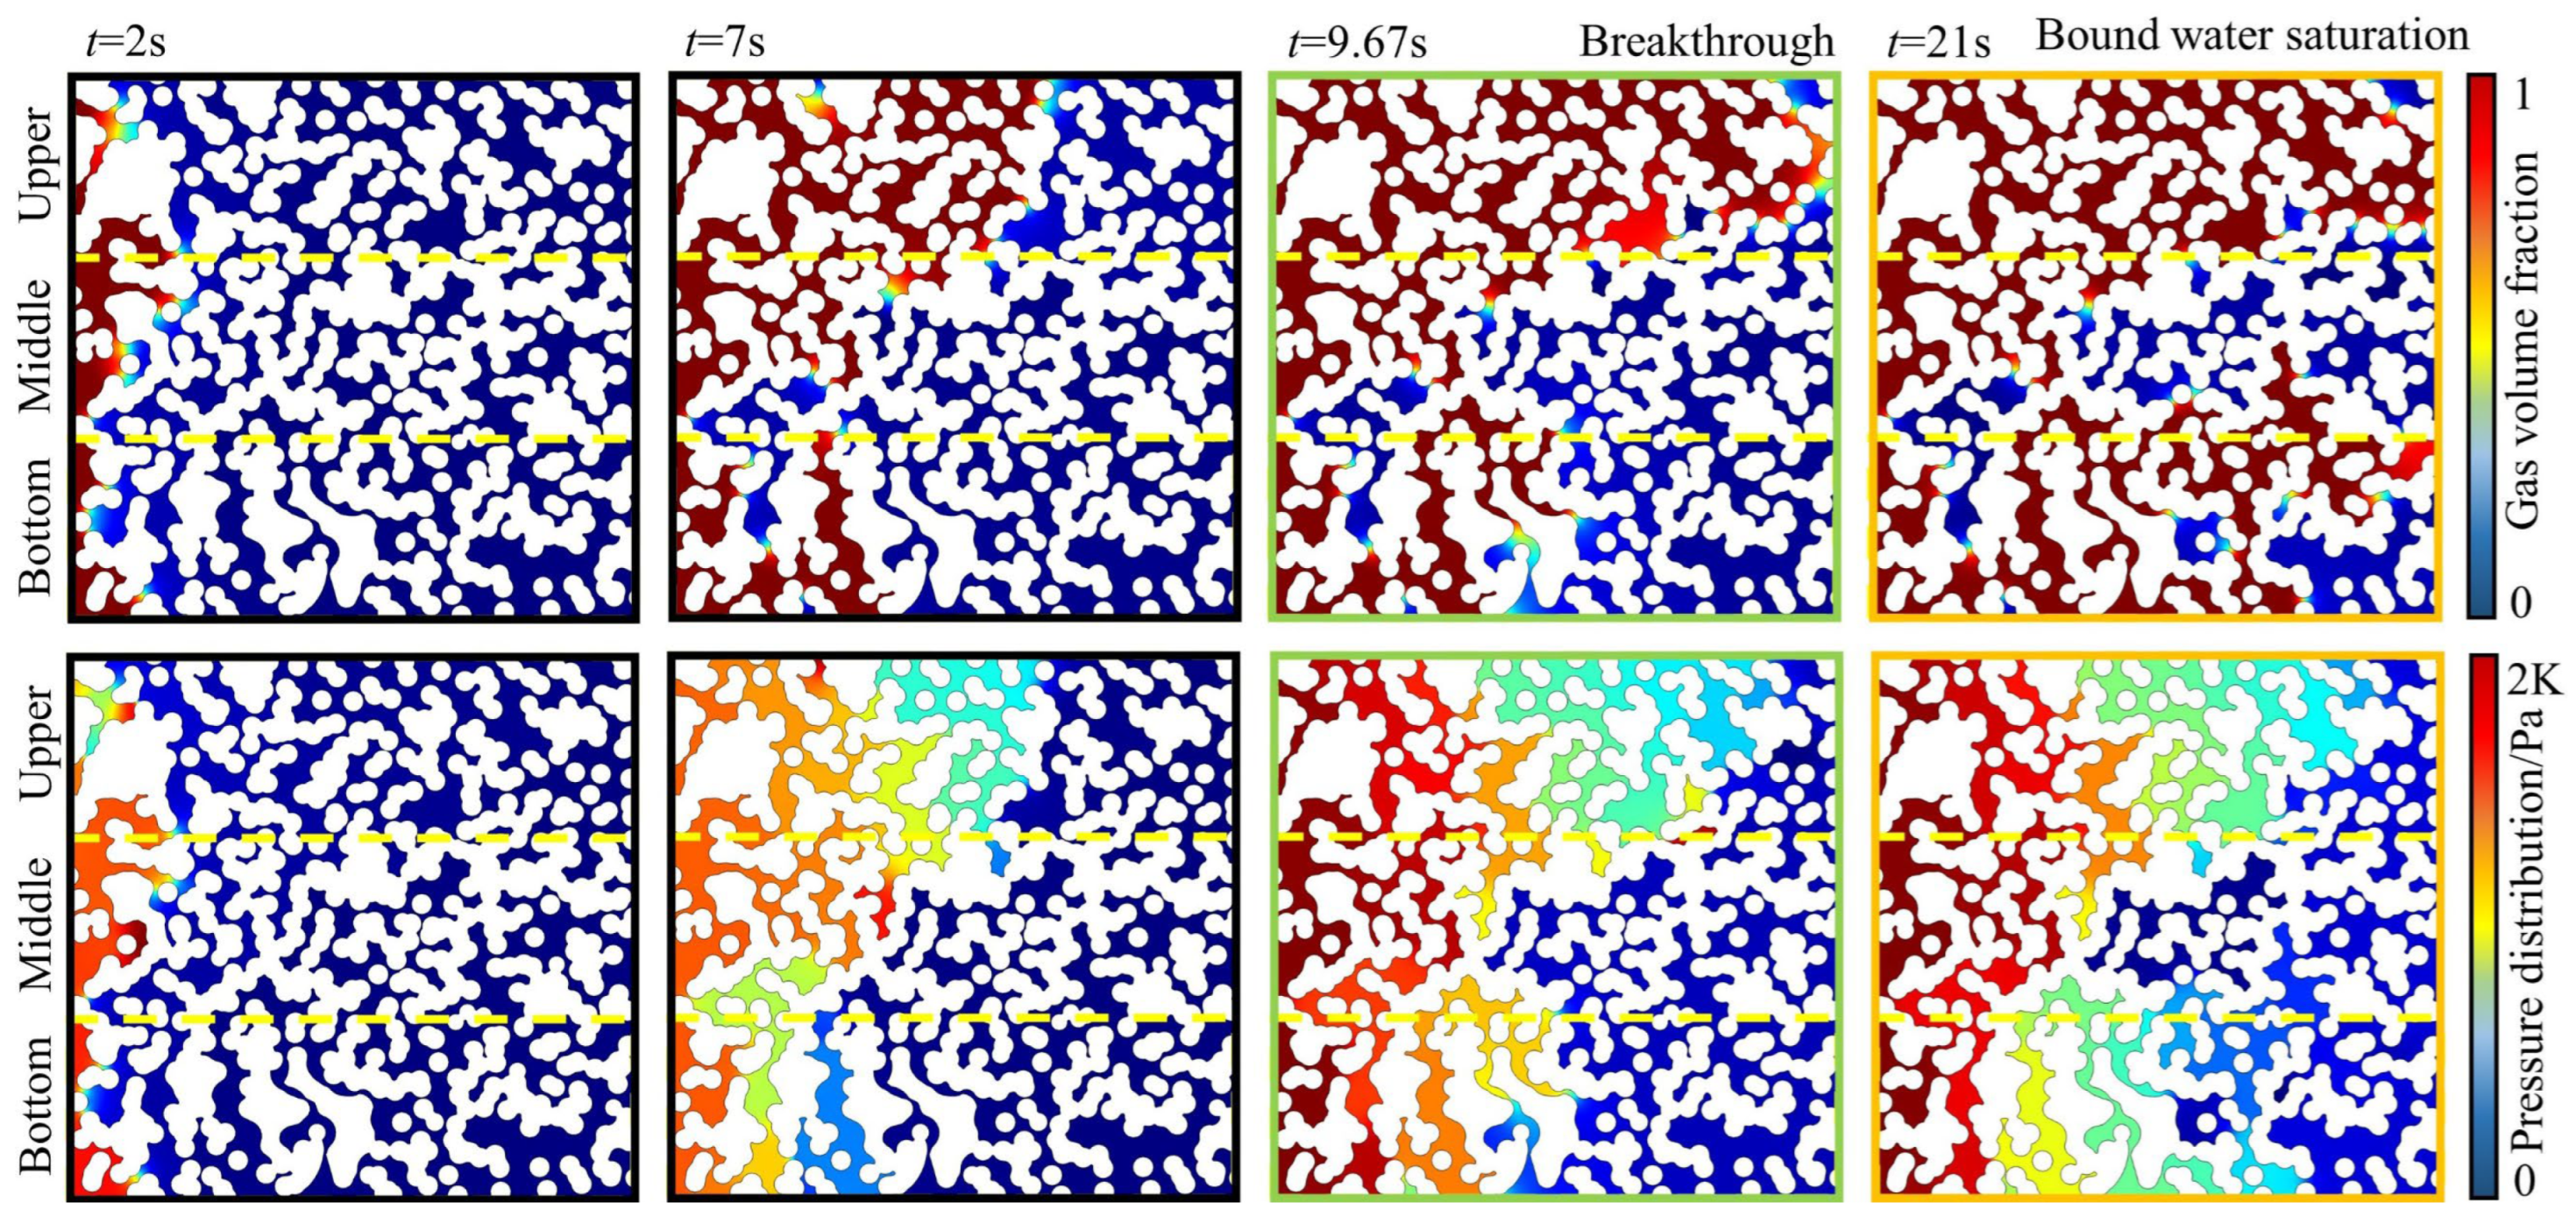
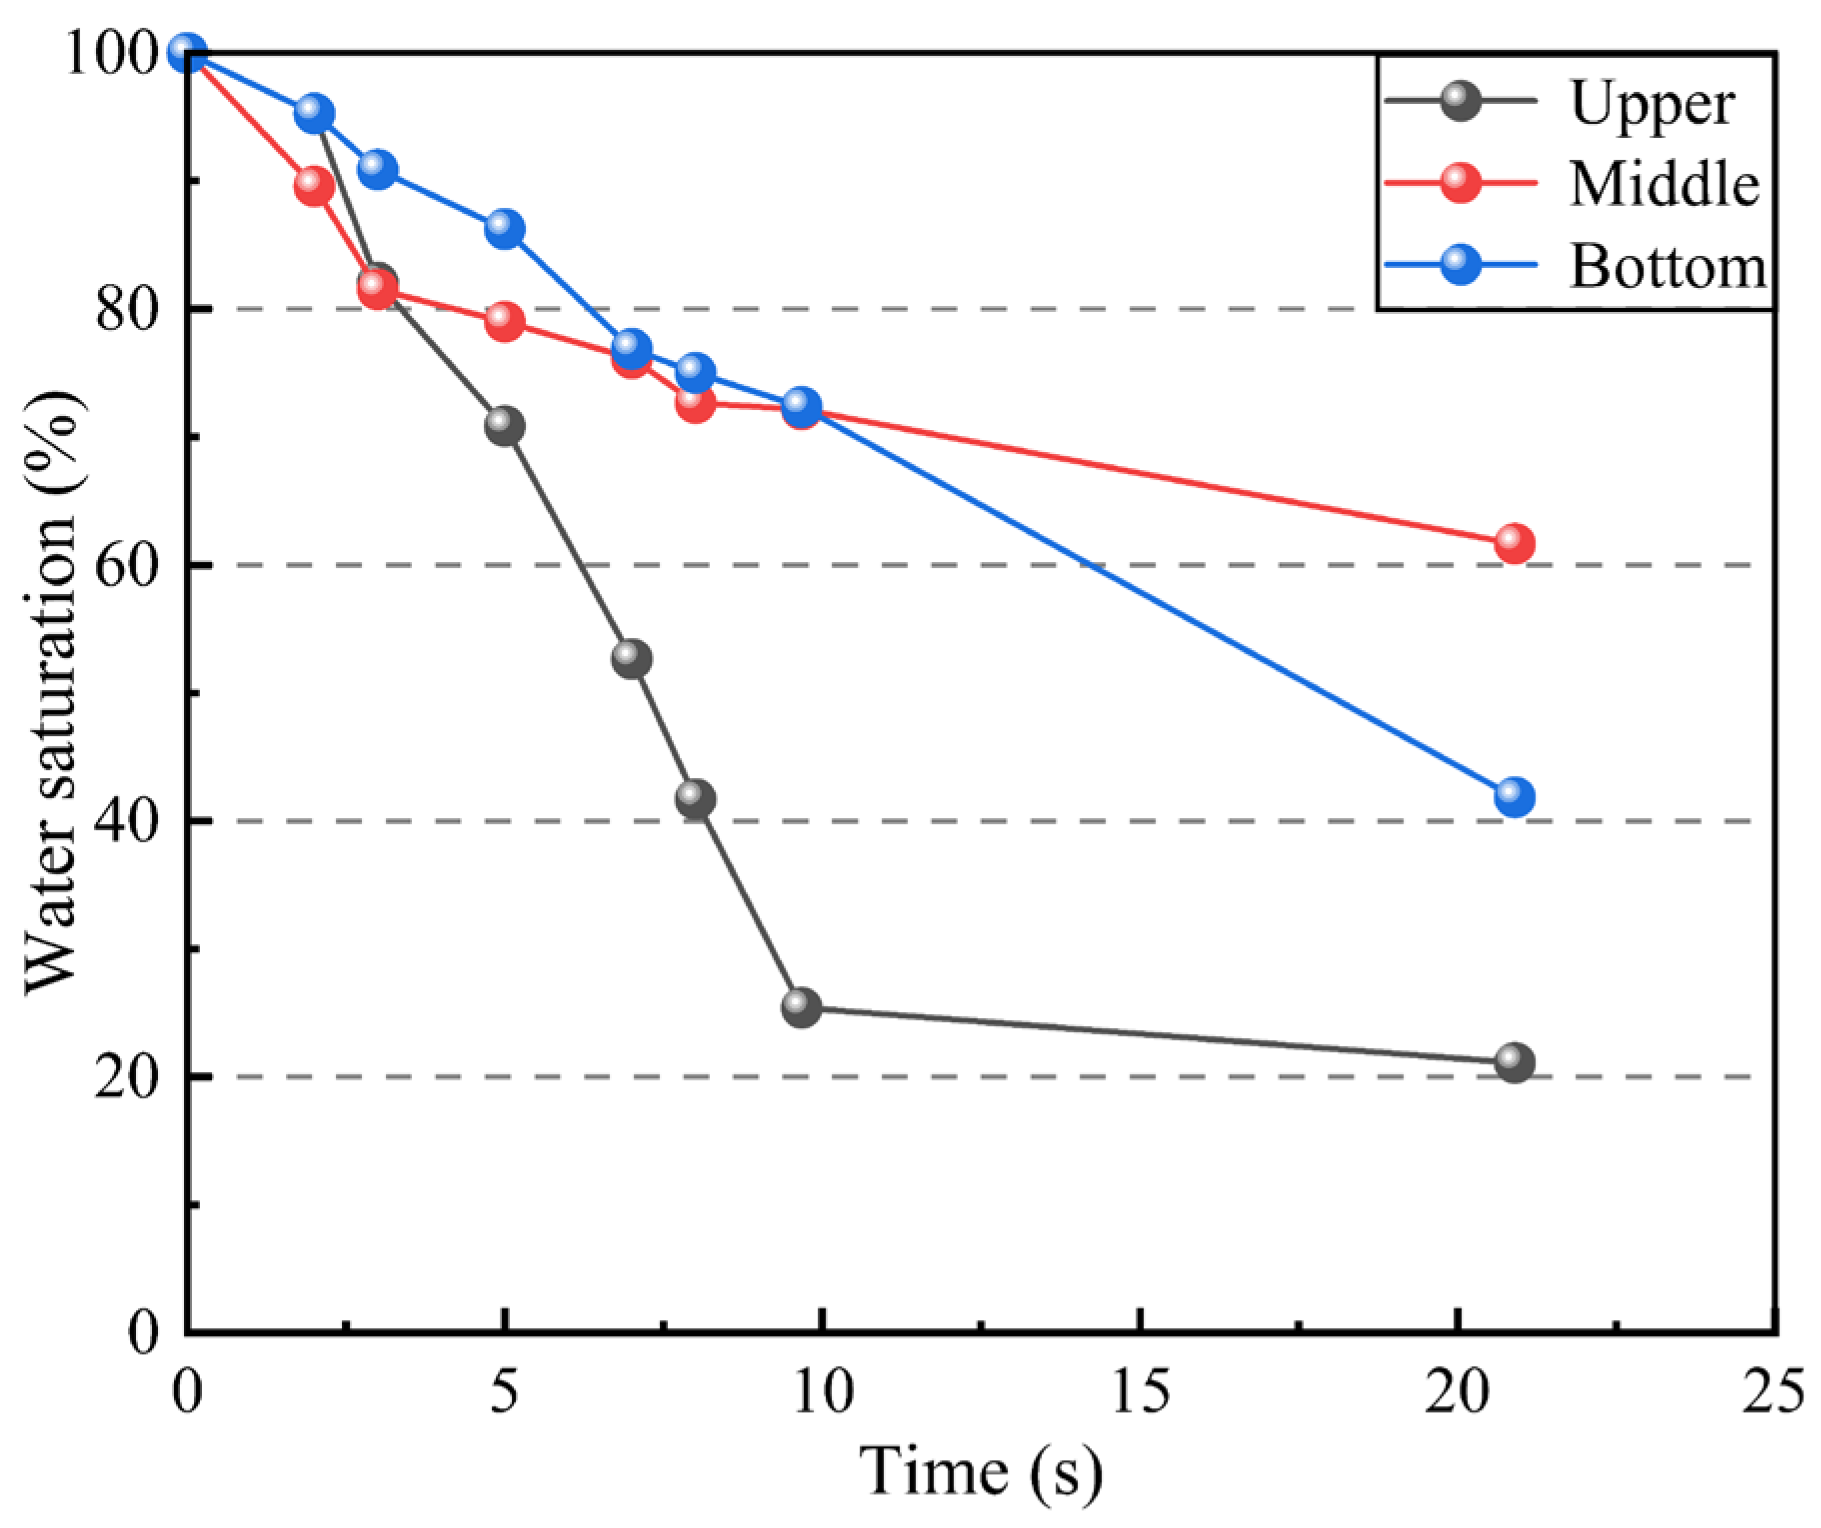
To investigate the effect of the modeled inhomogeneity of the porous media model on the flow, we simulated the methane displacement water process with a wall-wetting angle of 90°, which allows us to exclude the degree of hydrophilicity of the pore medium and only consider the effect of the geometric structure on the flow. The image was thresholded using the binary threshold algorithm to realize the separation of the channel portion and the closed portion of the partitioned image. Further, the channel region was manually selected using the Region Grow algorithm [37], and the pore area occupied by the gas–liquid phase was determined using ImageJ, respectively. The flow phase diagram and pressure cloud diagram are shown in Figure 7, and the change curve of water saturation is shown in Figure 8. Due to the wall resistance, the gas phase first drives off the saturated water in the middle region, and after 2 s, the gas phase mainly drives off the water phase in the upper channel, and the tail-end breakthrough occurs in the upper region at 9.67 s. At this time, the water saturation was 25.4%, 72.2%, and 72.4%, in order; after that, with the continuous injection of gas, the water saturation no longer changed; the water saturation in the upper and central parts of the change was small, only 4.3% and 10.5%, while the water saturation in the lower part of the decline was 30.5%, causing the central region of the water to become bound water. Dominant channels were formed in the upper and lower parts, with effective flow channels accounting for only 58.7% of the total channel area and close to half of the channels becoming ineffective.
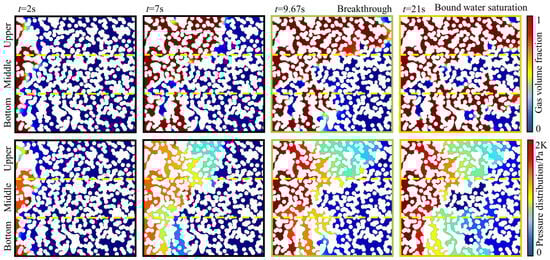
Figure 7.
The volume fraction and pressure distribution of gas drive the water process in porous media.
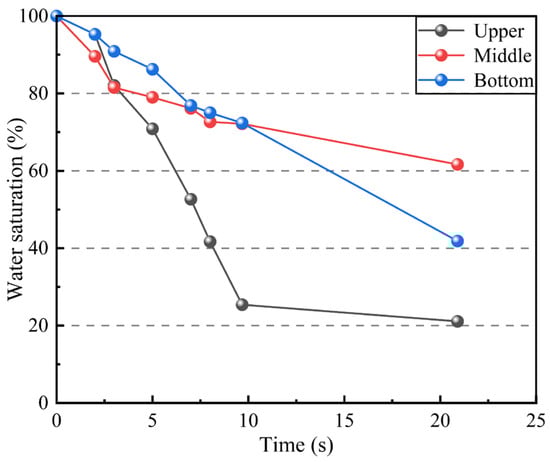
Figure 8.
The change in water saturation with time in the upper, middle, and bottom regions.
4.1.2. Throat Size Heterogeneity
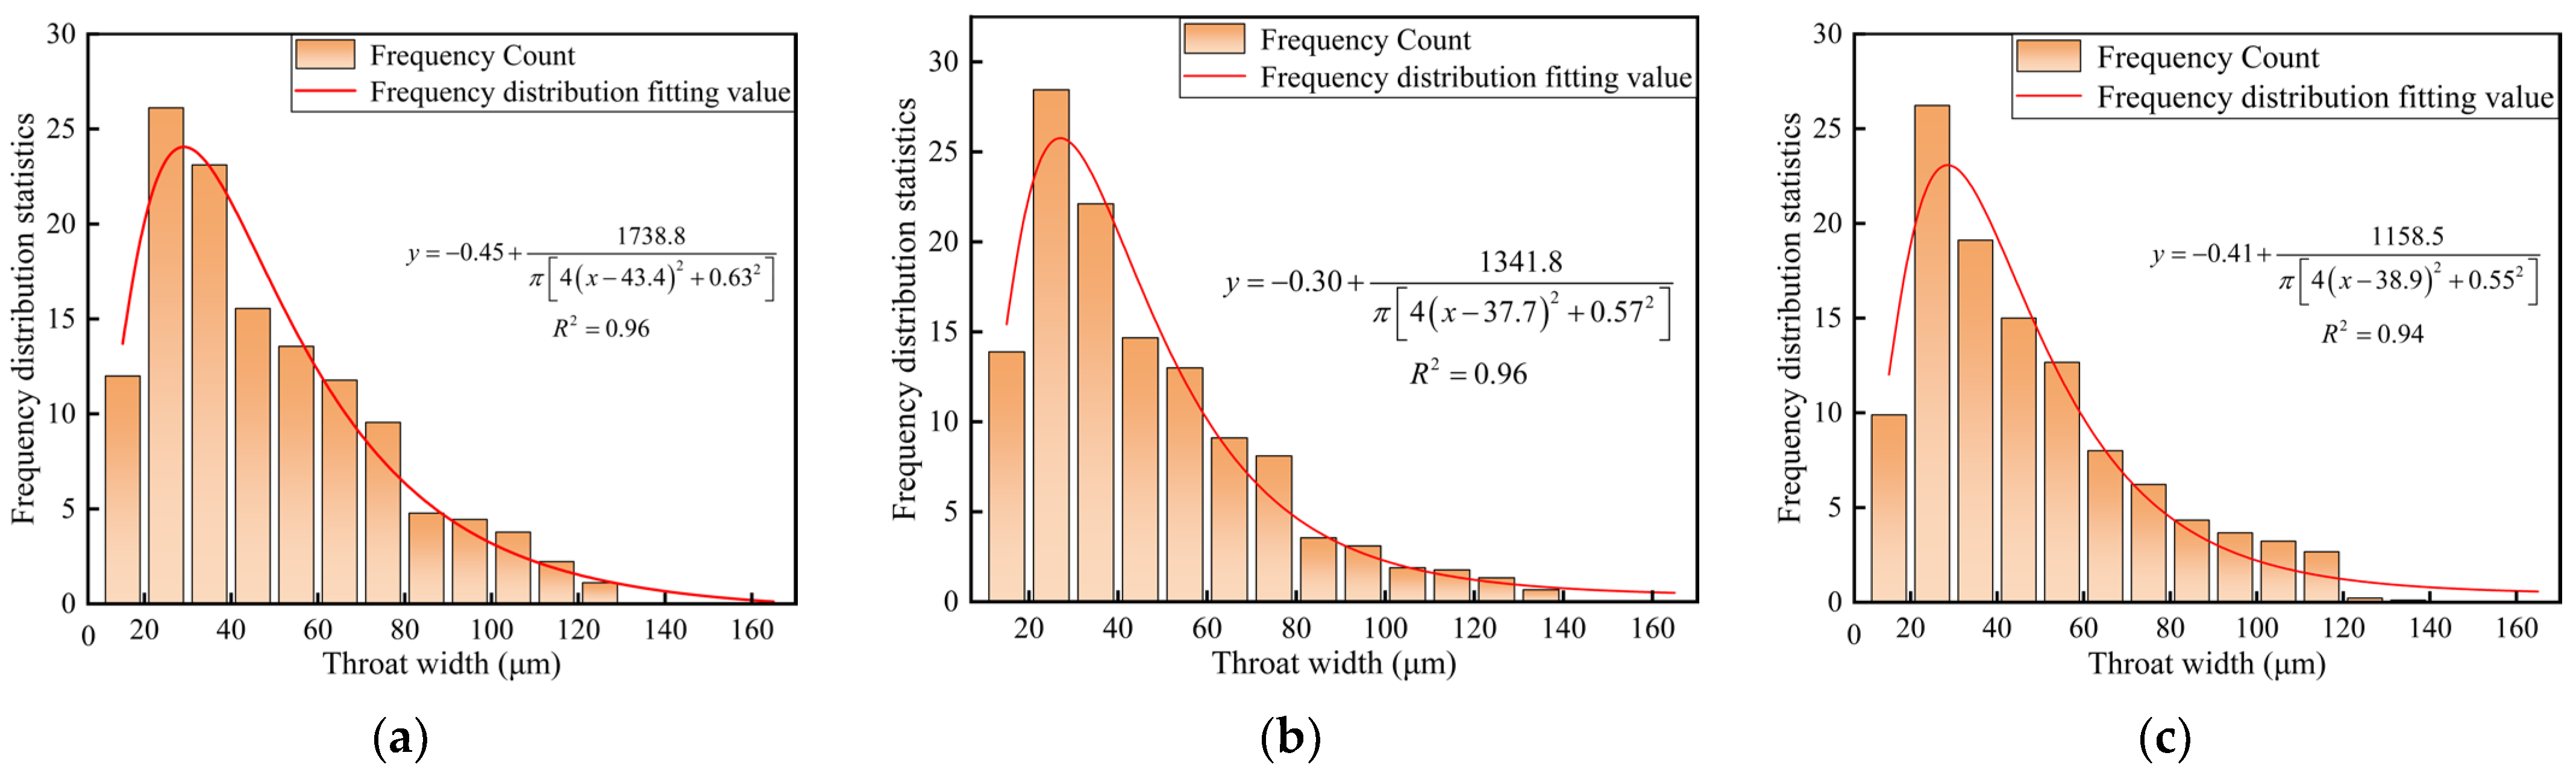
From the numerical simulation results, it can be seen that the throat size in the nonhomogeneous pore-scale model is an important factor that affects the effective flow channel. To further study the role played by throat width in the process of methane-driven replacement water, we divided the pore model with a contact angle of 90° into three parts: upper, middle, and lower regions according to its flow pattern and the location of the tail breakthrough and counted the distribution of the throats in the three regions and plotted the openness-frequency histograms, respectively. We used the Log normal function to model the distribution of throat dimensions across various widths. The fitting coefficients were 0.96, 0.96, and 0.94, respectively, aligning with the characteristics of a lognormal distribution. The histograms and fitted curves of the frequency distributions for the three regions are shown in Figure 9.
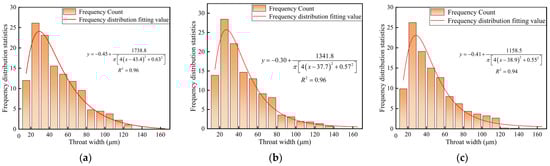
Figure 9.
The frequency distribution of pore model throat width: (a) upper; (b) middle; and (c) bottom.
In the small size range (10–40 μm), the percentage of throat width in the upper, middle, and lower regions was 47.83%, 52.97%, and 49.60%, respectively. In the medium size range (40–100 μm), the percentage of throat width in the three regions was 46.61%, 42.37%, and 44.81%, respectively. In the large size range (100–160 μm), the percentage of throat width in the three regions was 5.56%, 4.66%, and 5.59%, respectively. The porosity was 46.75%, 40.60%, and 45.83% in the upper, middle, and lower regions, respectively. Under neutral wetting, the process of methane driving off water is only related to the width of the flow channel, and the narrower the flow channel, the more difficult it is for driving off to occur. The central region has the highest number of throats in the small size range, which is 3.7% and 10.75% larger than the lower and upper regions, respectively, but the percentage of the gas phase after breakthrough is much smaller than this value, which shows that the minimum width in the flow channel determines the choice of the flow path. The throat dimensions are consistent with the simulations, and the smaller the porosity at the same pressure, the greater the resistance encountered by the displacement fluid, and the more difficult it is for the tail breakthrough to occur in this part of the region.
4.2. Displacement Efficiency and Effective Channel
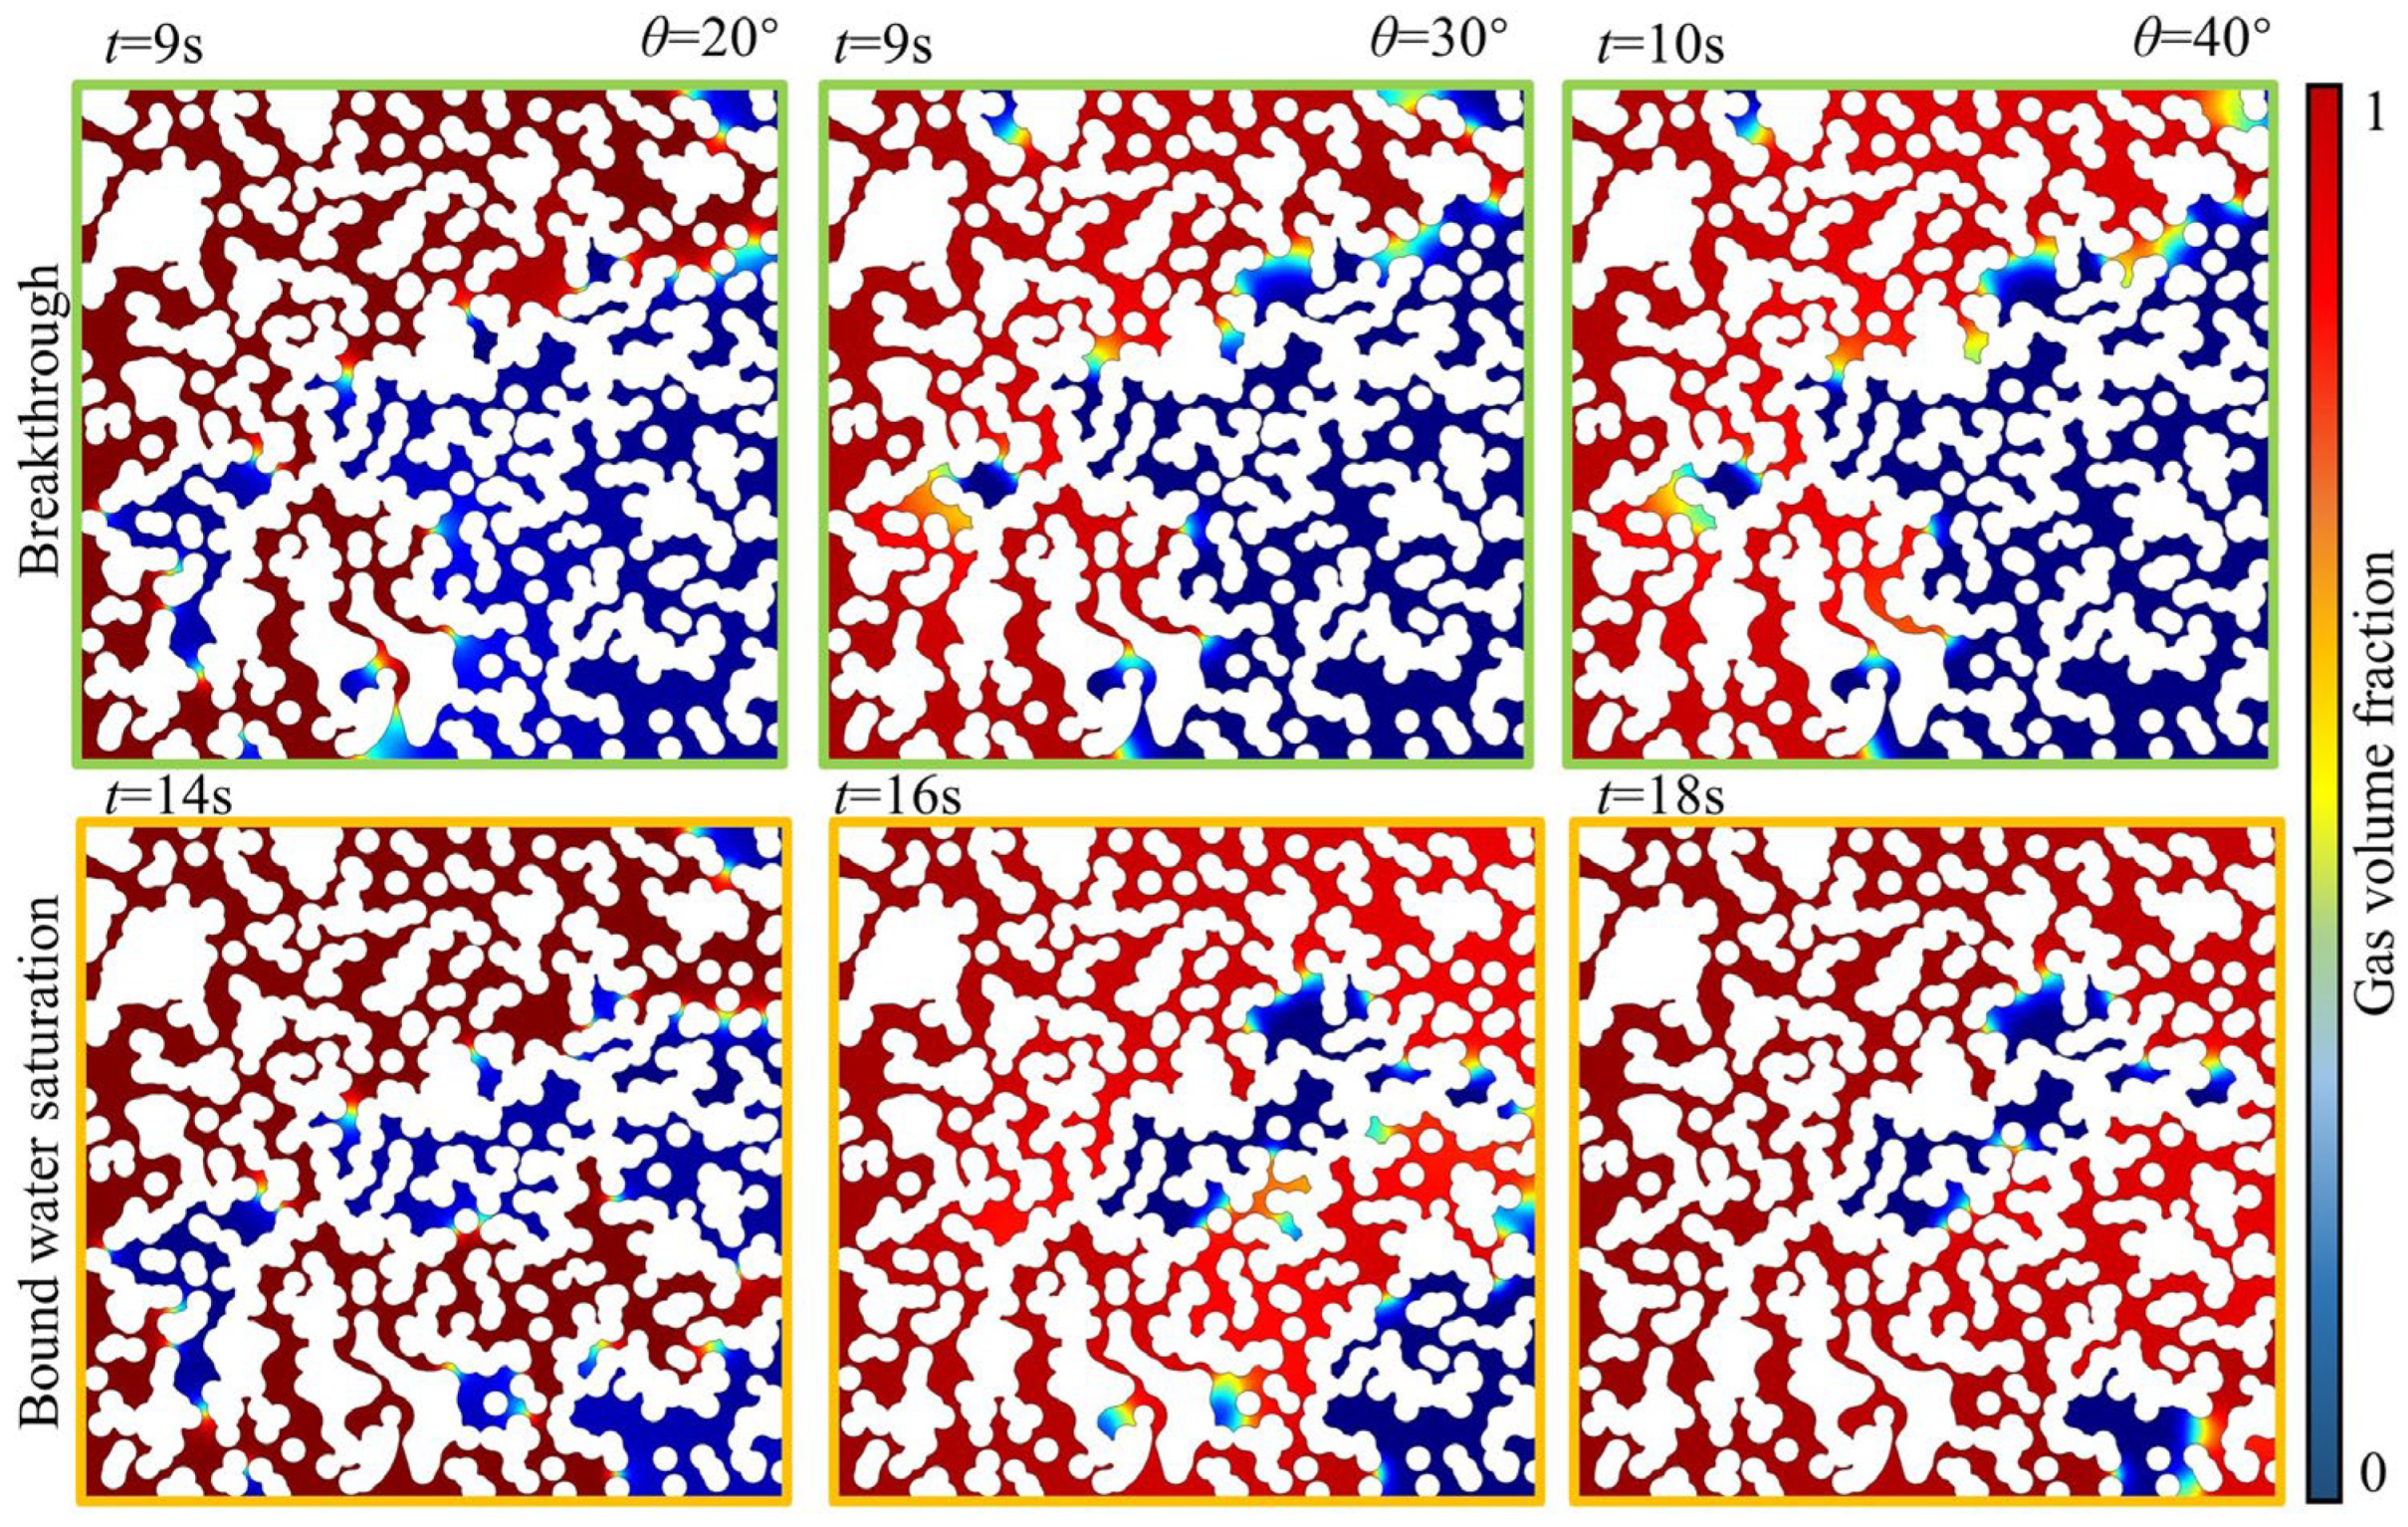
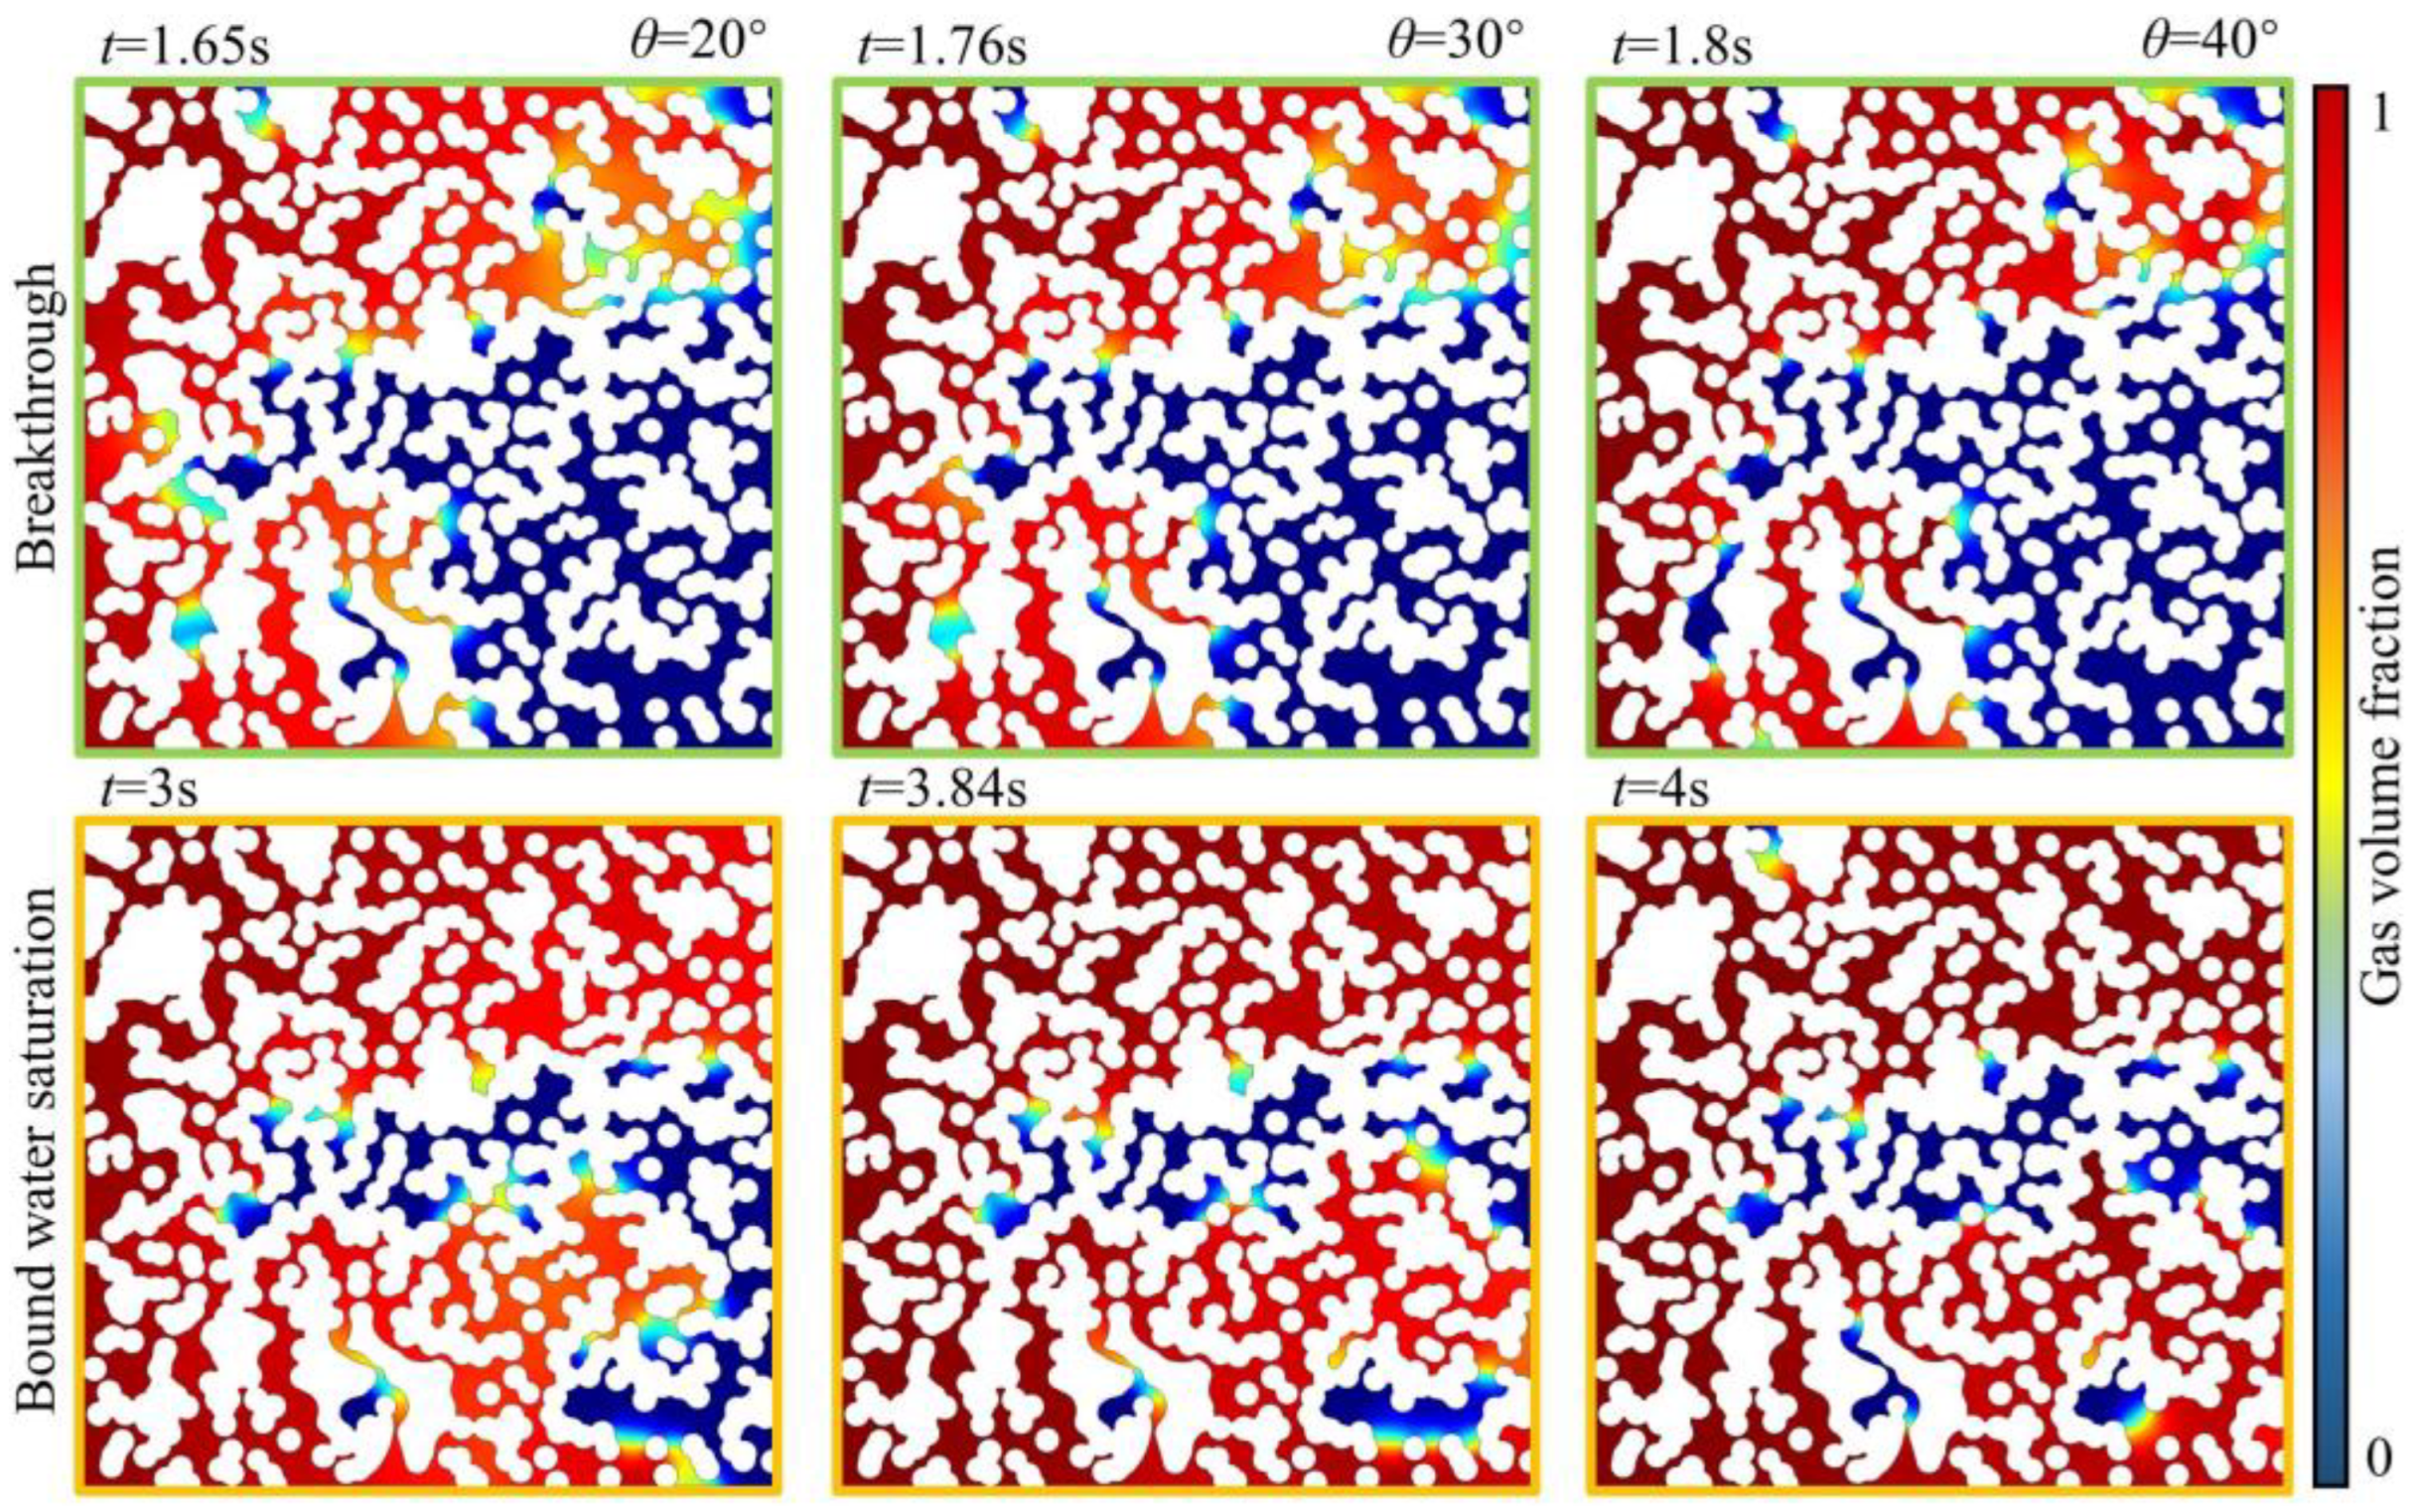
The simulation results of the interface drive at inlet velocities of 3.5 mm/s and 17.5 mm/s, respectively, are shown in Figure 10. The results for inlet velocities of 5 mm/s and 17.5 mm/s, respectively, are shown in Figure 11. The water saturation at the moment of tail-end breakthrough of methane-driven water, when the inlet interface moves at a speed of 3.5 mm/s and the contact angle of the pore medium wall surface is 40°, 30°, and 20°, is 51.5%, 54.8%, and 55.8%, respectively. This indicates that as the pore medium’s hydrophilicity increases, the time for methane tail-end breakthrough to occur decreases, making it easier to form a dominant channel. The gas–water drive process was continued until there was no more water phase at the tail end. At that point, the saturation of bound water was 25.1%, 30.7%, and 33.3%. From the initial tail-end breakthrough to the final stage, methane sequentially drove out 26.4%, 24.1%, and 22.5% of water from the pore medium. When the inlet interface replacement rate was increased by five times, the water saturation of methane replacement water at the moment of tail-end breakthrough was 40.4%, 49%, and 55.8% at the pore medium wall contact angles of 40°, 30°, and 20°. This indicates that with the increase in hydrophilicity in the pore medium, the time for methane breakthrough was reduced, making it easier to form the dominant channel. At this point, only about half of the channel served as a flow pathway for methane. The gas-driven water process was continued until no more water phase appeared at the tail-end. At that point, the bound water saturation levels were measured at 13.4%, 25.5%, and 34.3%. From the moment of breakthrough at the tail end to the final moment, 27%, 23.5%, and 21.5% of water was successively displaced from the pore medium by methane. From the distribution of the phase diagram, it can be observed that methane breakthrough primarily occurs in the upper region, with water being the main liquid discharged in the lower region. The water content in the middle region remains relatively stable, and the discharge of the water phase becomes more challenging with increased hydrophilicity. Additionally, a second breakthrough point does not form under conditions with a contact angle of 20°.
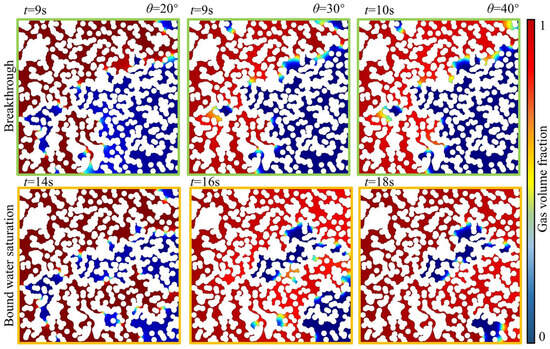
Figure 10.
Phase diagram distribution of the breakthrough and the final moment when the inlet displacement velocity is 3.5 mm/s.
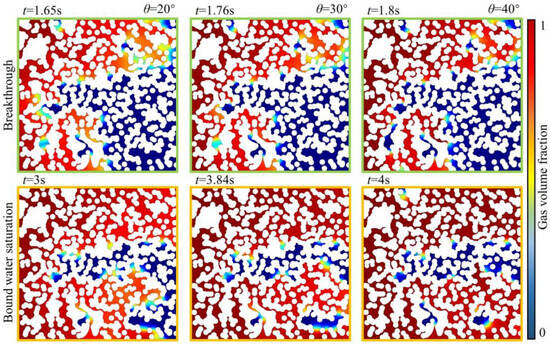
Figure 11.
Phase diagram distribution of the breakthrough and the final moment when the inlet displacement velocity is 17.5 mm/s.
4.3. Correlation Analysis of Contact Angle
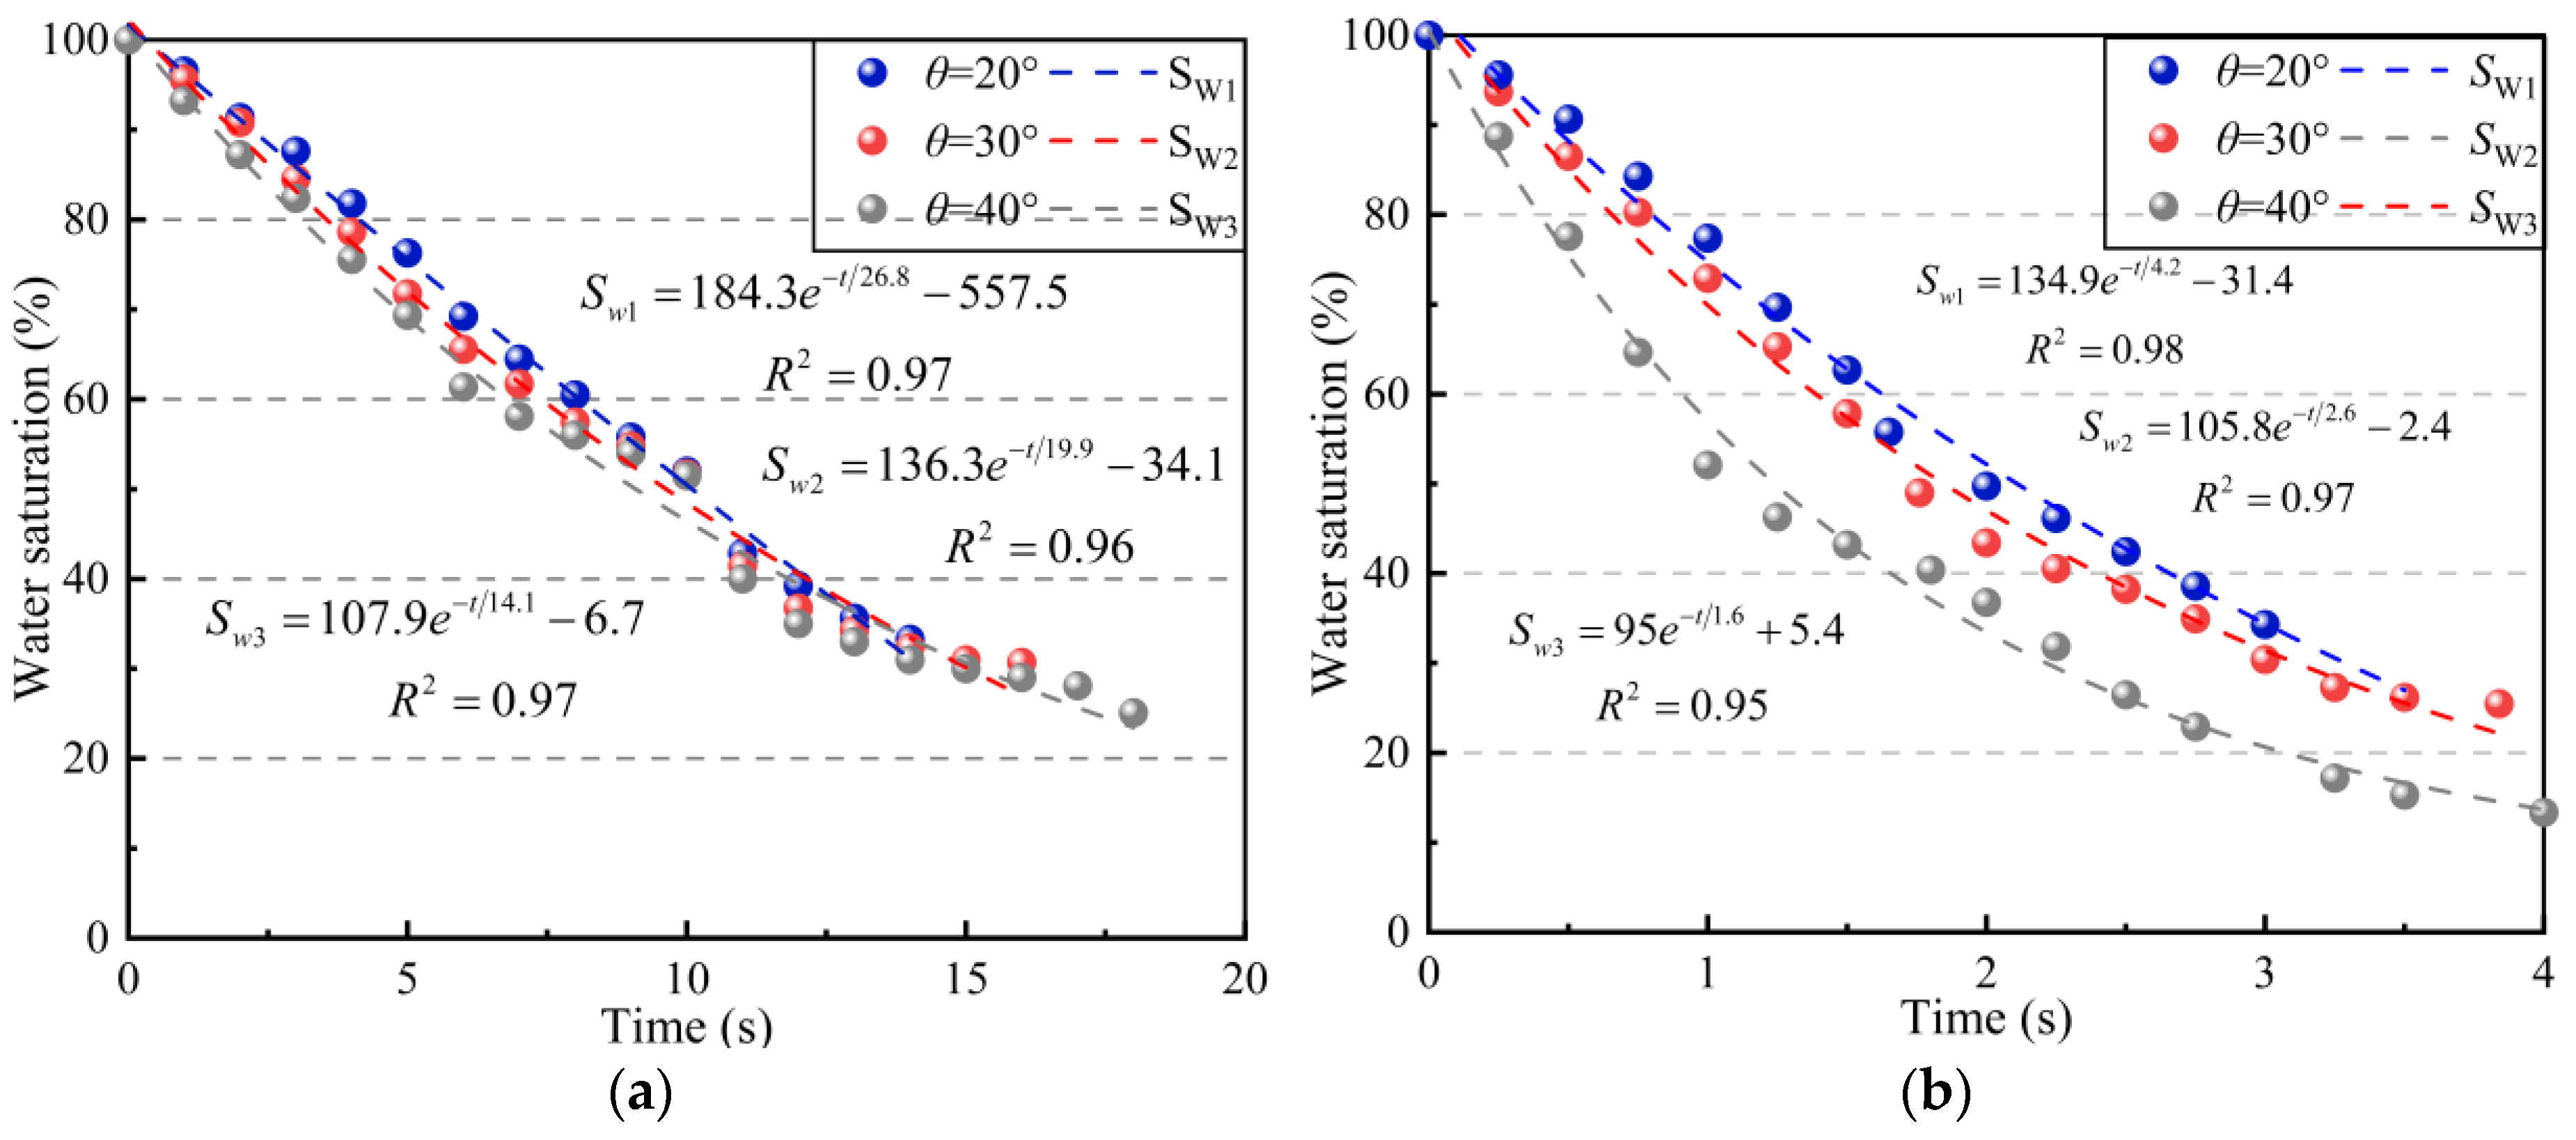
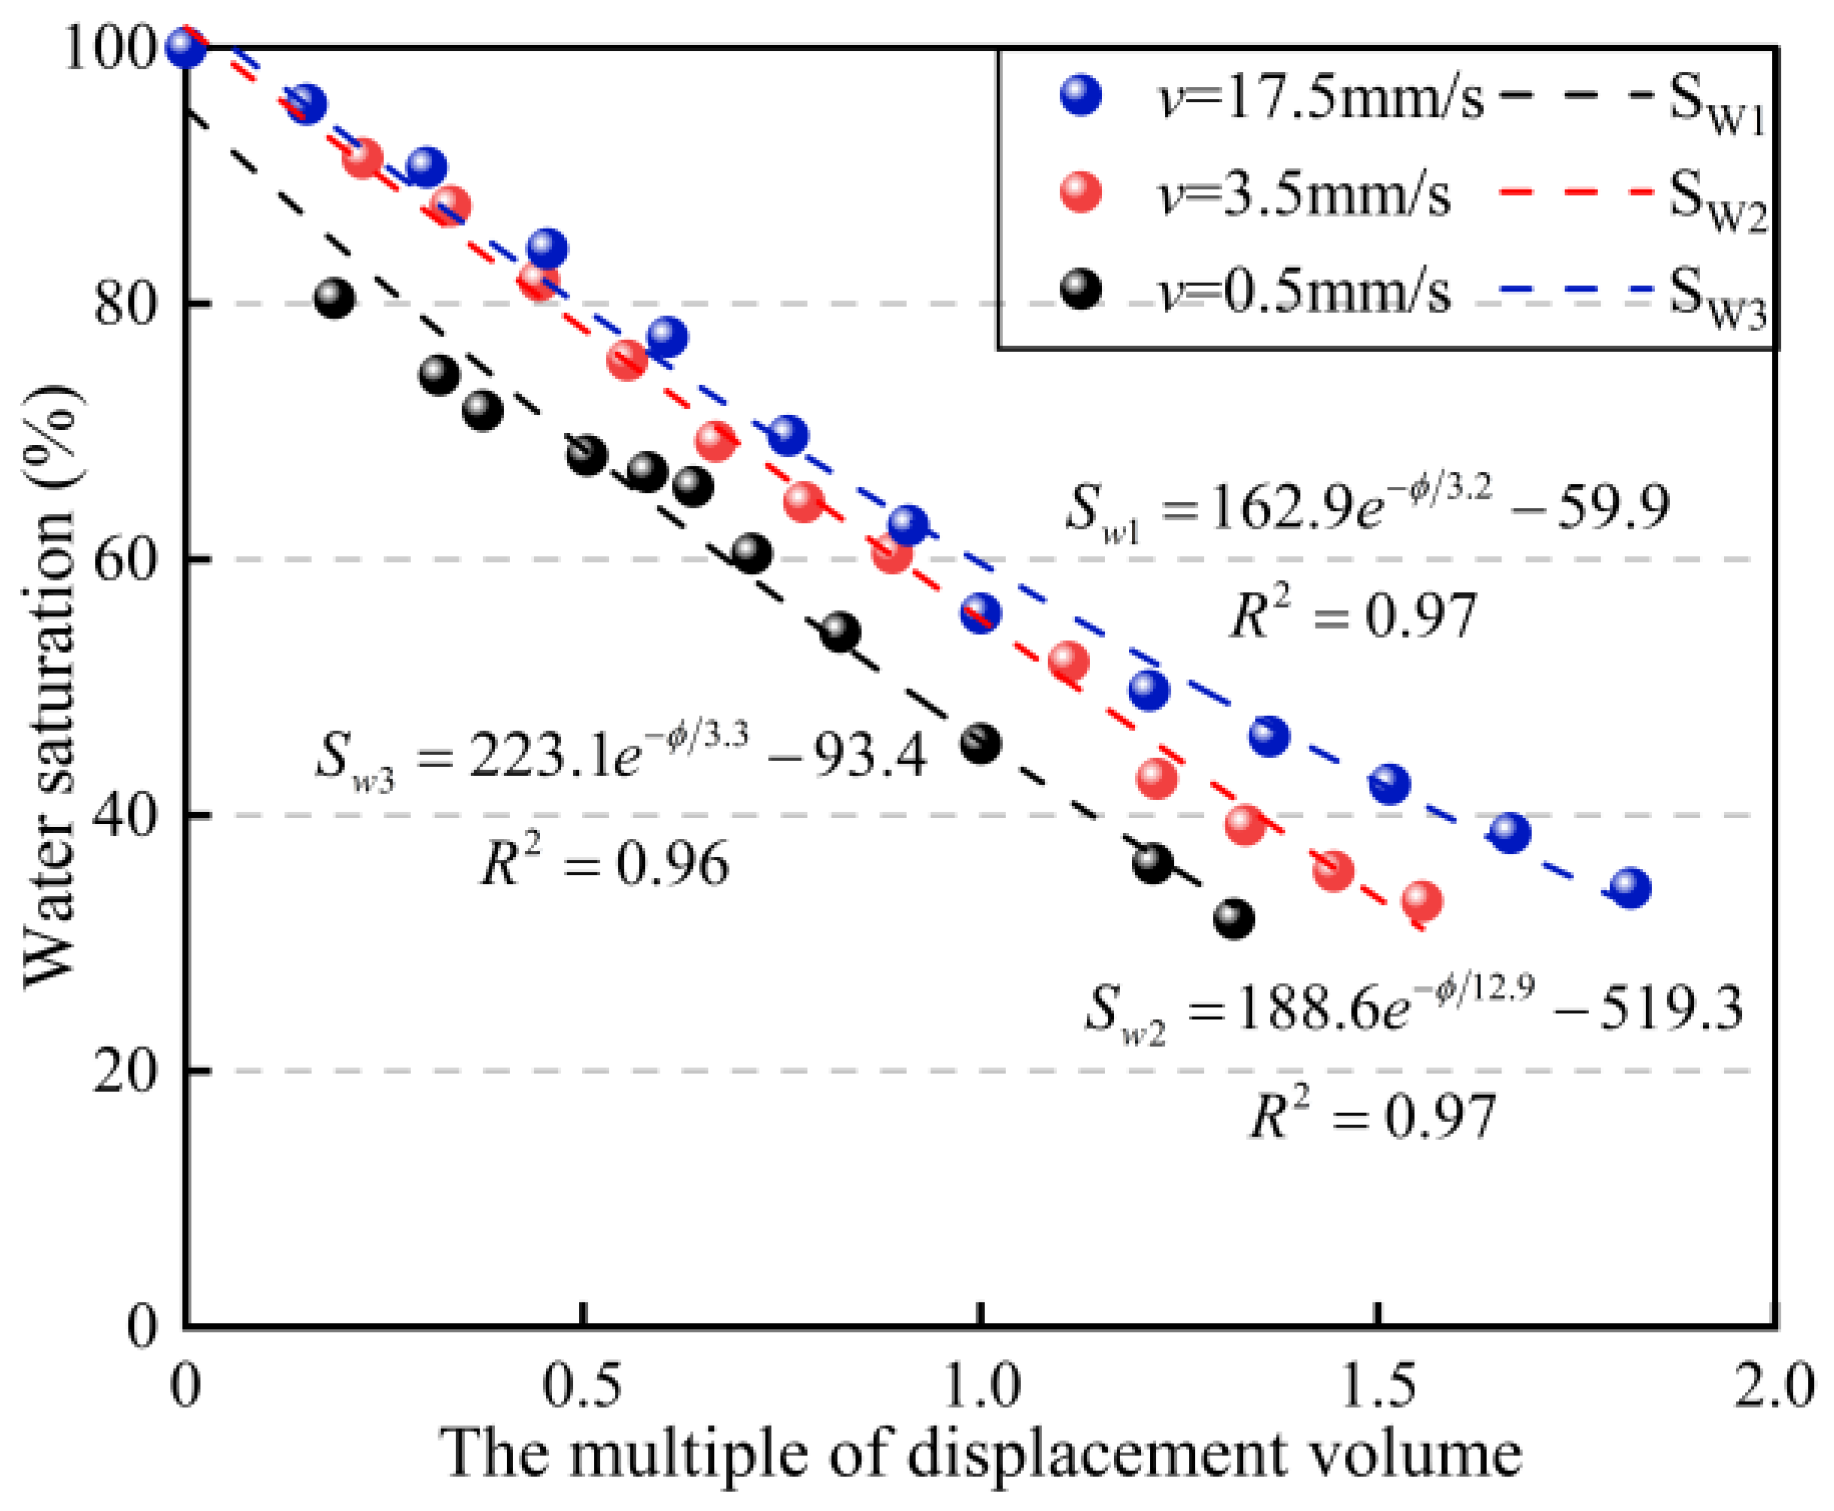
The variation in water saturation within the pore medium of the hydrate sediment layer as a function of time under the two flow rate conditions was established separately and fitted with a negative exponential function, as shown in Equation (13) [38]; fitting results are shown in Figure 12.
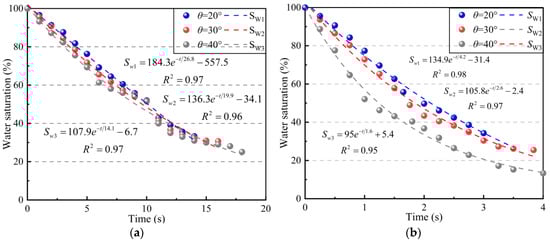
Figure 12.
Relationship between water saturation changes and methane release in porous media with varying wettability under two different flow rates. (a) The entrance interface moves at a speed of 3.5 mm/s. (b) The entrance interface moves at a speed of 17.5 mm/s.
Both displacement rates are sensitive to the contact angle of porous media. The changes in water saturation under the three wettability conditions are similar when the replacement rate is small, and the changes in water saturation under gas-driven water conditions in pore media with strong hydrophilicity exhibit more linear behavior. The curvature of the data curves changes significantly at large repulsive velocities, especially in weakly hydrophilic media. Porous media that are weakly hydrophilic are more sensitive to changes in water saturation initially, becoming more sensitive to time, changing more drastically over time, and becoming less sensitive to changes in time after the breakthrough at the tail end.
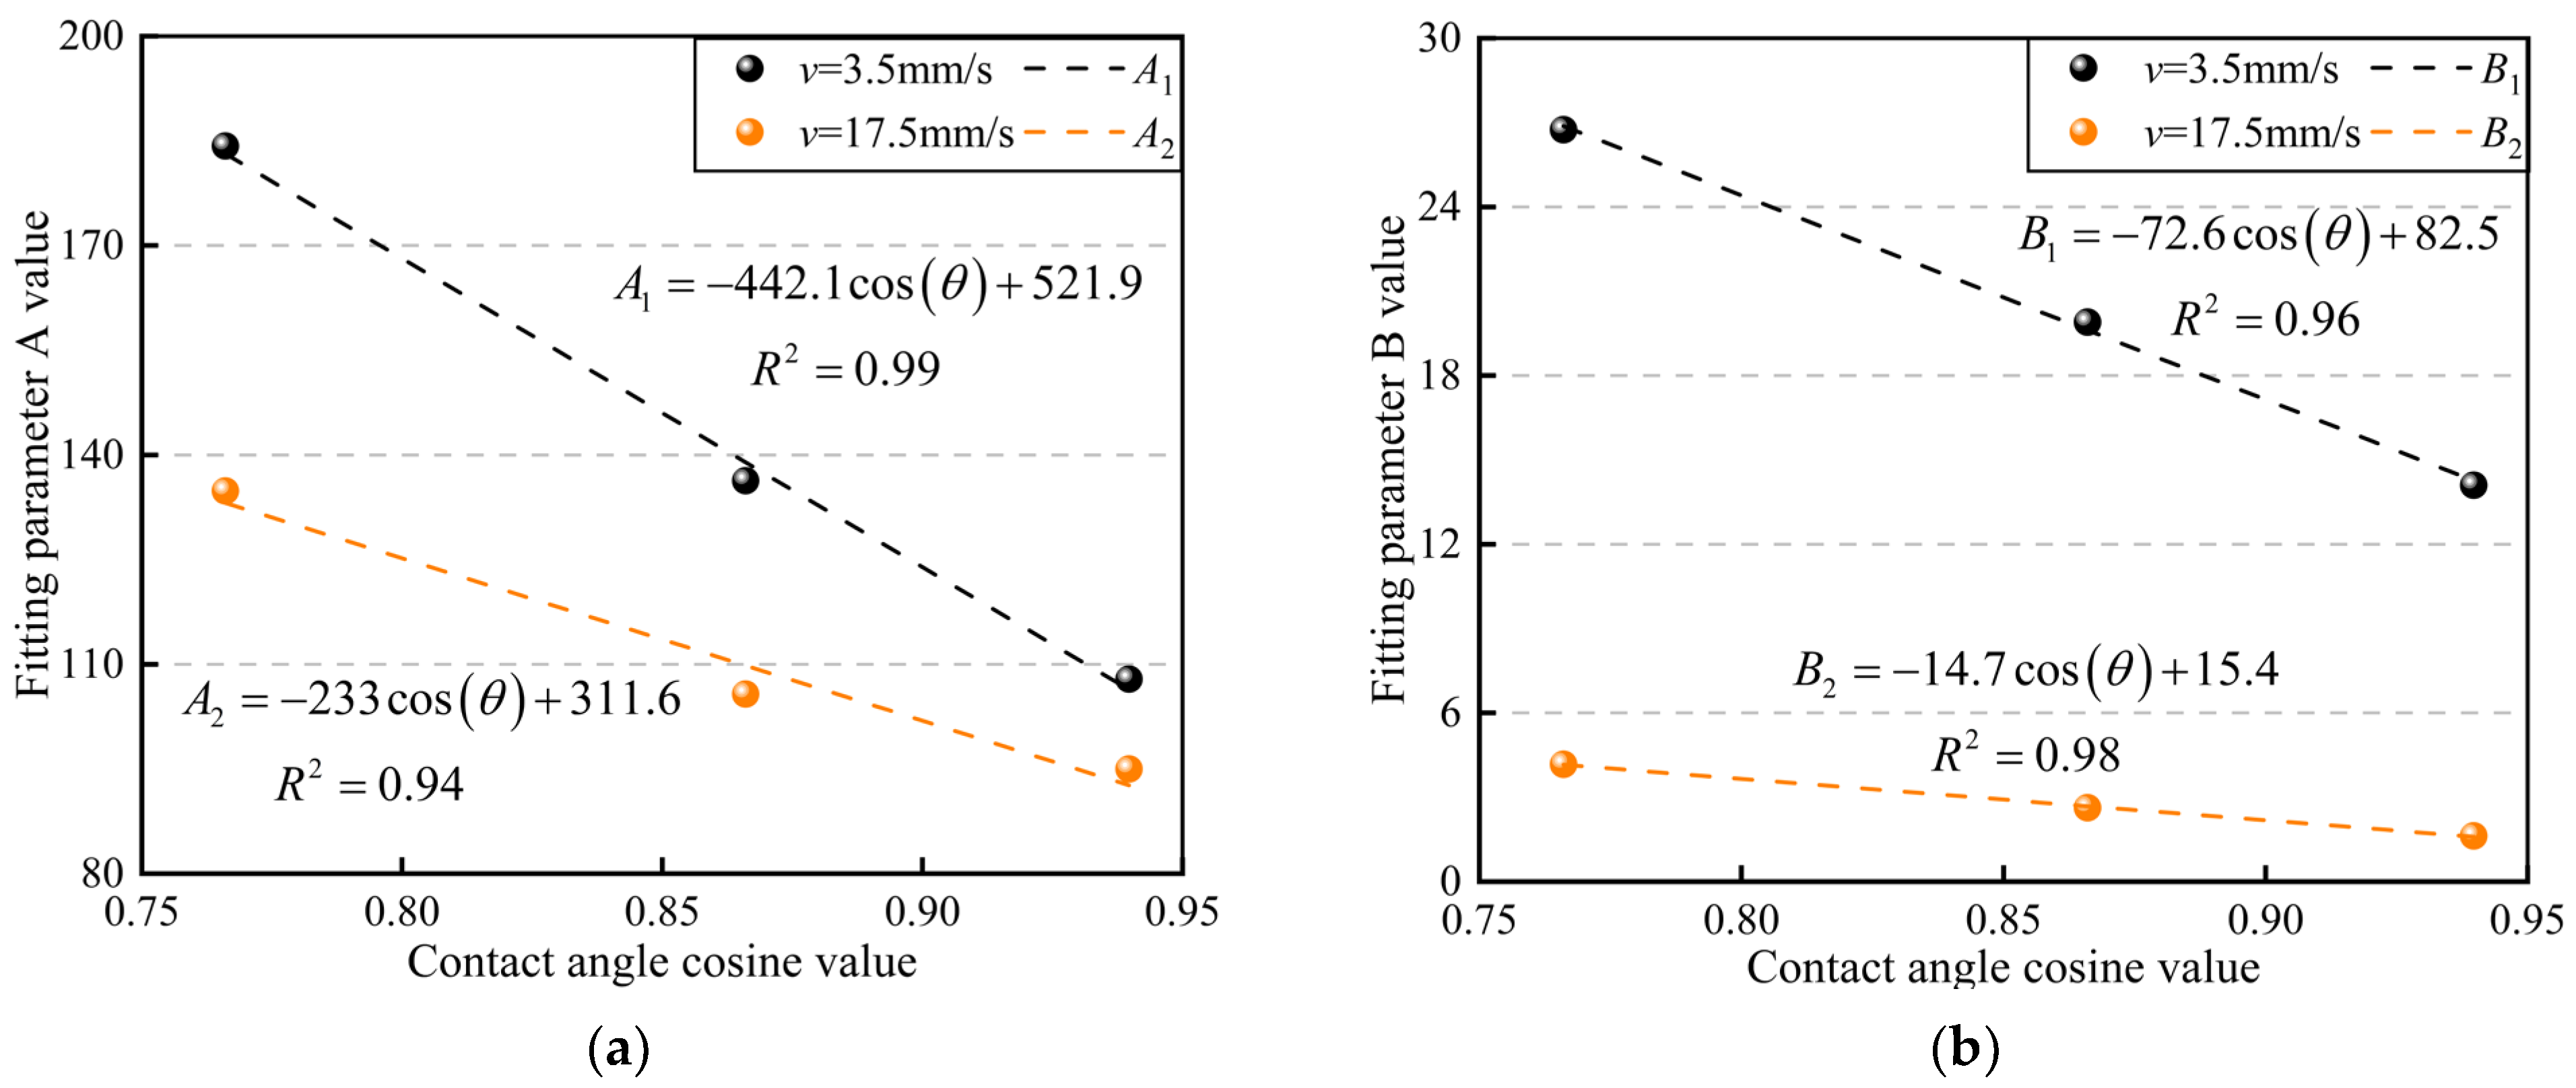
To further characterize the correlation between the values of the fitted function parameters in different wetted pore media, we compared the relationship between the values of the fitted parameters A and B with the cosine of the contact angle, respectively, as illustrated in Figure 13. The values of the fitted parameter A exhibit a consistent trend under both replacement velocity conditions, decreasing with the weakening of hydrophilicity. They also demonstrate a linear correlation with the cosine value of the contact angle. However, the slope of the fitted parameter A decreases by a factor of 0.53 when the replacement velocity is increased by a factor of 5. Moreover, the value of the fitted parameter A is more responsive to changes in the contact angle under conditions of low flow velocity. The trend of the fitted parameter B value remains consistent under both driving speed conditions, decreasing with reduced hydrophilicity. It demonstrates a linear correlation with the cosine value of the contact angle. However, the slope of the fitted parameter B value decreases by 0.2 times when the driving speed is increased by a factor of 5. Additionally, the fitted parameter B value shows insensitivity to changes in the contact angle under conditions of high flow rate. Therefore, under the working conditions described in this paper, the curvature of the water saturation versus the time curve is primarily determined by the value of the fitting parameter A.
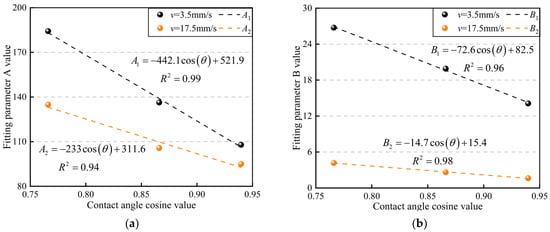
Figure 13.
Comparison of parameters for water saturation fitting curves. (a) Fitting the relationship between changes in parameter A; (b) fitting the relationship between changes in parameter B.
5. Discussion
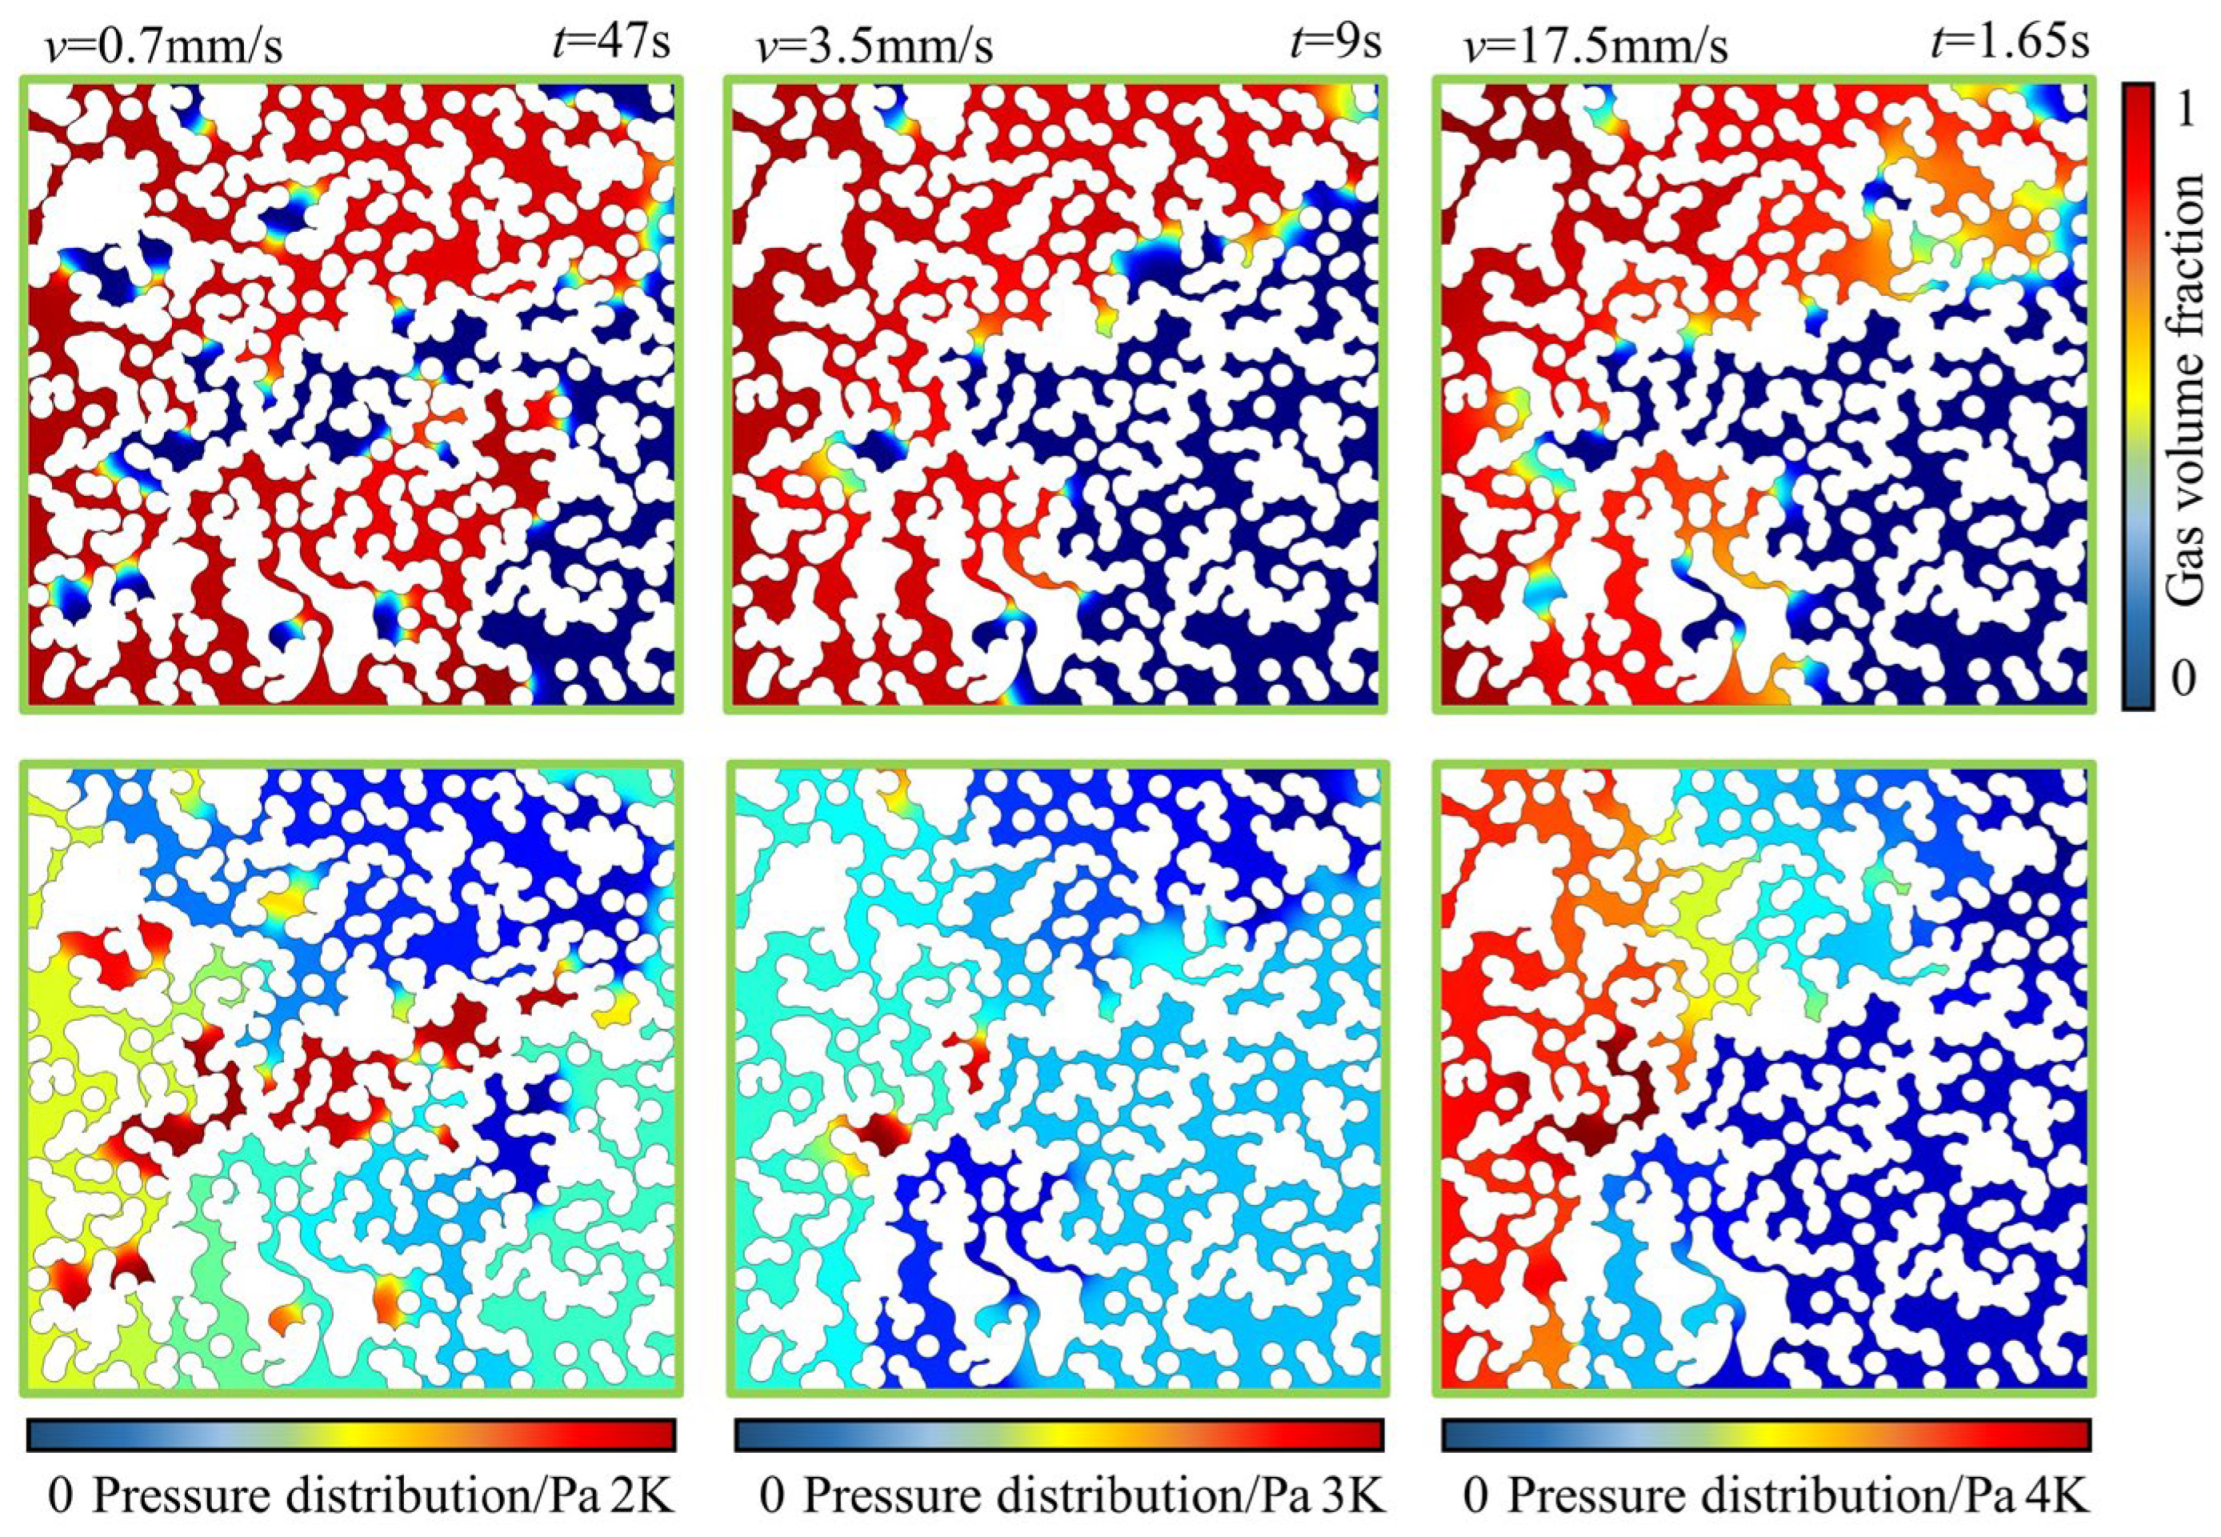
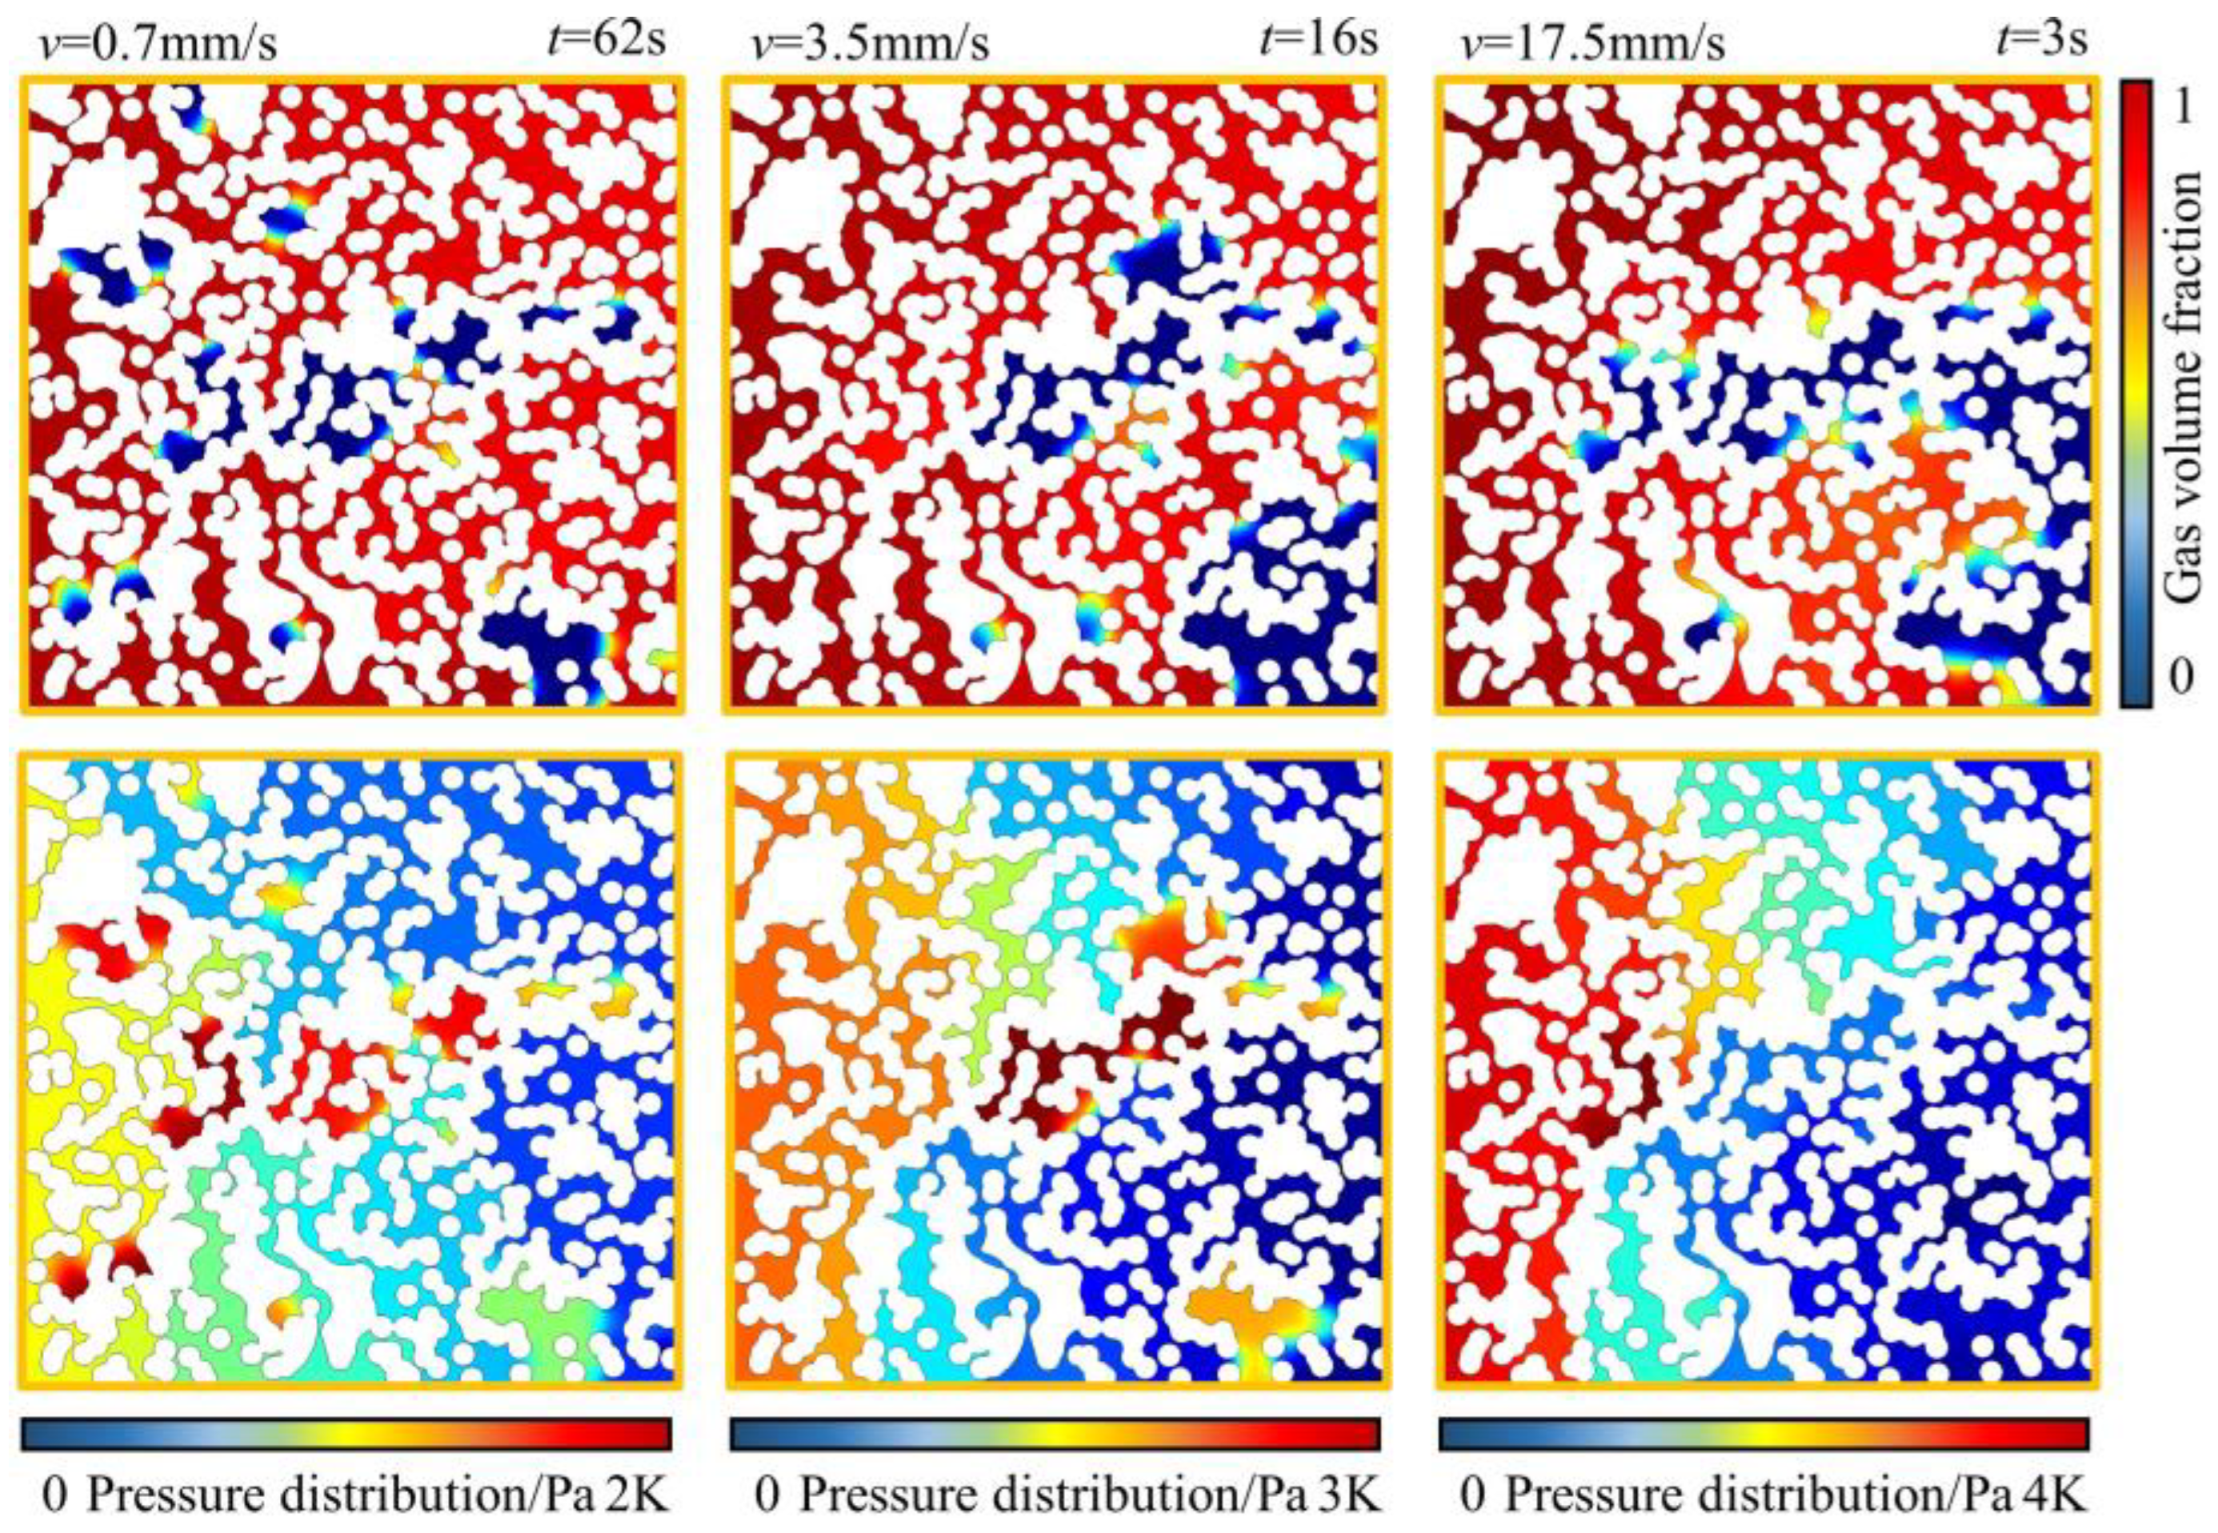
The gas-driven water working conditions were constructed for three flow rate conditions at a contact angle of 20° for the pore medium. The changes in water saturation and pressure clouds at the breakthrough and final moments are illustrated in Figure 14 and Figure 15. The water saturation at the moment of breakthrough was 45.6%, 55.7%, and 55.8% when the inlet interface moving velocity was 0.7 mm/s, 3.5 mm/s, and 17.5 mm/s, respectively. Under low flow rate conditions, the water saturation was low, and the gas phase occupied most of the space. Under high flow rate conditions, it was more likely to form an expulsive dominant channel, leading to premature breakthroughs. After the breakthrough to the moment of stabilization, the water saturation continued to decrease by 13.7%, 22.4%, and 21.5%, respectively. The larger the replacement velocity, the more water phases were replaced. This is because the larger the inlet replacement velocity, the larger the pressure difference. A larger pressure gradient allows the gas phase to enter more pore space, enabling more water phases to be replaced even after the tail-end breakthrough. In addition, the central region is always the primary area where bound water exists under the three flow conditions.
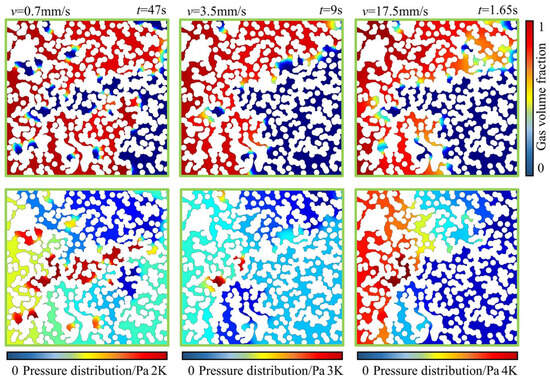
Figure 14.
Cloud diagram of the two-phase and pressure distribution at the time of breakthrough.
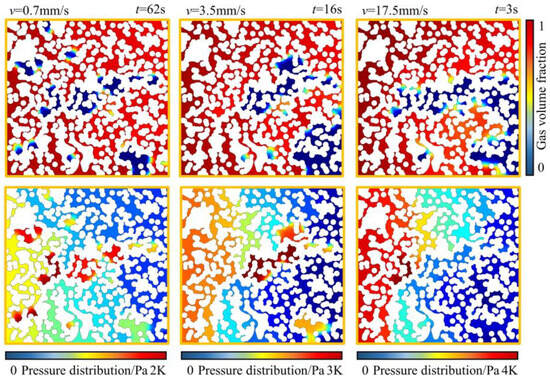
Figure 15.
Cloud diagram of the two-phase and pressure distribution at the time of end time.
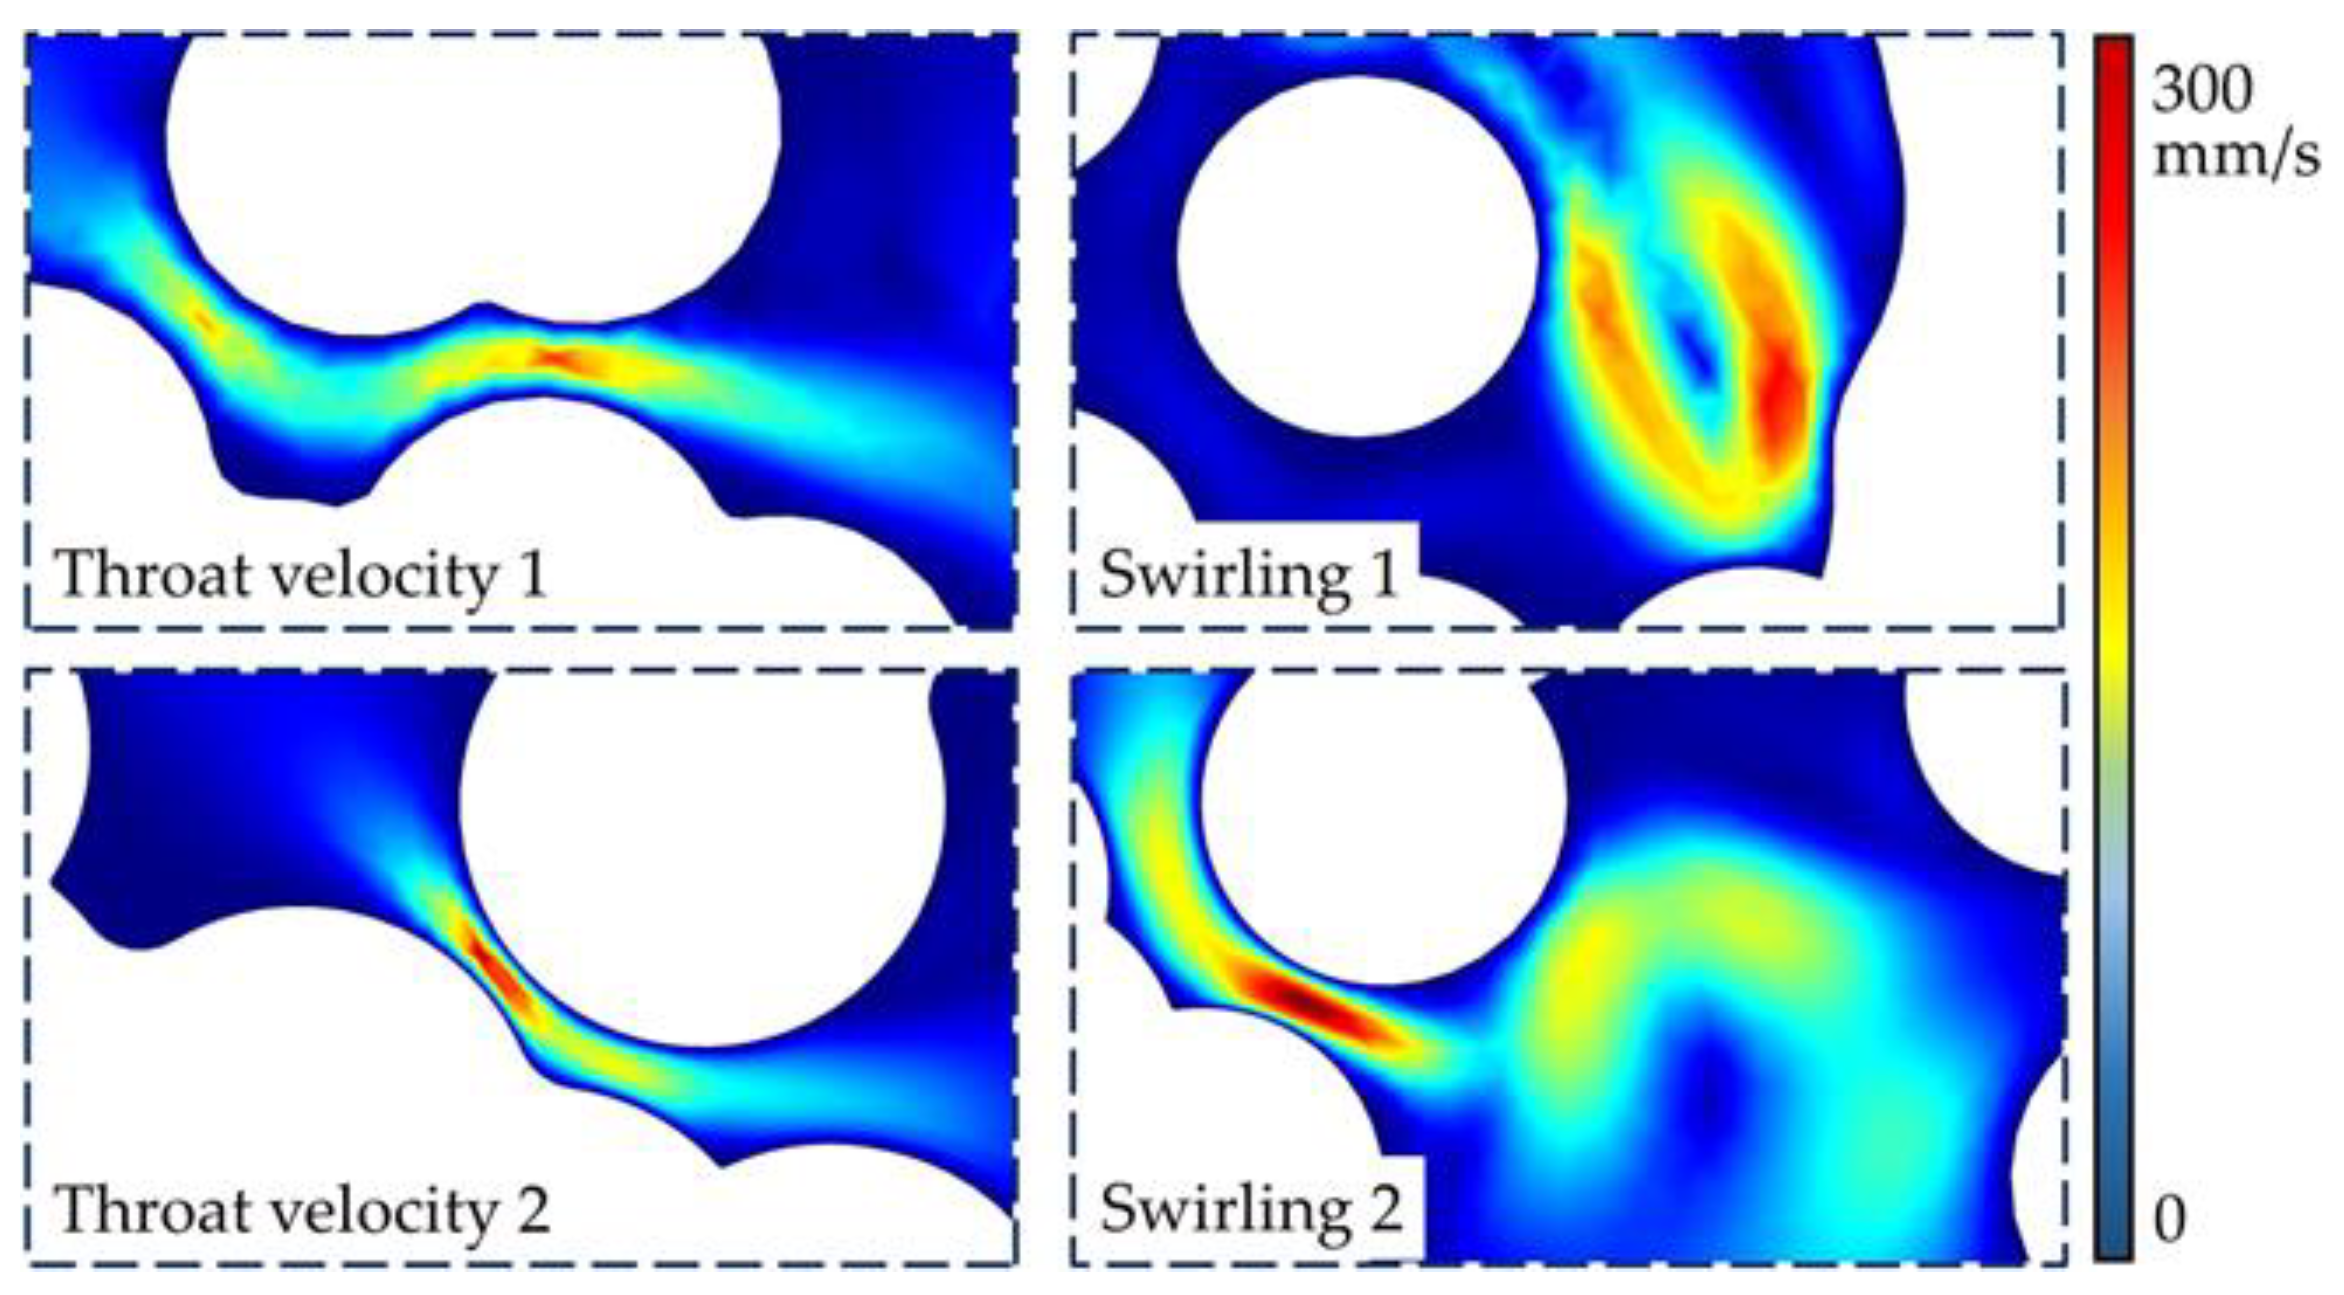
The flow time under the three flow conditions differs greatly. To facilitate comparison, we use the time of the breakthrough moment as a benchmark, and the ratio of different moments to this benchmark is used as a unit of comparison to analyze the characteristics of water content saturation changes under different displacement multiples, as illustrated in Figure 16. At the same displacement multiplicity, conditions with a higher inlet flow rate exhibit higher water saturation and fewer channels occupied by the gas phase. This implies that gas is more likely to flow from larger throats in hydrophilic environments under high flow rate conditions. Additionally, the gas phase further facilitates the capillary pressure into the smaller throats after the tail breakthrough. In addition, we calculated the instantaneous flow velocity in the narrow throat region and the orifice region. The instantaneous flow velocity cloud at v = 17.5 mm/s is shown in Figure 17. The figure illustrates that although the injection is performed at a steady flow rate at the inlet, the instantaneous flow velocity can vary by two orders of magnitude in the local region. The gas-driven water requires a larger driving force to overcome the capillary force when flowing through the throat region, resulting in the formation of a high flow velocity zone. In the area near the back of the throat, there is a sudden release of high flow velocities, leading to the formation of vortex flow.
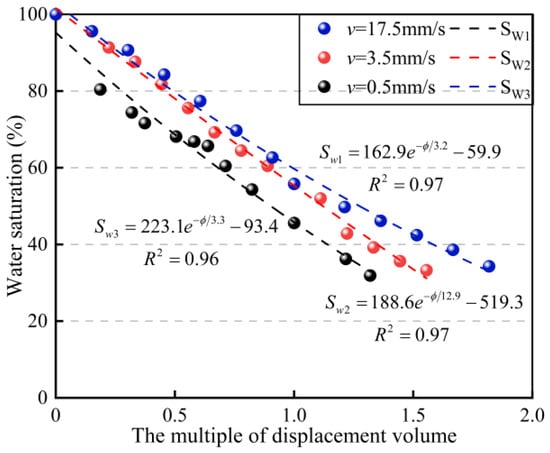
Figure 16.
The influence of displacement speed on water saturation.
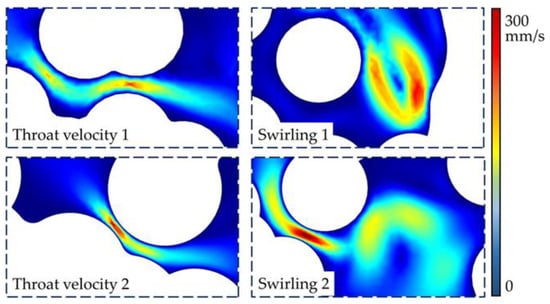
Figure 17.
Transient flow characteristics in local areas.
6. Conclusions
In this study, we constructed a nonhomogeneous pore medium model by developing a random distribution algorithm to simulate the process of methane displacing saturated water in hydrate deposits. We explored the effective flow channels of methane and the characteristics of bound water under different conditions. The main conclusions obtained are as follows:
- (a)
- Throat width is the most important factor affecting two-phase flow in inhomogeneous media. The distribution of the throat width within the pore medium gap significantly affects the flow channel. Even a small difference of 5% in the smallest throat distribution can result in a 40% difference in the effective flow space for methane. This can lead to almost half of the channel becoming a dead volume;
- (b)
- Differences in the degree of hydrophilicity of the pore medium affect the gas’s ability to enter the small throat region. The stronger the hydrophilicity, the shorter the breakthrough time and the time to final dominant channel formation, and the smaller the region where effective flow channels formed. The change in water saturation over time exhibits a negative exponential correlation. The less hydrophilic the material, the more sensitive it is to changes over time;
- (c)
- Higher replacement velocities result in more pronounced fingering. The higher rate of expulsion results in a larger pressure gradient, allowing methane to easily displace water in the larger throat area, thus forming a dominant channel. The larger pressure difference allows the gas phase to enter the smaller throat area, enabling the tail breakthrough to continue replacing more water at the end, ultimately creating a larger effective flow space.
Author Contributions
Methodology, W.L.; validation, D.G.; software, J.Z. and J.L.; investigation, C.L.; writing—original draft preparation, Y.C. and H.C.; funding acquisition, B.W. and D.G. All authors have read and agreed to the published version of the manuscript.
Funding
This study was funded by the Shandong Provincial Natural Science Foundation of China (No. ZR2023QD026), the China Postdoctoral Science Foundation (No. 2024M751860), and the Xinjiang Institute of Engineering Research Program of China (No. 2024xgy012605).
Institutional Review Board Statement
Not applicable.
Informed Consent Statement
Not applicable.
Data Availability Statement
Data are contained within the article.
Acknowledgments
We gratefully acknowledge the China National Offshore Oil Company for providing the basic data used in this paper.
Conflicts of Interest
The authors declare no conflicts of interest.
References
- Liu, J.S.; Chen, Z.W.; Elsworth, D.; Qu, H.Y.; Chen, D. Interactions of multiple processes during CBM extraction: A critical review. Int. J. Coal Geol. 2011, 87, 175–189. [Google Scholar] [CrossRef]
- BP. BP Statistical Review of World Energy 2023; BP: London, UK, 2023. [Google Scholar]
- Zhang, Y.Q.; Wang, W.; Zhang, P.P.; Li, G.S.; Tian, S.C.; Lu, J.S.; Zhang, B. A Solution to Sand Production from natural gas hydrate deposits with radial wells: Combined gravel packing and sand screen. J. Mar. Sci. Eng. 2022, 10, 71. [Google Scholar] [CrossRef]
- Yan, P.; Luan, H.J.; Jiang, Y.J.; Yu, H.Y.; Liang, W.; Cheng, X.Z.; Liu, M.K.; Chen, H.B. Experimental investigation into effects of thermodynamic hydrate inhibitors on natural gas hydrate synthesis in one-dimensional reactor. Energy Technol. 2023, 11, 2300262. [Google Scholar] [CrossRef]
- Li, Z.F.; Han, J. Environmental safety and low velocity of the development of submarine natural gas hydrate with examples of test production in South China Sea. Environ. Sci. Pollut. Res. 2021, 28, 6259–6265. [Google Scholar] [CrossRef] [PubMed]
- Qiu, N.; Fu, Q.C.; Yang, L.; Sun, Z.; Chang, Y.J.; Du, B.R. Saturation sensitivity and influencing factors of marine DC resistivity inversion to submarine gas hydrate. Front. Earth Sci. 2022, 10, 900025. [Google Scholar]
- He, Y.L.; Kuang, Z.G.; Cheng, C.; Jiang, T.; Zhang, C.; Lu, B.Y.; Yang, C.Z.; Liu, J.Y.; Xiang, C.L. Effects of depositional processes in submarine canyons and distribution of gas chimneys on gas hydrate accumulation in the Shenhu Sea area, Northern South China Sea. Energies 2023, 16, 234. [Google Scholar] [CrossRef]
- Fakhreeva, A.V.; Nosov, V.V.; Voloshin, A.I.; Dokichev, V.A. Polysaccharides are effective inhibitors of natural gas hydrate formation. Polymers 2023, 15, 1789. [Google Scholar] [CrossRef] [PubMed]
- Ye, R.J.; Jiang, Y.J.; Zhang, R.Q.; Gong, B.; Zhang, B.W. Numerical simulation study on mechanical properties of interlayer heterogeneous natural gas hydrate sediments. J. Shandong Univ. Sci. Technol. 2024, 43, 22–29. [Google Scholar]
- Wang, Y.; Wang, Y.Y.; Gao, M.; Zhang, L. Study on slope stability of deep-sea energy soil gas reservoirs. J. Shandong Univ. Sci. Technol. 2024, 43, 32–40. [Google Scholar]
- Yang, L.; Zhao, J.F.; Liu, W.G.; Li, Y.H.; Yang, M.J.; Song, Y.C. Microstructure observations of natural gas hydrate occurrence in porous media using microfocus x-ray computed tomography. Energy Fuels 2015, 29, 4835–4841. [Google Scholar] [CrossRef]
- Ji, Y.K.; Kneafsey, T.J.; Hou, J.; Zhao, J.L.; Liu, C.L.; Guo, T.K.; Wei, B.; Zhao, E.M.; Bai, Y.J. Relative permeability of gas and water flow in hydrate-bearing porous media: A micro-scale study by lattice Boltzmann simulation. Fuel 2022, 321, 124013. [Google Scholar] [CrossRef]
- Sun, X.; Wang, L.; Luo, H.; Song, Y.C.; Li, Y.H. Numerical modeling for the mechanical behavior of marine gas hydrate-bearing sediments during hydrate production by depressurization. J. Petrol. Sci. Eng. 2019, 177, 971–982. [Google Scholar] [CrossRef]
- Wu, S.L.; Wu, S.G.; Sun, J.; Li, Q.P.; Chen, J.J.; Chen, Y.; Zhou, X.Q.; Khan, U. The spatial coupling of fluid pathways with gas hydrates and shallow gas reservoirs a case study in the Qiongdongnan Basin, South China Sea. J. Mar. Sci. Eng. 2024, 12, 659. [Google Scholar] [CrossRef]
- Bu, Q.T.; Xing, T.J.; Li, C.F.; Zhao, J.H.; Liu, C.L.; Wang, Z.H.; Zhao, W.G.; Kang, J.L.; Meng, Q.G.; Hu, G.W. Effect of hydrate microscopic distribution on acoustic characteristics during hydrate dissociation: An insight from combined acoustic-CT detection study. J. Mar. Sci. Eng. 2022, 10, 1089. [Google Scholar] [CrossRef]
- Jiang, Y.J.; Yan, p.; Luan, H.J.; Chen, L.J.; Ding, G.R. Development of multi-dimensional production simulation test system for natural gas hydrate and its primary application. Rock Soil Mech. 2022, 43, 286–298. [Google Scholar]
- Liu, J.R.; Li, H.Y.; Xu, J.C.; Liu, S.Y.; Liu, R.J.; Hou, L.J.; Tan, Q.Z. Exploring the unique characteristics of high-pore-volume waterflooding and enhanced oil recovery mechanisms in offshore sandstone reservoirs using nuclear magnetic resonance technology. J. Mar. Sci. Eng. 2023, 11, 1296. [Google Scholar] [CrossRef]
- Zhang, J.D.; Yin, Z.Y.; Li, Q.P.; Li, S.X.; Jiao, H.M.; Liu, X.H. An investigation on CH4 hydrate transition and gas bubble evolution on a microfluidic chip. Chin. J. Theor. Appl. Mech 2024, 7, 1–9. [Google Scholar]
- Zhao, X.X.; Yin, F.L.; Yao, H.Y.; Qi, Y.Q.; Cao, X. A new model of bubble migration velocity in deep water wellbore considering hydrate phase transition. J. Mar. Sci. Eng. 2023, 11, 2206. [Google Scholar] [CrossRef]
- Ju, Y.; Gong, W.B.; Chang, W.; Sun, M. Effects of pore characteristics on water-oil two-phase displacement in non-homogeneous pore structures: A pore-scale lattice Boltzmann model considering various fluid density ratios. Int. J. Eng. Sci. 2020, 154, 103343. [Google Scholar] [CrossRef]
- Singh, K.; Jung, M.; Brinkmann, M.; Seemann, R. Capillary-Dominated fluid displacement in porous media. Annu. Rev. Fluid Mech. 2019, 51, 429–449. [Google Scholar] [CrossRef]
- Wang, Y.J.; Kang, Y.L.; You, L.J.; Chen, M.J.; Cheng, Y.Y.; Tu, Y.Q.; Tian, J. Effect of pore-throat heterogeneity on gas-water flow in tight gas reservoirs: From micro- to centimeter scale. Energy Fuels 2024, 38, 5075–5087. [Google Scholar] [CrossRef]
- Lu, W.Y.; Huang, B.X. Numerical simulation of migration characteristics of the two-phase interface in water–gas displacement. Energ. Explor. Exploit. 2018, 36, 246–264. [Google Scholar] [CrossRef]
- Lv, K.; Jiang, N.; Yin, D.W.; Meng, S.Y.; Gao, Z.Y.; Lv, T. Deterioration of compressive properties of coal rocks under water and gas coupling. J. Cent. South Univ. 2024, 31, 475–493. [Google Scholar]
- Merdan, M.; Atasoy, N. On the solutions of fractional random ordinary differential equations with the Residual power series method. Alex. Eng. J. 2023, 70, 169–177. [Google Scholar] [CrossRef]
- Wang, X.F.; Qiu, Y.; Liang, W.; Zhao, T.B. Simulation study on gas production law of natural gas hydrate under damage effect. J. Shandong Univ. Sci. Technol. 2023, 42, 70–77. [Google Scholar]
- Guo, Y.; Zhang, L.; Zhu, G.; Yao, J.; Sun, H.; Song, W.H.; Yang, Y.F.; Zhao, J.L. A pore-scale investigation of residual oil distributions and enhanced oil recovery methods. Energies 2019, 12, 3732. [Google Scholar] [CrossRef]
- Jafari, A.; Vahab, M.; Broumand, P.; Khalili, N. An extended finite element method implementation in COMSOL multiphysics: Thermo-hydro-mechanical modeling of fluid flow in discontinuous porous media. Comput. Geotech. 2023, 105, 105458. [Google Scholar] [CrossRef]
- Hysing, S. Mixed element FEM level set method for numerical simulation of immiscible fluids. J. Comput. Phys. 2012, 231, 2449–2465. [Google Scholar] [CrossRef]
- Amiri, H.A.A.; Hamouda, A.A. Evaluation of level set and phase field methods in modeling two phase flow with viscosity contrast through dual-permeability porous medium. Int. J. Multiphas. Flow 2013, 52, 22–34. [Google Scholar] [CrossRef]
- Amiri, H.A.A.; Hamouda, A.A. Pore-scale modeling of non-isothermal two phase flow in 2D porous media: Influences of viscosity, capillarity, wettability and heterogeneity. Int. J. Multiphas. Flow 2014, 61, 14–27. [Google Scholar] [CrossRef]
- Le, T.L.; Chen, J.C.; Hwu, F.S.; Nguyen, H.B. Numerical study of the migration of a silicone plug inside a capillary tube subjected to an unsteady wall temperature gradient. Int. J. Heat Mass Tran. 2016, 97, 439–449. [Google Scholar] [CrossRef]
- Ul Hassan, R.; Khalil, S.M.; Khan, S.A.; Moon, J.; Cho, D.H.; Byun, D. Electric field and viscous fluid polarity effects on capillary-driven flow dynamics between parallel plates. Heliyon 2023, 9, e16395. [Google Scholar] [CrossRef]
- Tang, D.; Jian, H.X.; Song, M.; Jiang, Z.M. Migration of leaked oil vapor in underground water-sealed, l storage cavern considering the influence of fractures. J. Mar. Sci. Eng. 2023, 11, 1248. [Google Scholar] [CrossRef]
- Chen, S.J.; Zhang, J.C.; Zaki, M.M.; Li, F.X.; Yan, Z.K.; Ding, Y.S. Seepage characteristics of mixed-wettability porous media on the phase-field model. ACS Omega 2022, 7, 104–112. [Google Scholar] [CrossRef] [PubMed]
- Choi, C.W.; Yu, D.I.; Kim, M.H. Adiabatic two-phase flow in rectangular microchannels with different aspect ratios: Part I-Flow pattern, pressure drop and void fraction. Int. J. Heat Mass Tran. 2011, 54, 616–624. [Google Scholar] [CrossRef]
- Zhu, D.F.; Yu, B.B.; Wang, D.Y.; Zhang, Y.J. Fusion of finite element and machine learning methods to predict rock shear strength parameters. J. Geophys Eng. 2024, 2024, gxae064. [Google Scholar] [CrossRef]
- Chen, S.J.; Zhang, J.C.; Zaki, M.M.; Yin, D.W.; Wang, S.; Sheng, S.Q.; Khoreshok, A.A. Similarity experimental study on the law of CBM-water microscale slug flow. Chin. J. Rock Mech. Eng. 2022, 41, 1338–1346. [Google Scholar]
Disclaimer/Publisher’s Note: The statements, opinions and data contained in all publications are solely those of the individual author(s) and contributor(s) and not of MDPI and/or the editor(s). MDPI and/or the editor(s) disclaim responsibility for any injury to people or property resulting from any ideas, methods, instructions or products referred to in the content. |
© 2024 by the authors. Licensee MDPI, Basel, Switzerland. This article is an open access article distributed under the terms and conditions of the Creative Commons Attribution (CC BY) license (https://creativecommons.org/licenses/by/4.0/).