Article

Feeding Habits of Scomber japonicus Inferred by Stable Isotope and Fatty Acid Analyses

1
College of Marine Living Resource Sciences and Management, Shanghai Ocean University, Shanghai 201306, China
2
Key Laboratory of Sustainable Exploitation of Oceanic Fisheries Resources, Ministry of Education, Shanghai Ocean University, Shanghai 201306, China
3
National Engineering Research Center for Oceanic Fisheries, Shanghai Ocean University, Shanghai 201306, China
4
Key Laboratory of Ocean Fisheries Exploitation, Ministry of Agriculture and Rural Affairs, Shanghai 201306, China
*
Authors to whom correspondence should be addressed.
J. Mar. Sci. Eng. 2024, 12(8), 1335; https://doi.org/10.3390/jmse12081335
Submission received: 10 July 2024 / Revised: 29 July 2024 / Accepted: 5 August 2024 / Published: 6 August 2024
(This article belongs to the Section Marine Biology)

Abstract

:
Scomber japonicus is widely distributed off the coast of Japan and in the northwestern Pacific. It is an important target for fisheries. To reveal the differences in diet shifts and niche changes of S. japonicus, we collected samples in the high seas of the northwest Pacific (38°59′ N–43°00′ N, 150°30′ E–161°48′ E) from June to August 2021. We utilized stable isotope and fatty acid analyses to study the differences in body length and sex of S. japonicus. The results showed no significant differences in stable isotope values and fatty acid composition between male and female individuals (p > 0.05). Differences in δ13C and δ15N values among different body length groups were also not significant (p > 0.05). Both δ13C and δ15N values showed a trend of increasing and then decreasing across different body length groups. The niche width of S. japonicus in different body length groups first increased and then decreased, with niche overlap among the groups exceeding 60%. Principal component analysis (PCA) results showed that the main fatty acids in S. japonicus were C14:0, C16:0, C18:0, C16:1n-7, C18:1n-9, C18:3n-6, C20:5n-3, C20:4n-6 and 22:6n-3. Except for C18:0 and C20:4n-6, the content of the other fatty acids showed significant differences among different body length groups (p < 0.05). The results of the similarity analysis (ANOSIM) indicated that the fatty acid compositions of the 100–130 mm length group were significantly different from those of the 131–160 mm and 161–190 mm length groups (p < 0.05). However, there were no significant differences among the other size groups (p > 0.05). During the growth and development of S. japonicus, the proportion of krill in their diet gradually decreased. Meanwhile, their consumption of zooplankton, diatoms and fish significantly increased. Additionally, S. japonicus also consumed crustaceans, but their intakes of planktonic bacteria and green algae were relatively low. We suggested that there were no significant differences between male and female individuals of S. japonicus. As they grew and developed, the ecological niche and feeding habits of S. japonicus continuously changed.

1. Introduction

The northwest Pacific is a region rich in biodiversity and fishery resources, spanning a vast area from the eastern coast of Asia to the Hawaiian Islands [1]. This region is one of the world’s most important fishing grounds, encompassing numerous economically significant fish species, with the Scomber japonicus holding a prominent position [2]. The S. japonicus is a highly migratory pelagic fish widely distributed in temperate and subtropical waters, particularly along the coasts of China, Japan and Korea in the northwest Pacific [3]. This fish species not only holds significant economic value for local fisheries but also plays a crucial role in the ecosystem as a mid-level predator and a key link in the food chain.
Studying the nutritional ecology of fish is crucial for assessing their behavior, population dynamics, habitat utilization, energy transfer and interspecific interactions within marine food webs [4]. Traditionally, stomach content analysis has been the most commonly used method, which involves directly examining the food remnants in fish stomachs to determine their feeding habits and food web structure [5]. However, this method has some limitations, such as the rapid digestion of stomach contents and the complexity of sample processing. To overcome these limitations, several new methods have emerged in recent years, either used separately or in combination, to provide more comprehensive nutritional ecology information. Stable isotope analysis (SIA) is one important method. By measuring the ratios of carbon (δ13C) and nitrogen (δ15N) isotopes in fish tissues, researchers can infer the long-term food sources and trophic levels of fish [6]. Fatty acid analysis (FAA), on the other hand, examines the composition and proportions of fatty acids in fish tissues to study their food sources and feeding habits [7]. DNA barcoding analysis is an emerging technology that involves extracting and identifying DNA from stomach contents to accurately identify food species. This method can overcome the limitations of traditional stomach content analysis, providing high-resolution dietary information [8].
Stable isotope analysis (SIA) has become an essential tool for studying the nutritional structure of marine food webs. DeNiro et al. (1978) were the first to study and evaluate the distribution of carbon and nitrogen stable isotopes in organisms’ diets [9], discovering that δ13C and δ15N values reliably reflect the dietary composition of organisms. SIA provides valuable indicators for trophic levels (TL), physiological processes (such as protein and lipid synthesis) and nutritional niches and foraging ranges [10]. By measuring the δ13C and δ15N ratios in fish tissues, researchers can reconstruct their long-term food sources and trophic levels. The spatial variability of carbon isotopes reflects the contribution of different carbon sources to consumers, such as the distinction between coastal and offshore environments [11]. Nitrogen isotopes indicate trophic levels and undergo changes during metabolic processes, known as trophic discrimination factors, reflecting physiological fractionation with increasing trophic levels [10]. SIA has been widely applied to various marine organisms, from plankton to top predators (e.g., dolphins), to reveal food web structures and energy flow [12,13].
Fatty acid composition analysis provides a unique methodology, as fatty acids not only serve as biomarkers reflecting the diet and nutritional status of organisms but are also significantly influenced by food sources [14]. Most importantly, fatty acid analysis can reveal the energy flow within food chains and interspecies relationships, offering crucial insights into the function and structure of ecosystems. These advantages make fatty acid analysis an indispensable tool in the fields of ecology and biology. In recent years, fatty acid composition analysis has gained prominence in ecology and has been widely applied to marine ecological studies, including the nutritional ecology of cephalopods [15], bony fishes [16] and cartilaginous fishes [17,18]. S. japonicus is not only an important food source, but its fatty acids are often used as sources of eicosapentaenoic acid (EPA) and docosahexaenoic acid (DHA). Certain fatty acids serve as indicators in dietary and nutritional relationship studies, such as C16:1n7 and C20:5n3, which indicate diatom consumption [19], and C20:1 + C22:1, which indicate zooplankton consumption [20].
Combining stable isotope analysis (SIA) with fatty acid analysis (FAA) can provide more comprehensive information on fish nutritional ecology. SIA is suitable for studying long-term food intake and trophic levels [10], while FAA can reveal detailed information on recent food intake [14]. For example, using SIA and FAA together can reveal changes in the diet and nutritional dynamics of S. japonicus across different seasons and habitats. The combination of these two methods can compensate for the limitations of each individual method, providing more detailed and accurate information on the food web structure and energy flow [21].
Based on the aforementioned research background on the biodiversity of the northwest Pacific, this study examines the importance of S. japonicus and its feeding habits, aiming to contribute further insights into its role in the ecosystem. This study collected the samples of S. japonicus from specific areas of the high seas in the northwest Pacific from June to August 2021. This unique sampling location provided detailed regional and temporal context, ensuring the representativeness and reliability of the data. We explored the feeding habits of S. japonicus by combining stable isotope analysis (SIA) and fatty acid analysis (FAA). Through this comprehensive analytical approach, we aimed to gain a more thorough understanding of the role of S. japonicus in the northwest Pacific ecosystem and its impact on the food web structure and energy flow. These findings will not only provide new insights into the ecology of S. japonicus but also offer scientific support for its population management and the development of sustainable fisheries.

2. Materials and Methods

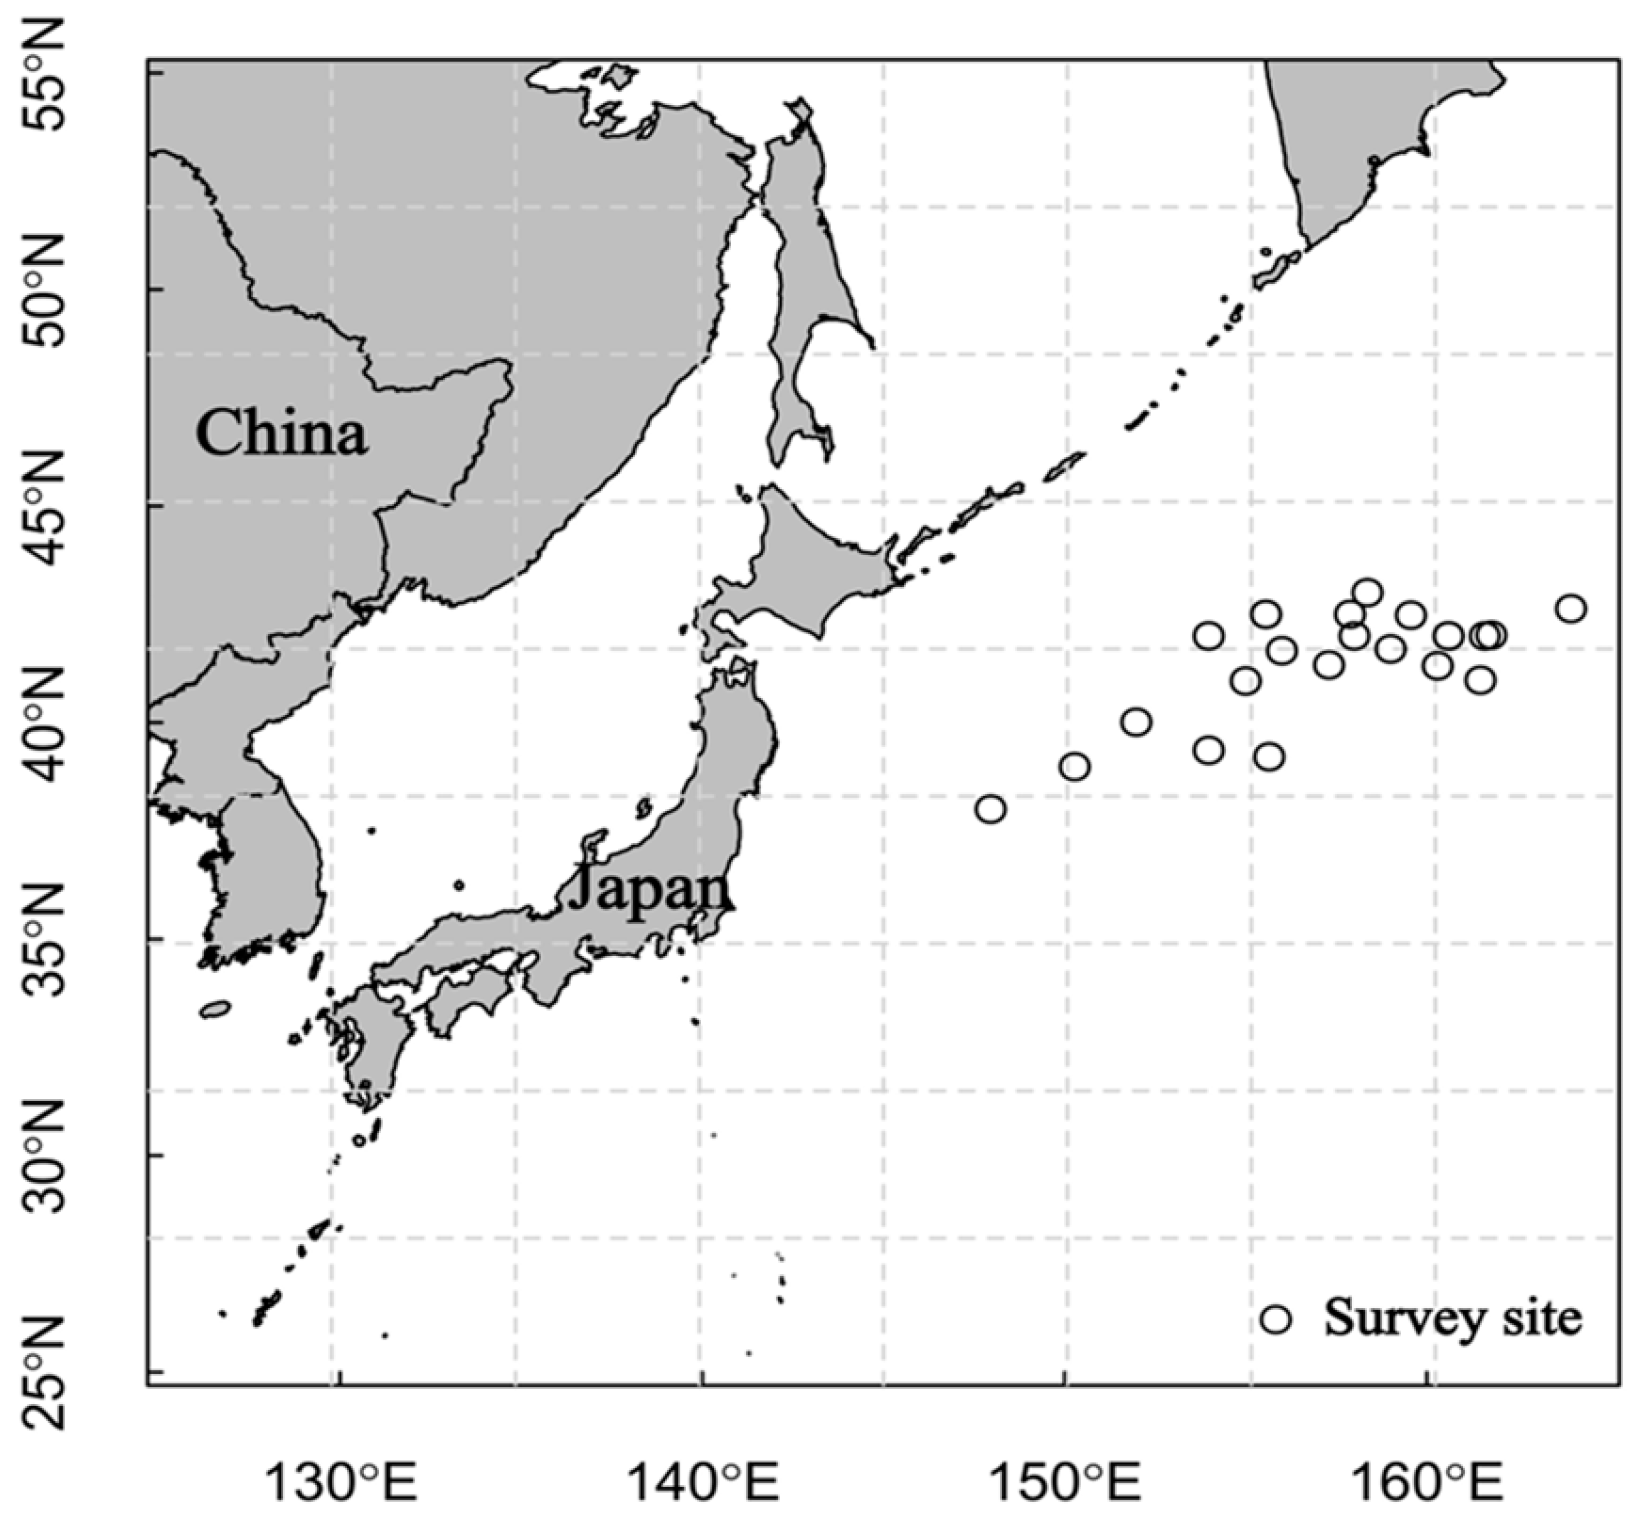
2.1. Sample Collection

The samples of S. japonicus were collected by the vessel “Song Hang” from June to August 2021 in the northwest Pacific (38°00′ N–43°00′ N, 147°58′ E–163°59′ E, Figure 1). Samples from each station were randomly selected from the catch. After classification and identification at sea, the samples were preserved in a freezer at −20 °C and transported to the laboratory. This study included 158 specimens of S. japonicus, comprising 84 males and 74 females.

2.2. Sample Processing

We measured and recorded the body length, weight and sex of each specimen. Body length was determined using a measuring board, with total length defined as the distance from the anterior-most point of the head to the posterior-most point of the caudal fin, accurate to 1 millimeter (mm). Body weight was assessed using a balance with a high precision of 1 g. Gonad examination entailed a thorough analysis of the body structure, form and appearance, enabling precise sex determination. This facilitated the accurate determination of sex. For tissue analysis, muscle samples measuring approximately 3 cm by 3 cm were excised from the anterior end of the dorsal fin in S. japonicus. The samples were immediately frozen at −20 °C to maintain their integrity for subsequent analyses.

2.3. Stable Isotope Analysis

First, muscle tissues were separated from the outer epidermis and subsequently cleaned using ultrapure water. These tissues were subsequently freeze-dried for 24 h at −55 °C and subsequently ground into a fine powder. In the next step, lipids were extracted from the powdered muscle using a chloroform/methanol (2:1) solution for 24 h, followed by drying at 40 °C for another 4 h. Then, the resulting defatted powder was transferred to 2 mL centrifuge tubes. These tubes were put into an elemental analyzer (Vario ISOTOPE Cube, Elementar Americas Inc., New York, NY, USA) and a stable isotope mass spectrometer (ISOPRIME100, IsoPrime Corporation, Lisle, IL, USA) for stable isotope determination. The outcomes were expressed as δ13C and δ15N values, which were computed using the following formula:
δX = [(Rsample/Rstandard) − 1] × 1000
where δX represents 13C or 15N, and R denotes 13C/12C or 15N/14N. δ13C values were based on PDB values (pee dee belemnite). δ15N values were based on atmospheric nitrogen. Rstandard was the standard value. For quality control, three laboratory standards (protein δ13C = −26.98‰, δ15N = 5.96‰) were inserted into every ten samples. These calibrated carbon and nitrogen-stable isotopes provided an analytical precision of 0.06‰ during sample determination.

2.4. Fatty Acid Analysis

First, place 200 mg of sample powder into a test tube, add 15 mL of dichloromethane–methanol solution (volume ratio 2:1), and soak for 20 h at room temperature. After soaking, centrifuge to collect the supernatant, and rinse the residue with 10 mL of trichloromethane–methanol solution before centrifuging again to collect the supernatant. Combine the supernatants from both steps, and add 4 mL of 0.9% sodium chloride solution for washing; then, allow to stand for 2 h until the solution separates. Afterward, collect the dichloromethane layer from the round-bottom flask, and use nitrogen gas to remove the organic solvent. Finally, add 4 mL of 0.5 mol/L sodium hydroxide–methanol solution to redissolve, and obtain the crude fat sample from the muscle.
Add 4 mL of 0.5 mol/L potassium hydroxide–methanol solution to a round-bottom flask, and mix thoroughly. Next, connect the flask to a water bath reflux apparatus, and set the temperature to 100 °C, heating for 15–20 min. Then, add 4 mL of boron trifluoride–methanol solution to the flask, and continue boiling for 25–30 min. After completion, add 4 mL of n-hexane for a 2 min reflux extraction. During the experiment, cool the solution, then add 20–30 mL of saturated sodium chloride solution, and shake to homogenize. Pour the mixed solution into a test tube, and let it stand for 1–2 min to allow layer separation. Finally, use a syringe to extract a specific amount of the n-hexane layer for subsequent measurement and analysis.

2.5. Trophic Level Calculation

The nutrient level of each sample was estimated, and a continuous nutrient spectrum was constructed. The formula for estimating nutrient levels is as follows:
TLconsumer = TLbase + (δ15Nconsumer − δ15Nbase)/TEF
TLbase represents the trophic level of the primary consumer, and its value was set to 2 [22]. The nitrogen stable isotope values of the consumer and copepod baselines were represented by δ15Nconsumer and δ15Nbase, respectively. In this study, we set δ15N base to 6‰ [23]. The trophic enrichment factor (TEF) was assumed to be 3.4‰ [24,25].

2.6. Data Analysis

In this study, we utilized Origin 2021 software to generate box plots illustrating δ13C and δ15N values for male and female S. japonicus. In the box plots used in this study, the box displays the third quartile (Q3) and the first quartile (Q1) at its upper and lower edges, respectively. These boundaries delineate the middle 50% of the data distribution. The horizontal line within the box represents the mean value, providing a clear visual indication of the central position of the distribution. The whiskers, extending from the box, denote the maximum and minimum values of the data but exclude those points considered outliers. Outliers are defined as points that lie beyond 1.5 times the interquartile range (IQR) from the box. Fatty acid content was quantified as a percentage of total fatty acid content using the internal standard method and expressed as mean ± standard deviation (Mean ± SD). The Shapiro–Wilk test and Levene test were employed to confirm the normality and homogeneity of variances, validating the assumptions for subsequent analyses. Variations in stable isotope values and fatty acid composition across different body length groups were analyzed using one-way ANOVA, while differences in carbon and nitrogen isotopes and fatty acids between sexes were assessed using t-tests. The preliminary evaluation of normality and homogeneity of variances confirmed the appropriateness of these tests for isotopic comparisons. Mean distribution plots of δ13C and δ15N values across various body length groups were constructed using R 4.2.2, and niche width and overlap were calculated via the standard ellipse area (SEAB) method, with visualization and analysis facilitated by the “SIBER” package in R 4.2.2 (Bayesian standard ellipse). Fatty acid percentage content data were standardized using the scale function in R, and principal component analysis (PCA) was conducted to identify the primary fatty acids contributing to observed differences based on loading strength. Furthermore, the Bray–Curtis similarity coefficient and similarity analysis (ANOSIM) were applied to compare differences in fatty acid composition among different body length groups of S. japonicus, with a significance threshold set at p < 0.05.

3. Results

3.1. Differences between Male and Female Individuals

The analysis revealed no significant differences in δ13C and δ15N values between male and female individuals of S. japonicus (Table 1 and Figure 2). The results of fatty acid analysis (Table 2) showed a total of 28 fatty acids detected, including 10 saturated fatty acids (SFAs), 8 monounsaturated fatty acids (MUFAs) and 10 polyunsaturated fatty acids (PUFAs). Among them, MUFA had the highest content, followed by SFA, while PUFA had the lowest content. There were no significant differences in fatty acid composition between male and female individuals (p > 0.05).

3.2. Differences among Different Size Groups

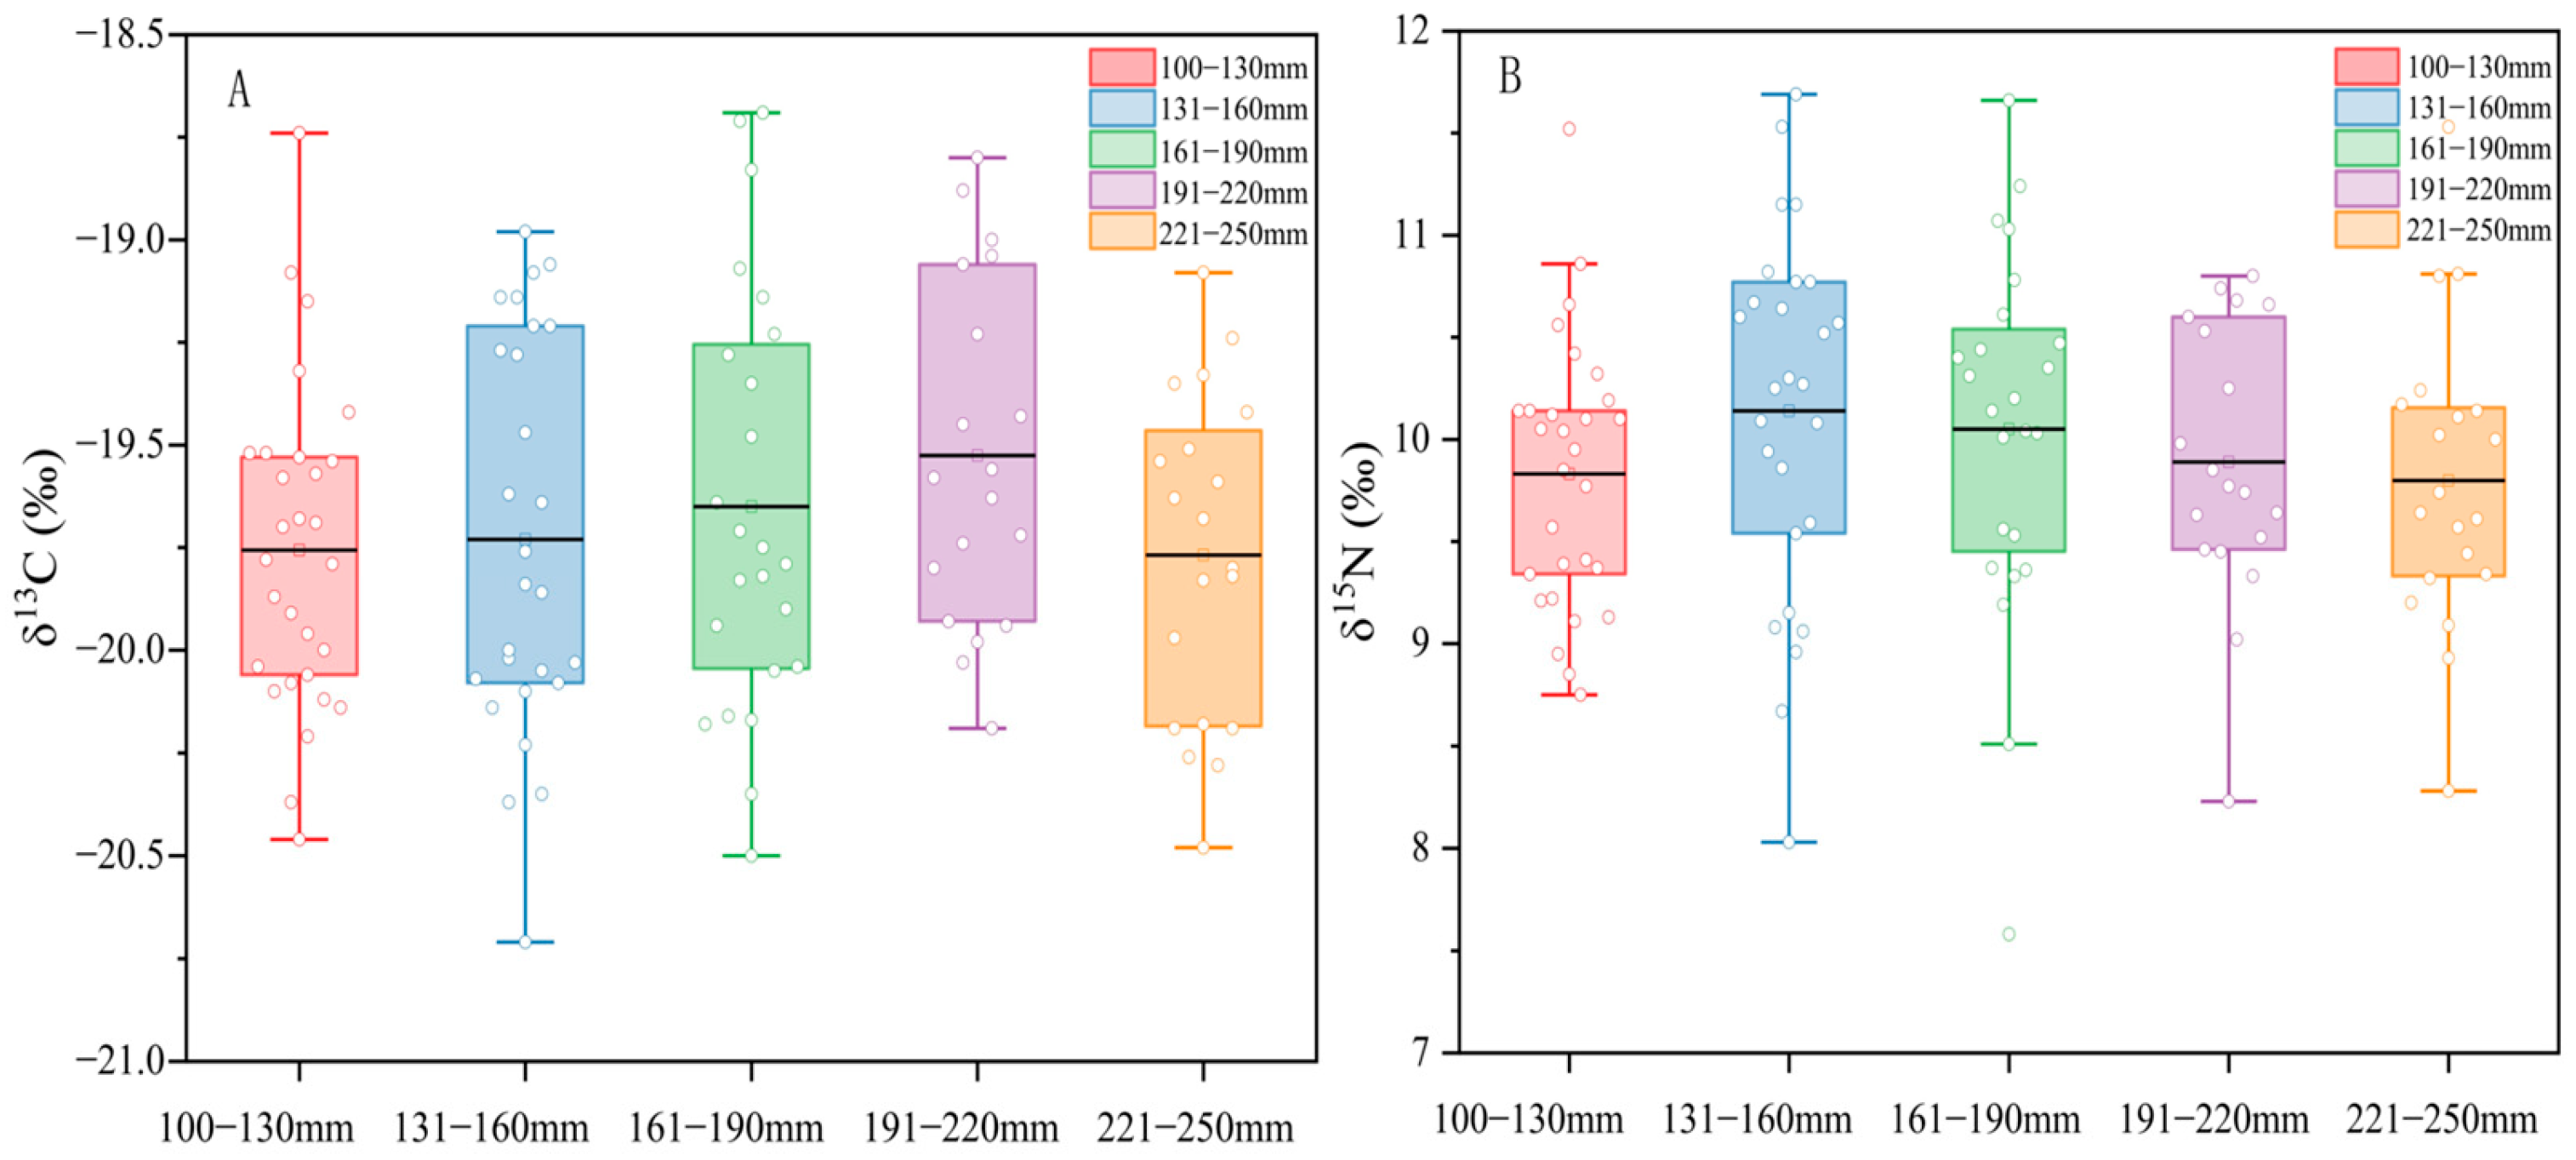
3.2.1. Differences in Stable Isotope Values among Different Size Groups

The results showed that there were no significant differences in δ15N and δ13C values between the different length groups (p > 0.05, Figure 3 and Table 3). The δ13C and δ15N values exhibited a trend of first increasing and then decreasing among the different length groups. The length groups 131–160 mm and 161–190 mm had higher average δ15N values, at 10.14 ± 0.90‰ and 10.05 ± 0.90‰, respectively. The length groups 100–130 mm and 221–250 mm had very similar δ13C and δ15N values. By calculating the mean trophic levels of different length groups, the average trophic level of S. japonicus was found to be 3.19. The average trophic levels of the five length groups were 3.13, 3.22, 3.19, 3.14 and 3.12, respectively.

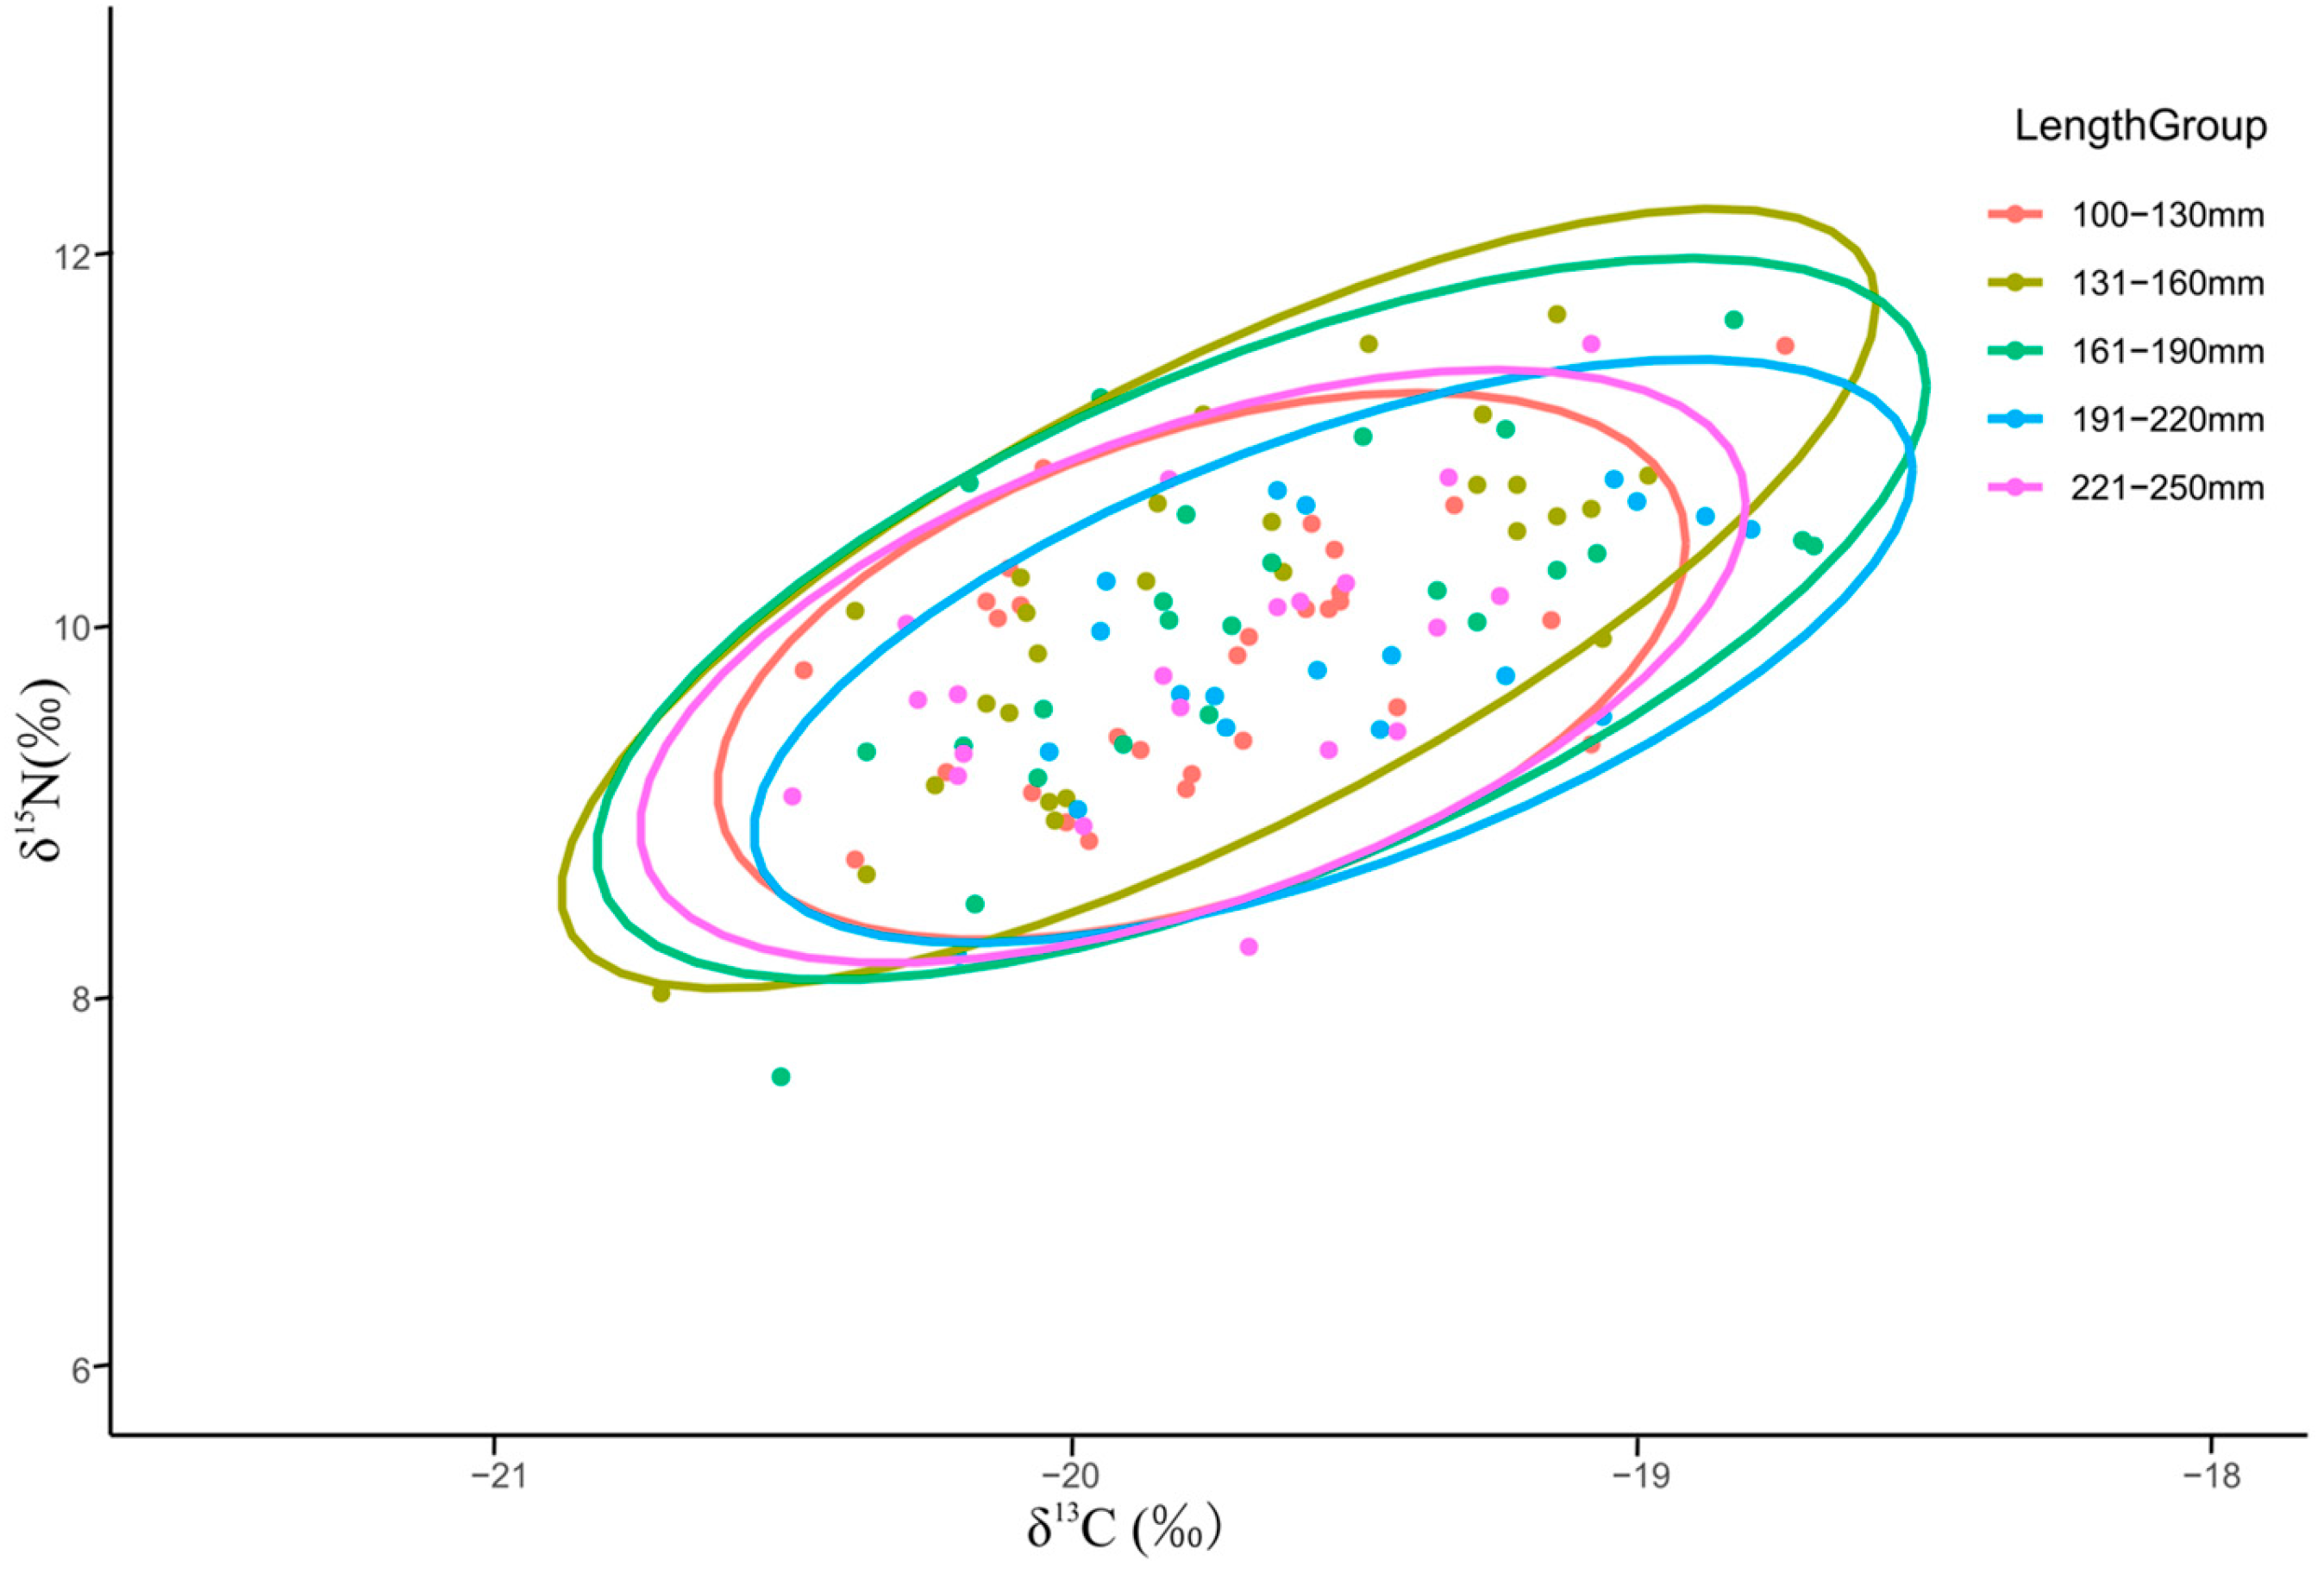
3.2.2. Niche Differences among Different Size Groups

The niche widths of S. japonicus in different length groups were 0.653‰2, 0.895‰2, 0.901‰2, 0.735‰2 and 0.680‰2, respectively (Table 4). The niche widths of the different length groups showed a trend of initially increasing and then decreasing (Figure 4), with the niche widths of the 100–130 mm and 221–250 mm length groups being similar. As the length increased, the niche overlap between adjacent groups first increased and then decreased, and the niche area overlap between all length groups was greater than 60%. The 161–190 mm length group of S. japonicus had the highest niche area overlap with other length groups and the largest niche width.

3.3. Differences in Fatty Acids among Different Body Length Groups

3.3.1. Fatty Acid Composition among Different Body Length Groups

The analysis results presented in Table 5 indicate that the content of saturated fatty acids (SFAs) ranged from 26.07% to 33.36%. Among them, palmitic acid (C16:0), stearic acid (C18:0) and myristic acid (C14:0) were predominant, accounting for 77.80%–81.03% of total SFAs. The monounsaturated fatty acids (MUFAs) content varied from 5.60% to 13.03%, with palmitoleic acid (C16:1n-7) and oleic acid (C18:1n-9) being the major constituents, representing 75.36%–80.42% of all MUFAs. Polyunsaturated fatty acids (PUFAs) ranged from 53.22% to 67.47%, with docosahexaenoic acid (DHA, C22:6n-3) constituting more than 65.69% of the total PUFAs.

3.3.2. Differences in Fatty Acid Composition among Different Body Length Groups

The results of the one-way ANOVA (Table 5) showed that the content of saturated fatty acids and polyunsaturated fatty acids differed significantly among the different length groups (p < 0.05), while the content of monounsaturated fatty acids differed highly significantly (p < 0.01). Among the 28 detected fatty acids, 14 showed highly significant differences in content, namely C16:0, C17:0, C15:1n-5, C16:1n-7, C18:1n-9, C22:1n-9, C20:1, C20:4n-6 and DHA (C22:6n-3) (p < 0.01). Additionally, C14:0, C15:0, C20:2, C14:1n-5 and C17:1n-7 showed significant differences in content among different length groups (p < 0.05). According to the similarity analysis results (Table 6), the fatty acid compositions of the 100–130 mm length group were significantly different from those of the 131–160 mm and 161–190 mm length groups (p < 0.05). However, there were no significant differences among the other length groups (p > 0.05).
We selected fatty acids from different length groups for principal component analysis (PCA), ensuring that each fatty acid content exceeded 1%. The results (Figure 5 and Table 7) showed that there were three principal components with initial eigenvalues greater than 1, with variance contributions of 51.57%, 14.99% and 11.46%. This indicated that the results reflect the information of fatty acid content in the muscle of S. japonicus. Principal components 1 and 2 were able to better distinguish the samples from different length groups. Combined with the component matrix results and the relative loading intensity and direction of the main vectors, it could be seen that C14:0, C16:0, C18:0, C16:1n-7, C18:1n-9, C18:3n-6, C20:5n-3, C20:4n-6 and 22:6n-3 were the main fatty acids causing the differences among the different length groups.

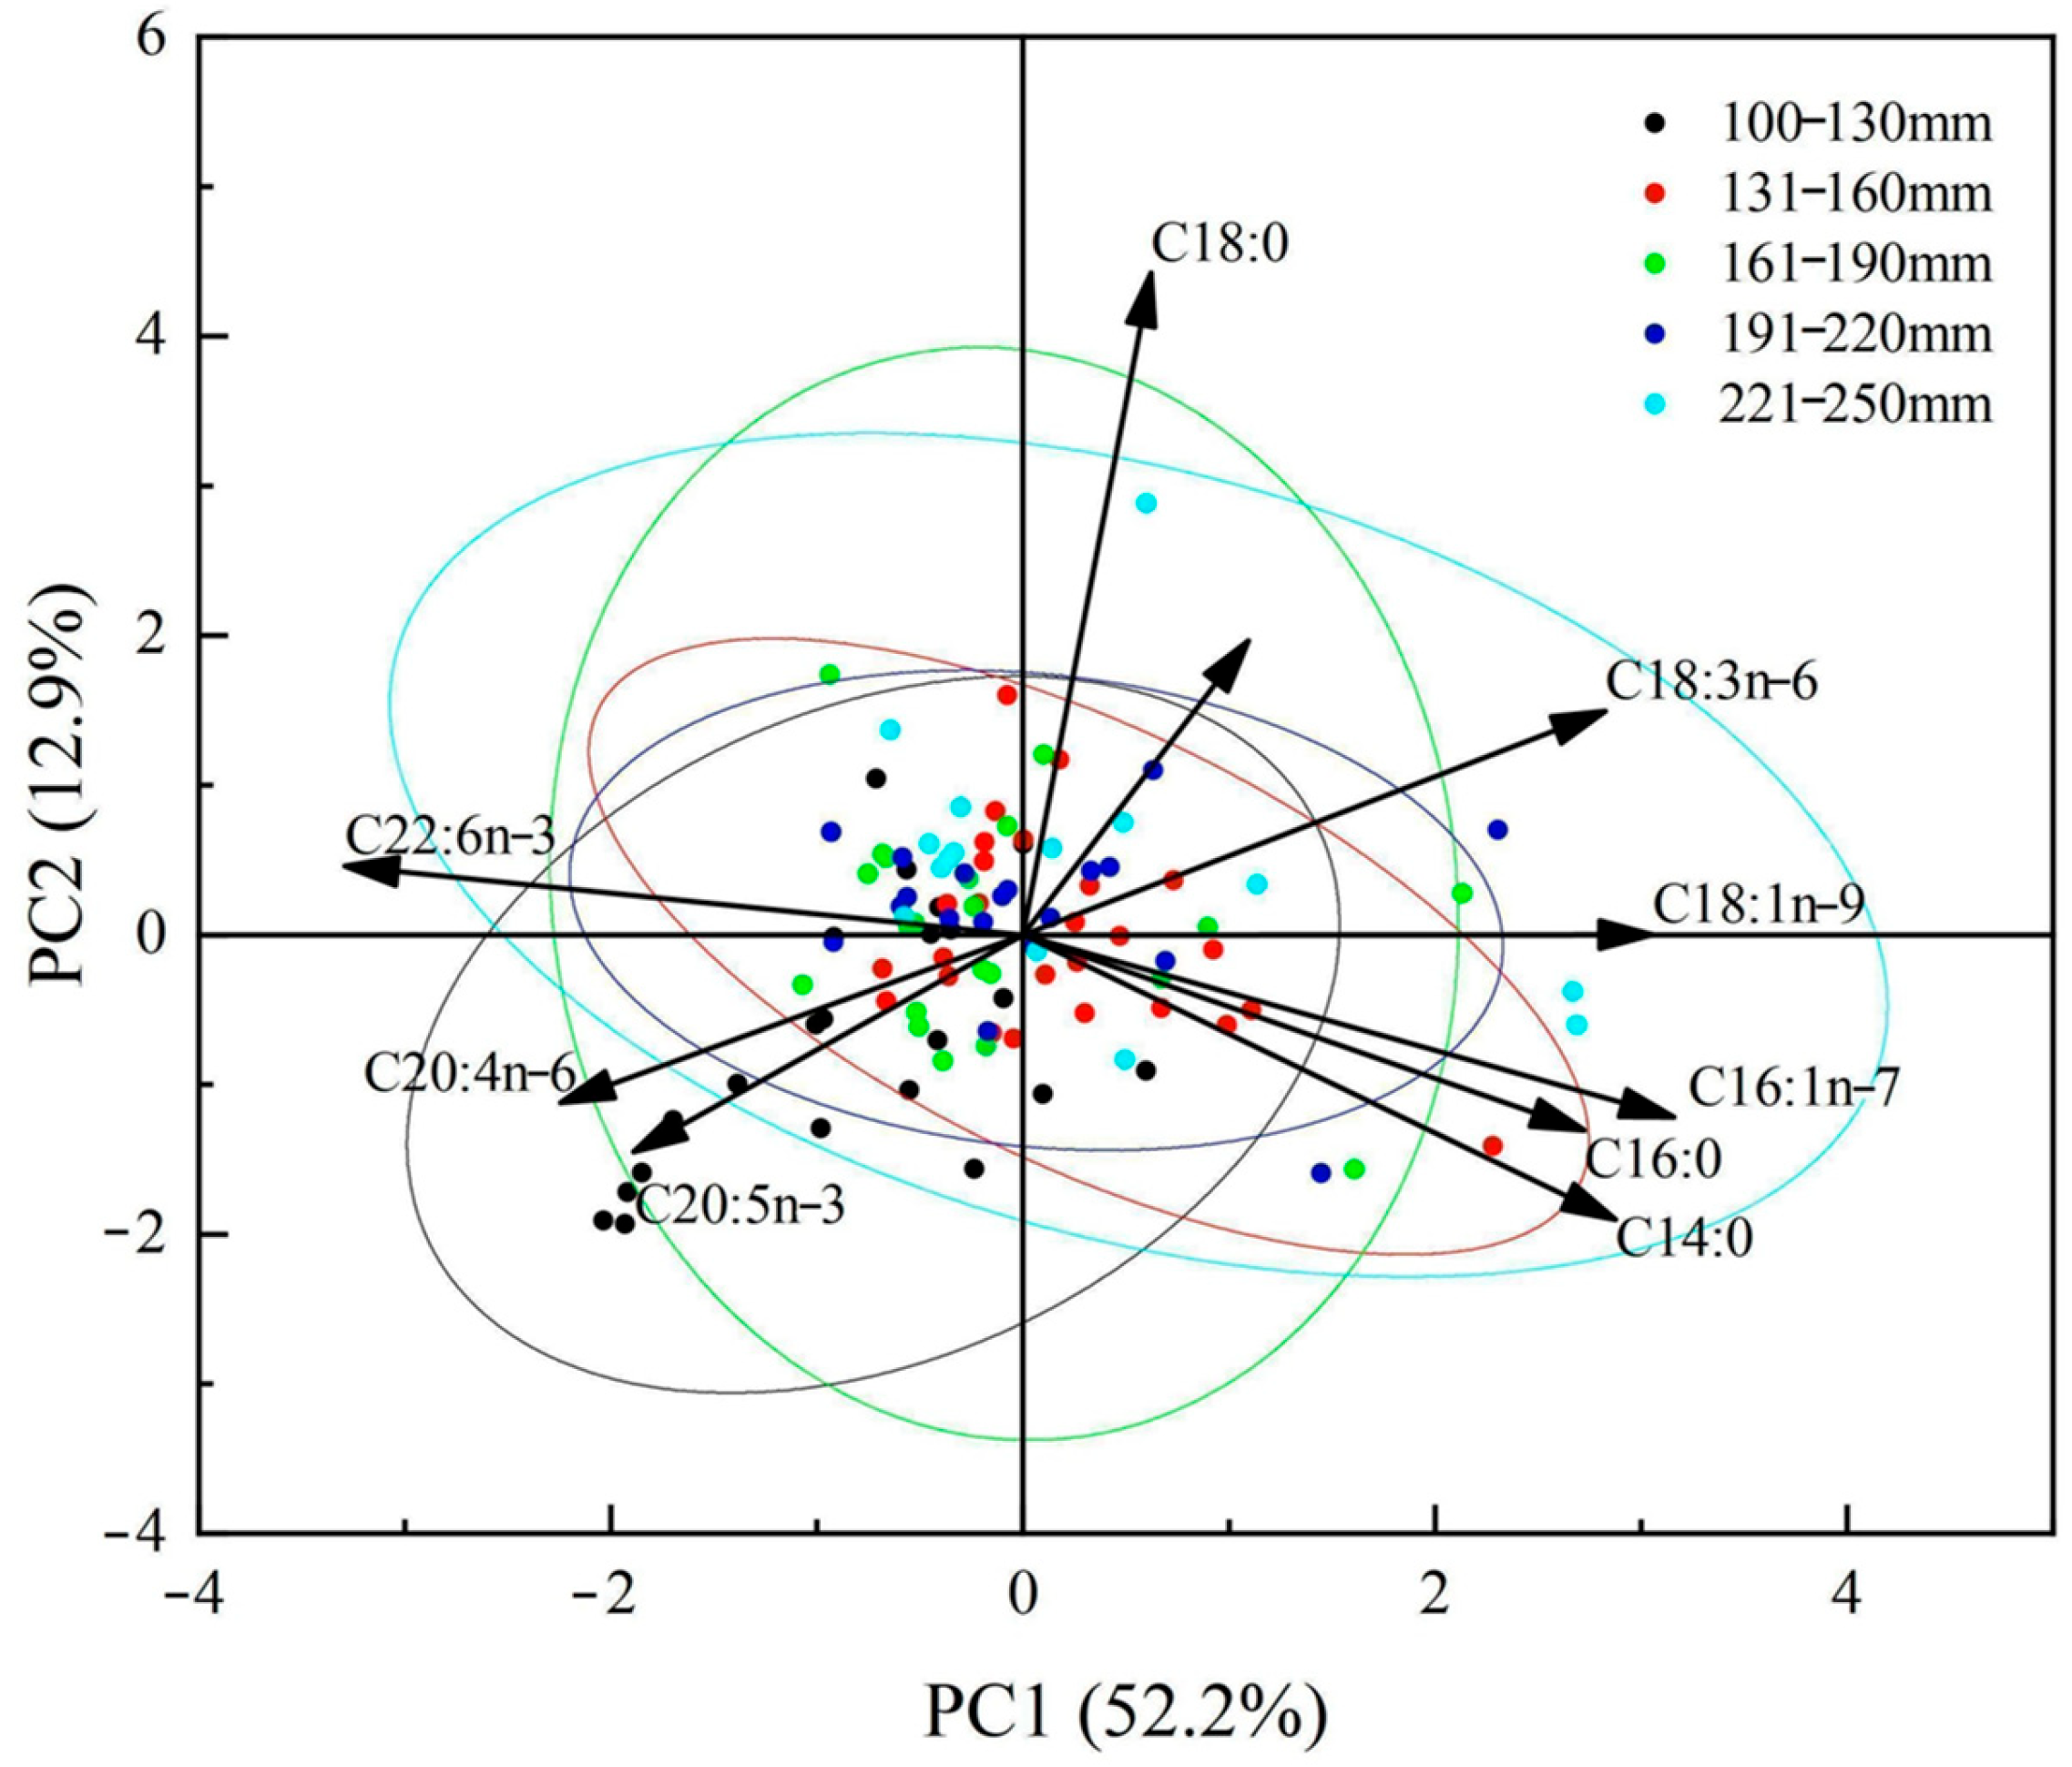
3.3.3. Characteristic Fatty Acids and Dietary Differences

By comparing the percentage changes in characteristic fatty acid content among different length groups (Table 8), the results showed that C18:1n-9 could indicate zooplankton, and C16:1n-7 could indicate diatoms, with both fatty acids increasing in content with body length. DHA (22:6n-3) was the primary fatty acid in all length groups, suggesting that fish might be the main food source for these groups. ARA (20:4n-6) remained relatively stable across all groups and could indicate crustaceans, but its content slightly decreased with increasing body length. EPA (20:5n-3) could indicate krill, with its content decreasing as the body length increased. C18:3n-3 and C18:2n-6 could indicate green algae, while C15:0 and C17:0 could indicate planktonic bacteria, but the content of these food sources was low in all length groups.

4. Discussion

4.1. Differences between Males and Females

Stable isotope analysis has been widely applied to the study of marine fish, providing valuable information about their nutritional ecology, habitat use and migration behavior [24]. We assessed the feeding habits of male and female S. japonicus individuals using carbon (δ13C) and nitrogen (δ15N) stable isotope analysis. The results showed no significant differences in the carbon and nitrogen stable isotope ratios between males and females, indicating similar feeding habits. This finding differs from other studies on marine fish. For example, a study on sockeye salmon (Oncorhynchus nerka) [29] showed no significant difference in δ13C values between males and females but a significant difference in δ15N values. Another study found that three-spined sticklebacks (Gasterosteus aculeatus) showed no significant difference in δ15N values between sexes, but females had significantly higher δ13C values than males, indicating possible differences in food sources [30]. Unlike these studies, S. japonicus showed no significant differences in both δ13C and δ15N values between males and females, suggesting they feed on similar primary food sources within the same habitat and have no significant differences in energy utilization. This highly consistent feeding habit may be related to the ecological characteristics and habitat of S. japonicus. Additionally, S. japonicus may have no significant sexual differentiation in life history strategies, leading to high consistency in trophic levels and food chain positions [31].
In studying ecosystems and biological behavior, fatty acid composition analysis provides a unique methodology in addition to stable isotope analysis. Fatty acids serve as biomarkers, reflecting the diet and nutritional status of organisms, and their composition is significantly influenced by food sources [15]. In this study, both male and female S. japonicus individuals contained the same types of fatty acids, with 28 fatty acids detected (Table 2). There were no significant differences in fatty acid composition between males and females (p > 0.05), indicating that gender is not a major factor affecting the fatty acid composition of S. japonicus. A study by Muro-Torres et al. (2023) found no significant differences in δ13C and δ15N values between male and female yellowtail snapper (Ocyurus chrysurus) [32]; the differences were mainly related to body length, with no significant differences in the types and quantities of their diet. Although this study used stable isotope methods, the results are similar to those of the present study. Baranek et al. (2024) analyzed the fatty acid composition of different genders of rainbow trout (Oncorhynchus mykiss) and found no significant differences in major fatty acids, such as DHA and EPA, between males and females [33]. Additionally, Usydus et al. (2012) studied the fatty acid composition of Baltic herring (Sprattus sprattus balticus) and found no significant differences between males and females under similar environmental and feeding conditions [34]. These findings suggest that there are no significant differences in fatty acid composition between male and female fish, indirectly indicating that their feeding habits are not substantially different.

4.2. Differences among Different Size Groups

4.2.1. Stable Isotope Differences

Stable isotope analysis of carbon and nitrogen is widely used in ecology to study the food web structure and trophic position of animals. The carbon isotope ratio (δ13C) typically reflects food sources and habitats [35], while the nitrogen isotope ratio (δ15N) indicates the trophic level [36]. In this study, stable isotope analysis was conducted on different length groups of S. japonicus. There were no significant differences in δ15N and δ13C values between the different length groups (p > 0.05). Notably, both δ13C and δ15N values exhibited a significant inverted U-shaped trend among the different length groups. For δ15N values, the length groups 131–160 mm and 161–190 mm had slightly higher values, suggesting that individuals in these groups might be at higher trophic levels. This phenomenon may reflect changes in the feeding habits within these length ranges, or the sample size and within-group variability may mask more subtle feeding differences. Similar phenomena have been observed in other studies. For example, Ben-Aderet et al. (2020) found that yellowtail kingfish showed minimal individual differences in δ15N, but δ13C had a strong correlation with fork length and body weight [37]. The similarity in δ15N was attributed to high trophic level feeding, while differences in δ13C among individuals reflected spatial variability in resource utilization.
Primary producers in coastal areas typically have higher δ13C values, while primary producers in pelagic areas have lower δ13C values [38]. This suggests that the higher δ13C values of the length groups 131–160 mm, 161–190 mm and 191–220 mm of S. japonicus may indicate a greater reliance on coastal or benthic food sources. In contrast, the length groups 100–130 mm and 221–250 mm may predominantly feed on pelagic prey. Additionally, we observed that the δ13C and δ15N values of the 100–130 mm and 221–250 mm length groups were very similar. The similar δ13C values suggest that these two length groups may feed on similar food sources or within similar ecosystems, and the similar δ15N values indicate that these length groups occupy similar positions in the food chain [39]. This phenomenon may reflect that the foraging behavior and ecological niche of the fish in these two length ranges have not significantly changed. This could be because fish in these length groups occupy similar ecological niches, utilize similar resources or face similar ecological pressures in the environment [40]. Moreover, the observed similarity in food sources among different length groups of S. japonicus may be attributable to their migratory behavior. S. japonicus exhibits distinct migratory patterns and habitat use that can significantly influence their feeding ecology. According to previous research, S. japonicus in the East China Sea migrates between different spawning and feeding grounds throughout the year [41]. This seasonal migration is often driven by changes in environmental conditions, such as temperature and food availability. Similarly, studies have shown that S. japonicus in the western north Pacific demonstrate seasonal movements and habitat shifts, adapting to varying ecological conditions [42]. During migration, S. japonicus adjusts its foraging strategies based on varying environmental conditions, likely leading to a convergence in food sources among different length groups [43]. This adaptability allows individuals of varying sizes to maintain similar diets despite potentially differing life stages. By calculating the average trophic levels for different length groups, the average trophic levels for the 100–130 mm and 221–250 mm length groups were found to be 3.13 and 3.12, respectively, further supporting the similarity between these two length groups.

4.2.2. Trophic Ecology of S. japonicus

The nutritional niche reflects a species’ function and position within an ecosystem, influenced not only by its biological characteristics but also by interactions with other species and environmental factors [44]. Variations within a species’ nutritional niche highlight the diversity in resource utilization and environmental adaptation among individuals or groups, which is crucial for adapting to environmental changes and maintaining population stability [45]. The concept of the nutritional niche plays a pivotal role in exploring the complexity and diversity of ecosystems [46,47].
This study used the Bayesian standard ellipse area (SEA) method to calculate the niche width and overlap among different length groups. The results showed that as S. japonicus grows, its niche width initially increases and then decreases, reaching its maximum in the 191–220 mm length group. This may be related to the diversified feeding behaviors within this length group. Similar studies have found that fish may exhibit a broader range of food sources at certain growth stages, leading to an increase in niche width [37]. As the body length of S. japonicus increases, the number of prey types initially increases and then decreases [48]. This phenomenon may be due to the development of feeding structures, such as the mouthparts [49], which gradually enhance feeding capability, leading to a dietary shift from zooplankton to fish and shrimp. This observation is consistent with the results of this study. The niche width of the 100–130 mm and 221–250 mm length groups is similar, indicating significant overlap in food resources and habitat selection between these two length groups. They may prey on similar types of food, utilize similar habitats and exhibit similar behavioral patterns [39].
The niche areas of different length groups of S. japonicus exhibit a high degree of overlap, indicating significant intraspecific competition. The 161–190 mm length group of S. japonicus shows the highest niche area overlap with other groups and also has the widest niche width. This suggests that individuals in this length group utilize a broader range of resources, possibly due to being in a rapid growth phase and having higher demands for diverse food resources [50]. Additionally, resource competition is most intense at this stage, and individuals may converge on similar food resources and habitats to secure enough resources [11]. This phenomenon aligns with the theory of intraspecific competition, which suggests that in environments with limited resources, individuals tend to utilize similar resources, leading to increased niche overlap [51].
In summary, S. japonicus exhibits high adaptability in resource utilization, resource competition and response to environmental changes at different growth stages. This adaptability allows different length groups to survive and reproduce under the same environmental conditions [52]. These findings are significant for understanding the ecological characteristics of S. japonicus and for developing effective conservation and management strategies.

4.3. Fatty Acid Analysis

4.3.1. Differences in Fatty Acid Composition among Different Body Length Groups

According to the results of one-way ANOVA (Table 5), there are significant differences in the fatty acid composition among different length groups of S. japonicus. Among the 28 fatty acids detected in the muscles of S. japonicus, 16 showed significant differences in content among different length groups, including saturated fatty acids, monounsaturated fatty acids and polyunsaturated fatty acids, such as C14:0, C16:1n-7, C20:5n-3 and C22:6n-3. These variations in fatty acids may reflect changes in the energy demands of fish of different lengths during physiological metabolism or the influence of environmental conditions, such as food sources and temperature, on fatty acid composition [53]. Combining the results of the principal component analysis, the main fatty acids characterizing S. japonicus include C14:0, C16:0, C18:0, C16:1n-7, C18:1n-9, C18:3n-6, C20:5n-3 and C22:6n-3. This indicates that the demand for energy and nutrients may change with increasing body length, which in turn affects physiological processes, such as growth and development, the immune system and the nervous system.
According to the similarity analysis results (Table 6), the fatty acid compositions of the 100–130 mm length group were significantly different from those of the 131–160 mm and 161–190 mm length groups (p < 0.05). This indicated significant differences in metabolic demands and environmental adaptability between smaller and medium-sized S. japonicus. This might be because smaller fish were in a rapid growth stage and had higher metabolic demands, requiring different fatty acids to support cell membrane growth and energy metabolism [54]. Additionally, there were significant differences in fatty acid composition between the 161–190 mm and 221–250 mm length groups, indicating that further increases in body length might involve new metabolic adjustments or environmental adaptations [55]. For example, larger fish might require more energy to maintain physiological functions, or their food sources might change, affecting fatty acid composition [56].
It is noteworthy that there are no significant differences in the fatty acid composition between the 100–130 mm and 221–250 mm length groups, and there are also no significant differences in their stable isotope values. While it is true that both stable isotopes and fatty acids can indicate diet, they each provide different layers of information. δ13C can suggest the primary productivity source (i.e., whether the food source is more terrestrial or marine, or benthic vs. pelagic) [10,11], whereas fatty acids can give more detailed information about the types of fats the fish are consuming, which can be traced back to specific types of prey like different kinds of plankton or fish [14]. First, there are no significant differences between the two length groups, suggesting they may inhabit similar environmental conditions. This similarity could extend to accessing the same types of prey within their respective ecosystems [57]. Second, the migratory behavior of S. japonicus might also contribute to the similarity in dietary profiles between different length groups. If these fish undertake migrations that traverse similar feeding grounds, or if their migratory routes overlap during crucial feeding times of the year, this could result in similar dietary intakes, regardless of size or age [42]. This behavior would ensure that both juvenile and adult stages of S. japonicus exploit similar food resources, leading to a convergence in their fatty acid profiles. Stable isotope analysis, particularly δ13C, could indeed corroborate the first two points regarding the stable environment and migratory patterns affecting the diet of S. japonicus. The final aspect to consider is the physiological or developmental needs of S. japonicus across different stages of growth. Fatty acids play critical roles in energy storage, membrane structure and as precursors to important signaling molecules [7]. Similar fatty acid profiles among the groups might indicate that these different length groups have similar nutritional requirements, which are met through the consumption of similar types of fatty acids [58]. The similarity in dietary needs could thus reflect an evolutionary adaptation to ensure developmental stability across various life stages.
In marine organisms, saturated fatty acids (SFAs) primarily served as an energy source. They were ubiquitously present in the body and could be synthesized endogenously. Especially during physical activity, SFAs were preferentially utilized to meet essential energy needs [59]. Fatty acids such as C14:0, C16:0 and C18:0 provided energy for fish growth and development, regulated immune cell activity and contributed to the construction and maintenance of cell membrane structure and function, playing vital roles in fish metabolism [53]. Monounsaturated fatty acids (MUFAs) had numerous vital physiological and biochemical functions in fish. These functions ranged from energy provision to the maintenance of cellular structures and support for environmental adaptability. Oleic acid C18:1n-9, stored abundantly as a vital energy source, ensured the normal development of ovaries [60]. Palmitoleic acid C16:1n-7 played various roles in fish, from maintaining cellular structures and functions to participating in energy metabolism and physiological regulation. Organisms supplemented fatty acids mainly through biosynthesis and dietary intake. Fish, as higher level aquatic organisms, generally could not synthesize polyunsaturated fatty acids (PUFAs) on their own and had to rely on consuming lower trophic level plankton to obtain these essential fatty acids [61]. Arachidonic acid C20:4n-6 regulated fish functions, helping fish resist adverse environmental effects [62] and enhancing the quality of juvenile fish [63]. DHA was an essential fatty acid for fish growth and development [64], with significant amounts required for the development of visual and brain nerves in juvenile fish [65]. Studies showed [66] that EPA played a crucial role in tissue biosynthesis and was vital for the survival and development of larvae [67]. Furthermore, like DHA, EPA maintained the integrity of biomembrane structures and functions, especially under cold conditions [68].

4.3.2. Dietary Differences

The types of fatty acids in organisms were primarily determined by the fatty acids present in their diet, and these specific fatty acids could serve as indicators of food sources [69]. For SFAs, they were ubiquitously present in the body and could be synthesized endogenously, thus not providing accurate information as indicators. The characteristic fatty acids corresponding to planktonic bacteria in the food web were C15:0 and C17:0 [28], indicating that planktonic bacteria contributed to the energy sources of S. japonicus, possibly from suspended particles or detritus attached to bacteria. Meanwhile, C14:0 and C16:0 played important roles in providing energy and maintaining cell structure and function. The content of these fatty acids showed a trend of first increasing and then decreasing with body length. The study by GONÇALVES et al. (2012) showed that phytoplankton in marine ecosystems affected the fatty acid composition of organisms, and each type of phytoplankton could be indicated by certain characteristic fatty acids [70].
For MUFAs, C16:1n-7 indicated diatoms [20], with C16:1n-7 comprising 30% of MUFAs, serving as an important food source for S. japonicus. Fatty acid C18:1n-9 indicated zooplankton [19]. Diatoms, the most efficient photosynthetic organisms in the world, were also a preferred food source for zooplankton, fish and shrimp. S. japonicus likely ingested these by feeding on planktonic diatoms or zooplankton. The overall rising content of C16:1n-7 and C18:1n-9 suggested an increasing proportion of zooplankton and diatom consumption by S. japonicus.
Organisms primarily relied on biosynthesis and dietary intake to replenish their fatty acid content. In terms of fatty acid synthesis, lower organisms had a greater capacity than higher organisms; most polyunsaturated fatty acids (PUFAs) could not be synthesized by the body and had to be obtained through the consumption of lower trophic level planktonic flora and fauna [71]. EPA indicated krill, and its content generally decreased as the body length increased. DHA indicated small fish species [20], with its content trending upwards, suggesting that as the body length increased, fish gradually became the primary diet of S. japonicus. C18:3n-6 and ARA C20:4n-6 showed an initial increase followed by a decrease. ARA C20:4n-6 indicated crustaceans [7], and its content showed an increasing and then decreasing trend, with no significant differences between different body length groups, indicating a consistent intake of crustaceans by S. japonicus. To meet its growth needs, S. japonicus changed its feeding strategies. This strategy was also reflected in individual development processes; generally, the DHA/EPA ratio increased with the trophic level [72]. In this study, as the body length increased, the DHA/EPA ratio of S. japonicus showed an increasing trend, indicating a dietary shift during growth and development. As the body length increased, they shifted from consuming food sources with low DHA/EPA ratios to those with high DHA/EPA ratios [73].

5. Conclusions

This study analyzed the dietary habits of S. japonicus in the open waters of the northwest Pacific by measuring the stable isotope values and fatty acid compositions of their muscles across different sexes and body size groups. The results showed no significant differences in carbon (δ13C) and nitrogen (δ15N) stable isotope ratios or fatty acid compositions between male and female individuals. S. japonicus individuals in the length group 131–160 mm were at a higher trophic level. There were considerable niche overlaps among different length groups, indicating strong intraspecific competition. As growth proceeded, the niche breadth initially increased and then decreased. Increased body length enhanced their range of movement and predatory capabilities, allowing them to utilize a broader variety of food resources. However, further growth led to increased dependence on and preference for specific resources, narrowing the niche breadth and intensifying intraspecific competition. Changes in fatty acid content reflected shifts in the energy and nutritional demands of S. japonicus, gradually transitioning from feeding on krill to diatoms, zooplankton, fish and crustaceans. This study reveals the dietary habits and ecological niche shifts of S. japonicus across different sexes and body lengths in the open waters of the northwest Pacific, providing a crucial foundation for further understanding their ecological traits. Future research could employ genomics and metabolomics to explore the metabolic pathways and gene expressions of S. japonicus at different growth stages and under various environmental conditions for a more precise understanding of their energy utilization and nutritional demands.

Author Contributions

Y.C.: Conceptualization, Writing—Original draft, Methodology, Data curation, Software, Visualization, Investigation; G.H.: Conceptualization, Writing—Review and editing, Methodology, Funding acquisition; Z.Z.: Methodology, Investigation; B.L.: Methodology, Investigation; X.C.: Conceptualization, Writing—Review and editing. All authors have read and agreed to the published version of the manuscript.

Funding

This work was supported by the National Key Research and Development Program (2023YFD2401305), the Program on Comprehensive Scientific Survey of Fisheries Resources on the High Seas sponsored by the Ministry of Agriculture and Rural Affairs (D-8025-24-5002), the Key Laboratory of Sustainable Exploitation of Oceanic Fisheries Resources (Shanghai Ocean University), the Ministry of Education (A1-2006-23-200206), and the Startup Foundation for Young Teachers of Shanghai Ocean University (A2-2006-23-200308, A2-2006-24-200307).

Institutional Review Board Statement

Not applicable.

Informed Consent Statement

Not applicable.

Data Availability Statement

The data will be made available upon request.

Acknowledgments

We thank the staff members of the Key Laboratory of Sustainable Exploitation of Oceanic Fisheries Resources, Ministry of Education, Shanghai Ocean University, for providing assistance in the laboratory.

Conflicts of Interest

The authors declare that they have no known competing financial interests or personal relationships that could appear to have influenced the work reported in this paper.

References

  1. Shi, Y.; Zhang, X.; He, Y.; Fan, W.; Tang, F. Stock assessment using length-based Bayesian evaluation method for three small pelagic species in the Northwest Pacific Ocean. Front. Mar. Sci. 2022, 9, 775180. [Google Scholar] [CrossRef]
  2. Zhang, H.; Yang, C.; Xu, B.; Shi, Y.; Zhao, G.; Han, H. Age and Growth of Japanese Mackerel in the High Seas of the Northwest pacific ocean. Open J. Anim. Sci. 2021, 12, 91–102. [Google Scholar] [CrossRef]
  3. Pan, X.; Ye, Z.; Xu, B.; Jiang, T.; Yang, J.; Tian, Y. Population connectivity in a highly migratory fish, Japanese Spanish mackerel (Scomberomorus niphonius), along the Chinese coast, implications from otolith chemistry. Fish. Res. 2020, 231, 105690. [Google Scholar] [CrossRef]
  4. Papadimitraki, M.; Maar, K.; Jónasdóttir, S.H. Meso- and bathypelagic fish feeding ecology: A meta-analysis on fatty acids and stable isotope trophic studies. Deep. Sea Res. Part I Oceanogr. Res. Pap. 2023, 198, 104083. [Google Scholar] [CrossRef]
  5. Hopkins, T.L.; Baird, R.C. Diet of the hatchetfish Sternoptyx diaphana. Mar. Biol. 1973, 21, 34–46. [Google Scholar] [CrossRef]
  6. Layman, C.A.; Araujo, M.S.; Boucek, R.; Hammerschlag-Peyer, C.M.; Harrison, E.; Jud, Z.R.; Matich, P.; Rosenblatt, A.E.; Vaudo, J.J.; Yeager, L.A.; et al. Applying stable isotopes to examine food-web structure: An overview of analytical tools. Biol. Rev. 2012, 87, 545–562. [Google Scholar] [CrossRef]
  7. Taşbozan, O.; Gökçe, M.A. Fatty acids in fish. Fat. Acids 2017, 1, 143–159. [Google Scholar] [CrossRef]
  8. Su, M.; Liu, H.; Liang, X.; Gui, L.; Zhang, J. Dietary analysis of marine fish species: Enhancing the detection of prey-specific DNA sequences via high-throughput sequencing using blocking primers. Estuaries Coasts 2018, 41, 560–571. [Google Scholar] [CrossRef]
  9. DeNiro, M.J.; Epstein, S. Influence of diet on the distribution of carbon isotopes in animals. Geochim. Cosmochim. Acta 1978, 42, 495–506. [Google Scholar] [CrossRef]
  10. Coplen, T.B. Guidelines and recommended terms for expression of stable-isotope-ratio and gas-ratio measurement results. Rapid Commun. Mass Spectrom. 2011, 25, 2538–2560. [Google Scholar] [CrossRef] [PubMed]
  11. Bearhop, S.; Adams, C.E.; Waldron, S.; Fuller, R.A.; Macleod, H. Determining trophic niche width: A novel approach using stable isotope analysis. J. Anim. Ecol. 2004, 73, 1007–1012. [Google Scholar] [CrossRef]
  12. Bode, A.; Alvarez-Ossorio, M.T.; Carrera, P.; Lorenzo, J. Reconstruction of trophic pathways between plankton and the North Iberian sardine (Sardina pilchardus) using stable isotopes. Sci. Mar. 2004, 68, 165–178. [Google Scholar] [CrossRef]
  13. Bode, A.; Carrera, P.; Lens, S. The pelagic foodweb in the upwelling ecosystem of Galicia (NW Spain) during spring: Natural abundance of stable carbon and nitrogen isotopes. ICES J. Mar. Sci. 2003, 60, 11–22. [Google Scholar] [CrossRef]
  14. Zhang, J.; Ren, C.; Zhang, H.; Yin, F.; Zhang, S.; Wan, R.; Kitazawa, D. Review of estimating trophic relationships by quantitative fatty acid signature analysis. J. Mar. Sci. Eng. 2020, 8, 1030. [Google Scholar] [CrossRef]
  15. Zhao, Z.F.; Hu, G.Y.; Chen, X.J.; Liu, B.L.; Liang, J.W. Studies on monthly difference of fatty acid composition and dietary indicator of Dosidicusgigasin offshore waters of Peru. Trans. Oceanol. Limnol. 2022, 44, 98–105. (In Chinese) [Google Scholar]
  16. Yang, Y.Y. Trophic Interactions in the Northern Slopeof the South China Sea through Fatty Acidand Stable Isotope Analyses; Shanghai Ocean University: Shanghai, China, 2016. (In Chinese) [Google Scholar]
  17. Huang, H.J. Feeding of Bigeye Tuna (Thunnusobesus) Inthe Tropical Eastern Pacific Ocean Baseon Biomarker Techniques; Shanghai Ocean University: Shanghai, China, 2021. (In Chinese) [Google Scholar]
  18. Xu, M. Trophic Niche Partitioning of Sympatricpelagic Sharks in the Tropical Eastern PacificInferred by Fatty Acid; Shanghai Ocean University: Shanghai, China, 2022. (In Chinese) [Google Scholar]
  19. Gao, X.D.; Chen, X.J.; Li, Y.K. A review on the methods used in aquatic food web research: Development and applications. J. Fish. Sci. China 2018, 25, 1347–1360. (In Chinese) [Google Scholar] [CrossRef]
  20. Rossi, S.; Sabatés, A.; Latasa, M.; Reyes, E. Lipid biomarkers and trophic linkages between phytoplankton, zooplankton and anchovy (Engraulis encrasicolus) larvae in the NW Mediterranean. J. Plankton Res. 2006, 28, 551–562. [Google Scholar] [CrossRef]
  21. Petursdottir, H.; Gislason, A.; Falk-Petersen, S.; Hop, H.; Svavarsson, J. Trophic interactions of the pelagic ecosystem over the Reykjanes Ridge as evaluated by fatty acid and stable isotope analyses. Deep. Sea Res. Part II Top. Stud. Oceanogr. 2008, 55, 83–93. [Google Scholar] [CrossRef]
  22. Du, J.; Makatipu, P.C.; Tao, L.S.; Pauly, D.; Cheung, W.W.; Peristiwady, T.; Liao, J.; Chen, B. Comparing trophic levels estimated from a tropical marine food web using an ecosystem model and stable isotopes. Estuarine Coast. Shelf Sci. 2020, 233, 106518. [Google Scholar] [CrossRef]
  23. Zhang, J.; Liu, B.; Hu, S.; Gong, Y. Trophic structure of micronekton in the Northwest Pacific Ocean. Front. Mar. Sci. 2022, 9, 971649. [Google Scholar] [CrossRef]
  24. Post, D.M. Using stable isotopes to estimate trophic position: Models, methods, and assumptions. Ecology 2002, 83, 703–718. [Google Scholar] [CrossRef]
  25. Minagawa, M.; Wada, E. Stepwise enrichment of δ15N along food chains: Further evidence and the relation between δ15N and animal age. Geochim. Cosmochim. Acta 1984, 48, 1135–1140. [Google Scholar] [CrossRef]
  26. Dalsgaard, J.; John, M.S.; Kattner, G.; Müller-Navarra, D.; Hagen, W. Fatty acid trophic markers in the pelagic marine environment. Adv. Mar. Biol. 2003, 46, 225–340. [Google Scholar] [CrossRef] [PubMed]
  27. Graeve, M.; Kattner, G.; Wiencke, C.; Karsten, U. Fatty acid composition of Arctic and Antarctic macroalgae: Indicator of phylogenetic and trophic relationships. Mar. Ecol. Prog. Ser. 2002, 231, 67–74. [Google Scholar] [CrossRef]
  28. Parrish, C.C.; Abrajano, T.A.; Budge, S.M.; Helleur, R.J.; Hudson, E.D.; Pulchan, K.; Ramos, C. Lipid and phenolic biomarkers in marine ecosystems: Analysis and applications. Mar. Chem. 2000, 5D, 193–223. [Google Scholar] [CrossRef]
  29. Martins, E.G.; Minke-Martin, V.; Patterson, D.A.; Power, M. The effects of inter- and intra-population variability on the use of adipose fin-muscle tissue comparisons for stable isotope studies of sockeye salmon. Fish. Res. 2019, 211, 148–157. [Google Scholar] [CrossRef]
  30. Reimchen, T.E.; Ingram, T.; Hansen, S.C. Assessing niche differences of sex, armour and asymmetry phenotypes using stable isotope analyses in Haida Gwaii sticklebacks. Behaviour 2008, 145, 561–577. [Google Scholar] [CrossRef]
  31. Karachle, P.K.; Stergiou, K.I. The effect of season and sex on trophic levels of marine fishes. J. Fish Biol. 2008, 72, 1463–1487. [Google Scholar] [CrossRef]
  32. Muro-Torres, V.M.; Amezcua, F.; Green, L.; Payan, J.; Balart-Páez, E.F.; Amezcua-Linares, F. Ontogenetic shifts in feeding habits of orangemouth weakfish (Cynoscion xanthulus): From estuarine benthic feeder to marine nektivore top predator. Mar. Ecol. 2023, 44, e12735. [Google Scholar] [CrossRef]
  33. Baranek, E.; Heraud, C.; Larroquet, L.; Surget, A.; Lanuque, A.; Terrier, F.; Skiba-Cassy, S.; Jérôme, R. Long-term regulation of fat sensing in rainbow trout (Oncorhynchus mykiss) fed a vegetable diet from the first feeding: Focus on free fatty acid receptors and their signalling. Br. J. Nutr. 2024, 131, 1–16. [Google Scholar] [CrossRef]
  34. Usydus, Z.; Szlifder-Richert, J.; Adamczyk, M. Variations in proximate composition and fatty acid profiles of Baltic sprat (Sprattus sprattus balticus). Food Chem. 2012, 130, 97–103. [Google Scholar] [CrossRef]
  35. Rumolo, P.; Bonanno, A.; Barra, M.; Fanelli, E.; Calabrò, M.; Genovese, S.; Ferreri, R.; Mazzola, S.; Basilone, G. Spatial variations in feeding habits and trophic levels of two small pelagic fish species in the central Mediterranean Sea. Mar. Environ. Res. 2016, 115, 65–77. [Google Scholar] [CrossRef]
  36. Perkins, M.J.; McDonald, R.A.; van Veen, F.J.F.; Kelly, S.D.; Rees, G.; Bearhop, S. Application of nitrogen and carbon stable isotopes (δ15N and δ13C) to quantify food chain length and trophic structure. PLoS ONE 2014, 9, e93281. [Google Scholar] [CrossRef] [PubMed]
  37. Ben-Aderet, N.; Johnston, E.M.; Cravey, R.; Sandin, S.A. Revisiting the life history of yellowtail jack (Seriola dorsalis) in the Southern California Bight: New evidence for ontogenetic habitat shifts and regional differences in a changing environment. Fish. Bull. 2020, 118, 158–170. [Google Scholar] [CrossRef]
  38. Pinnegar, J.K.; Polunin, N.V.C. Contributions of stable-isotope data to elucidating food webs of Mediterranean rocky littoral fishes. Oecologia 2000, 122, 399–409. [Google Scholar] [CrossRef] [PubMed]
  39. Layman, C.A.; Arrington, D.A.; Montaña, C.G.; Post, D.M. Can stable isotope ratios provide for community-wide measures of trophic structure? Ecology 2007, 88, 42–48. [Google Scholar] [CrossRef] [PubMed]
  40. Hussey, N.E.; MacNeil, M.A.; Olin, J.A.; McMeans, B.C.; Kinney, M.J.; Chapman, D.D.; Fisk, A.T. Stable isotopes and elasmobranchs: Tissue types, methods, applications and assumptions. J. Fish Biol. 2012, 80, 1449–1484. [Google Scholar] [CrossRef] [PubMed]
  41. Yu, W.; Wen, J.; Chen, X.; Li, G.; Li, Y.; Zhang, Z. Effects of climate variability on habitat range and distribution of chub mackerel in the east China sea. J. Ocean Univ. China 2021, 20, 1483–1494. [Google Scholar] [CrossRef]
  42. Kume, G.; Shigemura, T.; Okanishi, M.; Hirai, J.; Shiozaki, K.; Ichinomiya, M.; Komorita, T.; Habano, A.; Makino, F.; Kobari, T. Distribution, feeding habits, and growth of chub mackerel, Scomber japonicus, larvae during a high-stock period in the northern Satsunan area, southern Japan. Front. Mar. Sci. 2021, 8, 725227. [Google Scholar] [CrossRef]
  43. Ishikawa, K.; Watanabe, C.; Kameda, T.; Tokeshi, T.; Horie, H.; Hashida, D.; Ookawa, T.; Takeda, T.; Kuno, M.; Suzuki, Y.; et al. Spatiotemporal variability in the occurrence of juvenile Japanese jack mackerel Trachurus japonicus along coastal areas of the Kuroshio Current. Fish. Oceanogr. 2021, 30, 569–583. [Google Scholar] [CrossRef]
  44. Zarzo-Arias, A.; Uhl, B.; Maynard, D.S.; Morales, M.B. Editorial: The ecological niche at different spatial scales. Front. Ecol. Evol. 2023, 11, 1296340. [Google Scholar] [CrossRef]
  45. Endo, C.; Watanabe, K. Morphological variation associated with trophic niche expansion within a lake population of a benthic fish. PLoS ONE 2020, 15, e0232114. [Google Scholar] [CrossRef] [PubMed]
  46. Roches, S.D.; Post, D.M.; Turley, N.E.; Bailey, J.K.; Hendry, A.P.; Kinnison, M.T.; Schweitzer, J.A.; Palkovacs, E.P. The ecological importance of intraspecific variation. Nat. Ecol. Evol. 2018, 2, 57–64. [Google Scholar] [CrossRef] [PubMed]
  47. Govaert, L.; Hendry, A.P.; Fattahi, F.; Möst, M. Quantifying interspecific and intraspecific diversity effects on ecosystem functioning. Ecology 2024, 105, e4199. [Google Scholar] [CrossRef] [PubMed]
  48. Tang, F.H.; Dai, S.W.; Fang, W. Study on the stomach contents of Japanese mackerel (Scomber japonicus) in the high seas of the Northwest Pacific and its feeding grade. China Agric. Sci. Technol. Rev. 2020, 22, 138–148. [Google Scholar] [CrossRef]
  49. Xue, Y.; Jin, X.; Zhang, B.; Liang, Z. Seasonal, diel and ontogenetic variation in feeding patterns of small yellow croaker in the central Yellow Sea. J. Fish Biol. 2005, 67, 33–50. [Google Scholar] [CrossRef]
  50. Werner, E.E.; Gilliam, J.F. The ontogenetic niche and species interactions in size-structured populations. Annu. Rev. Ecol. Syst. 1984, 15, 393–425. [Google Scholar] [CrossRef]
  51. Bolnick, D.I.; Svanbäck, R.; Fordyce, J.A.; Yang, L.H.; Davis, J.M.; Hulsey, C.D.; Forister, M.L. The ecology of individuals: Incidence and implications of individual specialization. Am. Nat. 2003, 161, 1–28. [Google Scholar] [CrossRef] [PubMed]
  52. Svanbäck, R.; I Bolnick, D. Intraspecific competition drives increased resource use diversity within a natural population. Proc. R. Soc. B Biol. Sci. 2007, 274, 839–844. [Google Scholar] [CrossRef]
  53. Nemova, N.N.; Nefedova, Z.A.; Murzina, S.A.; Veselov, A.E.; Ripatti, P.O.; Pavlov, D.S. The effect of environmental conditions on the dynamics of fatty acids in juveniles of the Atlantic salmon (Salmo salar L.). Russ. J. Ecol. 2015, 46, 267–271. [Google Scholar] [CrossRef]
  54. Tocher, D.R. Metabolism and functions of lipids and fatty acids in teleost fish. Rev. Fish. Sci. 2003, 11, 107–184. [Google Scholar] [CrossRef]
  55. Killen, S.S.; Glazier, D.S.; Rezende, E.L.; Clark, T.D.; Atkinson, D.; Willener, A.S.T.; Halsey, L.G. Ecological influences and morphological correlates of resting and maximal metabolic rates across teleost fish species. Am. Nat. 2016, 187, 592–606. [Google Scholar] [CrossRef] [PubMed]
  56. Barbeaux, S.J.; Holsman, K.; Zador, S. Marine heatwave stress test of ecosystem-based fisheries management in the gulf of alaska pacific cod fishery. Front. Mar. Sci. 2020, 7, 703. [Google Scholar] [CrossRef]
  57. Hu, G.; Zhao, Z.; Liu, B.; Lin, D.; Liang, J.; Fang, Z.; Chen, X. Fatty acid profile of jumbo squid (Dosidicus gigas) off the Peruvian exclusive economic zone: Revealing the variability of feeding strategies. Fishes 2022, 7, 221. [Google Scholar] [CrossRef]
  58. Zhang, Z.; Liu, L.; Xie, C.; Li, D.; Xu, J.; Zhang, M.; Zhang, M. Lipid contents, fatty acid profiles and nutritional quality of nine wild caught freshwater fish species of the Yangtze Basin, China. J. Food Nutr. Res. 2014, 2, 388–394. [Google Scholar] [CrossRef]
  59. Chen, Y.J.; Ju, X.R.; Zhou, G.H. Classification and physiological functions of saturated fatty acids. Chin. Fats Oils 2008, 33, 35–39. (In Chinese) [Google Scholar]
  60. Xie, R.T.; Huang, K.; Xiao, X.; Zhao, X.; Zhang, S.; Lu, H. Analysis of muscle fatty acid composition of juvenile Pelteobagrus fulvidraco Jiang and parent fish of both sexes. Guangxi Agric. Sci. 2009, 40, 911–914. (In Chinese) [Google Scholar]
  61. Gao, C.X. Trophic Structure of Offshore Fishery Biomes in South-Central Zhejiang Based on Stable Isotope Technique; Shanghai Ocean University: Shanghai, China, 2020. (In Chinese) [Google Scholar]
  62. Koven, W.; Barr, Y.; Lutzky, S.; Ben-Atia, I.; Weiss, R.; Harel, M.; Behrens, P.; Tandler, A. The effect of dietary arachidonic acid (20:4n−6) on growth, survival and resistance to handling stress in gilthead seabream (Sparus aurata) larvae. Aquaculture 2001, 193, 107–122. [Google Scholar] [CrossRef]
  63. Castell, J.; Blair, T.; Neil, S.; Howes, K.; Mercer, S.; Reid, J.; Young-Lai, W.; Gullison, B.; Dhert, P.; Sorgeloos, P. The effect of different HUFA enrichment emulsions on the nutritional value of rotifers (Brachionus plicatilis) fed to larval haddock (Melanogrammus aeglefinus). Aquac. Int. 2003, 11, 109–117. [Google Scholar] [CrossRef]
  64. Shi, Y.H.; Xu, J.B.; Liu, Y.S.; Zhang, H.M.; Deng, P.P.; Lu, G.H.; Zhang, Z.F. Changes in fatty acid composition of the chrysanthemum yellow oriental triggerfish during early development. J. Aquat. Sci. 2017, 41, 1203–1212. (In Chinese) [Google Scholar]
  65. Lu, S.F.; Zhao, N.; Liu, H.B.; Hu, R.G. Changes in fatty acid composition of fertilised eggs and fish during early developmental stages of Pelteobagrus fulvidraco. J. Aquat. Sci. 2008, 5, 711–716. (In Chinese) [Google Scholar]
  66. Dall, W.; Chandumpai, A.; Smith, D.M. The fate of some 14C-labelled dietary lipids in the tiger prawn Penaeus esculentus. Mar. Biol. 1993, 115, 39–45. [Google Scholar] [CrossRef]
  67. Dickey-Collas, M.; Geffen, A.J. Importance of the fatty acids 20: 5ω 3 and 22: 6ω 3 in the diet of plaice (Pleuronectes platessa) larvae. Mar. Biol. 1992, 113, 463–468. [Google Scholar] [CrossRef]
  68. Hulbert, A.; Else, P.L. Membranes as possible pacemakers of metabolism. J. Theor. Biol. 1999, 199, 257–274. [Google Scholar] [CrossRef] [PubMed]
  69. Iverson, S.; Frost, K.; Lowry, L. Fatty acid signatures reveal fine scale structure of foraging distribution of harbor seals and their prey in Prince William Sound, Alaska. Mar. Ecol. Prog. Ser. 1997, 151, 255–271. [Google Scholar] [CrossRef]
  70. Gonçalves, A.; Azeiteiro, U.; Pardal, M.; De Troch, M. Fatty acid profiling reveals seasonal and spatial shifts in zooplankton diet in a temperate estuary. Estuarine Coast. Shelf Sci. 2012, 109, 70–80. [Google Scholar] [CrossRef]
  71. Liu, M.T. Indicative Role of Fatty Acid Markers in the Study of Trophic Relationships in the Yellow Sea Ecosystem; Graduate School of Chinese Academy of Sciences (Institute of Oceanography): Qingdao, China, 2010. (In Chinese) [Google Scholar]
  72. Iverson, S.J. Tracing aquatic food webs using fatty acids: From qualitative indicators to quantitative determination. In Lipids in Aquatic Ecosystems; Springer: New York, NY, USA, 2009; pp. 281–308. [Google Scholar] [CrossRef]
  73. Mejri, S.C.; Tremblay, R.; Audet, C.; Wills, P.S.; Riche, M. Essential fatty acid requirements in tropical and cold-water marine fish larvae and juveniles. Front. Mar. Sci. 2021, 8, 680003. [Google Scholar] [CrossRef]
Figure 1. Map of the sampling locations of S. japonicus.
Jmse 12 01335 g001
Figure 2. δ13C and δ15N trend graph for females and males.
Jmse 12 01335 g002
Figure 3. Mean distribution of different body length groups in δ13C (A) and δ15N (B) dimensions.
Jmse 12 01335 g003
Figure 4. Isotopic niches of different body length groups.
Jmse 12 01335 g004
Figure 5. Principal component analysis of the fatty acid compositions among different body length groups. Note: Vectors indicate the relative load intensity and direction of major fatty acids.
Jmse 12 01335 g005
Table 1. Stable isotope analyses of muscles for different body length groups and male and female individuals.
SpeciesSex/BLNumberδ15N (‰)δ15C (‰)
RangeMean ± SDpRangeMean ± SDp
S. japonicusMale707.58~11.6910 ± 0.790.684−20.50~−18.69−19.65 ± 0.450.331
Female498.03~11.9810.02 ± 0.76−20.71~−18.43−19.62 ± 0.42
100–130298.75~11.529.83 ± 0.65>0.05−20.46~−18.74−19.76 ± 0.39>0.05
131–160278.03~11.6910.14 ± 0.9−20.71~−18.98−19.73 ± 0.49
161–190247.58~11.6610.05 ± 0.9−20.50~−18.69−19.65 ± 0.51
191–220198.23~10.89.89 ± 0.68−20.19~−18.80−19.53 ± 0.42
221–250208.28~11.539.8 ± 0.74−20.48~−19.08−19.77 ± 0.40
Table 2. Fatty acid profiles of females and males.
Fatty AcidFemale/%Male/%p
C14:01.92 ± 1.521.71 ± 1.410.39
C15:00.46 ± 0.210.42 ± 0.170.27
C16:025.30 ± 8.3622.45 ± 7.840.13
C17:00.76 ± 0.270.74 ± 0.250.61
C18:04.53 ± 0.944.63 ± 1.440.63
C20:00.08 ± 0.050.08 ± 0.080.87
C21:00.05 ± 0.130.03 ± 0.020.14
C22:00.03 ± 0.050.03 ± 0.070.97
C23:00.04 ± 0.100.02 ± 0.030.20
C24:00.03 ± 0.040.03 ± 0.060.66
ΣSFA33.20 ± 11.6730.14 ± 11.370.35
C14:1n-50.05 ± 0.100.03 ± 0.040.10
C15:1n-50.29 ± 0.270.30 ± 0.260.07
C16:1n-73.39 ± 2.102.78 ± 1.970.09
C17:1n-70.45 ± 0.600.33 ± 0.200.07
C18:1n-96.13 ± 4.124.72 ± 2.850.20
C22:1n-90.27 ± 0.340.20 ± 0.260.13
C24:1n-90.39 ± 0.380.33 ± 0.310.30
C20:10.85 ± 0.600.72 ± 0.600.12
ΣMUFA11.82 ± 8.519.41 ± 6.490.41
C18:2n-61.00 ± 0.351.05 ± 0.310.33
C18:3n-30.26 ± 0.140.31 ± 0.240.22
C18:3n-66.11 ± 1.865.38 ± 2.000.17
C20:20.34 ± 0.290.28 ± 0.130.18
C20:3n-30.56 ± 0.620.54 ± 0.330.66
C20:3n-60.46 ± 0.330.45 ± 0.180.71
ARAC20:4n-67.61 ± 2.958.17 ± 3.040.26
EPAC20:5n-32.42 ± 2.472.80 ± 3.030.41
C22:2n-60.26 ± 0.370.20 ± 0.260.24
DHAC22:6n-335.33 ± 12.9040.68 ± 12.790.10
ΣPUFA54.35 ± 22.2859.86 ± 22.310.08
Table 3. Statistical analysis of the influence of body length on δ13C and δ15N isotopes.
SpeciesIsotopeVariableDegree of FreedomFpDE%
S. japonicusδ13CBL410.090.3337.6%
δ15NBL41.9020.84458.4%
Table 4. Ecological niche width (‰2) and ecological niche overlap (%) for different body length groups.
Body Length (mm)100–130131–160161–190191–220221–250
100–1300.653‰2
131–1600.630.895‰2
161–1900.630.790.901‰2
191–2200.720.550.690.735‰2
221–2500.890.710.700.660.680‰2
Table 5. Fatty acid composition of muscles in different body length groups.
Fatty Acid100–130 mm131–160 mm161–190 mm191–220 mm221–250 mmDFFp
C14:01.26 ± 0.782.34 ± 1.971.82 ± 1.251.34 ± 1.371.26 ± 1.0342.95<0.05 *
C15:00.39 ± 0.170.51 ± 0.160.40 ± 0.130.35 ± 0.170.47 ± 0.2343.30<0.05 *
C16:019.02 ± 4.8925.00 ± 4.2618.92 ± 7.1422.55 ± 5.9024.32 ± 9.2845.23<0.01 **
C17:00.78 ± 0.190.93 ± 0.270.77 ± 0.190.62 ± 0.160.68 ± 0.2446.62<0.01 **
C18:04.36 ± 1.024.93 ± 0.844.69 ± 1.834.35 ± 0.694.75 ± 1.0541.170.33
C20:00.10 ± 0.050.08 ± 0.030.09 ± 0.140.06 ± 0.050.08 ± 0.0540.800.53
C21:00.06 ± 0.170.02 ± 0.010.03 ± 0.040.04 ± 0.060.06 ± 0.0840.680.61
C22:00.03 ± 0.060.02 ± 0.010.04 ± 0.130.02 ± 0.010.04 ± 0.0440.870.49
C23:00.04 ± 0.140.02 ± 0.010.04 ± 0.010.01 ± 0.010.05 ± 0.0540.850.50
C24:00.03 ± 0.050.03 ± 0.010.03 ± 0.010.03 ± 0.030.11 ± 0.1440.820.51
ΣSFA26.07 ± 7.5233.36 ± 6.8526.27 ± 10.6529.37 ± 8.4532.90 ± 13.1345.34<0.05 *
C14:1n-50.04 ± 0.110.02 ± 0.010.03 ± 0.030.03 ± 0.030.11 ± 0.1443.44<0.05 *
C15:1n-50.16 ± 0.230.28 ± 0.190.49 ± 0.330.36 ± 0.190.44 ± 0.3146.51<0.01 **
C16:1n-71.66 ± 1.373.22 ± 1.962.30 ± 1.362.62 ± 0.993.58 ± 2.1245.39<0.01 **
C17:1n-70.26 ± 0.290.34 ± 0.170.34 ± 0.220.30 ± 0.160.69 ± 1.0542.80<0.05 *
C18:1n-92.56 ± 1.624.71 ± 2.784.37 ± 2.194.98 ± 2.186.12 ± 3.0347.43<0.01 **
C22:1n-90.23 ± 0.400.24 ± 0.310.31 ± 0.430.15 ± 0.080.32 ± 0.2846.890.49
C24:1n-90.30 ± 0.330.28 ± 0.190.32 ± 0.390.27 ± 0.230.64 ± 0.6143.84<0.01 **
C20:10.39 ± 0.320.77 ± 0.500.79 ± 0.540.74 ± 0.501.13 ± 0.5946.89<0.01 **
ΣMUFA5.60 ± 4.679.86 ± 6.118.95 ± 5.499.45 ± 4.3613.03 ± 8.1342.34<0.01 **
C18:2n-60.94 ± 0.261.06 ± 0.441.12 ± 0.471.02 ± 0.231.11 ± 0.2041.120.35
C18:3n-30.33 ± 0.330.25 ± 0.180.22 ± 0.140.27 ± 0.150.29 ± 0.1540.910.46
C18:3n-63.45 ± 1.576.66 ± 1.206.26 ± 2.105.81 ± 1.965.60 ± 1.34415.26<0.01 **
C20:20.28 ± 0.200.30 ± 0.130.36 ± 0.280.30 ± 0.140.39 ± 0.3840.890.47
C20:3n-30.84 ± 0.760.48 ± 0.210.65 ± 0.480.52 ± 0.480.50 ± 0.3342.340.06
C20:3n-60.57 ± 0.480.38 ± 0.070.45 ± 0.190.48 ± 0.260.45 ± 0.1541.680.16
ARAC20:4n-67.65 ± 3.608.52 ± 2.158.92 ± 3.459.14 ± 2.067.37 ± 2.7741.530.2
EPAC20:5n-35.10 ± 4.731.90 ± 0.603.40 ± 2.881.96 ± 0.521.58 ± 0.5747.50<0.01 **
C22:2n-60.27 ± 0.450.17 ± 0.180.22 ± 0.270.22 ± 0.410.31 ± 0.3340.590.67
DHAC22:6n-334.96 ± 16.1436.98 ± 8.9242.97 ± 10.9541.18 ± 9.9748.04 ± 8.4445.63<0.01 **
ΣPUFA54.39 ± 28.5356.70 ± 14.0864.12 ± 21.0760.69 ± 15.5665.64 ± 14.6644.59<0.05 *
Notes: * indicates significant difference (p < 0.05), ** indicates highly significant difference (p < 0.01).
Table 6. ANOSIM analysis of fatty acid composition among different length groups.
Body LengthSimilarity CoefficientsRp
GroupA/GroupBBray–Curtis−0.040.03
GroupA/GroupCBray–Curtis0.180.04
GroupA/GroupDBray–Curtis0.210.32
GroupA/GroupEBray–Curtis0.330.23
GroupB/GroupCBray–Curtis0.170.22
GroupB/GroupDBray–Curtis0.160.76
GroupB/GroupEBray–Curtis0.280.48
GroupC/GroupDBray–Curtis0.440.35
GroupC/GroupEBray–Curtis0.490.01
GroupD/GroupEBray–Curtis0.060.22
Notes: GroupA represents 100–130 mm, GroupB represents 131–160 mm, GroupC represents 161–190 mm, GroupD represents 191–220 mm, and GroupE represents 221–250 mm; R > 0 indicates that the between-group difference is greater than the within-group difference, and R < 0 indicates that the between-group difference is less than the within-group difference; p < 0.05 indicates significant differences between or within groups.
Table 7. Results of principal component analysis for different fatty acids.
Fatty AcidPC1PC2
C14:00.35−0.31
C16:00.34−0.21
C18:00.070.74
C16:1n-70.39−0.20
C18:1n-90.380.13
C18:3n-60.350.25
EPAC20:5n-3−0.24−0.24
ARAC20:4n-6−0.28−0.19
DHAC22:6n-3−0.410.08
Table 8. Content and dietary indicators of signature fatty acids across different body length groups.
Signature Fatty AcidCorresponding Sources100–130 mm131–160 mm161–190 mm191–220 mm221–250 mm
C18:1n-9Zooplankton [19]2.56 ± 1.624.71 ± 2.784.37 ± 2.194.98 ± 2.186.12 ± 3.03
C16:1n-7Diatoms [20]1.66 ± 1.373.22 ± 1.962.30 ± 1.362.62 ± 0.993.58 ± 2.12
DHAC22:6n-3Fish [20]34.96 ± 16.1436.98 ± 8.9242.97 ± 10.9541.18 ± 9.9748.04 ± 8.44
ARAC20:4n-6Crustacea [7]7.65 ± 3.608.52 ± 2.158.92 ± 3.459.14 ± 2.067.37 ± 2.77
EPAC20:5n-3Krill [26]5.10 ± 4.731.90 ± 0.603.40 ± 2.881.96 ± 0.521.58 ± 0.57
C18:3n-3
C18:2n-6
Green Algae [27]0.94 ± 0.26/
0.94 ± 0.26
1.06 ± 0.44/
0.25 ± 0.18
1.12 ± 0.47/
0.22 ± 0.14
1.02 ± 0.23/
0.27 ± 0.15
1.11 ± 0.20/
0.29 ± 0.15
C15:0
C17:0
Planktonic Bacteria [28]0.39 ± 0.17/
0.78 ± 0.19
0.51 ± 0.16/
0.93 ± 0.27
0.40 ± 0.13/
0.77 ± 0.19
0.35 ± 0.17/
0.62 ± 0.16
0.47 ± 0.23/
0.62 ± 0.16
Disclaimer/Publisher’s Note: The statements, opinions and data contained in all publications are solely those of the individual author(s) and contributor(s) and not of MDPI and/or the editor(s). MDPI and/or the editor(s) disclaim responsibility for any injury to people or property resulting from any ideas, methods, instructions or products referred to in the content.

