Article

Research on Aerodynamic Characteristics of Three Offshore Wind Turbines Based on Large Eddy Simulation and Actuator Line Model

1
State Key Laboratory of Ocean Engineering, School of Ocean and Civil Engineering, Shanghai Jiao Tong University, Shanghai 200240, China
2
China Shipbuilding NDRI Engineering Co., Ltd., Shanghai 200090, China
3
Shanghai Engineering Research Center of Ocean & Shipbuilding Maritime Engineering, Shanghai 200090, China
4
Foshan Green Intelligent Manufacturing Institute, Xiangtan University, Foshan 528000, China
5
College of Civil Engineering, Xiangtan University, Xiangtan 411105, China
*
Author to whom correspondence should be addressed.
J. Mar. Sci. Eng. 2024, 12(8), 1341; https://doi.org/10.3390/jmse12081341
Submission received: 15 June 2024 / Revised: 23 July 2024 / Accepted: 5 August 2024 / Published: 7 August 2024
(This article belongs to the Section Ocean Engineering)

Abstract

:
Investigating the aerodynamic performance and wake characteristics of wind farms under different levels of wake effects is crucial for optimizing wind farm layouts and improving power generation efficiency. The Large Eddy Simulation (LES)–actuator line model (ALM) method is widely used to predict the power generation efficiency of wind farms composed of multiple turbines. This study employs the LES-ALM method to numerically investigate the aerodynamic performance and wake characteristics of a single NREL 5 MW horizontal-axis wind turbine and three such turbines under different wake interaction conditions. For the single turbine case, the results obtained using the LES-ALM method were compared with the existing literature, showing good agreement and confirming its reliability for single turbine scenarios. For the three-turbine wake field problem, considering the aerodynamic performance differences under three cases, the results indicate that spacing has a minor impact on the power coefficient and thrust coefficient of the middle turbine but a significant impact on the downstream turbine. For staggered three-turbine arrangements, unilateral turbulent inflow to the downstream turbine causes significant fluctuations in thrust and torque, while bilateral turbulent inflow leads to more stable thrust and torque. The presence of two upstream turbines causes an acceleration effect at the inflow region of the downstream single turbine, significantly increasing its power coefficient. The findings of this study can provide methodological references for reducing wake effects and optimizing the layout of wind farms.

1. Introduction

Offshore wind energy, as a form of renewable and clean energy, has broad development prospects [1,2,3]. China boasts abundant offshore wind energy resources and significant development potential [4]. Developing offshore wind energy is of great importance for ensuring national energy security and achieving the goals of “peak carbon dioxide emissions” and “carbon neutrality” [5].
Offshore wind farms are the primary equipment for harnessing offshore wind energy. However, due to the wake effect of wind turbines, the airflow passing through upstream turbines slows down behind the turbines, reducing the power generation efficiency of the downstream turbines. The wake effect can lead to a total power generation loss of up to 20% in a typical wind farm [6]. Therefore, reducing the impact of the wake effect on the overall power generation of wind farms to increase total power output has become an important research topic.
The wake interaction mechanism in wind farms has been a research focus in recent years. Reddy [7] proposed a wind farm layout optimization framework, combining it with a single-objective hybrid optimization algorithm for wind farm layout optimization, effectively reducing the impact of the wake effect and improving wind farm power efficiency. Wu et al. [8] compared the effects of different inflow conditions and wind farm layouts on the degree of wake interaction and overall power efficiency of wind farms. Antonini et al. [9] proposed a method for optimizing wind farm layouts that allows CFD models to accurately simulate terrain-induced wake effects, achieving optimized wind farm layouts on complex terrains. Rezaeiha et al. [10] studied the power fluctuations and wake interaction of two tandem floating wind turbines under surge conditions using the actuator disk model. Wang et al. [11] conducted numerical simulations based on the actuator line model to study the wake field of three NREL 5 MW wind turbines arranged in tandem with varying distances, discovering the patterns of power and wake variations with changing distances between the three turbines.
Currently, actuator-based methods using computational fluid dynamics (CFD), such as the LES-ALM (Large Eddy Simulation–actuator line model) method, are widely used to predict wind farm power efficiency under various wake interaction conditions. Strijhak et al. [12] conducted numerical simulations on a wind farm consisting of 14 wind turbines using the ALM method. Zhang et al. [13] used the Unsteady Reynolds-averaged RANS turbulence model and a CFD grid with tens of millions of cells to simulate the power generation and wake characteristics of a dual-rotor floating wind turbine. Guggeri et al. [14] employed the LES-ALM method to simulate a real 7.7 MW onshore wind farm under different wind conditions. By comparing the simulation results with actual wind farm monitoring data, they confirmed that the LES-ALM method can accurately simulate the power efficiency of wind farms under multi-turbine wake interaction conditions with moderate computational costs. Tu et al. [15] used the LES-ALM method with a multi-million-cell grid to simulate the power loss due to wake effects for two tandem wind turbines under different yaw angles and spacings. Xu et al. [16] quantitatively studied the mechanical response of offshore wind turbines under complex atmospheric inflow conditions using the LES-ALM method. Bai et al. [17] simulated the wake field of three staggered wind turbines in an atmospheric boundary layer using the actuator line model and found that vertically staggered turbine arrangements can effectively enhance the power generation of downstream turbines.
In summary, the LES-ALM method has gained favor among researchers for its ability to accurately predict the power efficiency of multiple wind turbines under wake interaction conditions in large wind farms. However, there is limited research on the aerodynamic performance and wake characteristics of wind farms under different types of wake interaction. Further research in this area is important for predicting wind farm power efficiency and minimizing wake interaction, thus optimizing wind farm layout plans, and is worth deeper exploration.
This study considers a three-turbine array as the basic unit of an offshore wind farm, examining the wake conditions under full wake and staggered conditions. This approach helps to understand the relationship between key power generation parameters and wake inflow, aiding in the prediction of wake effects and power efficiency for the entire wind farm. However, there is still limited research on the aerodynamic loads and wake effects of three-turbine arrays, which this study aims to address.
Toosi et al. [18] also investigated the aerodynamic performance and wake characteristics of three wind turbines based on the LES-ALM method. But the differences between our work and their work in the above paper are as follows: 1. Research Focus: Our work aims to investigate the impact of wake interaction effects on three wind turbines under different layout cases, including three tandem turbines with varying spacing ratios, and three turbines in staggered configurations, whereas the referenced paper focused on the wake effects of three tandem turbines caused by yaw and tilt control methods. 2. Research Content: Our research further analyzes the force characteristics of three turbines, while this part was not included in referenced paper. 3. Application: The referenced paper applies to the optimization of yaw and tilt control, while our work can provide references for layout optimization.
The framework of this paper is as follows: First, the aerodynamic characteristics of a single turbine are validated by comparing the LES-ALM method with literature results. Then, the power efficiency and flow field characteristics of three turbine arrays under three different cases (full wake and staggered conditions) are compared. Finally, the LES-ALM method is used to study the unsteady mechanical characteristics of each turbine in the three-turbine arrays under different cases. This research provides a methodological reference for predicting wind farm power efficiency and optimizing layout plans.

2. Numerical Method

LES-ALM Method
This study utilizes the LES-ALM (Large Eddy Simulation–actuator line model) method [19] in the open-source software OpenFOAM-4.0.x [20] to analyze the aerodynamic performance and flow field characteristics of a three-turbine array. The model employs Large Eddy Simulation to solve the flow field problems around the wind turbines. The filtered incompressible Navier–Stokes equations are as follows:
u ˜ i x i = 0
u ˜ i t + u ˜ j u ˜ i x j = 1 ρ p ˜ x i + v x j u ˜ i x j τ i j x j + f i
In Equations (1) and (2), u i and p represent the velocity and pressure, respectively, while · ˜ denotes the resolved flow quantities. ρ and v represent the air density and kinematic viscosity, respectively. τ i j represents the subgrid-scale (SGS) stress tensor. The f i term denotes the body force applied to the flow field by the wind turbine. Equations (1) and (2) are solved using the PimpleFoam incompressible transient flow solver in OpenFOAM, which has been applied in numerous fluid flow studies [21,22,23].
The actuator line model is used to calculate the body force f i at each actuator point of the wind turbine. The ALM discretizes the blade along the radial direction into a series of two-dimensional airfoil sections, with each section’s quarter-chord point referred to as an actuator point. The body force at each actuator point can be expressed as:
f = ( L , D ) = 1 2 ρ c U rel 2 d r ( C l e L + C d e D )
where c is the chord length of the local airfoil section, and U r e l = U Ω 2 + U w i n d 2 is the relative wind speed with respect to the blade. C l is the lift coefficient of the local airfoil, and C d is the drag coefficient of the local airfoil, both of which can be pre-calculated based on the angle of attack of the relative wind speed. To avoid numerical singularities, a Gaussian weighting function is embedded in the ALM, as shown in Equation (4), to apply the actuator force back into the flow field:
η ϵ ( d ) = 1 ϵ 3 π 3 / 2 exp [ ( d ϵ ) 2 ]
Thus, the body force at the flow field point (x, y, z) is:
f ϵ , i ( x   ,   y   ,   z   ,   t   ) = f η ϵ = i = 1 N f ( x i   , y i   ,   z i   ,   t i   ) 1 ϵ 3 π 3 2 exp [ ( d i ϵ ) 2 ]
In Equation (5), d is the distance between the measurement point and the actuator point on the blade. ϵ is a parameter that adjusts the concentration of the distributed load, and it is set to twice the local grid size [24].

3. Verification and Validation

3.1. Single Turbine Parameter Settings

This study investigates the aerodynamic characteristics of a single wind turbine using the LES-ALM method. A time step of Δt = 0.024 s is set to ensure Co ≤ 0.2 (where Co, the Courant number, is the ratio of the fluid displacement within the time step to the mesh unit length in a rectangular mesh), ensuring computational convergence [25]. The simulation is carried out for at least 100 rotor revolutions, with a total duration of 500 s. The stable simulation results from the 50th to 100th rotor revolutions are used to analyze the aerodynamic performance and flow field characteristics. All the results were obtained when CP reached the stabilization stage, indicating the wake and vortices were fully developed in the calculation.
The inlet boundary condition is defined with a uniform velocity at the rated wind speed U = 11.4 m/s and a zero-gradient inlet velocity. The pressure of the outlet boundary is set to p = 0 Pa. All other boundaries are specified as slip boundaries. The air density ρ is set to 1.224 kg/m3. Furthermore, both the wind shear and turbulence intensity are assumed to be zero.
This study employs the actuator line model (ALM) to conduct Large Eddy Simulations (LESs) of the flow over three wind turbines, aiming to understand the impact of wake effects on wind farms under different layout cases from the perspectives of aerodynamic performance and wake dynamics. We focus on an idealized setup, ignoring the influence of the atmospheric boundary layer. This simplification allows us to clearly evaluate the sole impact of the layout.
This study utilizes the NREL 5 MW wind turbine [26] (see Figure 1), with the main technical parameters of the turbine listed in Table 1. The blade of the NREL 5 MW wind turbine is discretized along the radius into 19 elements using the actuator line model. The LES-ALM method used in this study does not consider the wind turbine hub and tower [15]. The power coefficient CP of the NREL 5 MW wind turbine is defined by the formula CP = P/(ρU3 A/2), where P is the generated power of the turbine, and the thrust coefficient CT is defined by the formula CT = T/(ρU2 A/2), where T is the thrust force experienced by the turbine, and A = πR2 represents the circular area swept by the turbine blade.

3.2. Results of the Mesh Independence Test

The quality of the mesh in the LES-ALM method significantly affects the accuracy of the simulation results. Therefore, a mesh independence test is necessary to verify the computational accuracy and precision [27]. By only changing the mesh density of the computational domain, the following three mesh density schemes were set: “coarse mesh”, “medium mesh”, and “fine mesh”.
The comparison of the power coefficient CP calculated for different grid schemes with a tip speed ratio λ = 7 for a single turbine is shown in Table 2. In the table, Δg represents the mesh size around the turbine blades. It can be seen that as the mesh density increases, the obtained CP gradually approaches the result of the fine mesh scheme. When the number of meshes is 6.52 × 10⁶, the predicted CP has a relative difference of 0.64% compared to the “fine mesh” result, which is almost negligible. Therefore, considering the requirements for both the number of meshes and the computational accuracy, the mesh density for all LES-ALM method cases in this study is based on the “medium mesh” scheme.

3.3. Comparison and Validation with Existing Literature Results

To validate the computational effectiveness of the LES-ALM method, OpenFOAM-4.0.x opensource software platform was used with uniform inflow conditions and other environmental parameters controlled to match those in the related literature [15,28,29]. The resulting velocity profiles of the wake from a single turbine at (a) x/D = 3, (b) x/D = 5, (c) x/D = 4 are shown in Figure 2. The LES-ALM method simulation results, RANS results [29], results obtained by LES-ALM in other studies [15], and results obtained by LES-ADM in other studies [30] were compared. It can be observed that the streamwise velocity profiles for the LES-ALM method exhibit a “W” shape. Due to the absence of modeling the turbine hub and tower in our LES-ALM method, a significant discontinuity in the streamwise velocity occurs at y = 0 [14]. Furthermore, there is not a significant change in the streamwise velocity in the LES-ALM method results. The LES-ALM method results from our work align closely with those obtained using LES-ALM in other studies.
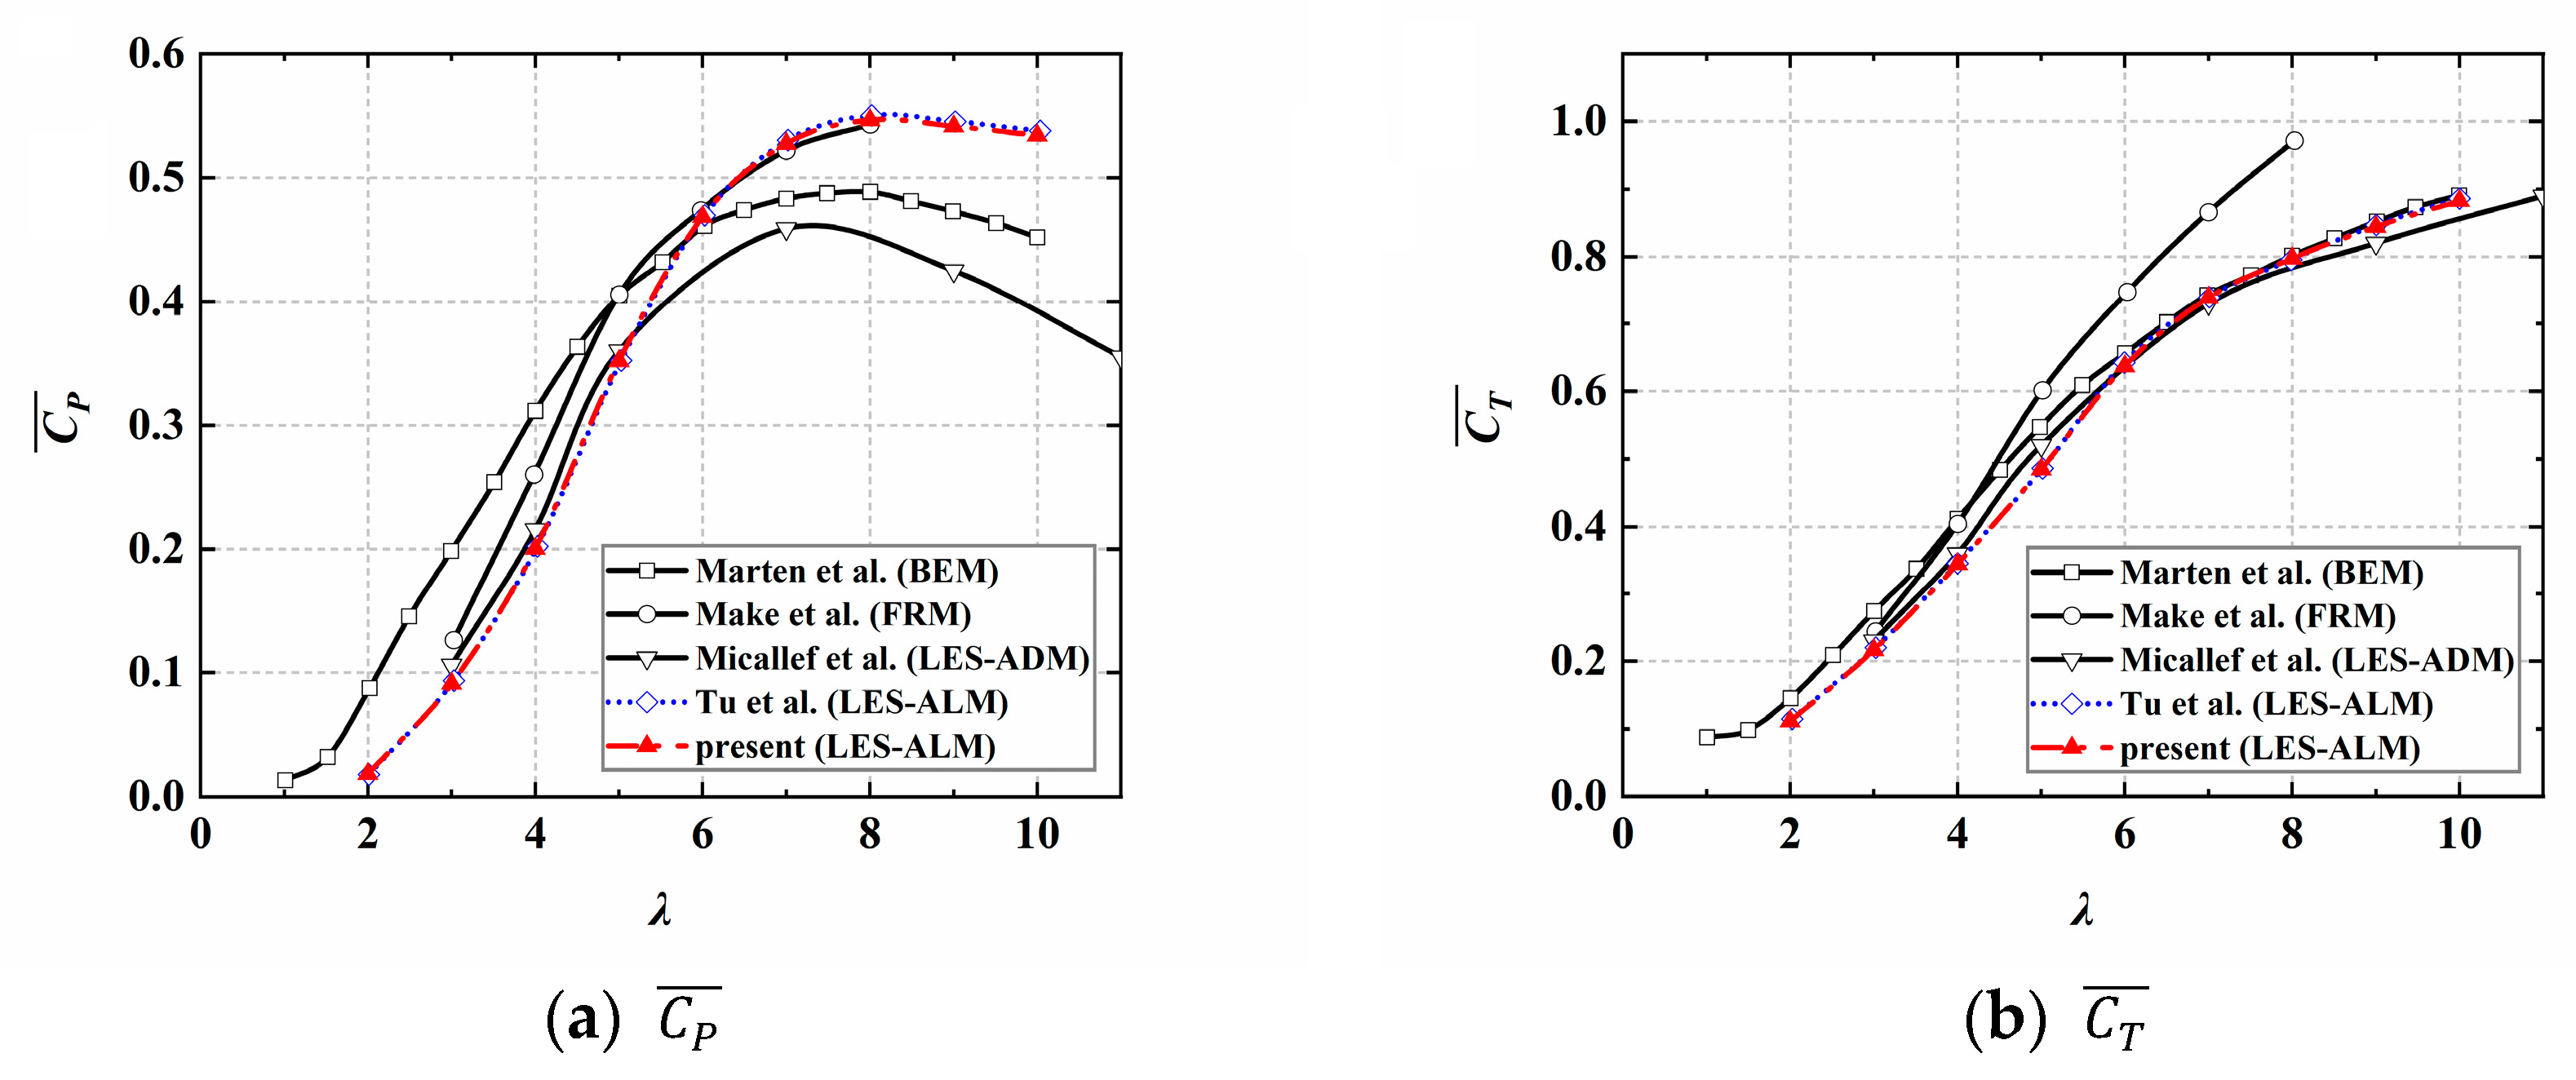
Figure 3a,b show the data results for the power coefficient CP and thrust coefficient CT of a single NREL 5 MW turbine at varying tip speed ratios (TSR), obtained by the LES-ALM method from our work and other methods, such as LES-ALM [15], blade element momentum (BEM) theory [30], fully resolved mesh (FRM) [31], and LES-actuator disk model (LES-ADM) [32]. It can be observed that the CP predicted by the LES-ALM method is consistent with the FRM method results, with better agreement at TSR values higher than 6. Due to the absence of modeling the turbine hub and tower in our LES-ALM method, there are some differences between the CP obtained by the LES-ADM and LES-ALM method at high TSR values. At lower TSR values, the CP obtained by the LES-ALM method tends to be underestimated compared to the FRM and BEM method results. The CT predicted by the LES-ALM method is consistent with the BEM method and LES-ADM method, with better agreement at TSR values higher than 6. Therefore, in the subsequent study, the TSR of the NREL 5 MW turbine is controlled at 8 to ensure the accuracy of the simulation data. In summary, a comparison of results calculated using the LES-ALM method with those obtained from various other methods shows good agreement, demonstrating the accuracy of the LES-ALM method in predicting CP and CT for a single turbine.

4. Three-Turbine Array Configuration

4.1. Three-Turbine Configuration and Computational Domain Grid Division under Full Wake Cases

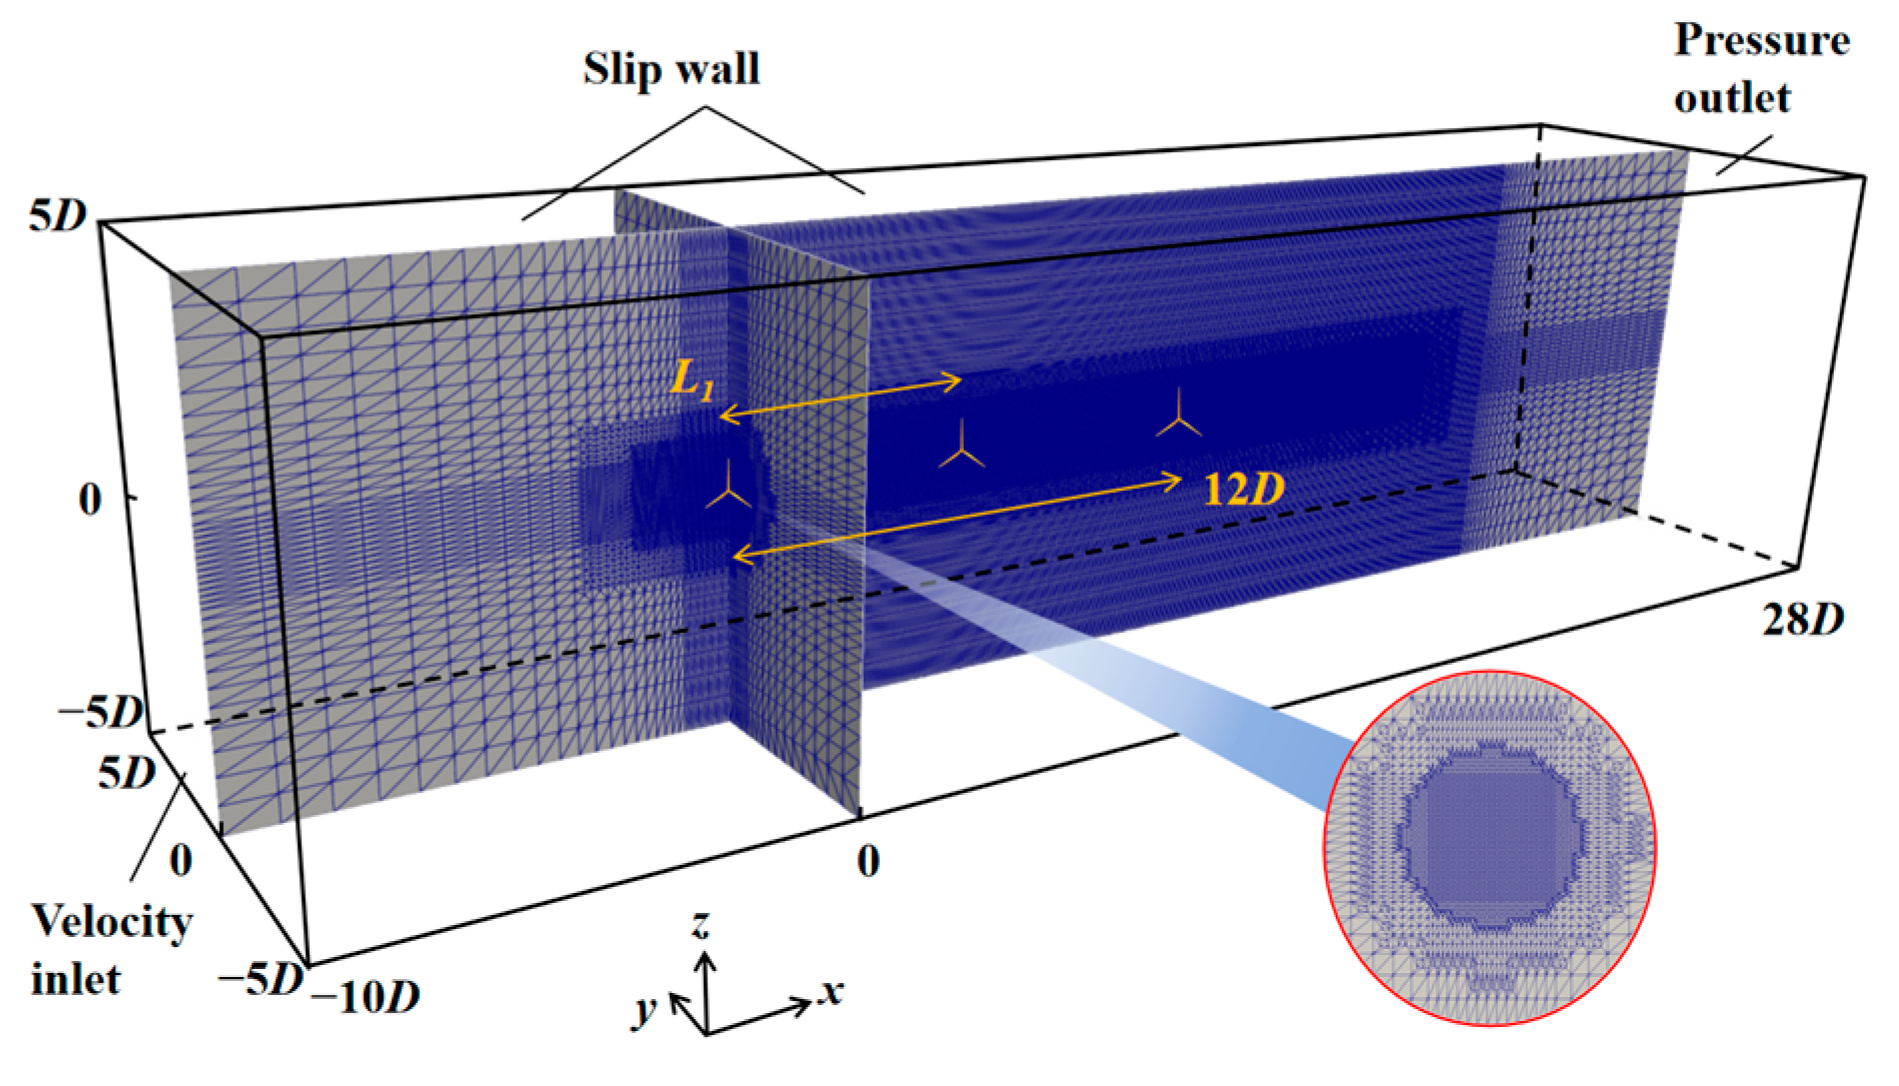
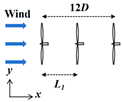
A tandem layout of three turbines is used to study the wind farm power efficiency under the full wake case. The corresponding mesh generated by OpenFOAM’s blockMesh and refineMesh tools is shown in Figure 4. The three NREL 5 MW turbines are arranged in series within a rectangular computational domain, with a length of 38D (D being the rotor diameter) along the X direction and a width of 10D. The length of the refined area around the cylindrical region surrounding the turbines is 20D along the X direction, and the diameter of the cylinder’s base is 5D, corresponding to a blockage ratio of 0.78%.
The hub center of the first turbine (WT1) is located at (X, Y, Z) = (0, 0, 0), while the hub center of the second turbine (WT2) is located at (L1, 0, 0), where L1 is the distance between the hub centers of WT1 and WT2 along the X direction. The hub center of the third turbine (WT3) is located at (L1 + L2, 0, 0), where L2 is the distance between the hub centers of WT2 and WT3 along the X direction. The sum of L1 and L2 is maintained at 12D, with only the value of L1 being varied. The tip speed ratio for all three turbines is set to 8. A zero-gradient condition is applied to the velocity at the outlet, where a reference pressure p = 0 is applied. The rest of the boundaries are set as slip. The turbine hub, tower, and ground effects are not considered in our work.

4.2. Cases of Three Turbines under Staggered Arrangement

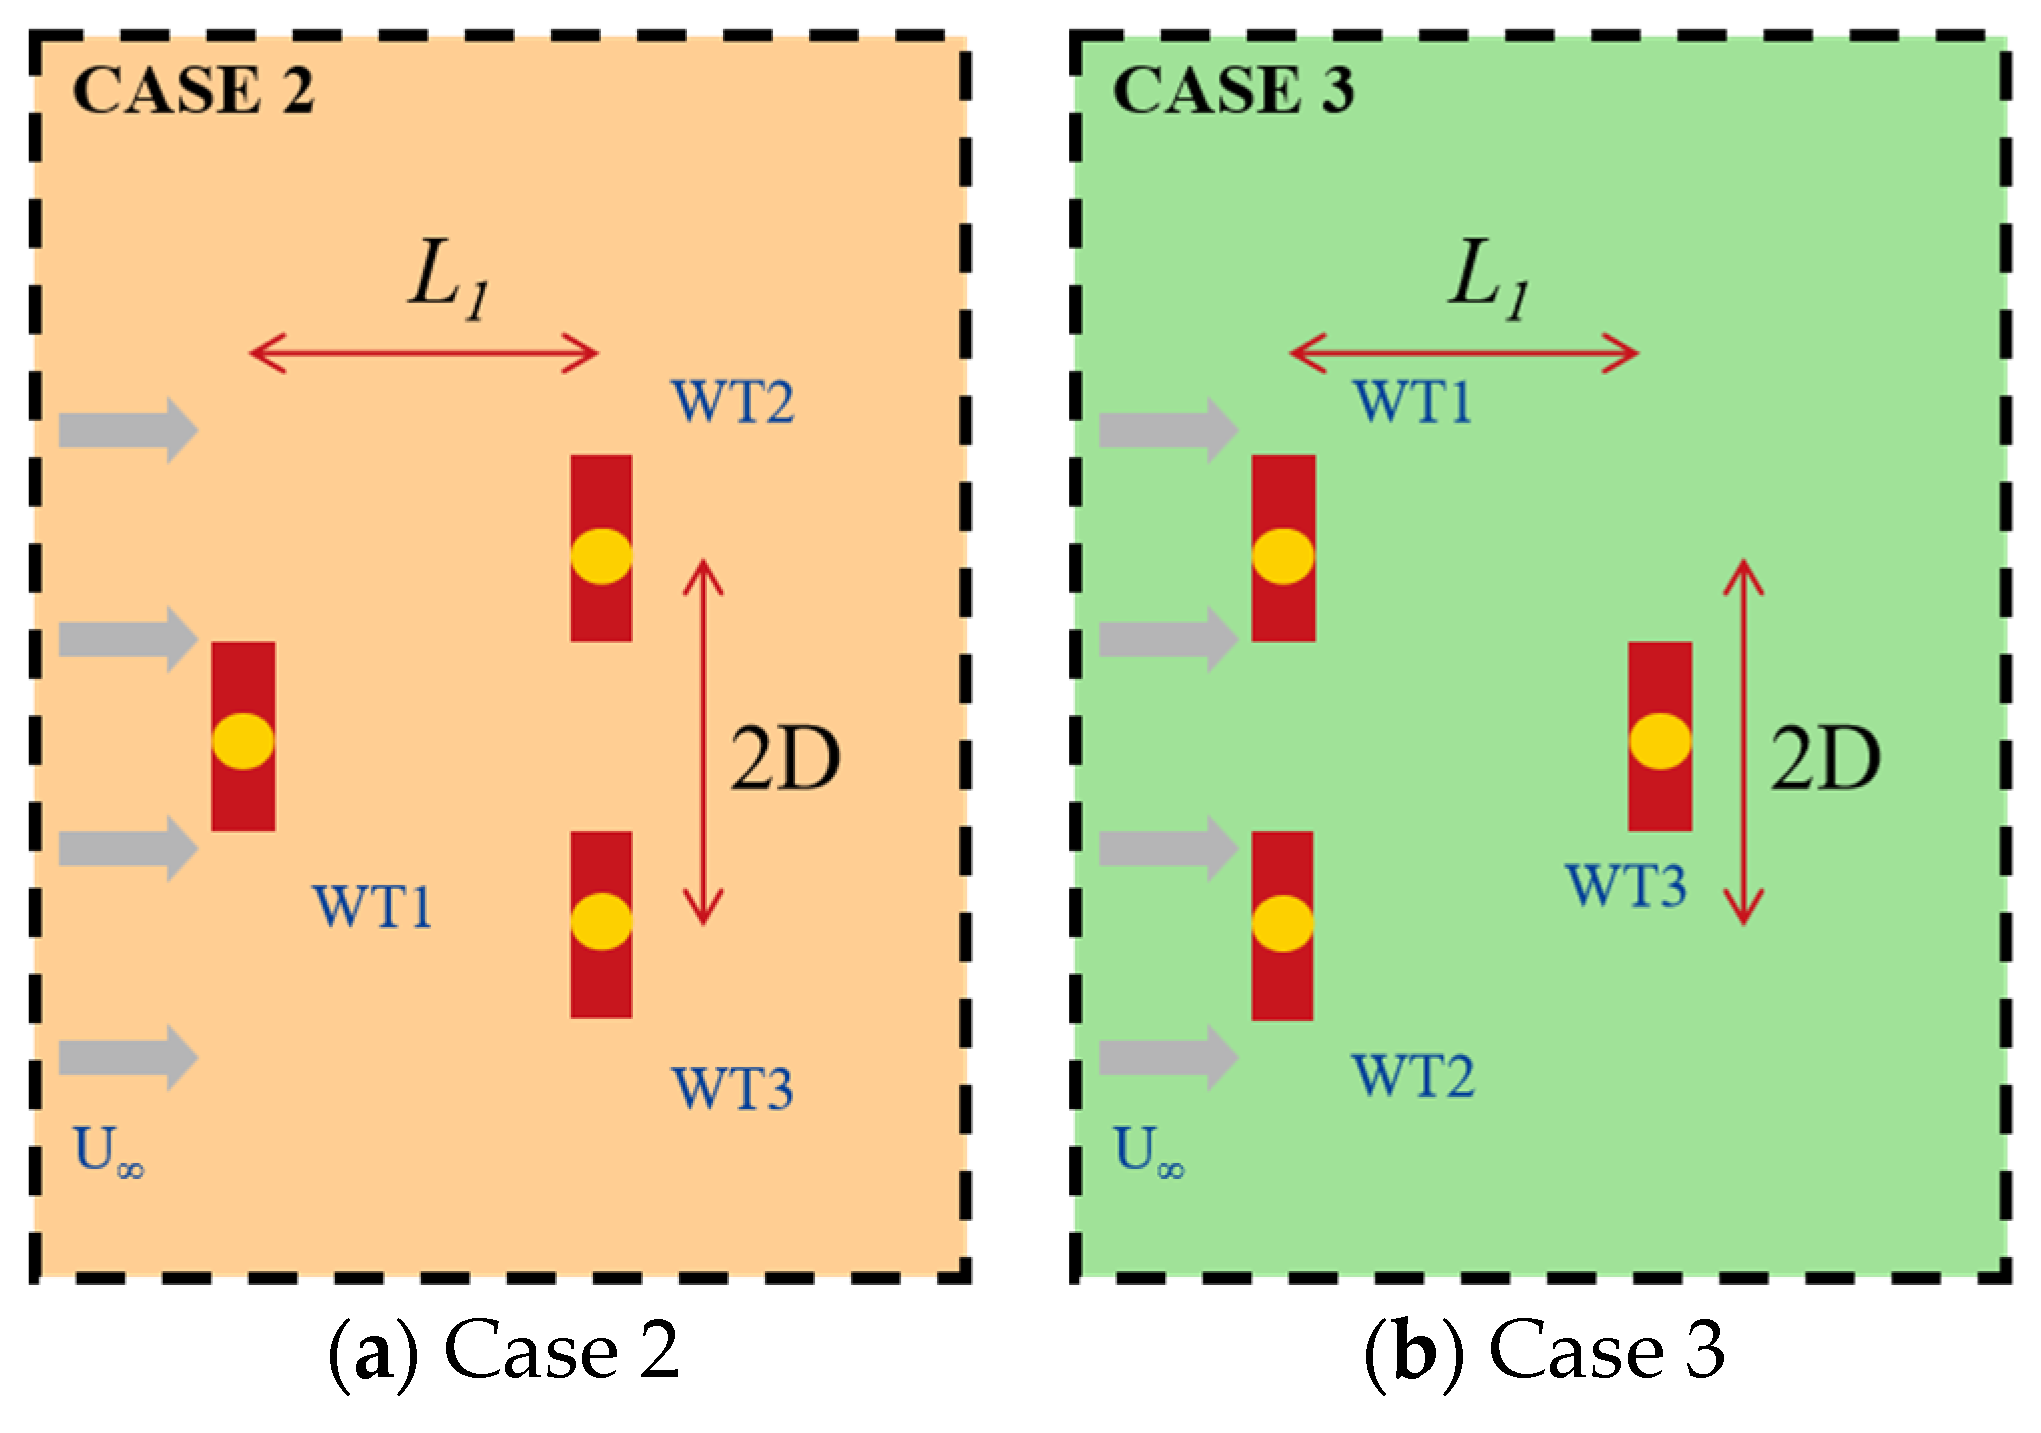
Figure 5 shows the two staggered cases of the three turbines used in this study. In Case 2, WT1 is placed upstream, with the turbine hub center located at (X, Y) = (0, 0) on the 2D projection plane. The hub centers of WT2 and WT3 are located at (L1, 126) and (L1, −126), respectively. In Case 3, WT1 and WT2 are placed upstream, with their hub centers at (0, −126) and (L1, 126), respectively. The hub center of WT3 is located at (L1, 0). In both cases, the inflow wind is set to uniform inflow along the X direction, U = 11.4 m/s. The setting of the inflow condition for this case is the same as that for the full wake case. And L1 is the distance in the X direction between the upstream and downstream turbines.
Table 3 summarizes the three-turbine cases using the LES-ALM method. Case 1 features a tandem layout with L1 varying from 4D to 7D in intervals of 0.5D. Cases 2 and 3 feature staggered layouts with a lateral offset of 2D, and L1 varies from 4D to 6D in intervals of 0.5D.

5. Comparative Analysis of Three-Turbine Simulation Results

5.1. Three Turbines under Full Wake Conditions

5.1.1. Comparison of Aerodynamic Performance Results

Using the LES-ALM method, the variations in CP and CT of three tandem turbines under full wake conditions with respect to the distance L1 between the turbines are shown in Figure 6a,b. It can be seen that the value of L1 has a negligible impact on the CP and CT of the middle turbine WT2, as WT2 experiences a significant reduction in CP and CT due to the wake effect from the upstream turbine. The CP and CT of WT3 gradually decrease as L1 increases. The reasons for these trends will be explained later. Variation in the power ratio with the spacing ratio of three tandem turbines under full wake conditions based on real offshore wind farm data and data from other studies are shown in Figure 6c. The results are consistent with findings in the related literature using the LES-ALM method [15,18,33]. Additionally, the results we obtained are consistent with the actual measurements in terms of trends, further validating the reliability of the simulations in this study.

5.1.2. Comparison of Wake Characteristics Results

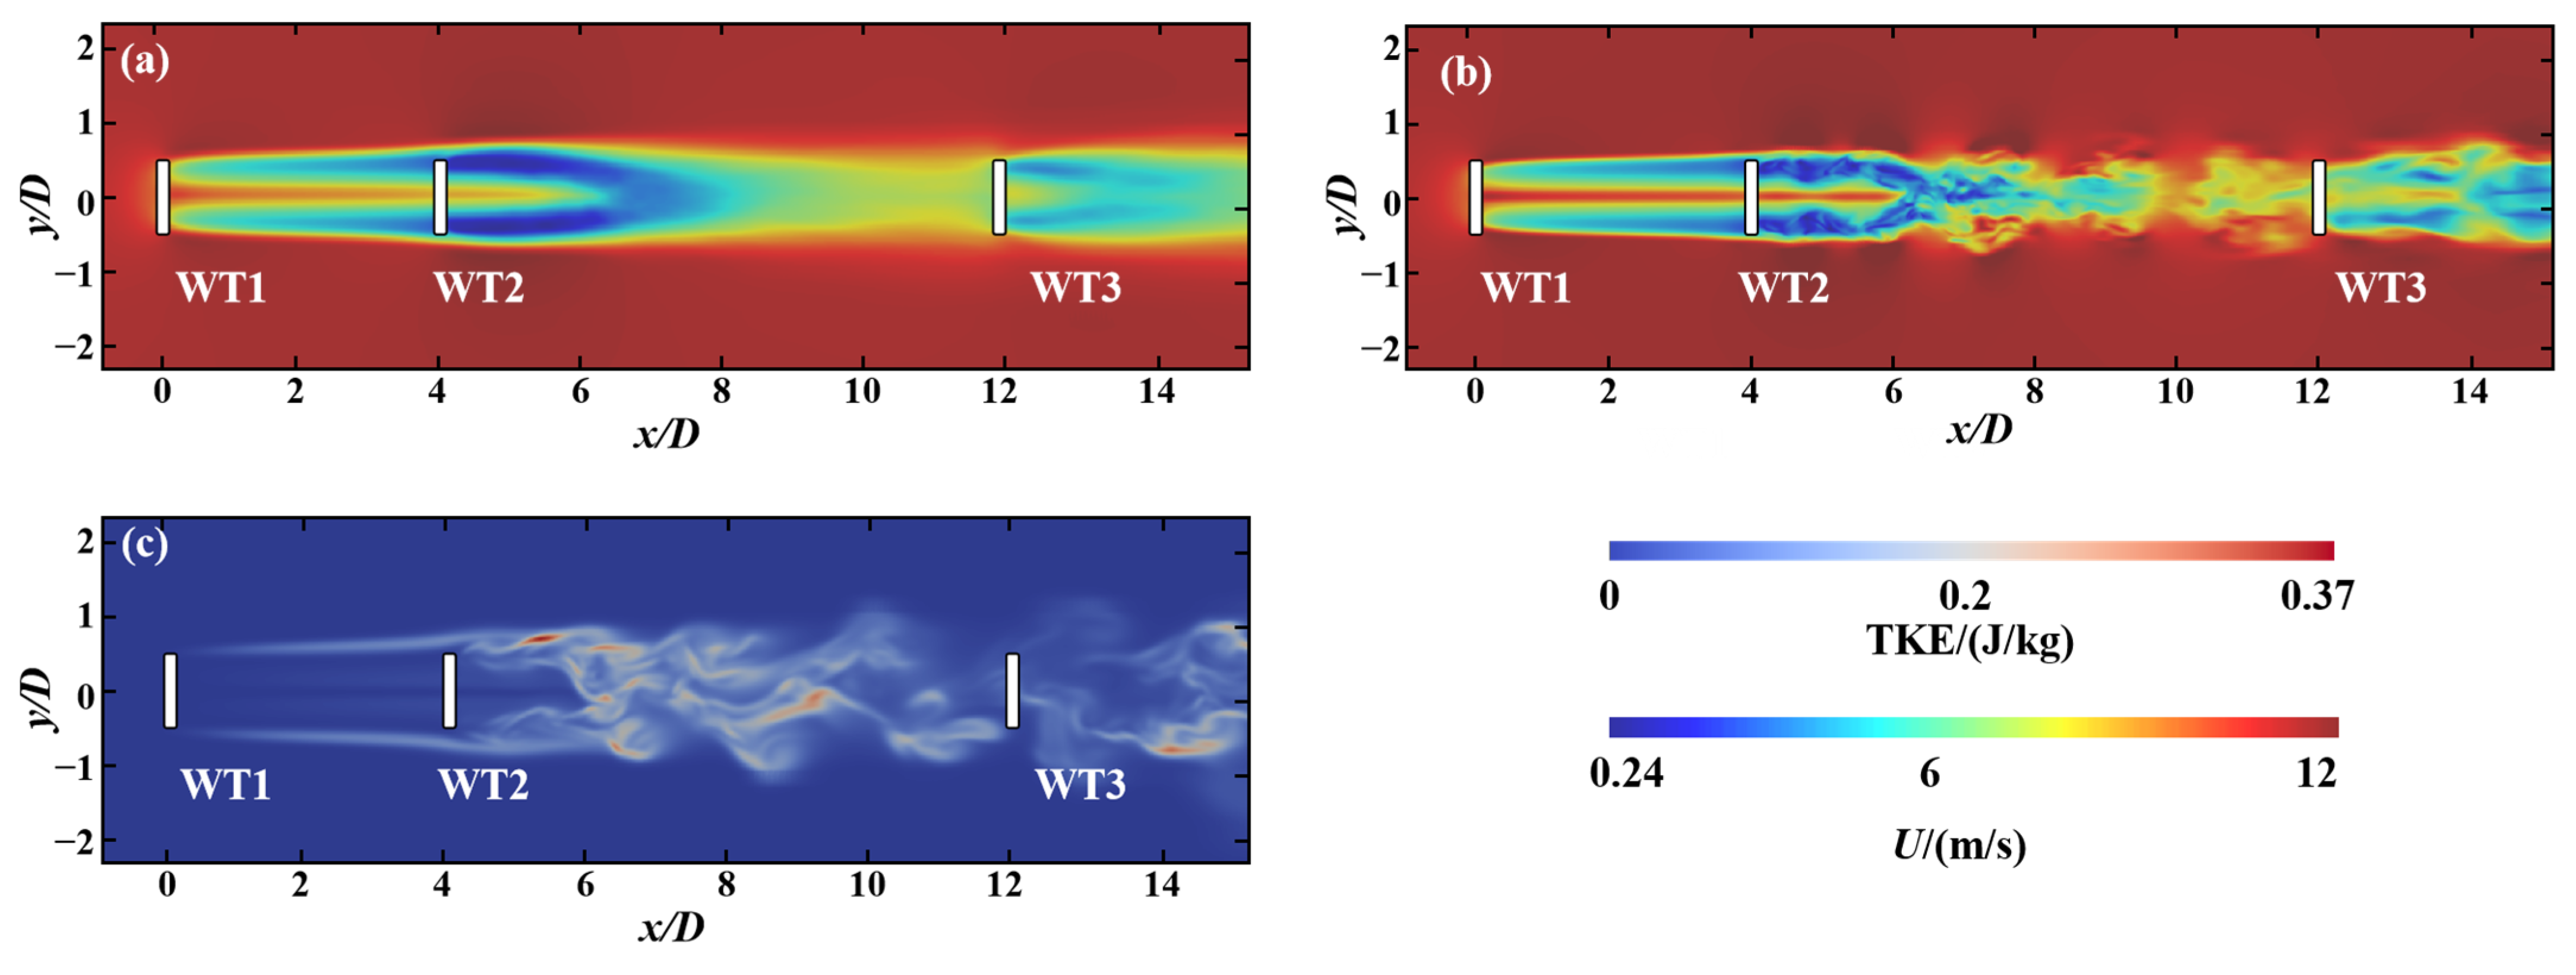
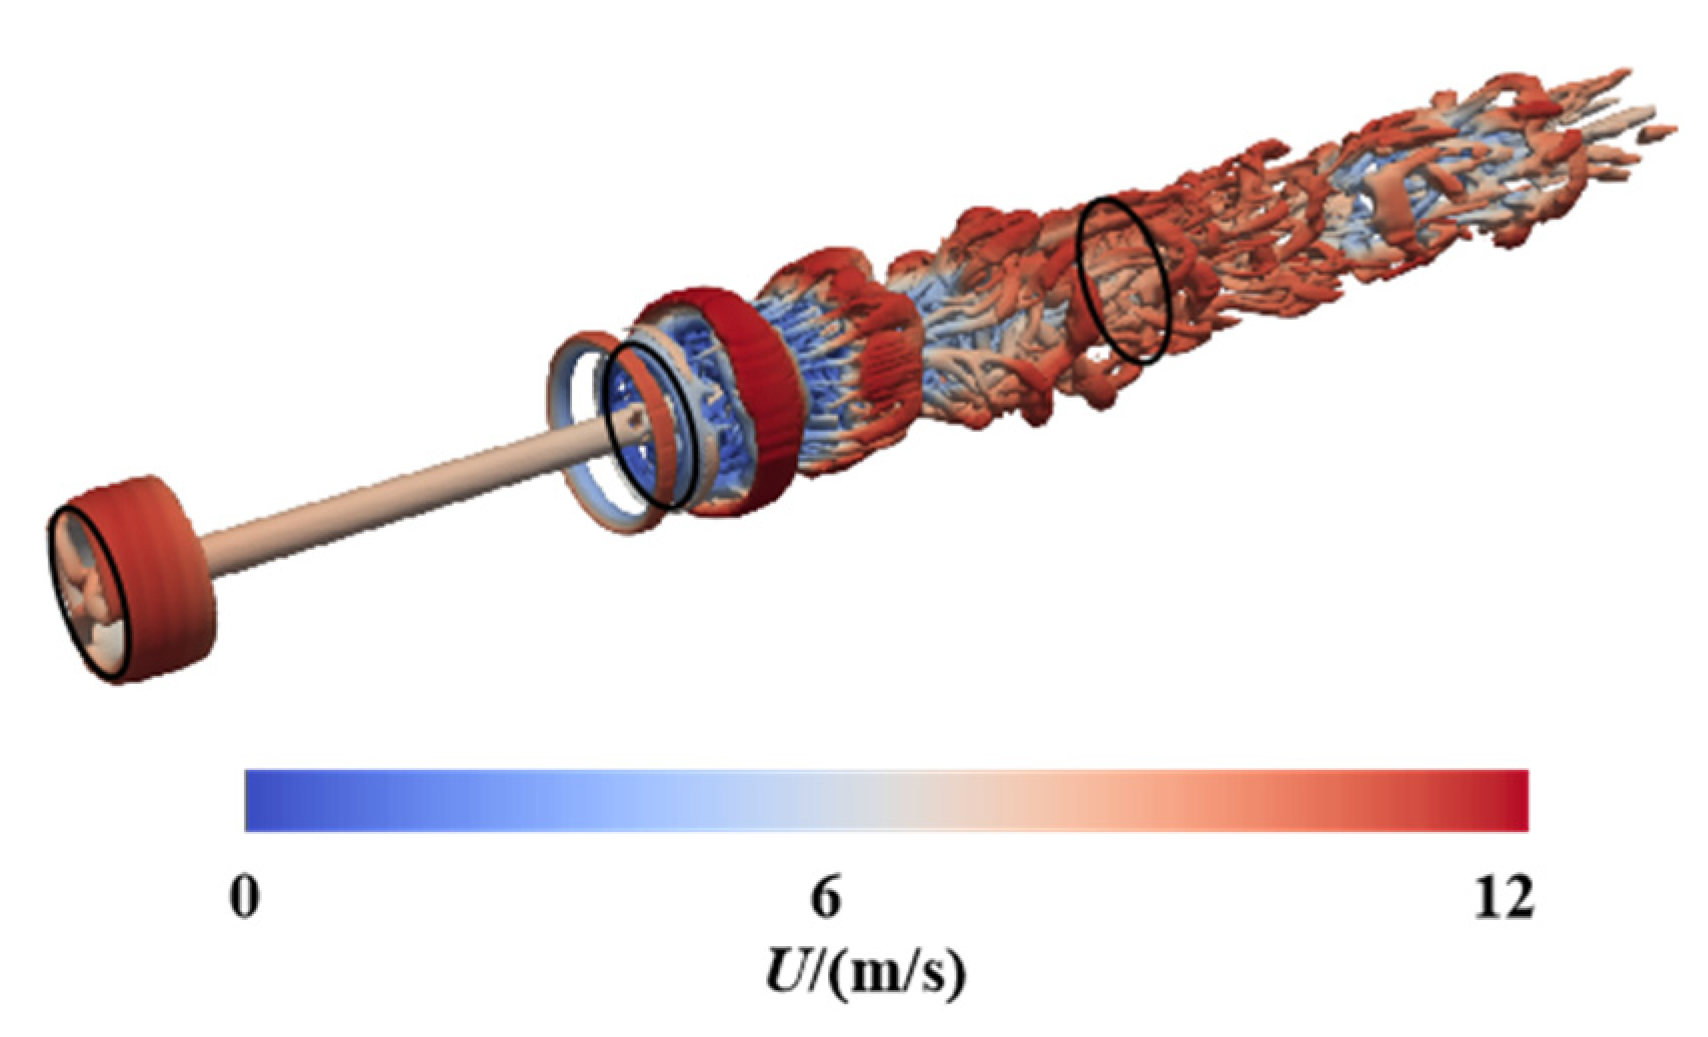
Next, we analyze the wake profiles of the three turbines to explain the aerodynamic calculation results. Simulations are conducted with L1 = 4D. Figure 7a shows the mean flow field distribution of the tandem three turbines, Figure 7b shows the flow field distribution at 400 s, and Figure 7c shows the corresponding turbulence kinetic energy. It can be observed that the wake width at the inflow of WT3 is significantly reduced, with notable wake recovery, while WT2 is completely under the wake of WT1. The turbulence kinetic energy at the inflow of WT2 is relatively low, and as the distance in the X direction increases, the turbulence kinetic energy of WT1’s wake does not change significantly, while the turbulence kinetic energy at the inflow of WT3 is relatively high. This explains why the mean CP and CT of WT3 are greater than those of WT2 and why the corresponding data for WT2 change little with distance D. Figure 8 shows a 3D vortex structure of the tandem three turbines at 400 s based on the Q-criterion. It can be seen that the near wake of the upstream turbine is mainly composed of helical vortices shed from the blade tips. When the upstream wake reaches the plane of the middle turbine, a ring vortex forms around the rotor and then breaks down in the far wake, explaining why WT3 is significantly affected by the distance change. A large amount of scattered vortex structures from the upstream and middle turbine wakes impact the downstream turbine. The inflow wind to the midstream turbine has fewer vortex structures and is more stable, while the inflow wind to the downstream turbine has more vortex structures and is less stable.
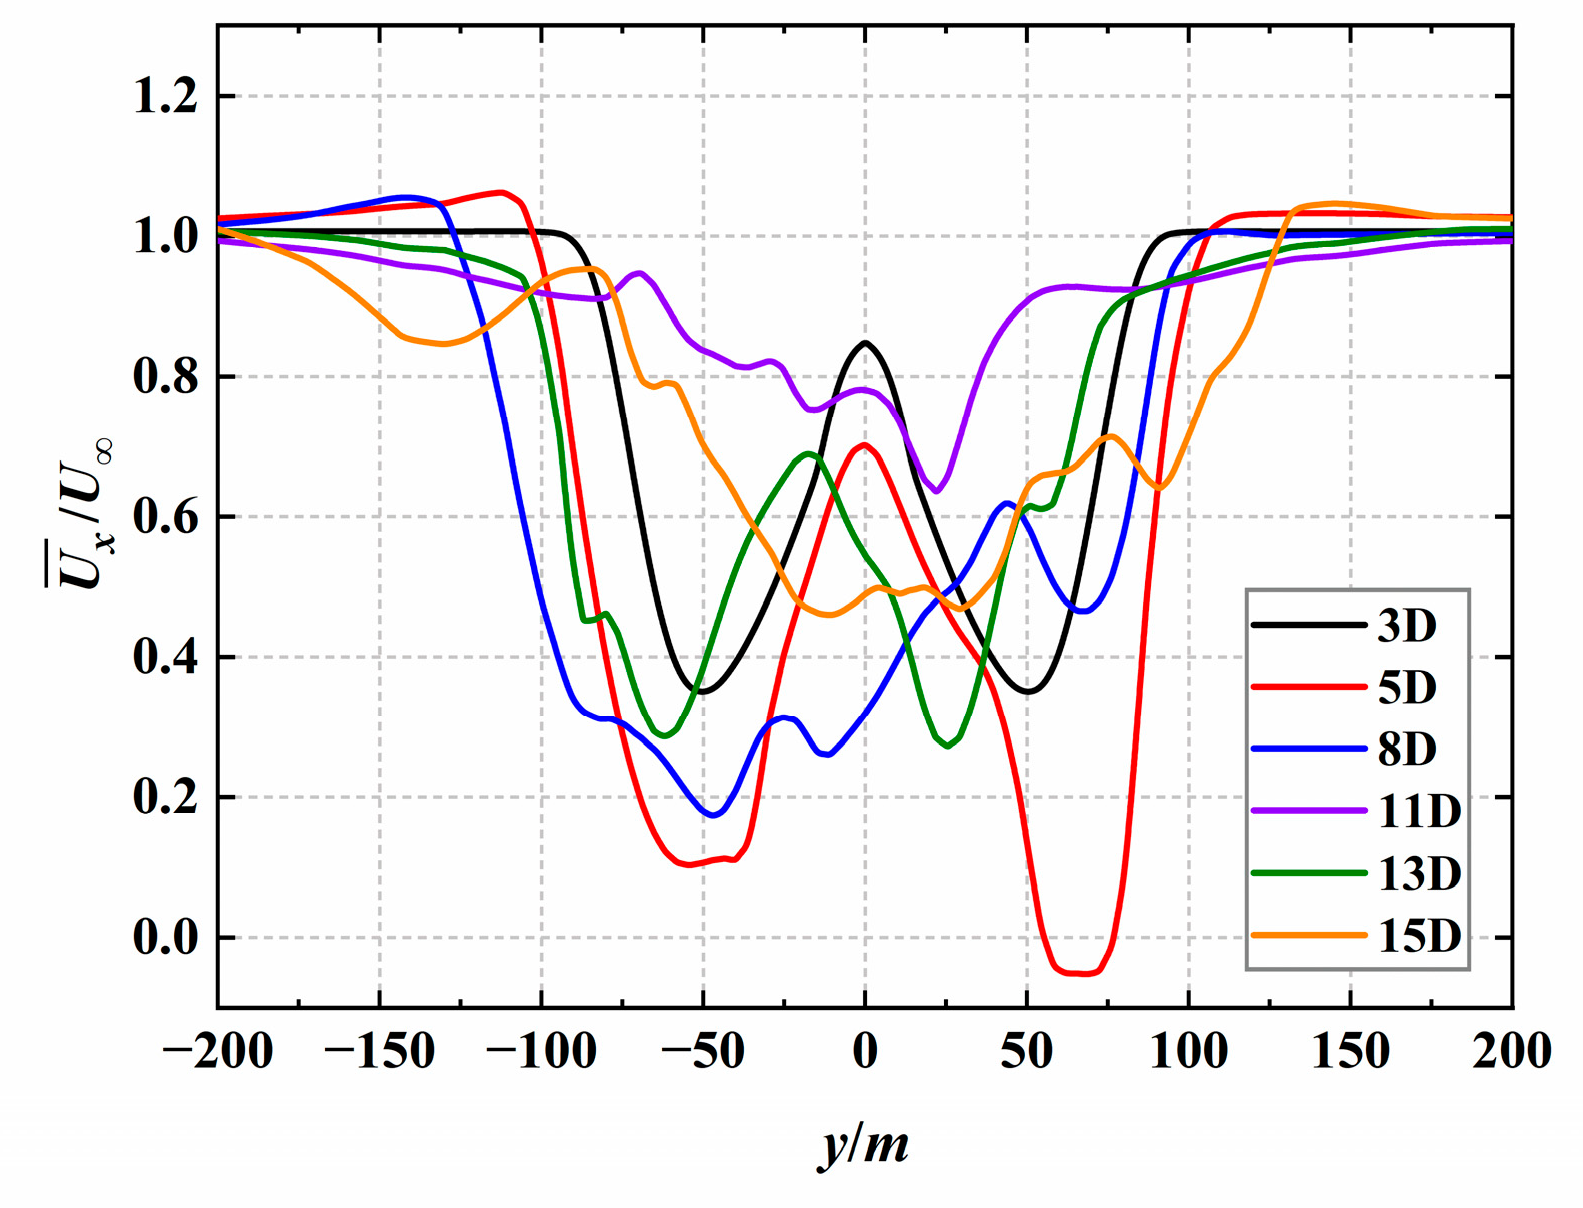
Further examination of the wake characteristics of the tandem three turbines is shown in Figure 9, which presents the along-wind turbine wake velocity profiles at the hub height of the tandem three turbines. It can be observed that at the wake of WT1, the wake velocity profile is approximately symmetrical, with an average wind speed showing a symmetric concave shape near the centerline. At the wake of WT2, there is a certain offset in the concave areas on both sides, and the streamwise mean wind speed profile is significantly deformed with noticeable velocity losses. As x/D > 12, the streamwise mean wind speed gradually recovers.

5.1.3. Unsteady Aerodynamic Characteristics of Three Turbines under Full Wake Conditions

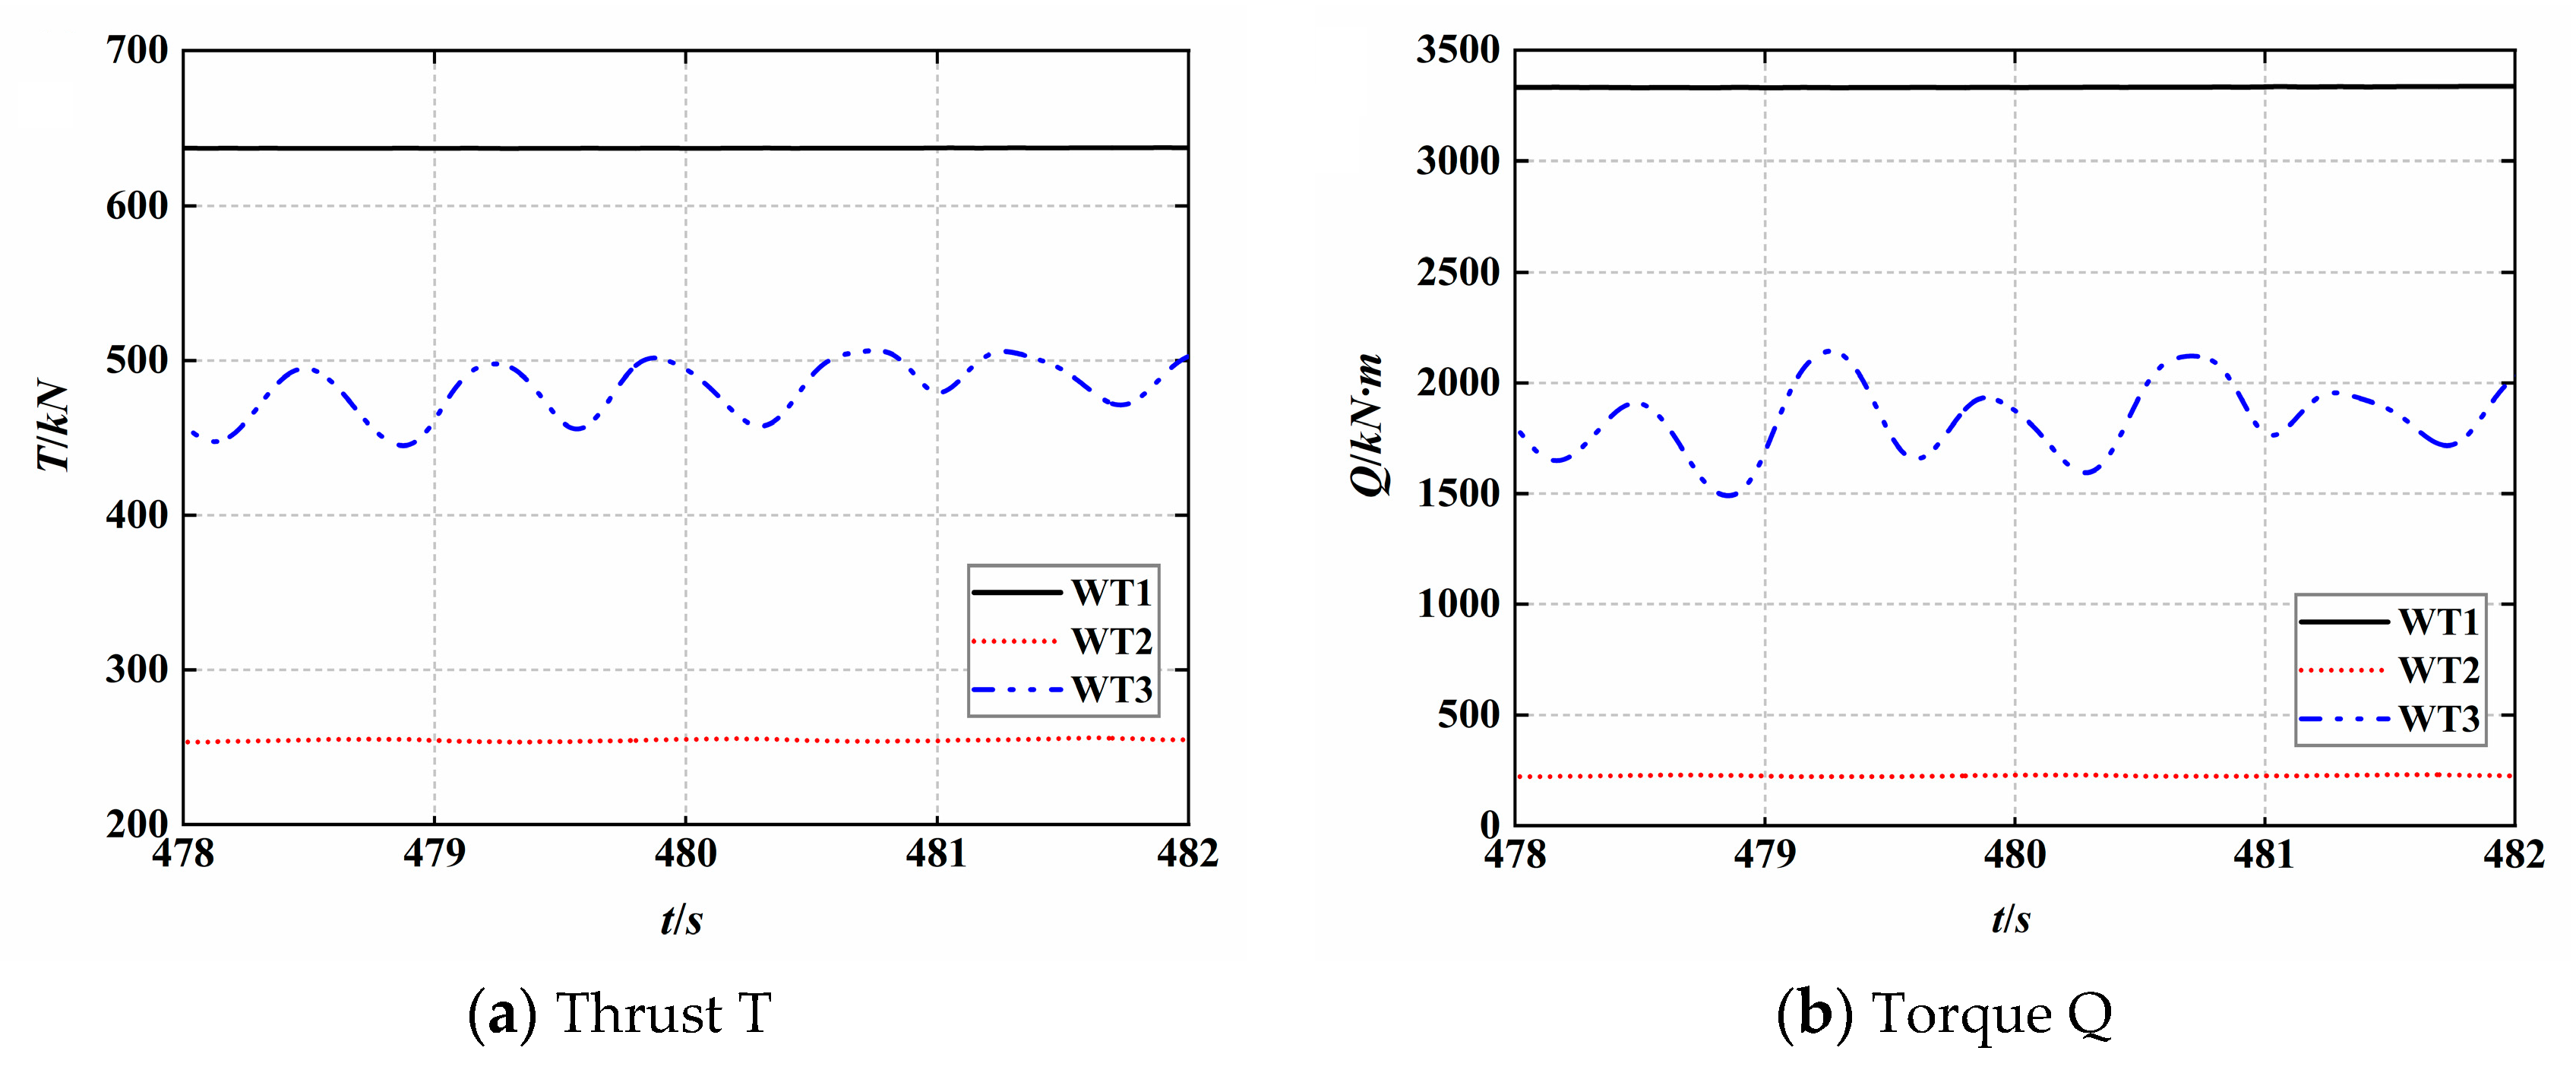
The time travel curves of thrust T and torque Q experienced by the tandem three turbines within the 110th rotation cycle, as computed using the LES-ALM method, are shown in Figure 10a,b. It can be observed that the thrust and torque experienced by WT1 are relatively stable, attributed to a stable inflow wind for WT1. WT2 experiences a weak periodic variation in thrust and torque due to certain disturbances from the upstream wake of WT1, with a thrust variation amplitude of approximately 2.70 kN and a torque variation amplitude of approximately 9.67 kN·m. Compared to WT1, the thrust and torque experienced by WT2 decrease by approximately 60.0% and 93.3%, respectively. WT3 exhibits a noticeable periodic fluctuation in thrust and torque, primarily due to more significant disturbances from the upstream wake; the peak frequency of this fluctuation is f = 0.69 HZ, which corresponds to three-times the rotational frequency f0 of the wind turbine at TSR = 8, where f0 = λU/(2πR) = 0.23 HZ, due to the fact that the wind turbine used in our work consists of three blades. The physical disturbances referred to here can be referred to as the fluctuations generated by the unsteady wake flow formed by the upstream and midstream wind turbines as it flows through the plane of the downstream wind turbine, see Figure 8. The thrust variation amplitude for WT3 is approximately 68.6 kN, and the torque variation amplitude is approximately 668.4 kN·m. Compared to WT1, the thrust and torque experienced by WT3 decrease by approximately 24.3% and 44.6%, respectively.

5.2. Three Turbines under Staggered Cases

5.2.1. Comparison of Aerodynamic Performance Results

Using the LES-ALM method to calculate the variations in CP and CT of the misaligned three turbines in Cases 2 and 3 with the spacing L1 between the turbines, the relevant parameters, mesh density, and the full wake conditions for the three turbines in Case 1 are consistent.
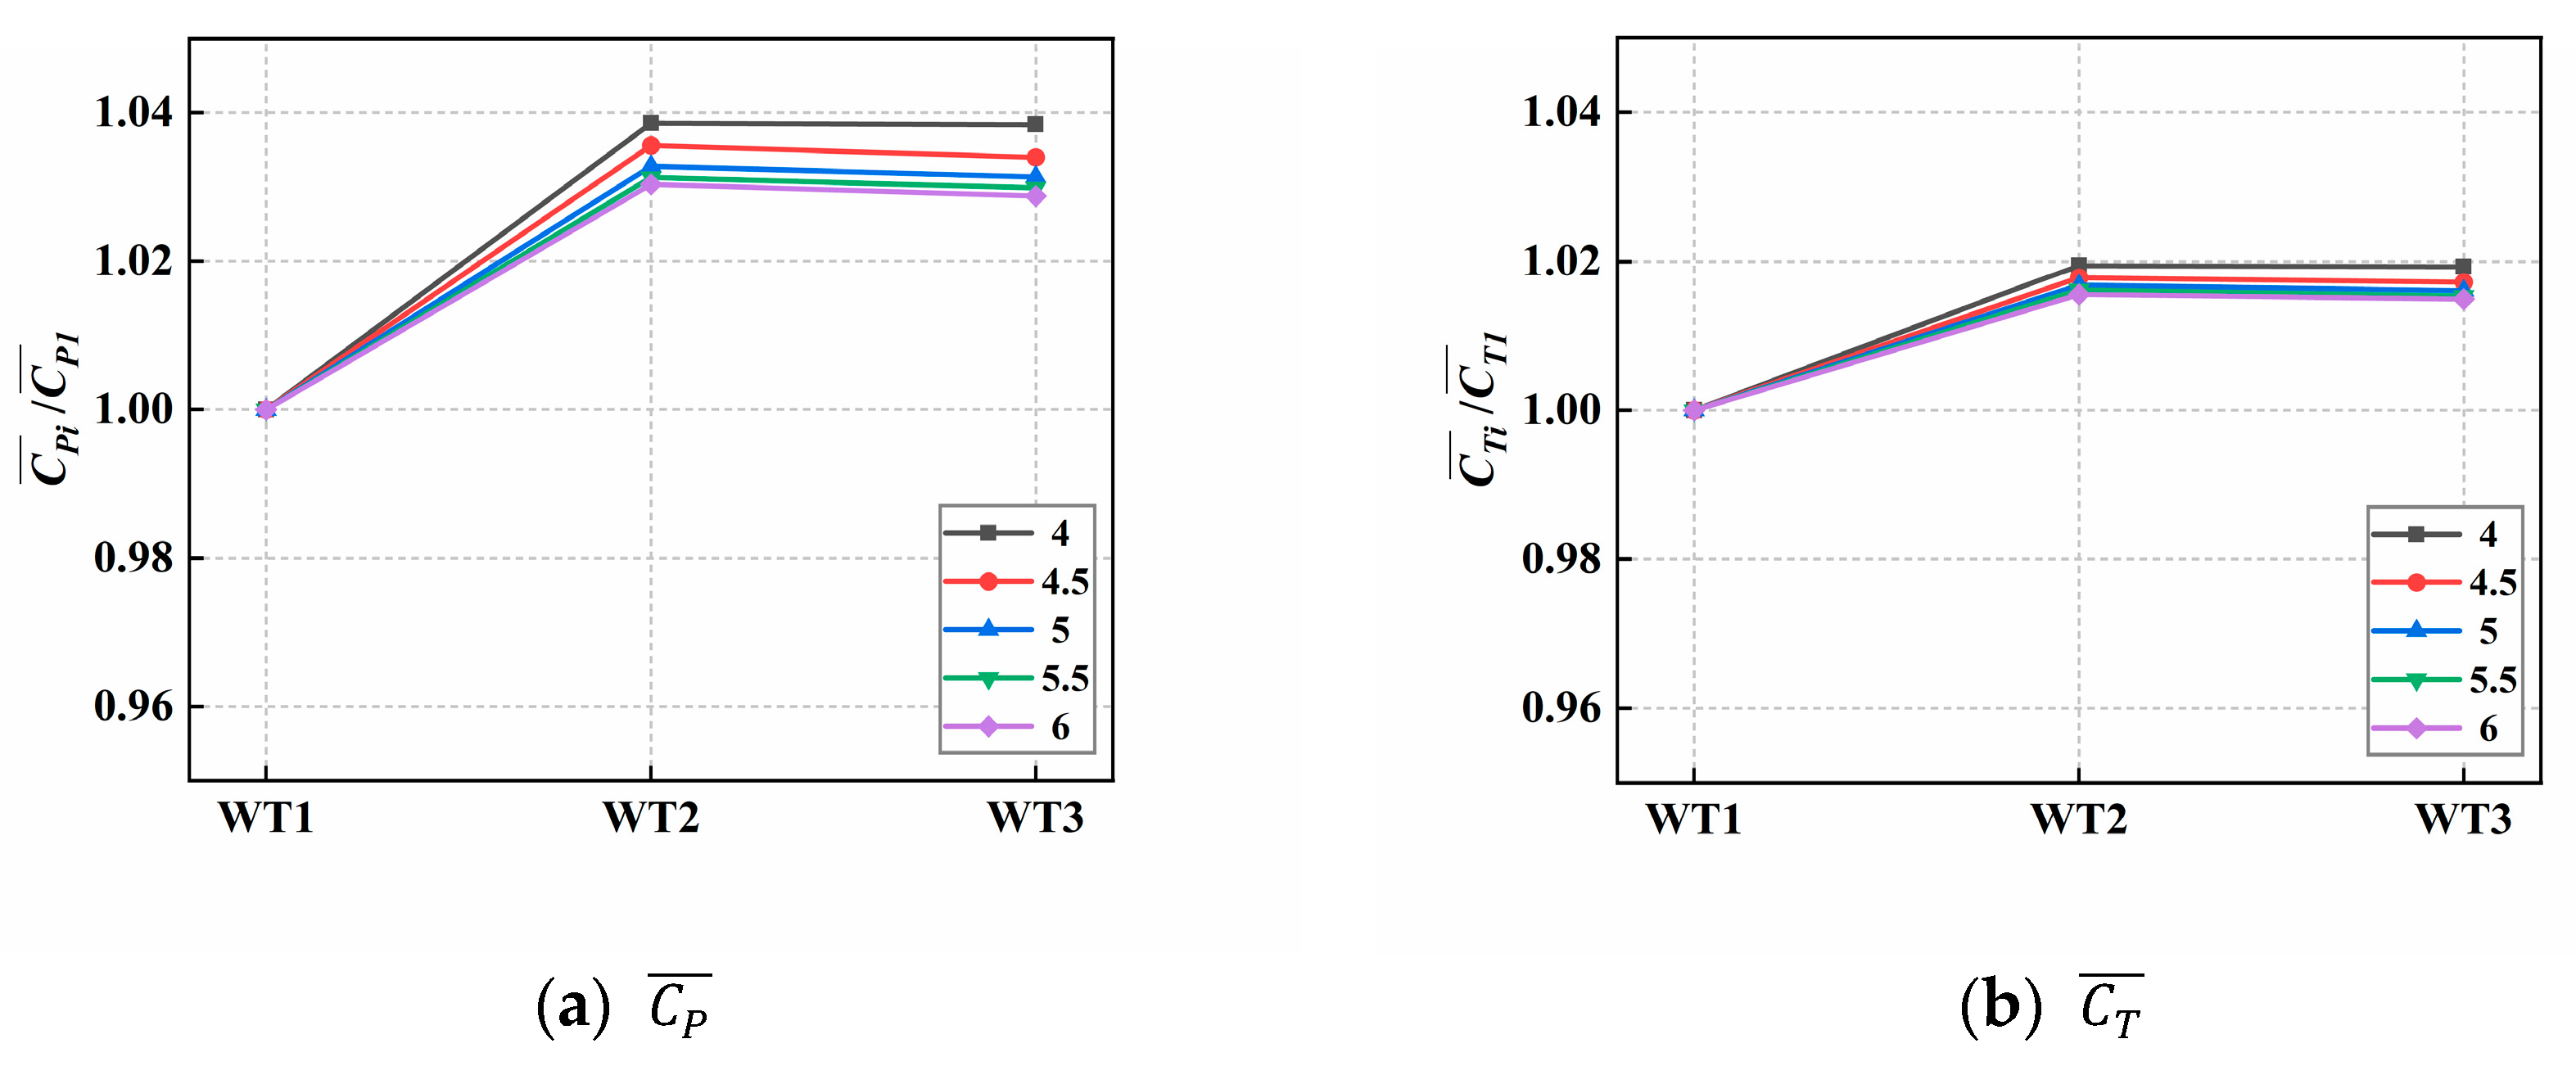
The variations in aerodynamic performance of the three turbines in Case 2 with the spacing L1 are shown in Figure 11. Figure 11a shows CP, and Figure 11b shows CT. It can be observed that the impact of spacing L1 on CP and CT is relatively weak. Specifically, as the spacing L1 increases, there is a stable upward trend in CP and CT for WT2 and WT3, but the variation remains within 1%. In the proposed Case 2, WT2 shows about a 0.2% increase compared to WT1 in CP and CT, and both values are higher than the corresponding parameters for WT3. The variations in aerodynamic performance of the three turbines in Case 3 with the spacing L1 are shown in Figure 12. It can be seen that the impact of spacing L1 on CP and CT of the three turbines in Case 3 is relatively small. CP and CT for WT1 and WT2 gradually increase with increasing L1, with a variation rate within 1%. In Case 3, the CP and CT obtained by the LES-ALM method for WT3 are higher than those for WT1 and WT2, with WT2 showing higher values than WT3. The total power of the three wind turbines in Case 3 is higher than the total power of the three wind turbines in Case 2.
In conclusion, for the cases of three wind turbines in tandem, the optimal distance between the upstream and midstream turbines is 4D. For the staggered cases of three wind turbines, the optimal distance between the upstream and downstream turbines is also 4D.

5.2.2. Comparison of Wake Characteristics Results

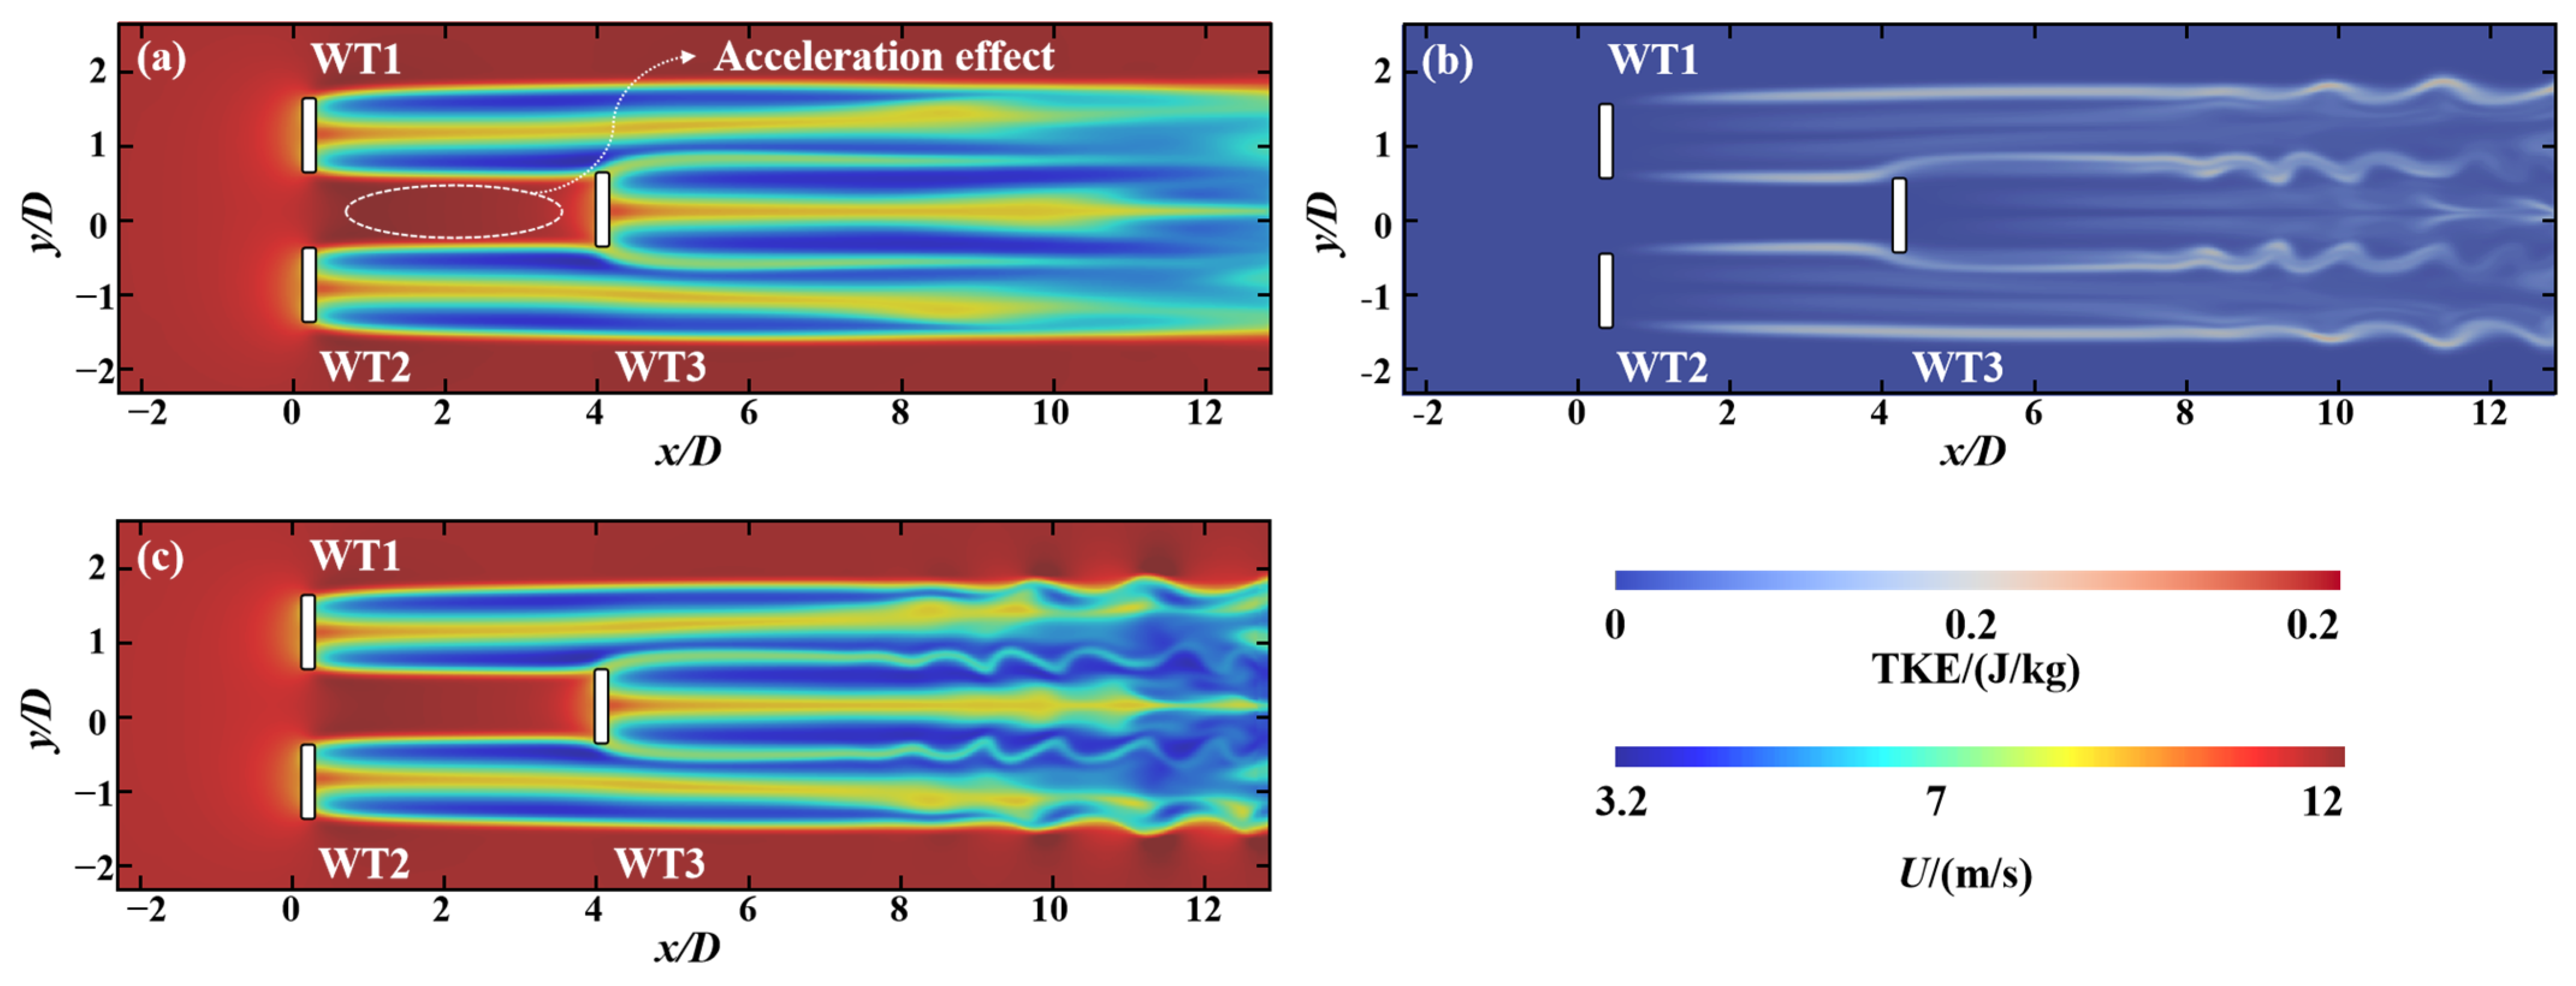
Next, we analyze the wake characteristics of the staggered three turbines to explain the aerodynamic performance calculation results obtained above. Figure 13 and Figure 14 show the average flow field distribution of the three turbines in two layout schemes (L1 is 4D). The left image represents the average flow field velocity contour, while the right image shows the turbulence kinetic energy results. The rectangles in the figures indicate the positions of each turbine.
As shown in Figure 13, the velocity contour and turbulence kinetic energy plot at z = 0 for Case 2 are displayed. It can be observed that in Figure 13a,c, there is an acceleration effect of the wake between WT2 and WT3 along the centerline of the two turbines, resulting in mutual interaction and a certain increase in CP and CT for downstream WT2 and WT3. In Figure 13b, the turbulence kinetic energy is higher on the side of WT2 and WT3 closer to the centerline of WT1, leading to significant fluctuations in the aerodynamic performance results of WT2 and WT3 due to this one-sided turbulent inflow.
Figure 14 shows the velocity contour and turbulence kinetic energy plot at z = 0 for Case 3. It can be seen that in Figure 14a,c, the interaction between WT1 and WT2 leads to an increase in the inflow velocity at the entrance of WT3, consistent with the relevant literature [9], resulting in increased inflow velocity for WT3. In Figure 14b, the turbulence kinetic energy is higher on both sides of WT3 at the inflow, leading to more stable aerodynamic performance results for downstream WT3. Additionally, it can be observed in Figure 14a that there is a difference in the wake velocity near WT1 and WT2 between the sides close to and away from downstream WT3, indicating the existence of interaction between WT1 and WT2.
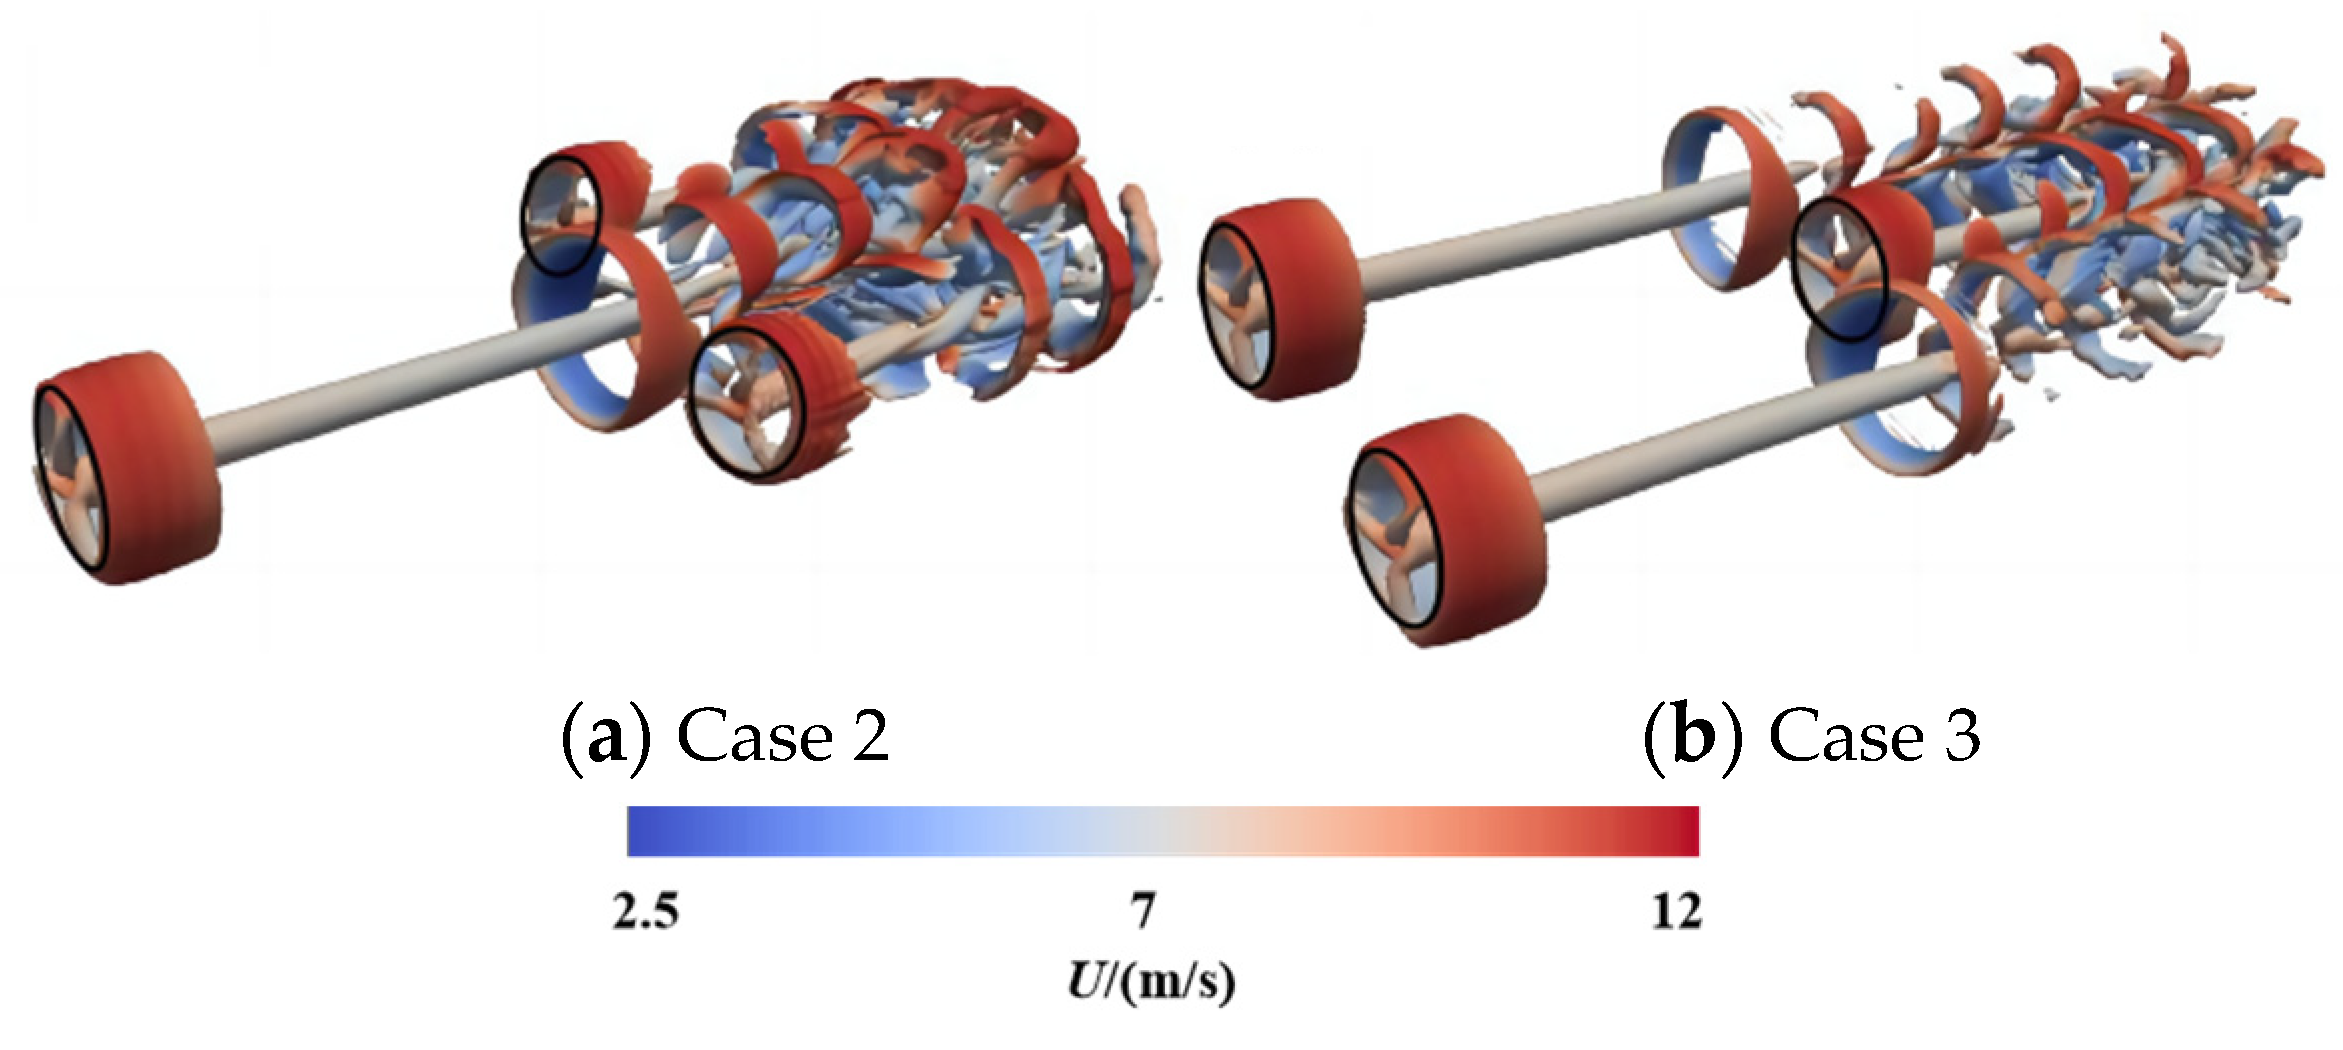
As shown in Figure 15, the three-dimensional vortex structure of the side wake inflow layout scheme based on the Q-criteria is depicted at 400 s. For Case 2, it can be observed that the near wake of the upstream turbine is mainly composed of helical vortex structures shed from the blade tips. When the upstream turbine wake enters the inflow plane of the downstream turbine, it interacts with the vortex structures at the blade tips of the downstream turbine, resulting in the formation of ring-shaped vortices. For Case 3, the wakes of the two upstream turbines generate a pair of ring-shaped vortices on both sides of the inflow plane of the downstream turbine. These vortices interact with the vortex structures generated at the blade tips of the downstream turbine and gradually dissipate in the far wake.
To gain further insights into the three-dimensional characteristics of the wake from the side-wake inflow layout with three turbines, the average velocity distribution of the wake slice in the Y-Z plane of the three turbines at different axial positions (x/D = 1–11) was obtained, as shown in Figure 16. It can be observed that in the near-wake region of the upstream turbine (x/D ≤ 3), the wake velocity profile exhibits a thin-disk shape, and the magnitude of velocity deficit remains relatively constant with increasing axial distance. This explains the phenomenon where the CP and CT of the downstream turbine show only minor changes with the increase in spacing L1. In the wake region of the third turbines (5 ≤ x/D), the interaction among the wakes of the three turbines intensifies, causing the shape of the wake velocity region to transition into a bird-head shape and a helical shape.

5.2.3. Unsteady Aerodynamic Characteristics of Three Turbines under Staggered Conditions

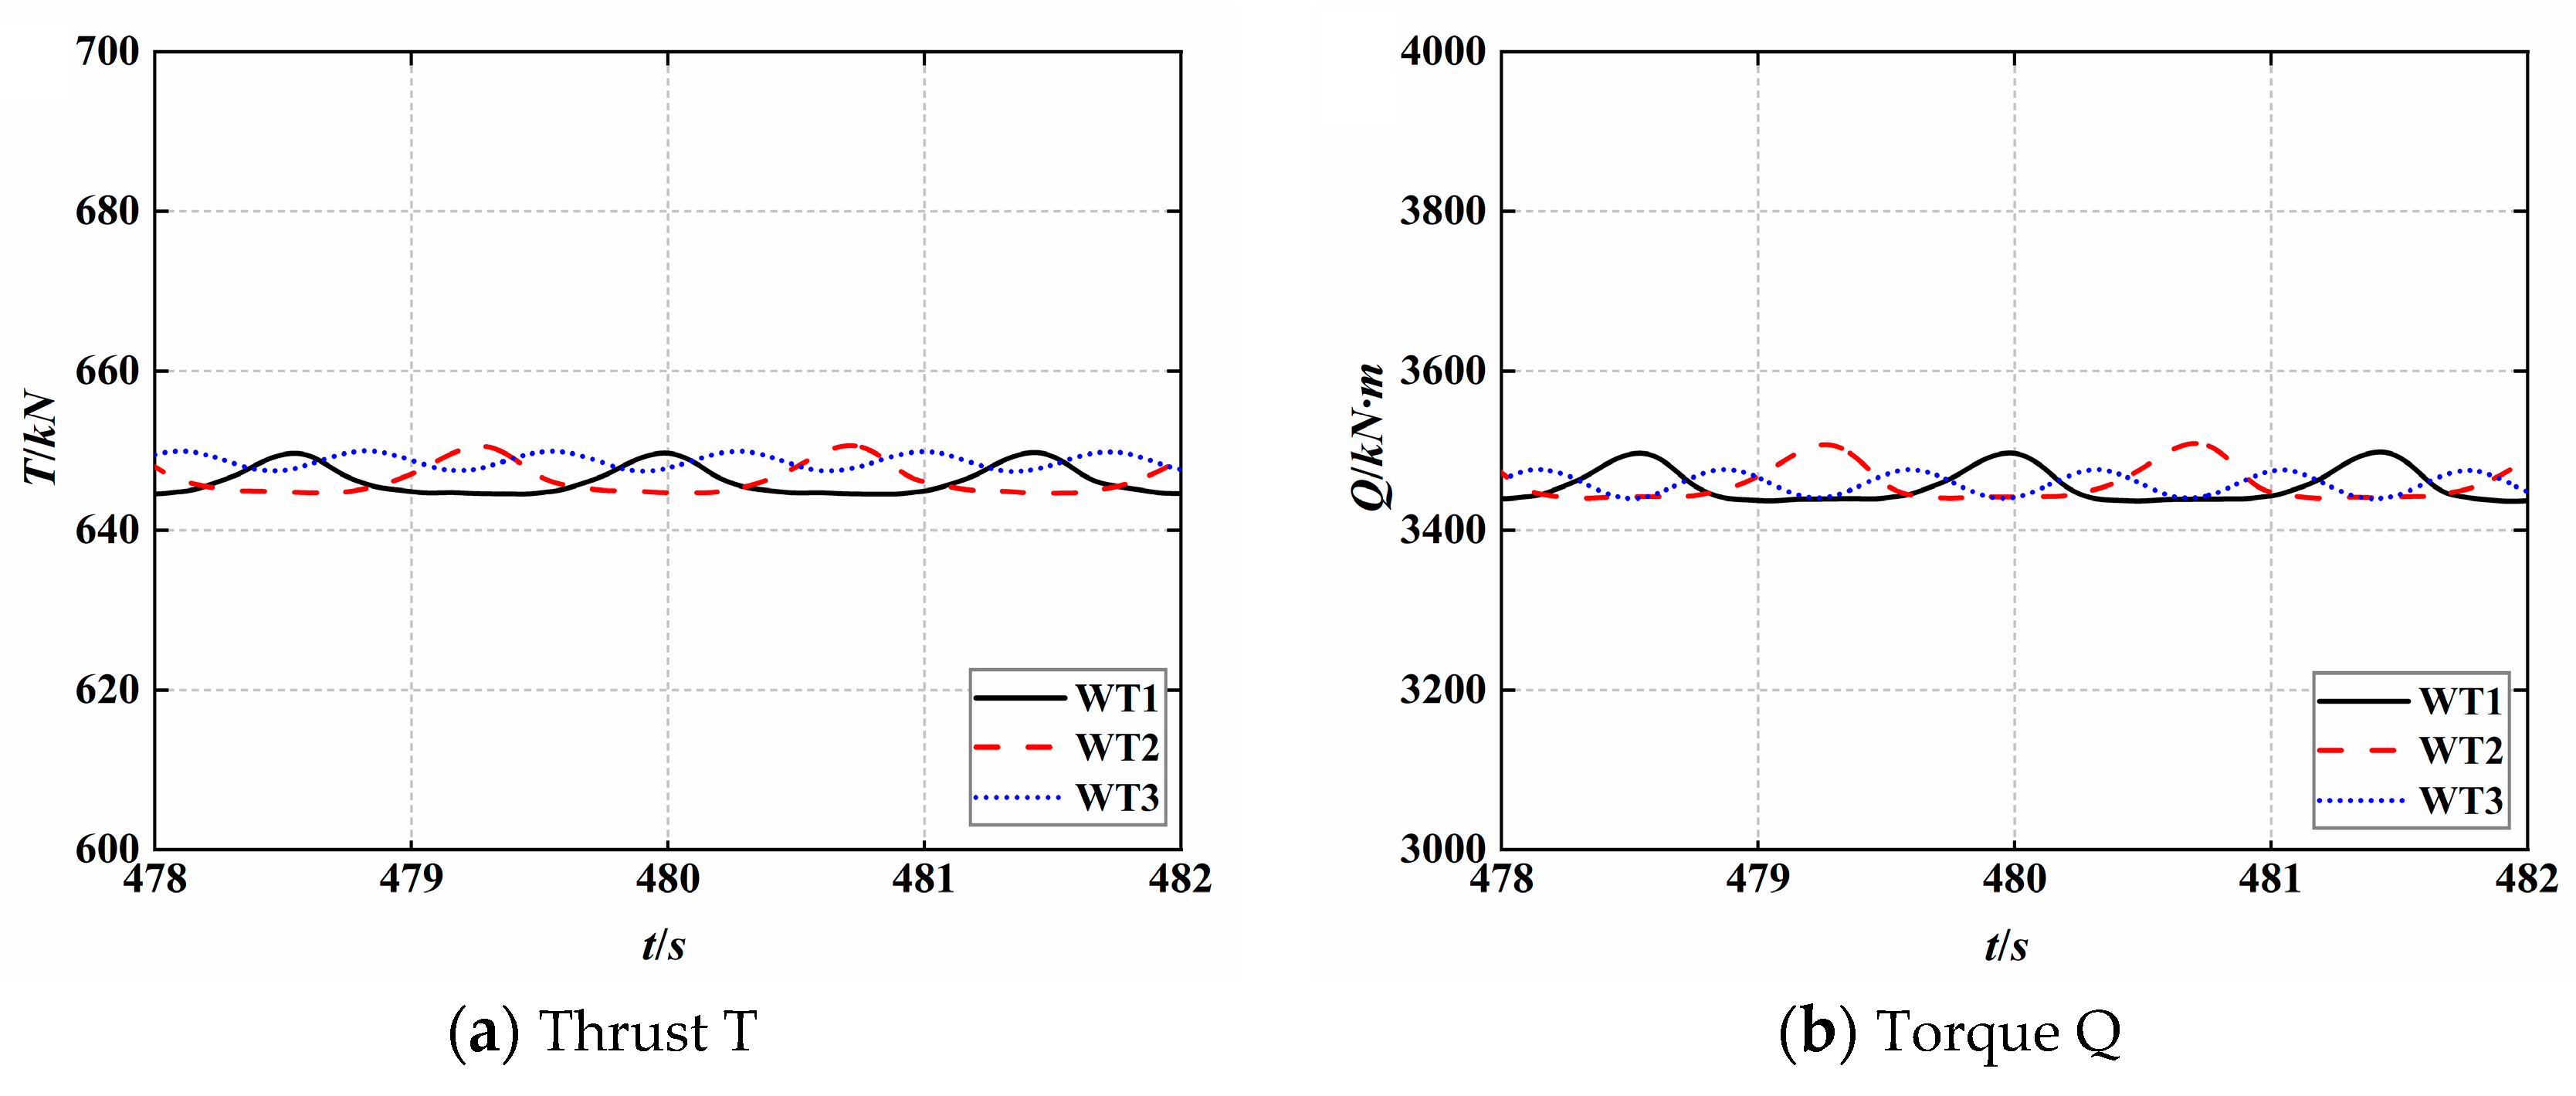
Using the LES-ALM method to compute the unsteady dynamic characteristics of the three turbines under the staggered configuration with L1 = 4D, Figure 17 shows the thrust and torque experienced by the three turbines in Case 2 during approximately one rotation in the 110th revolution cycle. It can be observed that WT1 experiences lower thrust and torque compared to WT2 and WT3, remaining stable. The thrust and torque experienced by WT2 and WT3 exhibit a cyclic variation with a period of one-third of a turbine rotation cycle, with significant amplitude changes. The thrust variation is approximately 27.0 kN, and the torque variation is about 248.0 kN·m, with an average value approximately 5.14% higher than WT1 for thrust and 2.46% higher for torque. The thrust and torque curves of WT2 and WT3 alternate between peaks and valleys at the same time points. The average values of WT2’s corresponding data are greater than for WT3, confirming the conclusion that WT2’s C P ¯ and C T ¯ are greater than WT3’s corresponding data.
Figure 18 shows the thrust and torque experienced by the three turbines in Case 3 during approximately one rotation in the 110th revolution cycle. It can be seen that the thrust and torque experienced by WT1 are closer to those of WT2 and WT3, all exhibiting periodic variations. The frequency of variation for WT3 is twice that of WT1 and WT2, with a thrust variation of about 5.2 kN and a torque variation of approximately 58.2 kN·m. The thrust and torque curves of WT1 and WT2 alternate between peaks and valleys at the same time points, with a thrust variation of about 5.7 kN and a torque variation of approximately 66.6 kN·m. The average values of WT2’s corresponding data are greater than WT1’s, confirming the conclusion that WT2’s C P ¯ and C T ¯ are greater than WT1’s corresponding data.
The observed fluctuations in thrust and torque are attributed to the instability of the incoming wind caused by the wake of the upstream turbine. As shown in Figure 15, the wake generated by the upstream turbine creates a substantial vortex structure at the inflow plane of the downstream turbine. In Case 3, the downstream turbine, WT3, is influenced by the wakes of both upstream turbines, which leads to fluctuations in thrust and torque at a frequency that is twice that of the corresponding data from the upstream turbines. Thus, it is anticipated that as the number of rows and columns of turbines in extensive wind farms increases, the phenomenon of wake interaction may become more pronounced. Consequently, the instability within the wakes of upstream turbines may also intensify, giving rise to these fluctuations.
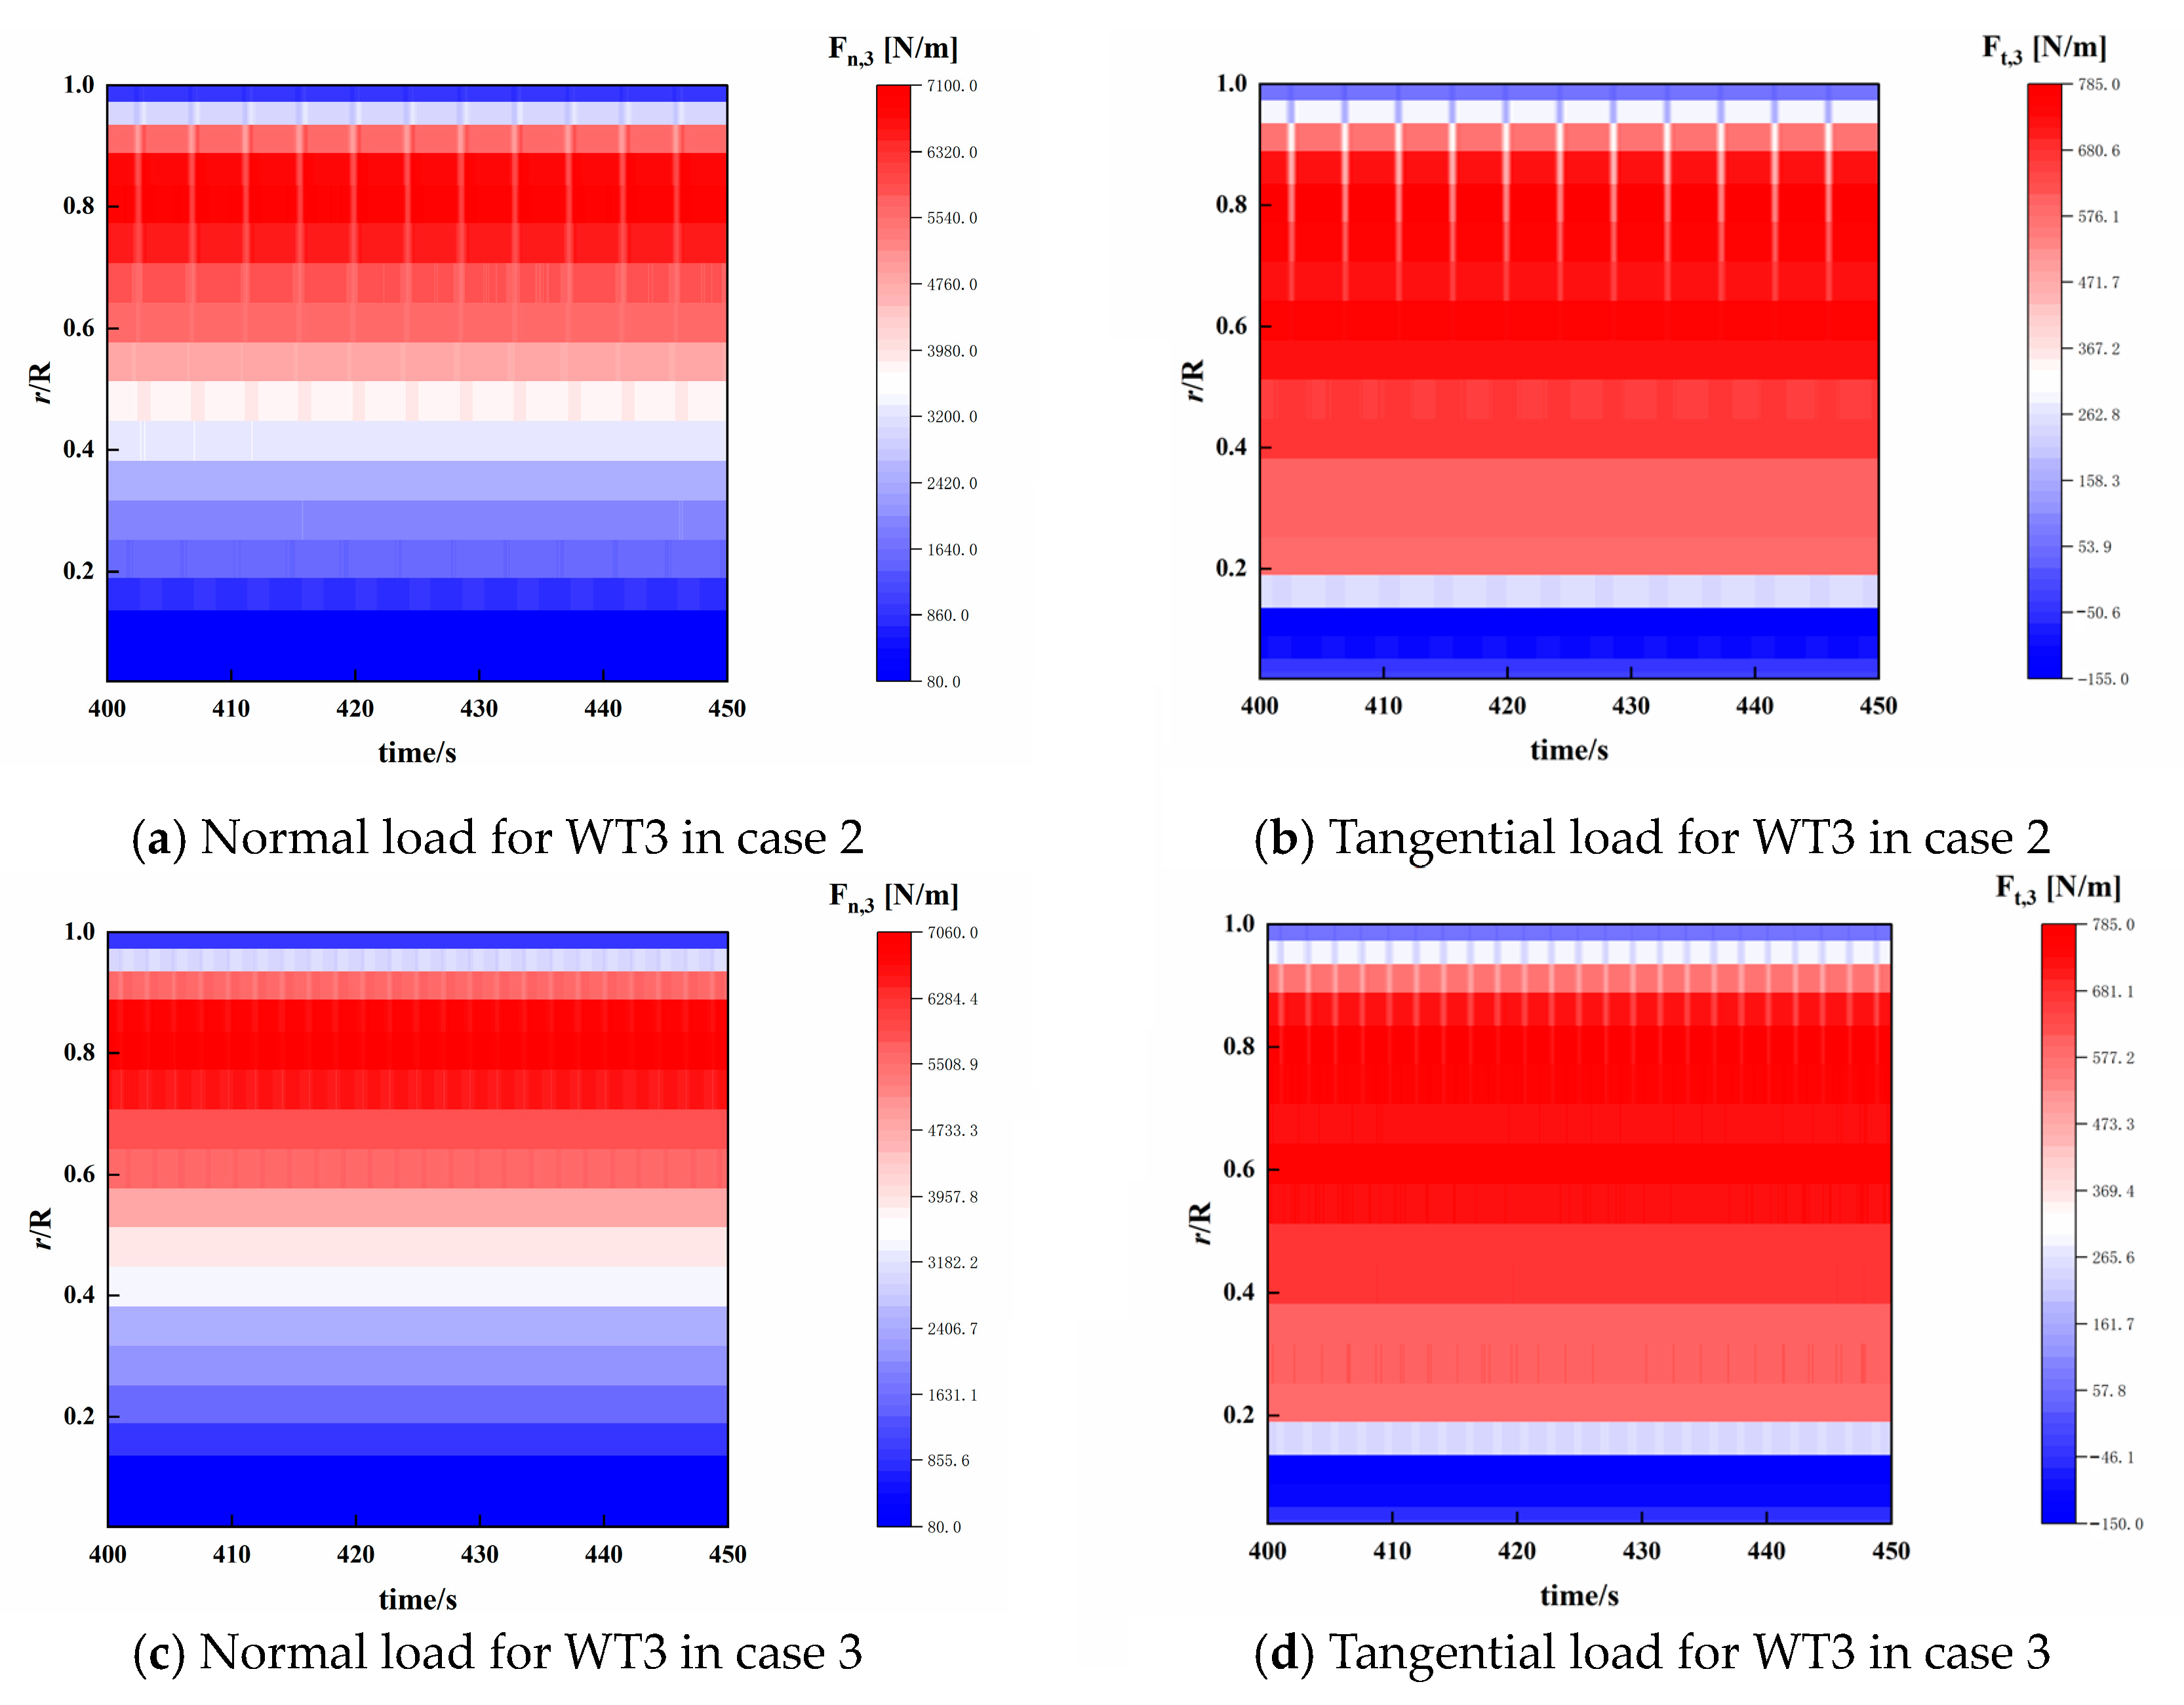
To further illustrate the unsteady aerodynamic response results of blade 1 of the downstream wind turbine WT3, the time histories of the tangential and normal loads (per unit span) for WT3 in Cases 2 and 3 were obtained, as shown in Figure 19. It can be observed that the tangential and normal loads of WT3 exhibit significant fluctuations at the blade tip, while the loads at the blade root and mid-section are relatively stable. Additionally, the fluctuations in the tangential and normal loads for WT3 in Case 2 are greater than those in Case 3. These results further validate the results presented in Figure 17 and Figure 18.

6. Conclusions

This study employs the LES-ALM method to study the power generation efficiency and wake characteristics of three turbines under different wake interaction conditions. It explores the differences and patterns of related unsteady dynamic characteristics and explains the causes of these differences through the flow field distribution and turbulence kinetic energy characteristics. By comparing and analyzing the aerodynamic performance and flow field distribution of three NREL 5 MW horizontal-axis turbines under different cases, the following main conclusions are drawn:
1. Under the full wake condition of three turbines, it is found that the spacing has a relatively small impact on the power coefficient and thrust coefficient of the middle turbine but has a significant impact on the power coefficient and thrust coefficient of the downstream turbine. Additionally, when the spacing between the upstream and middle turbines decreases, the total power of the three-turbine system tends to increase.
2. For the staggered arrangement of three turbines, the unilateral turbulent inflow to the downstream turbine causes significant fluctuations in thrust and torque, while bilateral turbulent inflow to the downstream turbine results in more stable thrust and torque. The presence of two upstream turbines causes an acceleration effect at the inflow region of the downstream single turbine, leading to a significant increase in the power coefficient of the downstream turbine.
3. Regarding wake field characteristics, the wake velocity of a single upstream turbine does not change significantly in the downwind direction. However, when the wake velocities of two upstream turbines overlap, the recovery of the wake velocity deficit in the X direction is notable.

Author Contributions

Conceptualization, C.F. and Z.H.; data curation, C.F.; formal analysis, C.F.; investigation, M.Y. and J.T.; methodology, C.F.; project administration, Z.H.; resources, L.D., J.T. and Z.H.; software, C.F. and Z.H.; supervision, D.Z., H.Z. and Z.H.; validation, C.F. and Z.Z.; visualization, C.F. and H.Z.; writing—original draft, C.F.; writing—review and editing, C.F., Z.Z. and Z.H. All authors have read and agreed to the published version of the manuscript.

Funding

The financial support from the National Natural Science Foundation of China (Nos. 52122110, 52371285, 52088102, 42076210), Natural Science Foundation of Shanghai (Grant No. 21ZR1429200), and Guangdong Basic and Applied Basic Research Foundation (2022A1515240077, 2023A1515240054) are gratefully acknowledged. The numerical calculations in this study were partially carried out on the ORISE Supercomputer.

Institutional Review Board Statement

Not applicable.

Informed Consent Statement

Not applicable.

Data Availability Statement

Data are contained within the article.

Conflicts of Interest

Author Meixin Yu was employed by the company China Shipbuilding NDRI Engineering. The remaining authors declare that the research was conducted in the absence of any commercial or financial relationships that could be construed as a potential conflict of interest.

Abbreviations

Nomenclature
CtThrust coefficient [-]
CpPower coefficient [-]
C T ¯ Mean thrust coefficient [-]
C P ¯ Mean power coefficient [-]
L1Distance between the upstream and downstream turbines [m]
DRotor diameter [m]
k*Turbulent kinetic energy [J/kg]
PPower output [MW]
QTorque of the rotor [N·m]
TThrust of the rotor [kN]
SDistance in the Y direction between the turbines [m]
UWind speed [m/s]
U ¯ Mean wake velocity [m/s]
Greek letters
ρFluid density [kg/m3]
λTip speed ratio
ΩThe rotation speed of the rotor [r/s]
Abbreviations
3DThree dimensional
SGSSubgrid-scale
FRMFully resolved mesh
BEMBlade element momentum theory
CFDComputational fluid dynamics
LESLarge Eddy Simulation
ALMOffshore floating wind turbine
TSRTip speed ratio
TITurbulence intensity
RANSReynolds Averaged Navier–Stokes
WT1Wind turbine 1
WT2Wind turbine 2
WT3Wind turbine 3

References

  1. Vargas, S.A.; Esteves, G.R.T.; Maçaira, P.M.; Bastos, B.Q.; Oliveira, F.L.C.; Souza, R.C. Wind power generation: A review and a research agenda. J. Clean. Prod. 2019, 218, 850–870. [Google Scholar] [CrossRef]
  2. Chen, G.; Liang, X.; Li, X. Modelling of wake dynamics and instabilities of a floating horizontal-axis wind turbine under surge motion. Energy 2022, 239, 122110. [Google Scholar] [CrossRef]
  3. Li, J.; Wang, G.; Li, Z.; Yang, S.; Chong, W.T.; Xiang, X. A review on development of offshore wind energy conversion system. Int. J. Energy Res. 2020, 44, 9283–9297. [Google Scholar] [CrossRef]
  4. Liu, J.; Ma, L.; Wang, Q.; Fang, F.; Zhu, Y. Offshore Wind Power Supports China’s Energy Transition. Strateg. Study CAE 2021, 23, 149–159. [Google Scholar]
  5. Wang, L.; Hong, Y.; Gao, Y.; Haung, M.; Guo, Z.; Lai, Y.; Zhu, R.; Yang, Q.; Hc, B. Dynamic catastrophe and control of offshore wind power structures in typhoon environment. Chin. J. Theor. Appl. Mech. 2023, 55, 567–587. [Google Scholar]
  6. Barthelmie, R.J.; Hansen, K.; Frandsen, S.T.; Rathmann, O.; Schepers, J.G.; Schlez, W.; Phillips, J.; Rados, K.; Zervos, A.; Politis, E.S.; et al. Modelling and measuring flow and wind turbine wakes in large wind farms offshore. Wind Energy 2010, 12, 431–444. [Google Scholar] [CrossRef]
  7. Reddy, S.R. Wind Farm Layout Optimization (WindFLO): An advanced framework for fast wind farm analysis and optimization. Appl Energy 2020, 269, 115090. [Google Scholar] [CrossRef]
  8. Wu, Y.; Lin, C.; Chang, T. Effects of inflow turbulence intensity and turbine arrangements on the power generation efficiency of large wind farms. Wind Energy 2020, 23, 1640–1655. [Google Scholar] [CrossRef]
  9. Antonini, E.G.A.; Romero, D.A.; Amon, C.H. Optimal design of wind farms in complex terrains using computational fluid dynamics and adjoint methods. Appl. Energy 2020, 261, 114426. [Google Scholar] [CrossRef]
  10. Rezaeiha, A.; Micallef, D. Wake interactions of two tandem floating offshore wind turbines: CFD analysis using actuator disc model. Renew. Energy 2021, 179, 859–876. [Google Scholar] [CrossRef]
  11. Wang, Y.; Li, C.; Miao, W.P. Layout Optimization of the Wind Farm in a Wind Power Station Based on Actuator Line Method. J. Chin. Soc. Power Eng. 2017, 37, 418–424. [Google Scholar]
  12. Strijhak, S.V.; Koshelev, K.B.; Kryuchkova, A.S. Simulation of turbulent wakes in model wind farm with arbitrary location for wind turbines. J. Phys. Conf. Ser. 2019, 1382, 12043. [Google Scholar] [CrossRef]
  13. Zhang, Z.; Kuang, L.; Zhao, Y.; Han, Z.; Zhou, D.; Tu, J.; Chen, M.; Ji, X. Numerical investigation of the aerodynamic and wake characteristics of a floating twin-rotor wind turbine under surge motion. Energy Convers. Manag. 2023, 283, 116957. [Google Scholar] [CrossRef]
  14. Guggeri, A.; Draper, M. Large Eddy Simulation of an onshore wind farm with the actuator line model including wind turbine’s control below and above rated wind speed. Energies 2019, 12, 3508. [Google Scholar] [CrossRef]
  15. Tu, Y.; Zhang, K.; Han, Z.; Zhou, D.; Bilgen, O. Aerodynamic characterization of two tandem wind turbines under yaw misalignment control using actuator line model. Ocean Eng. 2023, 281, 114992. [Google Scholar] [CrossRef]
  16. Xu, S.; Zhao, W.; Wan, D. Numerical study of dynamic characteristics for offshore wind turbine under complex atmospheric inflow. Chin. J. Theor. Appl. Mech. 2022, 54, 872–880. [Google Scholar]
  17. Bai, H.; Wan, D.; Wang, N. Numerical simulation of aerodynamic performance of three wind turbines with staggered strategies under atmospheric boundary layer flow. Chin. J. Hydrodyn. 2021, 36, 10–19. [Google Scholar]
  18. Toosi, M.E.N.; Rahmati, M. A Novel Wake Control Approach for Power Generation Improvement of Three Wind Turbines in a Wind Farm. Journal of Engineering for Gas Turbines and Power. J. Eng. Gas Turbines Power 2022, 144, 121001. [Google Scholar] [CrossRef]
  19. Sorensen, J.N.; Shen, W. Numerical modeling of wind turbine wakes. J. Fluids Eng. 2002, 124, 393–399. [Google Scholar] [CrossRef]
  20. Weller, H.G.; Tabor, G.; Jasak, H.; Fureby, C. A tensorial approach to computational continuum mechanics using object-oriented techniques. Comput. Phys. 1998, 12, 620–631. [Google Scholar] [CrossRef]
  21. Liu, L.; Franceschini, L.; Oliveira, D.F.; Galeazzo, F.C.; Carmo, B.S.; Stevens, R.J. Evaluating the accuracy of the actuator line model against blade element momentum theory in uniform inflow. Wind Energy 2022, 25, 1046–1059. [Google Scholar] [CrossRef]
  22. Zhang, K.; Bilgen, O. Multi-fidelity aerodynamic modeling of a floating offshore wind turbine rotor. In Proceedings of the ASME 2020 International Mechanical Engineering Congress and Exposition, Online, 16–19 November 2020. V010T10A061. [Google Scholar]
  23. Tian, K.; Zhang, Y.; Li, J.; Zhang, X.; You, Y. Numerical Wave Simulation Using Geometrical VOF Method Based on OpenFOAM. Shànghăi Jiāotōng Dàxué Xuébào 2021, 55, 1–10. [Google Scholar]
  24. Troldborg, N. Actuator Line Modeling of Wind Turbine Wakes; Technical University of Denmark: Kongens Lyngby, Denmark, 2008. [Google Scholar]
  25. Nakhchi, M.; Win Naung, S.; Rahmati, M. A novel hybrid control strategy of wind turbine wakes in tandem configuration to improve power production. Energy Convers. Manag. 2022, 260, 115575. [Google Scholar] [CrossRef]
  26. Jonkman, J.; Butterfield, S.; Musial, W.; Scott, G. Definition of a 5-MW Reference Wind Turbine for Offshore System Development; National Renewable Energy Lab. (NREL): Golden, CO, USA, 2009.
  27. Zhang, Y.; Cai, X.; Lin, S.; Wang, Y.; Guo, X. CFD Simulation of Co-Planar Multi-Rotor Wind Turbine Aerodynamic Performance Based on ALM Method. Energies 2022, 15, 6422. [Google Scholar] [CrossRef]
  28. Zhang, W.; Wang, Y.; Shen, Y.; Wang, Y.; Xu, Y.; Zhang, X. CFD Studies of Wake Characteristics and Power Capture of Wind Turbines with Trailing Edge Flaps. IEEE Access 2020, 8, 7349–7361. [Google Scholar] [CrossRef]
  29. Martínez-Tossas, L.A.; Churchfield, M.J.; Leonardi, S. Large eddy simulations of the flow past wind turbines: Actuator line and disk modeling. Wind Energy 2015, 18, 1047–1060. [Google Scholar] [CrossRef]
  30. Marten, D.; Peukert, J.; Pechlivanoglou, G.; Nayeri, C.N.; Paschereit, C.O. QBLADE: An open source tool for design and simulation of horizontal and vertical axis wind turbines. Int. J. Emerg. Technol. Adv. Eng. 2013, 3, 264–269. [Google Scholar]
  31. Make, M.; Vaz, G. Analyzing scaling effects on offshore wind turbines using CFD. Renew. Energy 2015, 83, 1326–1340. [Google Scholar] [CrossRef]
  32. Micallef, D.; Sant, T. Loading effects on floating offshore horizontal axis wind turbines in surge motion. Renew. Energy 2015, 83, 737–748. [Google Scholar] [CrossRef]
  33. Nilsson, K.; Ivanell, S.; Hansen, K.S.; Mikkelsen, R.; Sørensen, J.N.; Breton, S.; Henningson, D. Large-eddy simulations of the Lillgrund wind farm. Wind Energy 2015, 18, 449–467. [Google Scholar] [CrossRef]
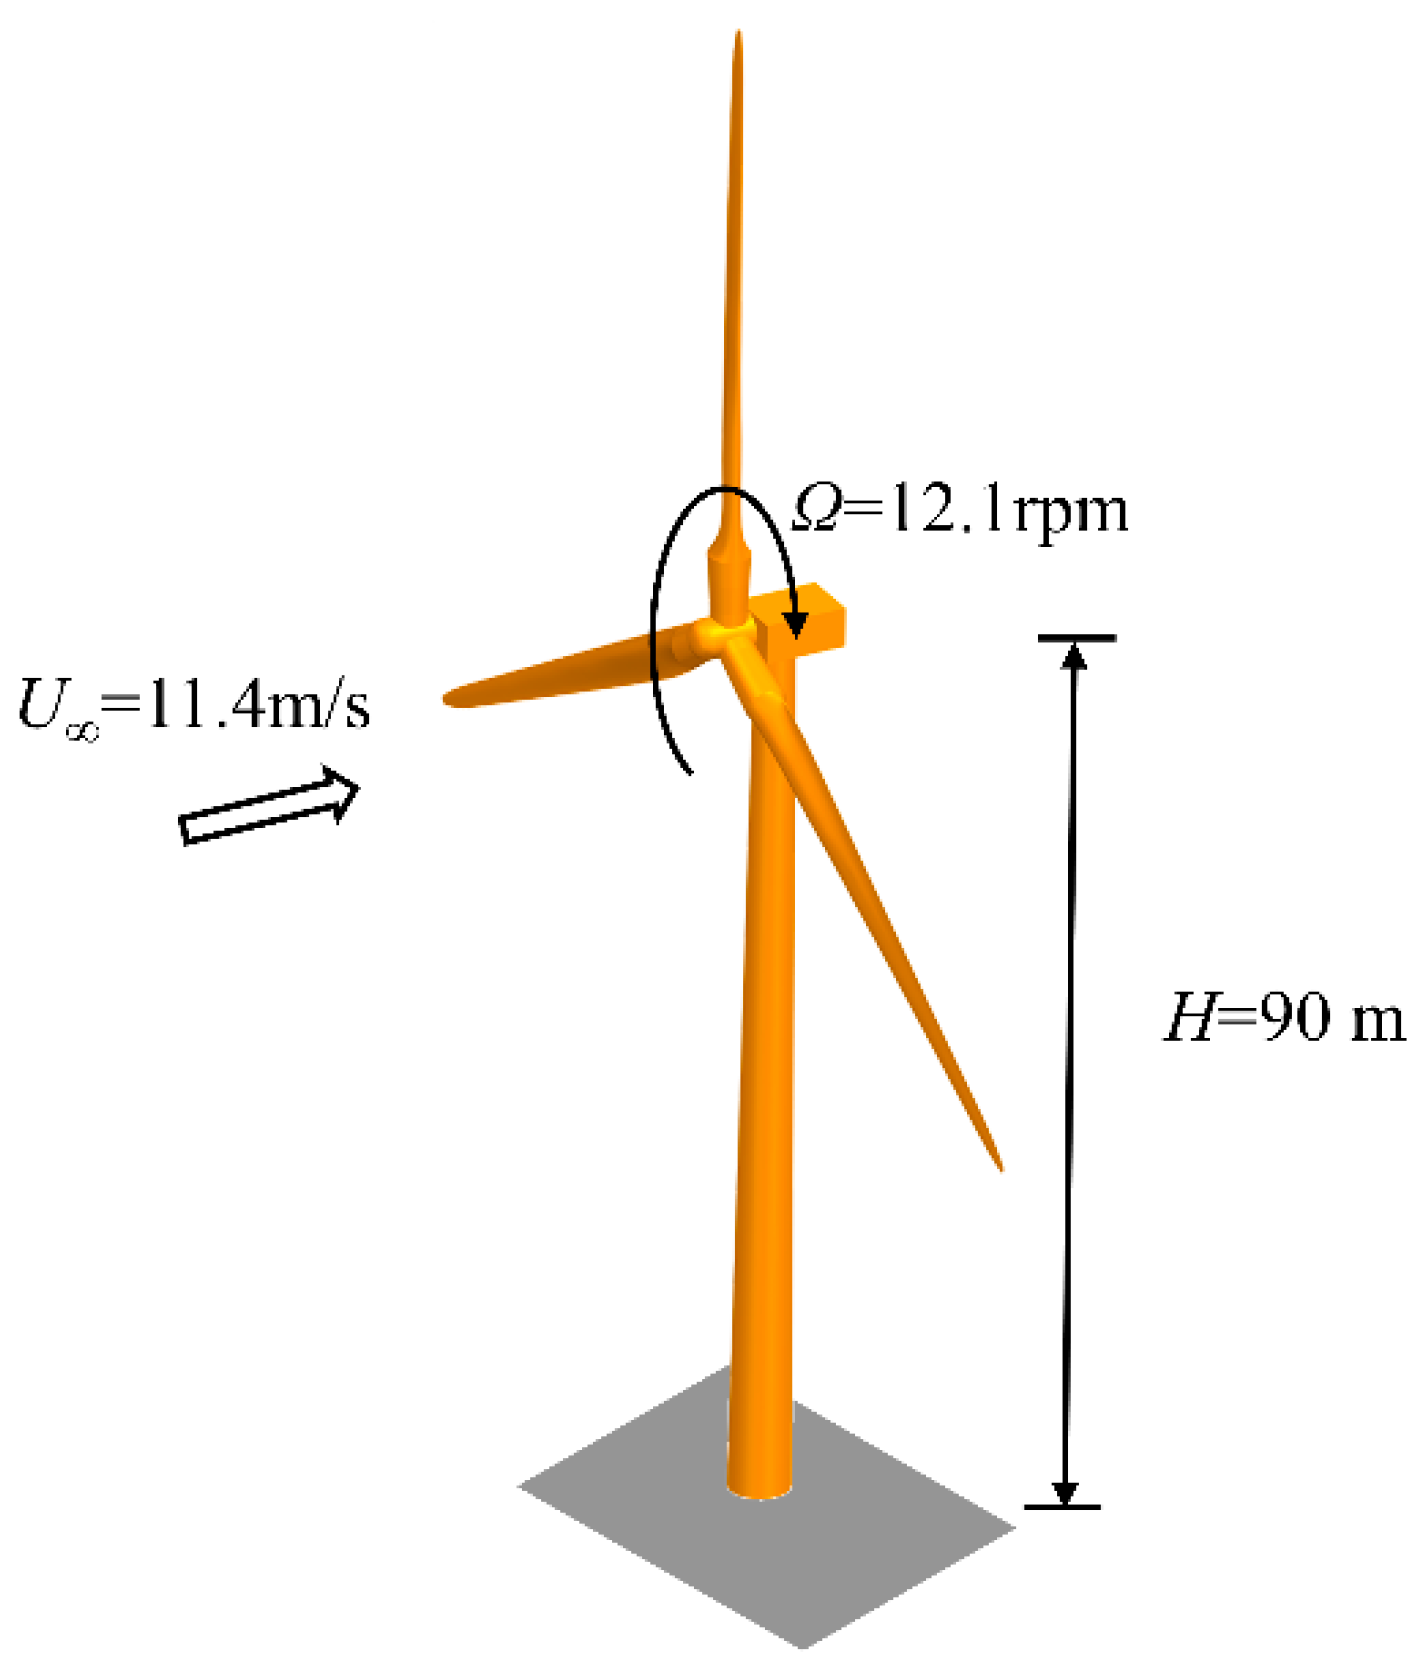
Figure 1. Key parameter schematic of a single NREL 5 MW WT.
Jmse 12 01341 g001
Figure 2. The cross-stream velocity profile of the mean wake at the hub height with the results from this study and relevant studies [15,28,29].
Jmse 12 01341 g002
Figure 3. The comparison of (a) C P ¯ and (b) C T ¯ of the NREL 5 MW turbine under different TSR conditions with the results from this study and relevant studies [15,30,31,32].
Jmse 12 01341 g003
Figure 4. The grid distribution of the flow field of three turbines using LES-ALM method.
Jmse 12 01341 g004
Figure 5. Two cases of three turbines under staggered arrangement.
Jmse 12 01341 g005
Figure 6. The ratio of C P ¯ and C T ¯ of the tandem three turbines at different L1 values to those of WT1.
Jmse 12 01341 g006
Figure 7. Diagram of time-averaged flow field distribution and turbulent kinetic energy at z = 0 of tandem three turbines (L1/D = 4): (a) Time-averaged flow field; (b) Flow field at t = 400 s; (c) Turbulent kinetic energy (TKE) at t = 400 s.
Jmse 12 01341 g007
Figure 8. Three-dimensional vortical structure of tandem three wind turbines at t = 400 s based on the Q-criteria. The black circles denote the position of turbines.
Jmse 12 01341 g008
Figure 9. Downwind wake velocity profile at hub height of tandem three turbines in series.
Jmse 12 01341 g009
Figure 10. Time travel curves of thrust and torque for tandem three turbines (L1/D = 4).
Jmse 12 01341 g010
Figure 11. The ratio of C P ¯ and C T ¯ of three turbines at different L1 values to those of WT1 in Case 2.
Jmse 12 01341 g011
Figure 12. The ratio of C P ¯ and C T ¯ of three turbines at different L1 values to those of WT1 in Case 3.
Jmse 12 01341 g012
Figure 13. Diagram of time-averaged flow field distribution and turbulent kinetic energy at z = 0 in Case 2 of three turbines: (a) Time-averaged flow field; (b) Turbulent kinetic energy (TKE) at t = 400 s; (c) Flow field at t = 400 s.
Jmse 12 01341 g013
Figure 14. Diagram of time-averaged flow field distribution and turbulent kinetic energy at z = 0 in Case 3 of three turbines: (a) Time-averaged flow field; (b) Turbulent kinetic energy (TKE) at t = 400 s; (c) Flow field at t = 400 s.
Jmse 12 01341 g014
Figure 15. Three-dimensional vortical structure with three wind turbines in 400 s based on the Q-criteria. The black circles denote the position of turbines.
Jmse 12 01341 g015
Figure 16. Average wake velocity profile of Y-Z plane wake slice at different axial positions.
Jmse 12 01341 g016
Figure 17. Time travel curves of thrust and torque for the three turbines in Case 2.
Jmse 12 01341 g017
Figure 18. Time travel curves of thrust and torque for the three turbines in Case 3.
Jmse 12 01341 g018
Figure 19. Spatiotemporal contour plots of tangential and normal loads (per unit span) for the WT3.
Jmse 12 01341 g019
Table 1. Key parameters of the NREL 5 MW wind turbine (WT) model used in this study.
NREL 5 MWUnits
Rated power5.0MW
Rotor diameter126.0m
Number of blades3
Hub diameter3.0m
Hub height90m
Rated wind speed U11.4m/s
Rated rotor speed12.1rpm
Table 2. LES-ALM simulation mesh independence test for a single wind turbine.
Total MeshRgCPRelative Difference (%)
Coarse mesh3.62 × 106280.55024.30
Medium mesh6.52 × 106360.52750.64
Fine mesh8.86 × 106400.5241/
Table 3. Distribution table of the three-WT simulation cases using LES-ALM method in this article.
Case L1/DS/D
1Full wake cases4~7, interval = 0.50Jmse 12 01341 i001
2Staggered cases4~6, interval = 0.52Jmse 12 01341 i002
3Staggered cases4~6, interval = 0.52Jmse 12 01341 i003
Disclaimer/Publisher’s Note: The statements, opinions and data contained in all publications are solely those of the individual author(s) and contributor(s) and not of MDPI and/or the editor(s). MDPI and/or the editor(s) disclaim responsibility for any injury to people or property resulting from any ideas, methods, instructions or products referred to in the content.