Research on Aerodynamic Characteristics of Three Offshore Wind Turbines Based on Large Eddy Simulation and Actuator Line Model

 , and
, and
Abstract
:1. Introduction
2. Numerical Method
3. Verification and Validation
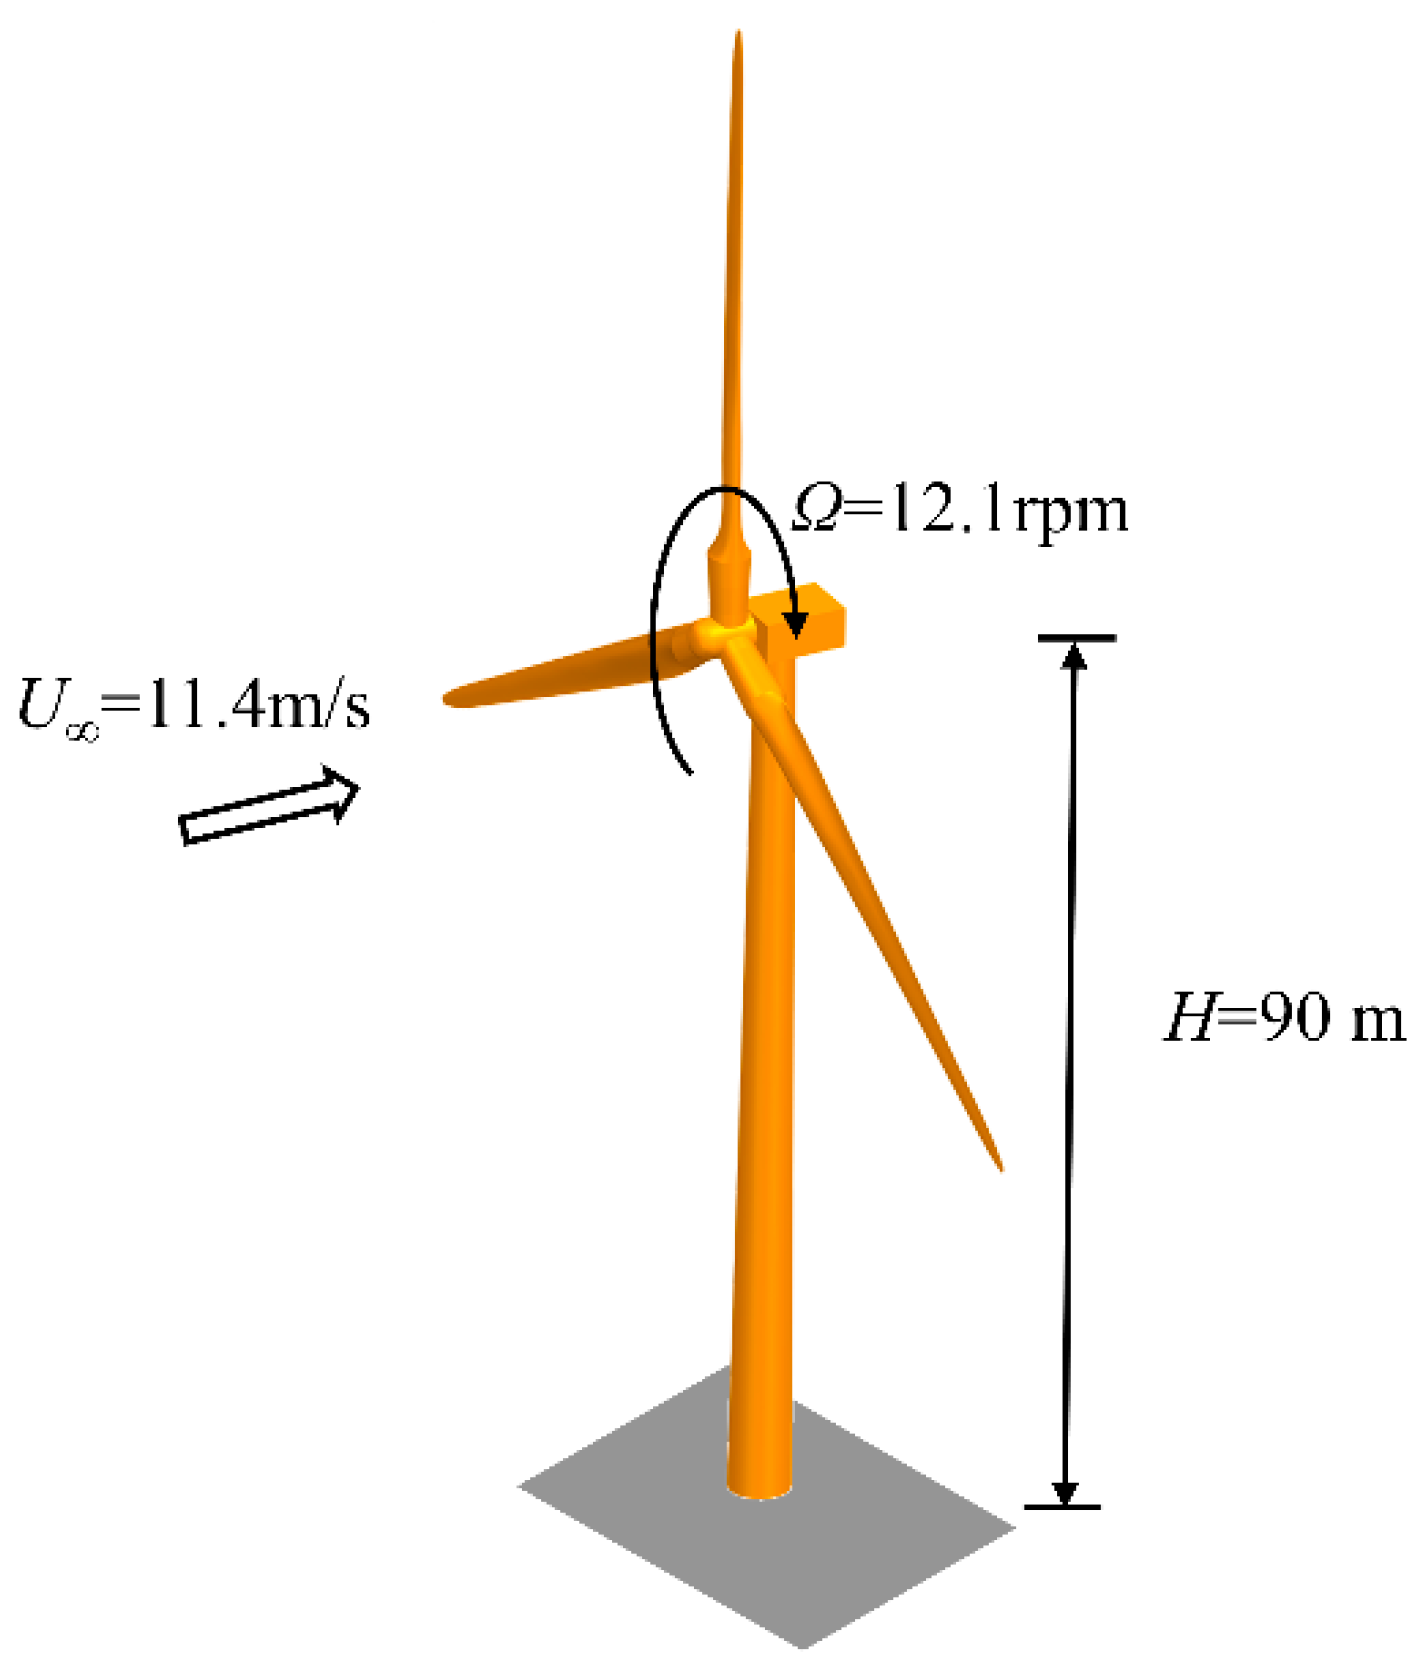
3.1. Single Turbine Parameter Settings
3.2. Results of the Mesh Independence Test
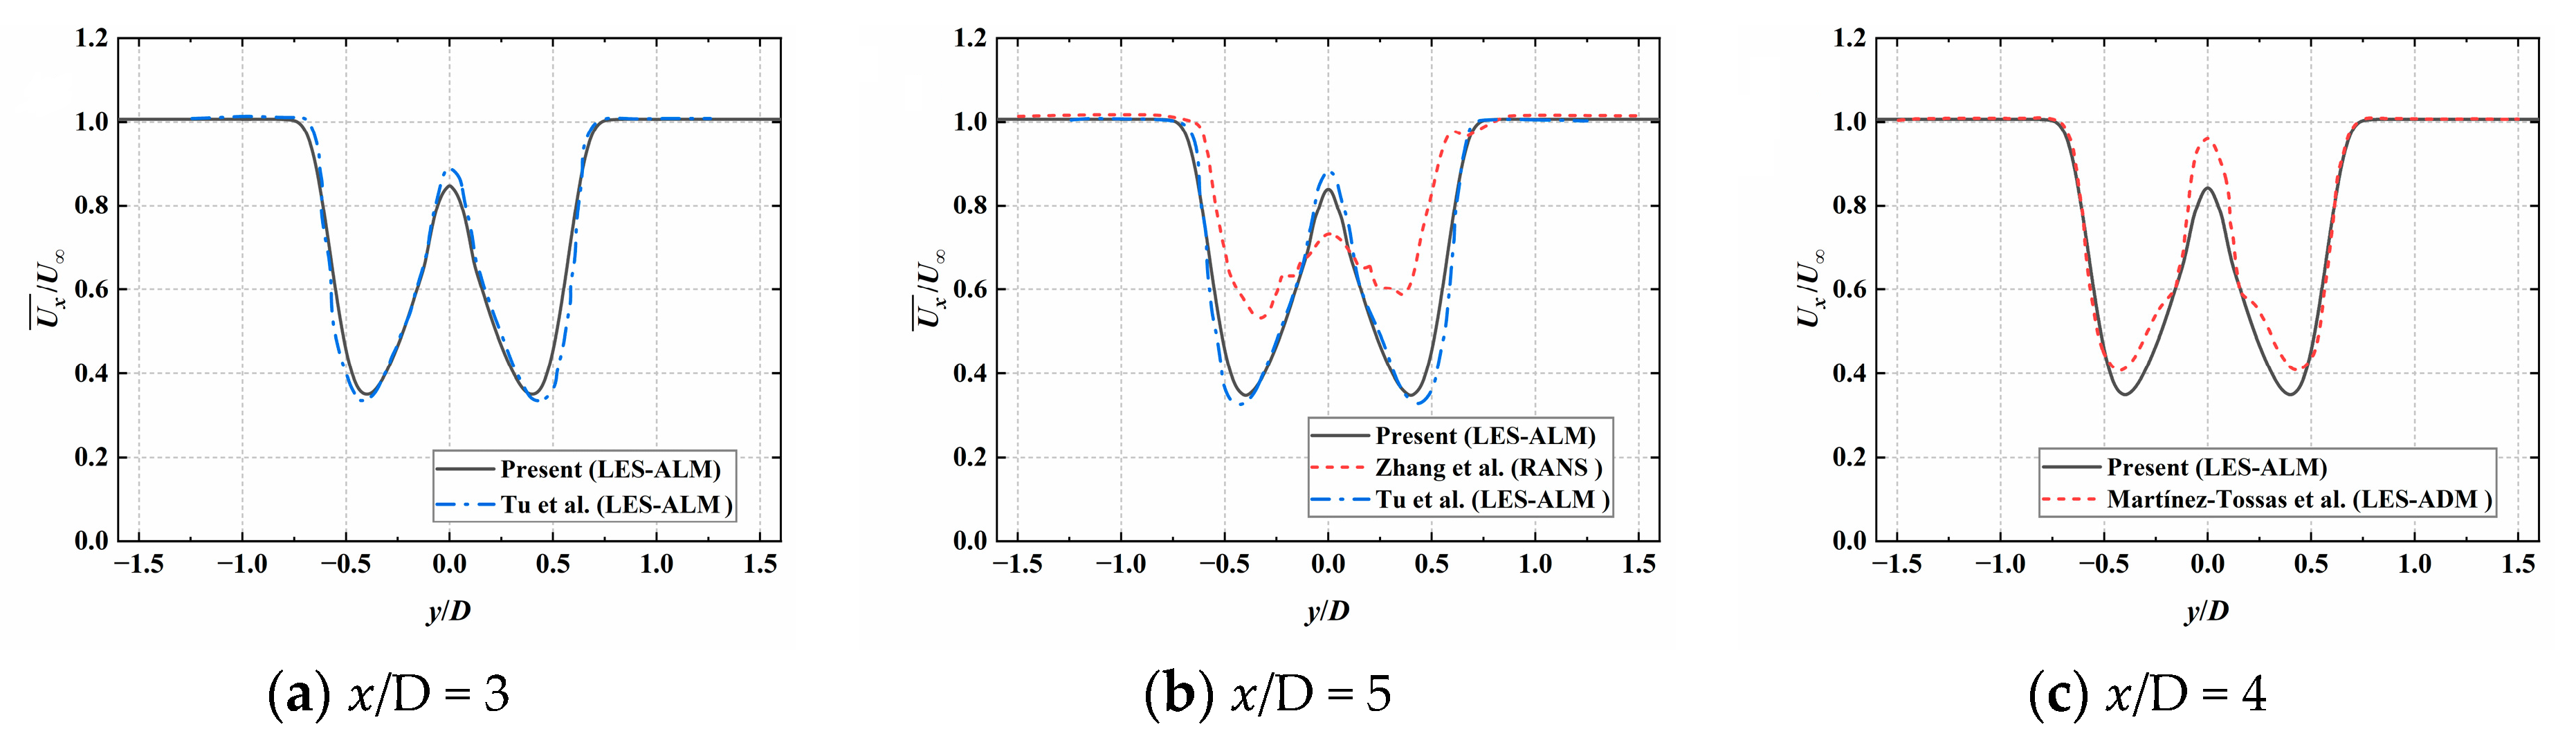
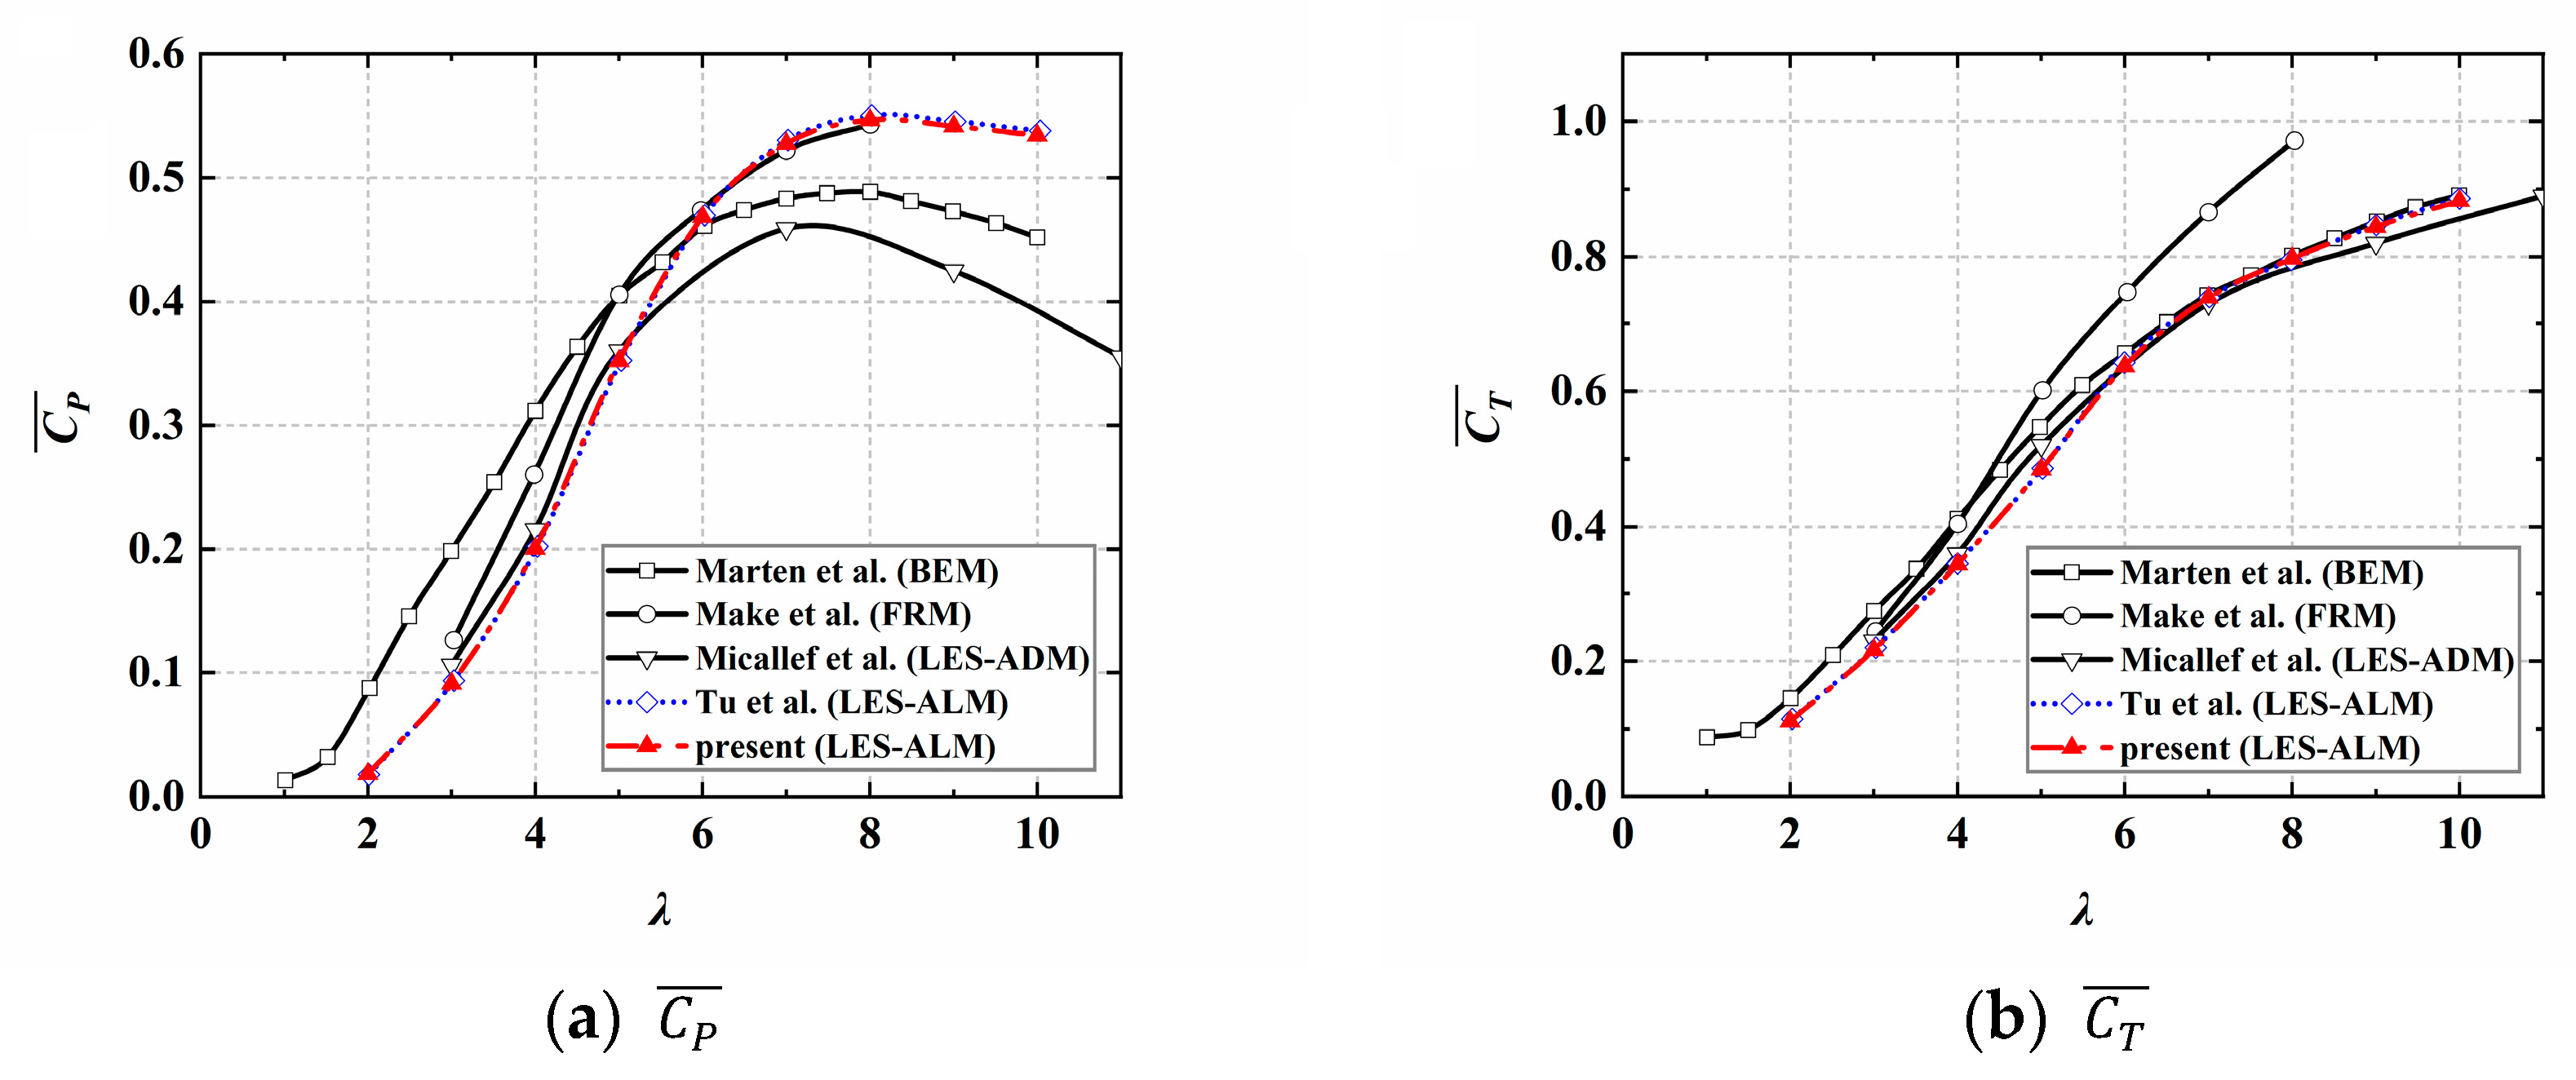
3.3. Comparison and Validation with Existing Literature Results
4. Three-Turbine Array Configuration
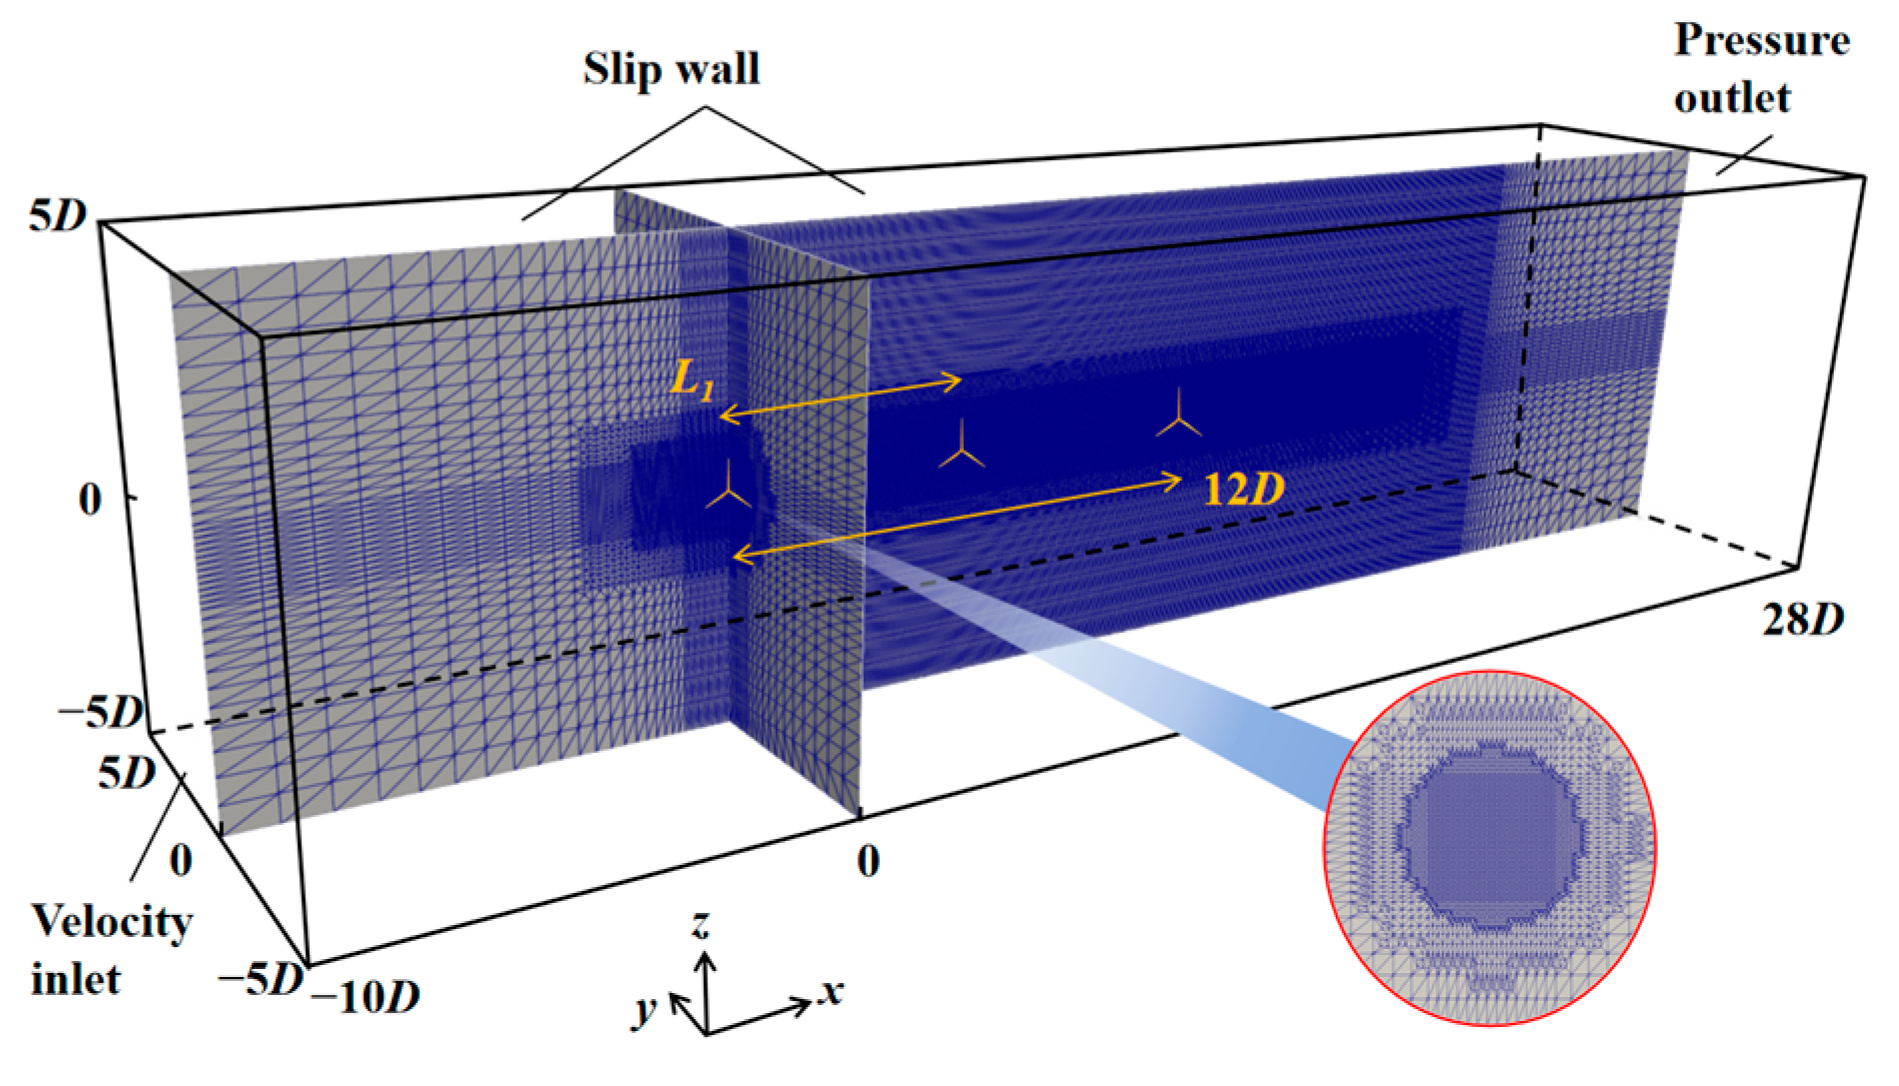
4.1. Three-Turbine Configuration and Computational Domain Grid Division under Full Wake Cases
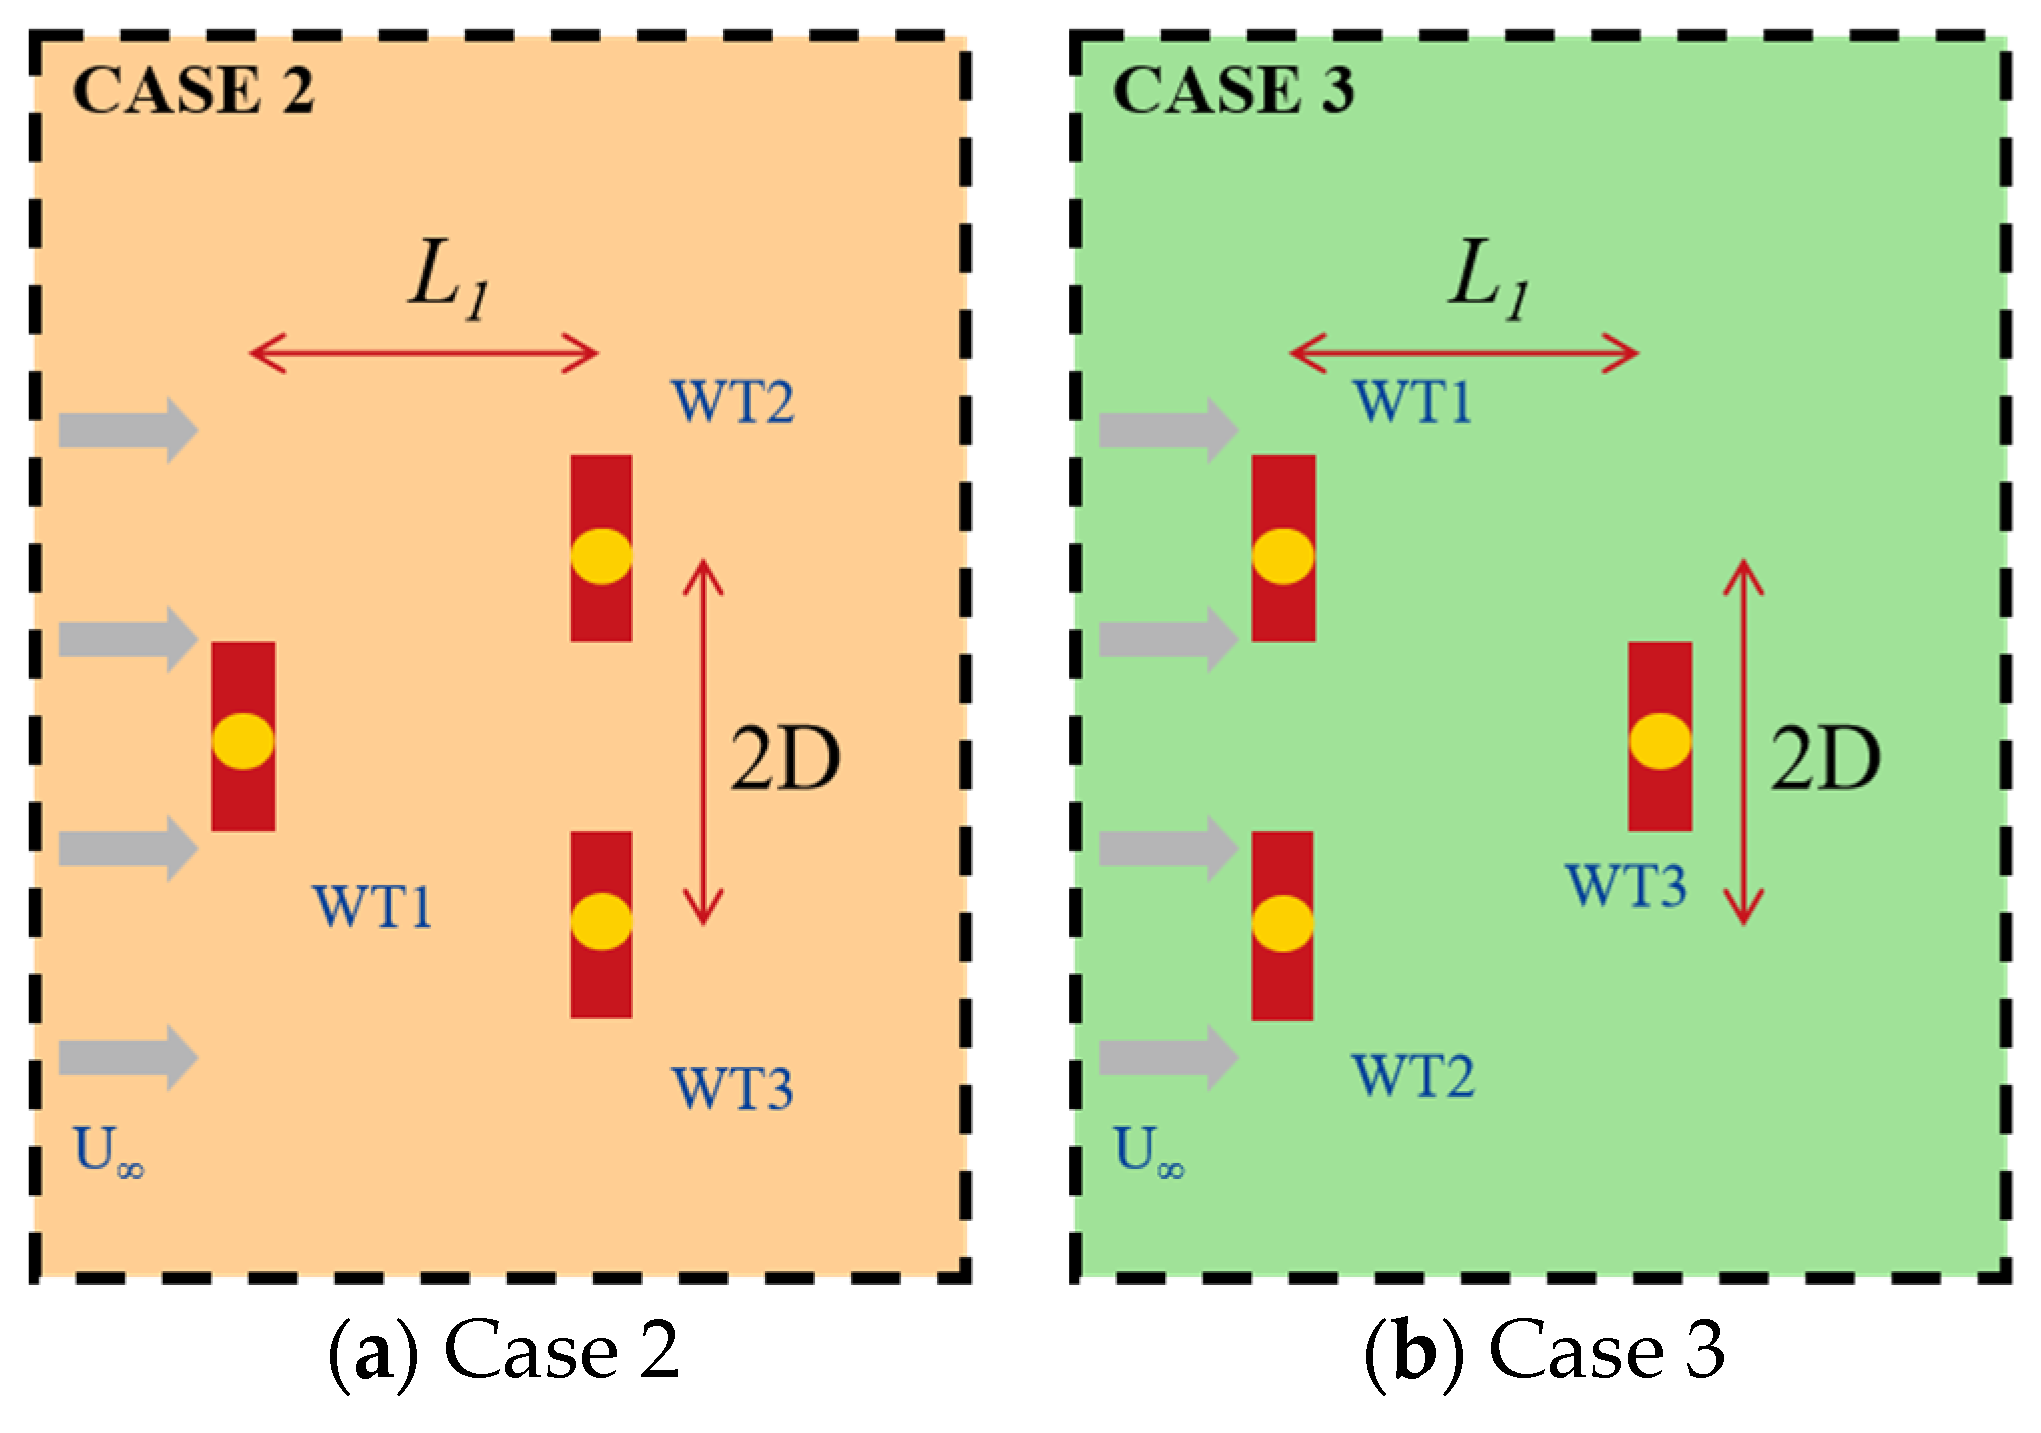
4.2. Cases of Three Turbines under Staggered Arrangement
5. Comparative Analysis of Three-Turbine Simulation Results
5.1. Three Turbines under Full Wake Conditions
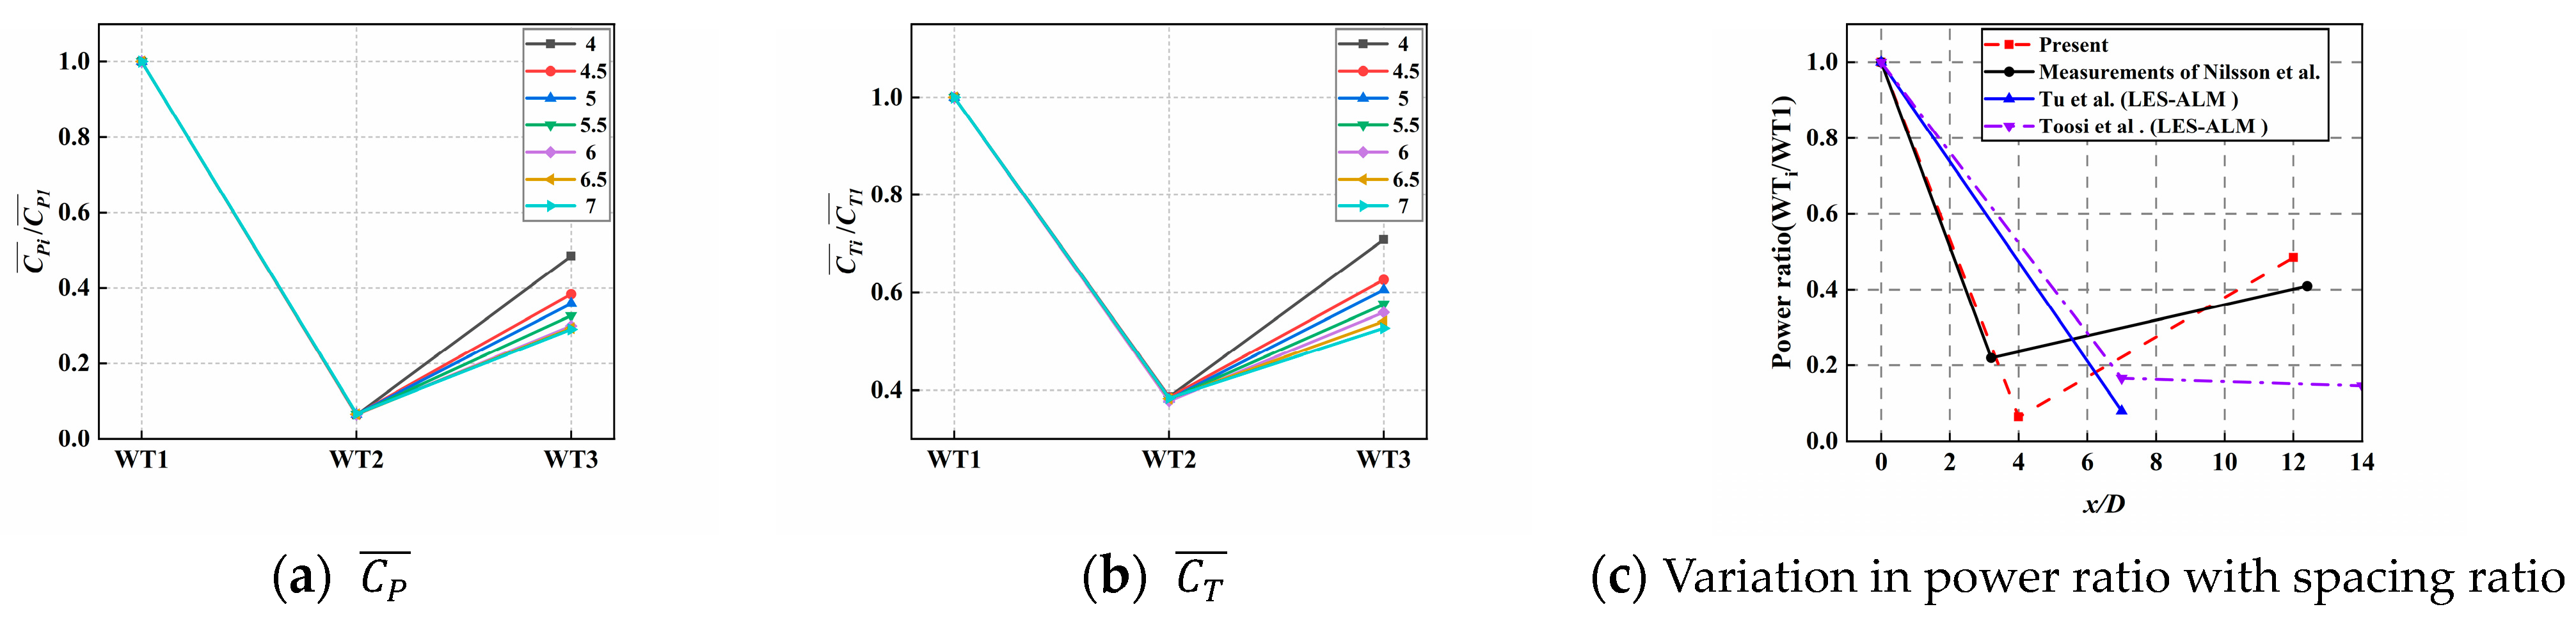
5.1.1. Comparison of Aerodynamic Performance Results
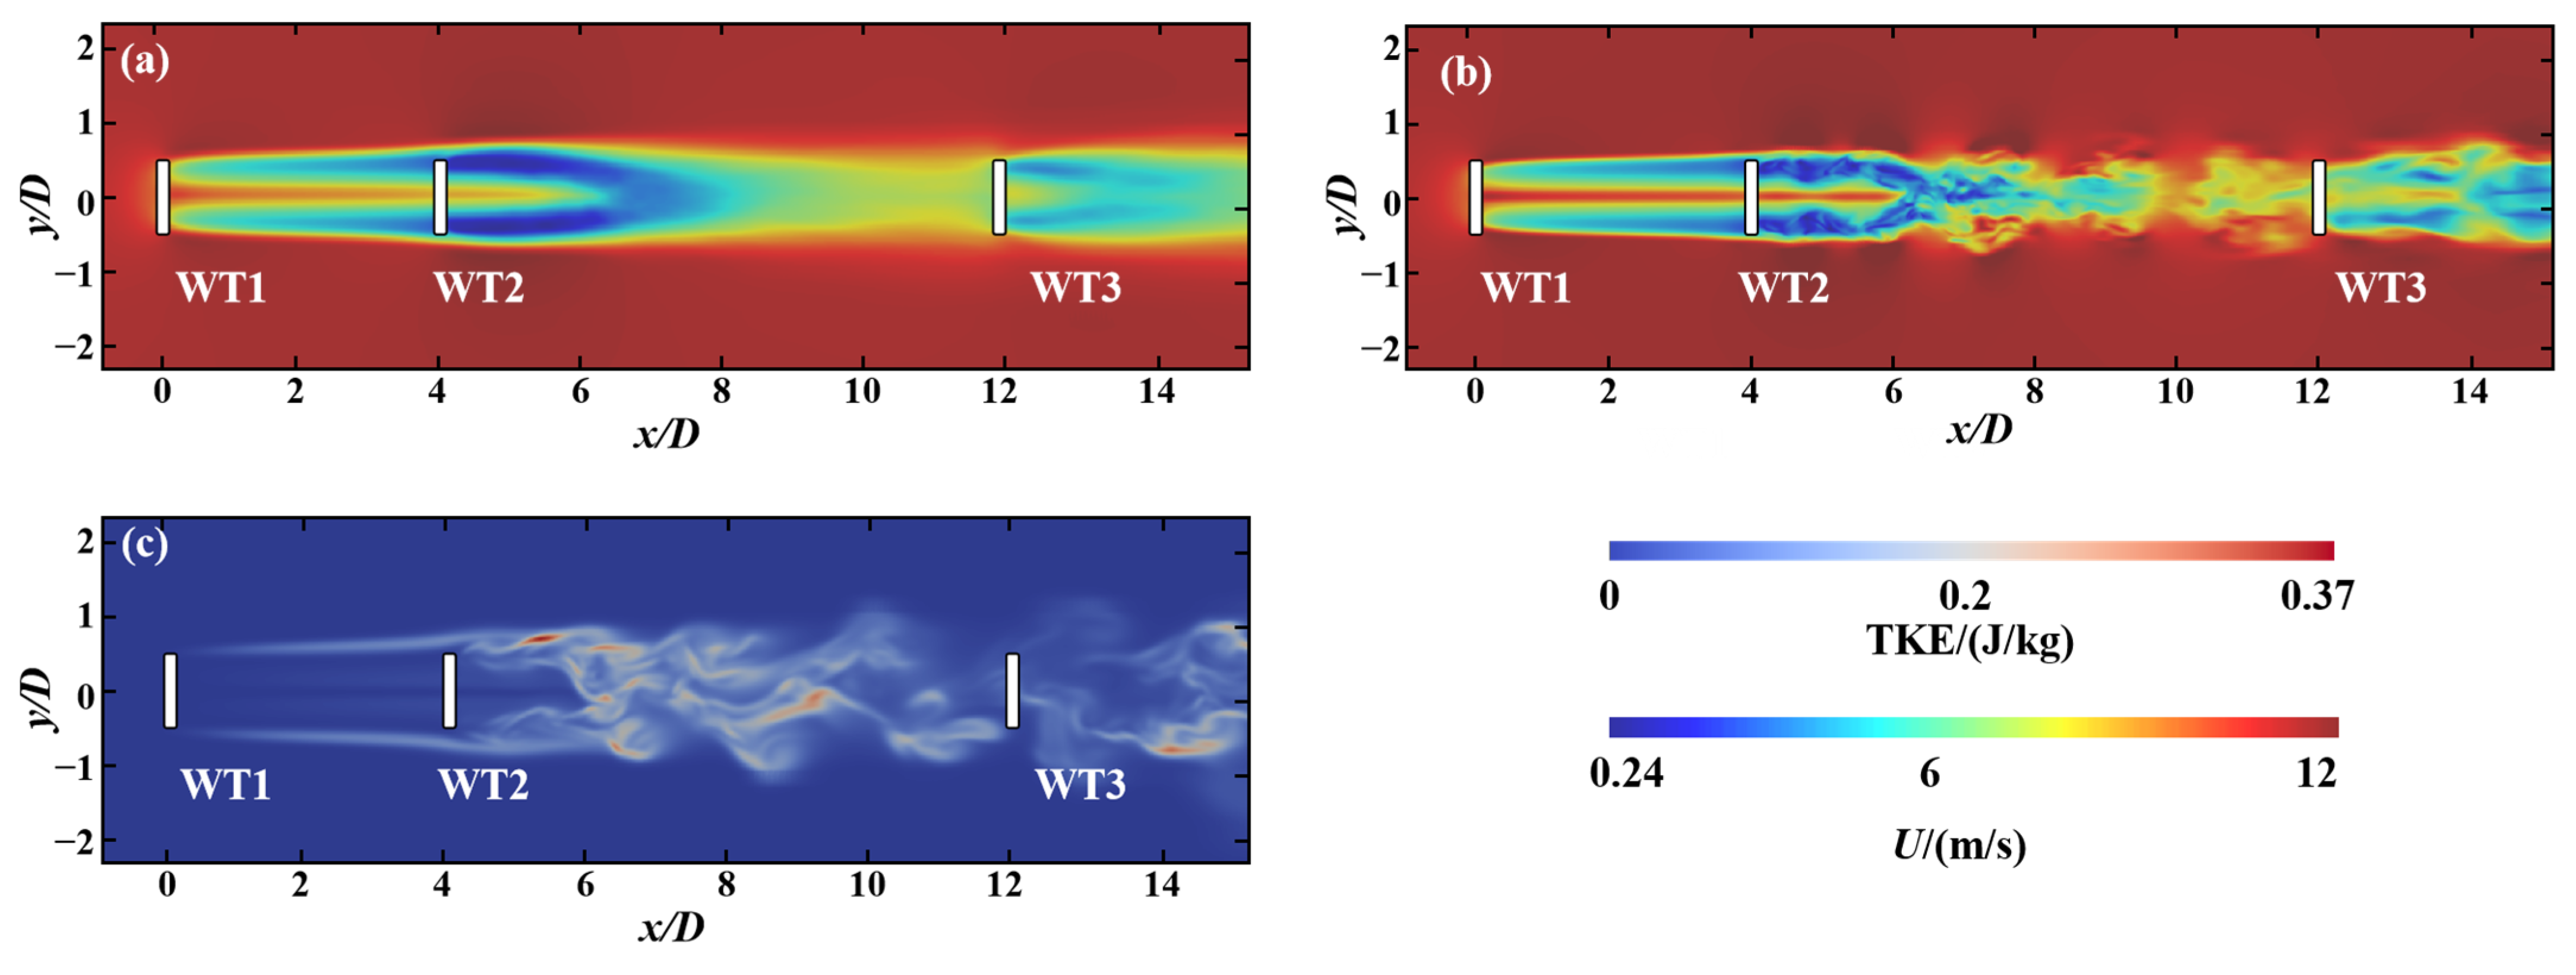
5.1.2. Comparison of Wake Characteristics Results
5.1.3. Unsteady Aerodynamic Characteristics of Three Turbines under Full Wake Conditions
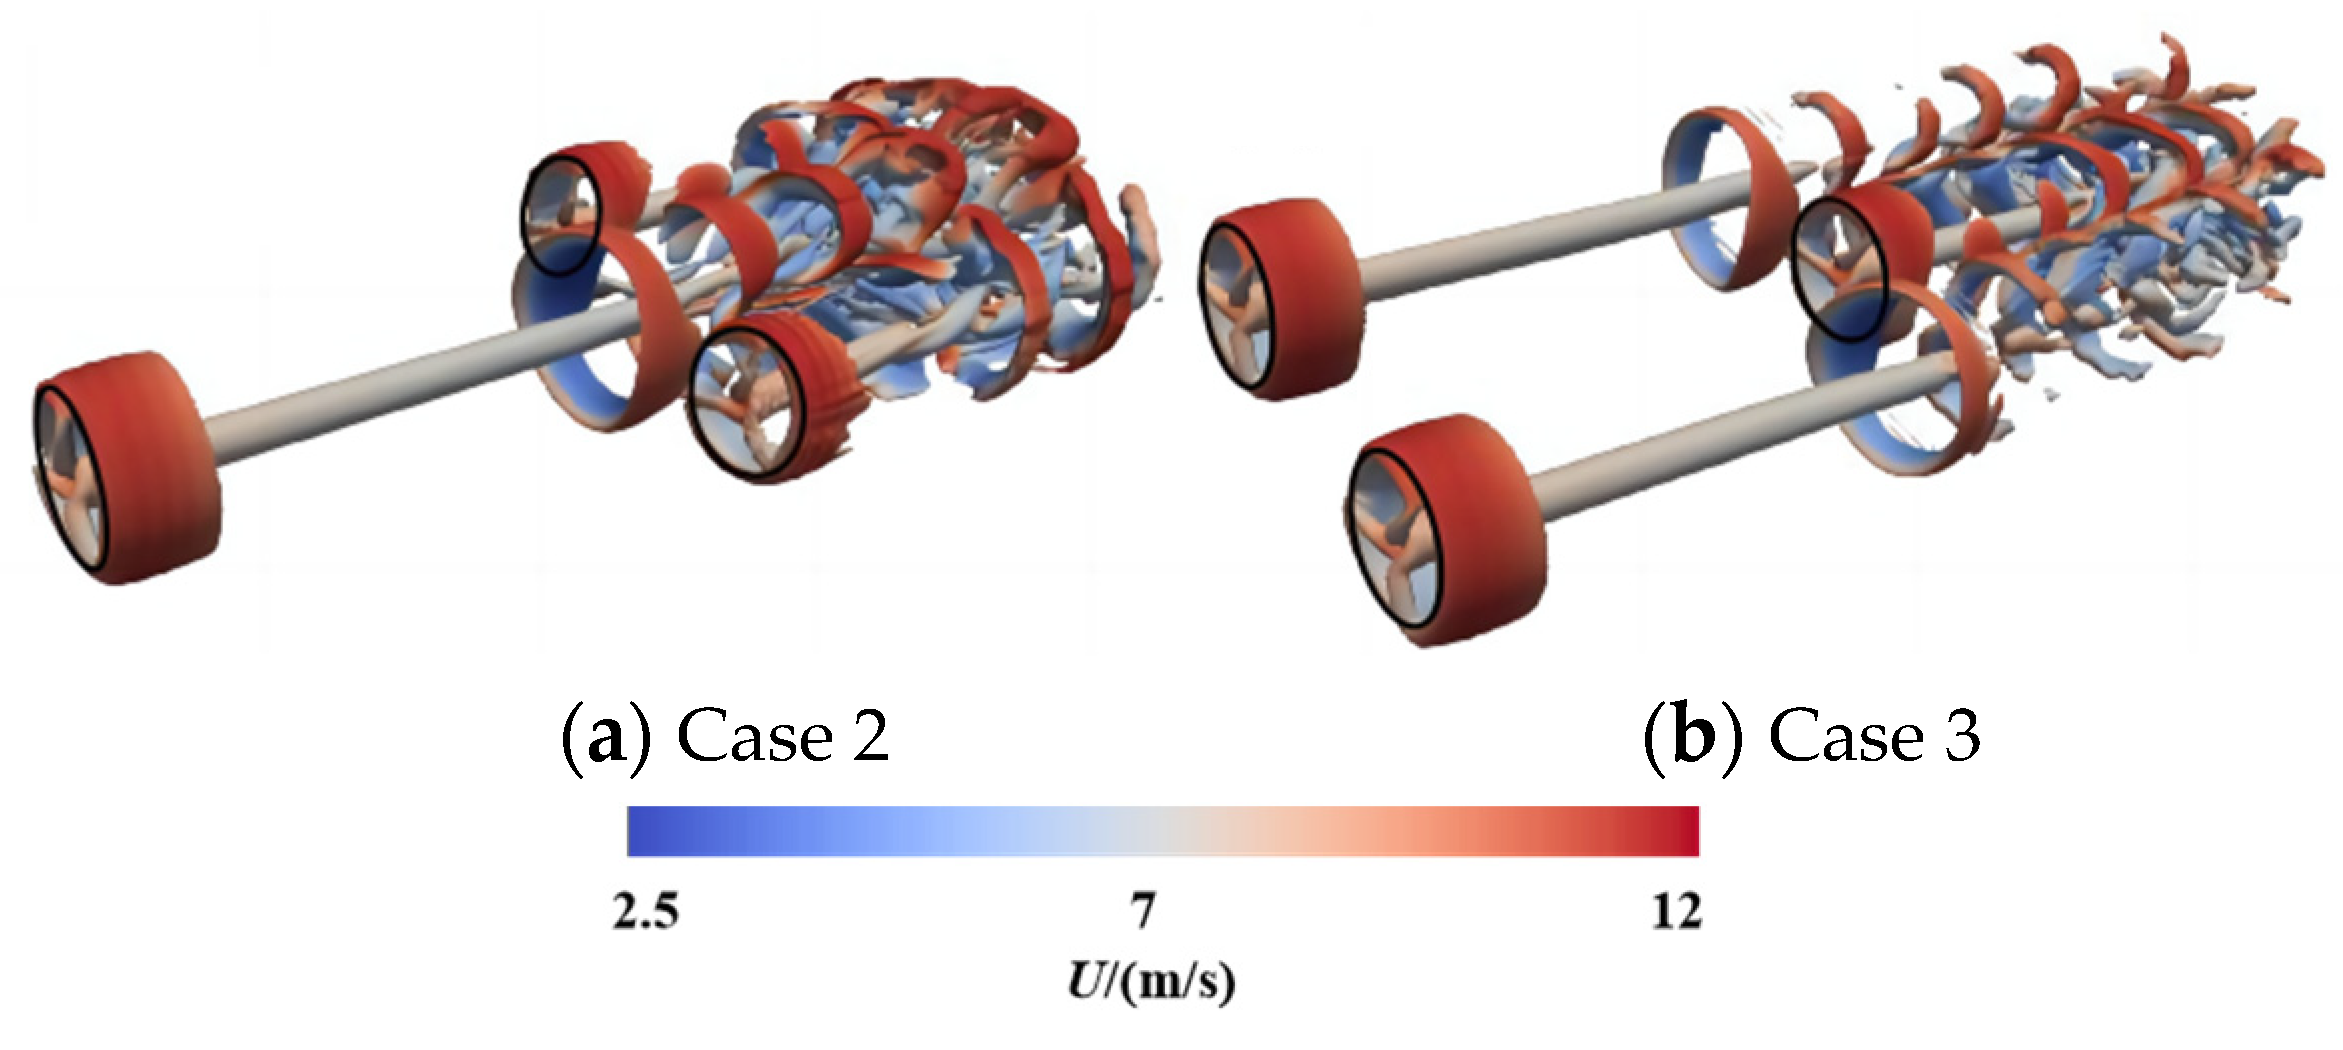
5.2. Three Turbines under Staggered Cases
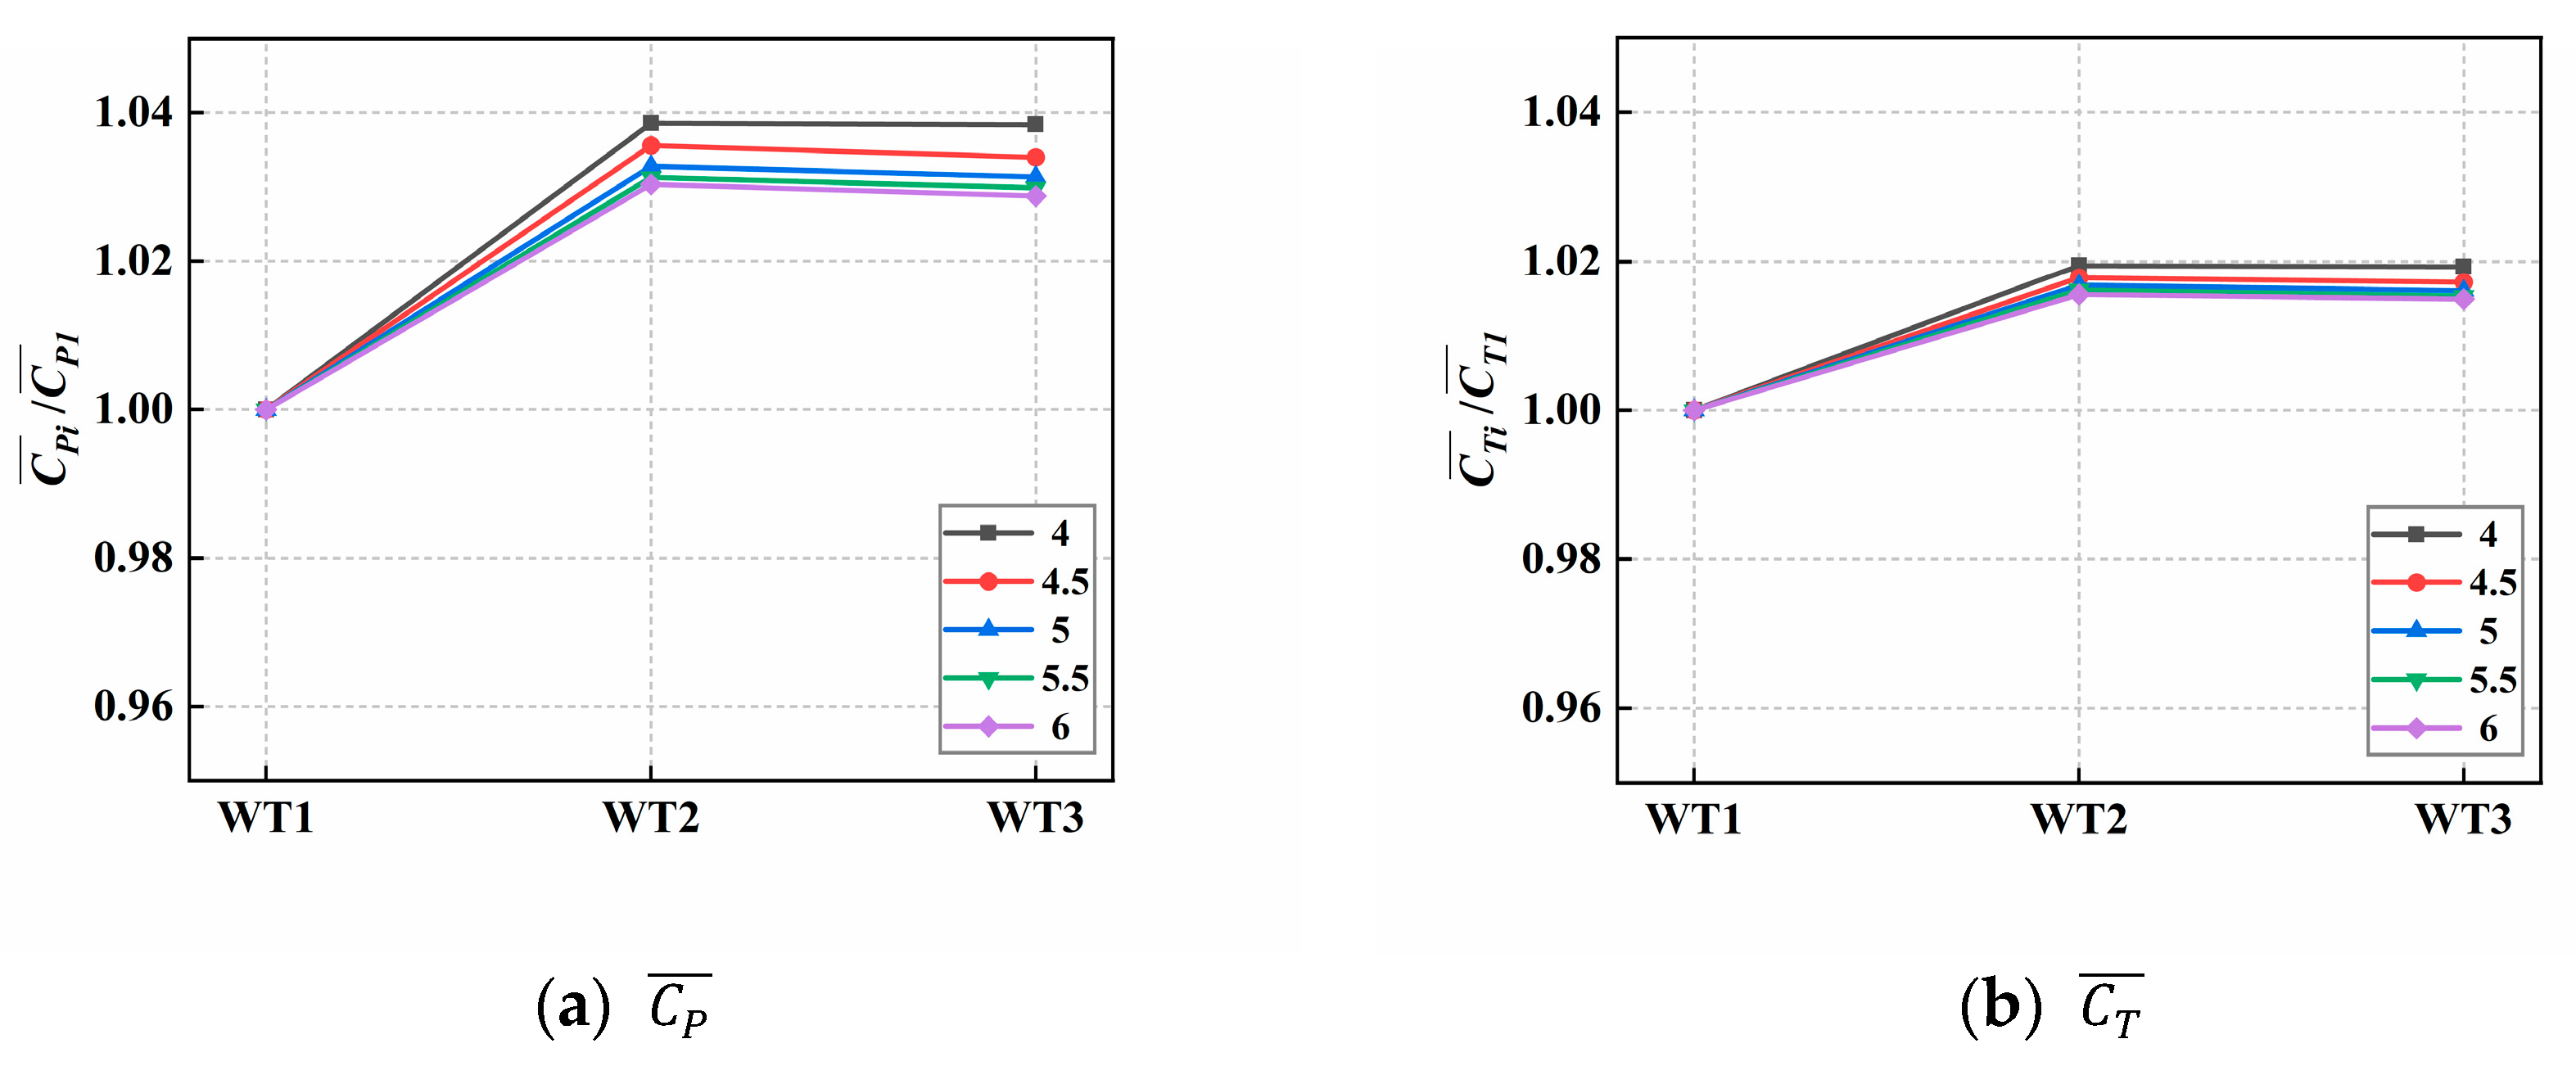
5.2.1. Comparison of Aerodynamic Performance Results
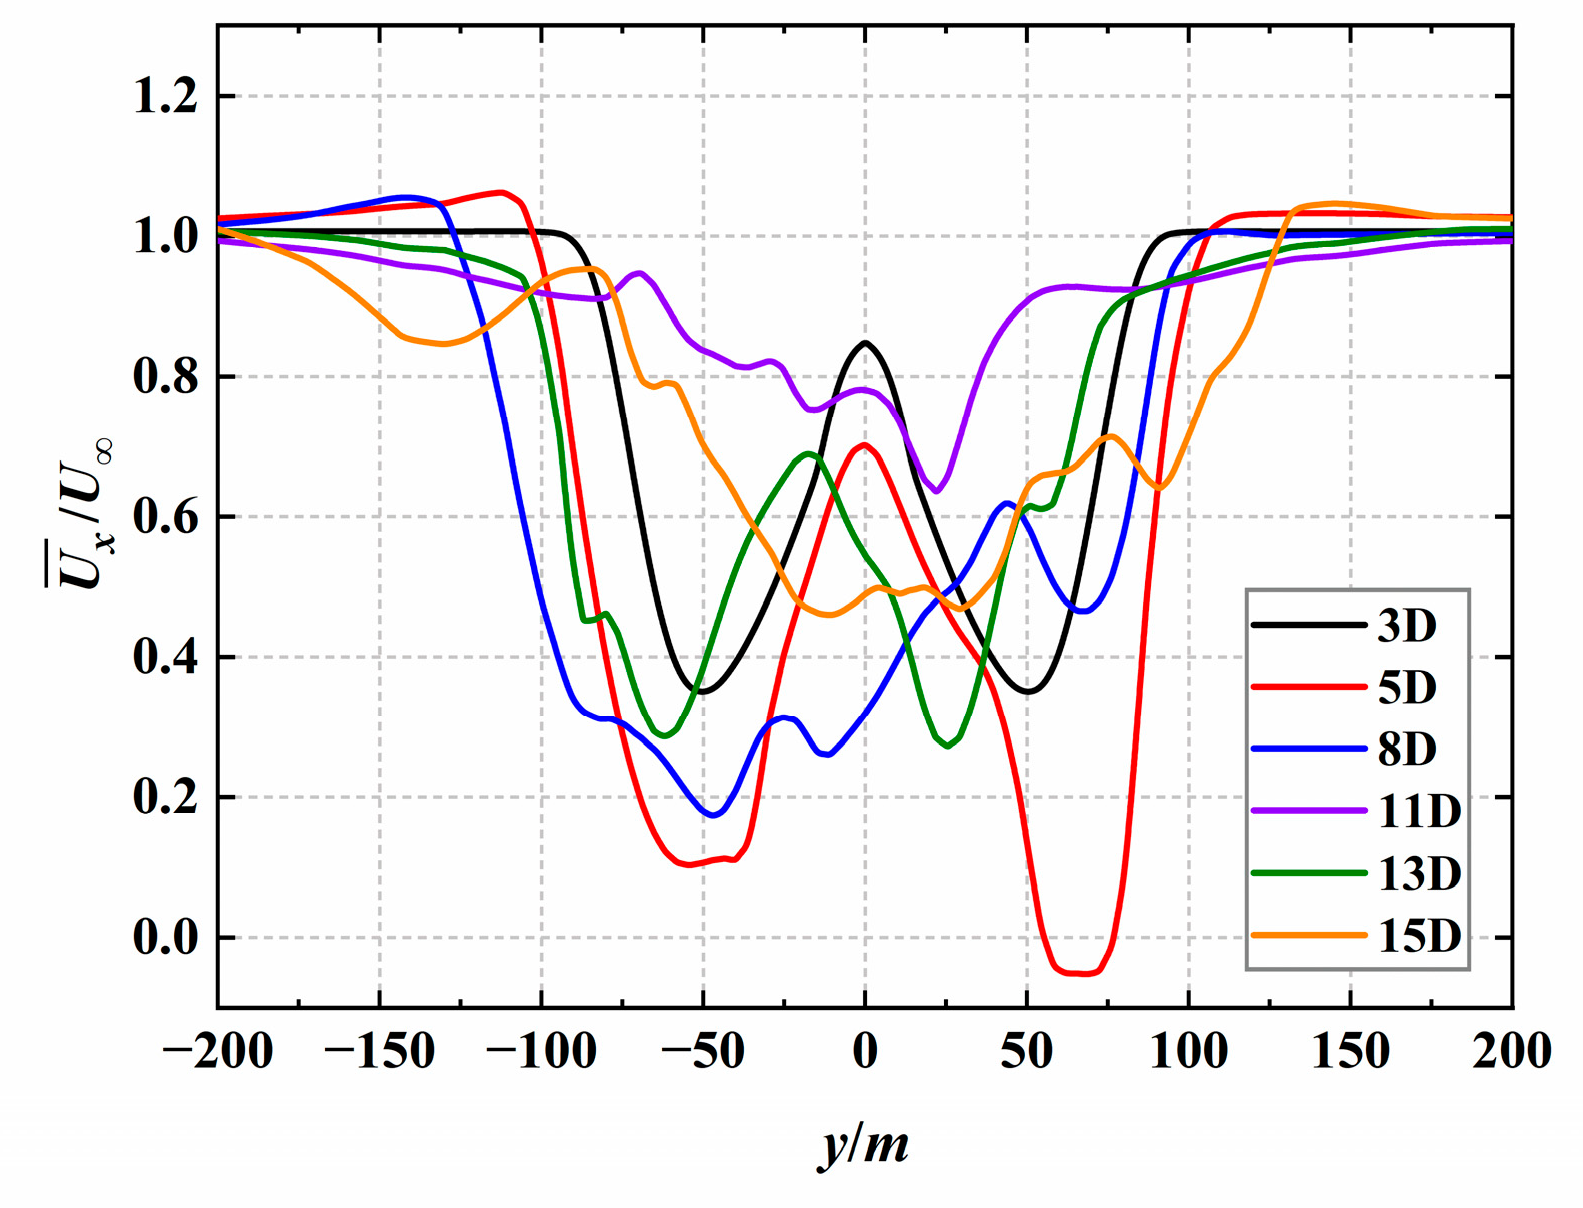
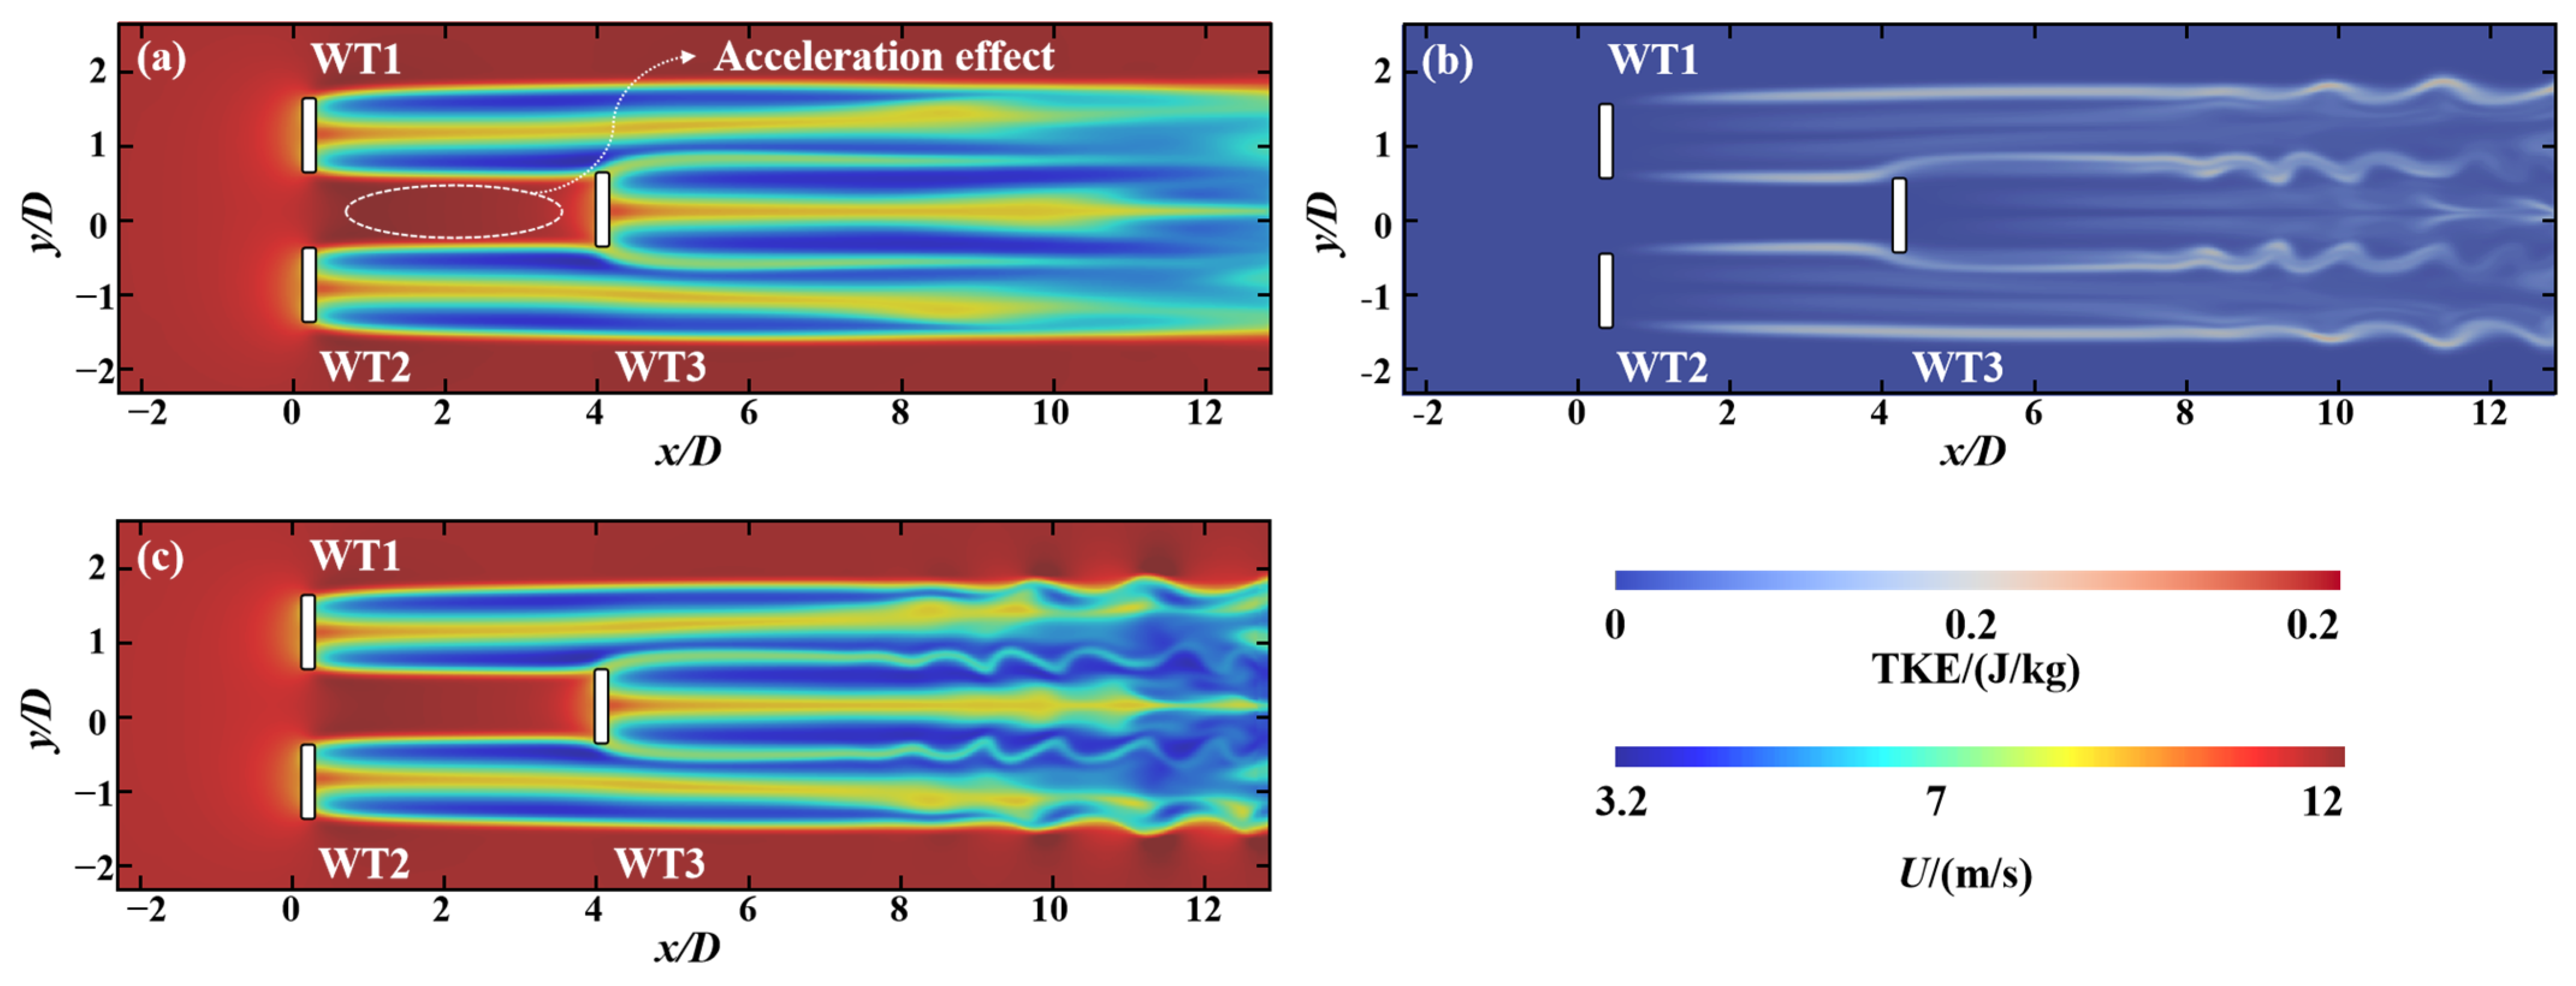
5.2.2. Comparison of Wake Characteristics Results
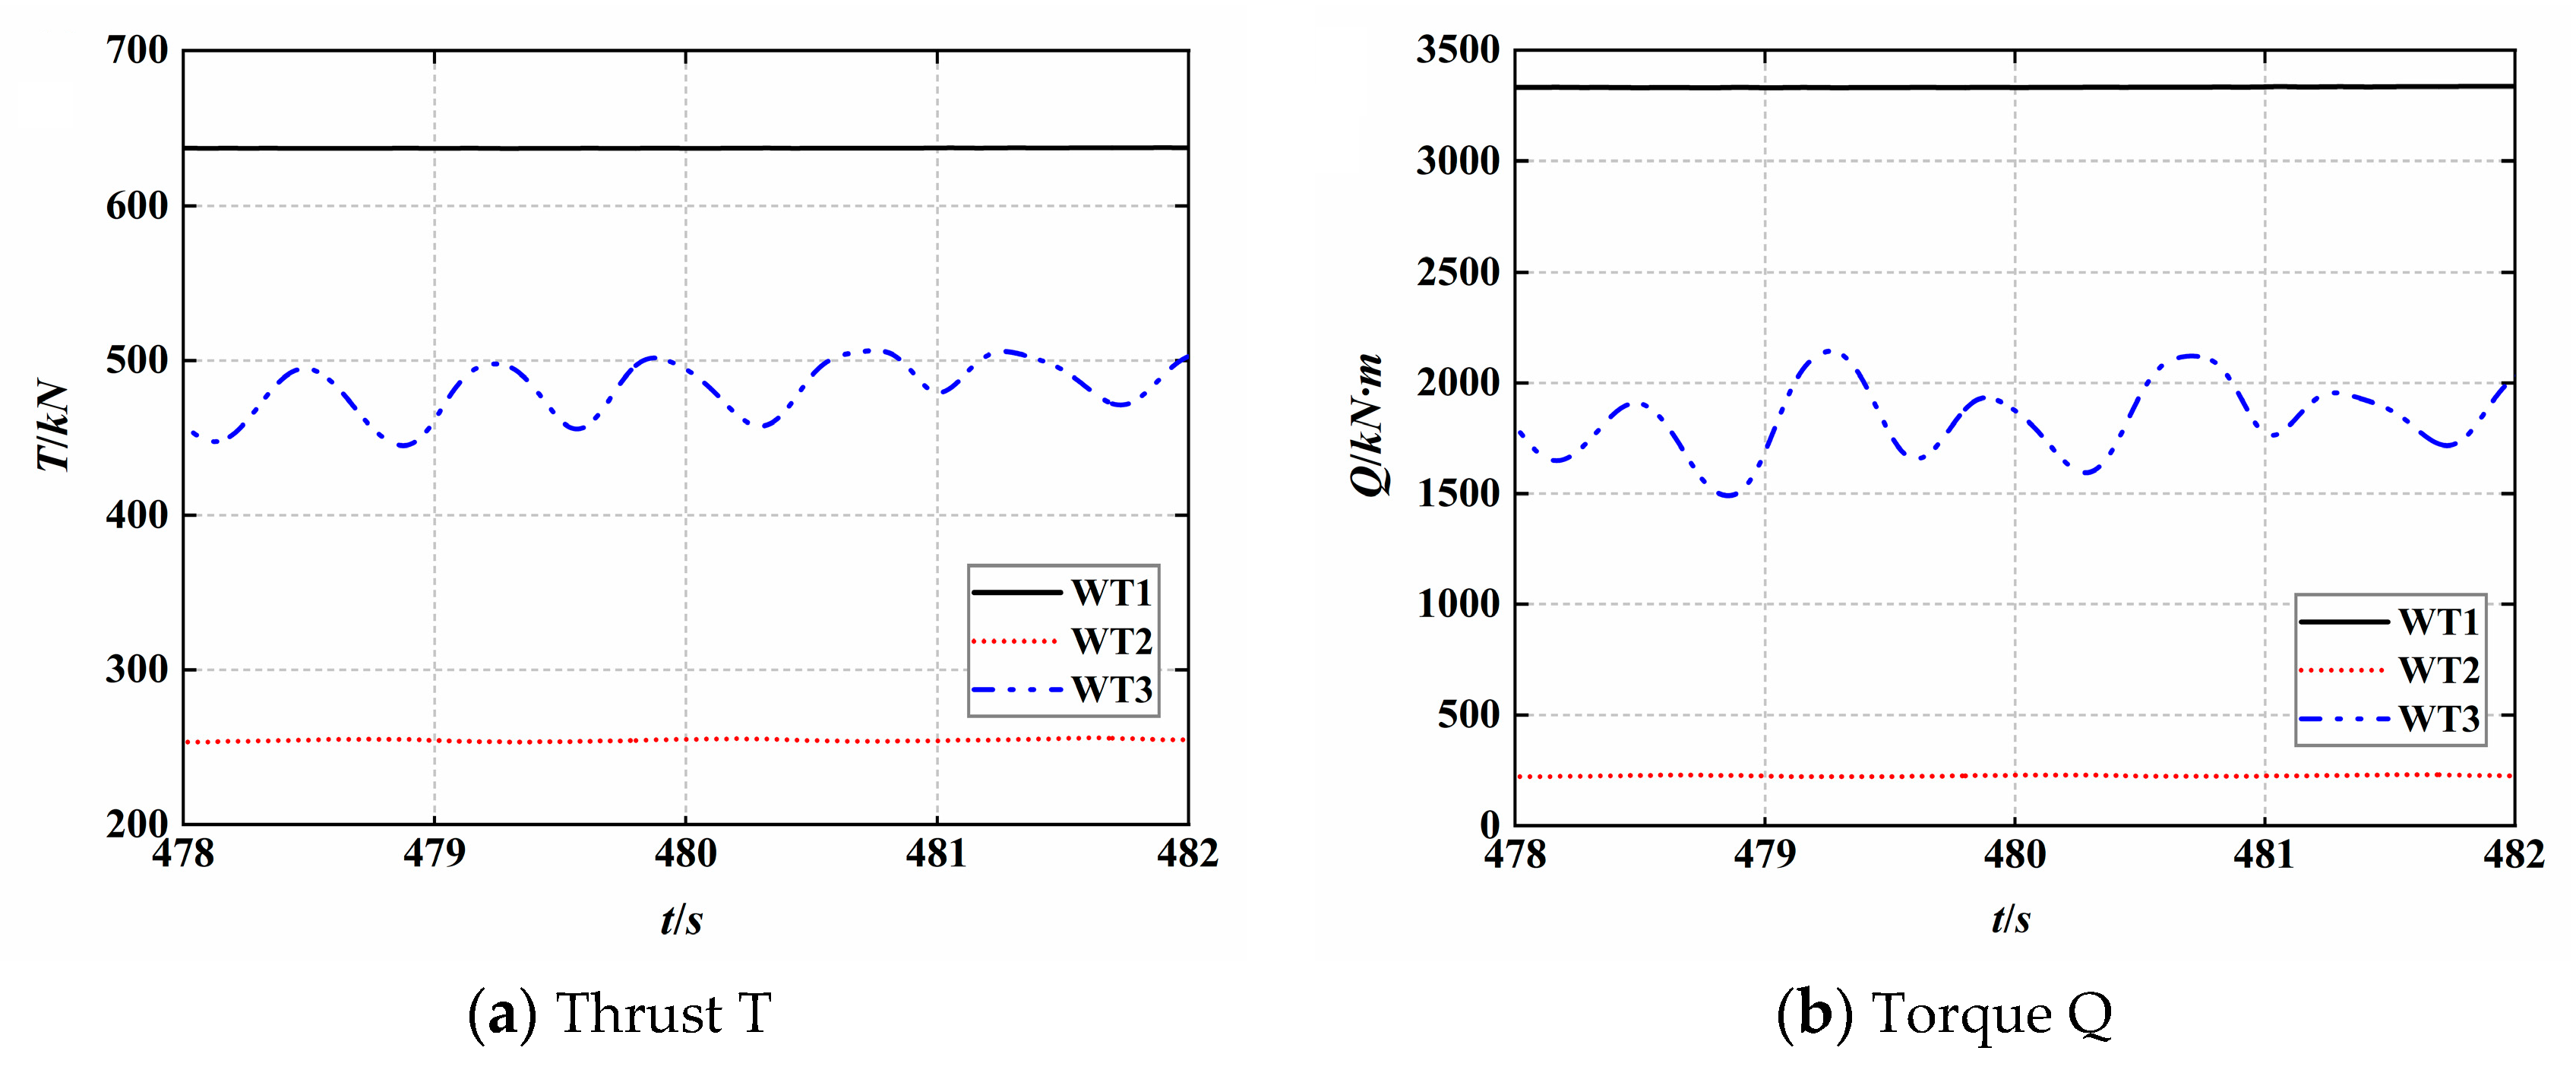
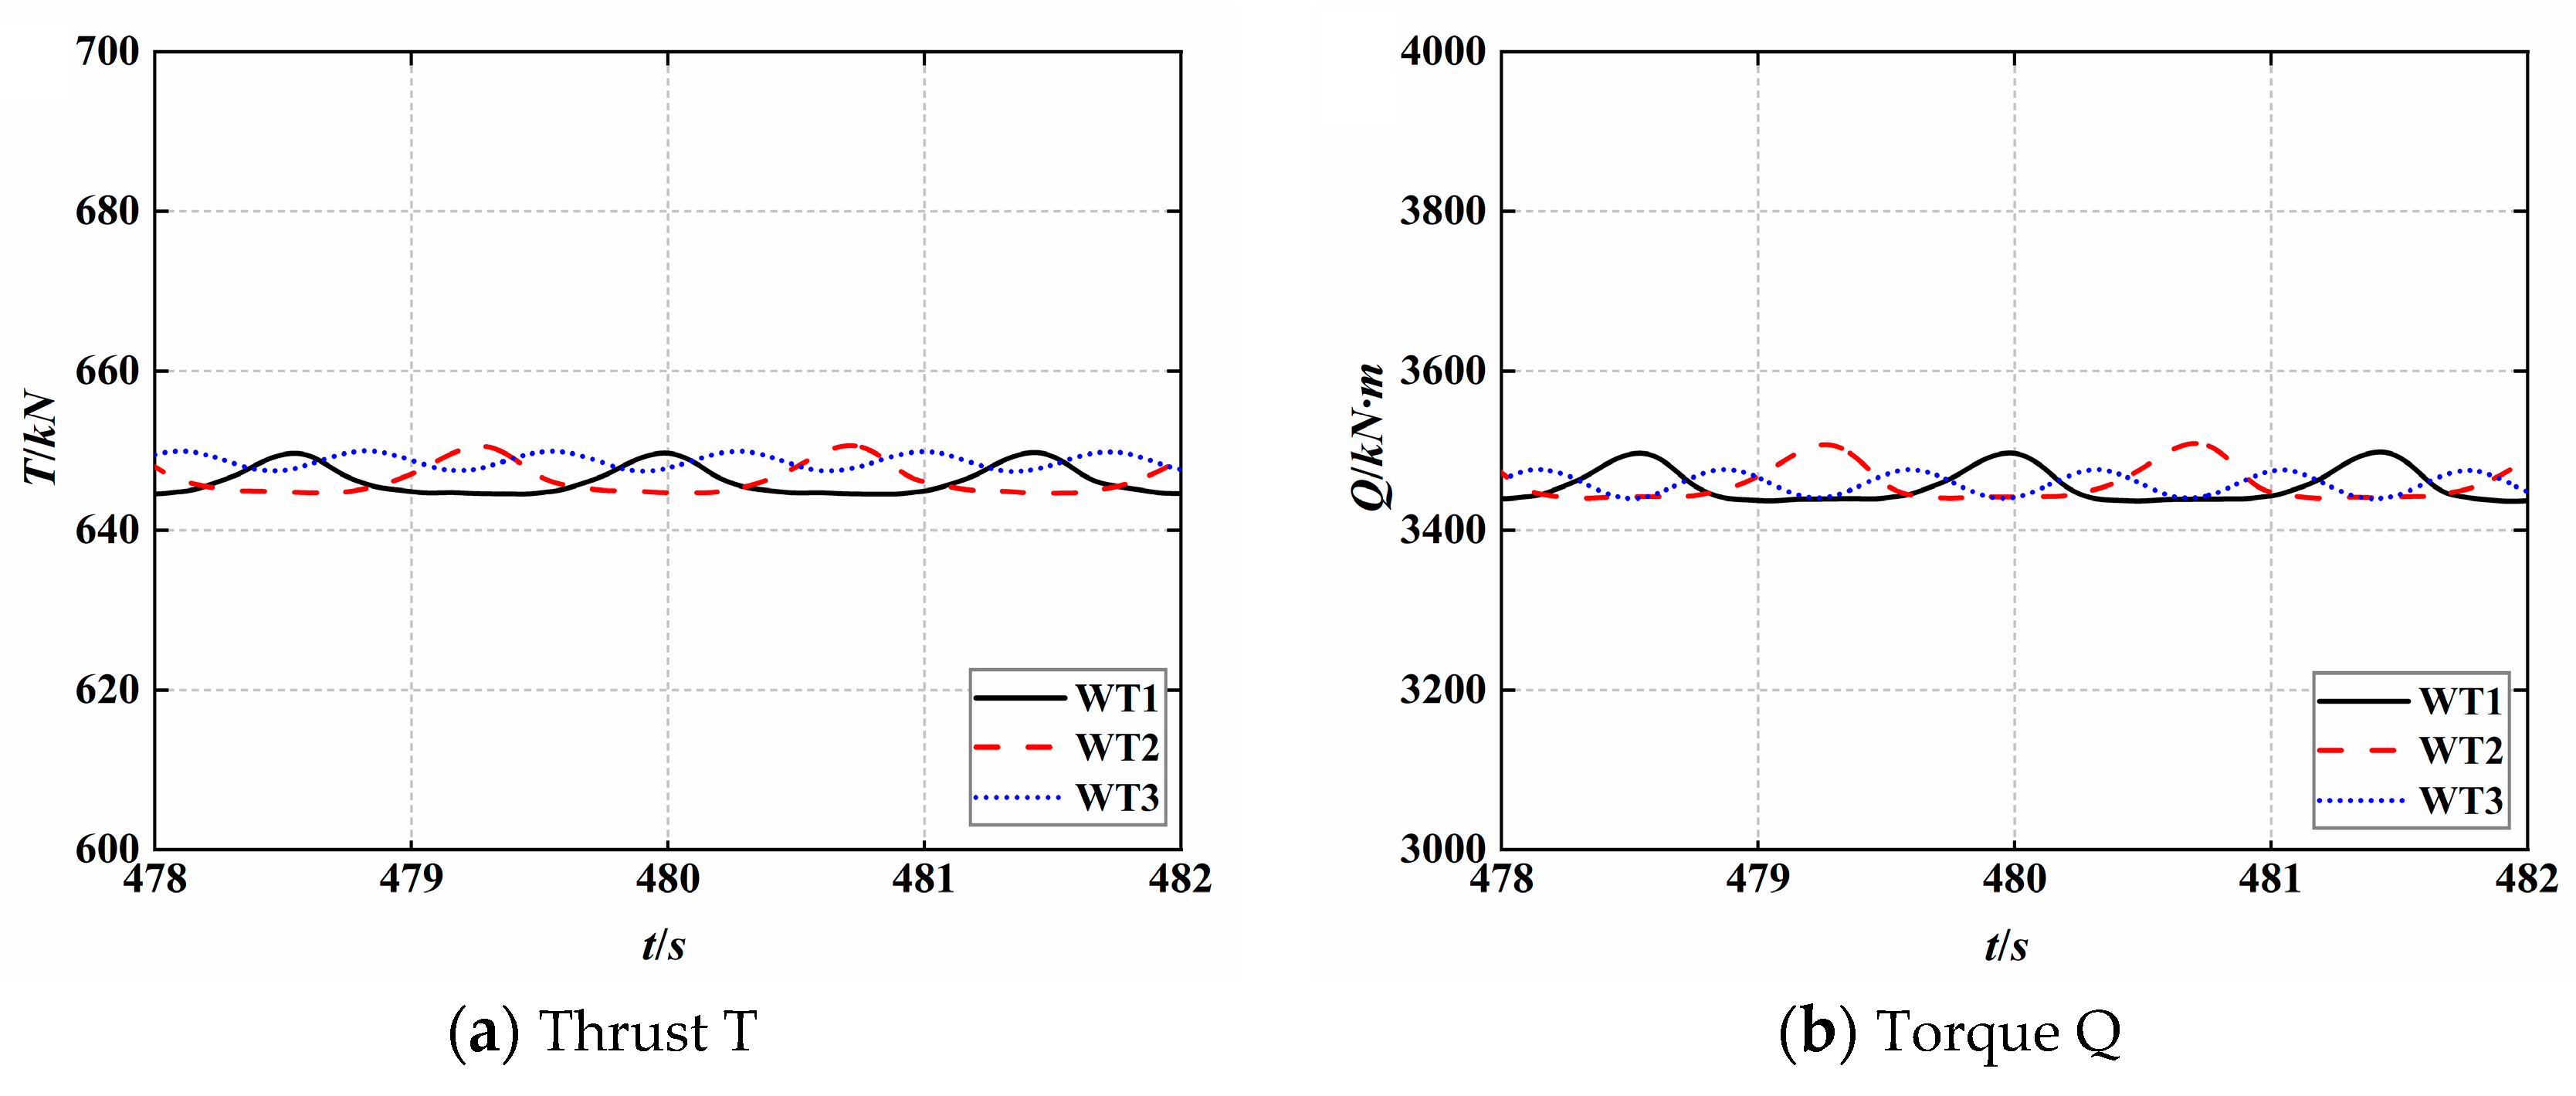
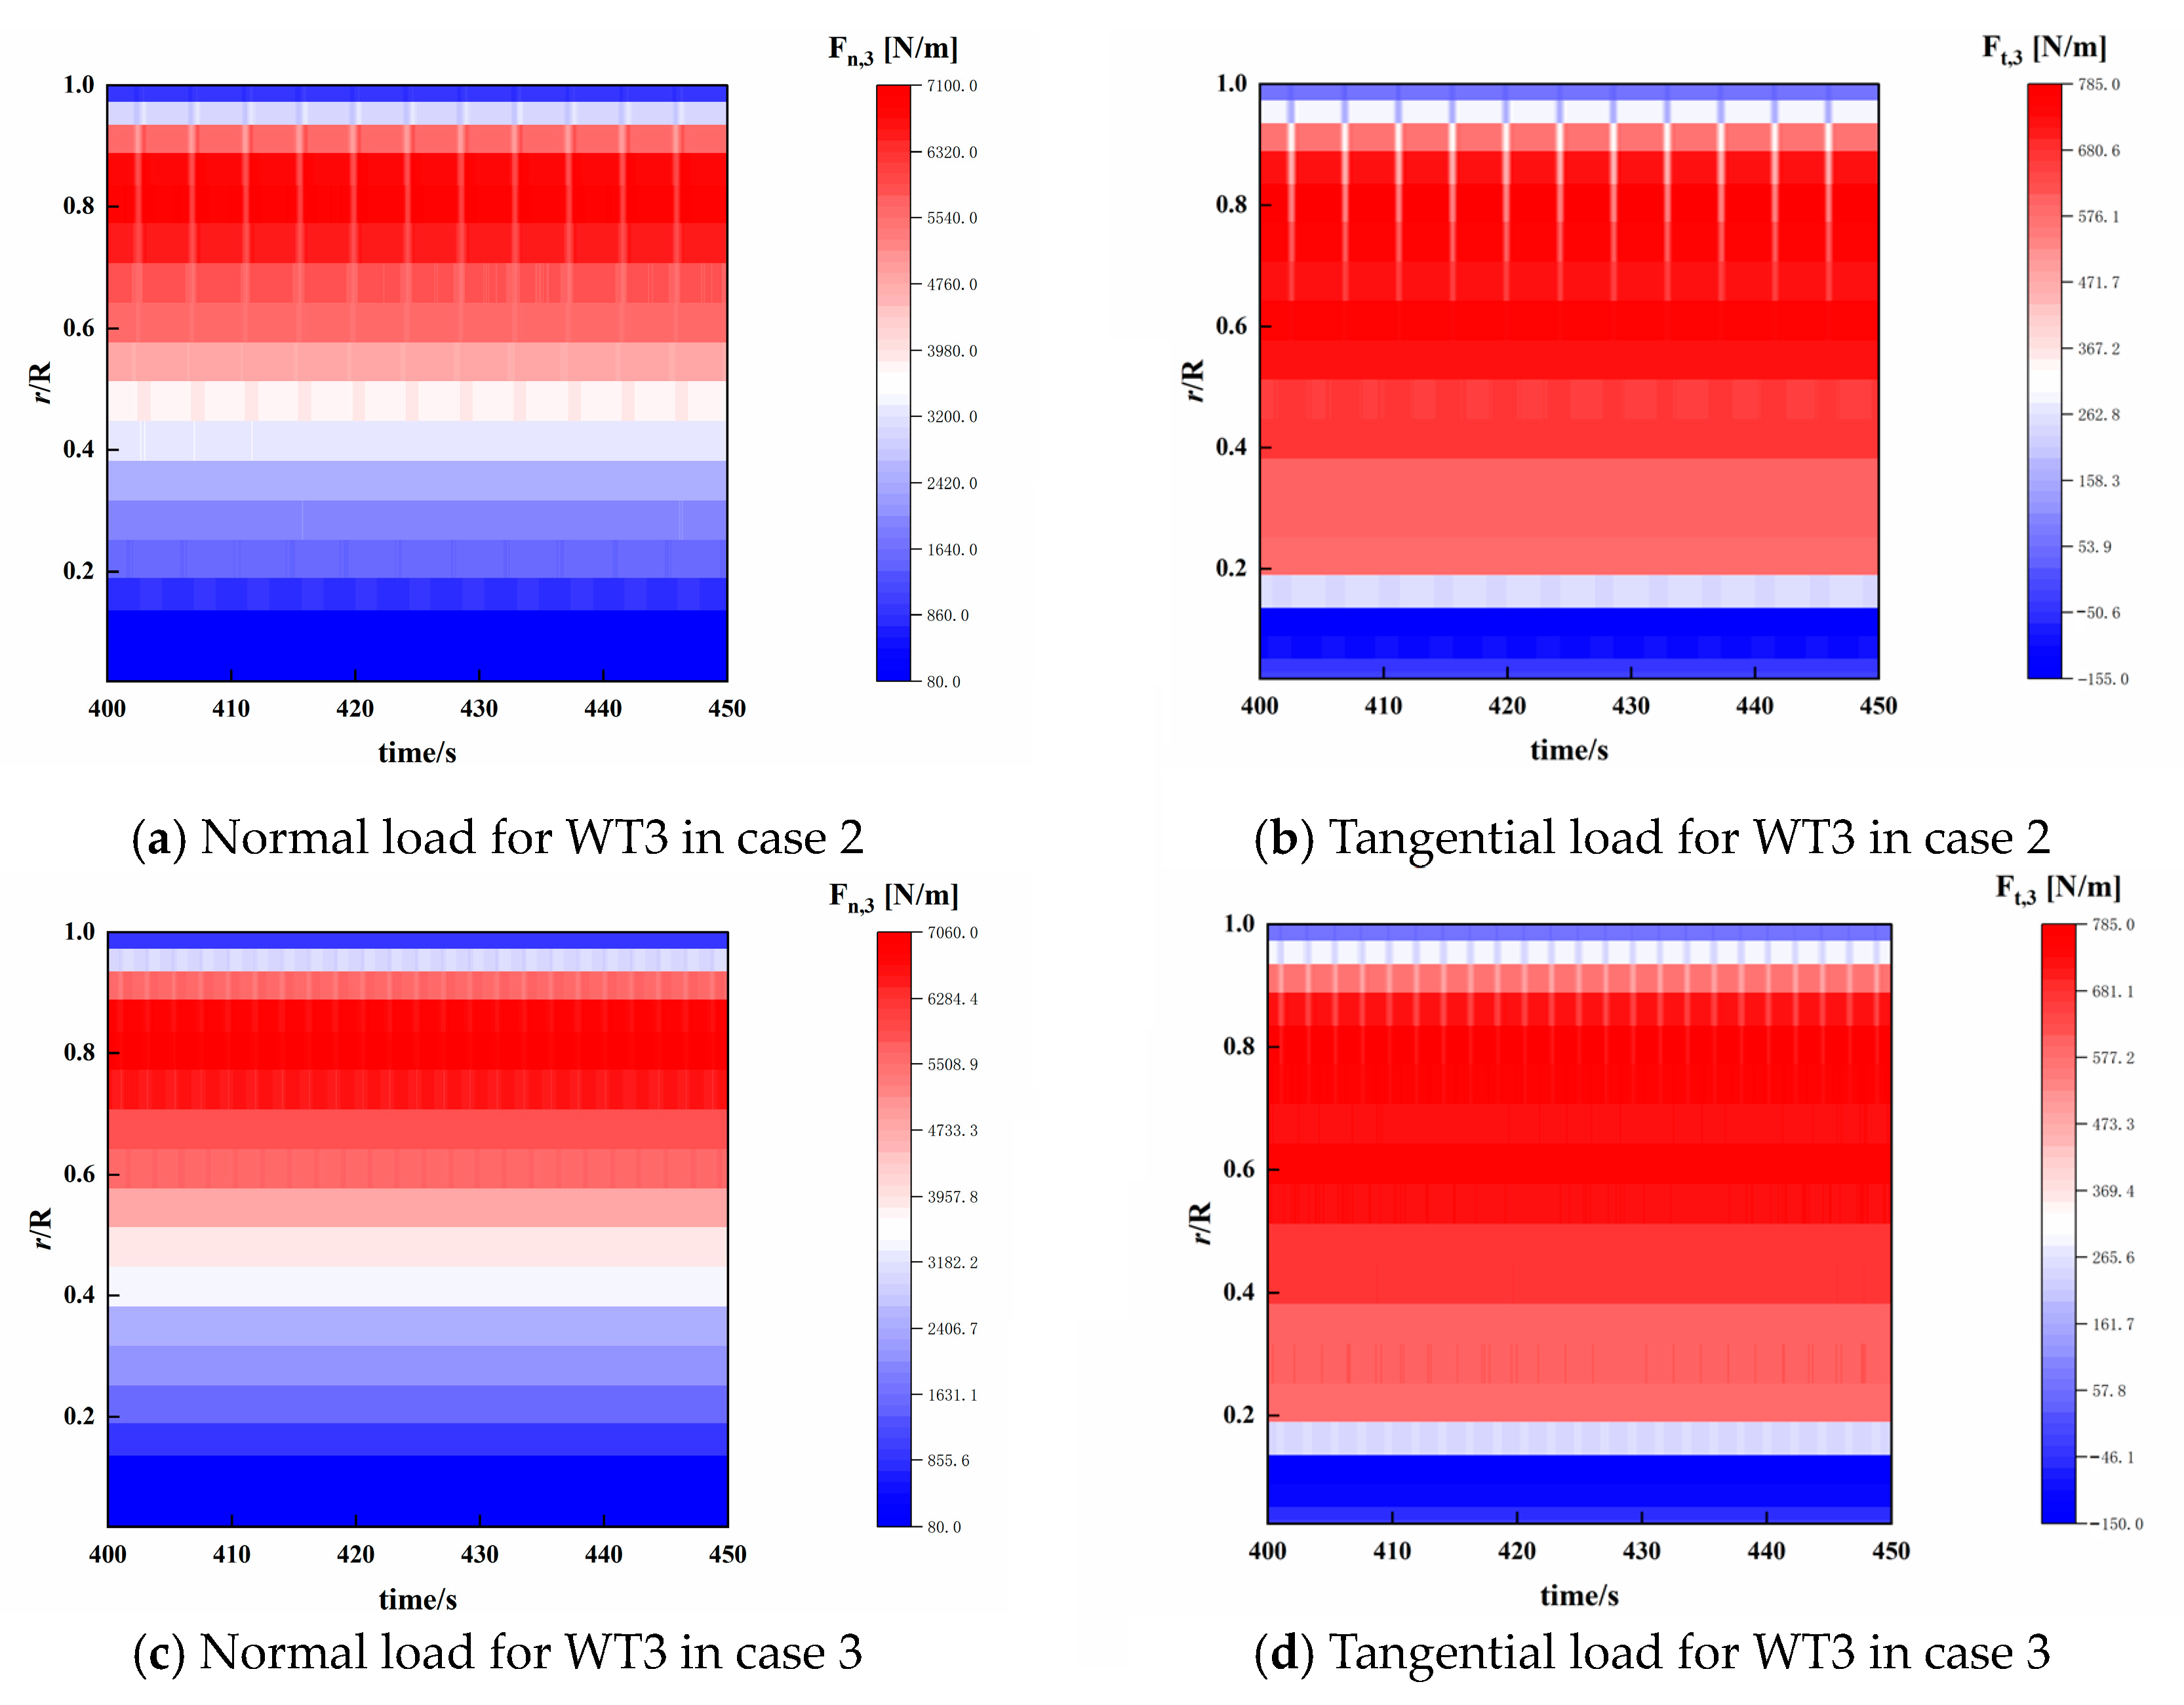
5.2.3. Unsteady Aerodynamic Characteristics of Three Turbines under Staggered Conditions
6. Conclusions
Author Contributions
Funding
Institutional Review Board Statement
Informed Consent Statement
Data Availability Statement
Conflicts of Interest
Abbreviations
| Nomenclature | |
| Ct | Thrust coefficient [-] |
| Cp | Power coefficient [-] |
| Mean thrust coefficient [-] | |
| Mean power coefficient [-] | |
| L1 | Distance between the upstream and downstream turbines [m] |
| D | Rotor diameter [m] |
| k* | Turbulent kinetic energy [J/kg] |
| P | Power output [MW] |
| Q | Torque of the rotor [N·m] |
| T | Thrust of the rotor [kN] |
| S | Distance in the Y direction between the turbines [m] |
| U∞ | Wind speed [m/s] |
| Mean wake velocity [m/s] | |
| Greek letters | |
| ρ | Fluid density [kg/m3] |
| λ | Tip speed ratio |
| Ω | The rotation speed of the rotor [r/s] |
| Abbreviations | |
| 3D | Three dimensional |
| SGS | Subgrid-scale |
| FRM | Fully resolved mesh |
| BEM | Blade element momentum theory |
| CFD | Computational fluid dynamics |
| LES | Large Eddy Simulation |
| ALM | Offshore floating wind turbine |
| TSR | Tip speed ratio |
| TI | Turbulence intensity |
| RANS | Reynolds Averaged Navier–Stokes |
| WT1 | Wind turbine 1 |
| WT2 | Wind turbine 2 |
| WT3 | Wind turbine 3 |
References
- Vargas, S.A.; Esteves, G.R.T.; Maçaira, P.M.; Bastos, B.Q.; Oliveira, F.L.C.; Souza, R.C. Wind power generation: A review and a research agenda. J. Clean. Prod. 2019, 218, 850–870. [Google Scholar] [CrossRef]
- Chen, G.; Liang, X.; Li, X. Modelling of wake dynamics and instabilities of a floating horizontal-axis wind turbine under surge motion. Energy 2022, 239, 122110. [Google Scholar] [CrossRef]
- Li, J.; Wang, G.; Li, Z.; Yang, S.; Chong, W.T.; Xiang, X. A review on development of offshore wind energy conversion system. Int. J. Energy Res. 2020, 44, 9283–9297. [Google Scholar] [CrossRef]
- Liu, J.; Ma, L.; Wang, Q.; Fang, F.; Zhu, Y. Offshore Wind Power Supports China’s Energy Transition. Strateg. Study CAE 2021, 23, 149–159. [Google Scholar]
- Wang, L.; Hong, Y.; Gao, Y.; Haung, M.; Guo, Z.; Lai, Y.; Zhu, R.; Yang, Q.; Hc, B. Dynamic catastrophe and control of offshore wind power structures in typhoon environment. Chin. J. Theor. Appl. Mech. 2023, 55, 567–587. [Google Scholar]
- Barthelmie, R.J.; Hansen, K.; Frandsen, S.T.; Rathmann, O.; Schepers, J.G.; Schlez, W.; Phillips, J.; Rados, K.; Zervos, A.; Politis, E.S.; et al. Modelling and measuring flow and wind turbine wakes in large wind farms offshore. Wind Energy 2010, 12, 431–444. [Google Scholar] [CrossRef]
- Reddy, S.R. Wind Farm Layout Optimization (WindFLO): An advanced framework for fast wind farm analysis and optimization. Appl Energy 2020, 269, 115090. [Google Scholar] [CrossRef]
- Wu, Y.; Lin, C.; Chang, T. Effects of inflow turbulence intensity and turbine arrangements on the power generation efficiency of large wind farms. Wind Energy 2020, 23, 1640–1655. [Google Scholar] [CrossRef]
- Antonini, E.G.A.; Romero, D.A.; Amon, C.H. Optimal design of wind farms in complex terrains using computational fluid dynamics and adjoint methods. Appl. Energy 2020, 261, 114426. [Google Scholar] [CrossRef]
- Rezaeiha, A.; Micallef, D. Wake interactions of two tandem floating offshore wind turbines: CFD analysis using actuator disc model. Renew. Energy 2021, 179, 859–876. [Google Scholar] [CrossRef]
- Wang, Y.; Li, C.; Miao, W.P. Layout Optimization of the Wind Farm in a Wind Power Station Based on Actuator Line Method. J. Chin. Soc. Power Eng. 2017, 37, 418–424. [Google Scholar]
- Strijhak, S.V.; Koshelev, K.B.; Kryuchkova, A.S. Simulation of turbulent wakes in model wind farm with arbitrary location for wind turbines. J. Phys. Conf. Ser. 2019, 1382, 12043. [Google Scholar] [CrossRef]
- Zhang, Z.; Kuang, L.; Zhao, Y.; Han, Z.; Zhou, D.; Tu, J.; Chen, M.; Ji, X. Numerical investigation of the aerodynamic and wake characteristics of a floating twin-rotor wind turbine under surge motion. Energy Convers. Manag. 2023, 283, 116957. [Google Scholar] [CrossRef]
- Guggeri, A.; Draper, M. Large Eddy Simulation of an onshore wind farm with the actuator line model including wind turbine’s control below and above rated wind speed. Energies 2019, 12, 3508. [Google Scholar] [CrossRef]
- Tu, Y.; Zhang, K.; Han, Z.; Zhou, D.; Bilgen, O. Aerodynamic characterization of two tandem wind turbines under yaw misalignment control using actuator line model. Ocean Eng. 2023, 281, 114992. [Google Scholar] [CrossRef]
- Xu, S.; Zhao, W.; Wan, D. Numerical study of dynamic characteristics for offshore wind turbine under complex atmospheric inflow. Chin. J. Theor. Appl. Mech. 2022, 54, 872–880. [Google Scholar]
- Bai, H.; Wan, D.; Wang, N. Numerical simulation of aerodynamic performance of three wind turbines with staggered strategies under atmospheric boundary layer flow. Chin. J. Hydrodyn. 2021, 36, 10–19. [Google Scholar]
- Toosi, M.E.N.; Rahmati, M. A Novel Wake Control Approach for Power Generation Improvement of Three Wind Turbines in a Wind Farm. Journal of Engineering for Gas Turbines and Power. J. Eng. Gas Turbines Power 2022, 144, 121001. [Google Scholar] [CrossRef]
- Sorensen, J.N.; Shen, W. Numerical modeling of wind turbine wakes. J. Fluids Eng. 2002, 124, 393–399. [Google Scholar] [CrossRef]
- Weller, H.G.; Tabor, G.; Jasak, H.; Fureby, C. A tensorial approach to computational continuum mechanics using object-oriented techniques. Comput. Phys. 1998, 12, 620–631. [Google Scholar] [CrossRef]
- Liu, L.; Franceschini, L.; Oliveira, D.F.; Galeazzo, F.C.; Carmo, B.S.; Stevens, R.J. Evaluating the accuracy of the actuator line model against blade element momentum theory in uniform inflow. Wind Energy 2022, 25, 1046–1059. [Google Scholar] [CrossRef]
- Zhang, K.; Bilgen, O. Multi-fidelity aerodynamic modeling of a floating offshore wind turbine rotor. In Proceedings of the ASME 2020 International Mechanical Engineering Congress and Exposition, Online, 16–19 November 2020. V010T10A061. [Google Scholar]
- Tian, K.; Zhang, Y.; Li, J.; Zhang, X.; You, Y. Numerical Wave Simulation Using Geometrical VOF Method Based on OpenFOAM. Shànghăi Jiāotōng Dàxué Xuébào 2021, 55, 1–10. [Google Scholar]
- Troldborg, N. Actuator Line Modeling of Wind Turbine Wakes; Technical University of Denmark: Kongens Lyngby, Denmark, 2008. [Google Scholar]
- Nakhchi, M.; Win Naung, S.; Rahmati, M. A novel hybrid control strategy of wind turbine wakes in tandem configuration to improve power production. Energy Convers. Manag. 2022, 260, 115575. [Google Scholar] [CrossRef]
- Jonkman, J.; Butterfield, S.; Musial, W.; Scott, G. Definition of a 5-MW Reference Wind Turbine for Offshore System Development; National Renewable Energy Lab. (NREL): Golden, CO, USA, 2009.
- Zhang, Y.; Cai, X.; Lin, S.; Wang, Y.; Guo, X. CFD Simulation of Co-Planar Multi-Rotor Wind Turbine Aerodynamic Performance Based on ALM Method. Energies 2022, 15, 6422. [Google Scholar] [CrossRef]
- Zhang, W.; Wang, Y.; Shen, Y.; Wang, Y.; Xu, Y.; Zhang, X. CFD Studies of Wake Characteristics and Power Capture of Wind Turbines with Trailing Edge Flaps. IEEE Access 2020, 8, 7349–7361. [Google Scholar] [CrossRef]
- Martínez-Tossas, L.A.; Churchfield, M.J.; Leonardi, S. Large eddy simulations of the flow past wind turbines: Actuator line and disk modeling. Wind Energy 2015, 18, 1047–1060. [Google Scholar] [CrossRef]
- Marten, D.; Peukert, J.; Pechlivanoglou, G.; Nayeri, C.N.; Paschereit, C.O. QBLADE: An open source tool for design and simulation of horizontal and vertical axis wind turbines. Int. J. Emerg. Technol. Adv. Eng. 2013, 3, 264–269. [Google Scholar]
- Make, M.; Vaz, G. Analyzing scaling effects on offshore wind turbines using CFD. Renew. Energy 2015, 83, 1326–1340. [Google Scholar] [CrossRef]
- Micallef, D.; Sant, T. Loading effects on floating offshore horizontal axis wind turbines in surge motion. Renew. Energy 2015, 83, 737–748. [Google Scholar] [CrossRef]
- Nilsson, K.; Ivanell, S.; Hansen, K.S.; Mikkelsen, R.; Sørensen, J.N.; Breton, S.; Henningson, D. Large-eddy simulations of the Lillgrund wind farm. Wind Energy 2015, 18, 449–467. [Google Scholar] [CrossRef]


| NREL 5 MW | Units | |
|---|---|---|
| Rated power | 5.0 | MW |
| Rotor diameter | 126.0 | m |
| Number of blades | 3 | |
| Hub diameter | 3.0 | m |
| Hub height | 90 | m |
| Rated wind speed U∞ | 11.4 | m/s |
| Rated rotor speed | 12.1 | rpm |
| Total Mesh | R/Δg | CP | Relative Difference (%) | |
|---|---|---|---|---|
| Coarse mesh | 3.62 × 10⁶ | 28 | 0.5502 | 4.30 |
| Medium mesh | 6.52 × 10⁶ | 36 | 0.5275 | 0.64 |
| Fine mesh | 8.86 × 10⁶ | 40 | 0.5241 | / |
| Case | L1/D | S/D | ||
|---|---|---|---|---|
| 1 | Full wake cases | 4~7, interval = 0.5 | 0 | 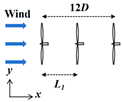 |
| 2 | Staggered cases | 4~6, interval = 0.5 | 2 | 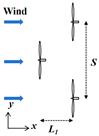 |
| 3 | Staggered cases | 4~6, interval = 0.5 | 2 | 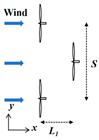 |
Disclaimer/Publisher’s Note: The statements, opinions and data contained in all publications are solely those of the individual author(s) and contributor(s) and not of MDPI and/or the editor(s). MDPI and/or the editor(s) disclaim responsibility for any injury to people or property resulting from any ideas, methods, instructions or products referred to in the content. |
© 2024 by the authors. Licensee MDPI, Basel, Switzerland. This article is an open access article distributed under the terms and conditions of the Creative Commons Attribution (CC BY) license (https://creativecommons.org/licenses/by/4.0/).
Share and Cite
Fu, C.; Zhang, Z.; Yu, M.; Zhou, D.; Zhu, H.; Duan, L.; Tu, J.; Han, Z. Research on Aerodynamic Characteristics of Three Offshore Wind Turbines Based on Large Eddy Simulation and Actuator Line Model. J. Mar. Sci. Eng. 2024, 12, 1341. https://doi.org/10.3390/jmse12081341
Fu C, Zhang Z, Yu M, Zhou D, Zhu H, Duan L, Tu J, Han Z. Research on Aerodynamic Characteristics of Three Offshore Wind Turbines Based on Large Eddy Simulation and Actuator Line Model. Journal of Marine Science and Engineering. 2024; 12(8):1341. https://doi.org/10.3390/jmse12081341
Chicago/Turabian StyleFu, Chen, Zhihao Zhang, Meixin Yu, Dai Zhou, Hongbo Zhu, Lei Duan, Jiahuang Tu, and Zhaolong Han. 2024. "Research on Aerodynamic Characteristics of Three Offshore Wind Turbines Based on Large Eddy Simulation and Actuator Line Model" Journal of Marine Science and Engineering 12, no. 8: 1341. https://doi.org/10.3390/jmse12081341