
Dynamic Response and Mooring Fracture Performance Analysis of a Semi-Submersible Floating Offshore Wind Turbine under Freak Waves

Abstract
:1. Introduction
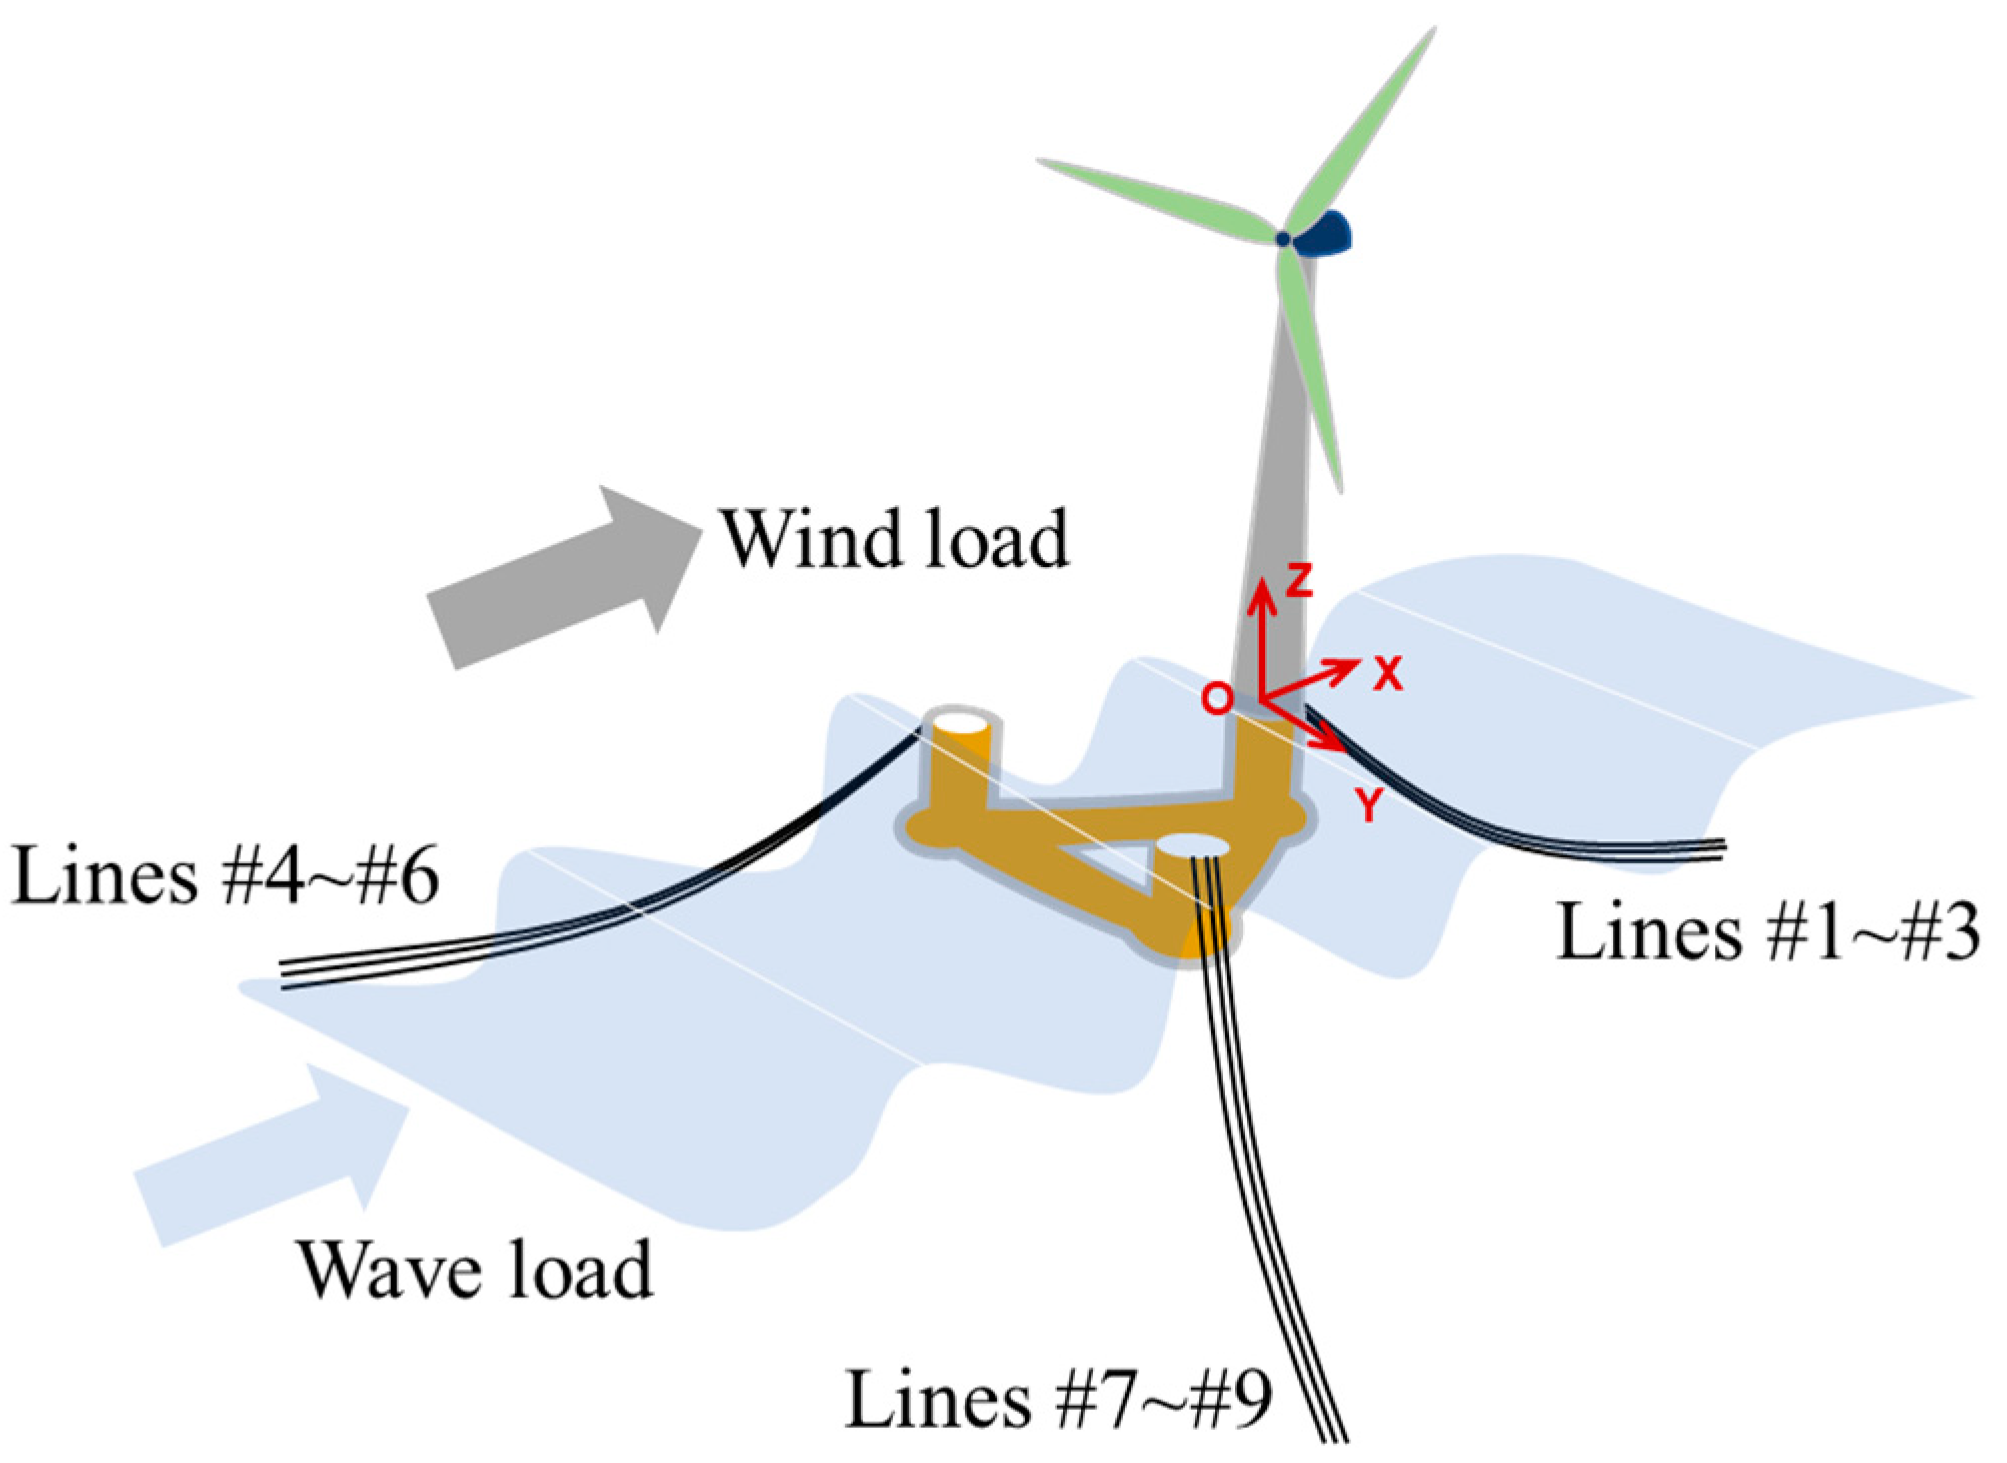
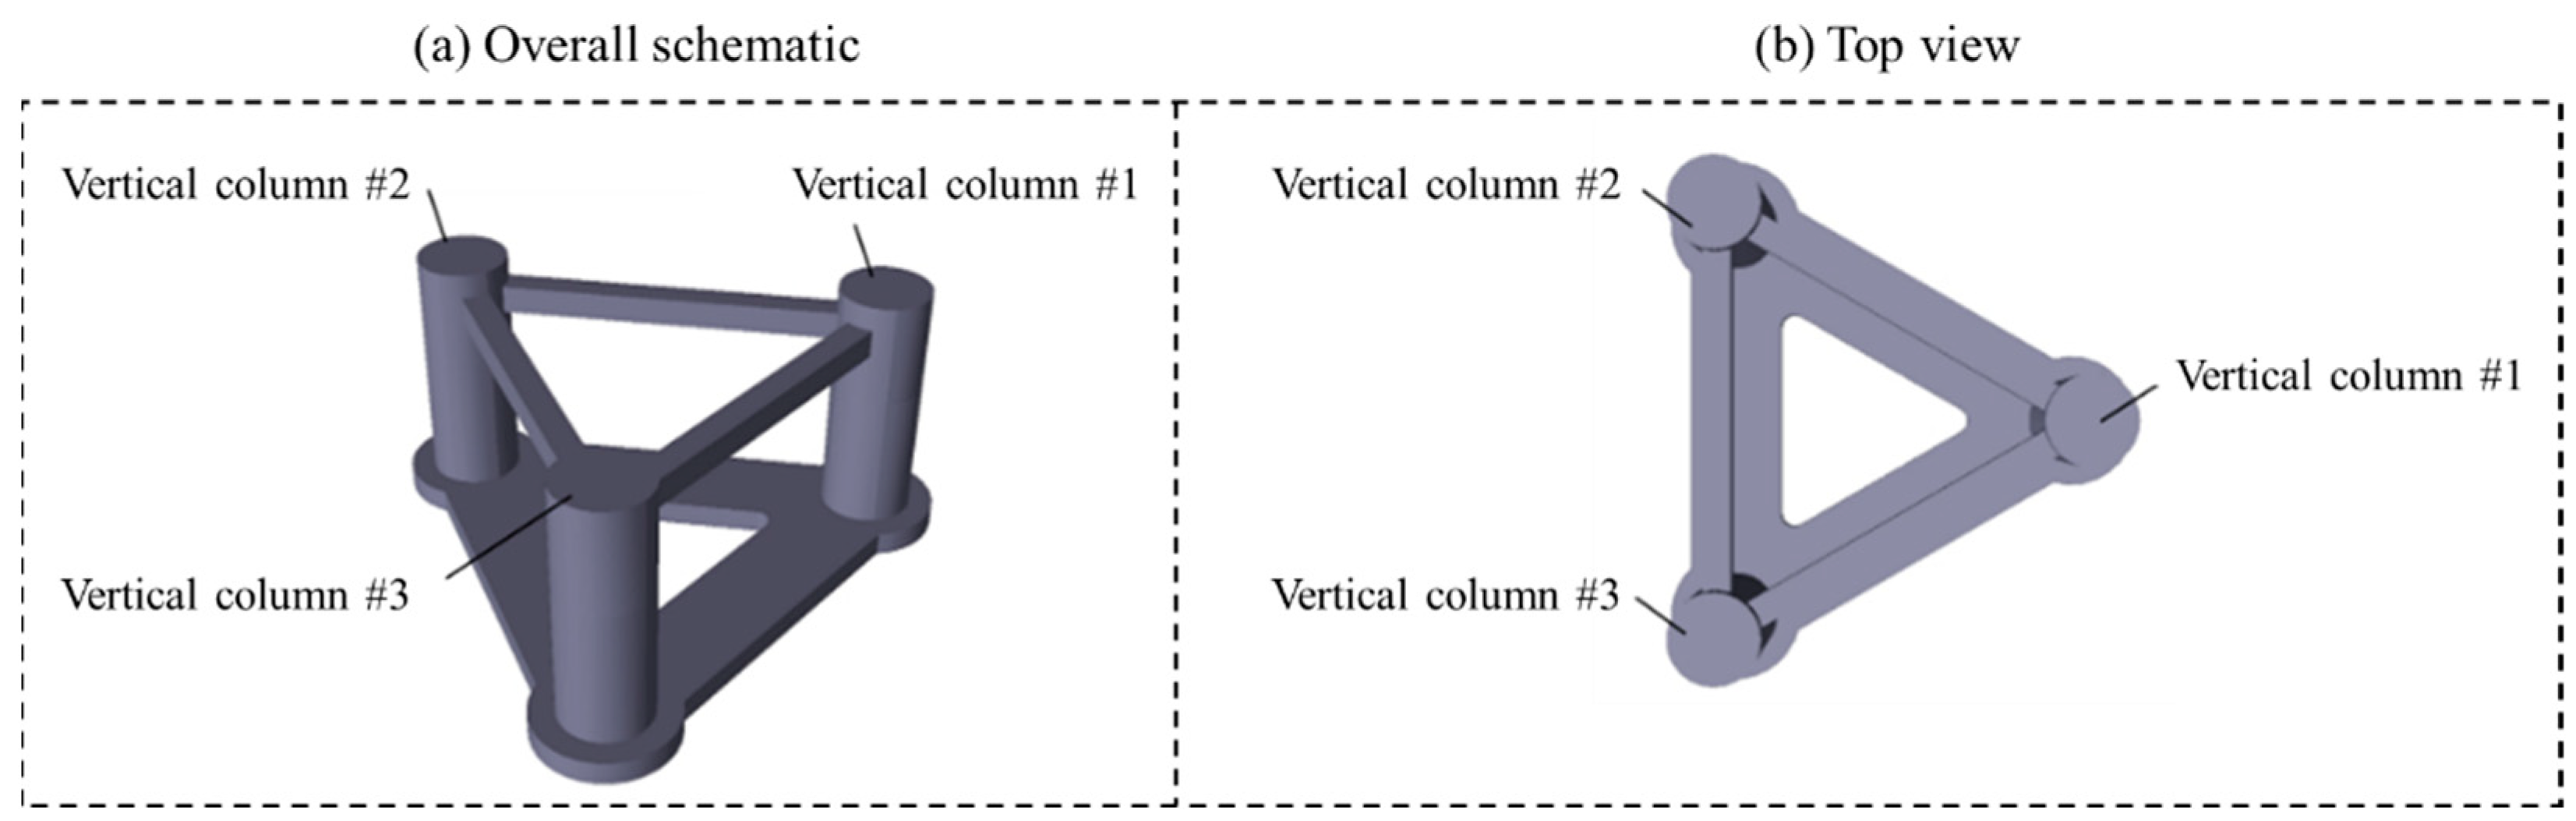
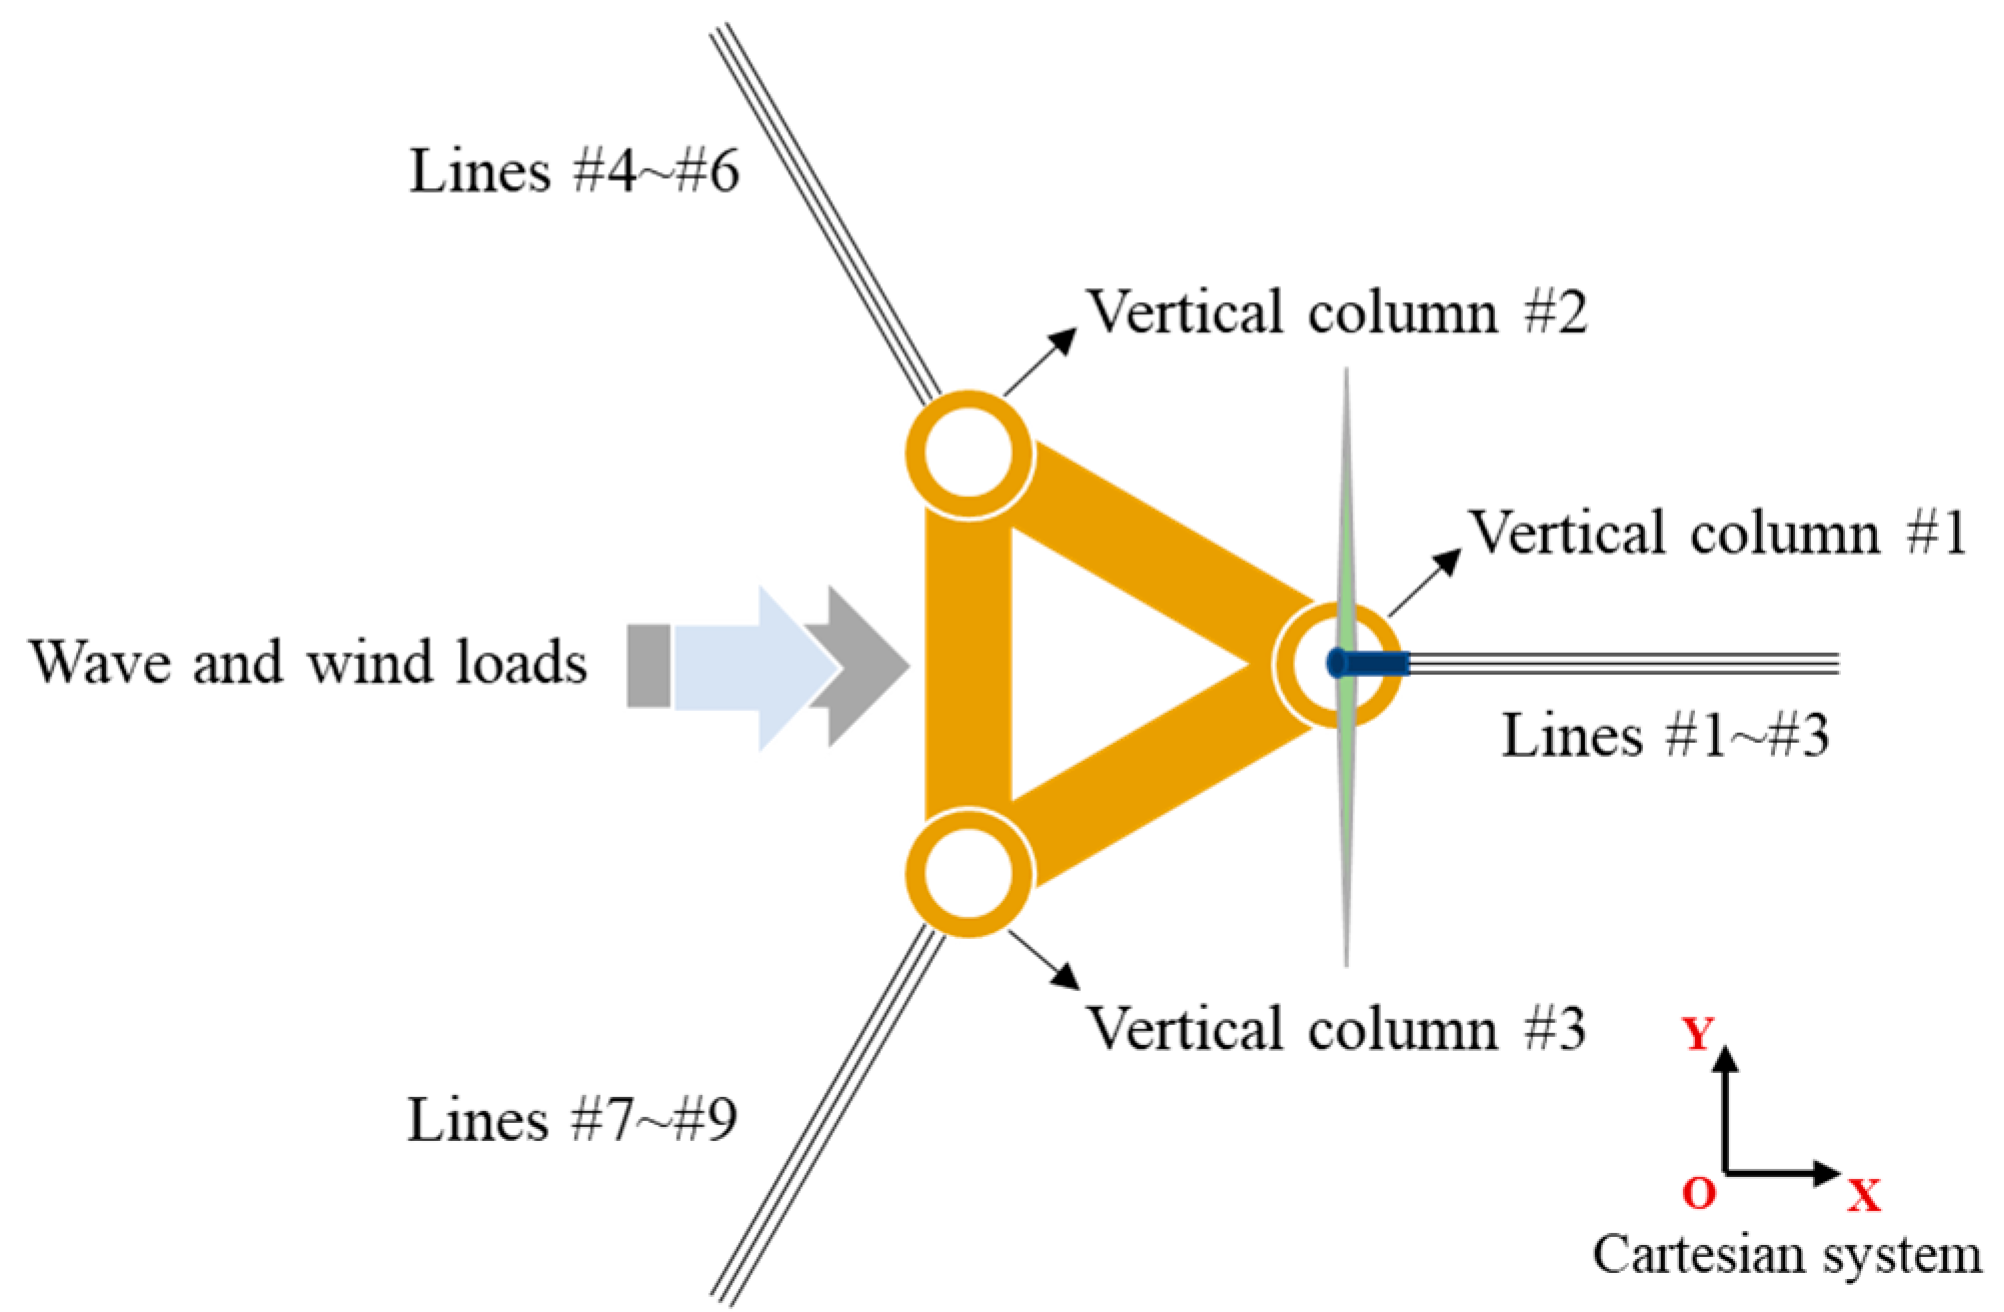
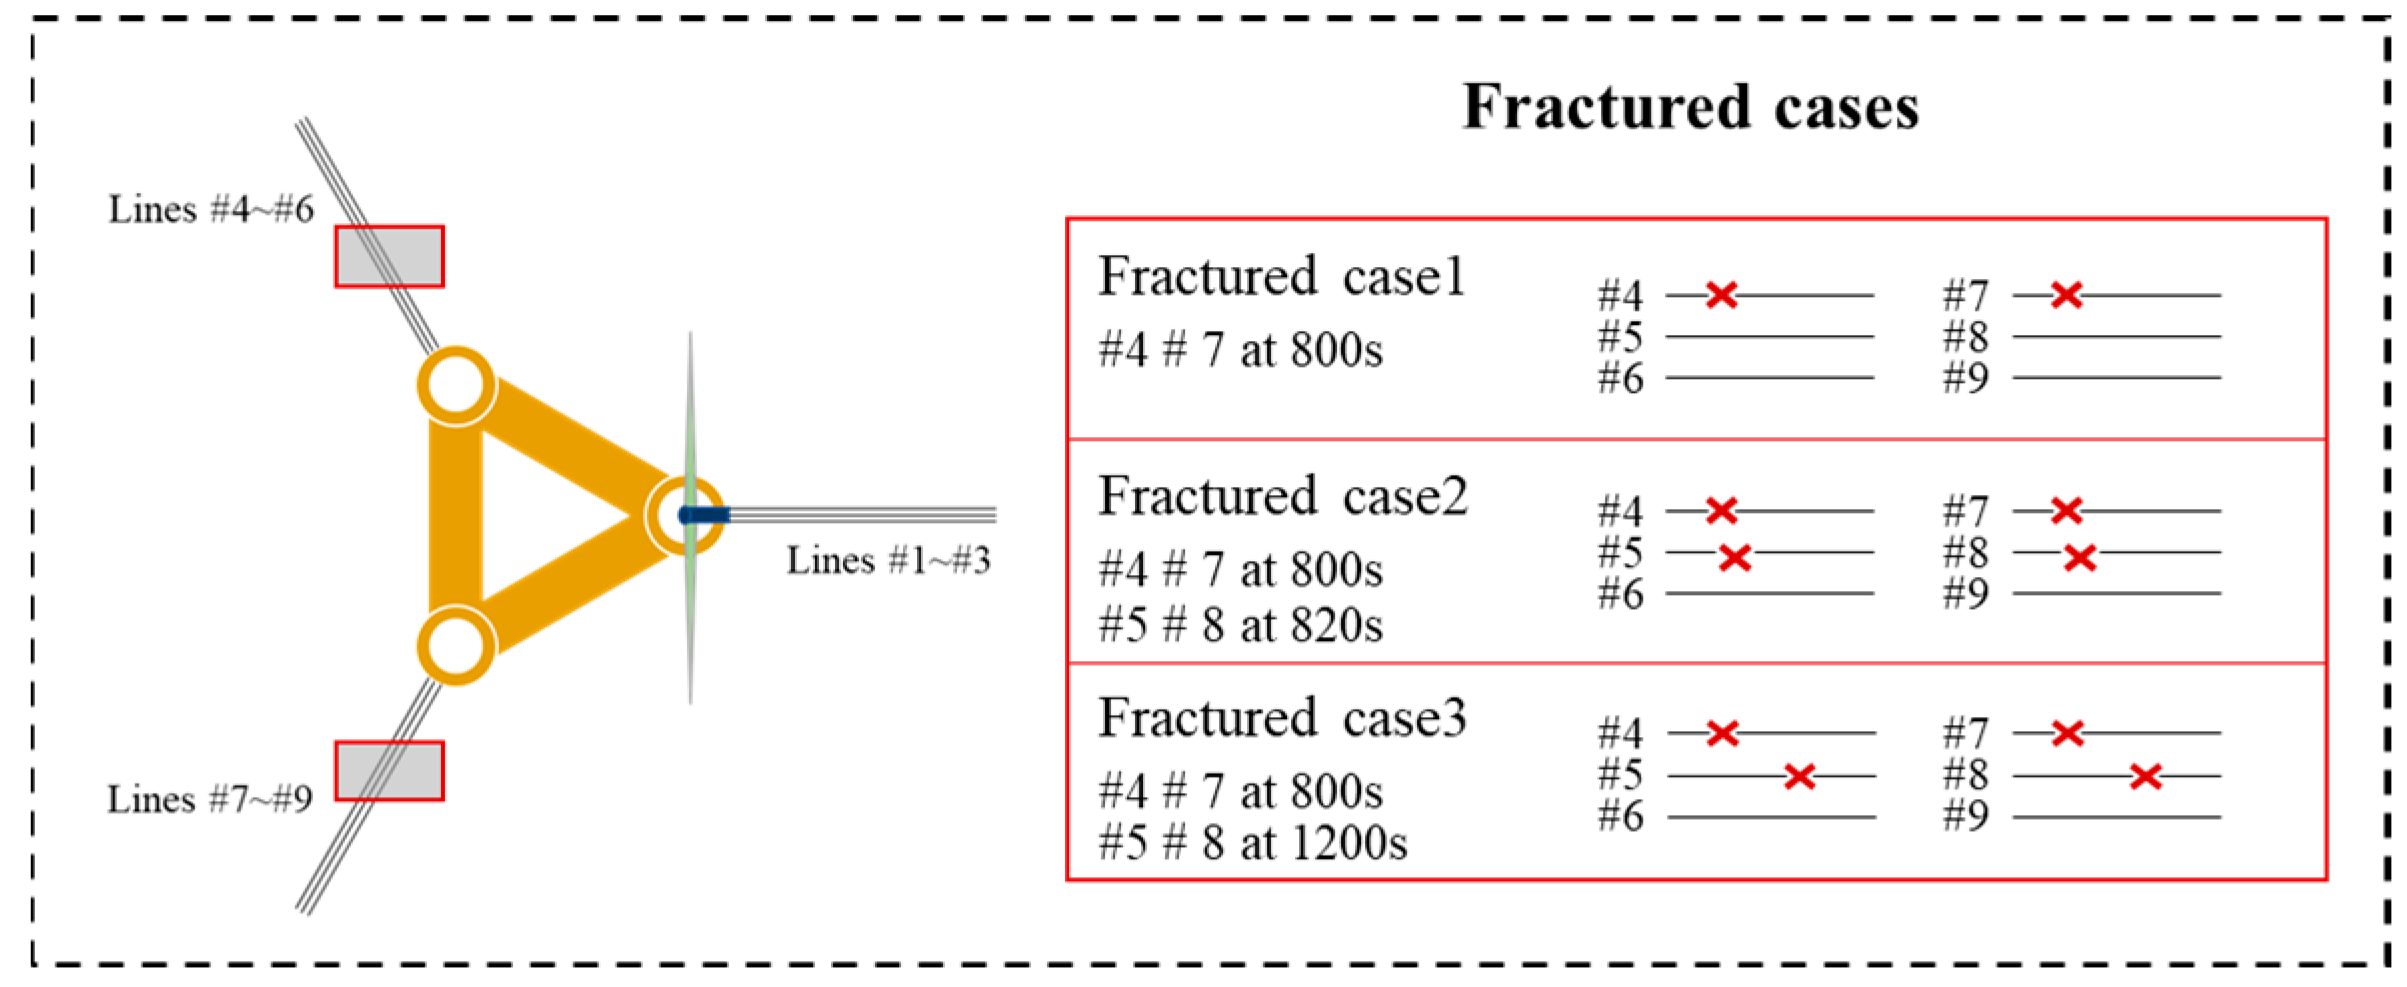
2. Physical Problem
3. Methodology
3.1. Dynamic Model of the FOWT
3.1.1. Three-Dimensional Potential Theory
3.1.2. Blade Element Momentum Theory
3.1.3. Governing Equation of the Buoy
3.1.4. Dynamic Modeling of Flexible Structures
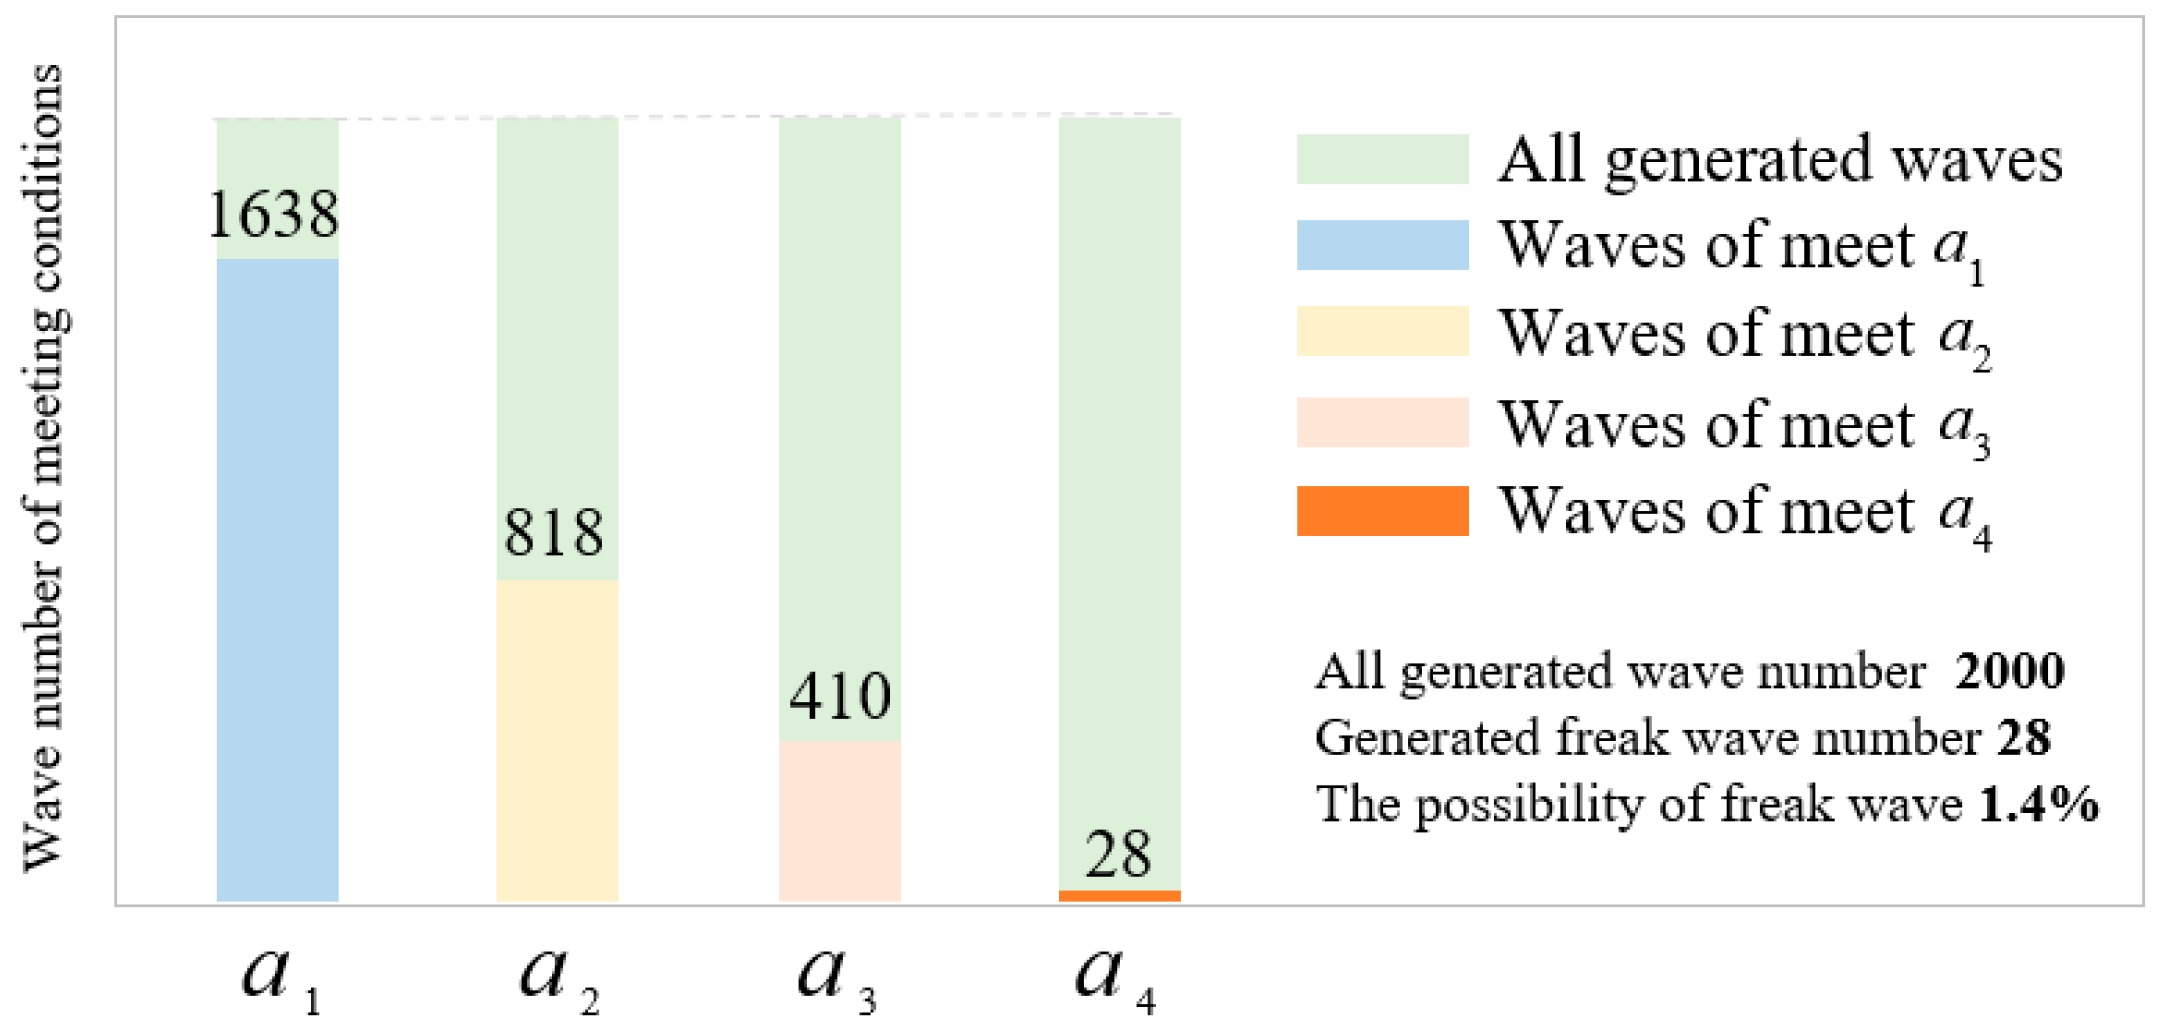
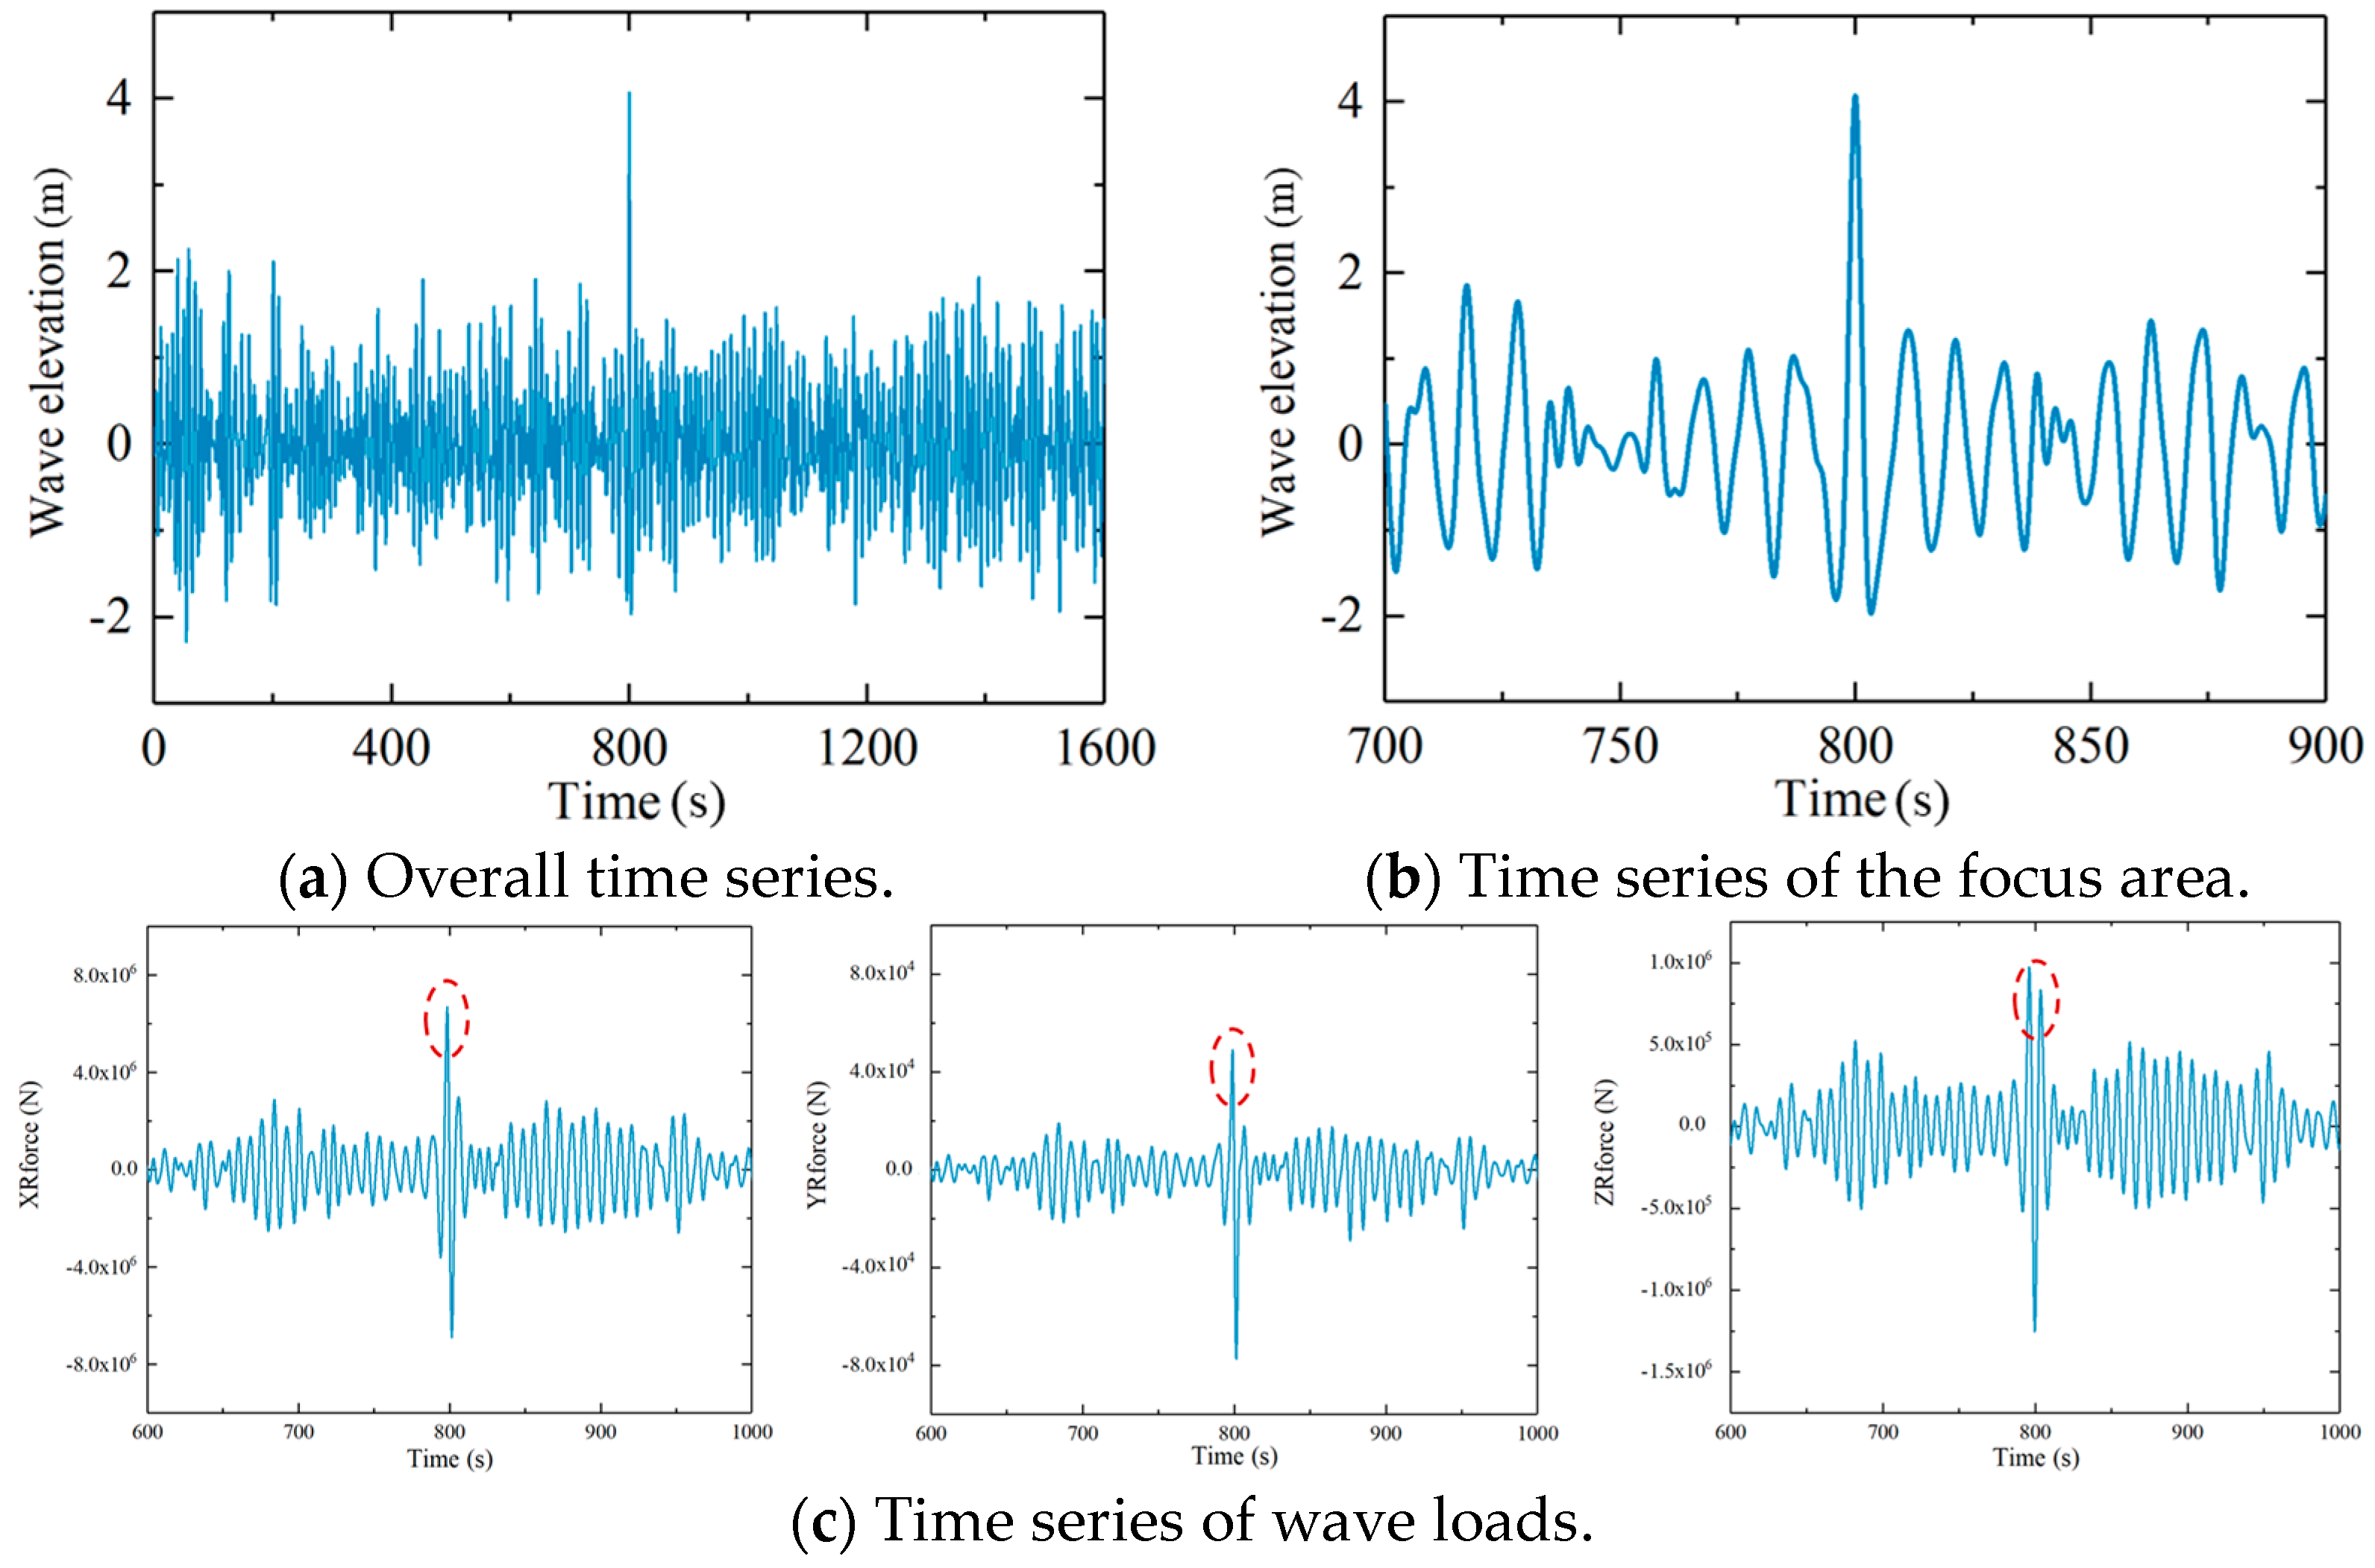
3.2. Numerical Algorithm of the Freak Wave Generation
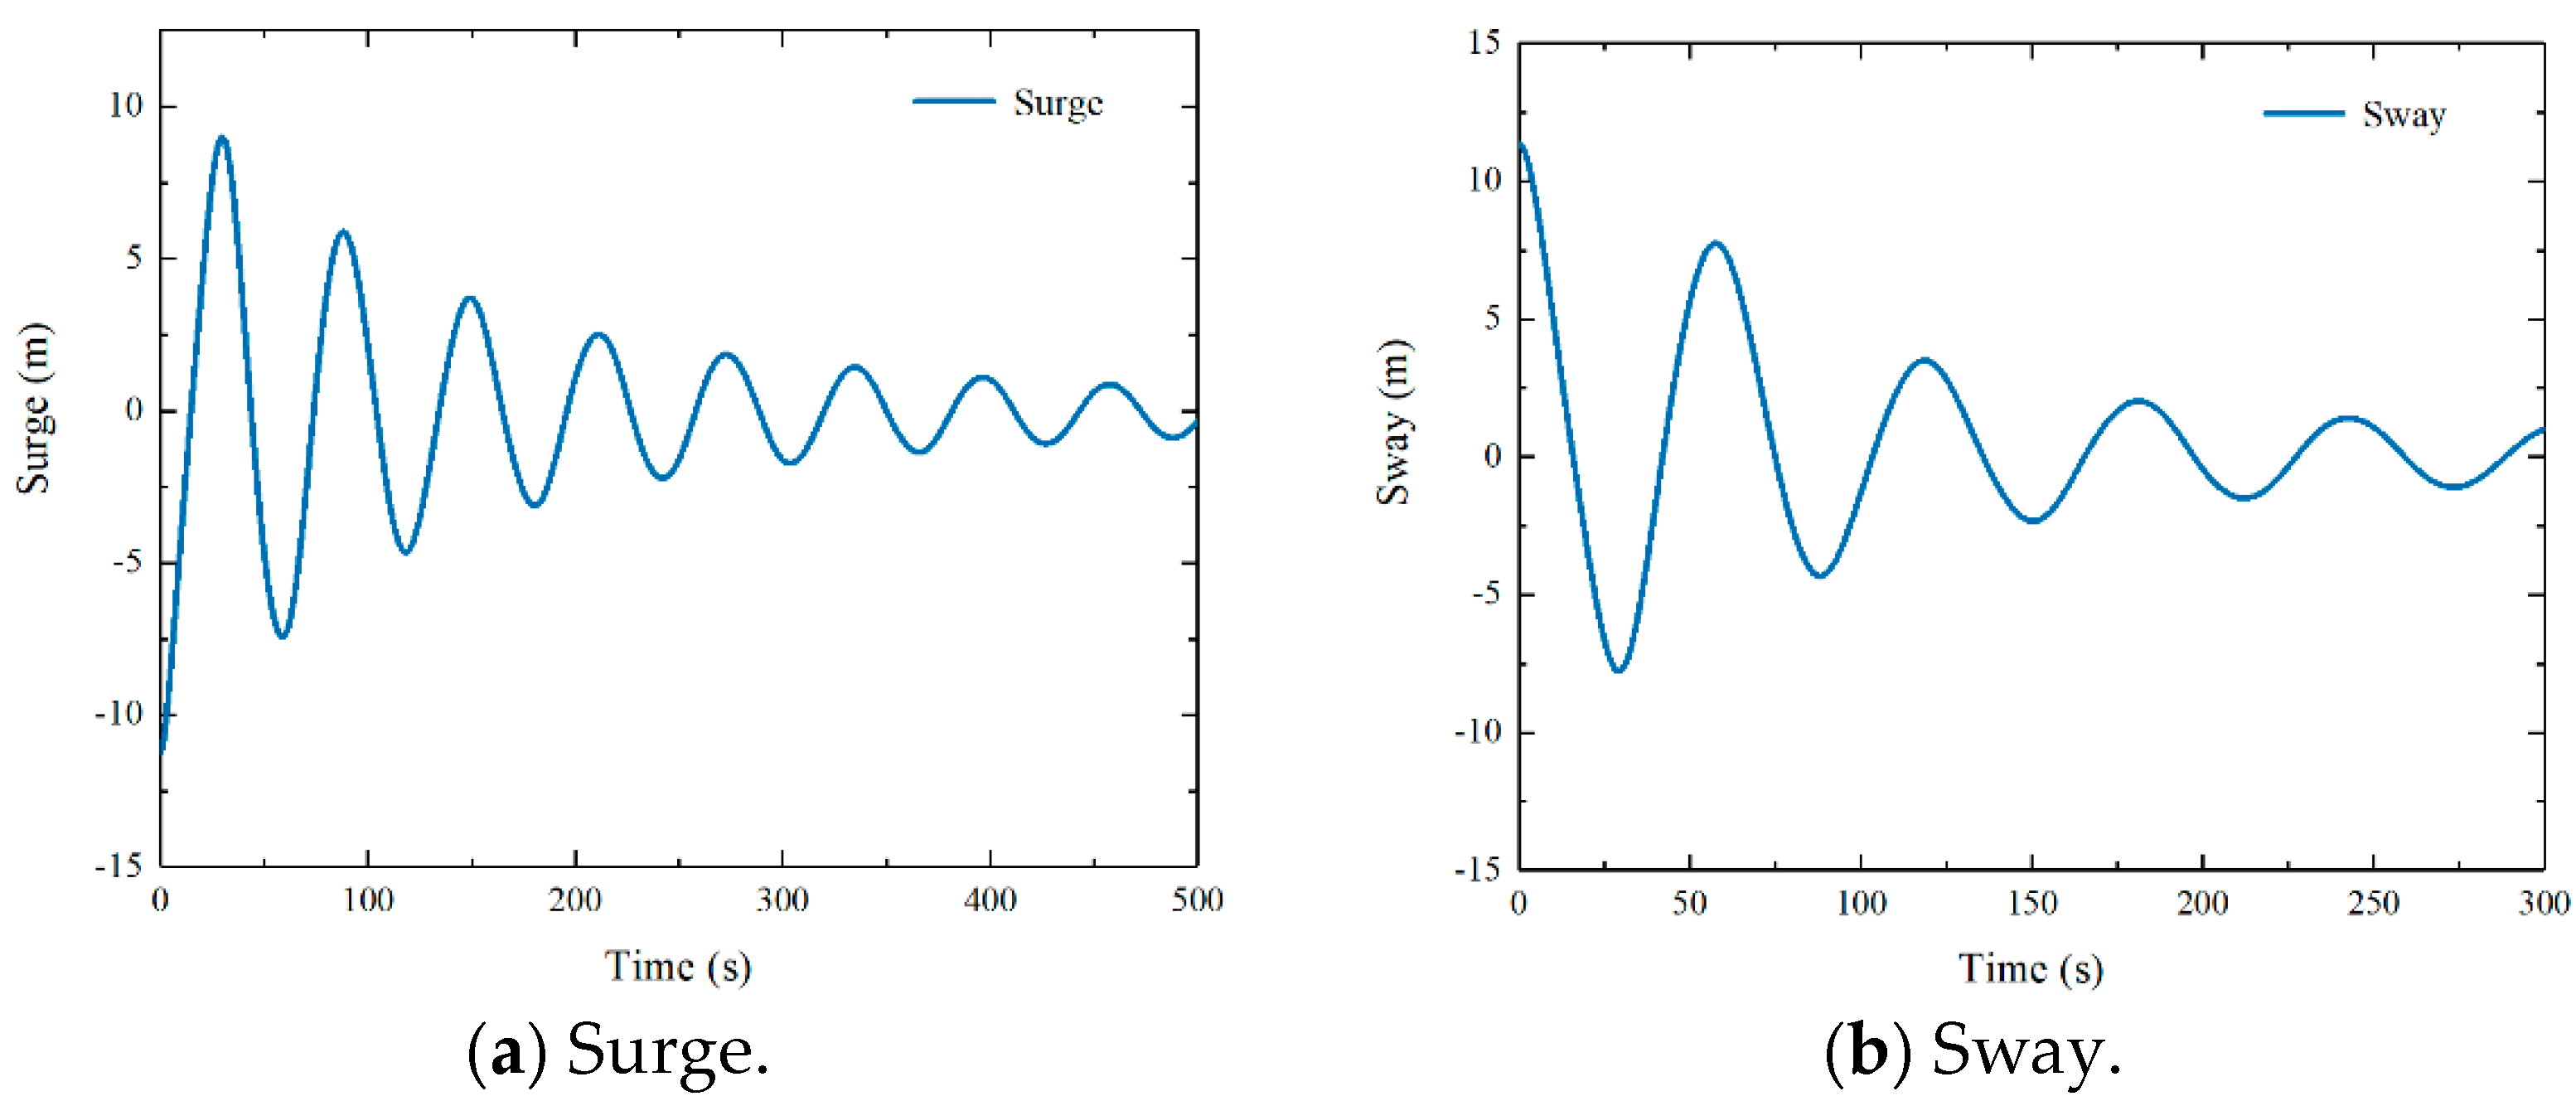
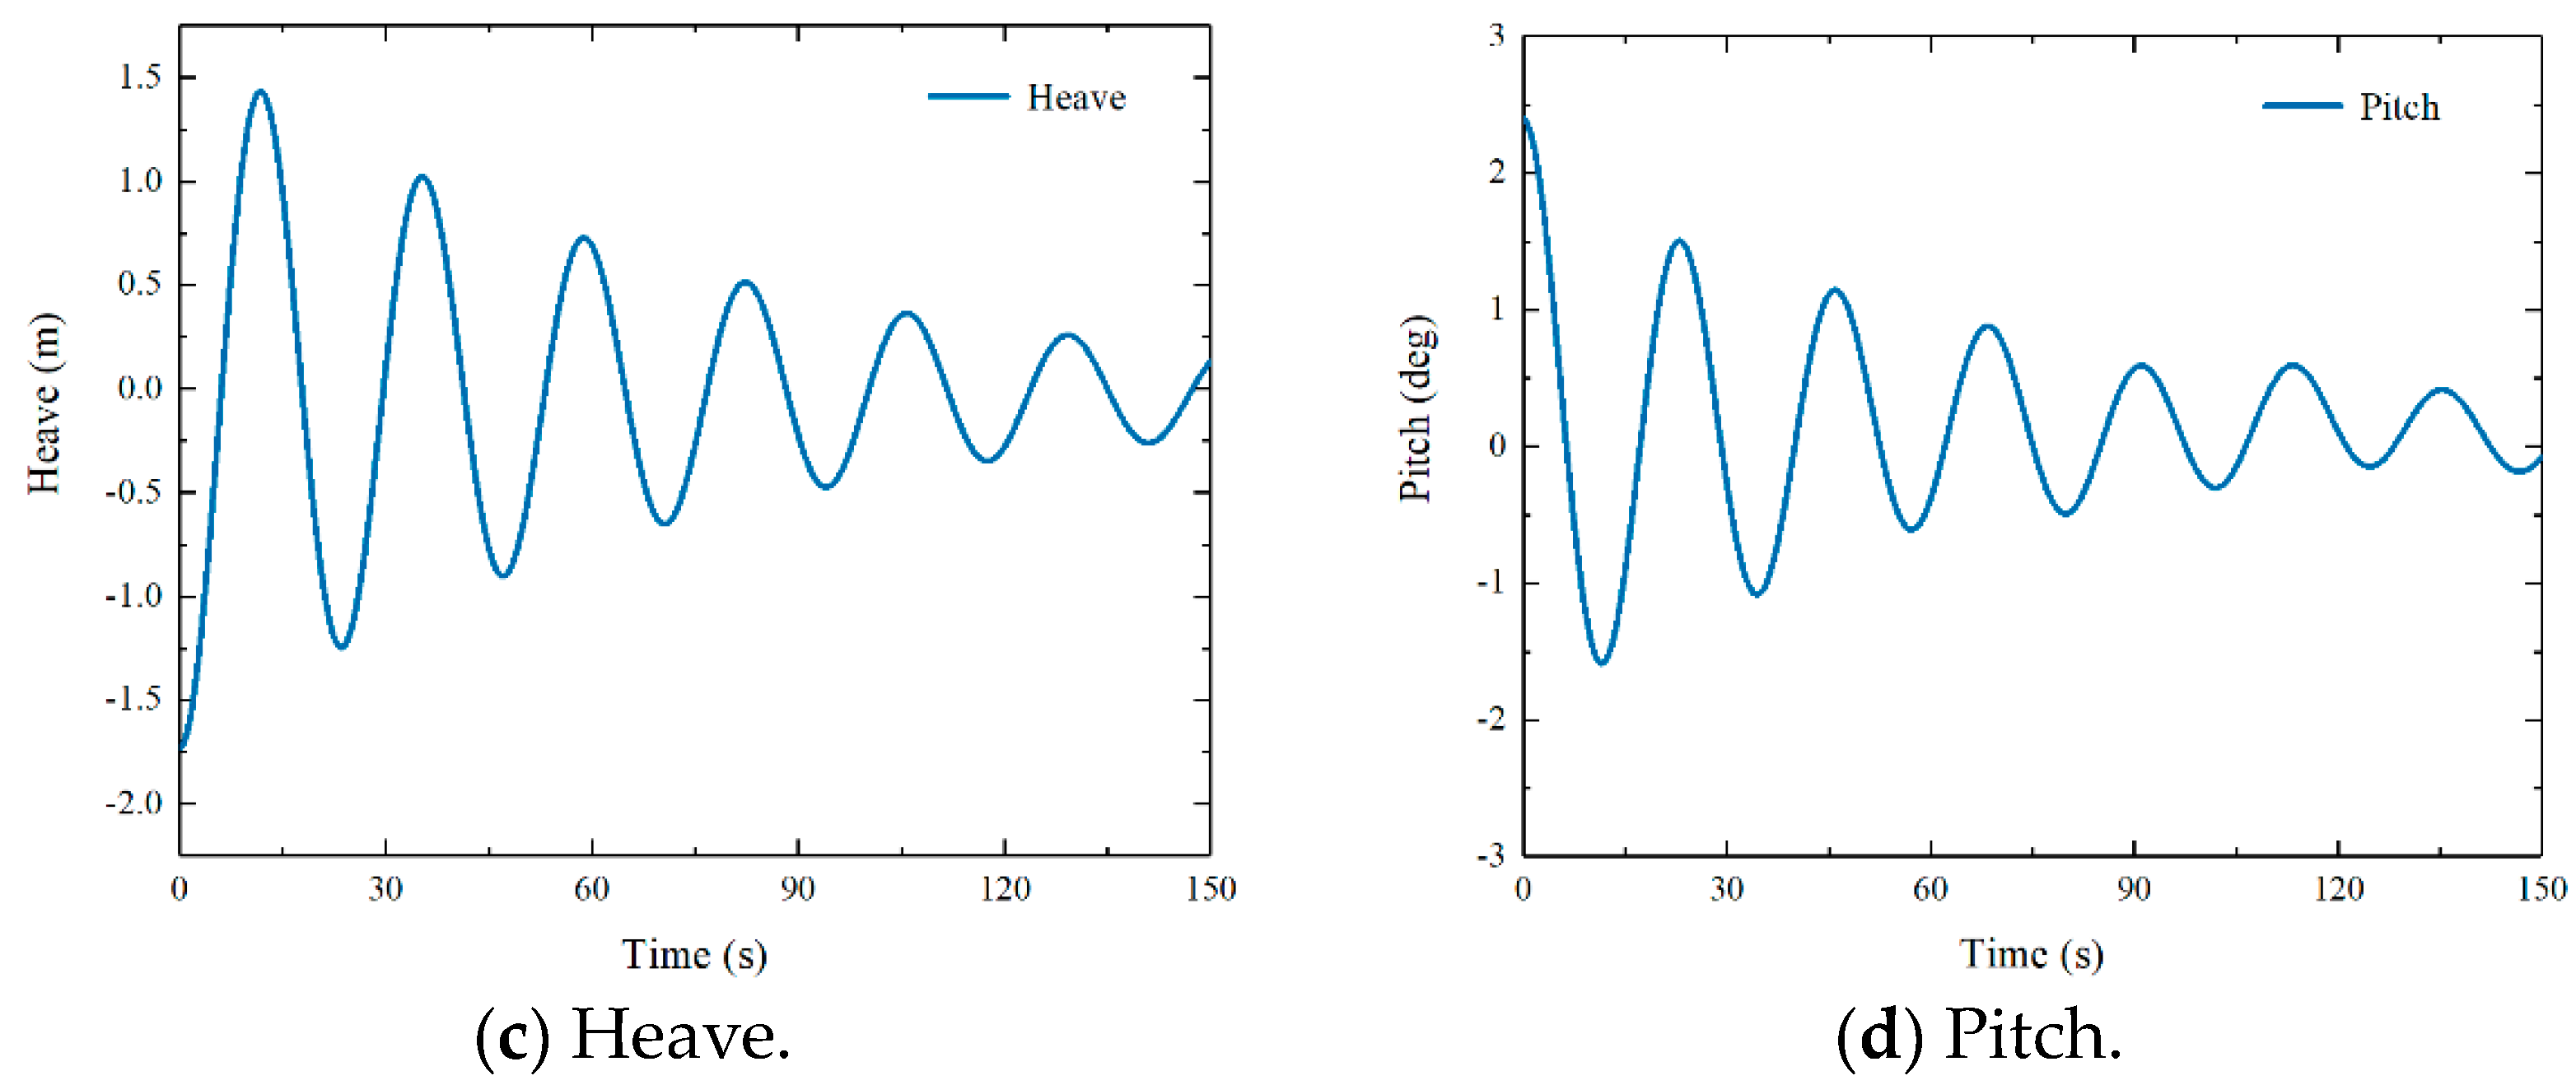
4. Validation
5. Results
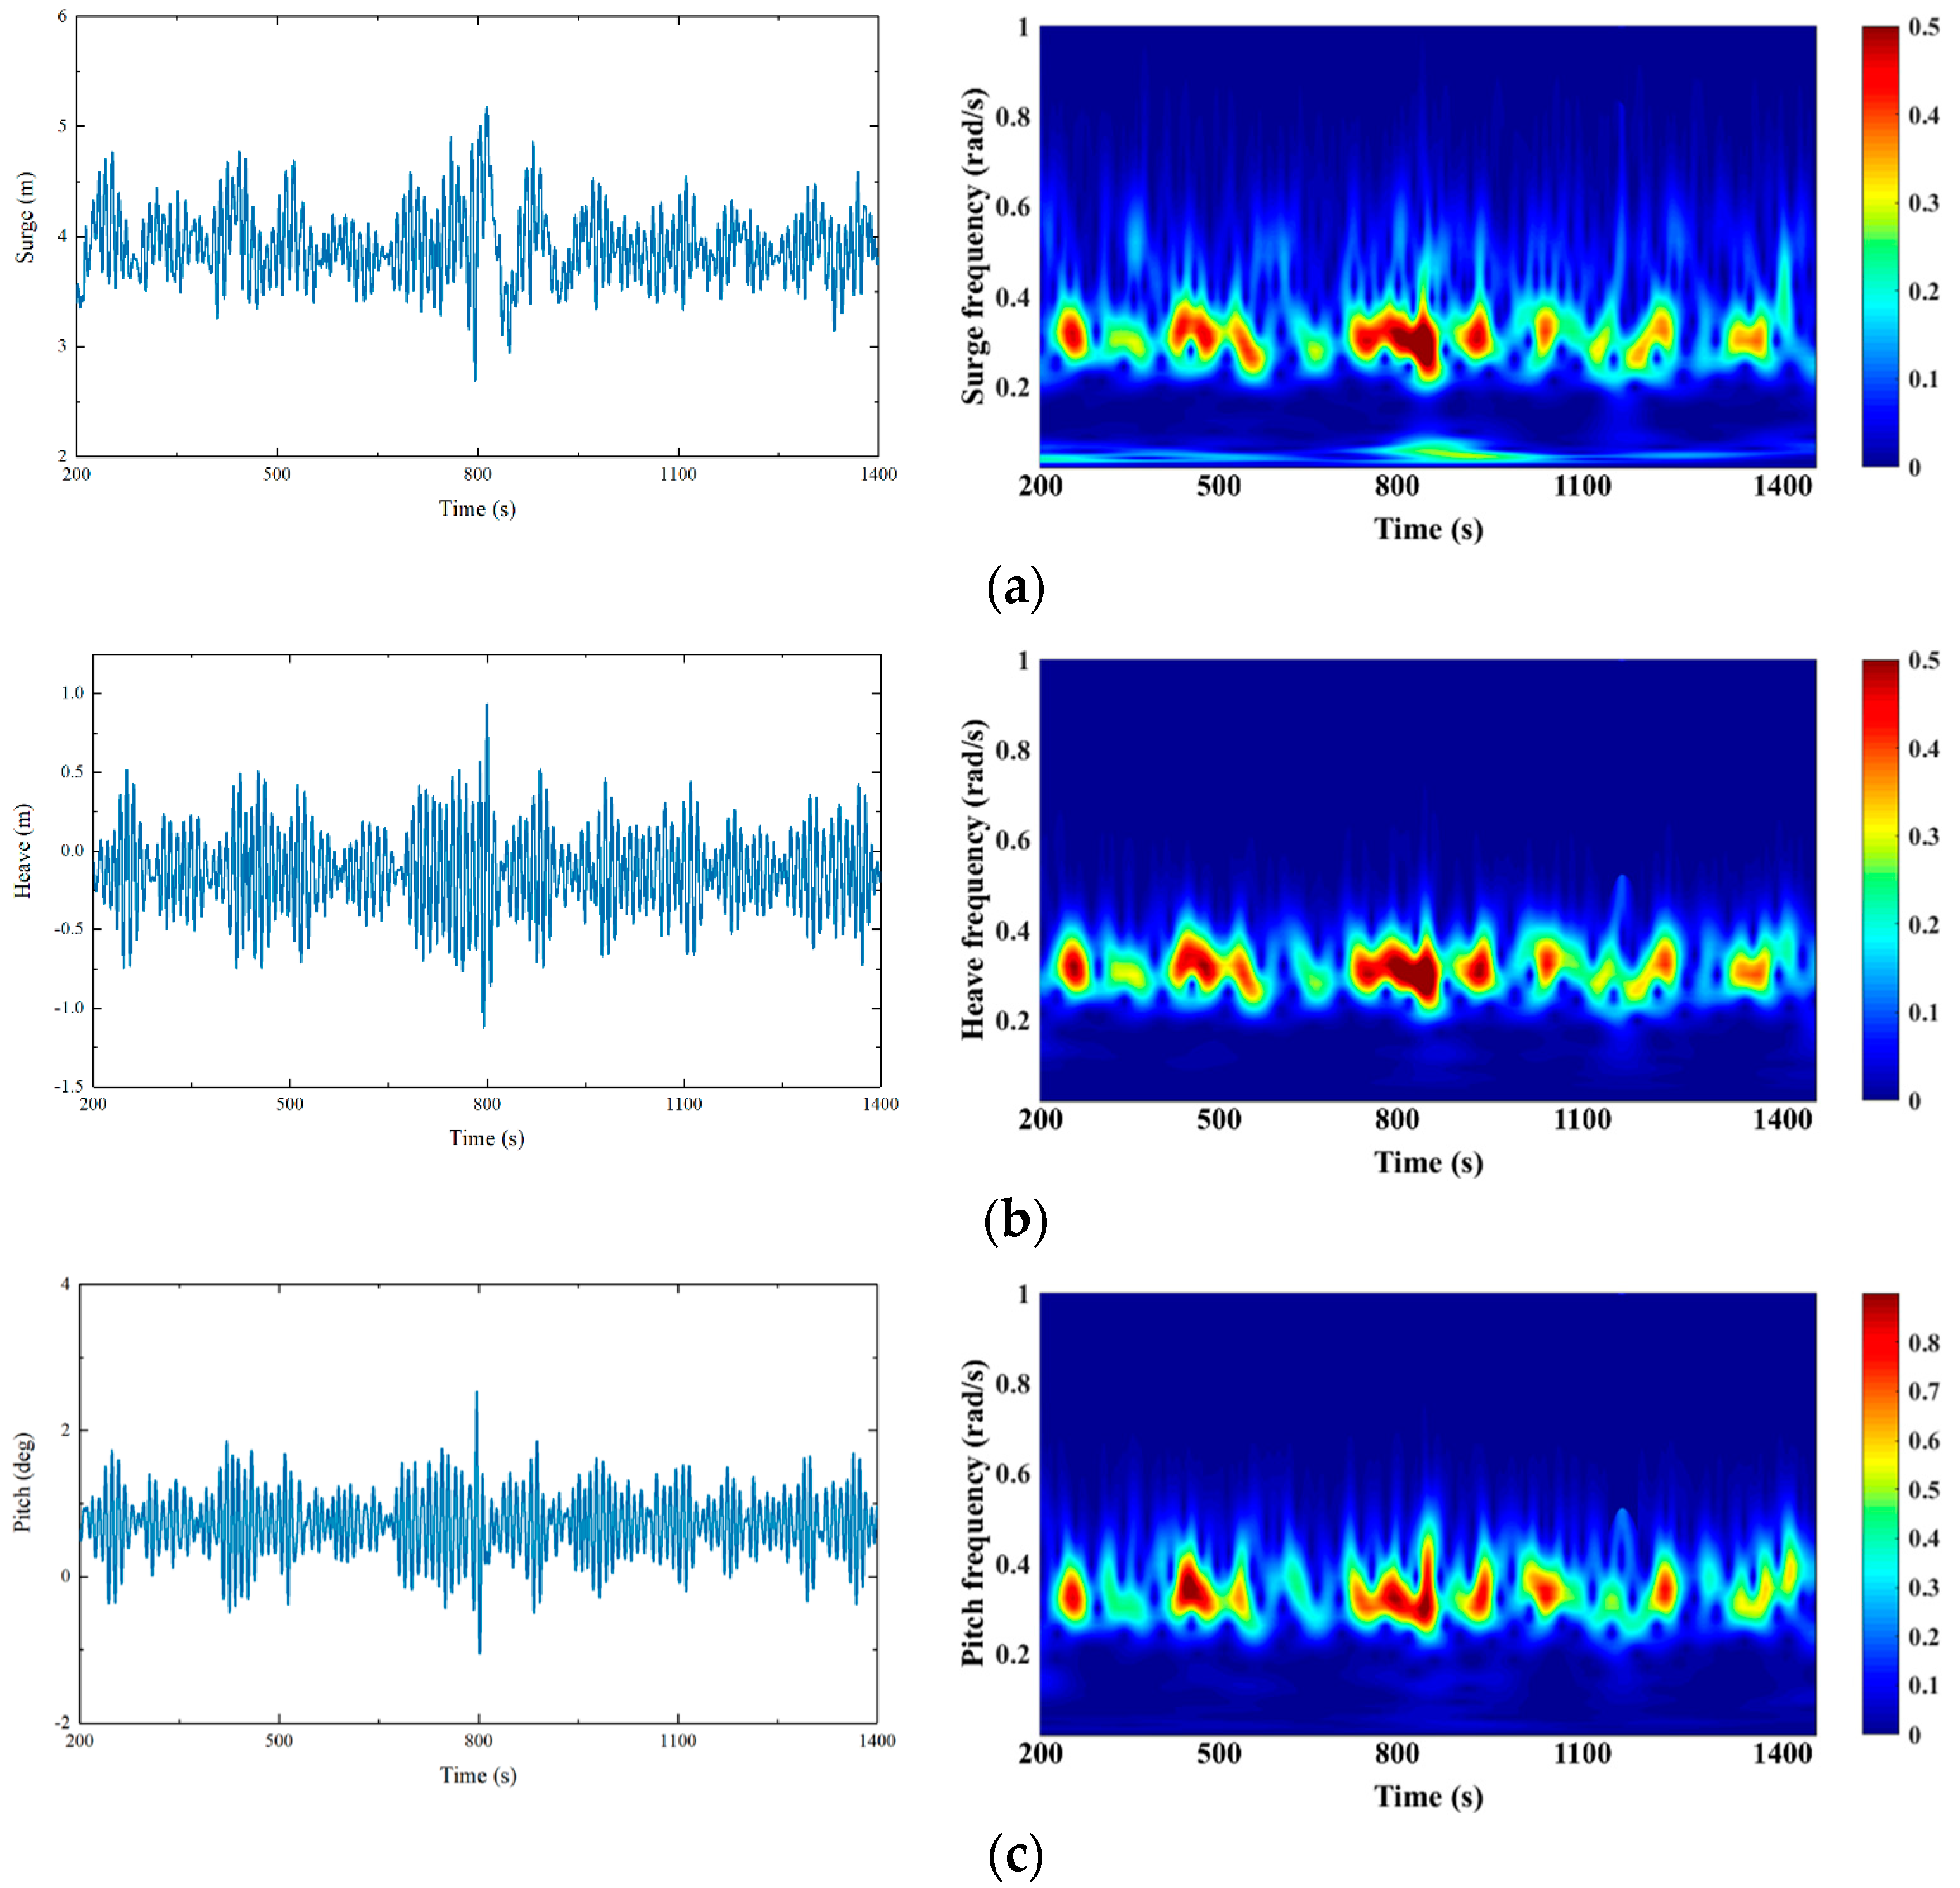
5.1. Dynamic Responses under Freak Waves
5.2. Dynamic Responses under Mooring Line Fracture
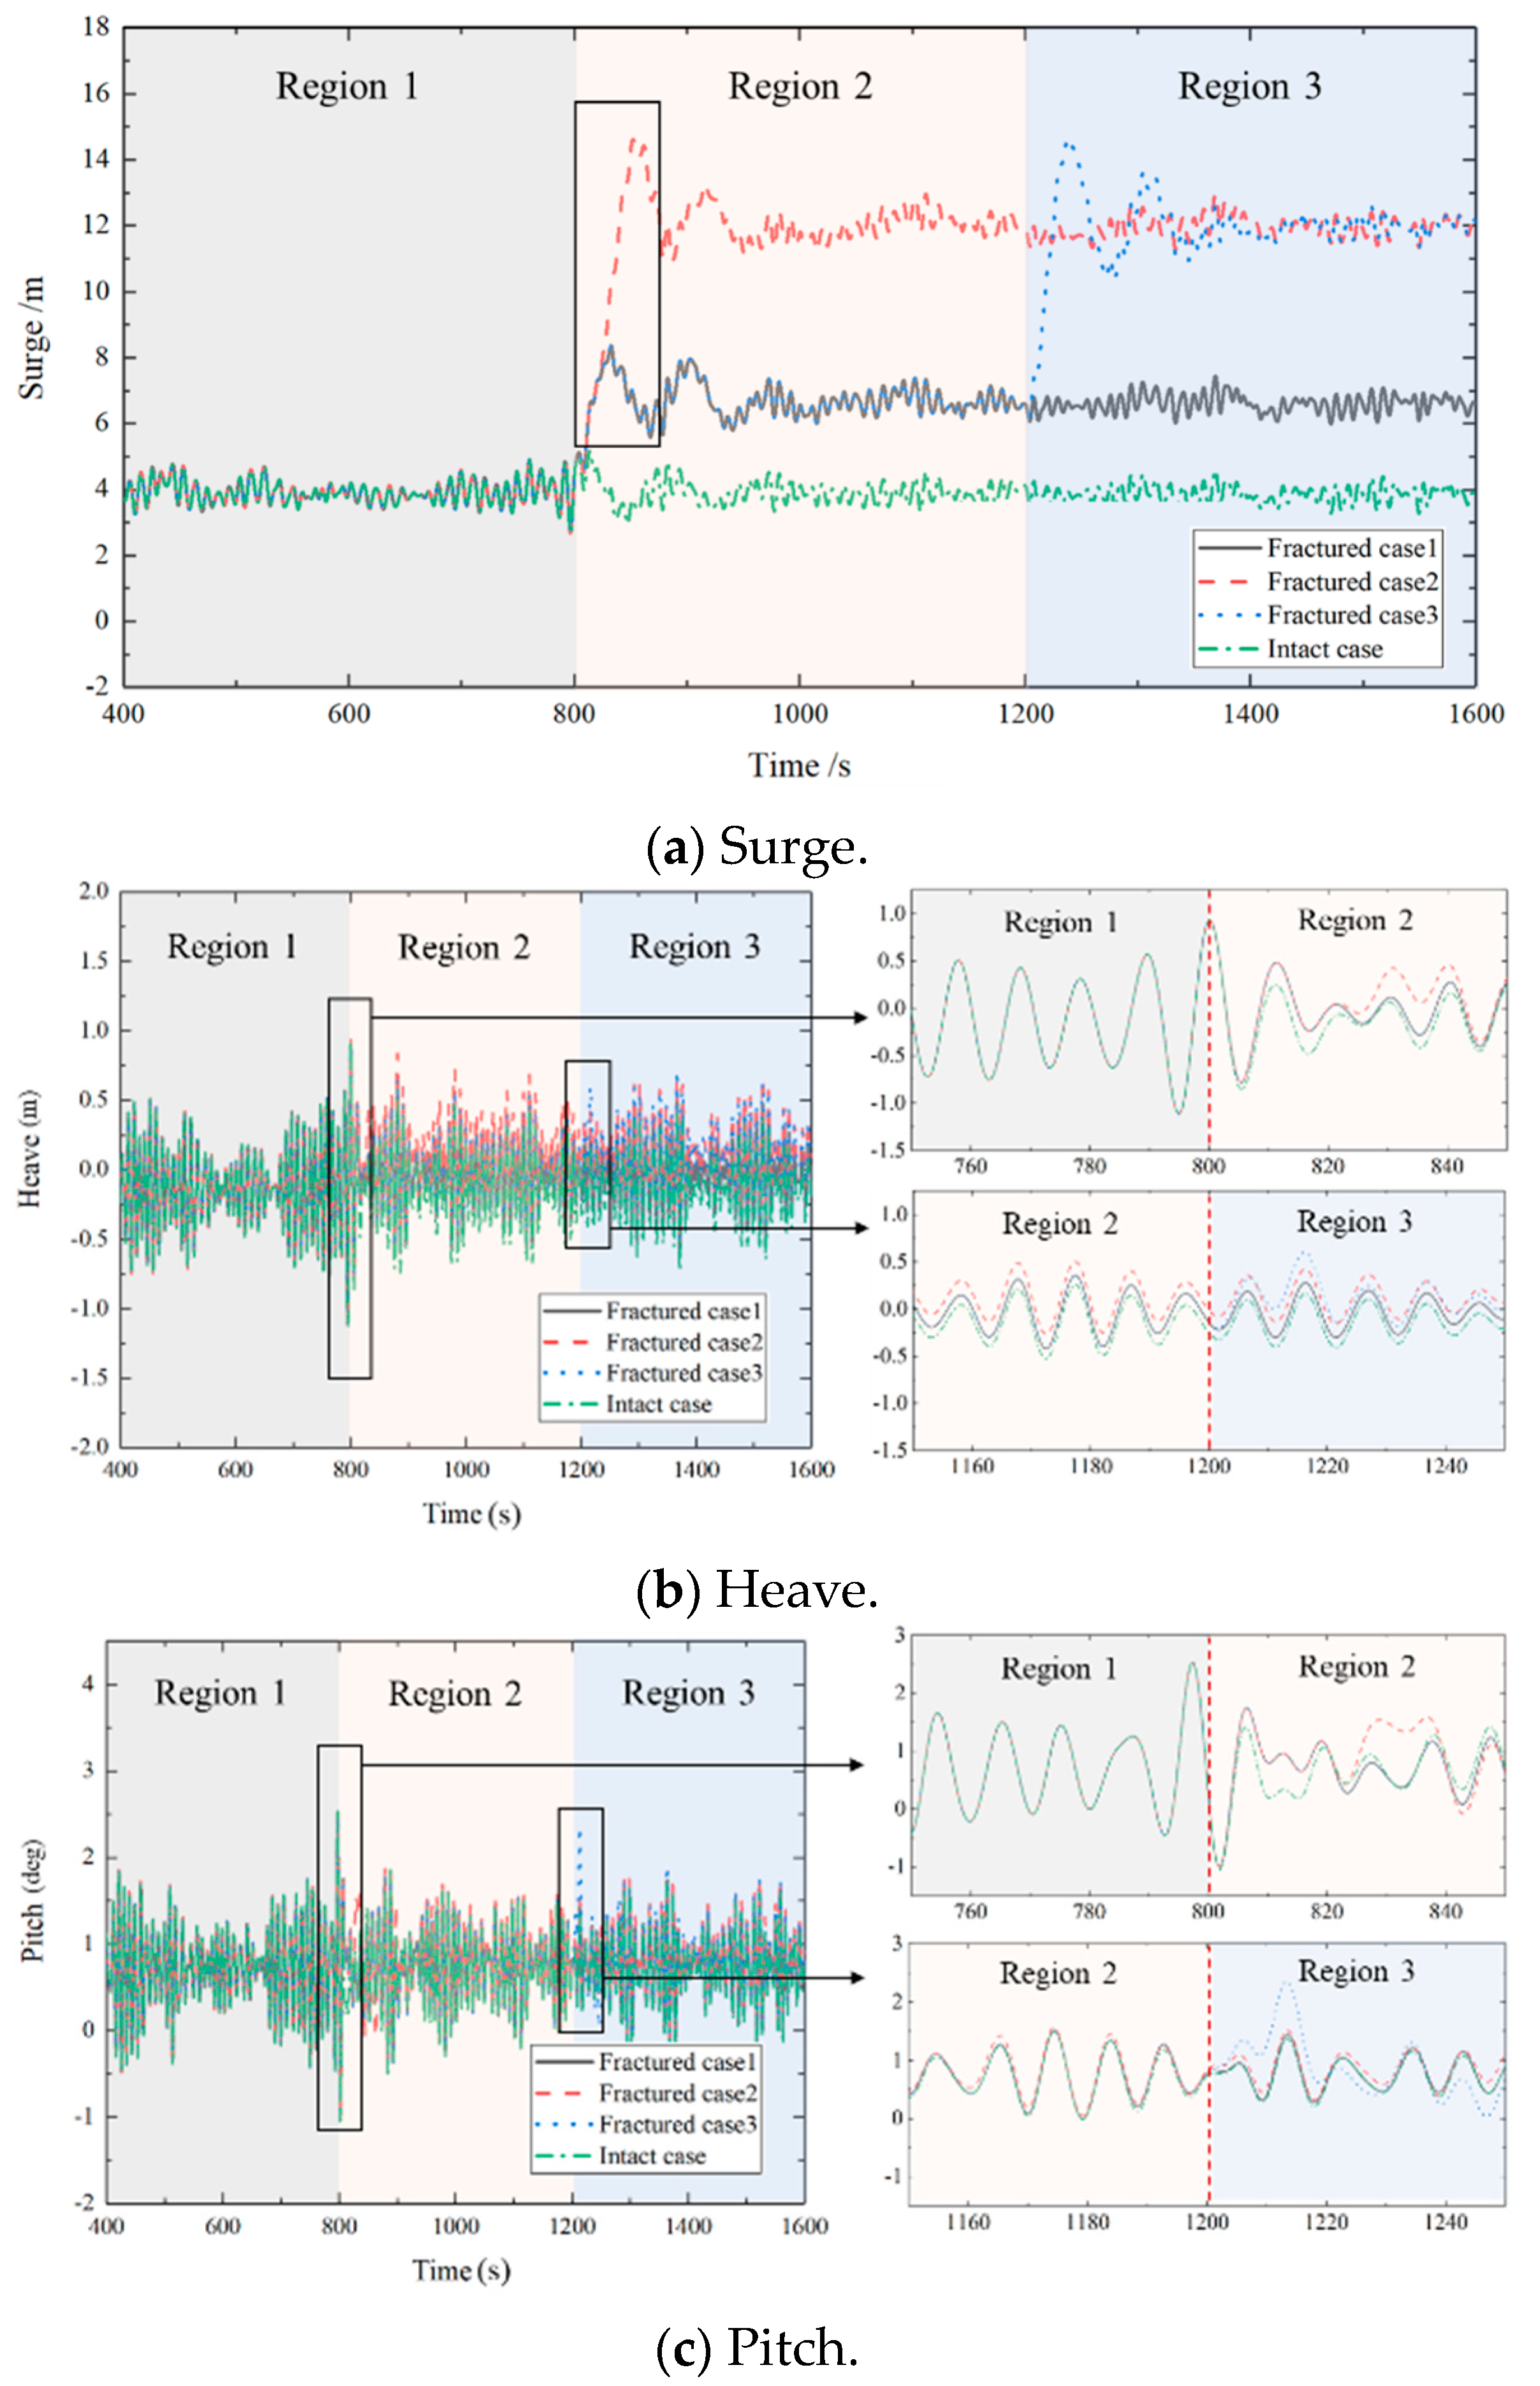
5.2.1. Floater Motion
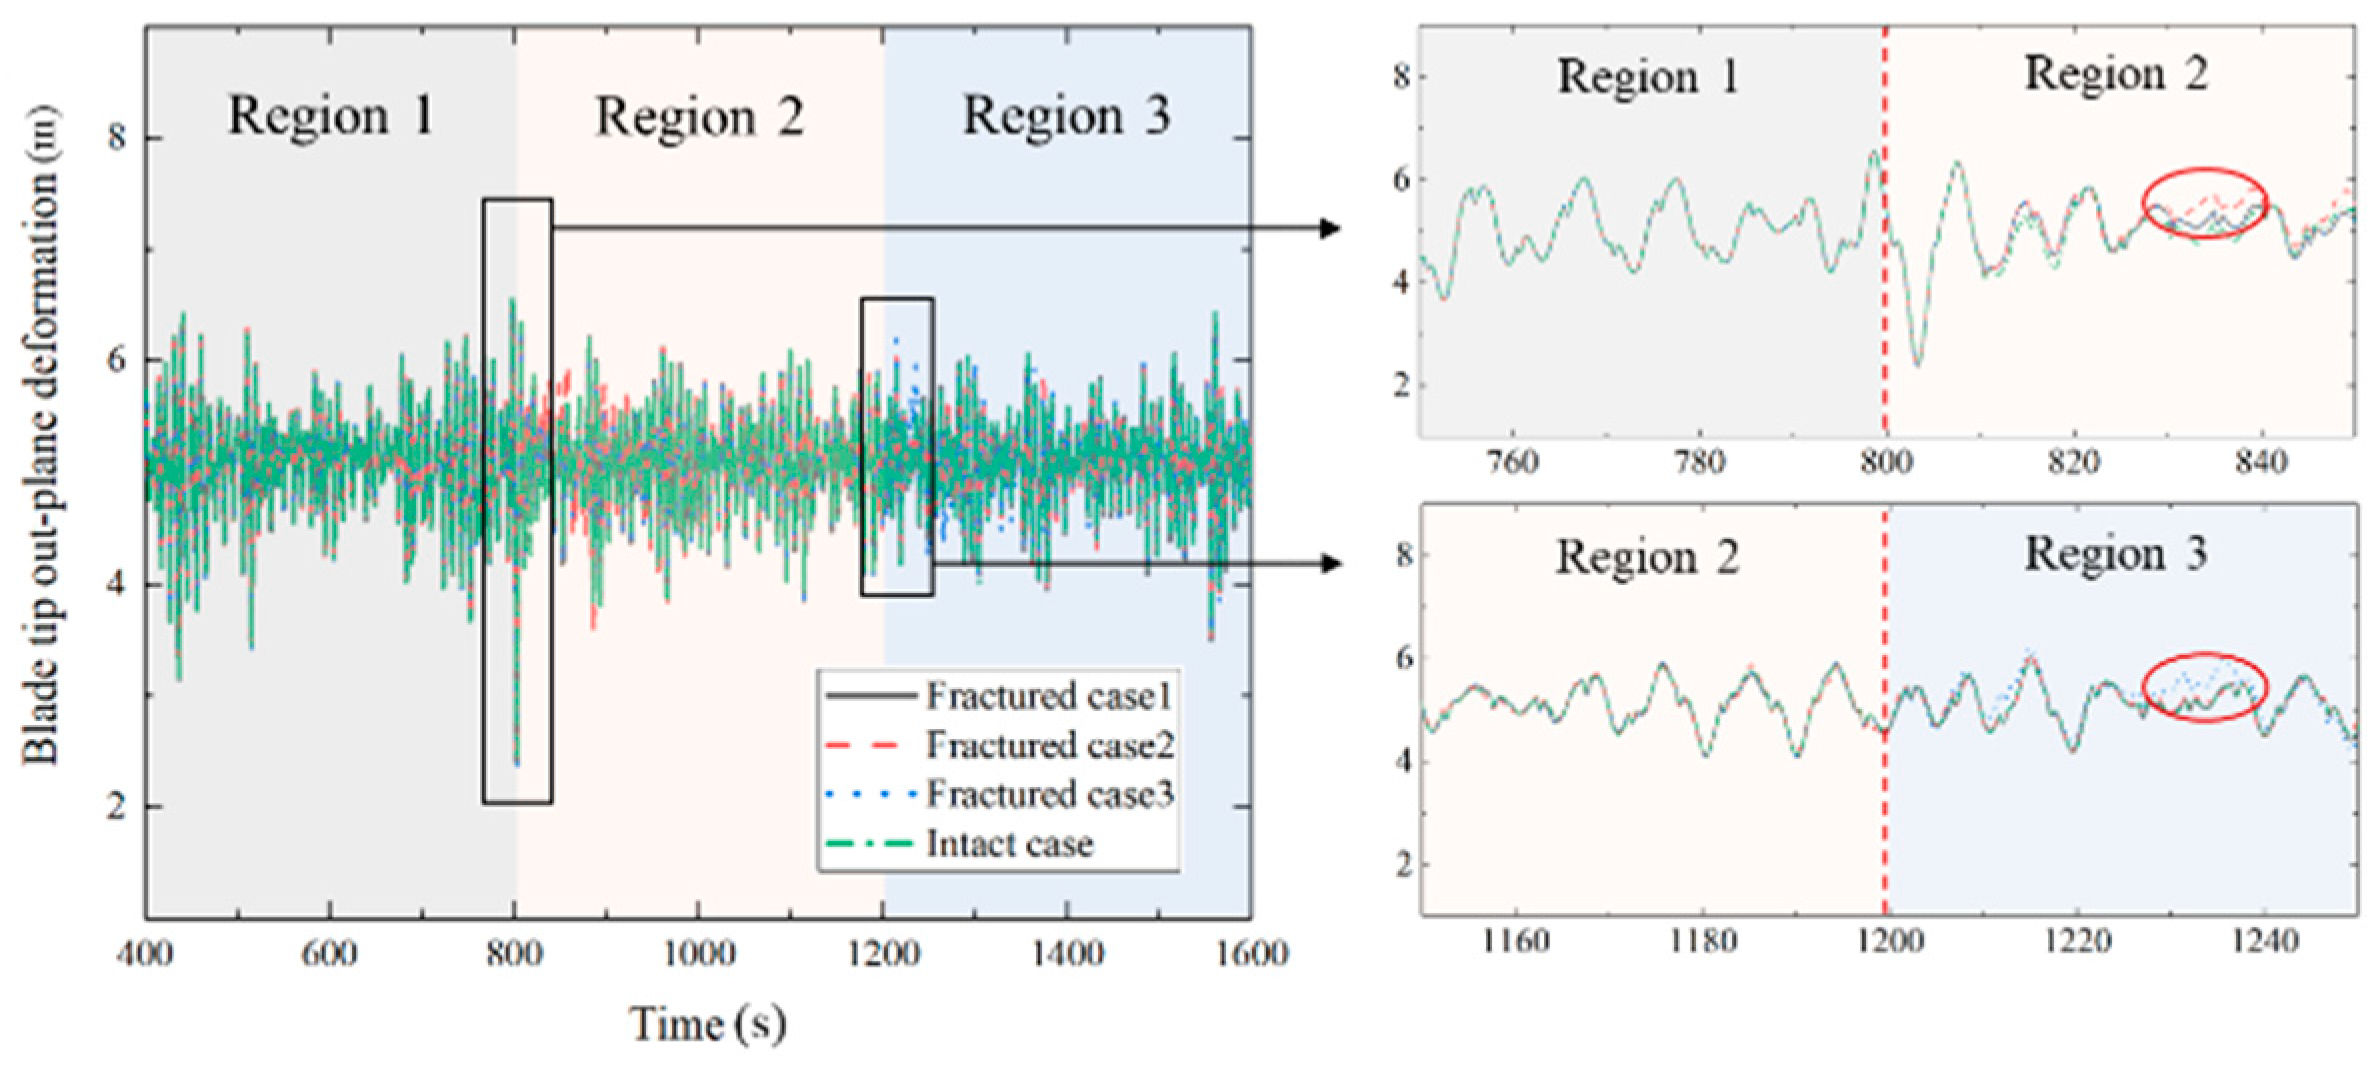
5.2.2. Blade Deformation
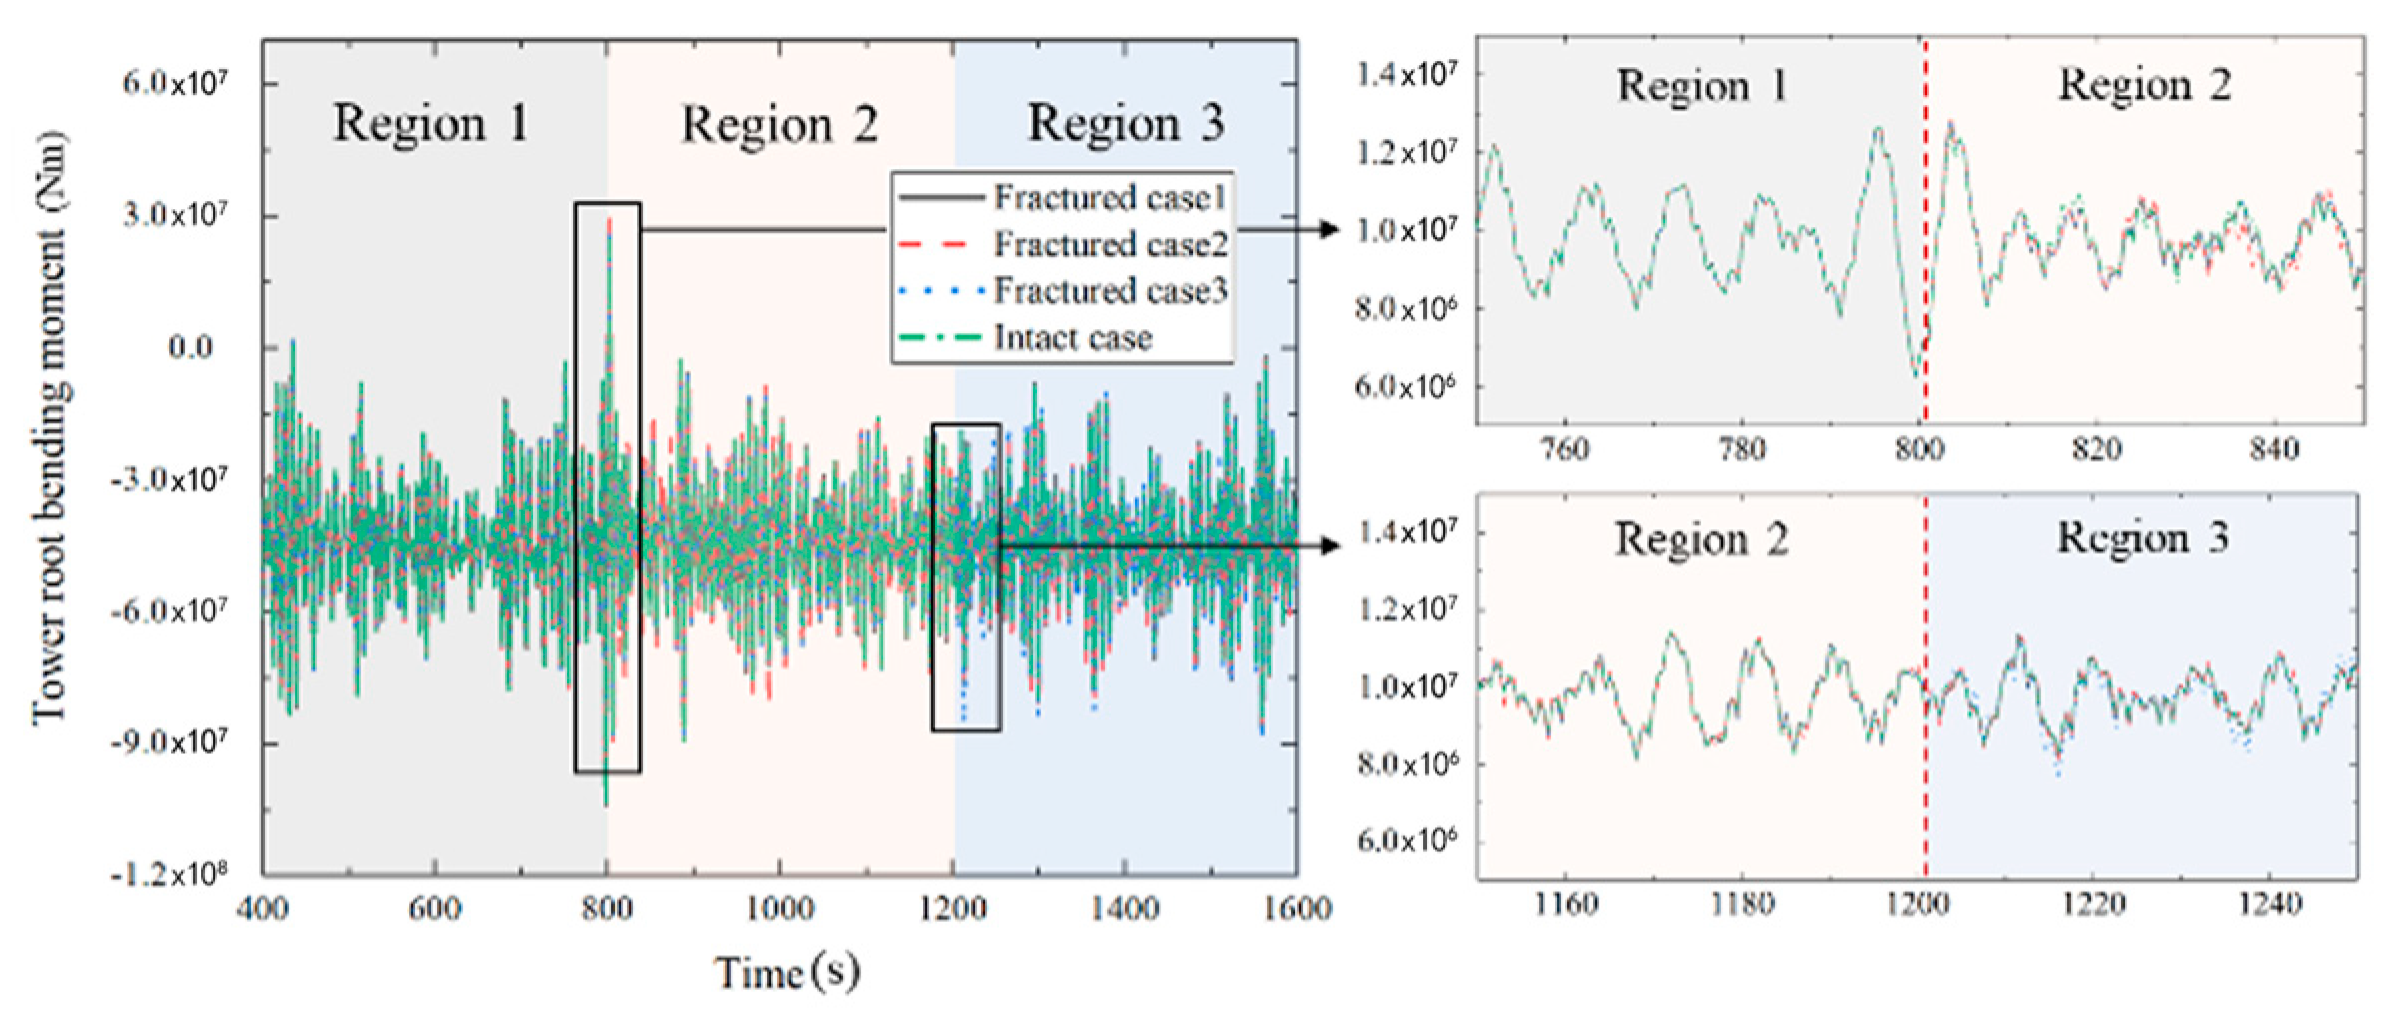
5.2.3. Tower Bending Moment
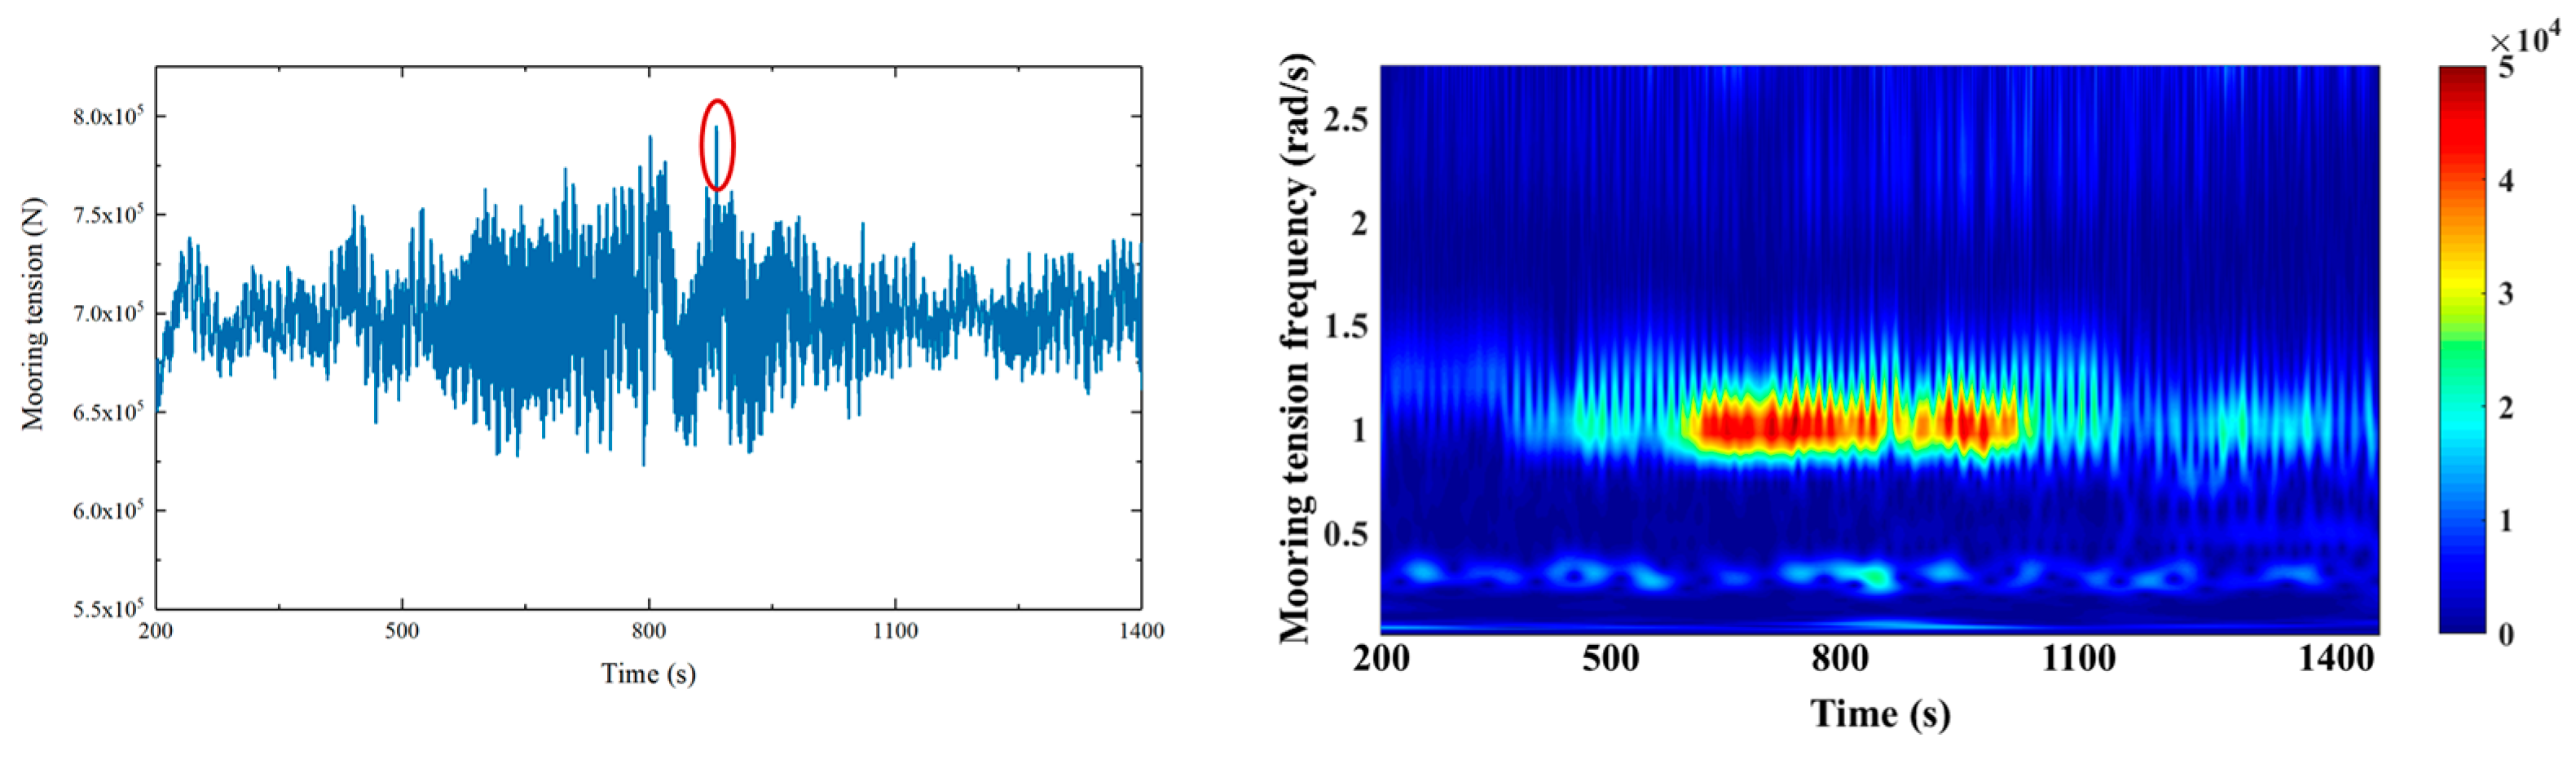
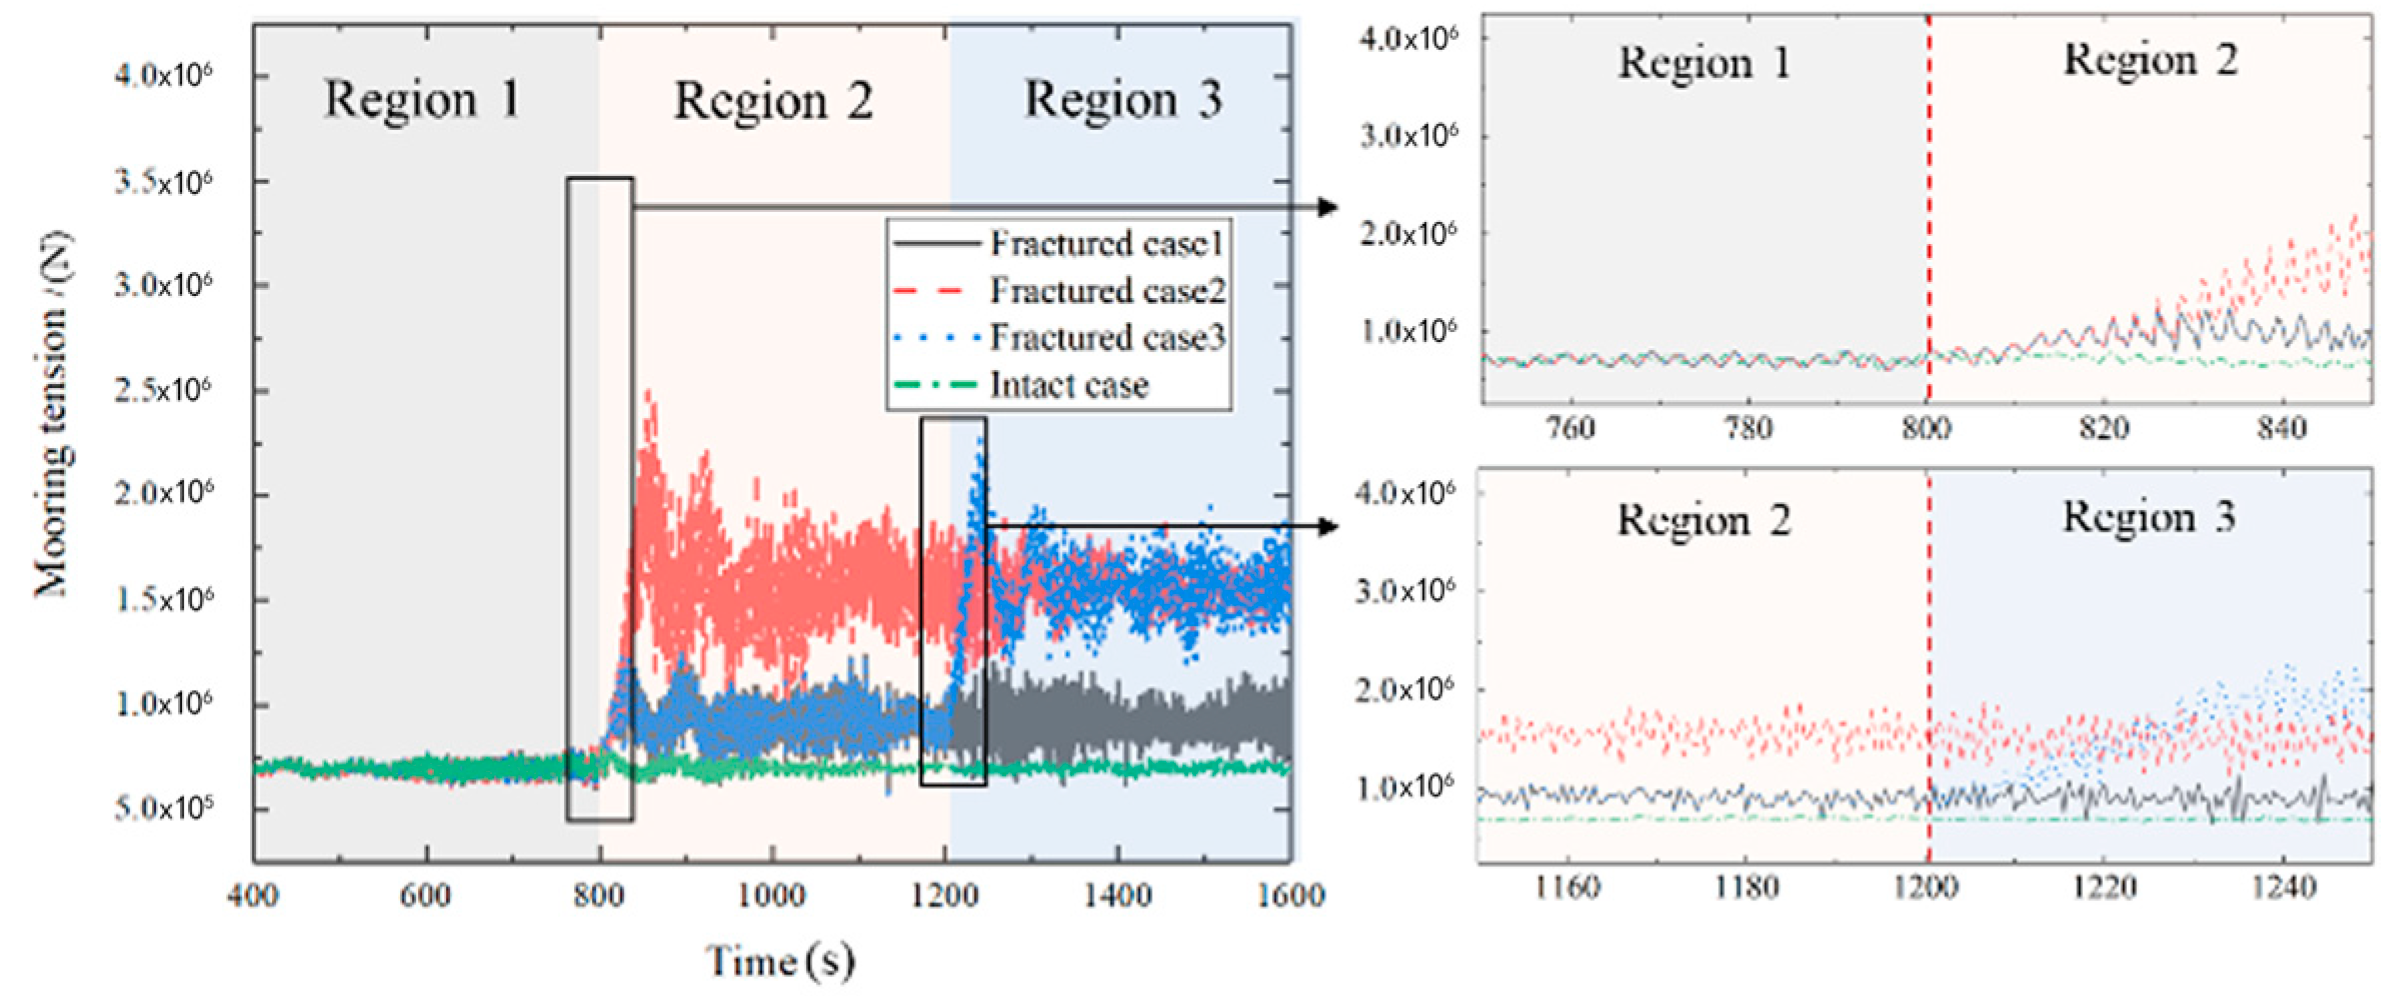
5.2.4. Mooring Lines
5.2.5. Aerodynamic Performance
6. Conclusions
Author Contributions
Funding
Institutional Review Board Statement
Informed Consent Statement
Data Availability Statement
Conflicts of Interest
References
- Yolcan, O.O. World energy outlook and state of renewable energy: 10-Year evaluation. Innov. Green Dev. 2023, 2, 100070. [Google Scholar] [CrossRef]
- Summerfield-Ryan, O.; Park, S. The power of wind: The global wind energy industry’s successes and failures. Ecol. Econ. 2023, 210, 107841. [Google Scholar] [CrossRef]
- Alotta, G.; Laface, V.; Failla, G.; Ruzzo, C.; Arena, F. A novel concept of floating absorber for motion mitigation in floating offshore wind turbines. Eng. Struct. 2023, 294, 116554. [Google Scholar] [CrossRef]
- Pimenta, F.; Ribeiro, D.; Román, A.; Magalhães, F. Predictive model for fatigue evaluation of floating wind turbines validated with experimental data. Renew. Energy 2024, 223, 119981. [Google Scholar] [CrossRef]
- Tanaka, K.; Sato, I.; Utsunomiya, T.; Kakuya, H. Validation of dynamic response of a 2-MW hybrid-spar floating wind turbine during typhoon using full-scale field data. Ocean Eng. 2020, 218, 108262. [Google Scholar] [CrossRef]
- Elobeid, M.; Pillai, A.C.; Tao, L.; Ingram, D.; Hanssen, J.E.; Mayorga, P. Implications of wave–current interaction on the dynamic responses of a floating offshore wind turbine. Ocean Eng. 2024, 292, 116571. [Google Scholar] [CrossRef]
- Li, Y.; Li, H.; Wang, Z.; Li, Y.; Wang, B.; Tang, Y. The dynamic response of a Spar-type floating wind turbine under freak waves with different properties. Mar. Struct. 2023, 91, 103471. [Google Scholar] [CrossRef]
- Zeng, X.; Shi, W.; Feng, X.; Shao, Y.; Li, X. Investigation of higher-harmonic wave loads and low-frequency resonance response of floating offshore wind turbine under extreme wave groups. Mar. Struct. 2023, 89, 103401. [Google Scholar]
- Zhang, H.; Tang, W.; Yuan, Y.; Xue, H.; Qin, H. The three-dimensional green-water event study on a fixed simplified wall-sided ship under freak waves. Ocean Eng. 2022, 251, 111096. [Google Scholar] [CrossRef]
- Ji, X.; Li, A.; Li, J.; Wang, L.; Wang, D. Research on the statistical characteristic of freak waves based on observed wave data. Ocean Eng. 2022, 243, 110323. [Google Scholar] [CrossRef]
- Luo, M.; Koh, C.G.; Lee, W.X.; Lin, P.; Reeve, D.E. Experimental study of freak wave impacts on a tension-leg platform. Mar. Struct. 2020, 74, 102821. [Google Scholar] [CrossRef]
- Chang, S.; Huang, W.; Liu, F.; Song, H. Influence of second-order wave force and focusing position on dynamic responses of tension leg platform under a freak wave. Ocean Eng. 2021, 242, 110126. [Google Scholar] [CrossRef]
- Wang, J.; Luo, Y.; Wang, Y.; Guo, R.; Cai, W.; Zhao, J. Dynamic response of tension leg platform with hydro-pneumatic tensioner under second-order waves and freak waves. Ocean Eng. 2022, 252, 111261. [Google Scholar] [CrossRef]
- Wang, J.; Wang, Y.; Guo, R.; Cai, W.; Zhao, J. Dynamic responses of TLP considering coupled transverse and axial effect of tether under second-order wave and freak wave. J. Mar. Sci. Technol. 2022, 27, 1084–1103. [Google Scholar] [CrossRef]
- Rudman, M.; Cleary, P.W. Freak wave impact on a tension leg platform: The effect of wave incidence angle and mooring line tension. Ocean Eng. 2013, 61, 123–138. [Google Scholar] [CrossRef]
- Russo, S.; Contestabile, P.; Bardazzi, A.; Leone, E.; Iglesias, G.; Tomasicchio, G.R.; Vicinanza, D. Dynamic loads and response of a spar buoy wind turbine with pitch-controlled rotating blades: An experimental study. Energies 2021, 14, 3598. [Google Scholar] [CrossRef]
- Ruzzo, C.; Saha, N.; Arena, F. Wave spectral analysis for design of a spar floating wind turbine in Mediterranean Sea. Ocean Eng. 2019, 184, 255–272. [Google Scholar] [CrossRef]
- Li, Y.; Qu, X.; Liu, L.; Xie, P.; Yin, T.; Tang, Y. A numerical prediction on the transient response of a spar-type floating offshore wind turbine in freak waves. J. Offshore Mech. Arct. Eng. 2020, 142, 062004. [Google Scholar]
- Luo, M.; Rubinato, M.; Wang, X.; Zhao, X. Experimental investigation of freak wave actions on a floating platform and effects of the air gap. Ocean Eng. 2022, 253, 111192. [Google Scholar]
- Qu, X.; Li, Y.; Tang, Y.; Hu, Z.; Zhang, P.; Yin, T. Dynamic response of spar-type floating offshore wind turbine in freak wave considering the wave-current interaction effect. Appl. Ocean Res. 2020, 100, 102178. [Google Scholar] [CrossRef]
- Tang, H.J.; Yao, H.C.; Yang, R.Y. Experimental and numerical study of a barge-type floating offshore wind turbine under a mooring line failure. Ocean Eng. 2023, 278, 114411. [Google Scholar] [CrossRef]
- Kim, H.C.; Kim, M.H.; Choe, D.E. Structural health monitoring of towers and blades for floating offshore wind turbines using operational modal analysis and modal properties with numerical-sensor signals. Ocean Eng. 2019, 188, 106226. [Google Scholar] [CrossRef]
- Rostam-Alilou, A.A.; Zhang, C.; Salboukh, F.; Gunes, O. Potential use of Bayesian Networks for estimating relationship among rotational dynamics of floating offshore wind turbine tower in extreme environmental conditions. Ocean Eng. 2022, 244, 110230. [Google Scholar] [CrossRef]
- Li, J.; Lian, J.; Guo, Y.; Wang, H. Concept design and floating installation method study of multi-bucket foundation floating platform for offshore wind turbines. Mar. Struct. 2024, 93, 103541. [Google Scholar] [CrossRef]
- Li, Y.; Zhu, Q.; Liu, L.; Tang, Y. Transient response of a SPAR-type floating offshore wind turbine with fractured mooring lines. Renew. Energy 2018, 122, 576–588. [Google Scholar] [CrossRef]
- Lin, Y.H.; Huang, Y.R. Drift simulation of a floating offshore wind turbine with broken mooring lines in a dynamic sea condition. Ocean Eng. 2022, 266, 112729. [Google Scholar] [CrossRef]
- Gao, X.; Liu, X.; Xue, X.; Chen, N.Z. Fracture mechanics-based mooring system fatigue analysis for a spar-based floating offshore wind turbine. Ocean Eng. 2021, 223, 108618. [Google Scholar] [CrossRef]
- Zhang, Z.; Wang, X.; Zhang, X.; Zhou, C.; Wang, X. Dynamic responses and mooring line failure analysis of the fully submersible platform for floating wind turbine under typhoon. Eng. Struct. 2024, 301, 117334. [Google Scholar] [CrossRef]
- Zhao, Z.; Fan, Y.; Kuang, X.; Zhou, S.; Zhang, K. Experimental study on dynamic characteristic of a new semi-submersible floating offshore wind turbine. J. Vib. Shock 2022, 41, 252–257. [Google Scholar]
- Zhao, Z.; Fan, Y.; Kuang, X.; Zhou, S.; Cheng, H. Experimental Research on Coupling Dynamic Response of Semi-submersible Floating Offshore Wind Turbine. Ship Build. China 2022, 63, 198–206. [Google Scholar]
- Jonkman, J.; Butterfield, S.; Musial, W.; Scott, G. Definition of a 5-MW Reference Wind Turbine for Offshore System Development (No. NREL/TP-500-38060); National Renewable Energy Lab. (NREL): Golden, CO, USA, 2009. [Google Scholar]
- Roddier, D.; Cermelli, C.; Aubault, A.; Weinstein, A. WindFloat: A floating foundation for offshore wind turbines. J. Renew. Sustain. Energy 2010, 2, 033104. [Google Scholar] [CrossRef]
- Klinting, P.; Sand, S.E. Analysis of Prototype Freak Waves; ASCE: Preston, VA, USA, 1987. [Google Scholar]
- Majumder, S.; Remya, P.G.; Nair, T.B.; Sirisha, P. Analysis of meteorological and oceanic conditions during freak wave events in the Indian Ocean. Ocean Eng. 2022, 259, 111920. [Google Scholar] [CrossRef]
- Li, Y.; Liu, L.; Zhu, Q.; Guo, Y.; Hu, Z.; Tang, Y. Influence of vortex-induced loads on the motion of SPAR-type wind turbine: A coupled aero-hydro-vortex-mooring investigation. J. Offshore Mech. Arct. Eng. 2018, 140, 051903. [Google Scholar] [CrossRef]
- Cai, L.; Zhao, J.; Xiang, R.; Sun, Z.; Liang, B. Analysis of freak wave probability and wave characteristics based on measured data. Ocean Eng. 2023, 41, 56–64. (In Chinese) [Google Scholar]
- Tang, Y.; Li, Y.; Wang, B.; Liu, S.; Zhu, L. Dynamic analysis of turret-moored FPSO system in freak wave. China Ocean Eng. 2016, 30, 521–534. [Google Scholar] [CrossRef]
- Li, H.; Li, Y.; Li, G.; Zhu, Q.; Wang, B.; Tang, Y. Transient tower and blade deformations of a Spar-type floating wind turbine in freak waves. Ocean Eng. 2024, 294, 116801. [Google Scholar] [CrossRef]
- Wu, Q.; Zhang, H.Q. Breathers, rogue waves and breather–rogue waves on a periodic background for the modified nonlinear Schrödinger equation. Wave Motion 2022, 110, 102890. [Google Scholar] [CrossRef]
- Kashima, H.; Mori, N. Aftereffect of high-order nonlinearity on extreme wave occurrence from deep to intermediate water. Coast. Eng. 2019, 153, 103559. [Google Scholar] [CrossRef]
- Houtani, H.; Waseda, T.; Fujimoto, W.; Kiyomatsu, K.; Tanizawa, K. Generation of a spatially periodic directional wave field in a rectangular wave basin based on higher-order spectral simulation. Ocean Eng. 2018, 169, 428–441. [Google Scholar] [CrossRef]
- Rongé, É.; Peyrard, C.; Venugopal, V.; Xiao, Q.; Johanning, L.; Benoit, M. Evaluation of second and third-order numerical wave-loading models for floating offshore wind TLPs. Ocean Eng. 2023, 288, 116064. [Google Scholar] [CrossRef]
- Khait, A. Third-order generation of narrow-banded wave trains by a wavemaker. Ocean Eng. 2020, 218, 108200. [Google Scholar] [CrossRef]
- Deng, Y.; Zhu, C.; Wang, Z. A comparative study of wave kinematics and inline forces on vertical cylinders under Draupner-type freak waves. Ocean Eng. 2023, 288, 115959. [Google Scholar] [CrossRef]


| Parameters | Value |
|---|---|
| Total length | 71.96 m |
| Total width | 80.0 m |
| Depth | 33.0 m |
| Column diameter/spacing | 13.0 m/60.0 m |
| Pontoon width/height | 14.0 m/3.5 m |
| Diameter/height of droop plate | 20.0 m/3.5 m |
| Square cross brace length/width/height | 47 m/3.5 m/3.5 m |
| Working condition draft | 18 m |
| Weight | 5621.066 t |
| Center of gravity | (29.314 m, 0.309 m, 24.793 m) |
| Parameters | Value |
|---|---|
| Rated power | 5 MW |
| Wind direction | Leeward |
| Number of blades | 3 |
| Shafting transmission efficiency | 0.944 |
| Wind wheel radius | 63 m |
| Propeller hub radius | 1.5 m |
| Cut-in/rated/cut-out wind speed | 3 m/s, 11.4 m/s, 25 m/s |
| Rated speed | 12.1 rpm |
| Hub height | 90 m |
| Height of center of gravity | 64.0 m |
| Mooring Line Segmentation | Bottom Part | Middle Part | Top Part |
|---|---|---|---|
| Ingredients | M2 | R3 | R3S |
| Diameter (mm) | 208 | 122 | 122 |
| Length (m) | 280 | 131 | 20 |
| Dry weight (kg/m) | 861 | 296.2 | 296.2 |
| Breaking tension (kN) | 24,140 | 11,365 | 12,690 |
| Axial stiffness (kN) | 3,690,000 | 1,270,000 | 1,270,000 |
| Parameters | Value |
|---|---|
| Spectral peak period | 10 s |
| Significant wave height | 3 m |
| Frequency-domain range | 0.05~2 rad/s |
| Number of constituent waves | 1000 |
| Number of random waves | 600 |
| Simulation duration | 1600 s |
| Time interval | 0.1 s |
| Focus moment | 800 s |
| Focus location | 0 m |
| DOF | Our Work | Zhao et al. [29] | Relative Error |
|---|---|---|---|
| Natural Period | Natural Period | ||
| Surge | 52.86 s | 59.48 s | 11.13% |
| Sway | 53.57 s | 58.66 s | 8.68% |
| Heave | 24.25 s | 24.12 s | 0.05% |
| Pitch | 23.25 s | 23.12 s | 0.06% |
Disclaimer/Publisher’s Note: The statements, opinions and data contained in all publications are solely those of the individual author(s) and contributor(s) and not of MDPI and/or the editor(s). MDPI and/or the editor(s) disclaim responsibility for any injury to people or property resulting from any ideas, methods, instructions or products referred to in the content. |
© 2024 by the authors. Licensee MDPI, Basel, Switzerland. This article is an open access article distributed under the terms and conditions of the Creative Commons Attribution (CC BY) license (https://creativecommons.org/licenses/by/4.0/).
Share and Cite
Liu, B.; Yu, J. Dynamic Response and Mooring Fracture Performance Analysis of a Semi-Submersible Floating Offshore Wind Turbine under Freak Waves. J. Mar. Sci. Eng. 2024, 12, 1414. https://doi.org/10.3390/jmse12081414
Liu B, Yu J. Dynamic Response and Mooring Fracture Performance Analysis of a Semi-Submersible Floating Offshore Wind Turbine under Freak Waves. Journal of Marine Science and Engineering. 2024; 12(8):1414. https://doi.org/10.3390/jmse12081414
Chicago/Turabian StyleLiu, Baolong, and Jianxing Yu. 2024. "Dynamic Response and Mooring Fracture Performance Analysis of a Semi-Submersible Floating Offshore Wind Turbine under Freak Waves" Journal of Marine Science and Engineering 12, no. 8: 1414. https://doi.org/10.3390/jmse12081414