
Experimental Characterization of Stiffness of a Polyester Mooring Rope for a CFPSO


Abstract
1. Introduction
2. Description of the Tests
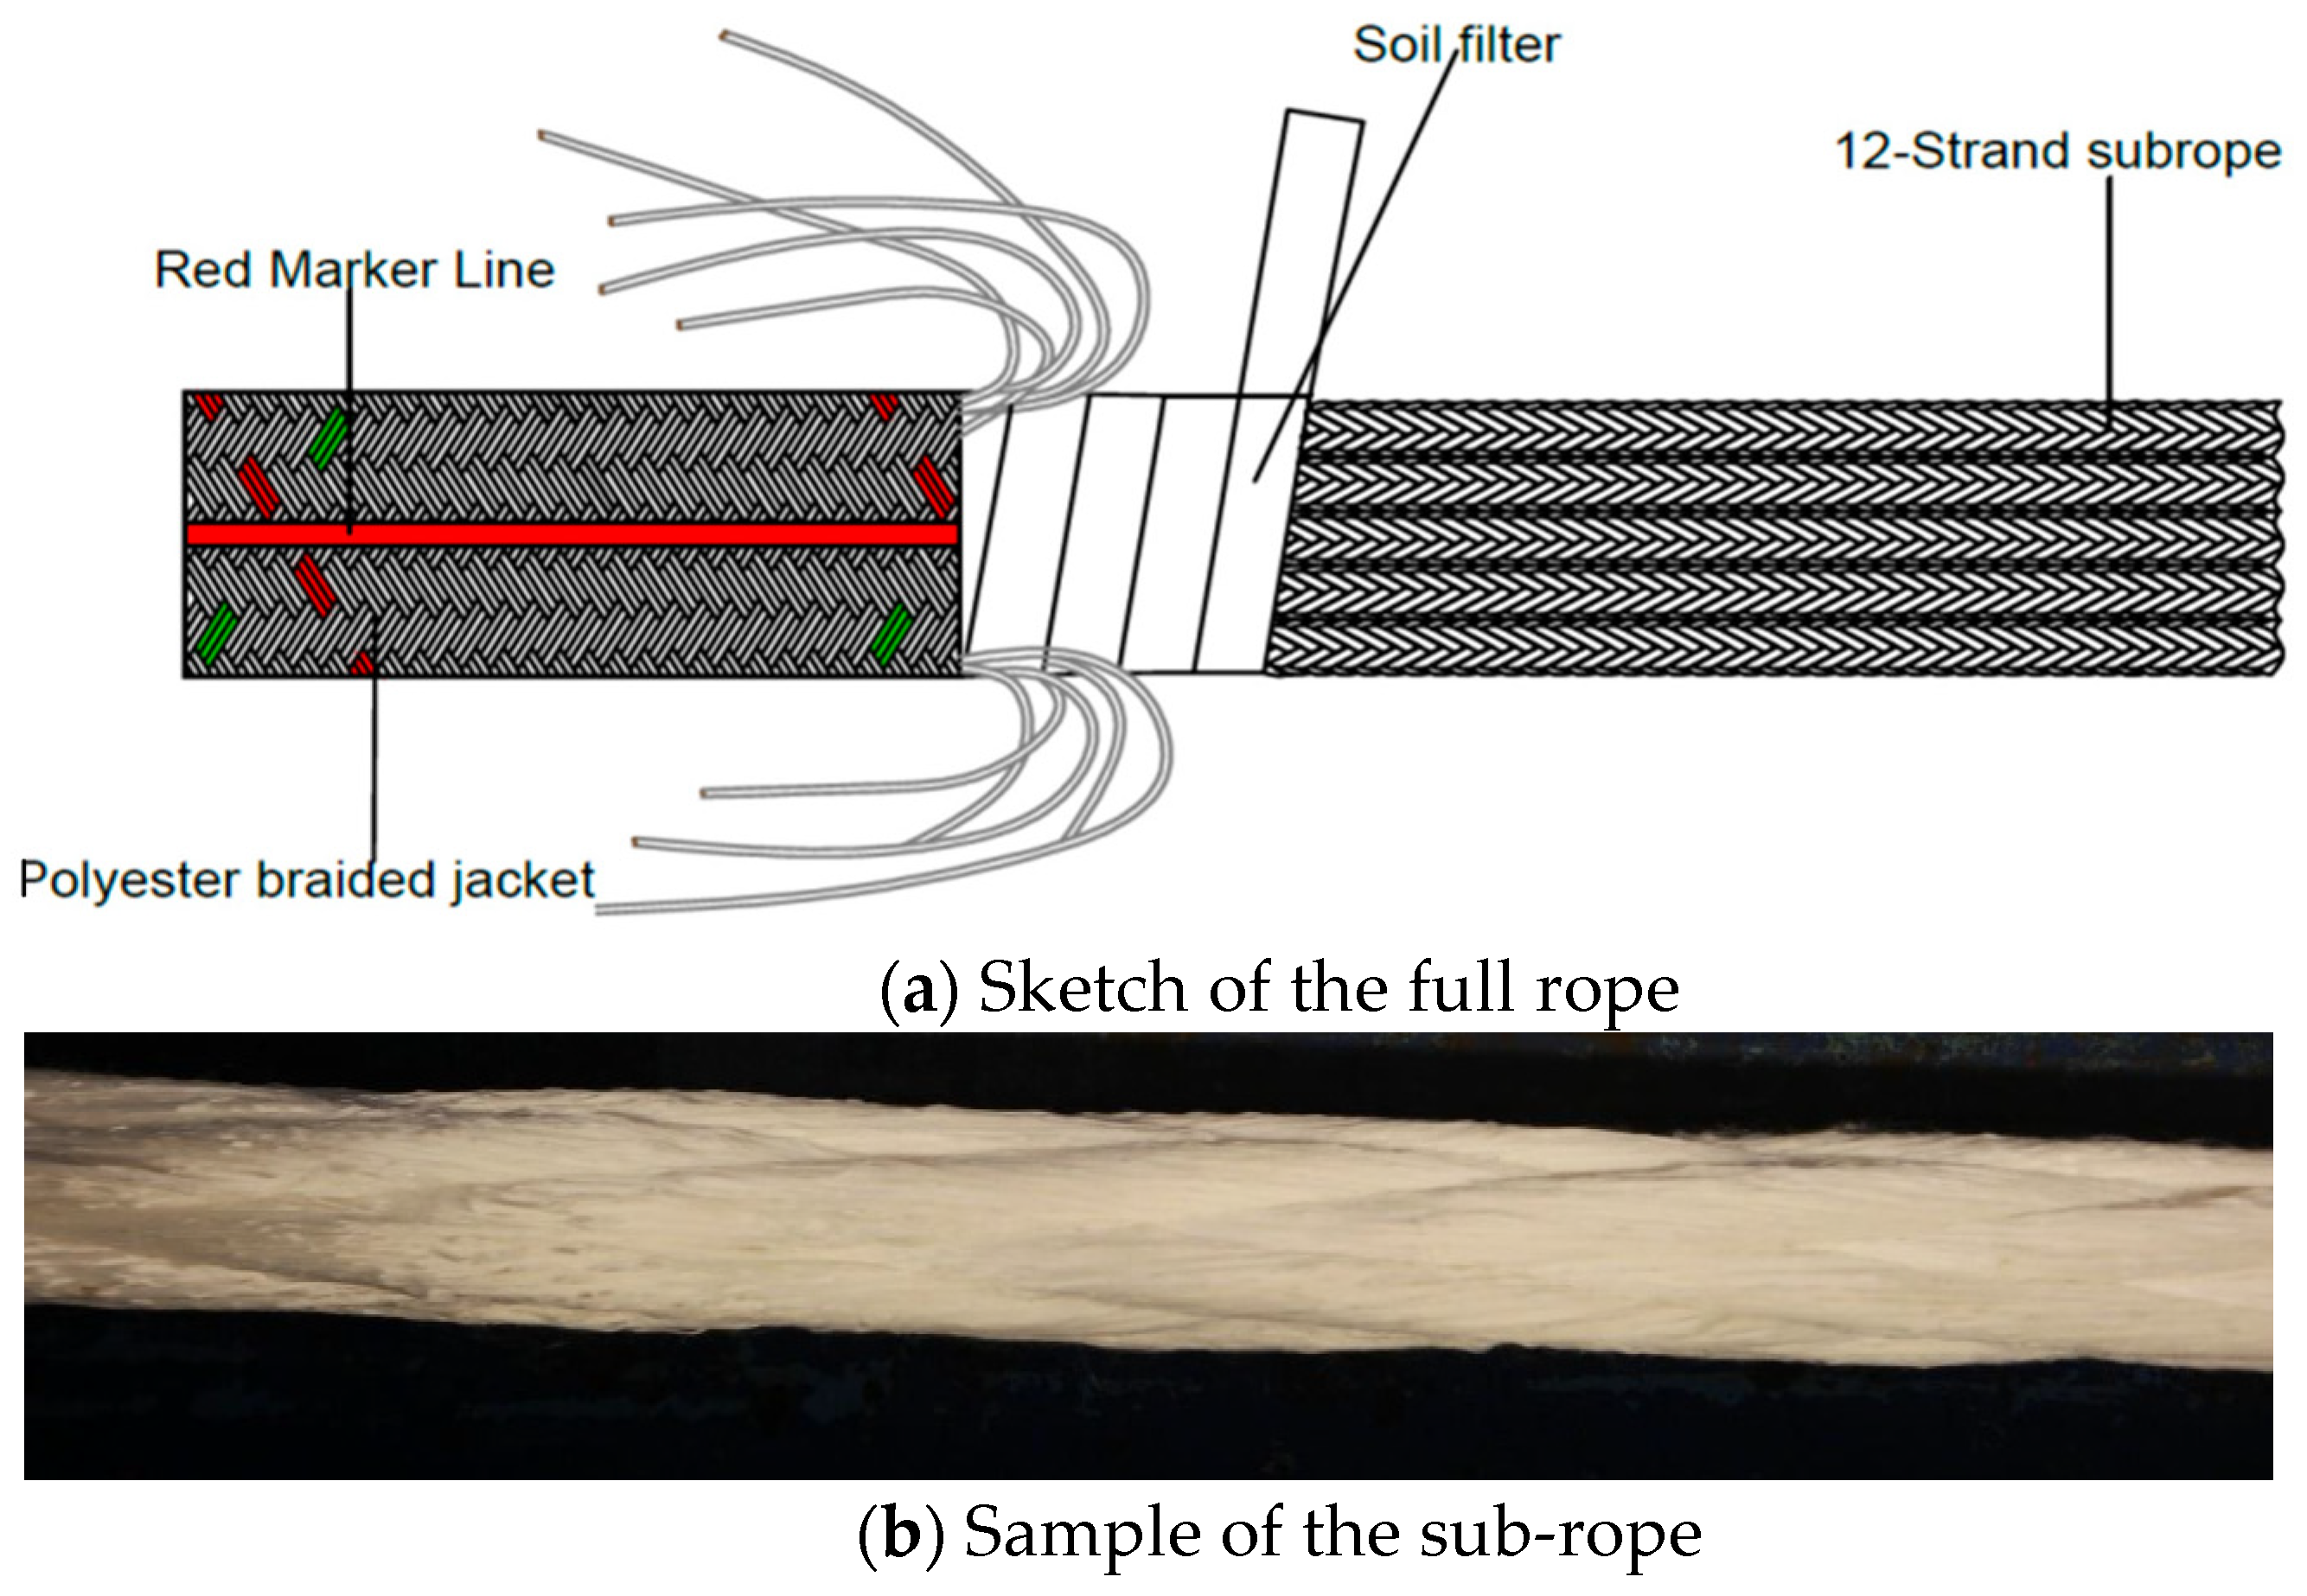
2.1. Test Samples
2.2. Test Facility
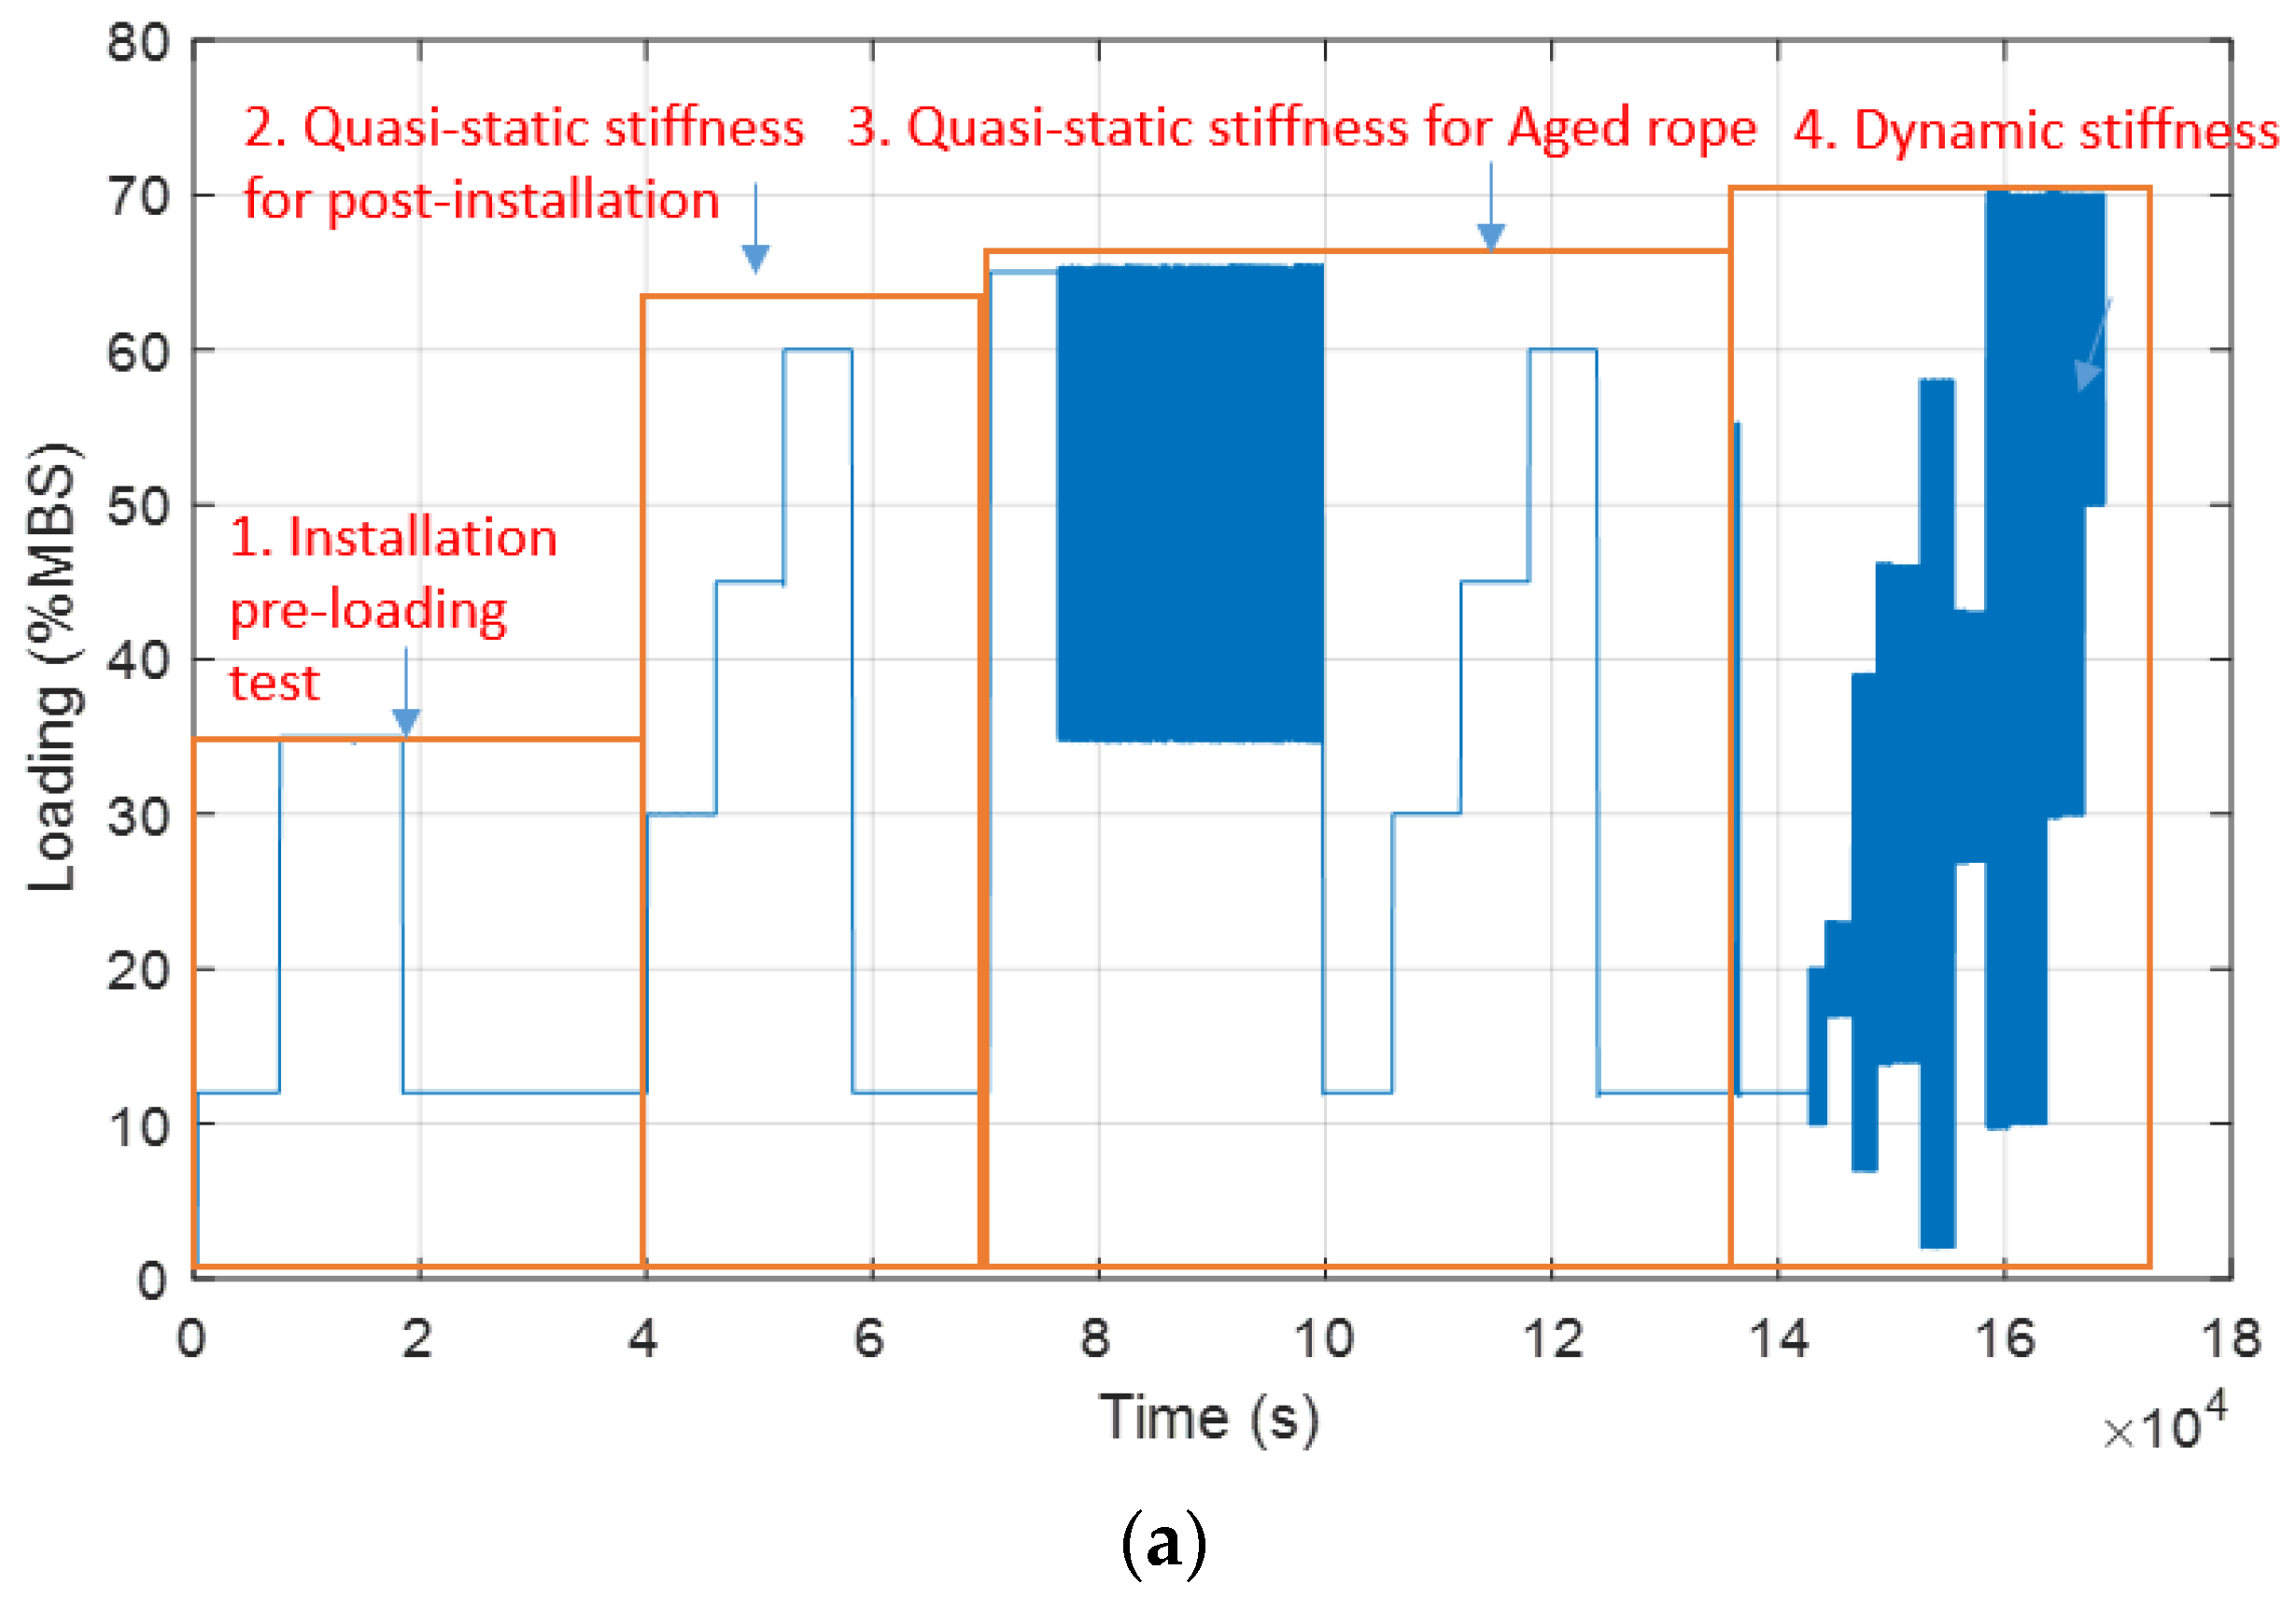
2.3. Test Procedures
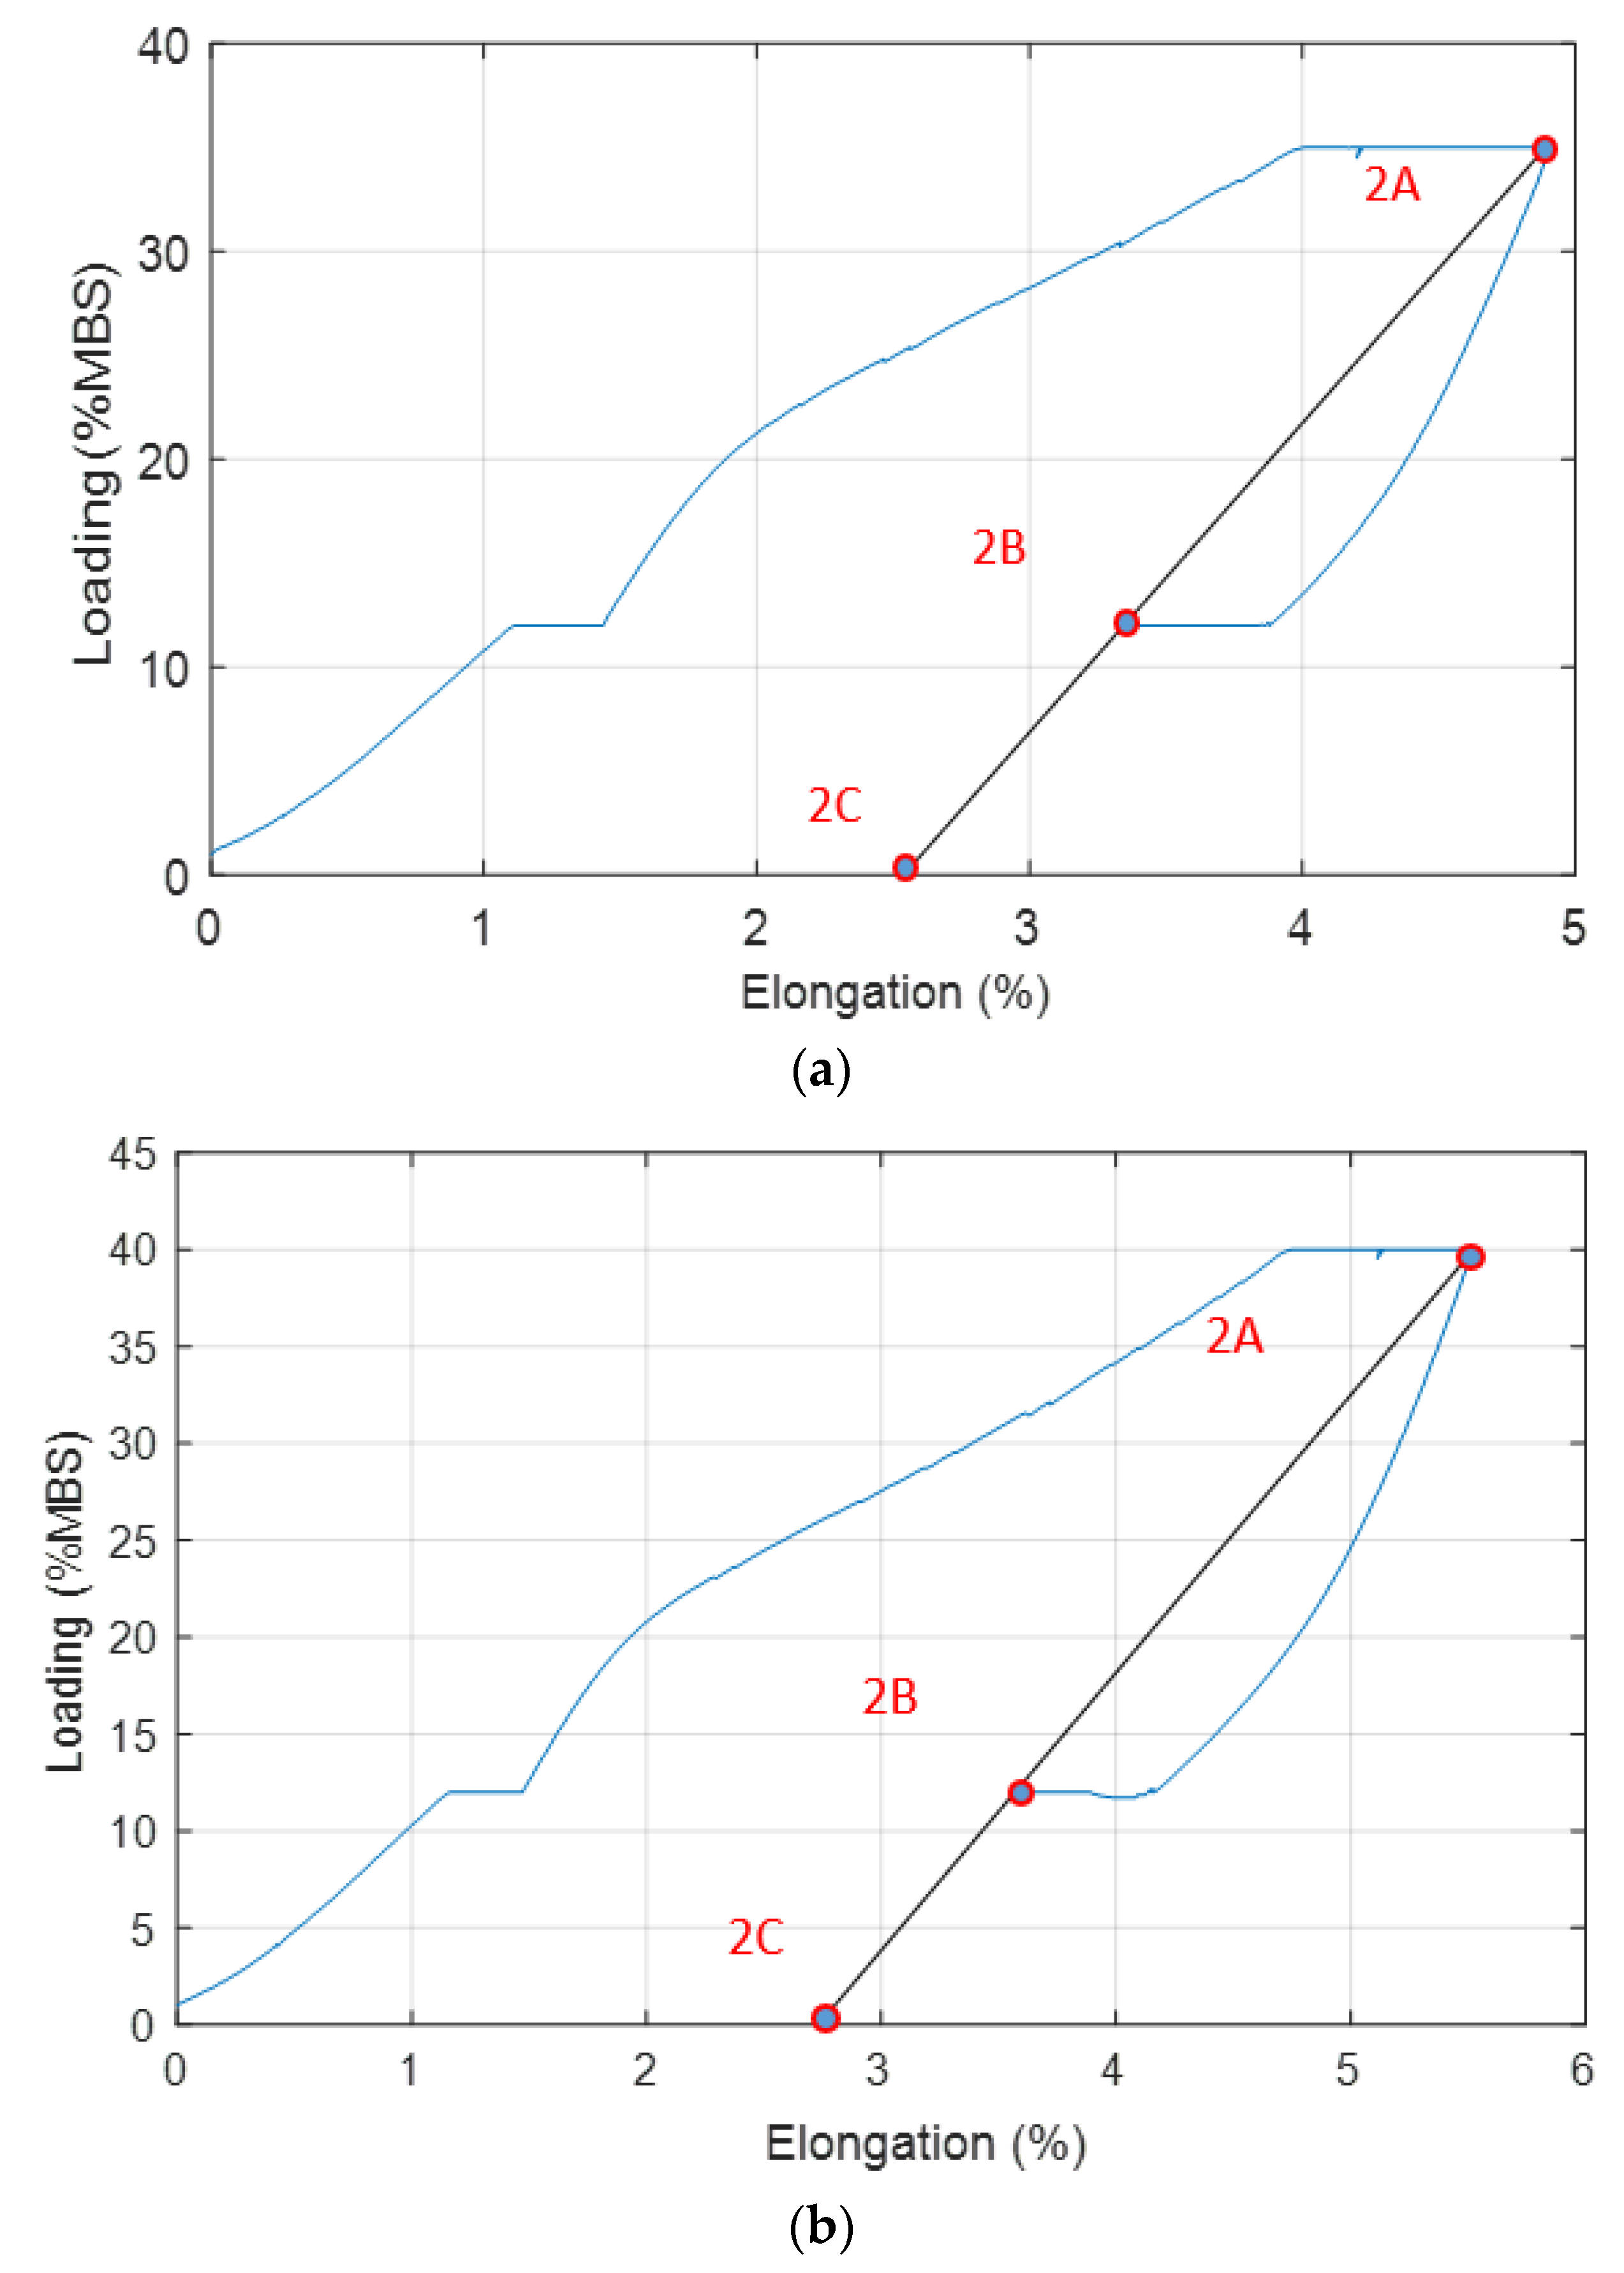
3. Analysis Methods for the Tested Data
4. Results and Discussions
5. Conclusions
Author Contributions
Funding
Data Availability Statement
Acknowledgments
Conflicts of Interest
References
- Aderinto, T.; Li, H. Ocean wave energy converters: Status and challenges. Energies 2018, 11, 1250. [Google Scholar] [CrossRef]
- Hsu, W.T.; Thiagarajan, K.P.; Manuel, L. Extreme mooring tensions due to snap loads on a floating offshore wind turbine system. Mar. Struct. 2017, 55, 182–199. [Google Scholar] [CrossRef]
- Kvitrud, A. Lessons Learned from Norwegian Anchor Line Failures 2010–2013. In Proceedings of the 33rd International Conference on Ocean, Offshore and Arctic Engineering, San Francisco, CA, USA, 8–13 June 2014. [Google Scholar]
- Jhang, S.E.; Kim, S.; Qi, Y. Lexical bundles in ESP writing: Marine accident investigation reports. Linguist. Res. 2018, 35, 105–135. [Google Scholar] [CrossRef]
- Bae, Y.H.; Kim, M.H.; Kim, H.C. Performance changes of a floating offshore wind turbine with broken mooring line. Renew. Energy 2017, 101, 364–375. [Google Scholar] [CrossRef]
- Li, Y.; Zhu, Q.; Liu, L.; Tang, Y. Transient response of a SPAR-type floating offshore wind turbine with fractured mooring lines. Renew. Energy 2018, 122, 576–588. [Google Scholar] [CrossRef]
- Yang, Y.; Bashir, M.; Li, C.; Wang, J. Investigation on mooring breakage effects of a 5 MW barge-type floating offshore wind turbine using F2A. Ocean Eng. 2021, 233, 108887. [Google Scholar] [CrossRef]
- Xu, H.; Rui, S.; Shen, K.; Guo, Z. Investigations on the mooring safety considering the coupling effect of the mooring line snap tension and anchor out-of-plane loading. Appl. Ocean Res. 2023, 141, 103753. [Google Scholar] [CrossRef]
- Howey, B.; Collins, K.M.; Hann, M.; Iglesias, G.; Gomes, R.P.; Henriques, J.C.; Gato, L.M.; Greaves, D. Compact floating wave energy converter arrays: Inter-device mooring connectivity and performance. Appl. Ocean Res. 2021, 115, 102820. [Google Scholar] [CrossRef]
- Weller, S.D.; Johanning, L.; Davies, P.; Banfield, S.J. Synthetic mooring ropes for marine renewable energy applications. Renew. Energy 2015, 83, 1268–1278. [Google Scholar] [CrossRef]
- Wang, S.; Xu, S.; Xiang, G.; Guedes Soares, C. An overview of synthetic mooring cables in marine applications. In Advances in Renewable Energies Offshore; Guedes Soares, C., Ed.; Taylor & Francis Group: London, UK, 2018; pp. 854–863. [Google Scholar]
- Xu, S.; Wang, S.; Guedes Soares, C. Review of mooring design for floating wave energy converters. Renew. Sustain. Energy Rev. 2019, 111, 595–621. [Google Scholar] [CrossRef]
- Wilson, S.; Hall, M.; Housner, S.; Sirnivas, S. Linearised modelling and optimisation of shared mooring systems. Ocean Eng. 2021, 241, 110009. [Google Scholar] [CrossRef]
- Lin, T.H.; Yang, R.Y. Stability Analysis and Environmental Influence Evaluation on a Hybrid Mooring System for a Floating Offshore Wind Turbine. J. Mar. Sci. Eng. 2023, 11, 2236. [Google Scholar] [CrossRef]
- Xu, S.; Wang, S.; Guedes Soares, C. Experimental investigation on hybrid mooring systems for wave energy converters. Renew. Energy 2020, 158, 130–153. [Google Scholar] [CrossRef]
- Xu, S.; Wang, S.; Guedes Soares, C. Experimental study of the influence of the rope material on mooring fatigue damage and point absorber response. Ocean Eng. 2021, 232, 108667. [Google Scholar] [CrossRef]
- Stansby, P.; Draycott, S.; Li, G.; Zhao, C.; Moreno, E.C.; Pillai, A.; Johanning, L. Experimental study of mooring forces on the multi-float WEC M4 in large waves with buoy and elastic cables. Ocean Eng. 2022, 266, 113049. [Google Scholar] [CrossRef]
- Sloan, C.; Hall, M.; Housner, S.; Lozon, E.; Sirnivas, S. Shared Mooring Systems for Deep-Water Floating Wind Farms; Technical Report NYSERDA Contract 142869; National Renewable Energy Lab. (NREL): Golden, CO, USA, 2022. [Google Scholar]
- DNV. Mooring Systems—Floating Wind and Solar Research Needs; DNV: Bærum, Norway, 2023. [Google Scholar]
- Pham, H.D.; Cartraud, P.; Schoefs, F.; Soulard, T.; Berhault, C. Dynamic modelling of nylon mooring lines for a floating wind turbine. Appl. Ocean Res. 2019, 87, 1–8. [Google Scholar] [CrossRef]
- Depalo, F.; Wang, S.; Xu, S.; Guedes Soares, C.; Yang, S.H.; Ringsberg, J.W. Effects of dynamic axial stiffness of elastic moorings for a wave energy converter. Ocean Eng. 2022, 251, 111132. [Google Scholar] [CrossRef]
- Wibner, C.; Versavel, T.; Masetti, I. Specifying and testing polyester mooring rope for the Barracuda and Caratinga FPSO deepwater mooring systems. In Proceedings of the Off-Shore Technology Conference, Houston, TX, USA, 5–8 May 2003. Offshore Technology Conference. [Google Scholar]
- Francois, M.; Davies, P.; Grosjean, F.; Legerstee, F. Modelling fiber rope load-elongation properties-Polyester and other fibers. In Proceedings of the Offshore Technology Conference, Houston, TX, USA, 3–6 May 2010. Offshore Technology Conference. [Google Scholar]
- Davies, P.; Baron, P.; Salomon, K.; Bideaud, C.; Labbé, J.P.; Toumit, S.; Francois, M.; Grosjean, F.; Bunsell, T.; Moysan, A.G. Influence of Fibre Stiffness on Deepwater Mooring Line Response. In Proceedings of the ASME 2008 27th International Conference on Offshore Mechanics and Arctic Engineering, Estoril, Portugal, 15–20 June 2008; American Society of Mechanical Engineers: New York, NY, USA, 2008; pp. 179–187, (Omae 2008–57147). [Google Scholar]
- Varney, A.S.; Taylor, R.; Seelig, W. Evaluation of Wire-Lay Nylon Mooring Lines in a Wave Energy Device Field Trial. In Proceedings of the 2013 OCEANS—San Diego, San Diego, CA, USA, 23–27 September 2013. [Google Scholar]
- Liu, H.; Huang, W.; Lian, Y.; Li, L. An experimental investigation on nonlinear behaviors of synthetic fiber ropes for deepwater moorings under cyclic loading. Appl. Ocean Res. 2014, 45, 22–32. [Google Scholar] [CrossRef]
- Huntley, M.B. Fatigue and Modulus Characteristics of Wire-Lay Nylon Rope. In Proceedings of the OCEANS 2016 MTS/IEEE Monterey, OCE 2016, Monterey, CA, USA, 19–23 September 2016; pp. 5–10. [Google Scholar]
- Ridge, I.M.L.; Banfield, S.J.; Mackay, J. Nylon Fibre Rope Moorings for Wave Energy Converters. In Proceedings of the MTS/IEEE Seattle, OCEANS 2010, Seattle, WA, USA, 20–23 September 2010; pp. 1–9. [Google Scholar]
- Lian, Y.; Liu, H.; Zhang, Y.; Li, L. An experimental investigation on fatigue behaviors of HMPE ropes. Ocean Eng. 2017, 139, 237–249. [Google Scholar] [CrossRef]
- Lian, Y.; Zhang, B.; Zheng, J.; Liu, H.; Ma, G.; Yim, S.C. An upper and lower bound method for evaluating residual strengths of polyester mooring ropes with artificial damage. Ocean Eng. 2022, 262, 112243. [Google Scholar] [CrossRef]
- Falkenberg, E.; Yang, L.; Åhjem, V. The syrope method for stiffness testing of polyester ropes. In Proceedings of the International Conference on Offshore Mechanics and Arctic Engineering, Madrid, Spain, 17–22 June 2018; American Society of Mechanical Engineers: New York, NY, USA, 2018; Volume 51203, p. V001T01A067. [Google Scholar]
- DNV. DNV-RP-E305 Design, Testing and Analysis of Offshore Fibre Ropes: Technical Report; DNV: Høvik, Norway, 2021. [Google Scholar]
- Sørum, S.H.; Fonseca, N.; Kent, M.; Faria, R.P. Assessment of nylon versus polyester ropes for mooring of floating wind turbines. Ocean Eng. 2023, 278, 114339. [Google Scholar] [CrossRef]
- Sisworo, S.J.; Windyandari, A.; Zakki, A.F. Sea Keeping Performance Investigation of Cylindrical Floating Production Storage and Offloading (FPSO) on the Indonesian Offshore Environment. In Proceedings of the 6th International Seminar on Ocean and Coastal Engineering, Environmental and Natural Disaster Management (ISOCEEN 2018), Surabaya, Indonesia, 4–5 November 2018; pp. 153–158. [Google Scholar] [CrossRef]
- Deng, S.; Zhong, W.; Yang, X.; Wu, M.; Fu, S. Experimental and numerical study of the hydrodynamic features of a cylindrical FPSO considering current-induced motion. Ocean Eng. 2022, 262, 112263. [Google Scholar] [CrossRef]
- Li, Y.; Li, Y.; Zhao, Z.; Tang, Y.; Li, H.; Zhang, Y.; Hu, Y. Dynamic Responses of the Cylindrical Floating Drilling Production Storage and Offloading System with Annular Anti-Motion Structures under the Survival Sea Scenario. J. Mar. Sci. Eng. 2023, 11, 218. [Google Scholar] [CrossRef]
- ABS 90-2011; Guidance Notes on the Application of Fiber Rope for Offshore Mooring. ABS (American Bureau of Shipping): Houston, TX, USA, 2011.
- Zhejiang Four Brothers Rope Co., Ltd. (FBR). Available online: https://en.fbrope.com/ (accessed on 1 February 2021).
- Fernandes, A.C.; Del Vecchio, C.J.M.; Castro, G.A.V. Mechanical properties of polyester mooring cables. Int. J. Offshore Polar Eng. 1999, 9, 208–213. Available online: https://onepetro.org/ISOPEIOPEC/proceedings-abstract/ISOPE98/All-ISOPE98/24560 (accessed on 1 February 2021).
- Bosman, R.L.M.; Hooker, J. The elastic modulus characteristics of polyester mooring ropes. In Proceedings of the Offshore Technology Conference, OTC-10779, Houston, TX, USA, 3–6 May 1999. [Google Scholar]
- Casey, N.F.; Belshaw, R.; Paton, A.G.; Hooker, J. Short- and long-term property behaviour of polyester rope. In Proceedings of the Offshore Technology Conference Paper OTC-12177, Houston, TX, USA, 1–4 May 2000. [Google Scholar]
- Xu, S.; Wang, S.; Liu, H.; Zhang, Y.; Li, L.; Guedes Soares, C. Experimental evaluation of the dynamic stiffness of synthetic fibre mooring ropes. Appl. Ocean Res. 2021, 112, 102709. [Google Scholar] [CrossRef]


| Test | Procedures |
|---|---|
| 1. Installation Pre-loading Test | (1) A load of 1% of MBS shall be applied and held for 5 min. (2) Install extensometers and measure the gauge and pin-to-pin length. (3) Increase the tension to 12% MBS and hold for 2 h. (4) Increase tension to a preload tension of 40% (for three samples)/35% (for three samples) MBS and hold the load for 3 h. (5) If the load drops to less than 5% MBS, then the load should be increased back to 40%/35% MBS (set the load and hold, allowing it to drop naturally, then adjust it back to 40%/35%, and this should only occur two to three times during the hold period). (6) Decrease tension to a 12% MBS level and hold the load for 6 h. |
| 2. Quasi-Static Stiffness for Post-Installation Rope | (1) Increase the tension from a pre-tension of 12% MBS to 30% MBS and then hold for 100 min. (2) Increase the tension from 30% to 45% MBS and hold for 100 min. (3) Increase the tension from 45% to 60% MBS and hold for 100 min. (4) Reduce the tension from 60% MBS to a pre-tension of 12% MBS and hold at this tension for at least 200 min. |
| 3. Quasi-Static Stiffness for Aged Rope | (1) Increase the tension from 13% MBS to 65% MBS and hold at this tension for 100 min. (2) Apply 1000 cycles of dynamic load with a tension range of 35% to 65% MBS and a period of 12 to 35 s. (3) Reduce the tension from 65% MBS to 13% MBS and hold at this tension for 100 min. (4) The quasi-static stiffness test outlined in Step 2 should be repeated after the above loading. |
| 4. Dynamic Stiffness | (1) Cycle the rope 10 times between a pre-tension of 12% MBS and 55% MBS with a period of 12 to 35 s and then return to the pre-tension of 12% MBS and hold for at least 100 min. (2) For each WF test case, cycle the rope between Tmin and Tmax 40 times, and then record the load and elongation with a frequency of at least 1 Hz. (3) For each LF test case, cycle the rope at the tension between Tmin and Tmax 20 times, and then record the load and elongation with a frequency of at least 0.25 Hz. (4) The sequence of the test cases can be selected to best facilitate the tests and perform the dynamic test cycles listed in Table 2. |
| Test Case | Mean Load (%MBS) | Amp. (%MBS) | Min Load (%MBS) | Max Load (%MBS) | Loading Period (s) | Cycles |
|---|---|---|---|---|---|---|
| 1 | 15% | 5% | 10% | 20% | 75 | 20 |
| 2 | 20% | 3% | 17% | 23% | 24 | 40 |
| 3 | 20% | 3% | 17% | 23% | 70 | 20 |
| 4 | 23% | 16% | 7% | 39% | 110 | 20 |
| 5 | 30% | 16% | 14% | 46% | 34 | 40 |
| 6 | 30% | 16% | 14% | 46% | 129 | 20 |
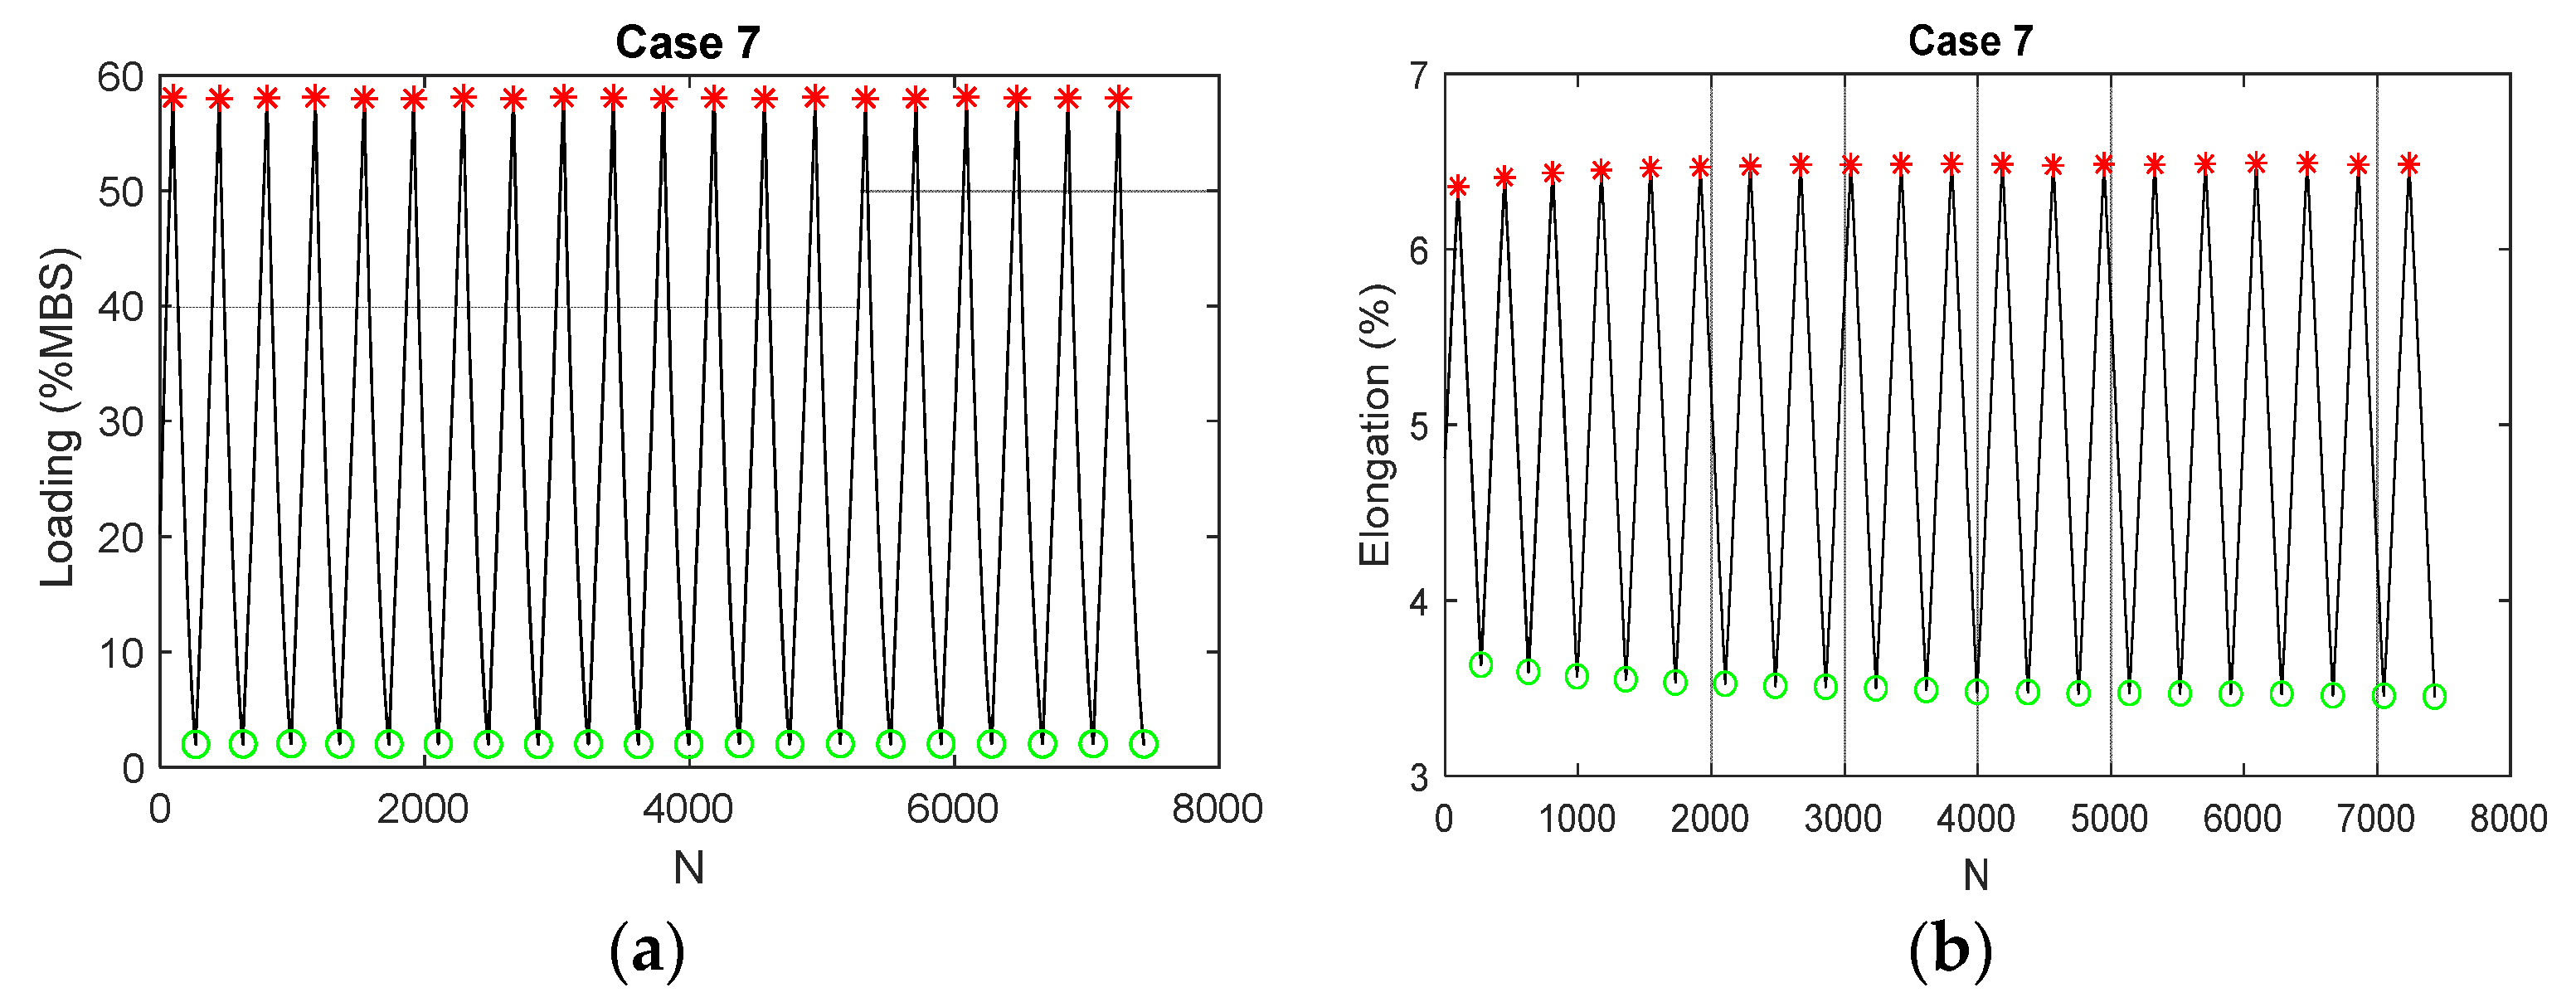
| 7 | 30% | 28% | 2% | 58% | 140 | 20 |
| 8 | 35% | 8% | 27% | 43% | 31 | 40 |
| 9 | 35% | 8% | 27% | 43% | 84 | 20 |
| 10 | 40% | 30% | 10% | 70% | 44 | 40 |
| 11 | 40% | 30% | 10% | 70% | 170 | 20 |
| 12 | 50% | 20% | 30% | 70% | 33 | 40 |
| 13 | 50% | 20% | 30% | 70% | 106 | 20 |
| 14 | 60% | 10% | 50% | 70% | 92 | 20 |
| Elongation (%) | Point A | Point B |
|---|---|---|
| S1 | 0 | 3.23% |
| S2 | 0 | 3.34% |
| S3 | 0 | 3.29% |
| S4 | 0 | 3.50% |
| S5 | 0 | 3.57% |
| S6 | 0 | 3.58% |
| Average | 0 | 3.42% |
| Point | Loading (% MBS) | S1 | S2 | S3 | Average |
|---|---|---|---|---|---|
| 2A | 35% | 4.81% | 4.91% | 4.86% | 4.86% |
| 2B | 12% | 3.23% | 3.34% | 3.29% | 3.29% |
| 2C | 1% | 2.47% | 2.59% | 2.53% | 2.53% |
| Point | Loading (% MBS) | S4 | S5 | S6 | Average |
|---|---|---|---|---|---|
| 2A | 40% | 5.49% | 5.52% | 5.55% | 5.52% |
| 2B | 12% | 3.50% | 3.57% | 3.58% | 3.55% |
| 2C | 1% | 2.72% | 2.80% | 2.81% | 2.78% |
| Time (s) | Loading (%MBS) | Elongation (%) | Note |
|---|---|---|---|
| 40,086.199 | 11.99877854 | 3.3400 | Initial elongation (Point B) |
| 40,117.578 | 30.00069039 | 4.1298 | The moment when 30% of MBS loading starts |
| 40,177.609 | 30.0000000 | 4.2560 | 1 min after 30% of MBS loading |
| 40,717.391 | 30.00026553 | 4.3822 | 10 min after 30% of MBS loading |
| 46,117.719 | 30.00053107 | 4.4960 | 100 min after 30% of MBS loading |
| Time | Log(t) | Lr_relative |
|---|---|---|
| 1 min | 0 | 0 |
| 10 min | 1 | 0.1210482 |
| 100 min | 2 | 0.2302026 |
| Empirical Equations | α | β | ϒ | ẟ | k |
|---|---|---|---|---|---|
| Equation (5), Fernandes et al. [39] | 12.058 | 0.152 | −0.201 | −0.473 | x |
| Equation (5), ABS [37] | 27.5 | 0.25 | −0.59 | −1.65 | x |
| Equation (6), Wibner et al. [22] | 18.5 | 0.33 | x | x | x |
| Equation (8), Casey et al. [41] | 11.477 | 0.153 | −5.429 | x | x |
| Equation (9), Liu et al. [26] | 7.16 | 0.41 | 6.3 | 1.78 | 0.01 |
Disclaimer/Publisher’s Note: The statements, opinions and data contained in all publications are solely those of the individual author(s) and contributor(s) and not of MDPI and/or the editor(s). MDPI and/or the editor(s) disclaim responsibility for any injury to people or property resulting from any ideas, methods, instructions or products referred to in the content. |
© 2024 by the authors. Licensee MDPI, Basel, Switzerland. This article is an open access article distributed under the terms and conditions of the Creative Commons Attribution (CC BY) license (https://creativecommons.org/licenses/by/4.0/).
Share and Cite
Feng, L.; Wang, Q.; Wang, S.; Xu, S. Experimental Characterization of Stiffness of a Polyester Mooring Rope for a CFPSO. J. Mar. Sci. Eng. 2024, 12, 1435. https://doi.org/10.3390/jmse12081435
Feng L, Wang Q, Wang S, Xu S. Experimental Characterization of Stiffness of a Polyester Mooring Rope for a CFPSO. Journal of Marine Science and Engineering. 2024; 12(8):1435. https://doi.org/10.3390/jmse12081435
Chicago/Turabian StyleFeng, Limei, Qian Wang, Shan Wang, and Sheng Xu. 2024. "Experimental Characterization of Stiffness of a Polyester Mooring Rope for a CFPSO" Journal of Marine Science and Engineering 12, no. 8: 1435. https://doi.org/10.3390/jmse12081435
APA StyleFeng, L., Wang, Q., Wang, S., & Xu, S. (2024). Experimental Characterization of Stiffness of a Polyester Mooring Rope for a CFPSO. Journal of Marine Science and Engineering, 12(8), 1435. https://doi.org/10.3390/jmse12081435