

An Updated Design Formula for Predicting the Compressive Strength of Plate: Elastic Buckling and Ultimate Compressive Strength


Abstract
1. Introduction
- Elastic buckling strength of the column (1D)
- Elastic buckling strength of the plate (2D)
- Johnson–Ostenfeld (J-O) formula
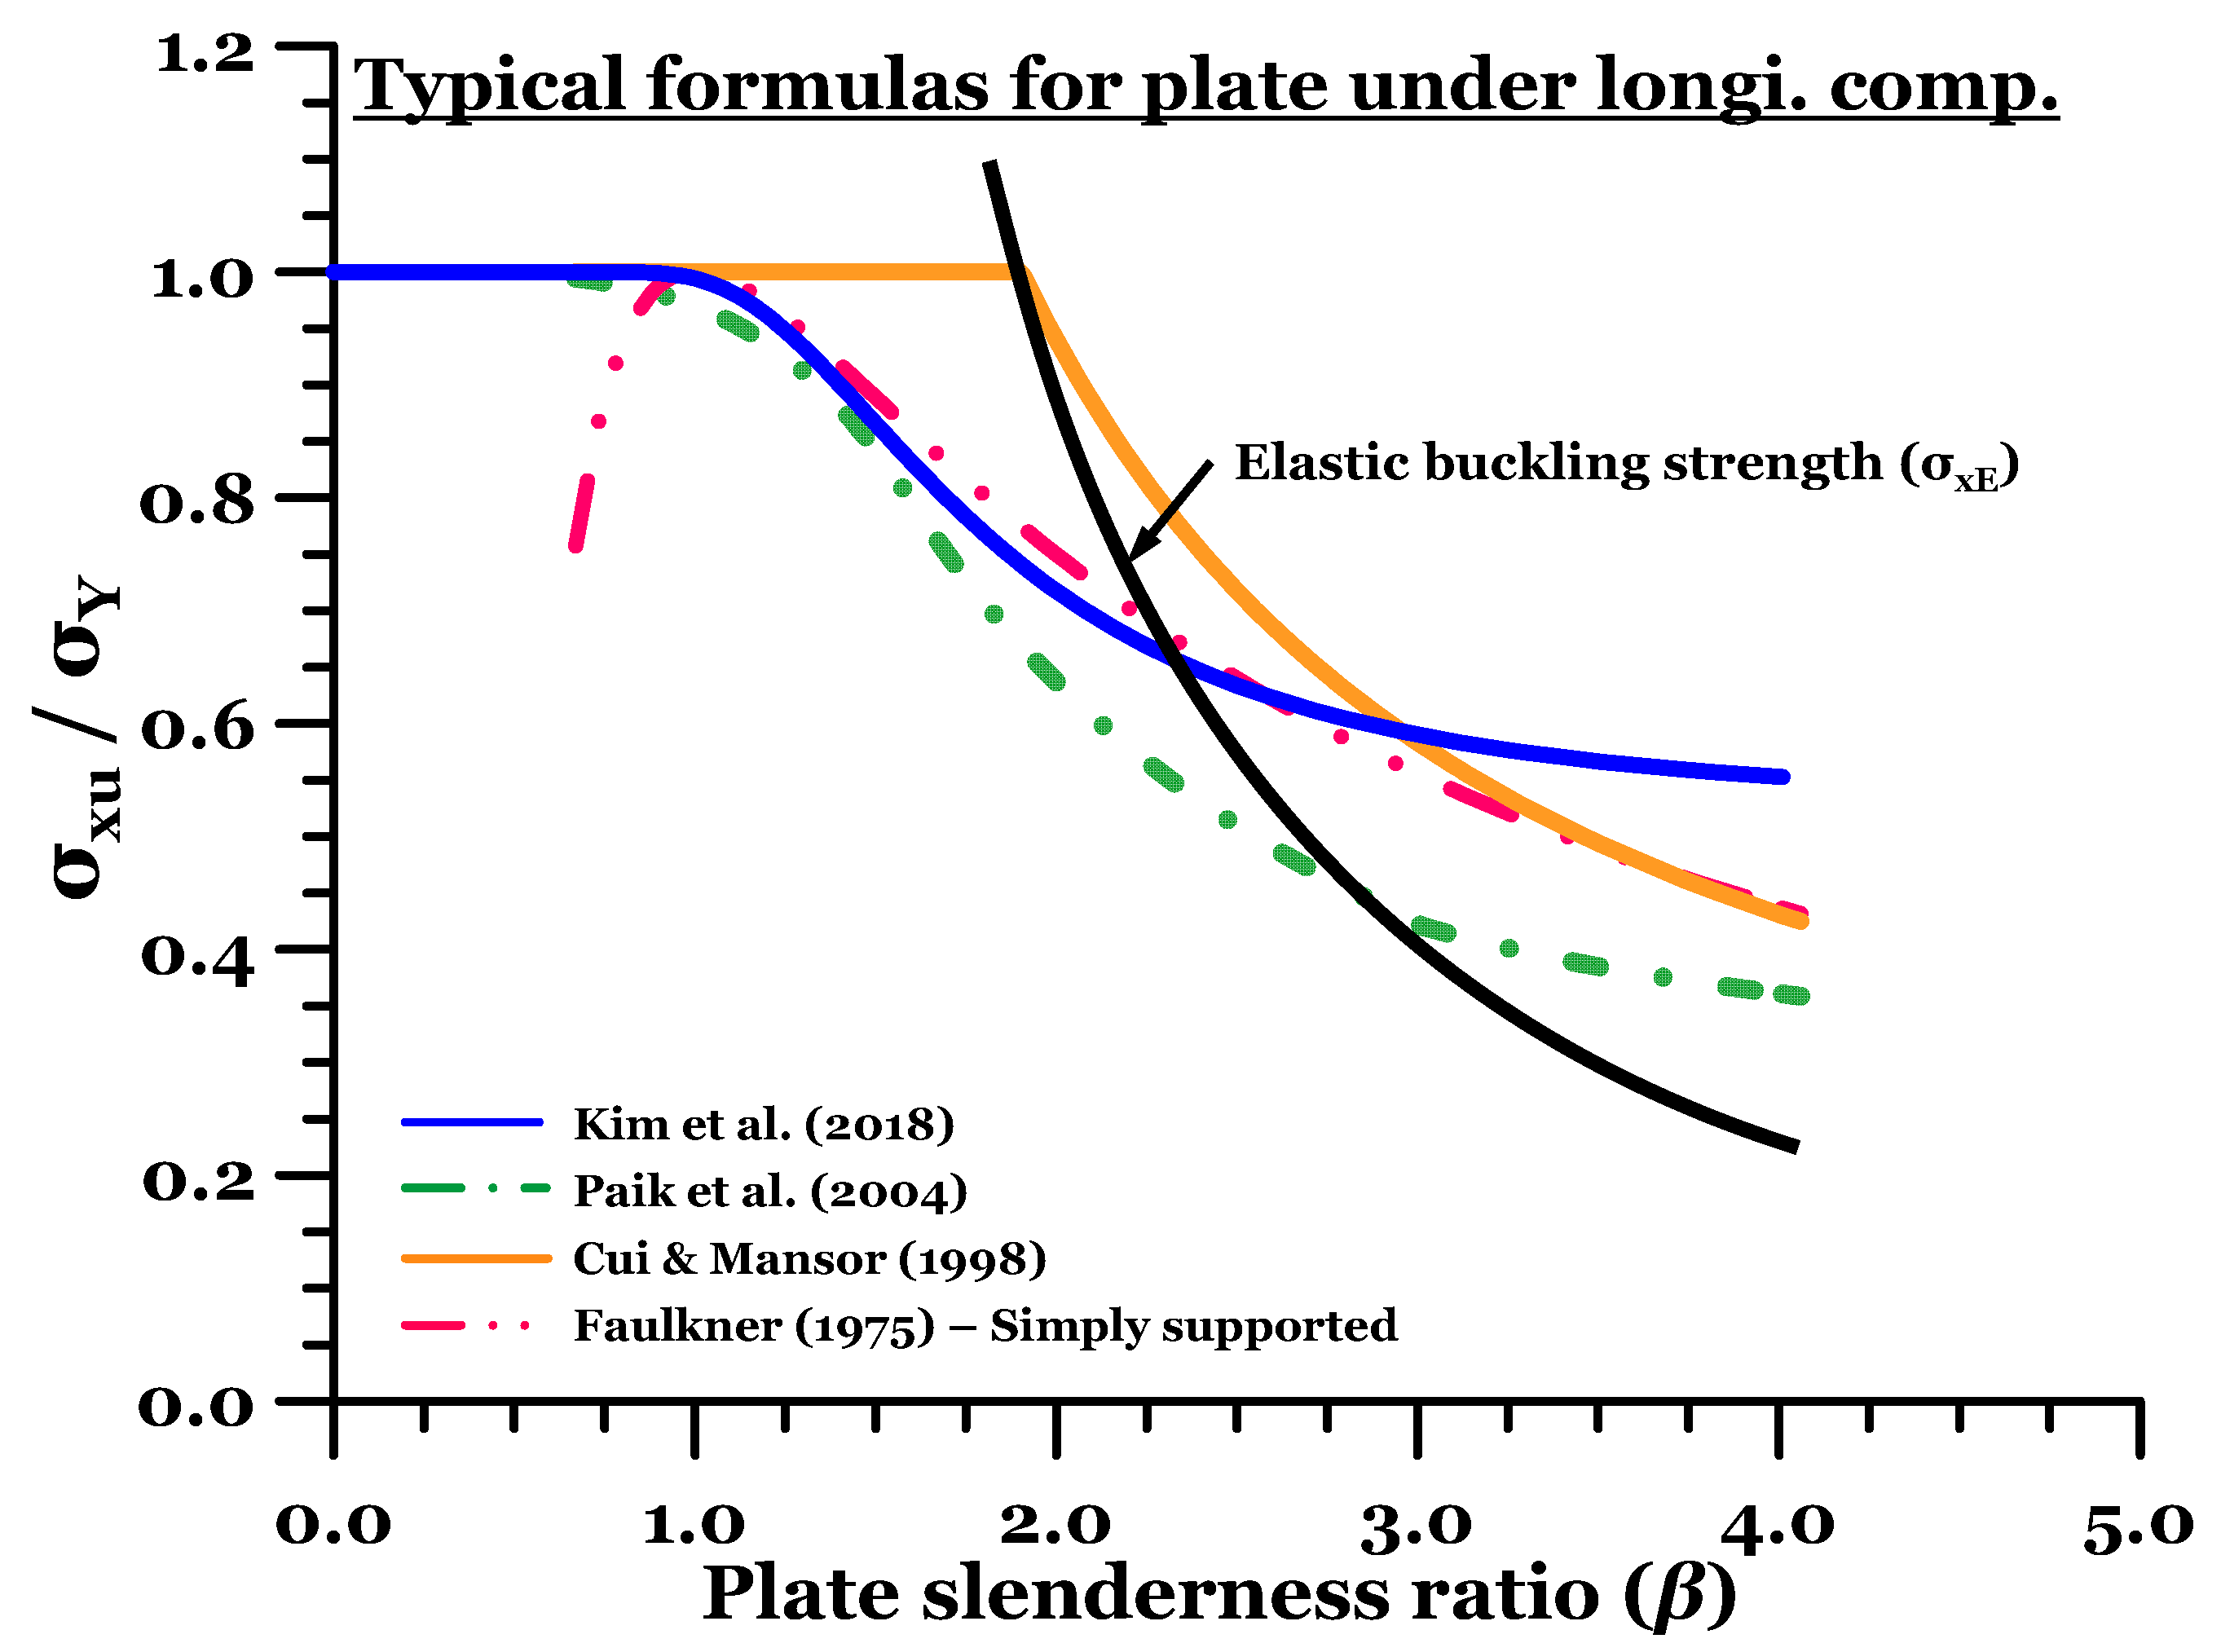
- <Case I>: ULS of un-stiffened panel (= plate) in longitudinal compression: Typical example of the existing formulae.
- Faulkner [31]
- Cui and Mansour [32]
- Paik et al. [33]
- Kim et al. [8]
- < Case II > ULS of the stiffened panel in longitudinal compression: Typical example of the existing formulae.
- Paik and Thayamballi [34]
- Zhang and Khan [10]
- Kim et al. [30]
- Kim et al. [28]
2. Methodology
2.1. General
- To propose an empirical expression to predict the ultimate compressive strength of a plate and derive a correction factor () that can take into account initial deflection and different plate sizes.
- To verify the applicability of the developed empirical formula.
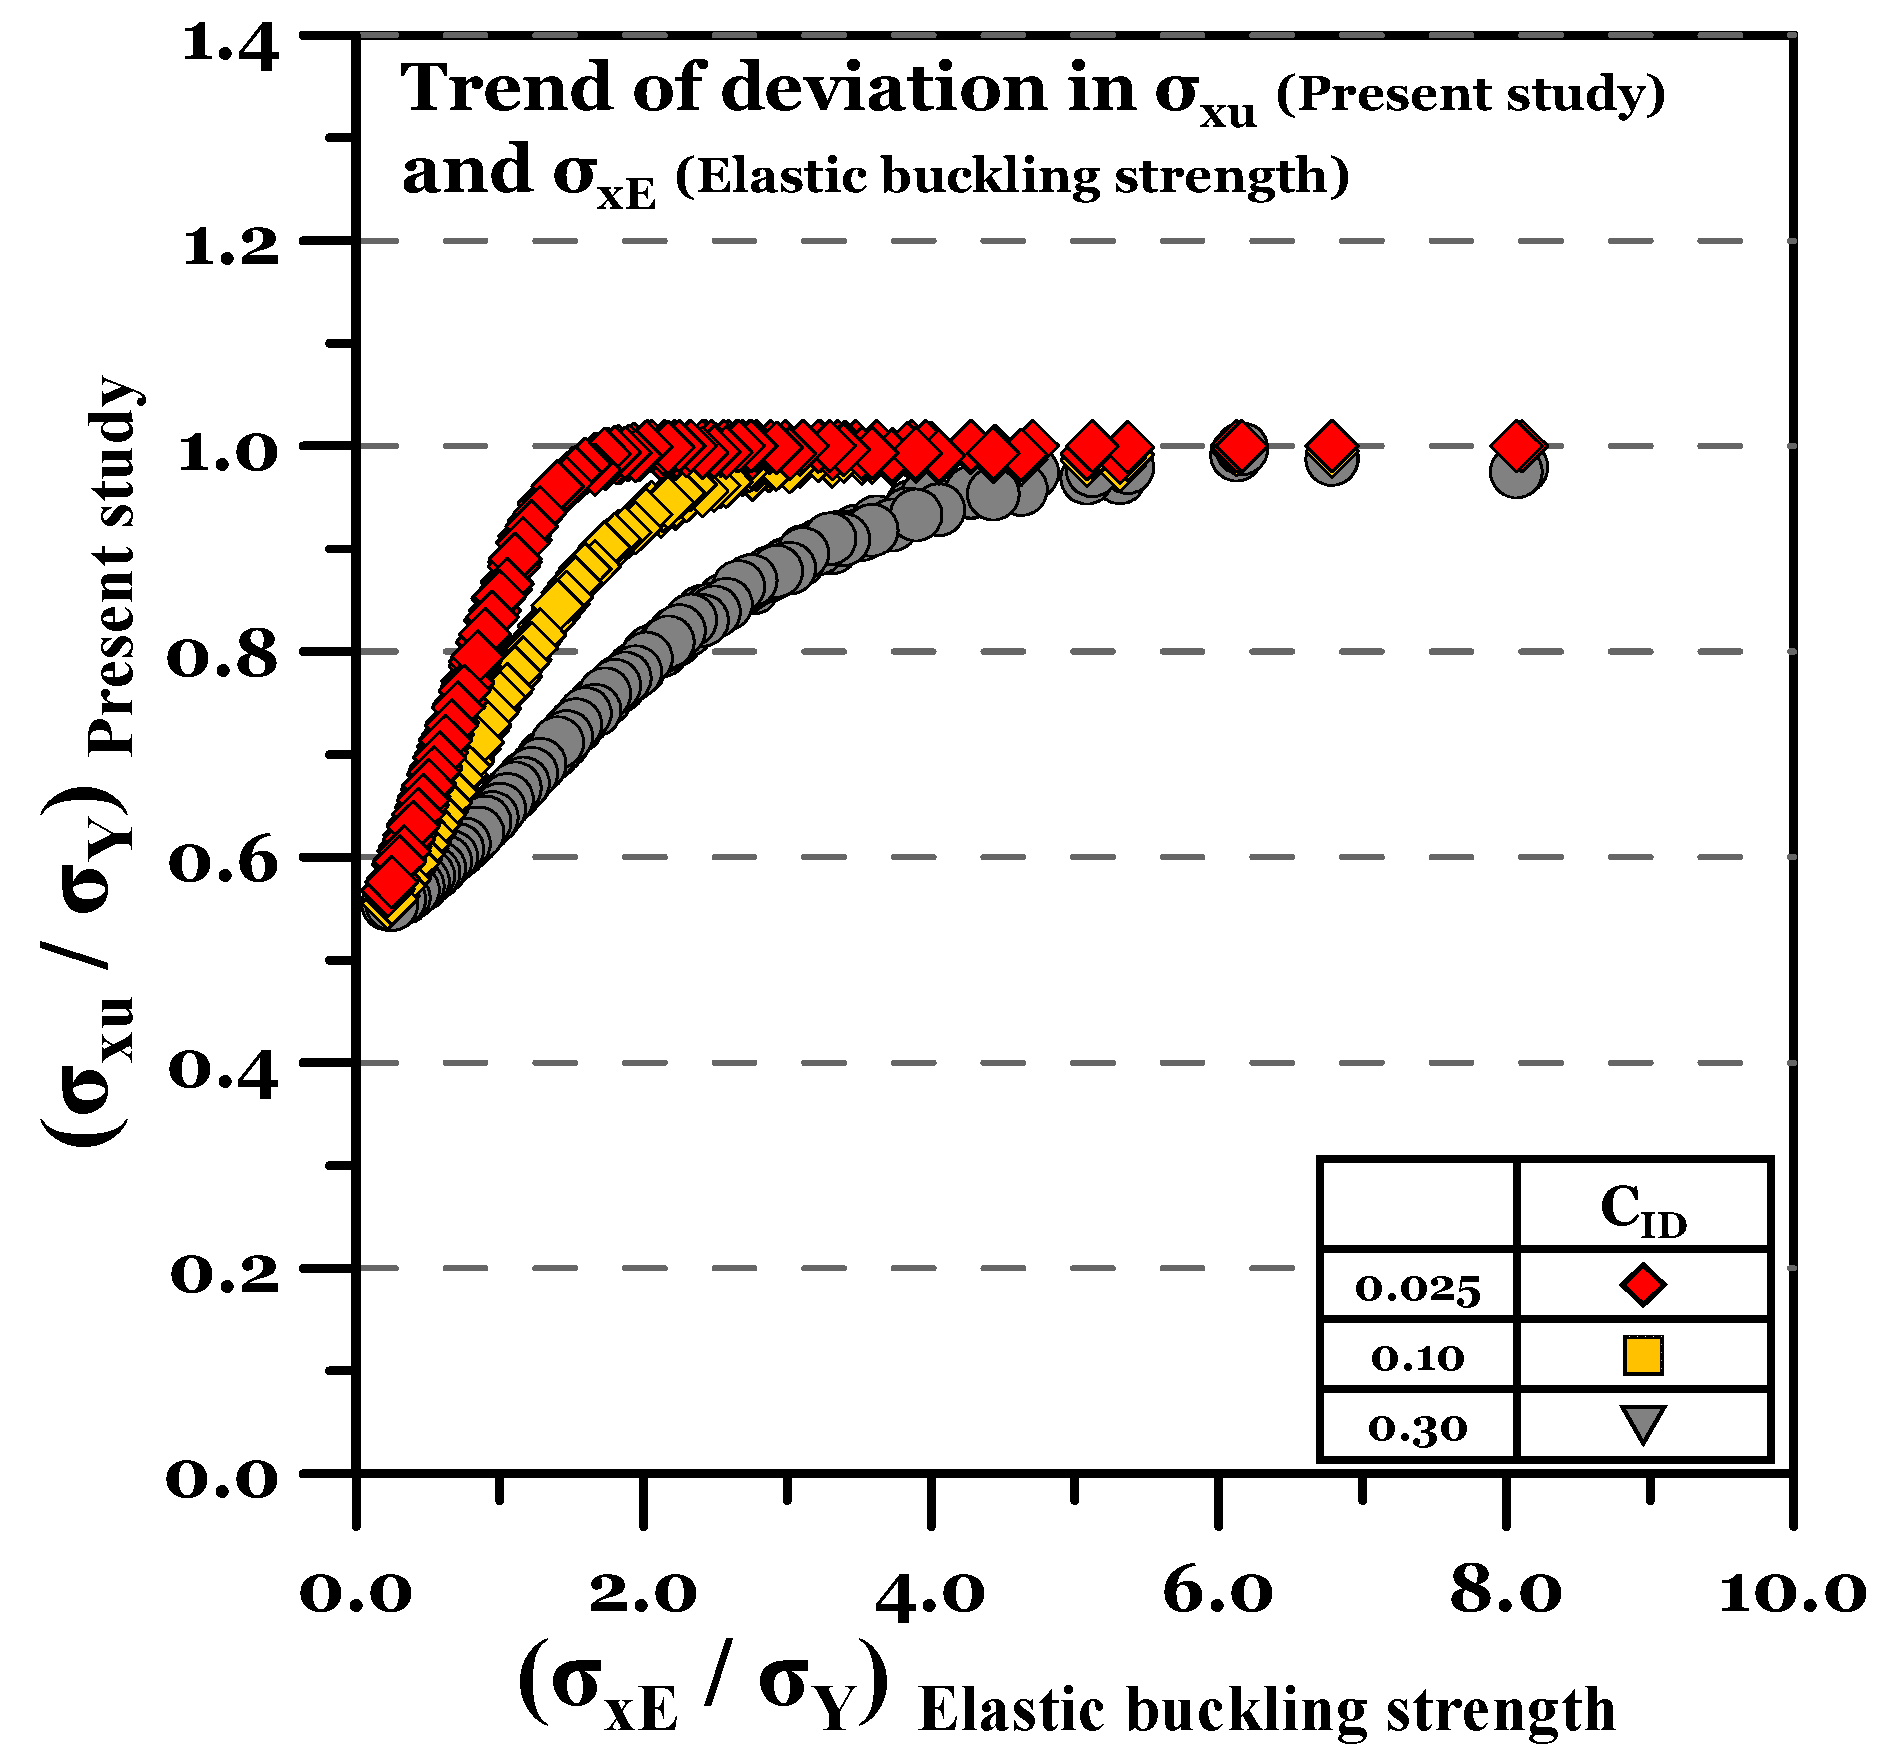
- To investigate the correlation between elastic buckling strength and the ultimate strength of a plate.
2.2. Development of the Correction Factor (Cf)
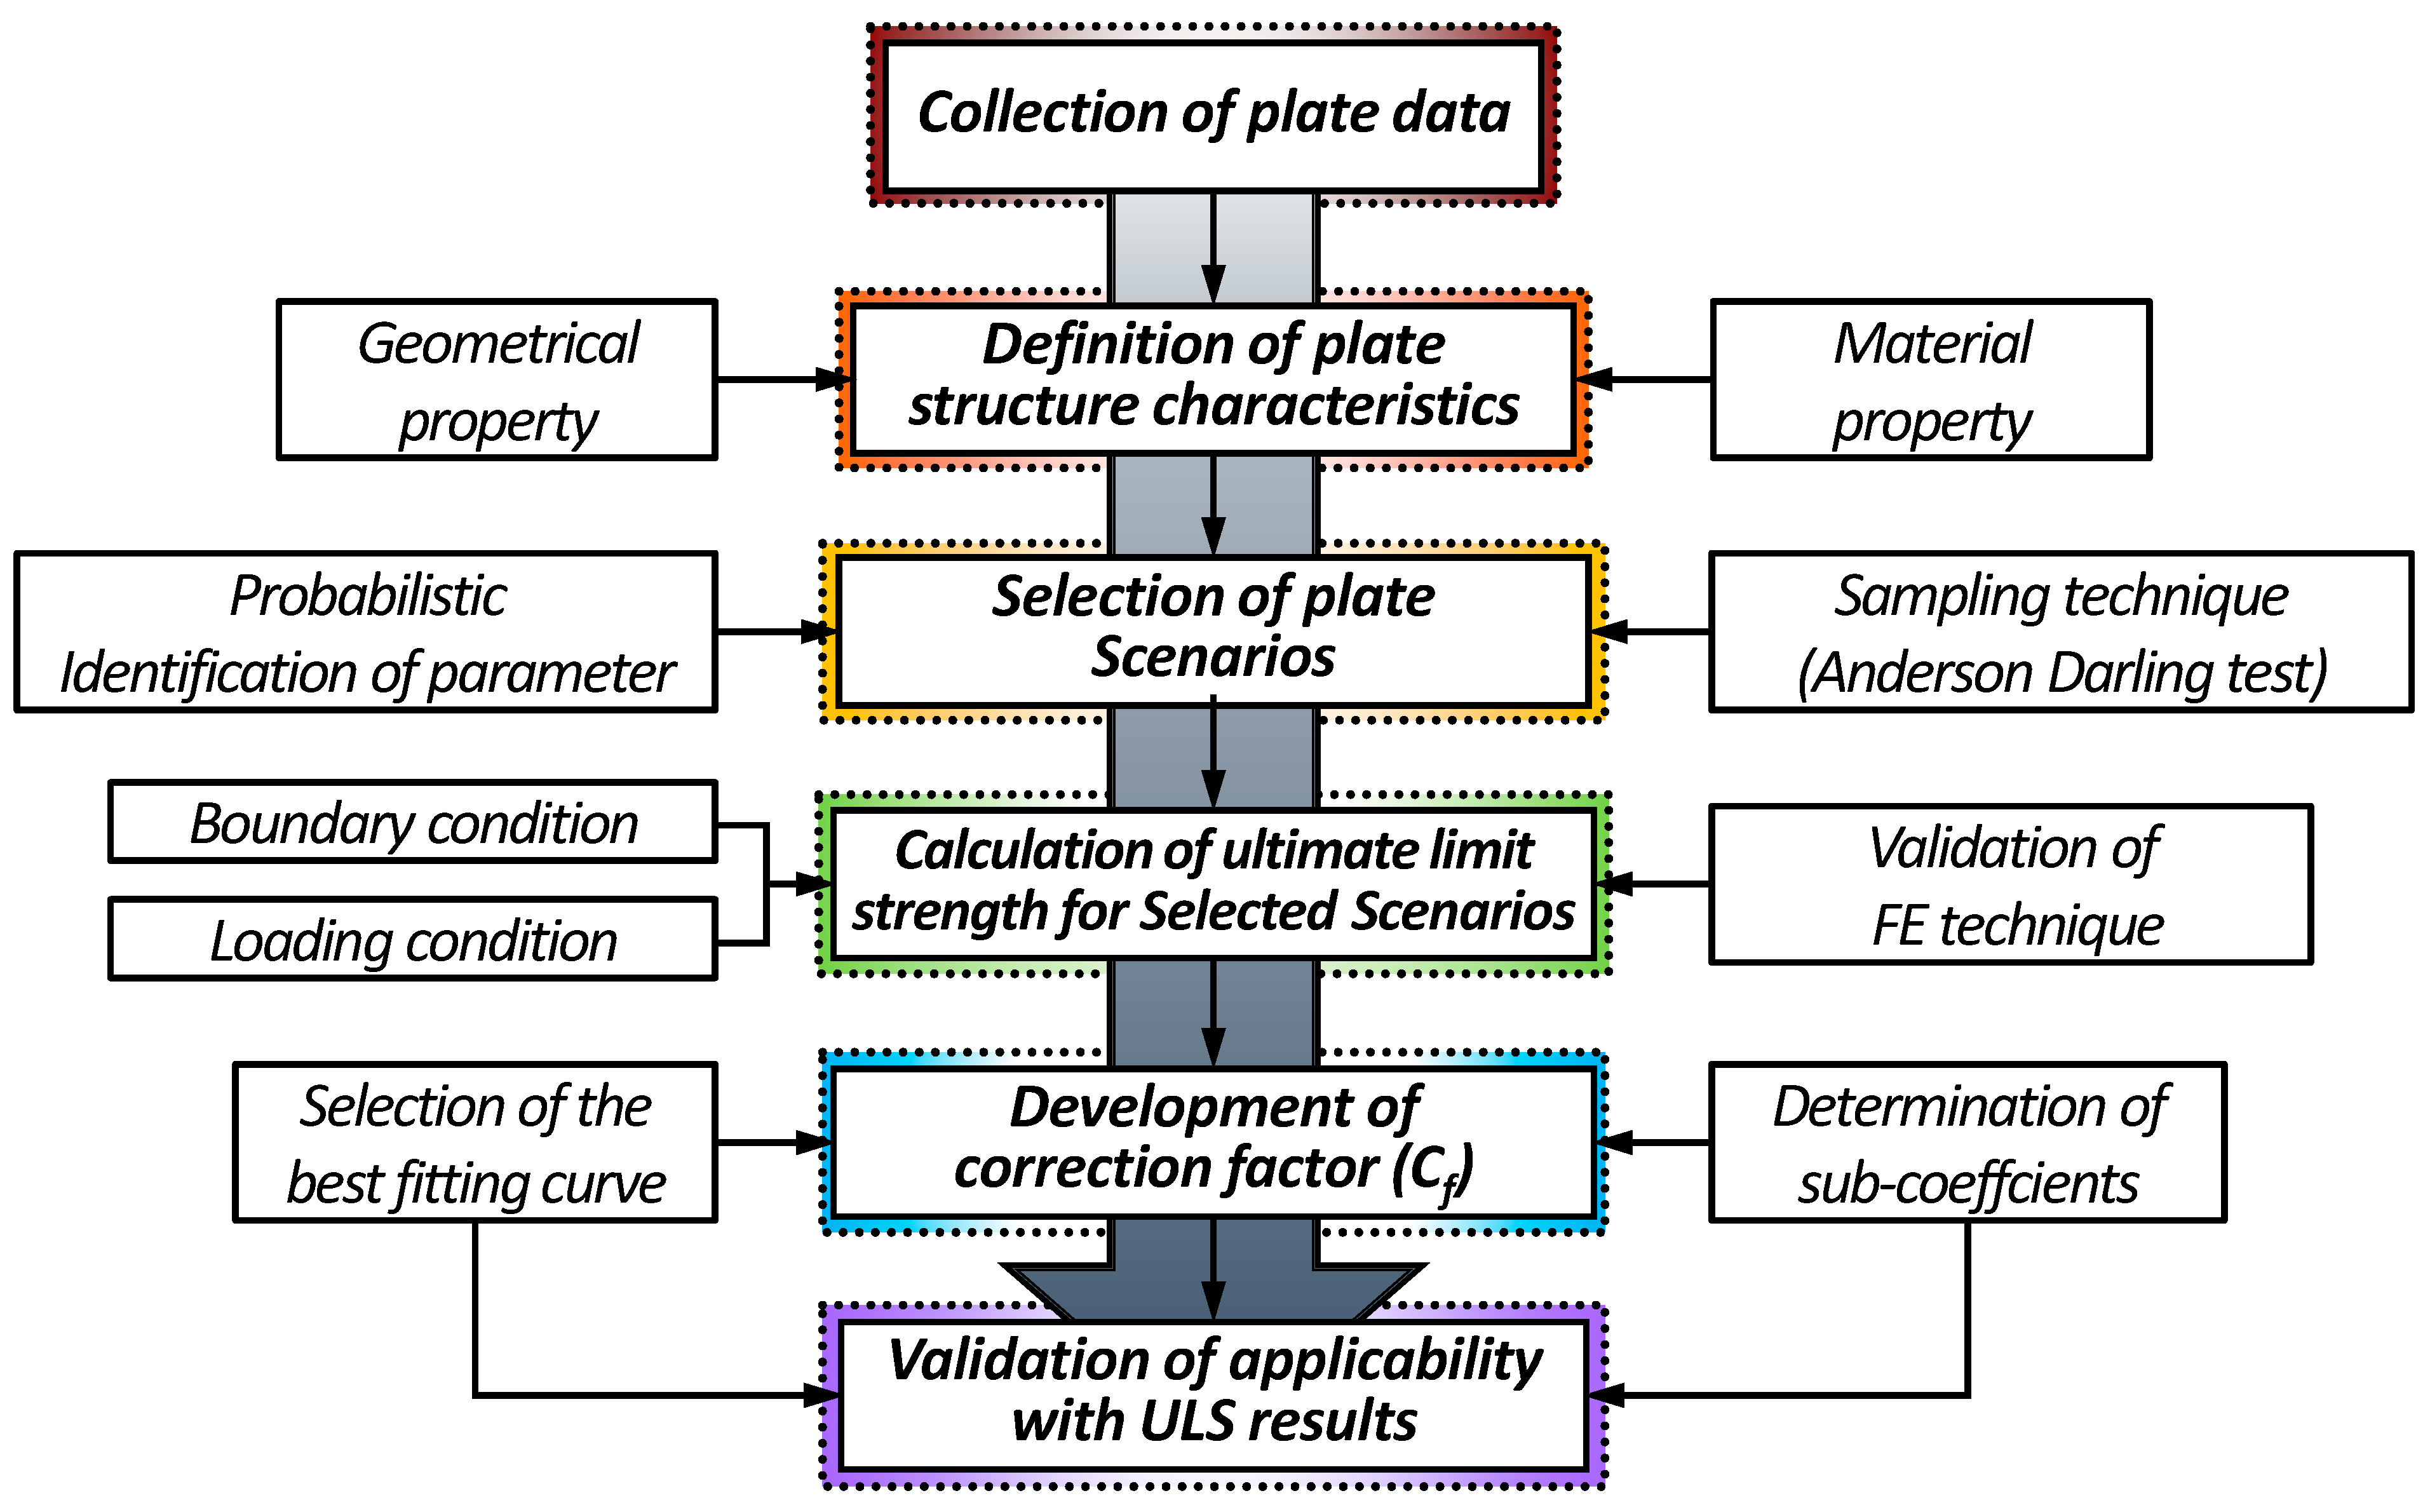
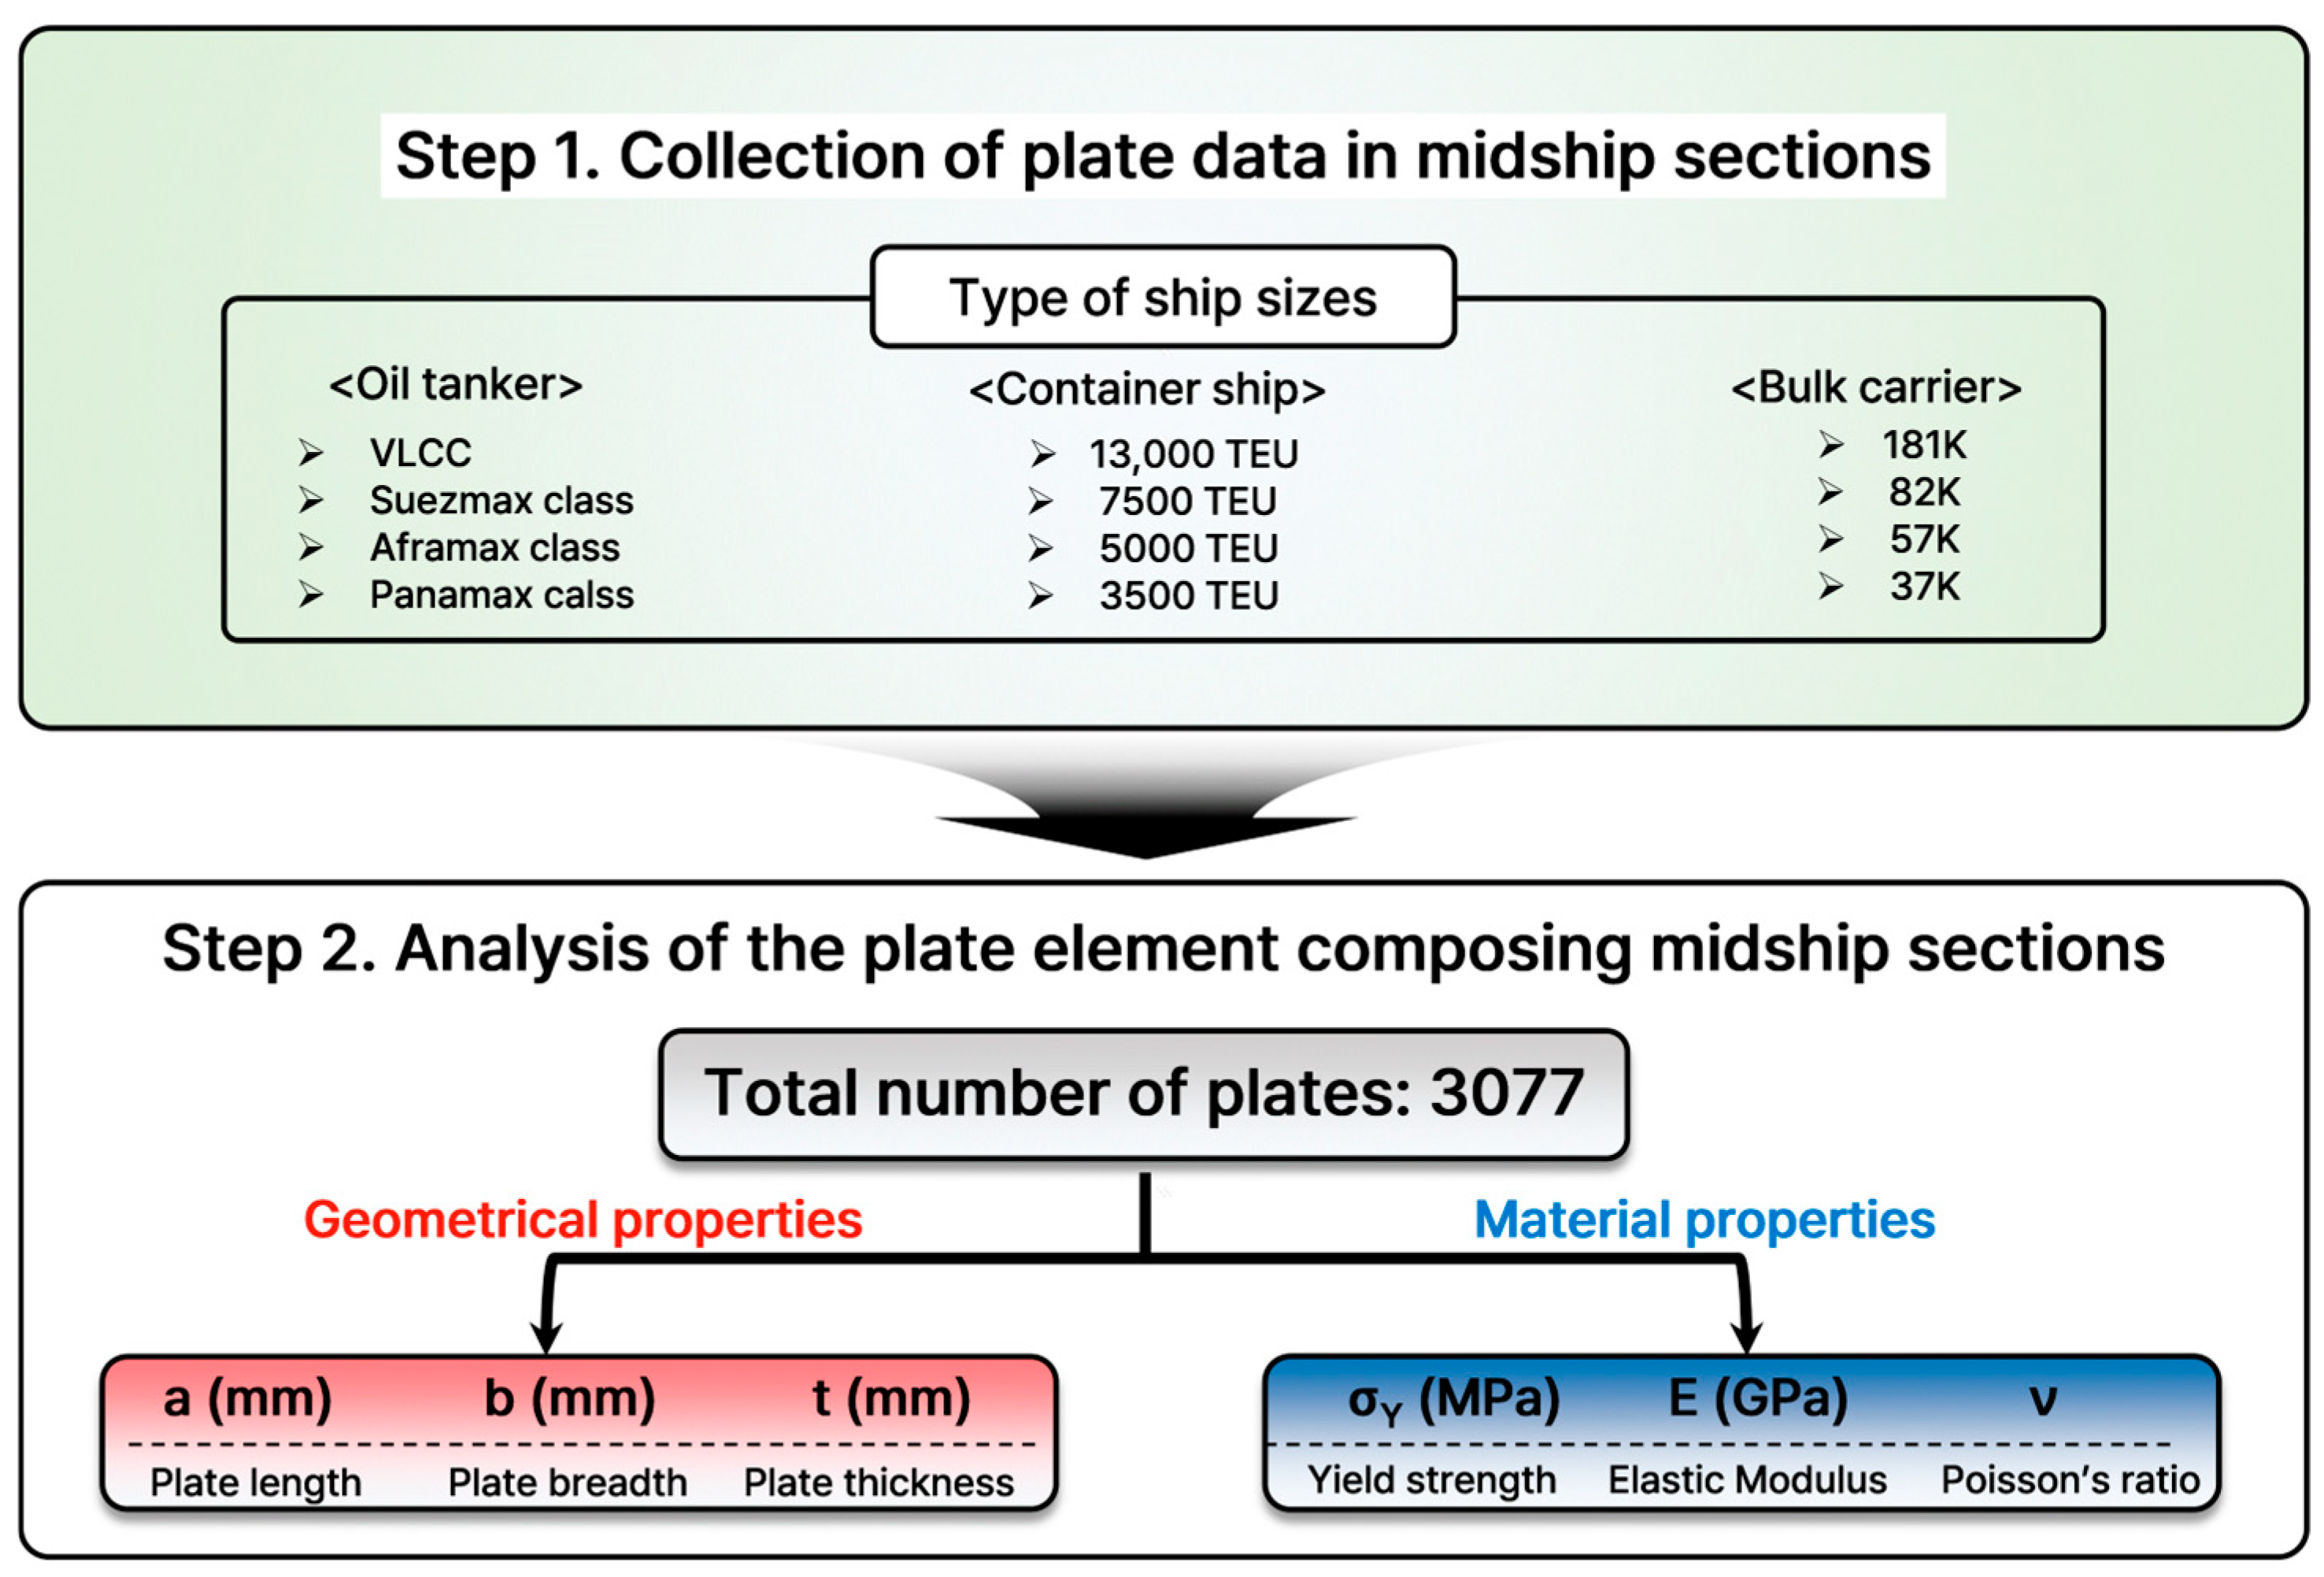
2.2.1. Collection of Plate Data and Definition of Plate Structure Characteristics
2.2.2. Selection of the Scenarios
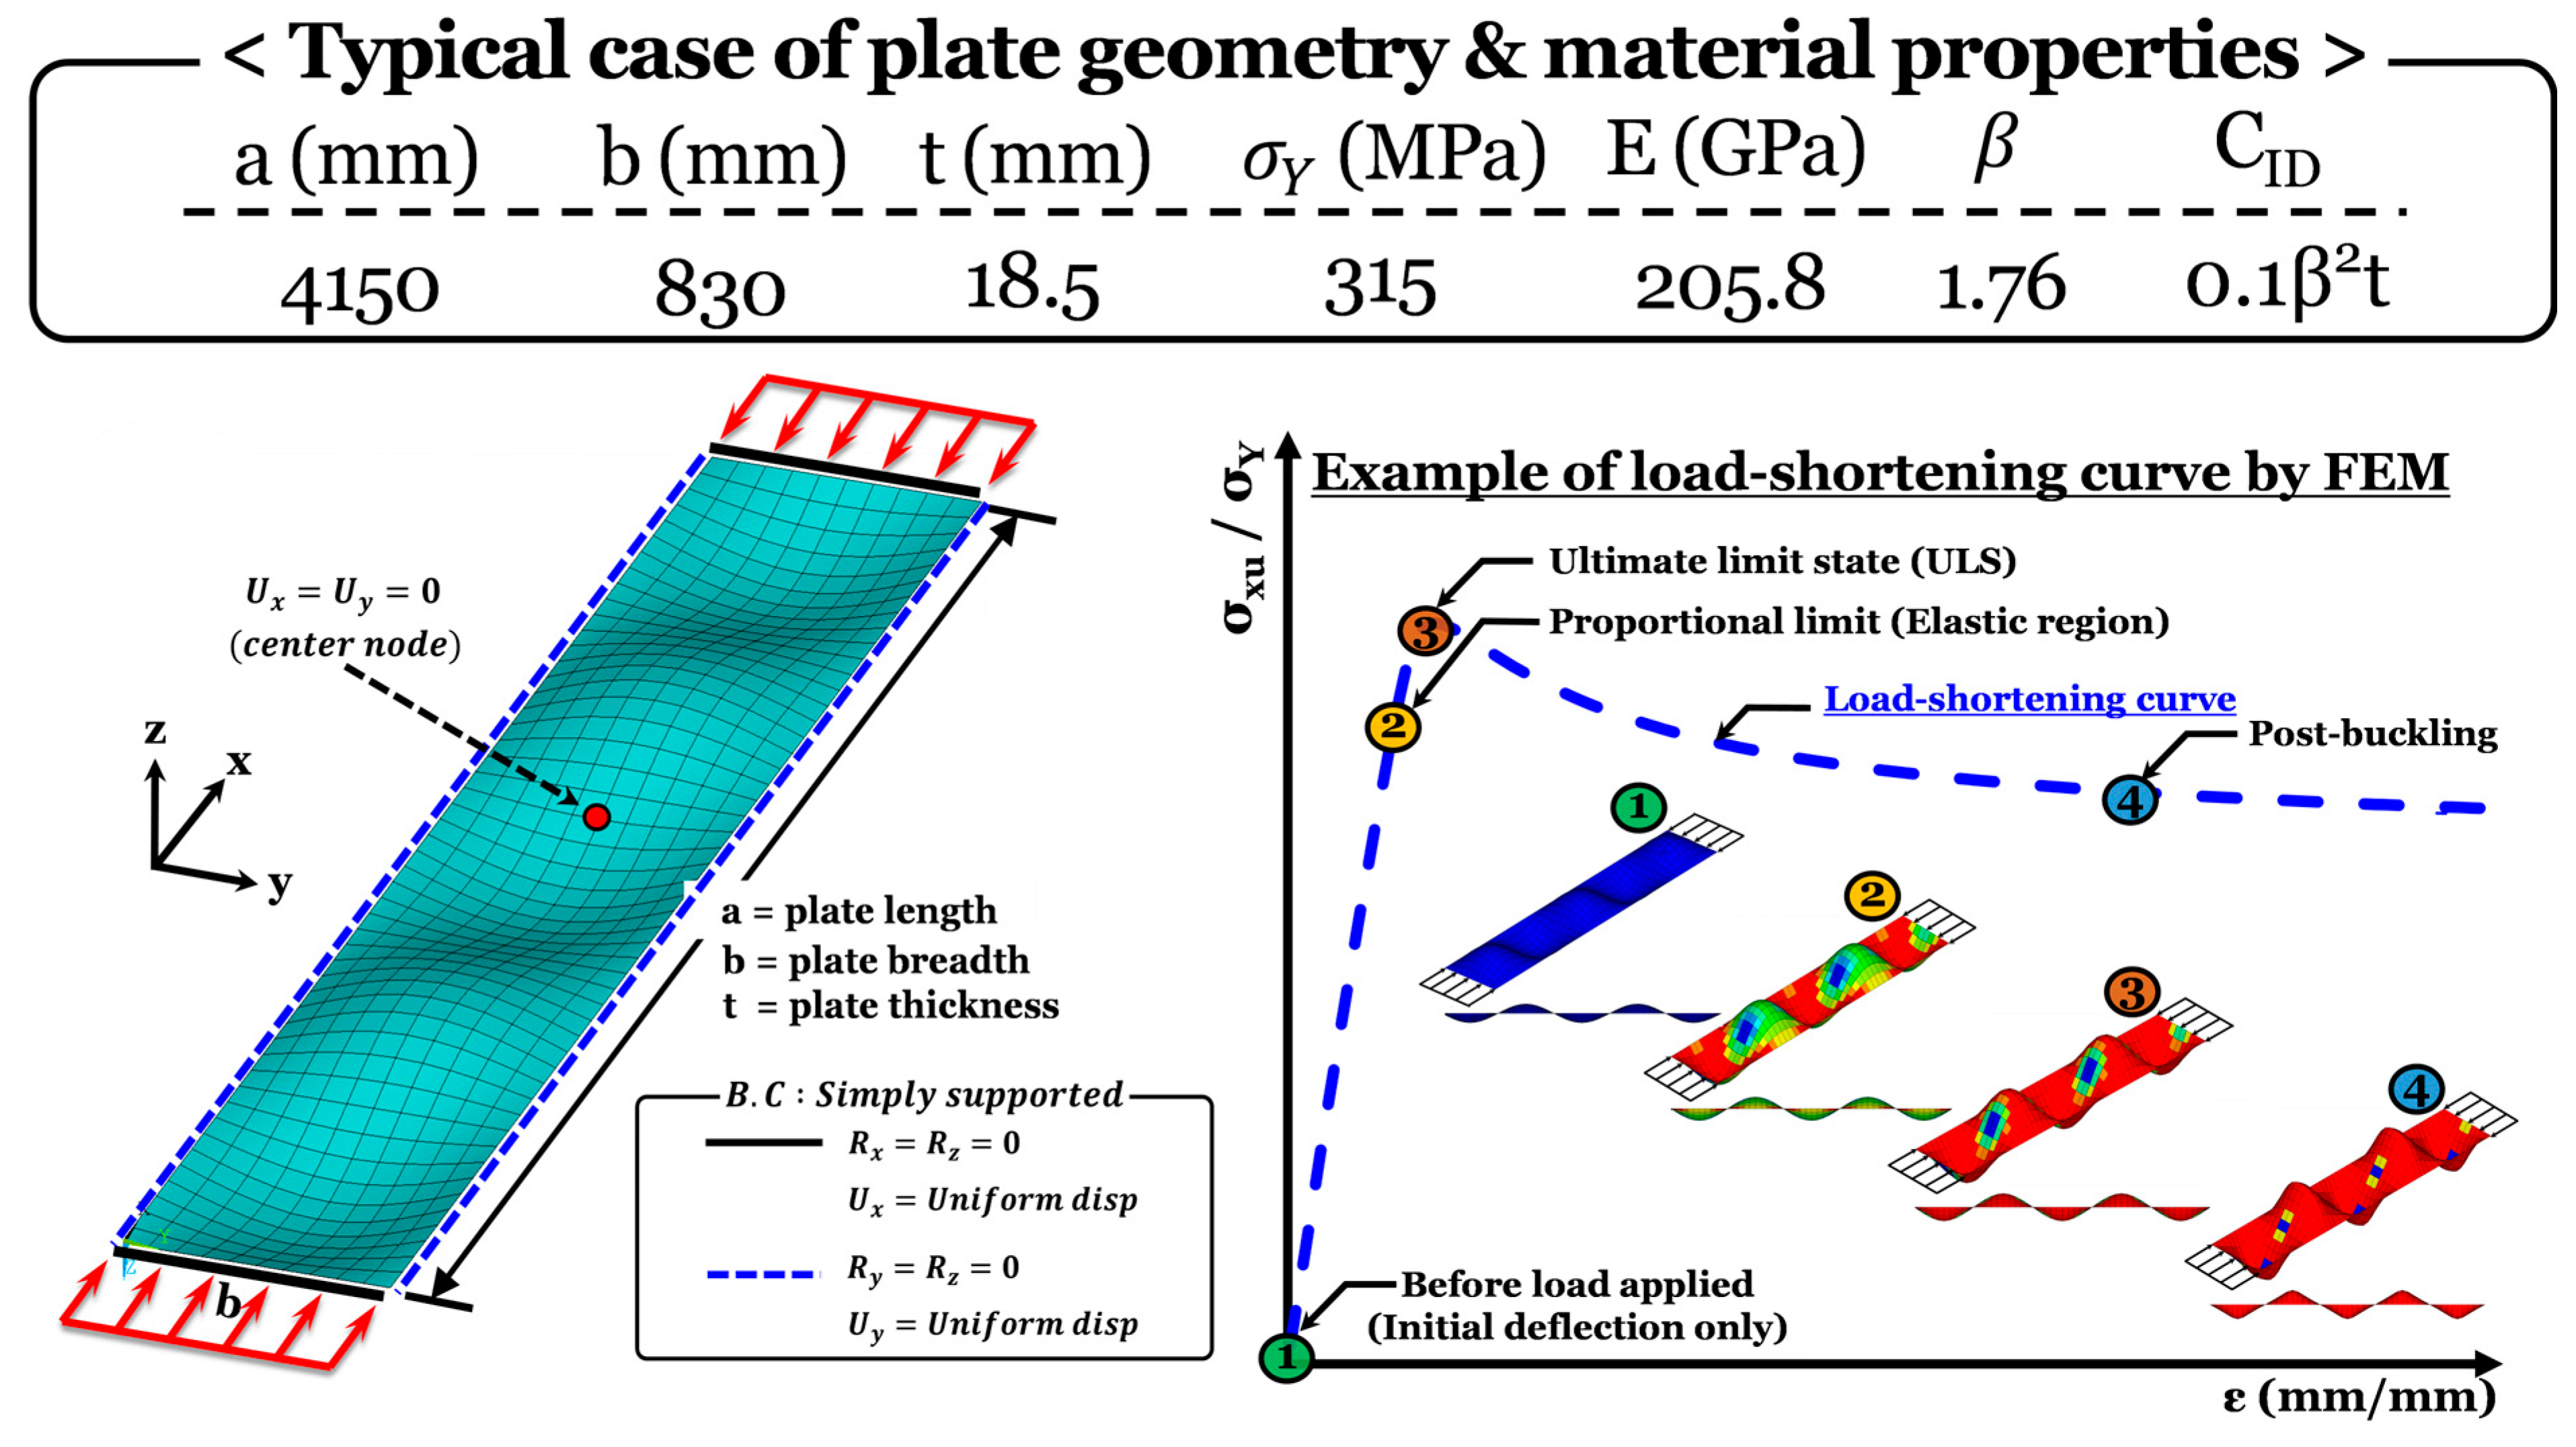
2.2.3. Calculation of Ultimate Limit Strength for Selected Scenarios
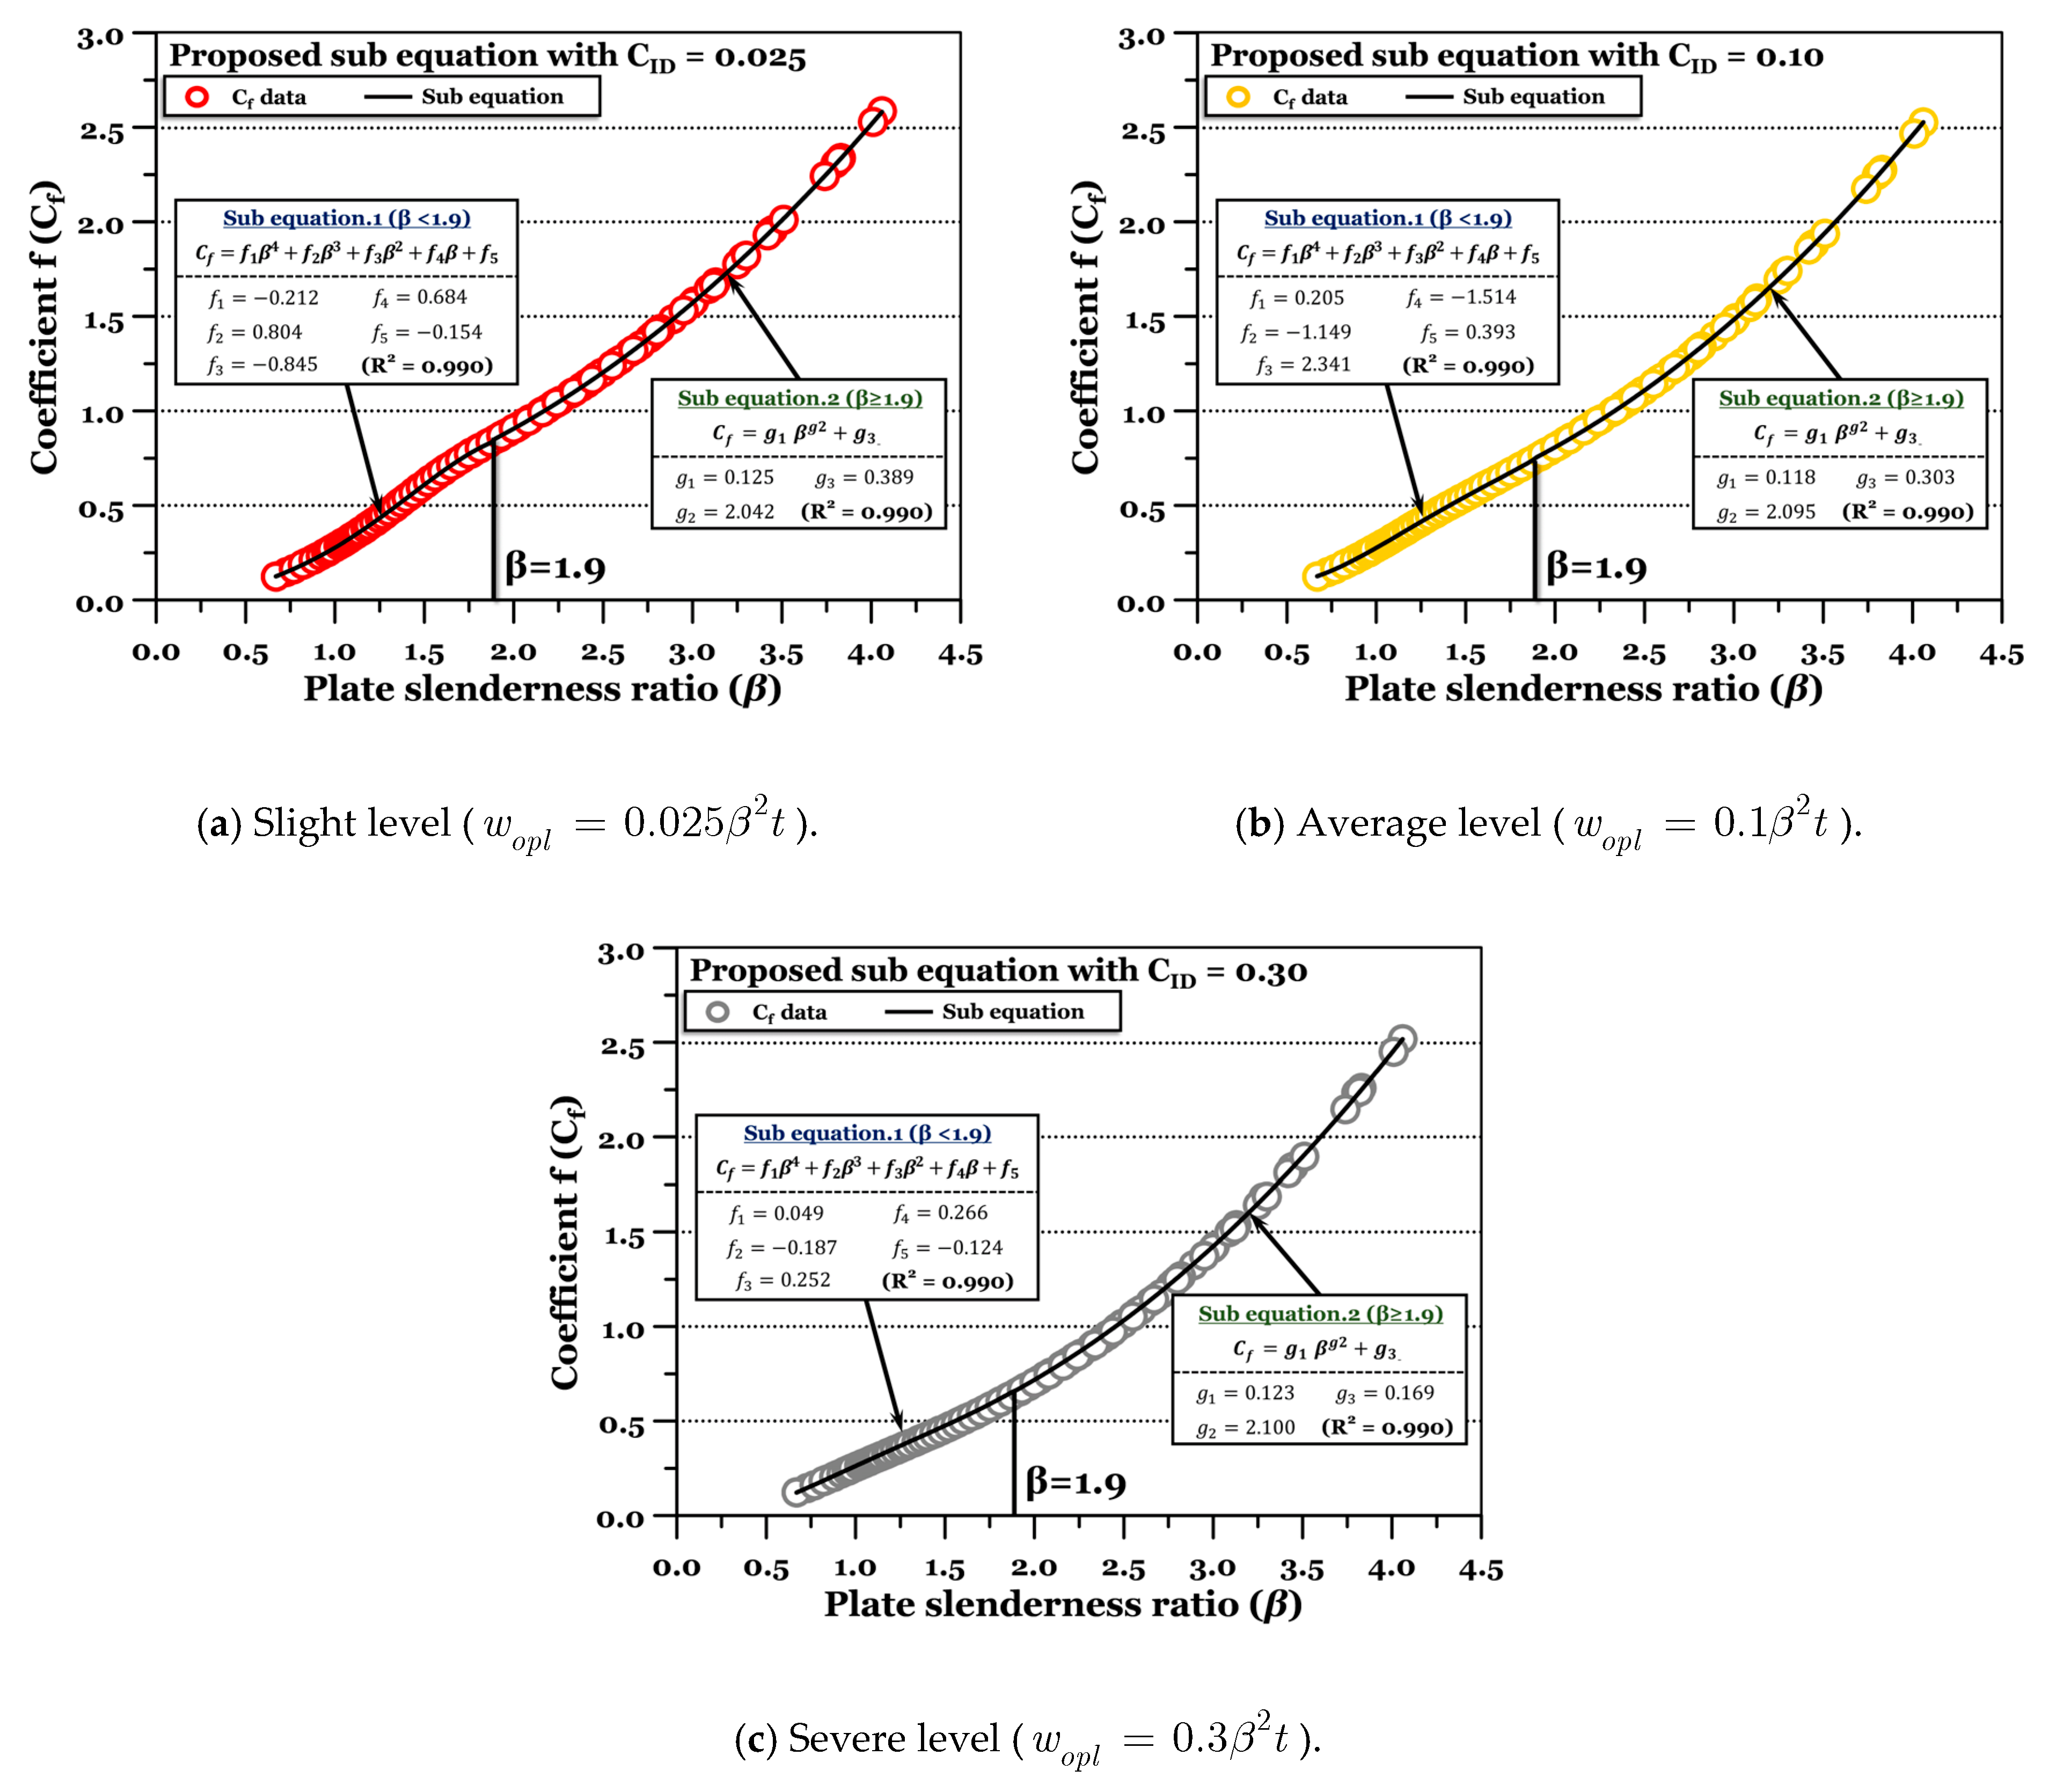
2.2.4. Development of Correction Factor (or Sub-Equation) ()
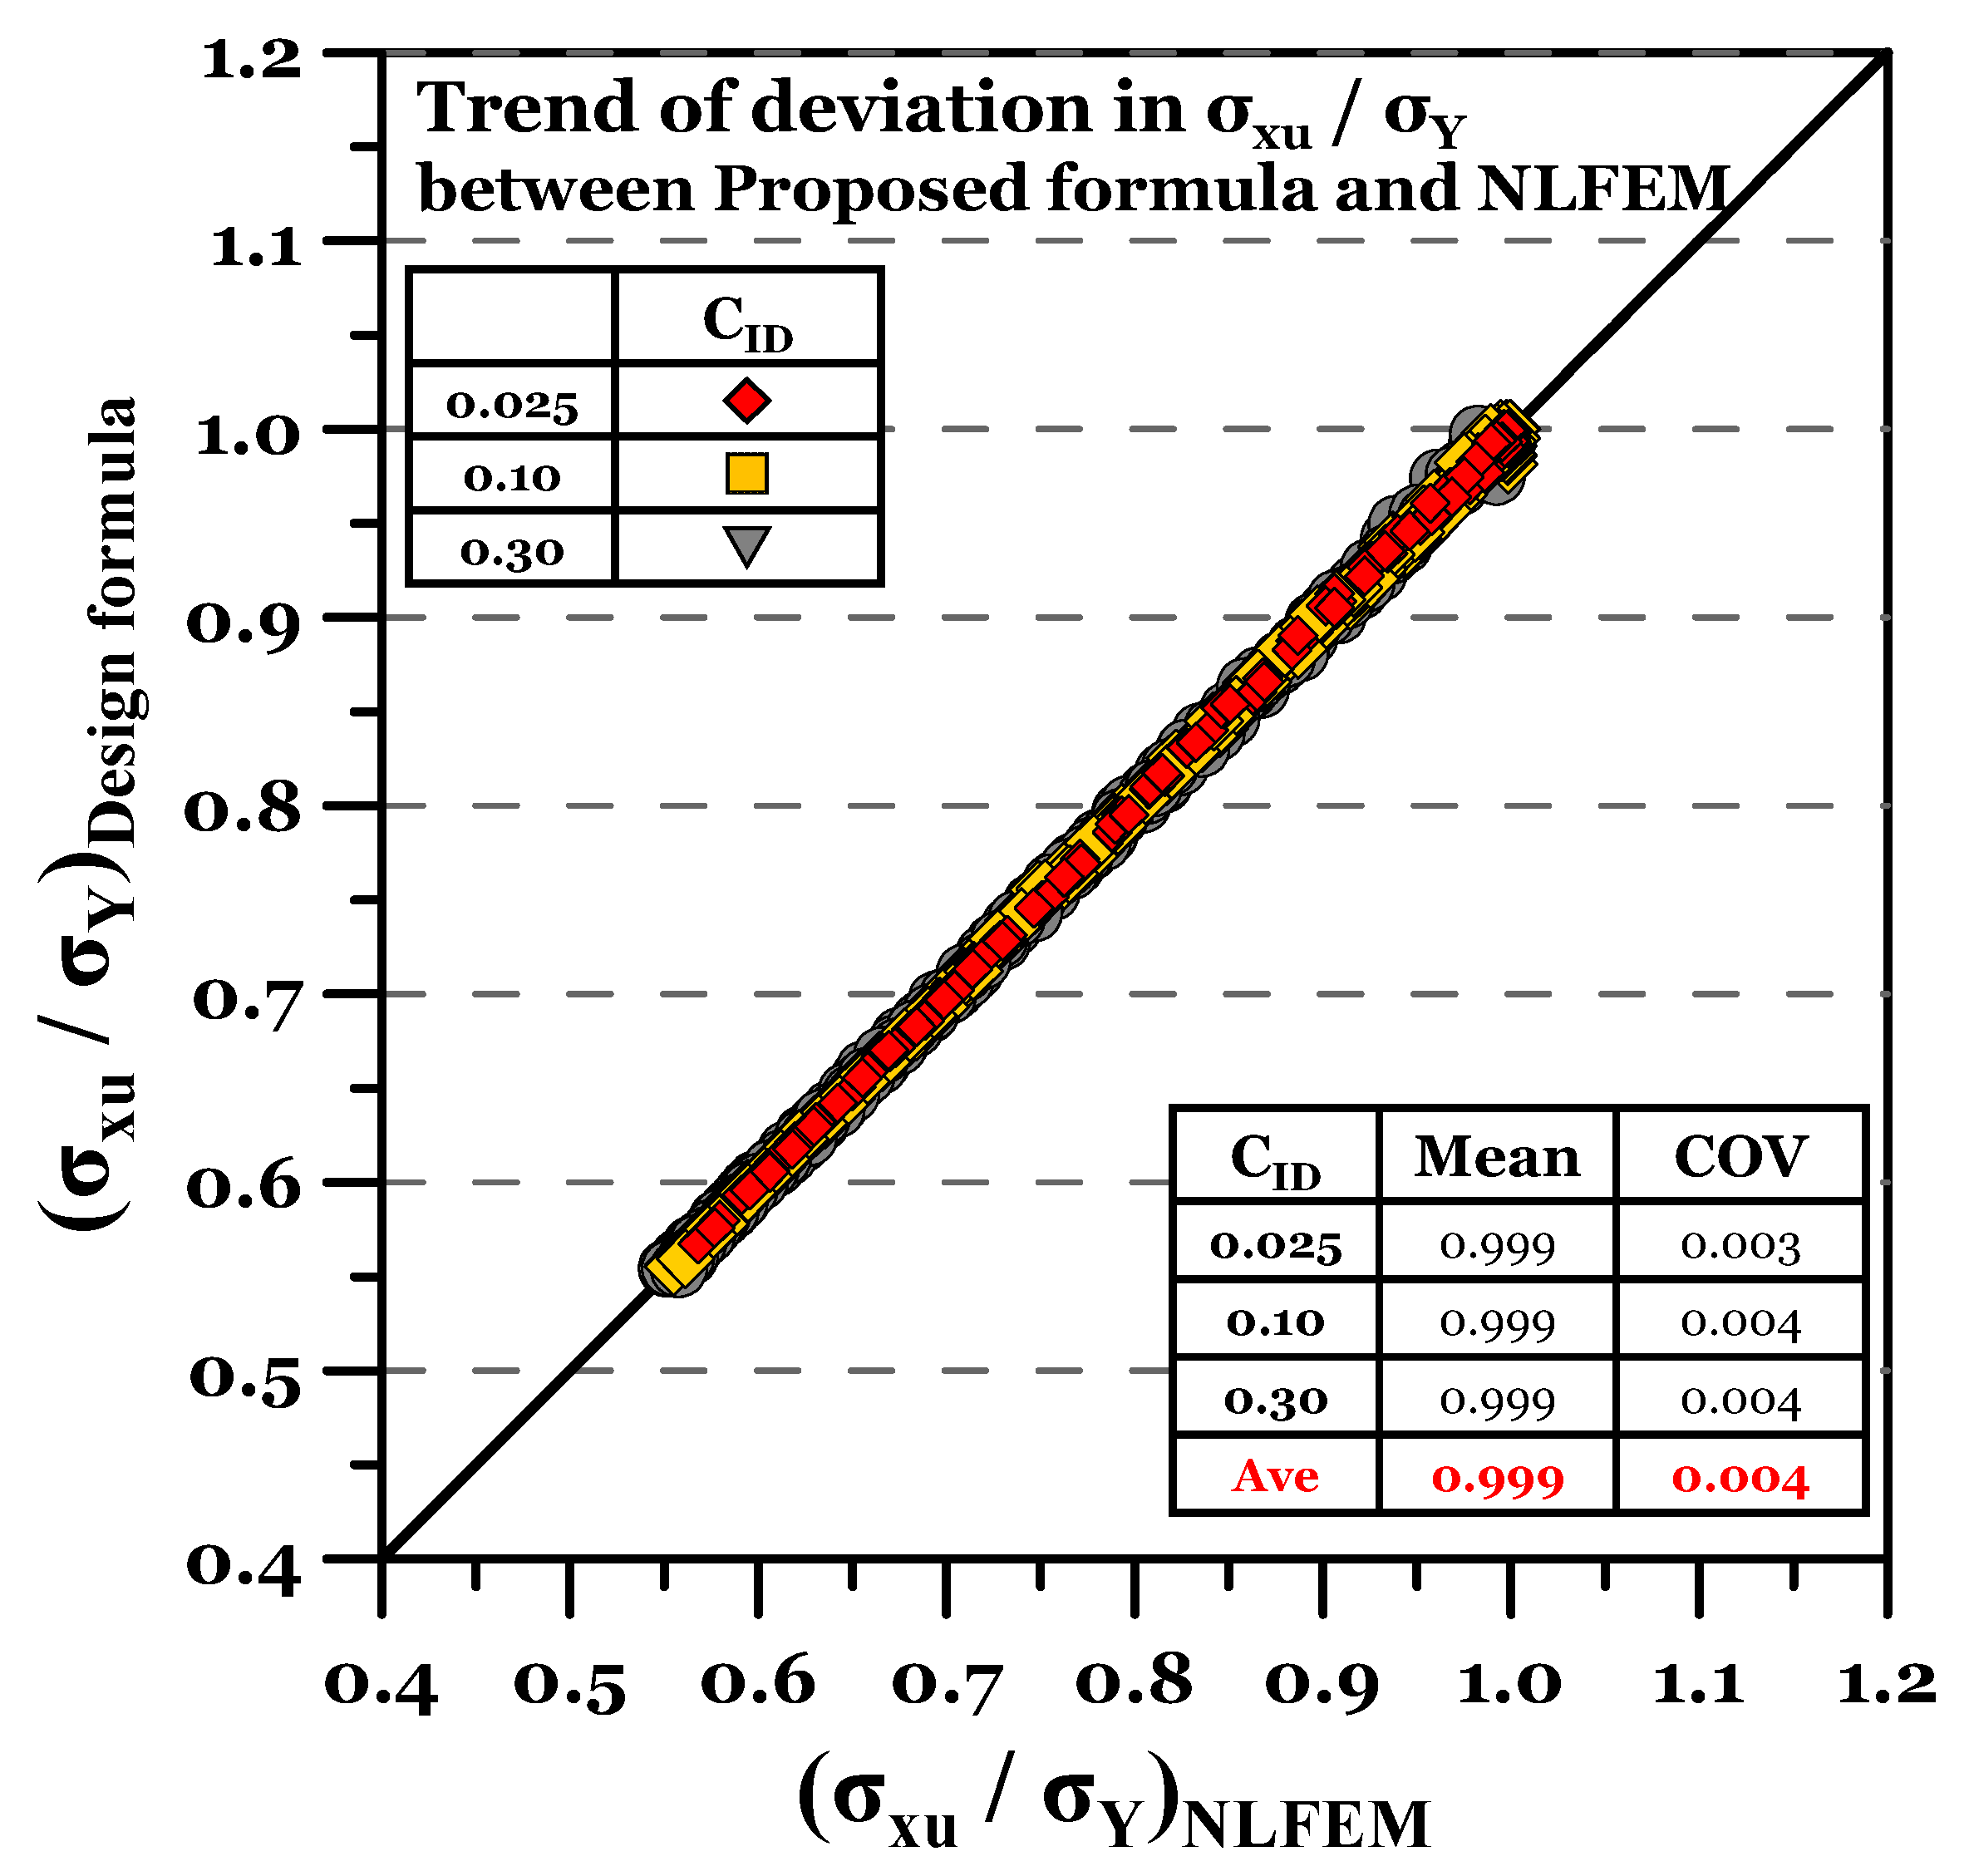
2.2.5. Validation of the Correction Factor () Developed
- Proposed design formula
3. Discussions on the Proposed Design Formula (PROS and CONS)
4. Conclusions and Limitations
- A design equation for predicting the ultimate compressive strength of plates was developed, which took the form of updating the elastic buckling strength equation. In particular, through the development of the , an equation was developed that can take into account various conditions such as initial deflection and yield strength.
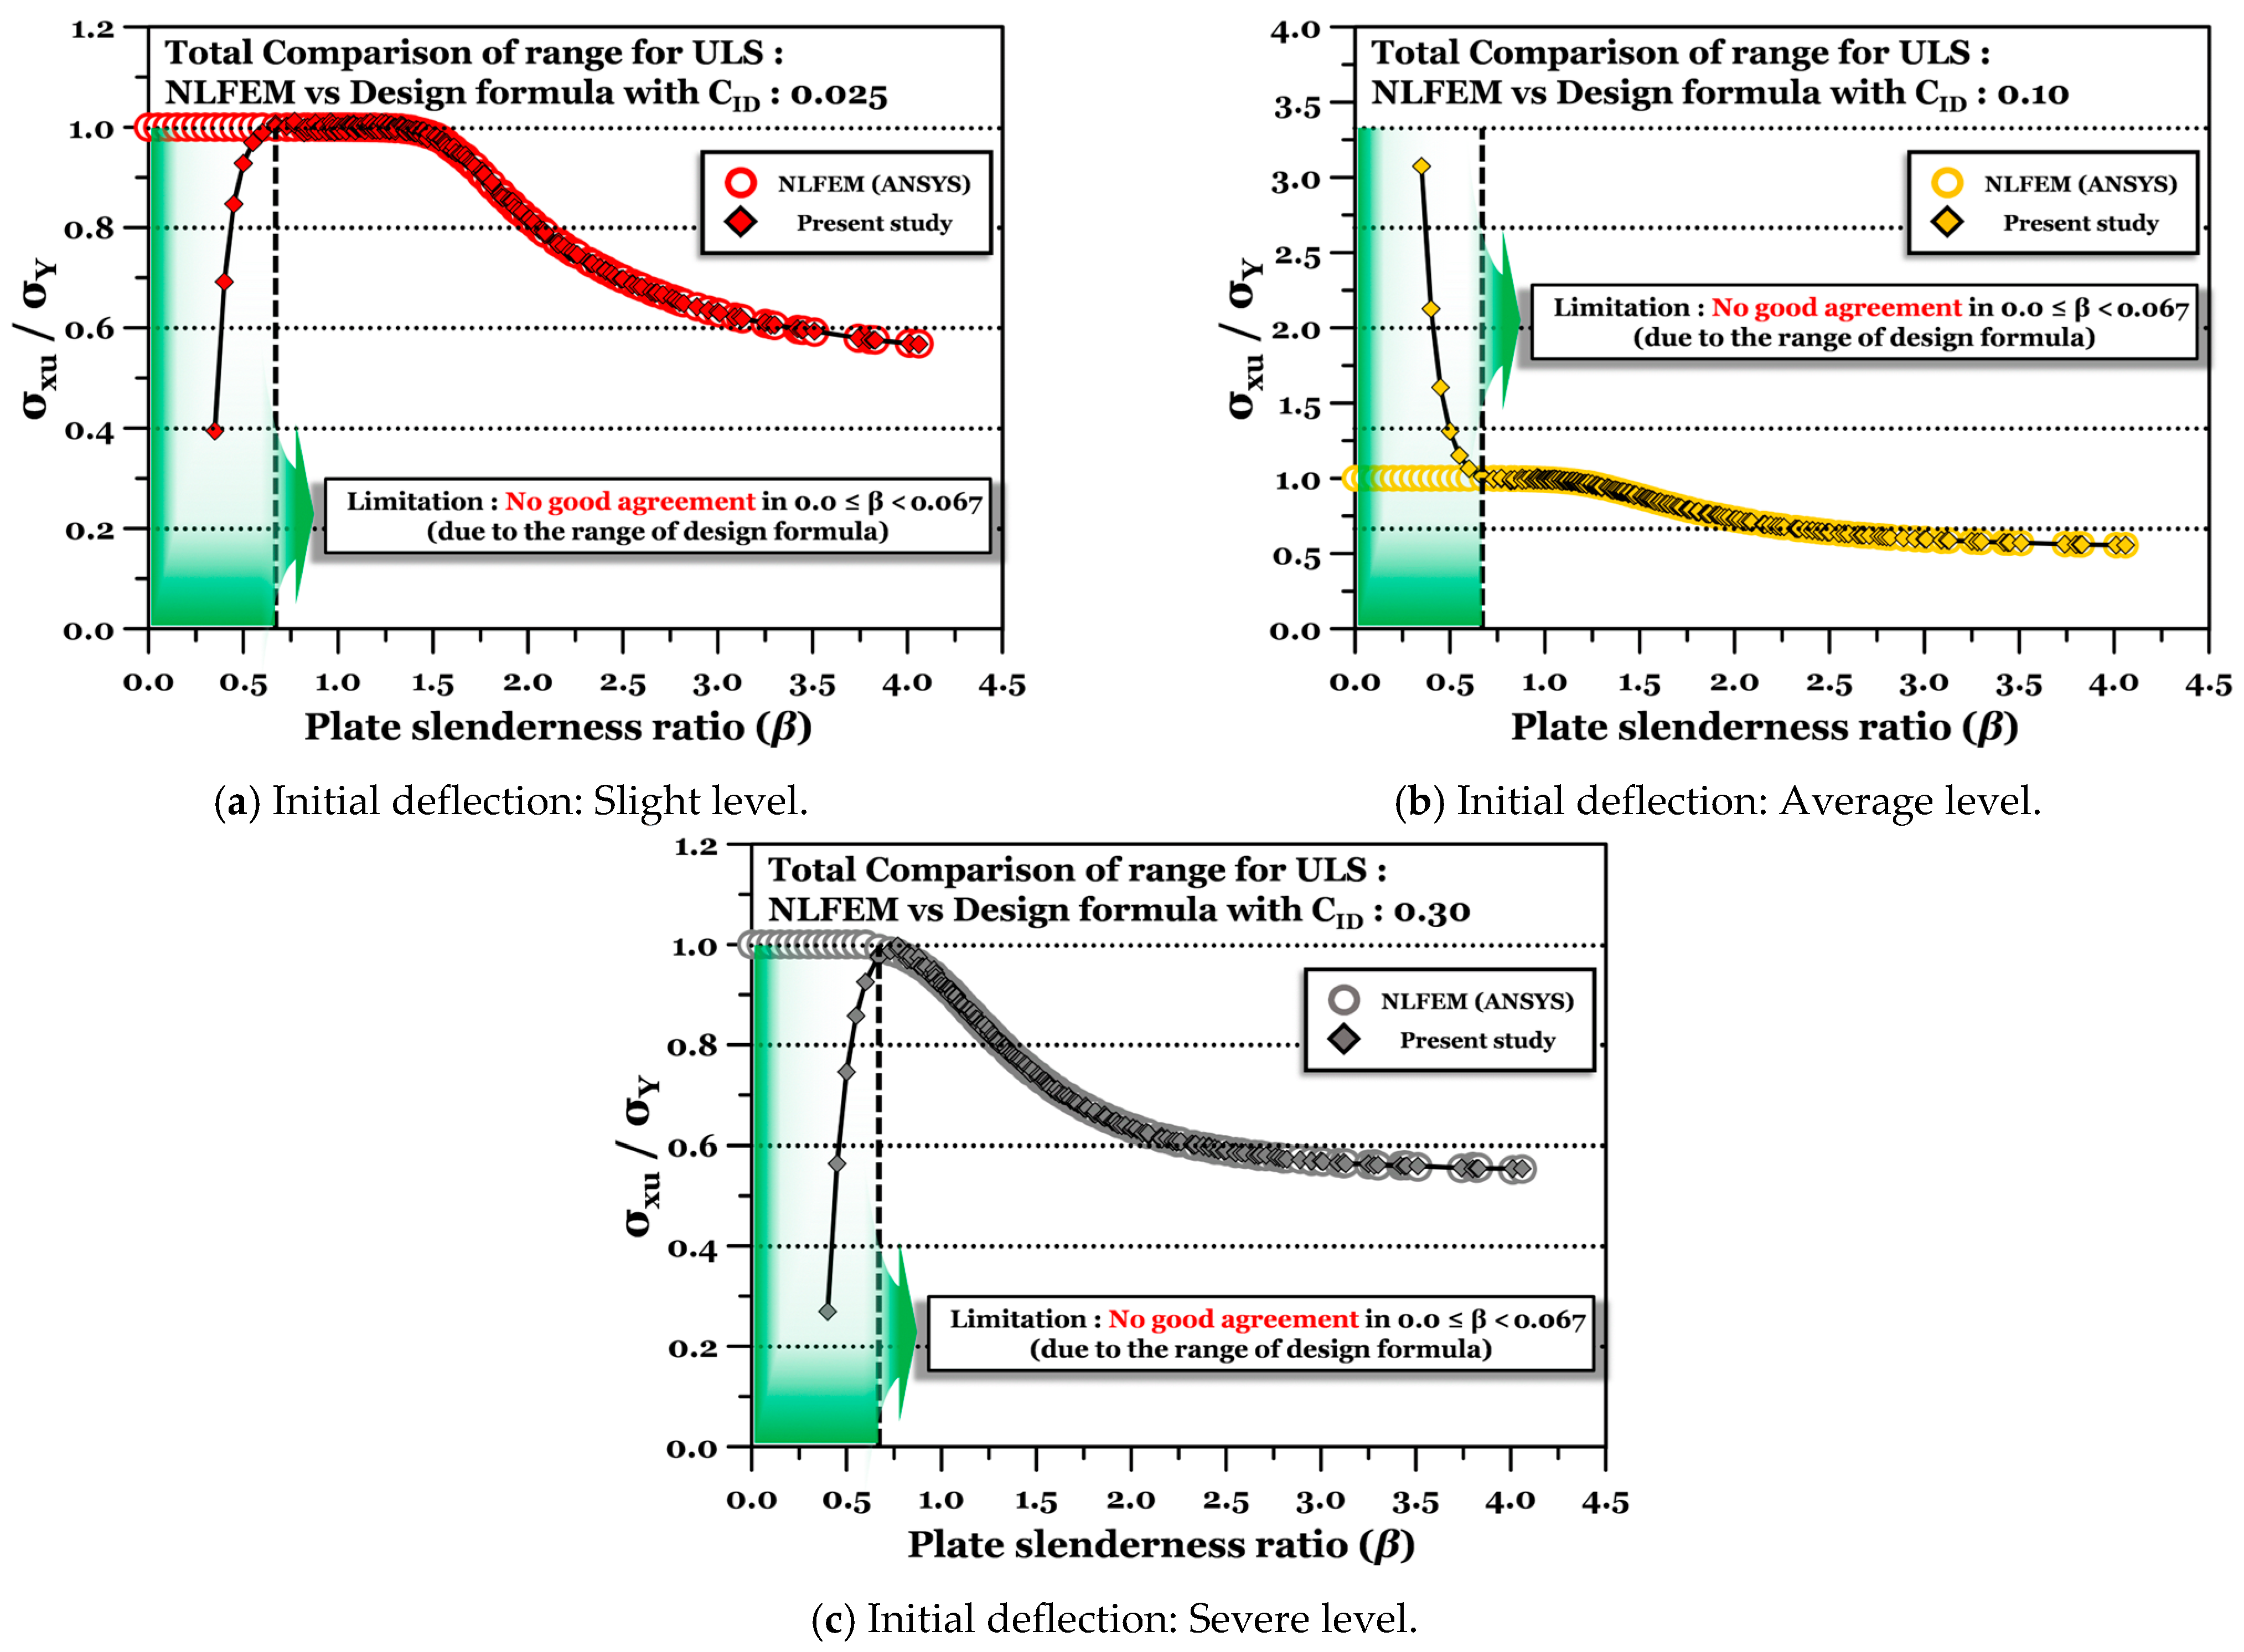
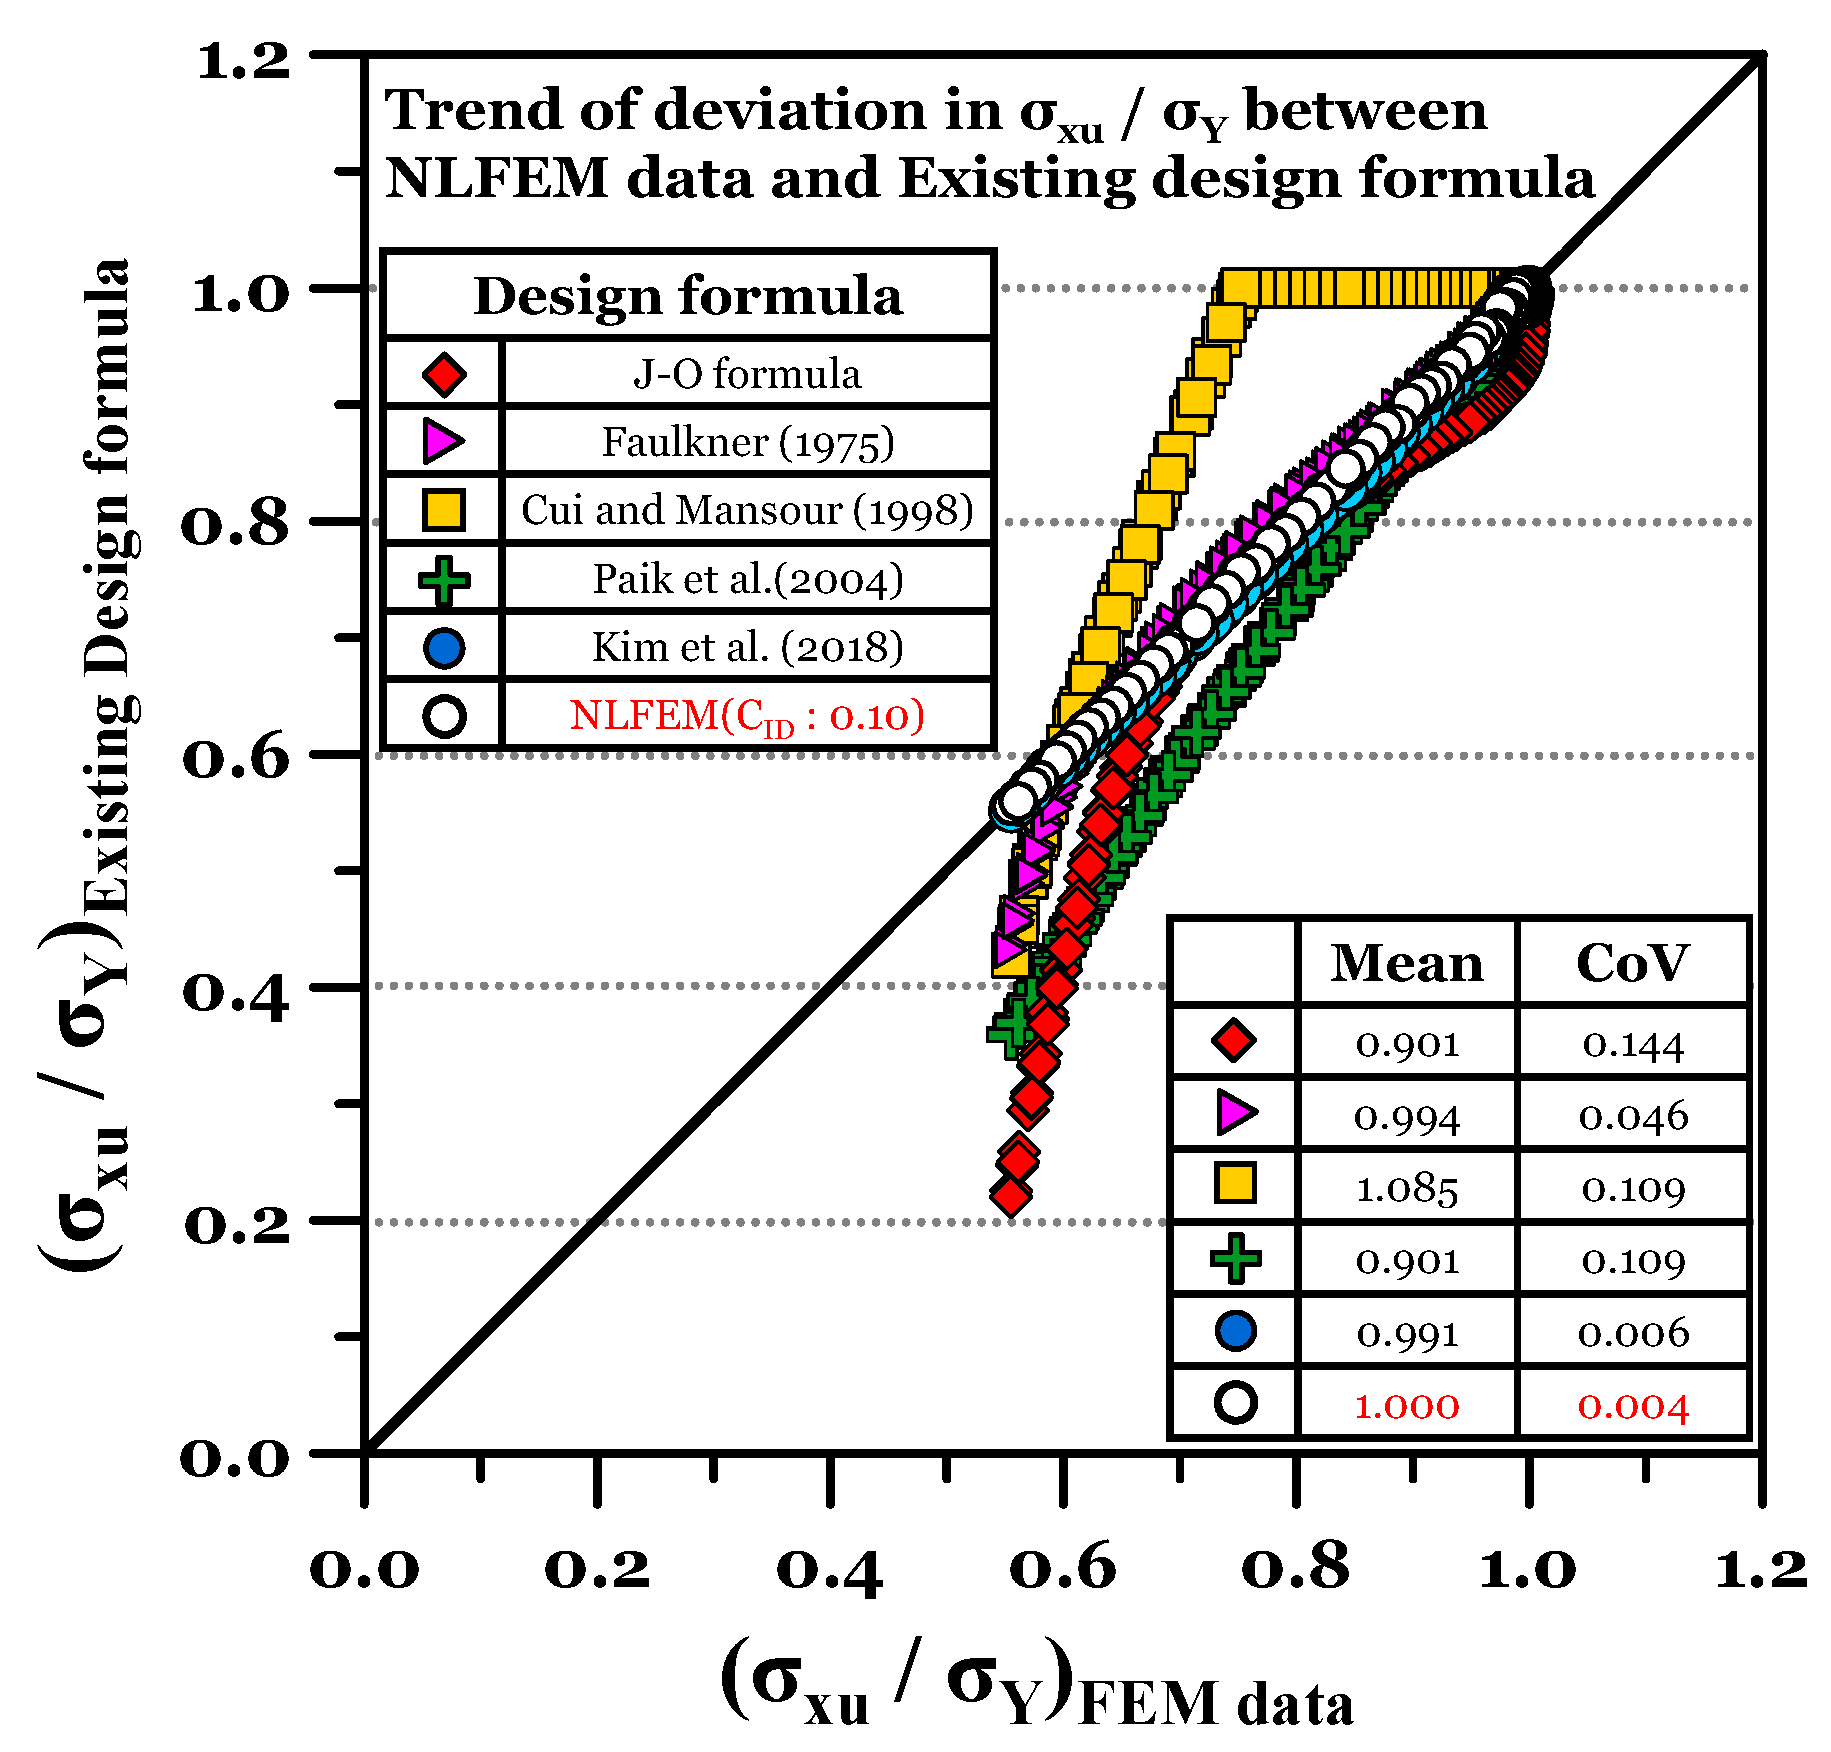
- The developed empirical formula showed an accuracy of = 0.99 compared to the results of nonlinear finite element analysis (NLFEA), which proves its applicability.
- The correlation between the elastic buckling strength and the ultimate strength of the plate was investigated. Compared to the elastic buckling strength, the compressive ultimate strength decreases as beta increases, with an average decrease of 29.7%. The details can be found in the developed and ULS relationship. However, for thin plates with a large slenderness ratio, the ULS being greater than the elastic buckling strength is the background for introducing the ultimate strength criteria. Therefore, the percentage numbers many not be importantly considered.
- The applicable range of the plate slenderness ratio shall be clearly presented. As shown in Figure 15, it is recommended to utilise the proposed formula in the range.
Author Contributions
Funding
Institutional Review Board Statement
Informed Consent Statement
Data Availability Statement
Conflicts of Interest
Nomenclatures
| = | Total area of stiffened panel | |
| = | Breadth of plate, also taken as stiffener spacing | |
| = | Effective width | |
| = | Plate rigidity | |
| = | Elastic modulus (GPa) | |
| = | Height of web | |
| = | Total moment of inertia of stiffener and plate | |
| = | Moment of inertia of plate in z-direction | |
| = | Moment of inertia of stiffener in z-direction | |
| = | Buckling coefficient of plate which is determined depending on loading and boundary conditions | |
| = | Length of stiffener (= length of plate) | |
| = | Buckling coefficient of plate which is determined depending on loading and boundary conditions | |
| = | Elastic buckling force | |
| = | Radius of gyration | |
| = | Elastic buckling strength | |
| = | Yield strength | |
| = | Yield strength (equivalent) | |
| = | Thickness of plate | |
| = | Thickness of web | |
| = | Plate slenderness ratio | |
| = | Column slenderness ratio |
Appendix A

| No. | a(mm) | b(mm) | t(mm) | σY(MPa) | E(GPa) | β |
|---|---|---|---|---|---|---|
| 1 | 4150 | 830 | 42 | 235 | 205.8 | 0.67 |
| 2 | 4150 | 830 | 36.5 | 235 | 205.8 | 0.77 |
| 3 | 4150 | 830 | 34 | 235 | 205.8 | 0.82 |
| 4 | 4150 | 830 | 32 | 235 | 205.8 | 0.88 |
| 5 | 4150 | 830 | 30.5 | 235 | 205.8 | 0.92 |
| 6 | 4150 | 830 | 29.5 | 235 | 205.8 | 0.95 |
| 7 | 4150 | 830 | 29 | 235 | 205.8 | 0.97 |
| 8 | 4150 | 830 | 28.5 | 235 | 205.8 | 0.98 |
| 9 | 4150 | 830 | 27.5 | 235 | 205.8 | 1.02 |
| 10 | 4150 | 830 | 27 | 235 | 205.8 | 1.04 |
| 11 | 4150 | 830 | 26.5 | 235 | 205.8 | 1.06 |
| 12 | 4150 | 830 | 26 | 235 | 205.8 | 1.08 |
| 13 | 4150 | 830 | 25.5 | 235 | 205.8 | 1.10 |
| 14 | 4150 | 830 | 25 | 235 | 205.8 | 1.12 |
| 15 | 4150 | 830 | 24.5 | 235 | 205.8 | 1.14 |
| 16 | 4150 | 830 | 24 | 235 | 205.8 | 1.17 |
| 17 | 4150 | 830 | 23.5 | 235 | 205.8 | 1.19 |
| 18 | 4150 | 830 | 23 | 235 | 205.8 | 1.22 |
| 19 | 4150 | 830 | 22.5 | 235 | 205.8 | 1.25 |
| 20 | 4150 | 830 | 22 | 235 | 205.8 | 1.27 |
| 21 | 4150 | 830 | 21.5 | 235 | 205.8 | 1.30 |
| 22 | 4150 | 830 | 21 | 235 | 205.8 | 1.34 |
| 23 | 4150 | 830 | 20.5 | 235 | 205.8 | 1.37 |
| 24 | 4150 | 830 | 20 | 235 | 205.8 | 1.40 |
| 25 | 4150 | 830 | 19.5 | 235 | 205.8 | 1.44 |
| 26 | 4150 | 830 | 19 | 235 | 205.8 | 1.48 |
| 27 | 4150 | 830 | 18.5 | 235 | 205.8 | 1.52 |
| 28 | 4150 | 830 | 18 | 235 | 205.8 | 1.56 |
| 29 | 4150 | 830 | 17.5 | 235 | 205.8 | 1.60 |
| 30 | 4150 | 830 | 17 | 235 | 205.8 | 1.65 |
| 31 | 4150 | 830 | 16.5 | 235 | 205.8 | 1.70 |
| 32 | 4150 | 830 | 16 | 235 | 205.8 | 1.75 |
| 33 | 4150 | 830 | 15.5 | 235 | 205.8 | 1.81 |
| 34 | 4150 | 830 | 15 | 235 | 205.8 | 1.87 |
| 35 | 4150 | 830 | 14.5 | 235 | 205.8 | 1.93 |
| 36 | 4150 | 830 | 14 | 235 | 205.8 | 2.00 |
| 37 | 4150 | 830 | 13.5 | 235 | 205.8 | 2.08 |
| 38 | 4150 | 830 | 13 | 235 | 205.8 | 2.16 |
| 39 | 4150 | 830 | 12.5 | 235 | 205.8 | 2.24 |
| 40 | 4150 | 830 | 12 | 235 | 205.8 | 2.34 |
| 41 | 4150 | 830 | 11.5 | 235 | 205.8 | 2.44 |
| 42 | 4150 | 830 | 11 | 235 | 205.8 | 2.55 |
| 43 | 4150 | 830 | 10.5 | 235 | 205.8 | 2.67 |
| 44 | 4150 | 830 | 10 | 235 | 205.8 | 2.80 |
| 45 | 4150 | 830 | 9.5 | 235 | 205.8 | 2.95 |
| 46 | 4150 | 830 | 9 | 235 | 205.8 | 3.12 |
| 47 | 4150 | 830 | 8.5 | 235 | 205.8 | 3.30 |
| 48 | 4150 | 830 | 8 | 235 | 205.8 | 3.51 |
| 49 | 4150 | 830 | 7.5 | 235 | 205.8 | 3.74 |
| 50 | 4150 | 830 | 7 | 235 | 205.8 | 4.01 |
| 51 | 4150 | 830 | 44.5 | 315 | 205.8 | 0.73 |
| 52 | 4150 | 830 | 38.5 | 315 | 205.8 | 0.84 |
| 53 | 4150 | 830 | 36 | 315 | 205.8 | 0.90 |
| 54 | 4150 | 830 | 34 | 315 | 205.8 | 0.96 |
| 55 | 4150 | 830 | 32.5 | 315 | 205.8 | 1.00 |
| 56 | 4150 | 830 | 31.5 | 315 | 205.8 | 1.03 |
| 57 | 4150 | 830 | 31 | 315 | 205.8 | 1.05 |
| 58 | 4150 | 830 | 30 | 315 | 205.8 | 1.08 |
| 59 | 4150 | 830 | 29.5 | 315 | 205.8 | 1.10 |
| 60 | 4150 | 830 | 29 | 315 | 205.8 | 1.12 |
| 61 | 4150 | 830 | 28.5 | 315 | 205.8 | 1.14 |
| 62 | 4150 | 830 | 28 | 315 | 205.8 | 1.16 |
| 63 | 4150 | 830 | 27.5 | 315 | 205.8 | 1.18 |
| 64 | 4150 | 830 | 27 | 315 | 205.8 | 1.20 |
| 65 | 4150 | 830 | 26.5 | 315 | 205.8 | 1.23 |
| 66 | 4150 | 830 | 26 | 315 | 205.8 | 1.25 |
| 67 | 4150 | 830 | 25.5 | 315 | 205.8 | 1.27 |
| 68 | 4150 | 830 | 25 | 315 | 205.8 | 1.30 |
| 69 | 4150 | 830 | 24.5 | 315 | 205.8 | 1.33 |
| 70 | 4150 | 830 | 24 | 315 | 205.8 | 1.35 |
| 71 | 4150 | 830 | 23.5 | 315 | 205.8 | 1.38 |
| 72 | 4150 | 830 | 23 | 315 | 205.8 | 1.41 |
| 73 | 4150 | 830 | 22.5 | 315 | 205.8 | 1.44 |
| 74 | 4150 | 830 | 22 | 315 | 205.8 | 1.48 |
| 75 | 4150 | 830 | 21.5 | 315 | 205.8 | 1.51 |
| 76 | 4150 | 830 | 21 | 315 | 205.8 | 1.55 |
| 77 | 4150 | 830 | 20.5 | 315 | 205.8 | 1.58 |
| 78 | 4150 | 830 | 20 | 315 | 205.8 | 1.62 |
| 79 | 4150 | 830 | 19.5 | 315 | 205.8 | 1.67 |
| 80 | 4150 | 830 | 19 | 315 | 205.8 | 1.71 |
| 81 | 4150 | 830 | 18.5 | 315 | 205.8 | 1.76 |
| 82 | 4150 | 830 | 18 | 315 | 205.8 | 1.80 |
| 83 | 4150 | 830 | 17.5 | 315 | 205.8 | 1.86 |
| 84 | 4150 | 830 | 17 | 315 | 205.8 | 1.91 |
| 85 | 4150 | 830 | 16.5 | 315 | 205.8 | 1.97 |
| 86 | 4150 | 830 | 16 | 315 | 205.8 | 2.03 |
| 87 | 4150 | 830 | 15.5 | 315 | 205.8 | 2.09 |
| 88 | 4150 | 830 | 15 | 315 | 205.8 | 2.16 |
| 89 | 4150 | 830 | 14.5 | 315 | 205.8 | 2.24 |
| 90 | 4150 | 830 | 14 | 315 | 205.8 | 2.32 |
| 91 | 4150 | 830 | 13.5 | 315 | 205.8 | 2.41 |
| 92 | 4150 | 830 | 13 | 315 | 205.8 | 2.50 |
| 93 | 4150 | 830 | 12.5 | 315 | 205.8 | 2.60 |
| 94 | 4150 | 830 | 12 | 315 | 205.8 | 2.71 |
| 95 | 4150 | 830 | 11.5 | 315 | 205.8 | 2.82 |
| 96 | 4150 | 830 | 11 | 315 | 205.8 | 2.95 |
| 97 | 4150 | 830 | 10.5 | 315 | 205.8 | 3.09 |
| 98 | 4150 | 830 | 10 | 315 | 205.8 | 3.25 |
| 99 | 4150 | 830 | 9.5 | 315 | 205.8 | 3.42 |
| 100 | 4150 | 830 | 8.5 | 315 | 205.8 | 3.82 |
| 101 | 4150 | 830 | 51.5 | 355 | 205.8 | 0.67 |
| 102 | 4150 | 830 | 45 | 355 | 205.8 | 0.77 |
| 103 | 4150 | 830 | 42 | 355 | 205.8 | 0.82 |
| 104 | 4150 | 830 | 39 | 355 | 205.8 | 0.88 |
| 105 | 4150 | 830 | 37.5 | 355 | 205.8 | 0.92 |
| 106 | 4150 | 830 | 36.5 | 355 | 205.8 | 0.94 |
| 107 | 4150 | 830 | 35.5 | 355 | 205.8 | 0.97 |
| 108 | 4150 | 830 | 35 | 355 | 205.8 | 0.98 |
| 109 | 4150 | 830 | 34 | 355 | 205.8 | 1.01 |
| 110 | 4150 | 830 | 33 | 355 | 205.8 | 1.04 |
| 111 | 4150 | 830 | 32.5 | 355 | 205.8 | 1.06 |
| 112 | 4150 | 830 | 32 | 355 | 205.8 | 1.08 |
| 113 | 4150 | 830 | 31.5 | 355 | 205.8 | 1.09 |
| 114 | 4150 | 830 | 31 | 355 | 205.8 | 1.11 |
| 115 | 4150 | 830 | 30 | 355 | 205.8 | 1.15 |
| 116 | 4150 | 830 | 29.5 | 355 | 205.8 | 1.17 |
| 117 | 4150 | 830 | 29 | 355 | 205.8 | 1.19 |
| 118 | 4150 | 830 | 28.5 | 355 | 205.8 | 1.21 |
| 119 | 4150 | 830 | 27.5 | 355 | 205.8 | 1.25 |
| 120 | 4150 | 830 | 27 | 355 | 205.8 | 1.28 |
| 121 | 4150 | 830 | 26.5 | 355 | 205.8 | 1.30 |
| 122 | 4150 | 830 | 25.5 | 355 | 205.8 | 1.35 |
| 123 | 4150 | 830 | 25 | 355 | 205.8 | 1.38 |
| 124 | 4150 | 830 | 24.5 | 355 | 205.8 | 1.41 |
| 125 | 4150 | 830 | 24 | 355 | 205.8 | 1.44 |
| 126 | 4150 | 830 | 23.5 | 355 | 205.8 | 1.47 |
| 127 | 4150 | 830 | 22.5 | 355 | 205.8 | 1.53 |
| 128 | 4150 | 830 | 22 | 355 | 205.8 | 1.57 |
| 129 | 4150 | 830 | 21.5 | 355 | 205.8 | 1.60 |
| 130 | 4150 | 830 | 21 | 355 | 205.8 | 1.64 |
| 131 | 4150 | 830 | 20.5 | 355 | 205.8 | 1.68 |
| 132 | 4150 | 830 | 19.5 | 355 | 205.8 | 1.77 |
| 133 | 4150 | 830 | 19 | 355 | 205.8 | 1.81 |
| 134 | 4150 | 830 | 18.5 | 355 | 205.8 | 1.86 |
| 135 | 4150 | 830 | 18 | 355 | 205.8 | 1.92 |
| 136 | 4150 | 830 | 17 | 355 | 205.8 | 2.03 |
| 137 | 4150 | 830 | 16.5 | 355 | 205.8 | 2.09 |
| 138 | 4150 | 830 | 16 | 355 | 205.8 | 2.15 |
| 139 | 4150 | 830 | 15.5 | 355 | 205.8 | 2.22 |
| 140 | 4150 | 830 | 14.5 | 355 | 205.8 | 2.38 |
| 141 | 4150 | 830 | 14 | 355 | 205.8 | 2.46 |
| 142 | 4150 | 830 | 13.5 | 355 | 205.8 | 2.55 |
| 143 | 4150 | 830 | 13 | 355 | 205.8 | 2.65 |
| 144 | 4150 | 830 | 12.5 | 355 | 205.8 | 2.76 |
| 145 | 4150 | 830 | 11.5 | 355 | 205.8 | 3.00 |
| 146 | 4150 | 830 | 11 | 355 | 205.8 | 3.13 |
| 147 | 4150 | 830 | 10.5 | 355 | 205.8 | 3.28 |
| 148 | 4150 | 830 | 10 | 355 | 205.8 | 3.45 |
| 149 | 4150 | 830 | 9 | 355 | 205.8 | 3.83 |
| 150 | 4150 | 830 | 8.5 | 355 | 205.8 | 4.06 |
| 151 | 4150 | 830 | 49.5 | 390 | 205.8 | 0.73 |
| 152 | 4150 | 830 | 43 | 390 | 205.8 | 0.84 |
| 153 | 4150 | 830 | 40 | 390 | 205.8 | 0.90 |
| 154 | 4150 | 830 | 37.5 | 390 | 205.8 | 0.96 |
| 155 | 4150 | 830 | 36 | 390 | 205.8 | 1.00 |
| 156 | 4150 | 830 | 35 | 390 | 205.8 | 1.03 |
| 157 | 4150 | 830 | 34.5 | 390 | 205.8 | 1.05 |
| 158 | 4150 | 830 | 33.5 | 390 | 205.8 | 1.08 |
| 159 | 4150 | 830 | 33 | 390 | 205.8 | 1.09 |
| 160 | 4150 | 830 | 32.5 | 390 | 205.8 | 1.11 |
| 161 | 4150 | 830 | 31.5 | 390 | 205.8 | 1.15 |
| 162 | 4150 | 830 | 31 | 390 | 205.8 | 1.17 |
| 163 | 4150 | 830 | 30.5 | 390 | 205.8 | 1.18 |
| 164 | 4150 | 830 | 30 | 390 | 205.8 | 1.20 |
| 165 | 4150 | 830 | 29.5 | 390 | 205.8 | 1.22 |
| 166 | 4150 | 830 | 29 | 390 | 205.8 | 1.25 |
| 167 | 4150 | 830 | 28.5 | 390 | 205.8 | 1.27 |
| 168 | 4150 | 830 | 28 | 390 | 205.8 | 1.29 |
| 169 | 4150 | 830 | 27 | 390 | 205.8 | 1.34 |
| 170 | 4150 | 830 | 26.5 | 390 | 205.8 | 1.36 |
| 171 | 4150 | 830 | 26 | 390 | 205.8 | 1.39 |
| 172 | 4150 | 830 | 25.5 | 390 | 205.8 | 1.42 |
| 173 | 4150 | 830 | 25 | 390 | 205.8 | 1.45 |
| 174 | 4150 | 830 | 24.5 | 390 | 205.8 | 1.47 |
| 175 | 4150 | 830 | 24 | 390 | 205.8 | 1.51 |
| 176 | 4150 | 830 | 23.5 | 390 | 205.8 | 1.54 |
| 177 | 4150 | 830 | 23 | 390 | 205.8 | 1.57 |
| 178 | 4150 | 830 | 22.5 | 390 | 205.8 | 1.61 |
| 179 | 4150 | 830 | 21.5 | 390 | 205.8 | 1.68 |
| 180 | 4150 | 830 | 21 | 390 | 205.8 | 1.72 |
| 181 | 4150 | 830 | 20.5 | 390 | 205.8 | 1.76 |
| 182 | 4150 | 830 | 20 | 390 | 205.8 | 1.81 |
| 183 | 4150 | 830 | 19.5 | 390 | 205.8 | 1.85 |
| 184 | 4150 | 830 | 19 | 390 | 205.8 | 1.90 |
| 185 | 4150 | 830 | 18.5 | 390 | 205.8 | 1.95 |
| 186 | 4150 | 830 | 18 | 390 | 205.8 | 2.01 |
| 187 | 4150 | 830 | 17.5 | 390 | 205.8 | 2.06 |
| 188 | 4150 | 830 | 16.5 | 390 | 205.8 | 2.19 |
| 189 | 4150 | 830 | 16 | 390 | 205.8 | 2.26 |
| 190 | 4150 | 830 | 15.5 | 390 | 205.8 | 2.33 |
| 191 | 4150 | 830 | 15 | 390 | 205.8 | 2.41 |
| 192 | 4150 | 830 | 14.5 | 390 | 205.8 | 2.49 |
| 193 | 4150 | 830 | 14 | 390 | 205.8 | 2.58 |
| 194 | 4150 | 830 | 13.5 | 390 | 205.8 | 2.68 |
| 195 | 4150 | 830 | 13 | 390 | 205.8 | 2.78 |
| 196 | 4150 | 830 | 12.5 | 390 | 205.8 | 2.89 |
| 197 | 4150 | 830 | 12 | 390 | 205.8 | 3.01 |
| 198 | 4150 | 830 | 11 | 390 | 205.8 | 3.28 |
| 199 | 4150 | 830 | 10.5 | 390 | 205.8 | 3.44 |
| 200 | 4150 | 830 | 9.5 | 390 | 205.8 | 3.80 |
References
- Paik, J.K. Ship-Shaped Offshore Installations: Design, Construction, Operation, Healthcare and Decommissioning, 2nd ed.; Cambridge University Press: Cambridge, UK, 2022. [Google Scholar]
- IACS. Common Structural Rules for Bulk Carriers and Oil Tankers; International Association of Classification Societies: London, UK, 2022. [Google Scholar]
- Wang, Z.; Kong, X.; Wu, W.; Li, S.; Kim, D.K. A guidance of solid element application in predicting the ultimate strength of flat plates in compression. J. Ocean Eng. Sci. 2024, in press. [Google Scholar] [CrossRef]
- Feng, L.; Yu, J.; Zheng, J.; He, W.; Liu, C. Experimental and numerical study of residual ultimate strength of hull plate subjected to coupled damage of pitting corrosion and crack. Ocean Eng. 2024, 294, 116710. [Google Scholar] [CrossRef]
- Kim, J.-H.; Park, D.-H.; Kim, S.-K.; Kim, M.-S.; Lee, J.-M. Experimental Study and Development of Design Formula for Estimating the Ultimate Strength of Curved Plates. Appl. Sci. 2021, 11, 2379. [Google Scholar] [CrossRef]
- Ahmadi, F.; Rahbar Ranji, A.; Nowruzi, H. Ultimate strength prediction of corroded plates with center-longitudinal crack using FEM and ANN. Ocean Eng. 2020, 206, 107281. [Google Scholar] [CrossRef]
- Paik, J.K. Ultimate Limit State Analysis and Design of Plated Structures, 2nd ed.; John Wiley & Sons: Chichester, UK, 2018. [Google Scholar]
- Kim, D.K.; Poh, B.Y.; Lee, J.R.; Paik, J.K. Ultimate strength of initially deflected plate under longitudinal compression: Part I = An advanced empirical formulation. Struct. Eng. Mech. 2018, 68, 247–259. [Google Scholar] [CrossRef]
- Jiang, X.; Guedes Soares, C. A closed form formula to predict the ultimate capacity of pitted mild steel plate under biaxial compression. Thin-Walled Struct. 2012, 59, 27–34. [Google Scholar] [CrossRef]
- Zhang, S.; Khan, I. Buckling and ultimate capability of plates and stiffened panels in axial compression. Mar. Struct. 2009, 22, 791–808. [Google Scholar] [CrossRef]
- Wang, Z.; Kong, X.; Wu, W.; Kim, D.K. An advanced design diagram of stiffened plate subjected to combined in-plane and lateral loads considering initial deflection effects. Thin-Walled Struct. 2024, 203, 112144. [Google Scholar] [CrossRef]
- Woloszyk, K.; Garbatov, Y.; Kowalski, J. Experimental ultimate strength assessment of stiffened plates subjected to marine immersed corrosion. Appl. Ocean Res. 2023, 138, 103679. [Google Scholar] [CrossRef]
- Lee, H.H.; Kim, H.J.; Paik, J.K. Use of physical testing data for the accurate prediction of the ultimate compressive strength of steel stiffened panels. Ships Offshore Struct. 2023, 18, 609–623. [Google Scholar] [CrossRef]
- Ringsberg, J.W.; Darie, I.; Nahshon, K.; Shilling, G.; Vaz, M.A.; Benson, S.; Brubak, L.; Feng, G.; Fujikubo, M.; Gaiotti, M.; et al. The ISSC 2022 committee III.1-Ultimate strength benchmark study on the ultimate limit state analysis of a stiffened plate structure subjected to uniaxial compressive loads. Mar. Struct. 2021, 79, 103026. [Google Scholar] [CrossRef]
- Piculin, S.; Može, P. Ultimate resistance of longitudinally stiffened curved plates subjected to pure compression. J. Constr. Steel Res. 2021, 181, 106616. [Google Scholar] [CrossRef]
- Zhang, S. A review and study on ultimate strength of steel plates and stiffened panels in axial compression. Ships Offshore Struct. 2016, 11, 81–91. [Google Scholar] [CrossRef]
- Seo, J.K.; Song, C.H.; Park, J.S.; Paik, J.K. Nonlinear structural behaviour and design formulae for calculating the ultimate strength of stiffened curved plates under axial compression. Thin-Walled Struct. 2016, 107, 1–17. [Google Scholar] [CrossRef]
- Tran, K.L.; Douthe, C.; Sab, K.; Dallot, J.; Davaine, L. Buckling of stiffened curved panels under uniform axial compression. J. Constr. Steel Res. 2014, 103, 140–147. [Google Scholar] [CrossRef]
- Choi, B.H.; Hwang, M.O.; Yoon, T.Y.; Yoo, C.H. Experimental study of inelastic buckling strength and stiffness requirements for longitudinally stiffened panels. Eng. Struct. 2009, 31, 1141–1153. [Google Scholar] [CrossRef]
- Li, D.; Chen, Z. Progressive collapse response and ultimate strength evaluation of stiffened plates with welding residual stress under combined biaxial cyclic loads and lateral pressure. Mar. Struct. 2025, 99, 103703. [Google Scholar] [CrossRef]
- Li, D.; Chen, Z. Progressive collapse analysis and ultimate strength estimation of continuous stiffened panel under longitudinal extreme cyclic load and lateral pressure. Ocean Eng. 2023, 285, 115340. [Google Scholar] [CrossRef]
- Hosseinabadi, O.F.; Khedmati, M.R. A review on ultimate strength of aluminium structural elements and systems for marine applications. Ocean Eng. 2021, 232, 109153. [Google Scholar] [CrossRef]
- Paik, J.K.; Lee, D.H.; Noh, S.H.; Park, D.K.; Ringsberg, J.W. Full-scale collapse testing of a steel stiffened plate structure under cyclic axial-compressive loading. Structures 2020, 26, 996–1009. [Google Scholar] [CrossRef]
- Manuel Gordo, J.; Guedes Soares, C. Compressive Tests on Long Continuous Stiffened Panels. J. Offshore Mech. Arct. Eng. 2011, 134, 021403. [Google Scholar] [CrossRef]
- Khedmati, M.R.; Zareei, M.R.; Rigo, P. Empirical formulations for estimation of ultimate strength of continuous stiffened aluminium plates under combined in-plane compression and lateral pressure. Thin-Walled Struct. 2010, 48, 274–289. [Google Scholar] [CrossRef]
- Kim, D.K.; Li, S.; Yoo, K.; Danasakaran, K.; Cho, N.-K. An empirical formula to assess ultimate strength of initially deflected plate: Part 2 = combined longitudinal compression and lateral pressure. Ocean Eng. 2022, 252, 111112. [Google Scholar] [CrossRef]
- Kim, D.K.; Li, S.; Lee, J.R.; Poh, B.Y.; Benson, S.; Cho, N.-K. An empirical formula to assess ultimate strength of initially deflected plate: Part 1 = propose the general shape and application to longitudinal compression. Ocean Eng. 2022, 252, 111151. [Google Scholar] [CrossRef]
- Kim, D.K.; Lim, H.L.; Yu, S.Y. Ultimate strength prediction of T-bar stiffened panel under longitudinal compression by data processing: A refined empirical formulation. Ocean Eng. 2019, 192, 106522. [Google Scholar] [CrossRef]
- Xu, M.C.; Song, Z.J.; Zhang, B.W.; Pan, J. Empirical formula for predicting ultimate strength of stiffened panel of ship structure under combined longitudinal compression and lateral loads. Ocean Eng. 2018, 162, 161–175. [Google Scholar] [CrossRef]
- Kim, D.K.; Lim, H.L.; Kim, M.S.; Hwang, O.J.; Park, K.S. An empirical formulation for predicting the ultimate strength of stiffened panels subjected to longitudinal compression. Ocean Eng. 2017, 140, 270–280. [Google Scholar] [CrossRef]
- Faulkner, D. A Review of Effective Plating for Use in the Analysis of Stiffened Plating in Bending and Compression. J. Ship Res. 1975, 19, 1–17. [Google Scholar] [CrossRef]
- Cui, W.; Mansour, A.E. Effects of welding distortions and residual stresses on the ultimate strength of long rectangular plates under uniaxial compression. Mar. Struct. 1998, 11, 251–269. [Google Scholar] [CrossRef]
- Paik, J.K.; Thayamballi, A.K.; Lee, J.M. Effect of initial deflection shape on the ultimate strength behavior of welded steel plates under biaxial compressive loads. J. Ship Res. 2004, 48, 45–60. [Google Scholar] [CrossRef]
- Paik, J.K.; Thayamballi, A.K. An Empirical Formulation For Predicting the Ultimate Compressive Strength of Stiffened Panels. In Proceedings of the The 7th International Offshore and Polar Engineering Conference (ISOPE 1997), Honolulu, HI, USA, 25–30 May 1997; ISOPE-I-97-444. [Google Scholar]
- Kim, D.K.; Lim, H.L.; Yu, S.Y. A technical review on ultimate strength prediction of stiffened panels in axial compression. Ocean. Eng. 2018, 170, 392–406. [Google Scholar] [CrossRef]
- Sivaprasad, H.; Lekkala, M.R.; Latheef, M.; Seo, J.; Yoo, K.; Jin, C.; Kim, D.K. Fatigue damage prediction of top tensioned riser subjected to vortex-induced vibrations using artificial neural networks. Ocean. Eng. 2023, 268, 113393. [Google Scholar] [CrossRef]
- Zhao, Z.; Zhou, S.; Gao, H.; Liu, H. Predictions of compression capacity of randomly corroded spherical shells based on artificial neural network. Ocean Eng. 2022, 257, 111668. [Google Scholar] [CrossRef]
- Park, Y.I.L.; Kim, J.-H. Artificial neural network based prediction of ultimate buckling strength of liquid natural gas cargo containment system under sloshing loads considering onboard boundary conditions. Ocean Eng. 2022, 249, 110981. [Google Scholar] [CrossRef]
- Lee, D.; Lee, S.; Lee, J. Standardization in building an ANN-based mooring line top tension prediction system. Int. J. Nav. Archit. Ocean Eng. 2022, 14, 100421. [Google Scholar] [CrossRef]
- La Ferlita, A.; Di Nardo, E.; Macera, M.; Lindemann, T.; Ciaramella, A.; Koulianos, N. A Deep Neural Network Method to Predict the Residual Hull Girder Strength. In Proceedings of the SNAME Maritime Convention, SMC 2022, Houston, TX, USA, 27–29 September 2022. [Google Scholar]
- La Ferlita, A.; Di Nardo, E.; MacEra, M.; Lindemann, T.; Ciaramella, A.; Kaeding, P. Deep Neural Network (DNN) Method to Predict the Displacement Behavior of Neutral Axis for Ships in Vertical Bending. In Technology and Science for the Ships of the Future, Proceedings of the 20th International Conference on Ship & Maritime Research, Genoa and La Spezia, Italy, 15–17 June 2022; Progress in Marine Science and Technology; IOS Press: Amsterdam, The Netherlands, 2022; pp. 95–103. [Google Scholar]
- Oh, D.; Race, J.; Oterkus, S.; Koo, B. Burst pressure prediction of API 5L X-grade dented pipelines using deep neural network. J. Mar. Sci. Eng. 2020, 8, 766. [Google Scholar] [CrossRef]
- Remennikov, A.M.; Rose, T.A. Predicting the effectiveness of blast wall barriers using neural networks. Int. J. Impact Eng. 2007, 34, 1907–1923. [Google Scholar] [CrossRef]
- Pu, Y.; Mesbahi, E. Application of artificial neural networks to evaluation of ultimate strength of steel panels. Eng. Struct. 2006, 28, 1190–1196. [Google Scholar] [CrossRef]
- Kim, D.K.; Park, D.K.; Kim, J.H.; Kim, S.J.; Kim, B.J.; Seo, J.K.; Paik, J.K. Effect of corrosion on the ultimate strength of double hull oil tankers—Part I: Stiffened panels. Struct. Eng. Mech. Int. J. 2012, 42, 507–530. [Google Scholar] [CrossRef]
- Li, S.; Georgiadis, D.G.; Kim, D.K.; Samuelides, M.S. A comparison of geometric imperfection models for collapse analysis of ship-type stiffened plated grillages. Eng. Struct. 2022, 250, 113480. [Google Scholar] [CrossRef]
- Paik, J.K.; Thayamballi, A.K. Ultimate Limit State Design of Steel-Plated Structures; Wiley: New York, NY, USA, 2003. [Google Scholar]
- Li, S.; Kim, D.K.; Benson, S. The influence of residual stress on the ultimate strength of longitudinally compressed stiffened panels. Ocean Eng. 2021, 231, 108839. [Google Scholar] [CrossRef]
- ISSC. Ultimate Strength (Committee III.1). In Proceedings of the 15th International Ship and Offshore Structures Congress (ISSC 2003), San Diego, CA, USA, 11–15 August 2003. [Google Scholar]
- ISSC. Ultimate Strength (Committee III.1). In Proceedings of the 16th International Ship and Offshore Structures Congress (ISSC 2006), Southampton, UK, 20–25 August 2006. [Google Scholar]
- ISSC. Ultimate Strength (Committee III.1). In Proceedings of the 17th International Ship and Offshore Structures Congress (ISSC 2009), Seoul, Republic of Korea, 16–21 August 2009. [Google Scholar]
- ISSC. Ultimate Strength (Committee III.1). In Proceedings of the 18th International Ship and Offshore Structures Congress (ISSC 2012), Rostock, Germany, 9–13 September 2012. [Google Scholar]
- ISSC. Ultimate Strength (Committee III.1). In Proceedings of the 19th International Ship and Offshore Structures Congress (ISSC 2015), Cascais, Portugal, 7–10 September 2015. [Google Scholar]
- ISSC. Ultimate Strength (Committee III.1). In Proceedings of the 20th International Ship and Offshore Structures Congress (ISSC 2018), Liège, Belgium and Amsterdam, The Netherlands, 9–14 September 2018. [Google Scholar]
- ISSC. Ultimate Strength (Committee III.1). In Proceedings of the 21st International Ship and Offshore Structures Congress (ISSC 2022), Vancouver, BC, Canada, 11–15 September 2022. [Google Scholar]
- ISSC. Ultimate Strength (Committee III.1). In Proceedings of the 22nd International Ship and Offshore Structures Congress (ISSC 2025), Wuxi, China, 22–26 September 2025. [Google Scholar]
- Kim, D.K.; Wong, A.M.K.; Hwang, J.; Li, S.; Cho, N.-K. A novel formula for predicting the ultimate compressive strength of the cylindrically curved plates. Int. J. Nav. Archit. Ocean Eng. 2024, 16, 100562. [Google Scholar] [CrossRef]
- Kim, D.K.; Ban, I.; Poh, B.Y.; Shin, S.-C. A useful guide of effective mesh-size decision in predicting the ultimate strength of flat- and curved plates in compression. J. Ocean. Eng. Sci. 2023, 8, 401–417. [Google Scholar] [CrossRef]


| Properties & Conditions | Number of Scenarios | Selected Scenarios | |
|---|---|---|---|
| Geometric | Plate length (a) | 1 | 4150mm |
| Plate breadth (b) | 1 | 830mm | |
| Plate thickness (t) | 50 | See Appendix A | |
| Material | Yield strength (σY) | 4 | 235,315,355 and 390 MPa |
| Elastic modulus | 1 | 205.8 GPa | |
| Initial imperfections | Initial deflection (CID = initial deflection coefficient) | 3 | 0.025 (slight), 0.10 (average) and 0.30 (severe) |
| Residual stress | N/A | N/A | |
| Boundary condition | 1 | Simply-supported | |
| Loading condition | 1 | Longitudinal compression | |
| (a) | |||||||
| β < 1.9 | Initial deflection amount (CID) | ||||||
| Sub-coefficients | 0.025 | 0.05 | 0.10 | 0.15 | 0.20 | 0.25 | 0.30 |
| f1 | −0.212 | 0.057 | 0.204 | 0.185 | 0.131 | 0.085 | 0.049 |
| f2 | 0.804 | −0.518 | −1.149 | −0.967 | −0.647 | −0.385 | −0.188 |
| f3 | −0.846 | 1.447 | 2.341 | 1.844 | 1.165 | 0.637 | 0.252 |
| f4 | 0.684 | −1.003 | −1.515 | −1.025 | −0.452 | −0.028 | 0.266 |
| f5 | −0.154 | 0.293 | 0.394 | 0.236 | 0.070 | −0.047 | −0.124 |
| R2 | 0.999 | 0.999 | 0.999 | 0.999 | 0.999 | 0.999 | 0.999 |
| (b) | |||||||
| β ≥ 1.9 | Initial deflection amount (CID) | ||||||
| Sub-coefficients | 0.025 | 0.05 | 0.10 | 0.15 | 0.20 | 0.25 | 0.30 |
| g1 | 0.125 | 0.127 | 0.118 | 0.117 | 0.118 | 0.123 | 0.124 |
| g2 | 2.042 | 2.036 | 2.095 | 2.112 | 2.119 | 2.099 | 2.100 |
| g3 | 0.389 | 0.342 | 0.303 | 0.261 | 0.229 | 0.191 | 0.170 |
| R2 | 0.999 | 0.999 | 0.999 | 0.999 | 0.999 | 0.999 | 0.999 |
Disclaimer/Publisher’s Note: The statements, opinions and data contained in all publications are solely those of the individual author(s) and contributor(s) and not of MDPI and/or the editor(s). MDPI and/or the editor(s) disclaim responsibility for any injury to people or property resulting from any ideas, methods, instructions or products referred to in the content. |
© 2025 by the authors. Licensee MDPI, Basel, Switzerland. This article is an open access article distributed under the terms and conditions of the Creative Commons Attribution (CC BY) license (https://creativecommons.org/licenses/by/4.0/).
Share and Cite
Kim, D.K.; Yang, H.Y.; Li, S.; Kim, S. An Updated Design Formula for Predicting the Compressive Strength of Plate: Elastic Buckling and Ultimate Compressive Strength. J. Mar. Sci. Eng. 2025, 13, 113. https://doi.org/10.3390/jmse13010113
Kim DK, Yang HY, Li S, Kim S. An Updated Design Formula for Predicting the Compressive Strength of Plate: Elastic Buckling and Ultimate Compressive Strength. Journal of Marine Science and Engineering. 2025; 13(1):113. https://doi.org/10.3390/jmse13010113
Chicago/Turabian StyleKim, Do Kyun, Hee Yeong Yang, Shen Li, and Seungjun Kim. 2025. "An Updated Design Formula for Predicting the Compressive Strength of Plate: Elastic Buckling and Ultimate Compressive Strength" Journal of Marine Science and Engineering 13, no. 1: 113. https://doi.org/10.3390/jmse13010113
APA StyleKim, D. K., Yang, H. Y., Li, S., & Kim, S. (2025). An Updated Design Formula for Predicting the Compressive Strength of Plate: Elastic Buckling and Ultimate Compressive Strength. Journal of Marine Science and Engineering, 13(1), 113. https://doi.org/10.3390/jmse13010113