
Multi-Objective Optimization of Ship Design for the Effect of Wind Propulsion †


Abstract
:1. Introduction
- It allows the optimization of the design of vessels fitted with WAPSs from scratch at the concept design stage (not as a retrofit solution to an existing design).
- It is a flexible and modular MATLAB tool allowing the consideration of different ship types, sizes, and WAPSs.
- It is fully parametric, while beyond the eight selected variables that are presented in this paper, more optimization variables can be incorporated in the optimization study, such as propeller diameter, number of propeller blades, vessel speed (laden and ballast), WAPS alternative technologies, etc., which can be optimized for any given routes.
- It allows single- and multi-objective optimization.
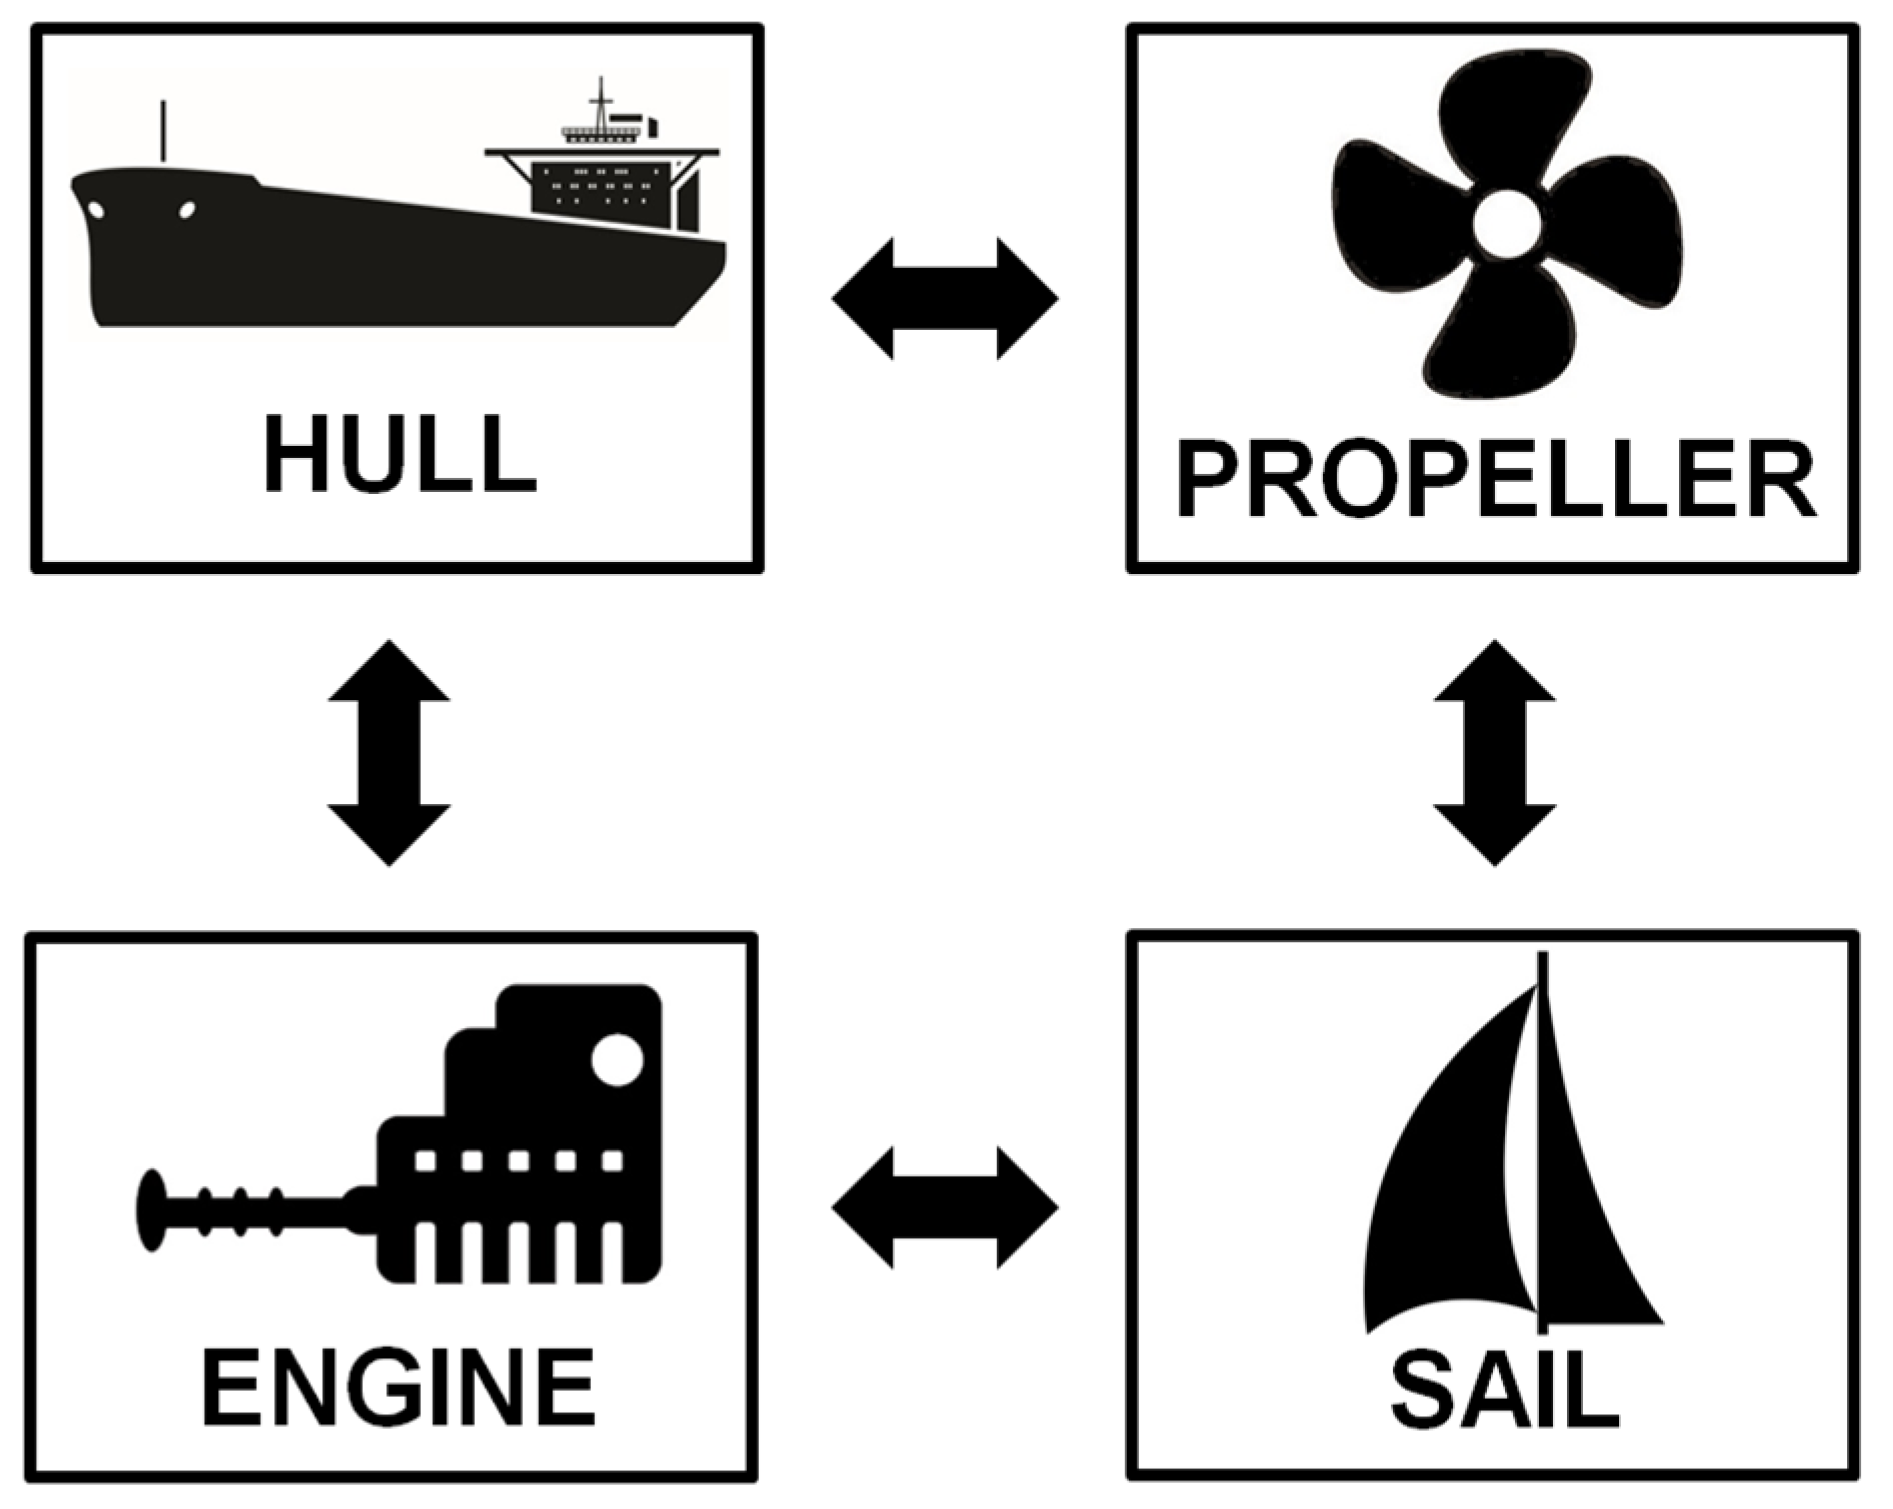
- It allows optimization of the hull form, engine, propeller, and sail design characteristics in parallel, within the same optimization framework.
2. WAPS Simulation Tool
2.1. Wind-Powered Ship Propulsion Simulation Model
2.2. Wing Sail Characteristics
2.3. Estimation of Forces
2.4. Vessel Performance Comparison with and Without Sails
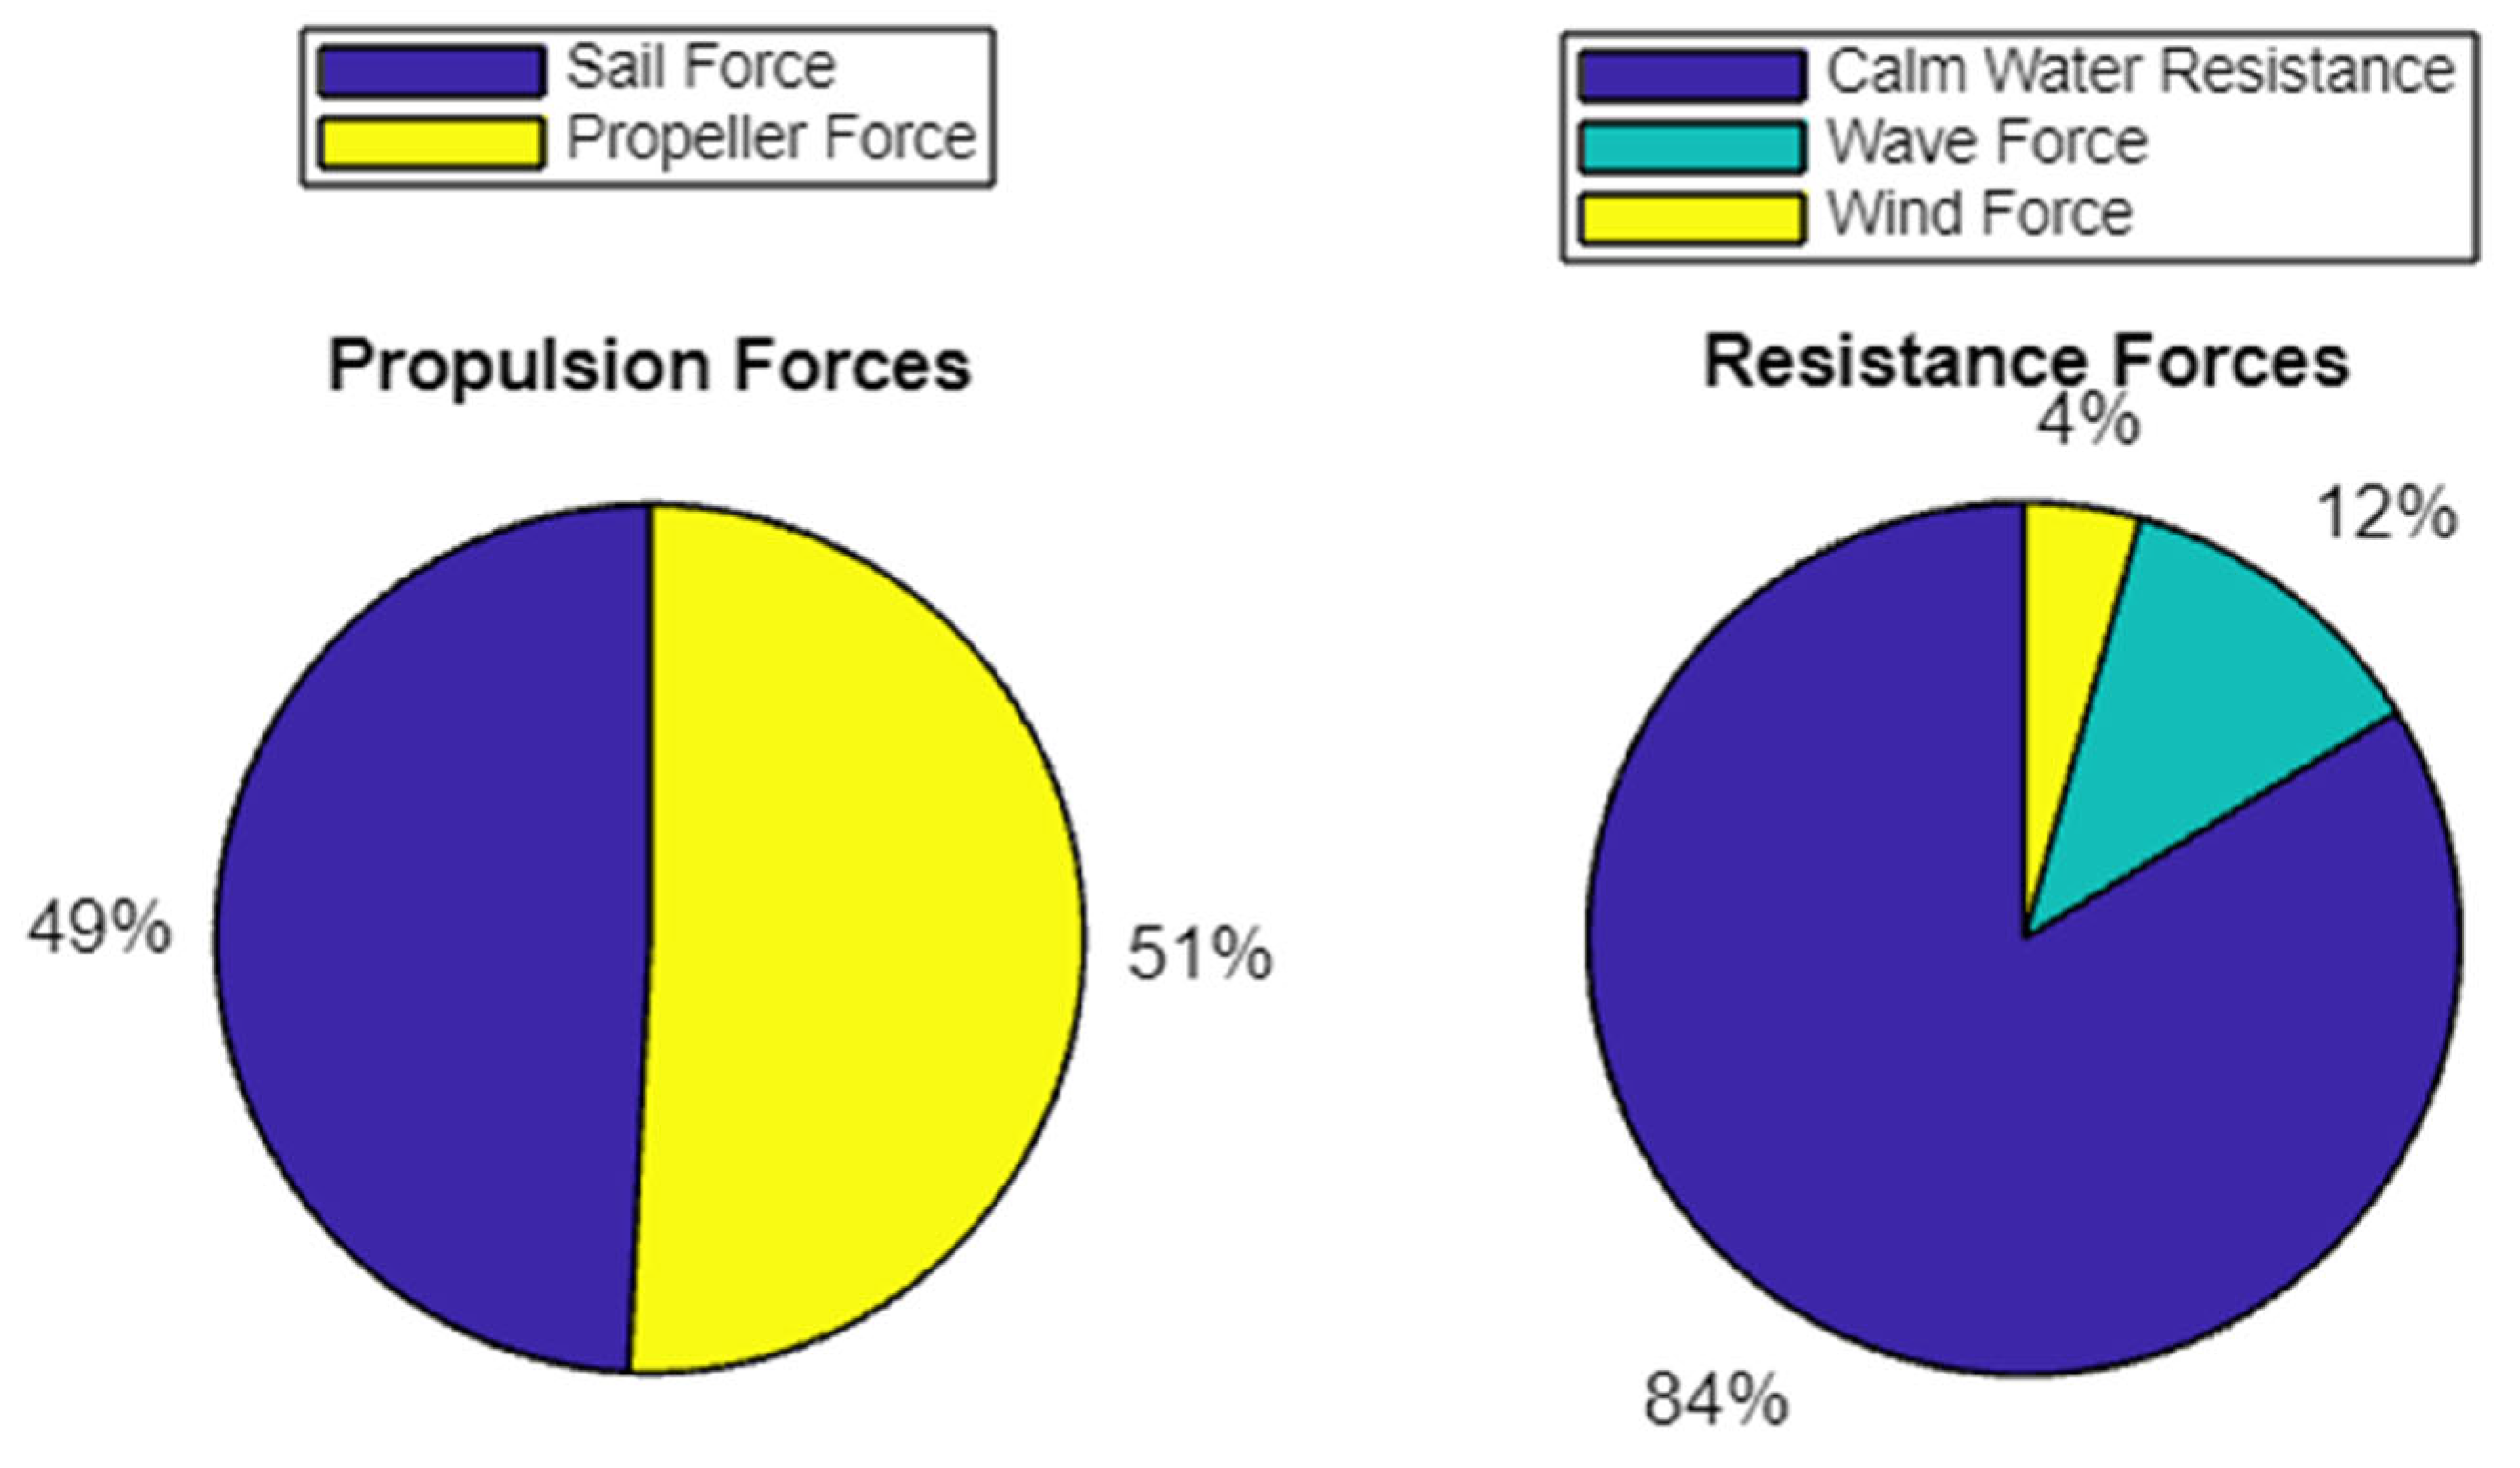
2.4.1. Forces
2.4.2. Hull
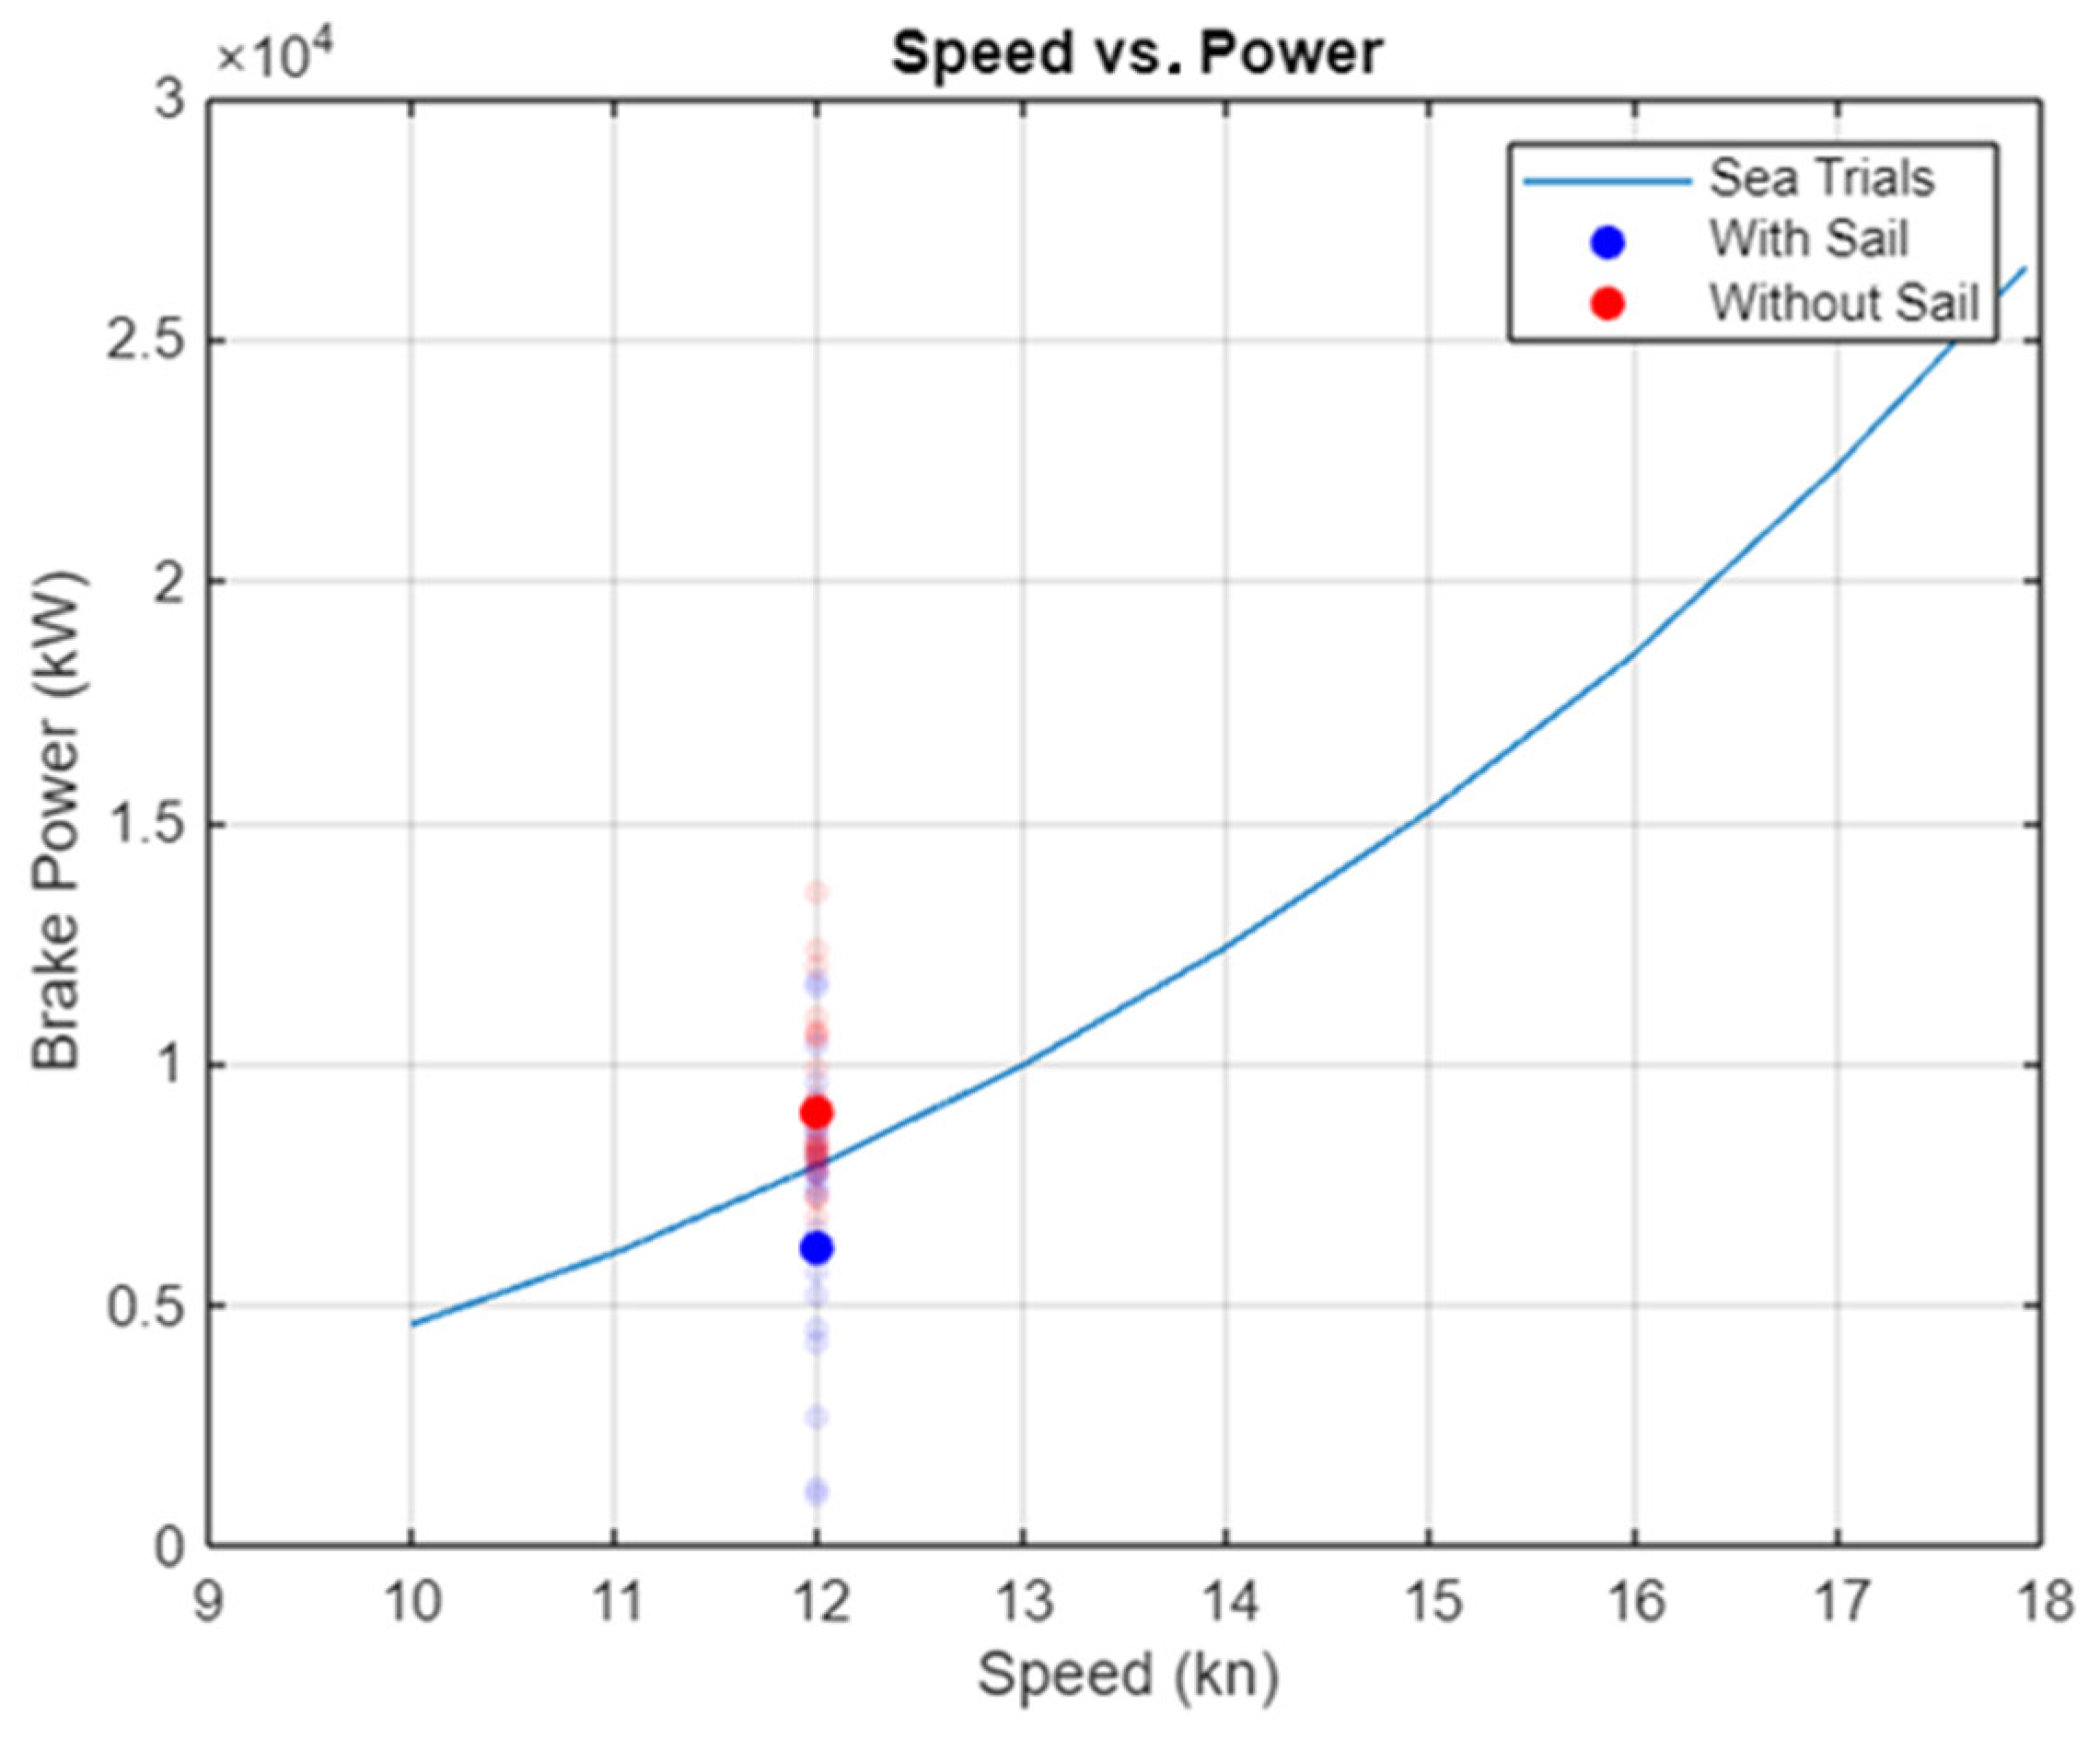
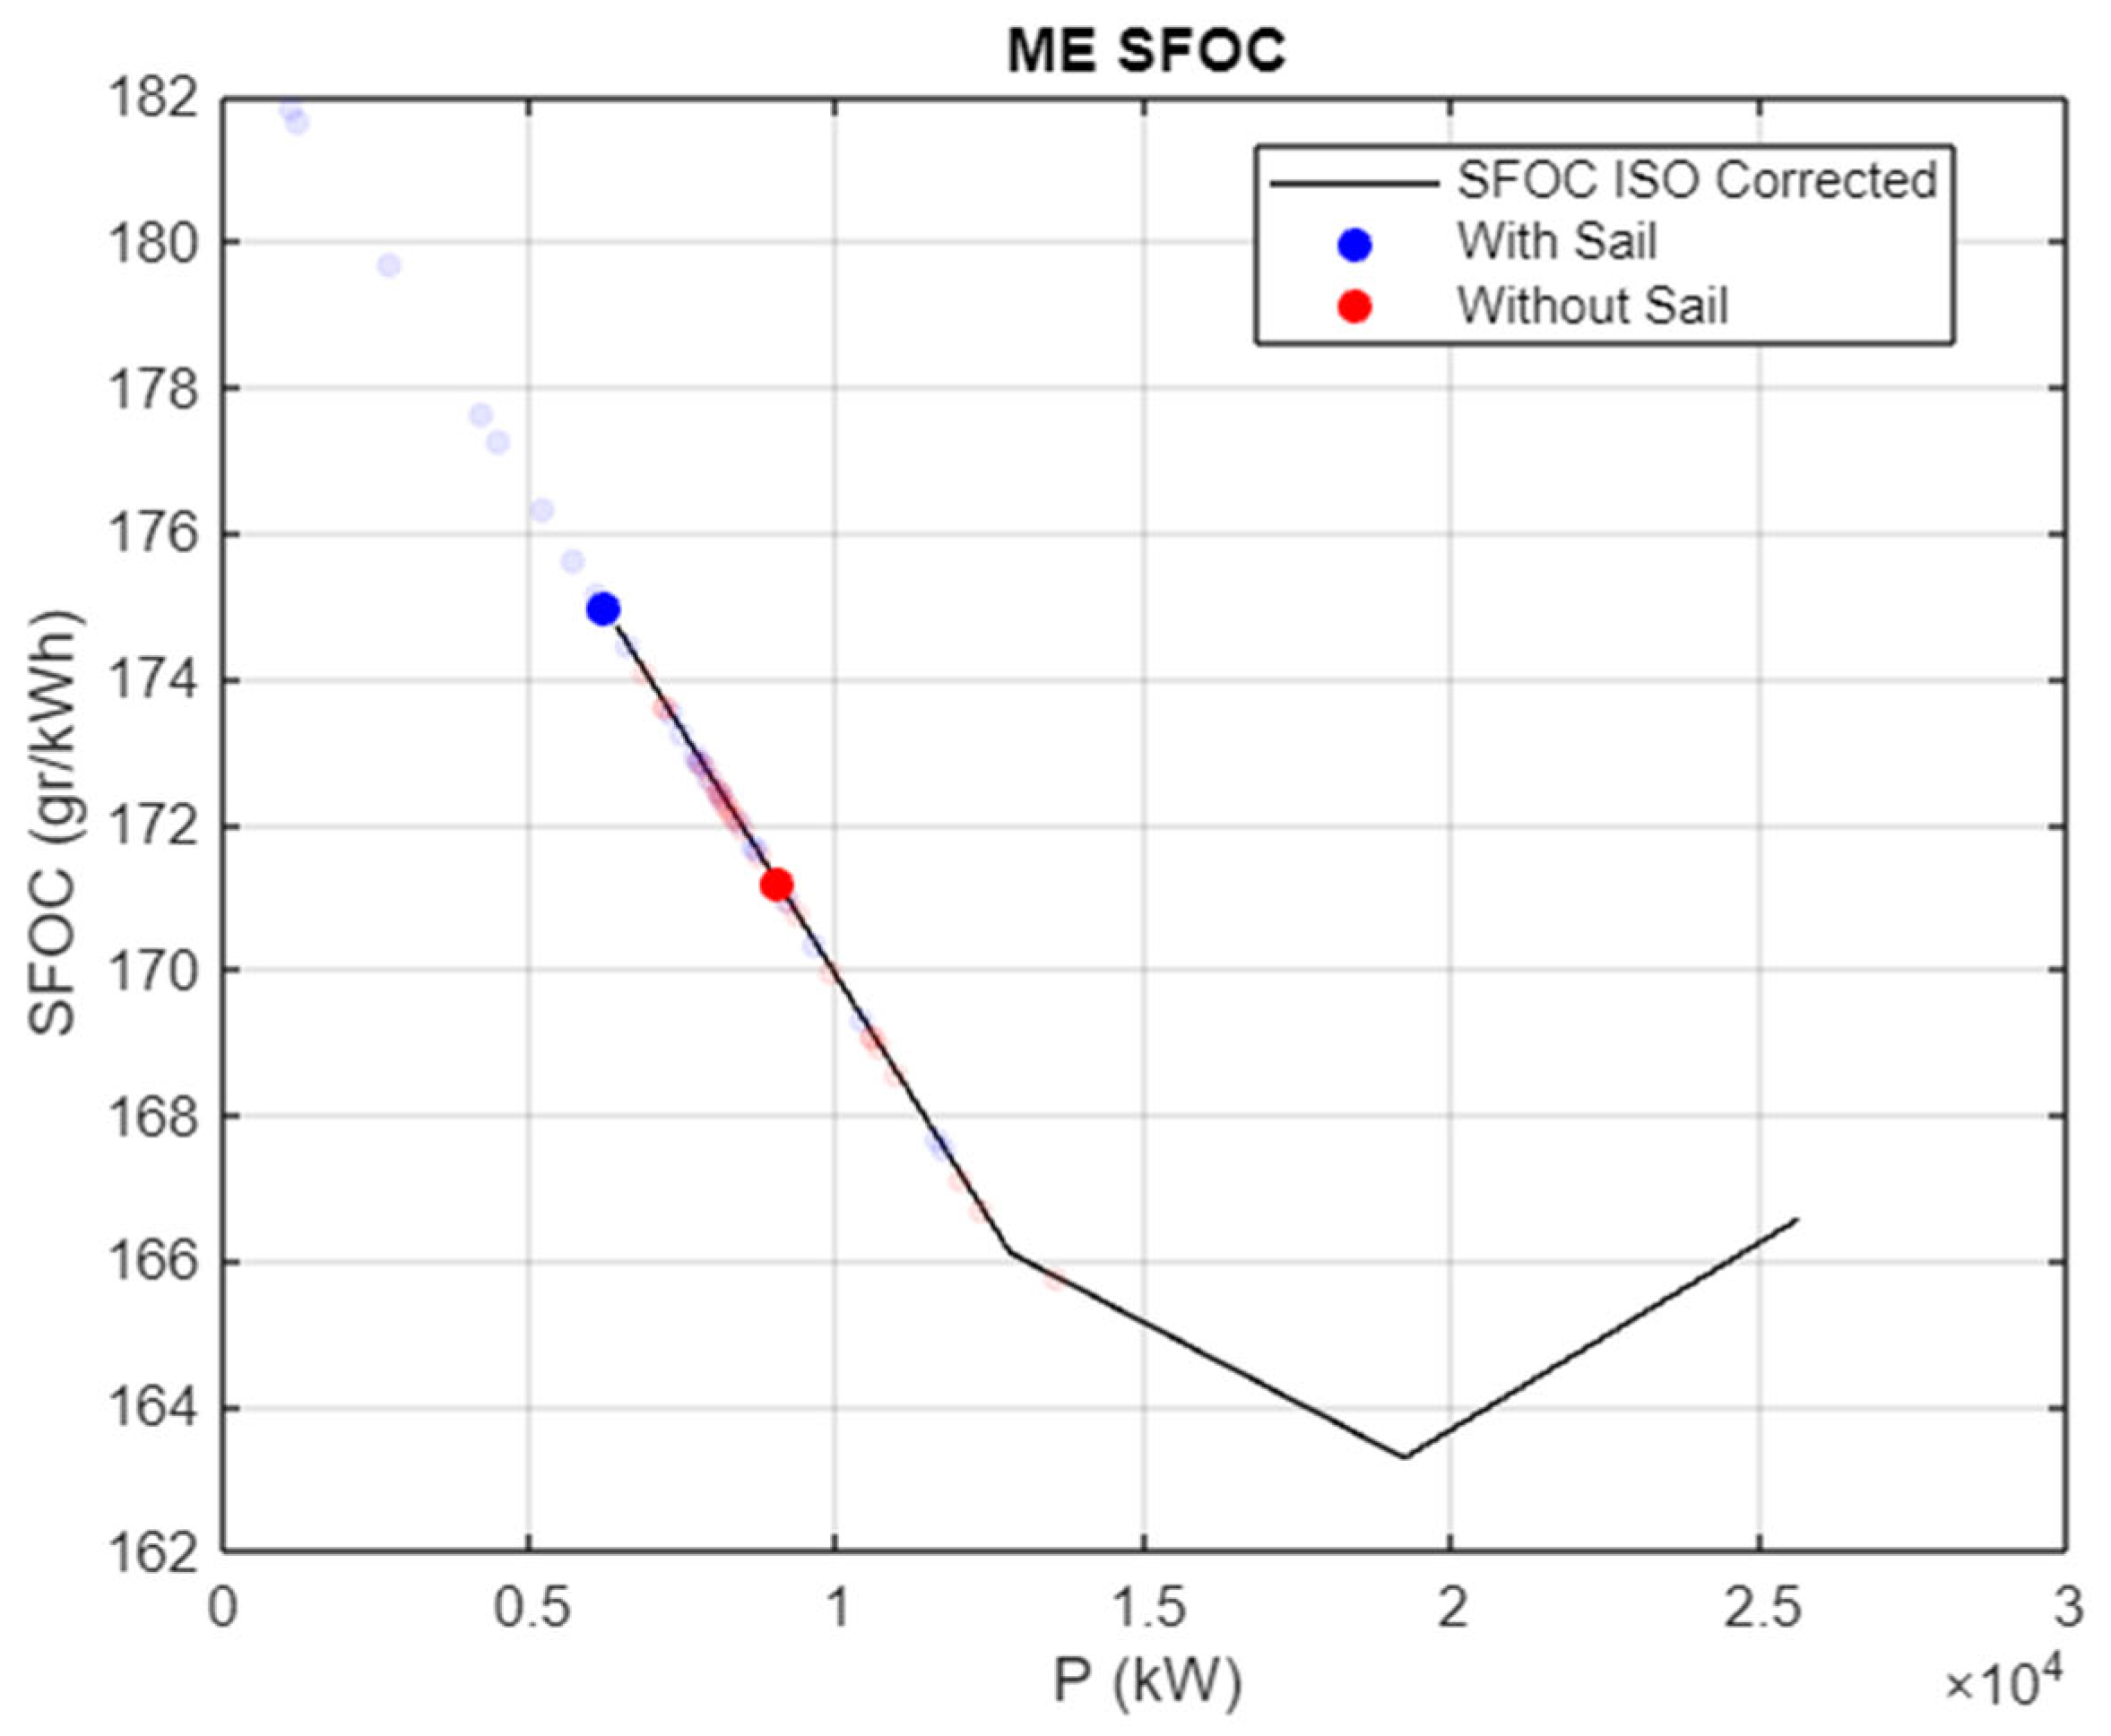
2.4.3. Main Engine
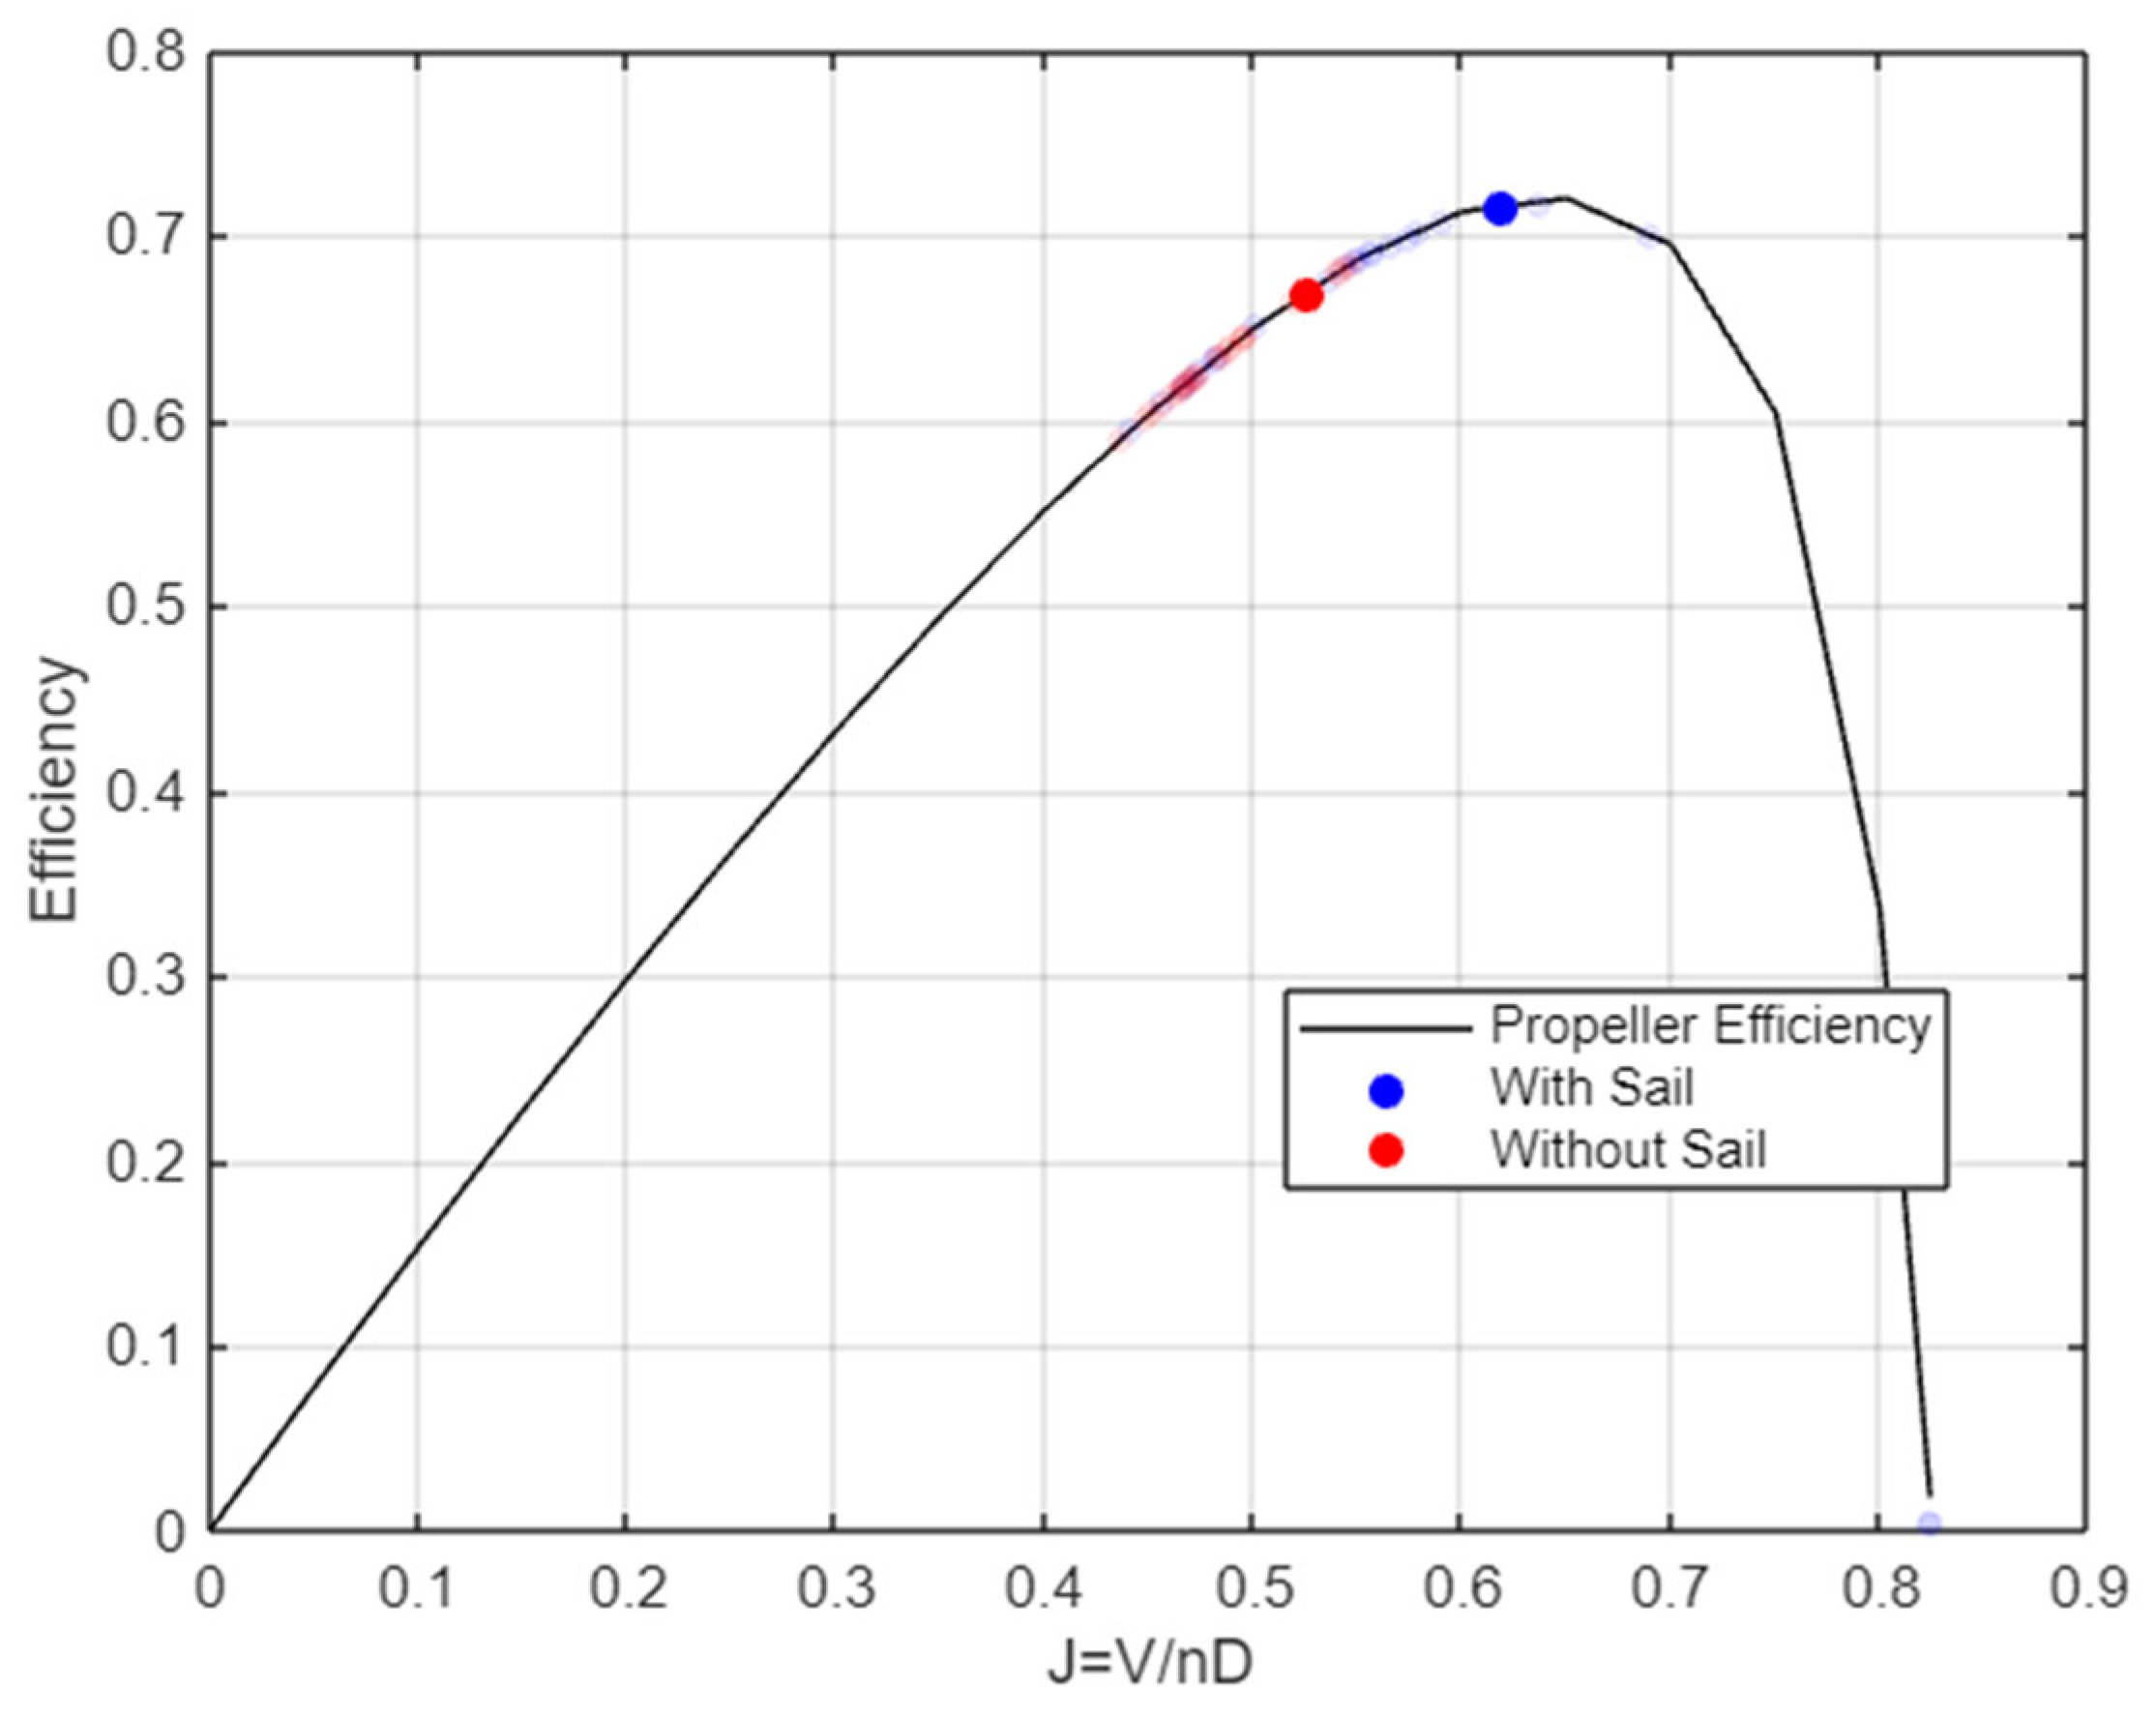
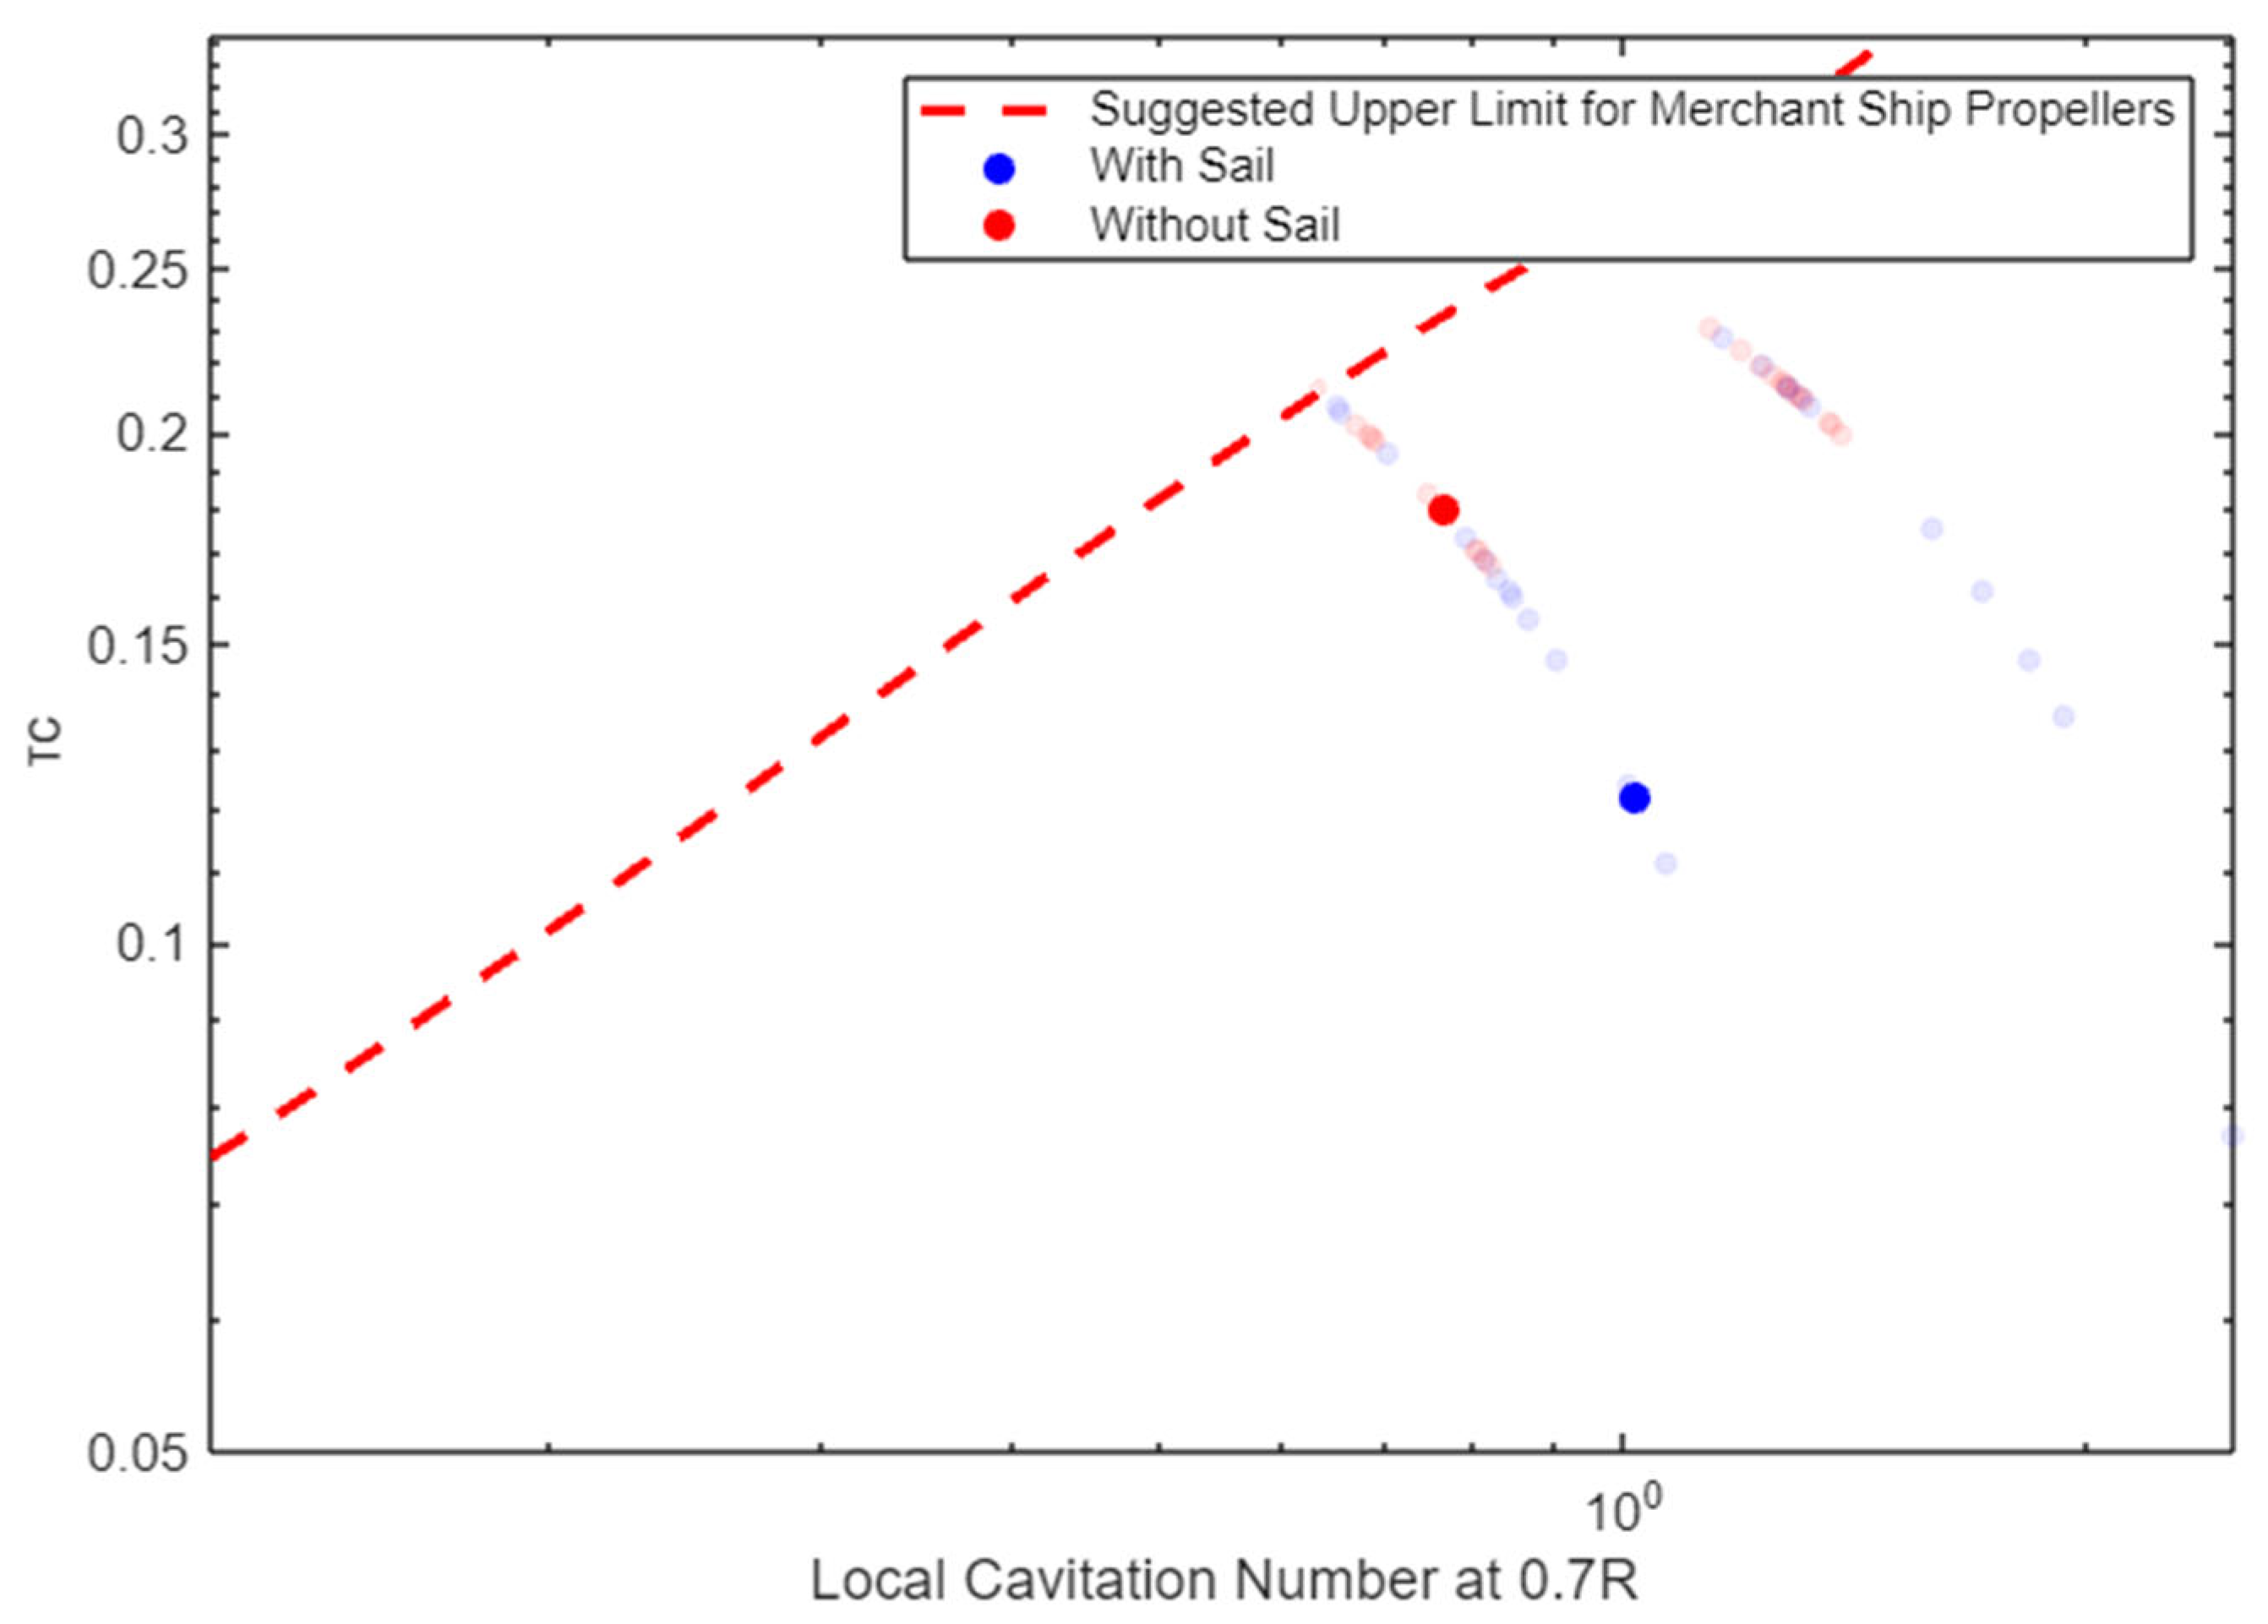
2.4.4. Propeller
2.4.5. Wing Sail
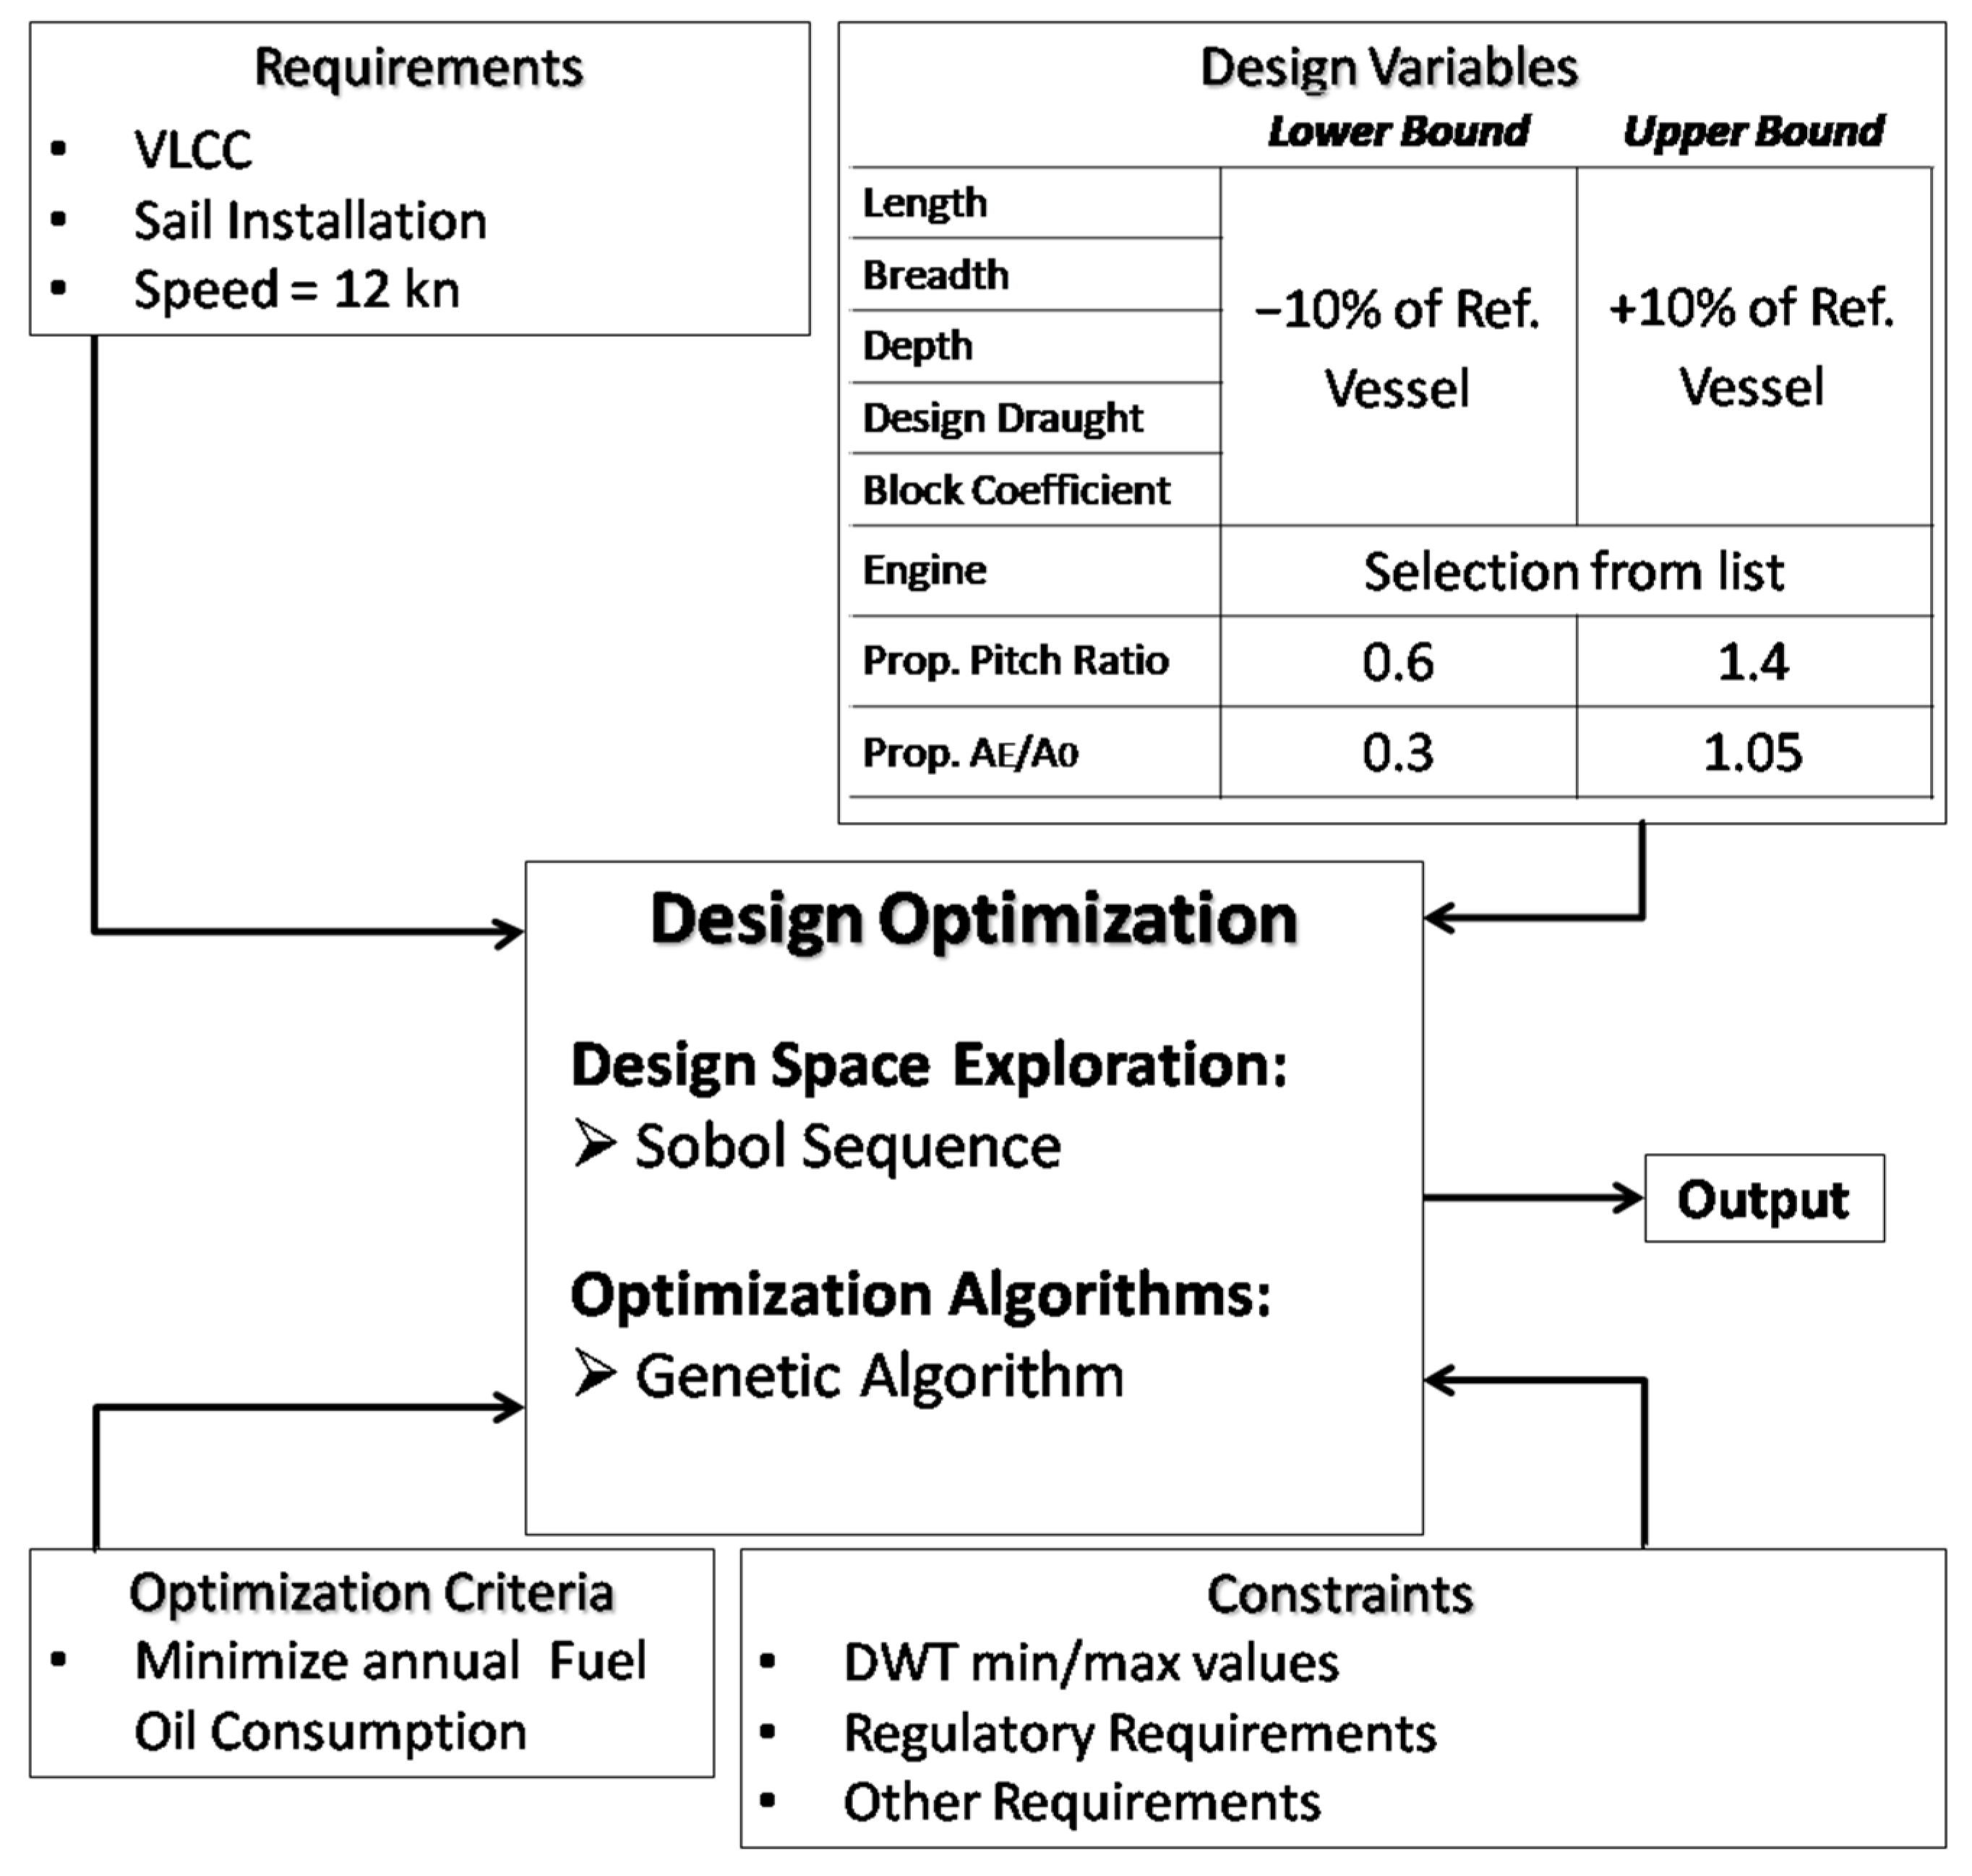
3. Design Optimization Methodology
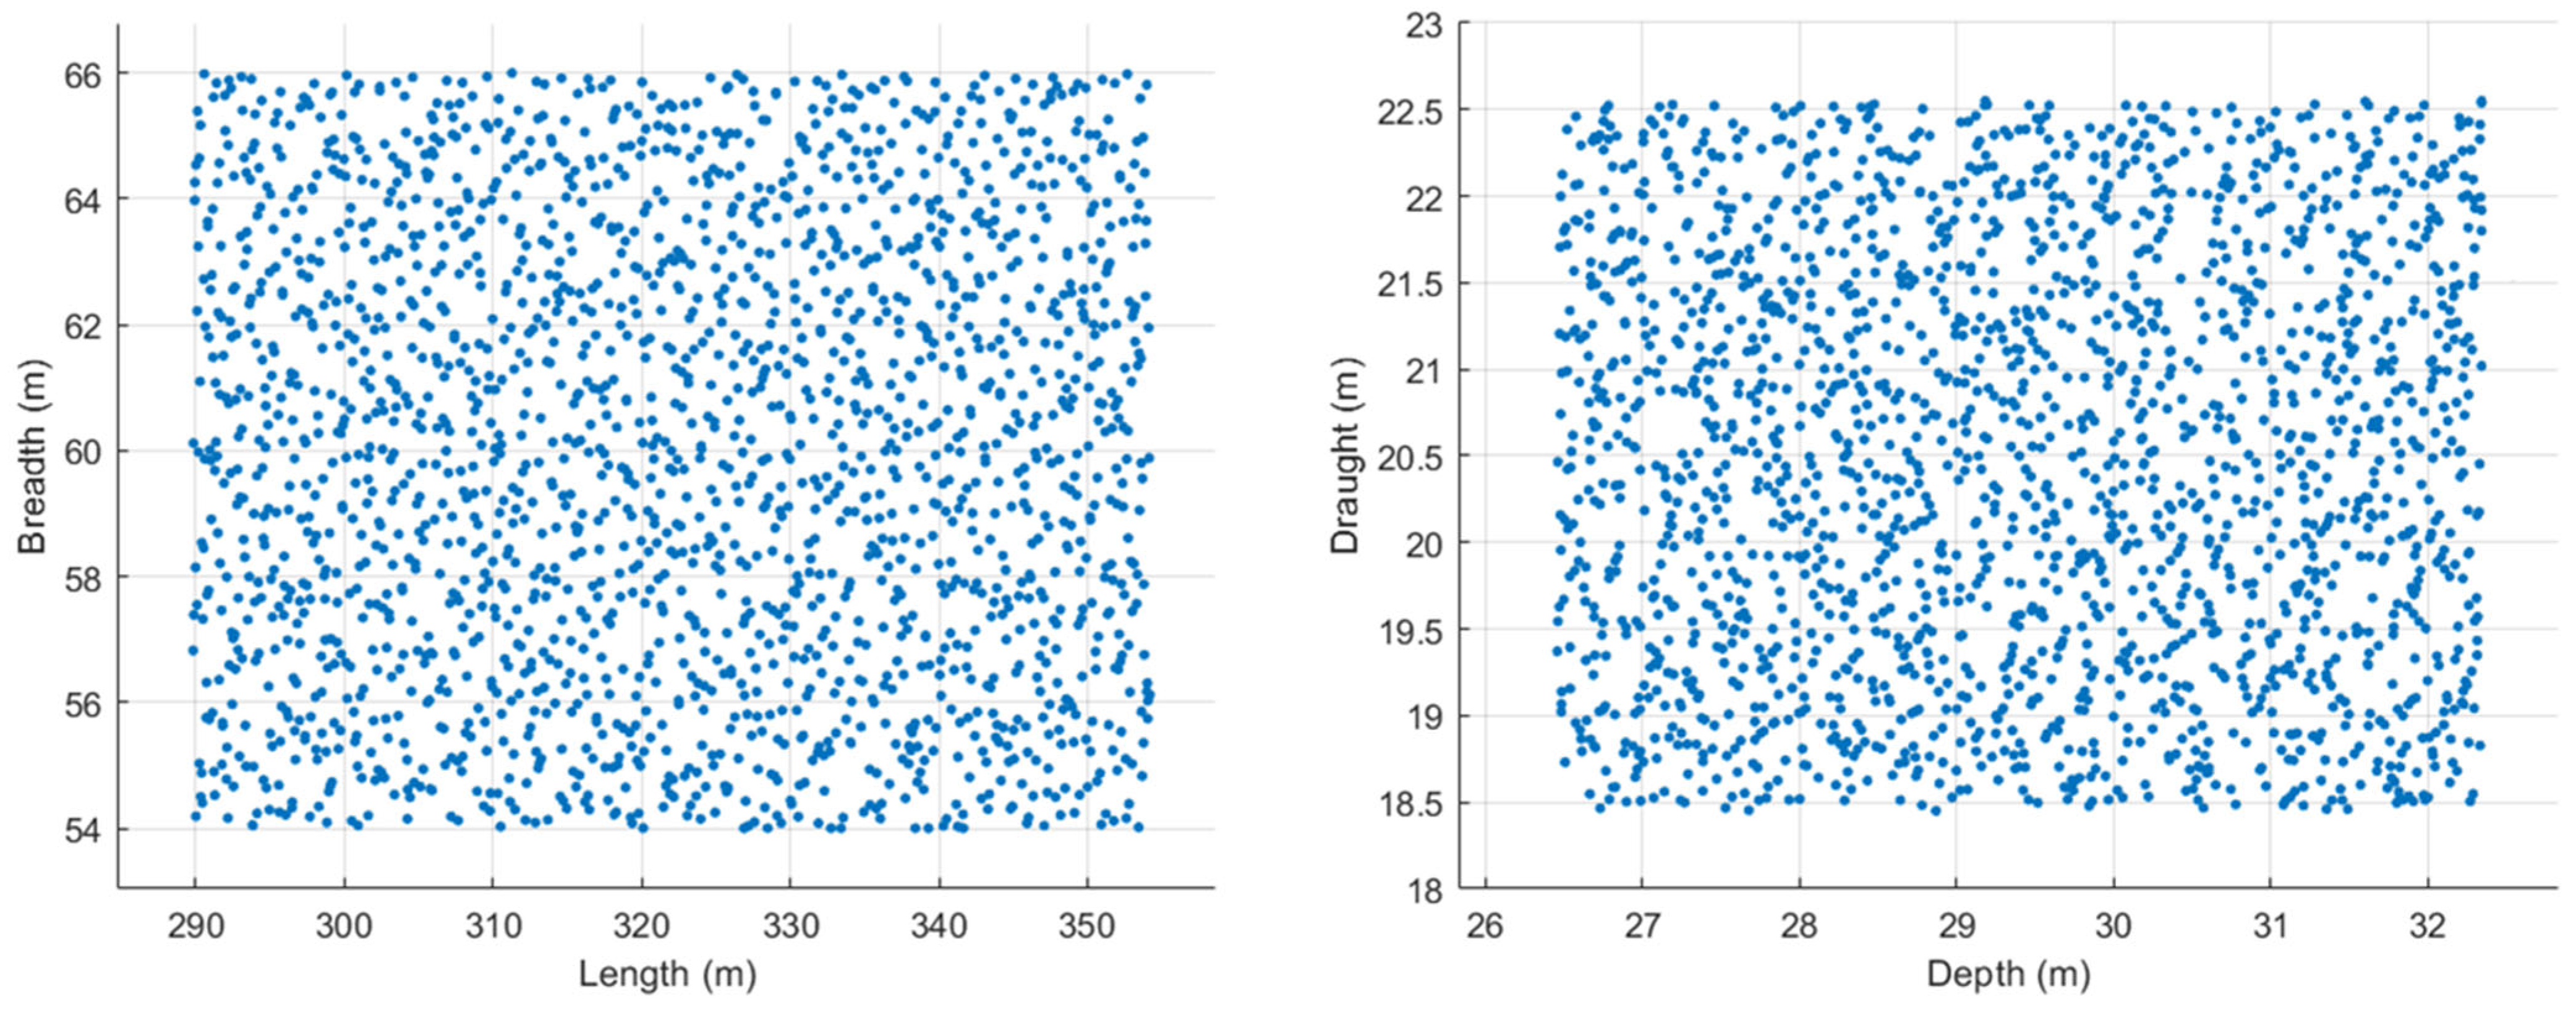
3.1. Design Space Exploration
3.2. Heuristic Optimization Algorithm
4. Implementation
4.1. Design Variables
4.2. Multi-Objective Functions
4.3. Constraints
- Min. DWT ≥ 263,060 tons (−5% from reference vessel);
- Max. DWT ≤ 290,750 tons (+5% from reference vessel);
- Engine limit constraint;
- Less than approximately 5% cavitation at the propeller;
- 0.79 ≤ CB ≤ 0.88;
- 0.992 ≤ CM ≤ 0.996;
- 0.88 ≤ CWL ≤ 0.94;
- 0.835 ≤ CP ≤ 0.855;
- 5.1 ≤ L/B ≤ 6.8;
- 2.4 ≤ B/T ≤ 3.2;
- 10.5 ≤ L/D ≤ 14;
- IMO minimum power requirement;
- Freeboard constraint;
- GM ≥ 3 m;
- 0.2·T ≤ propeller diameter ≤ 0.55·T.
5. Case Study
5.1. Reference Vessel
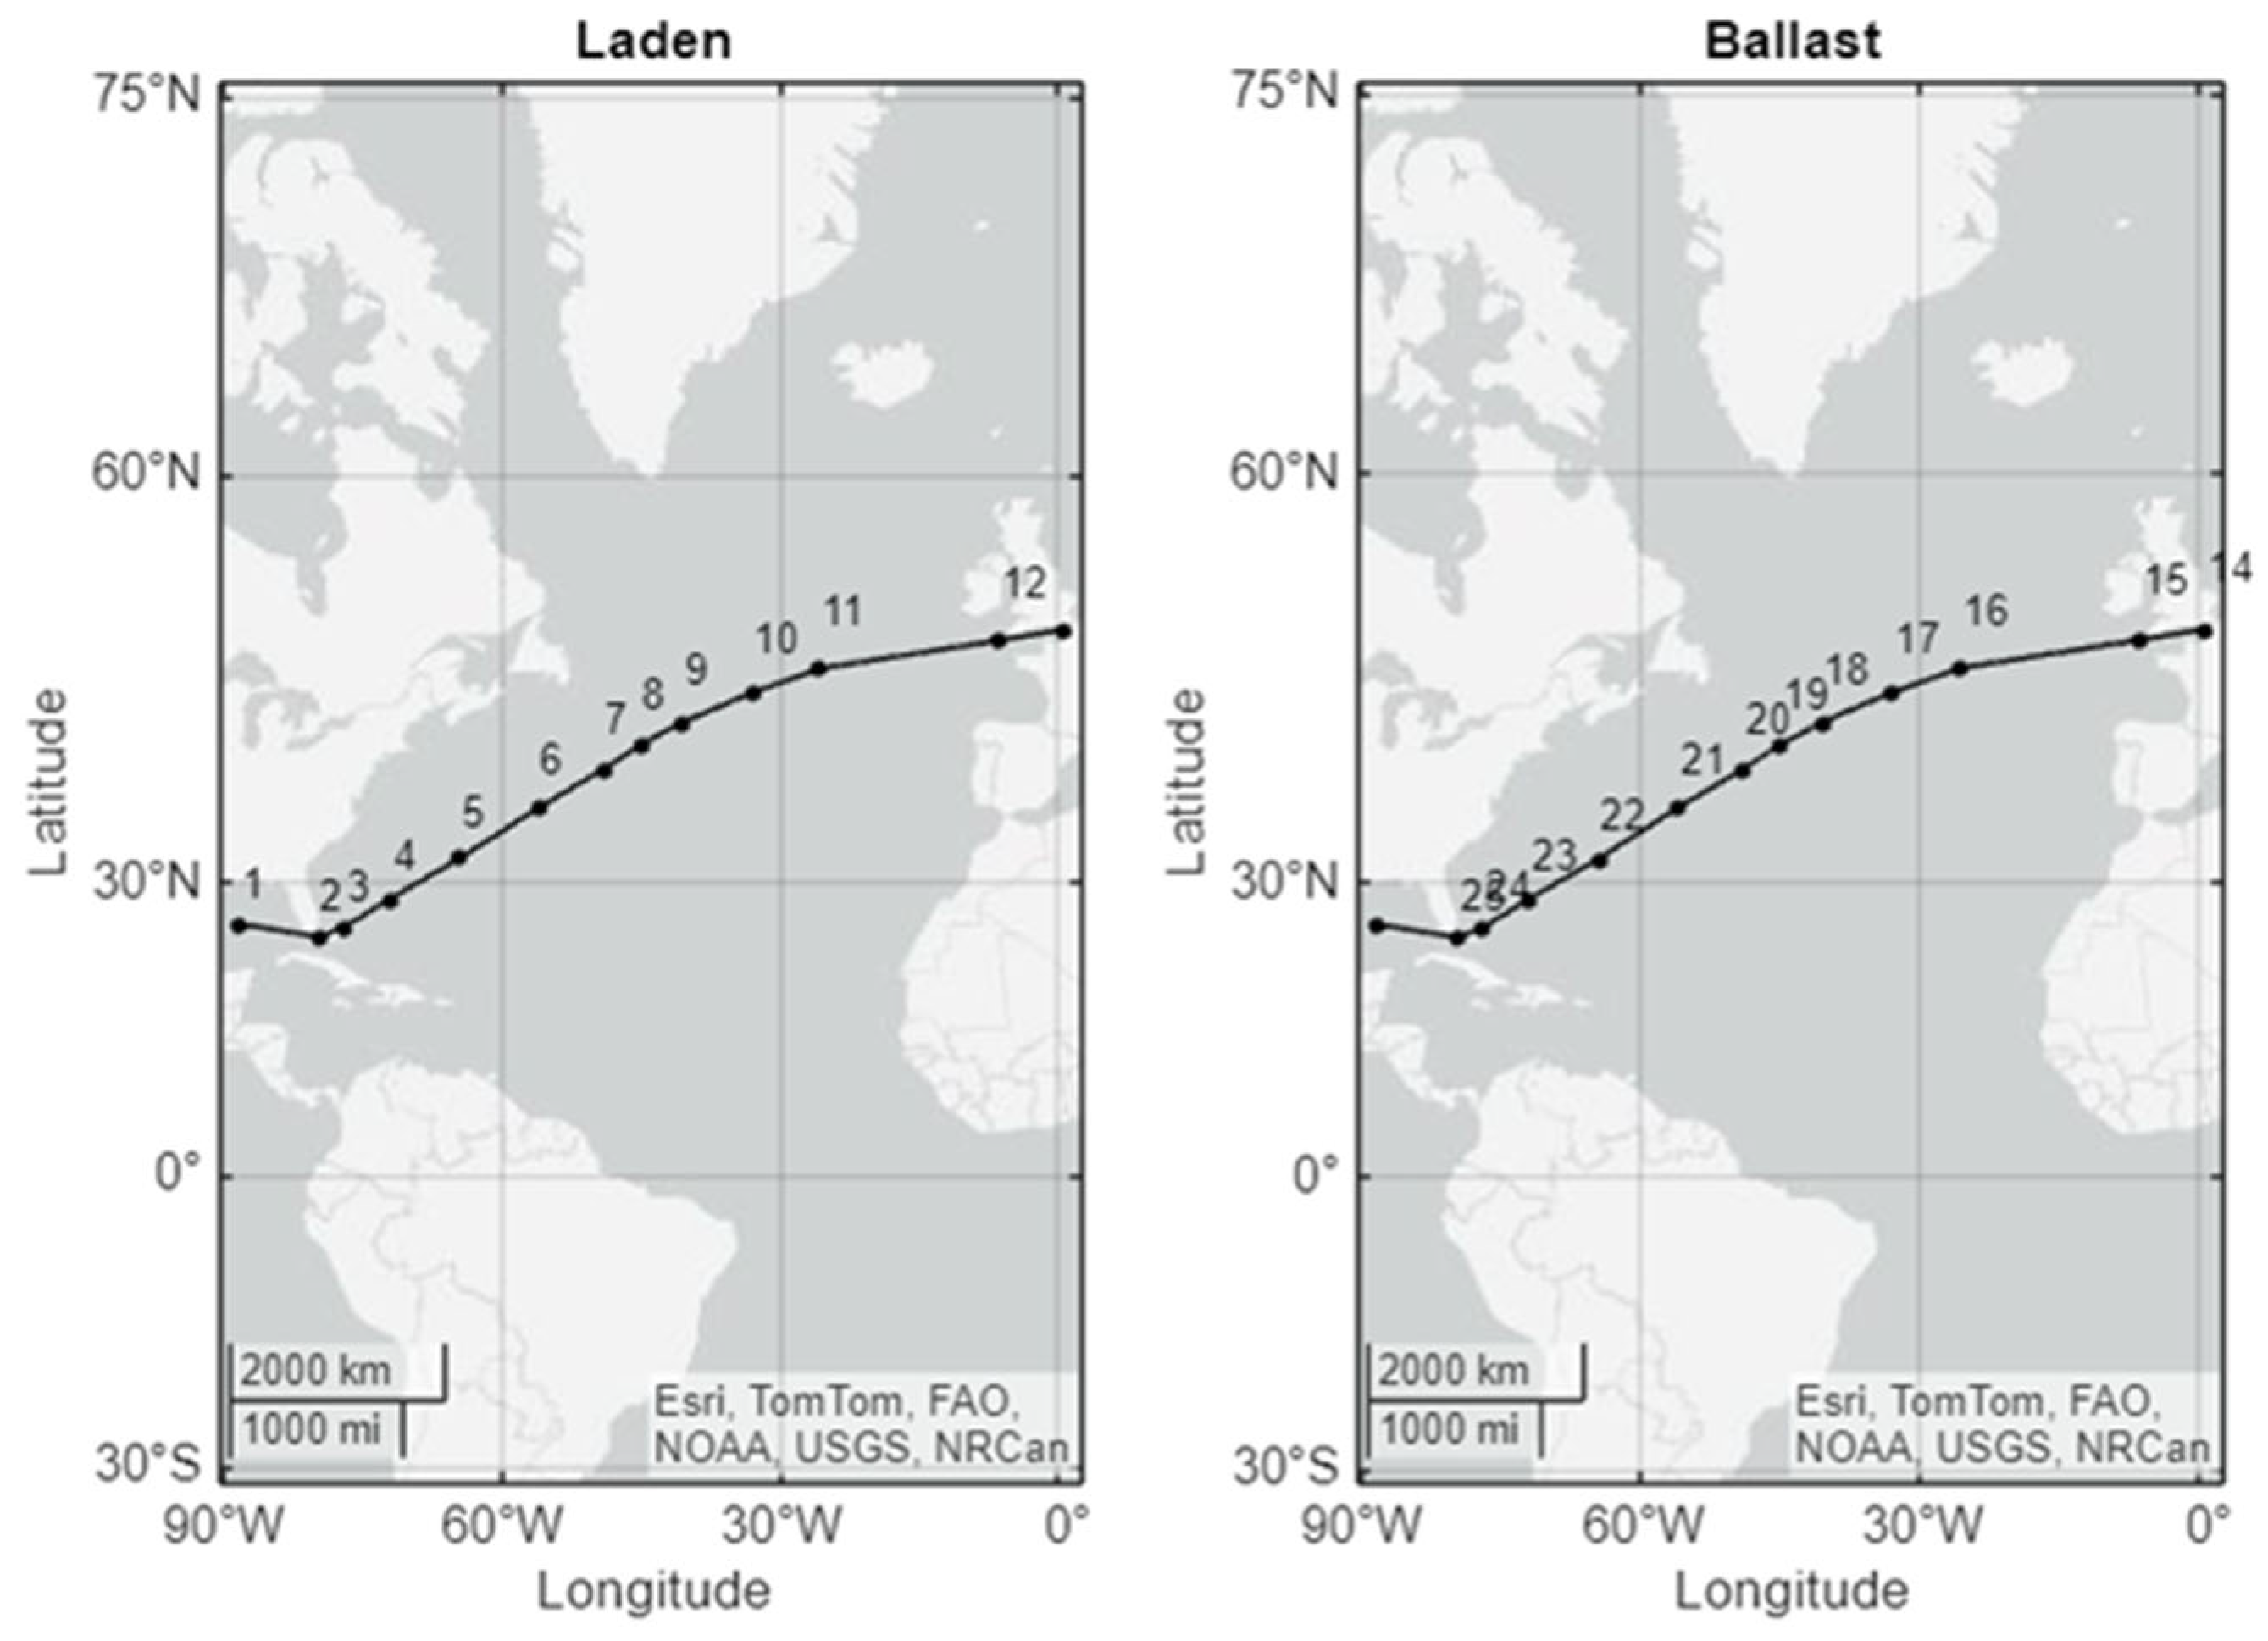
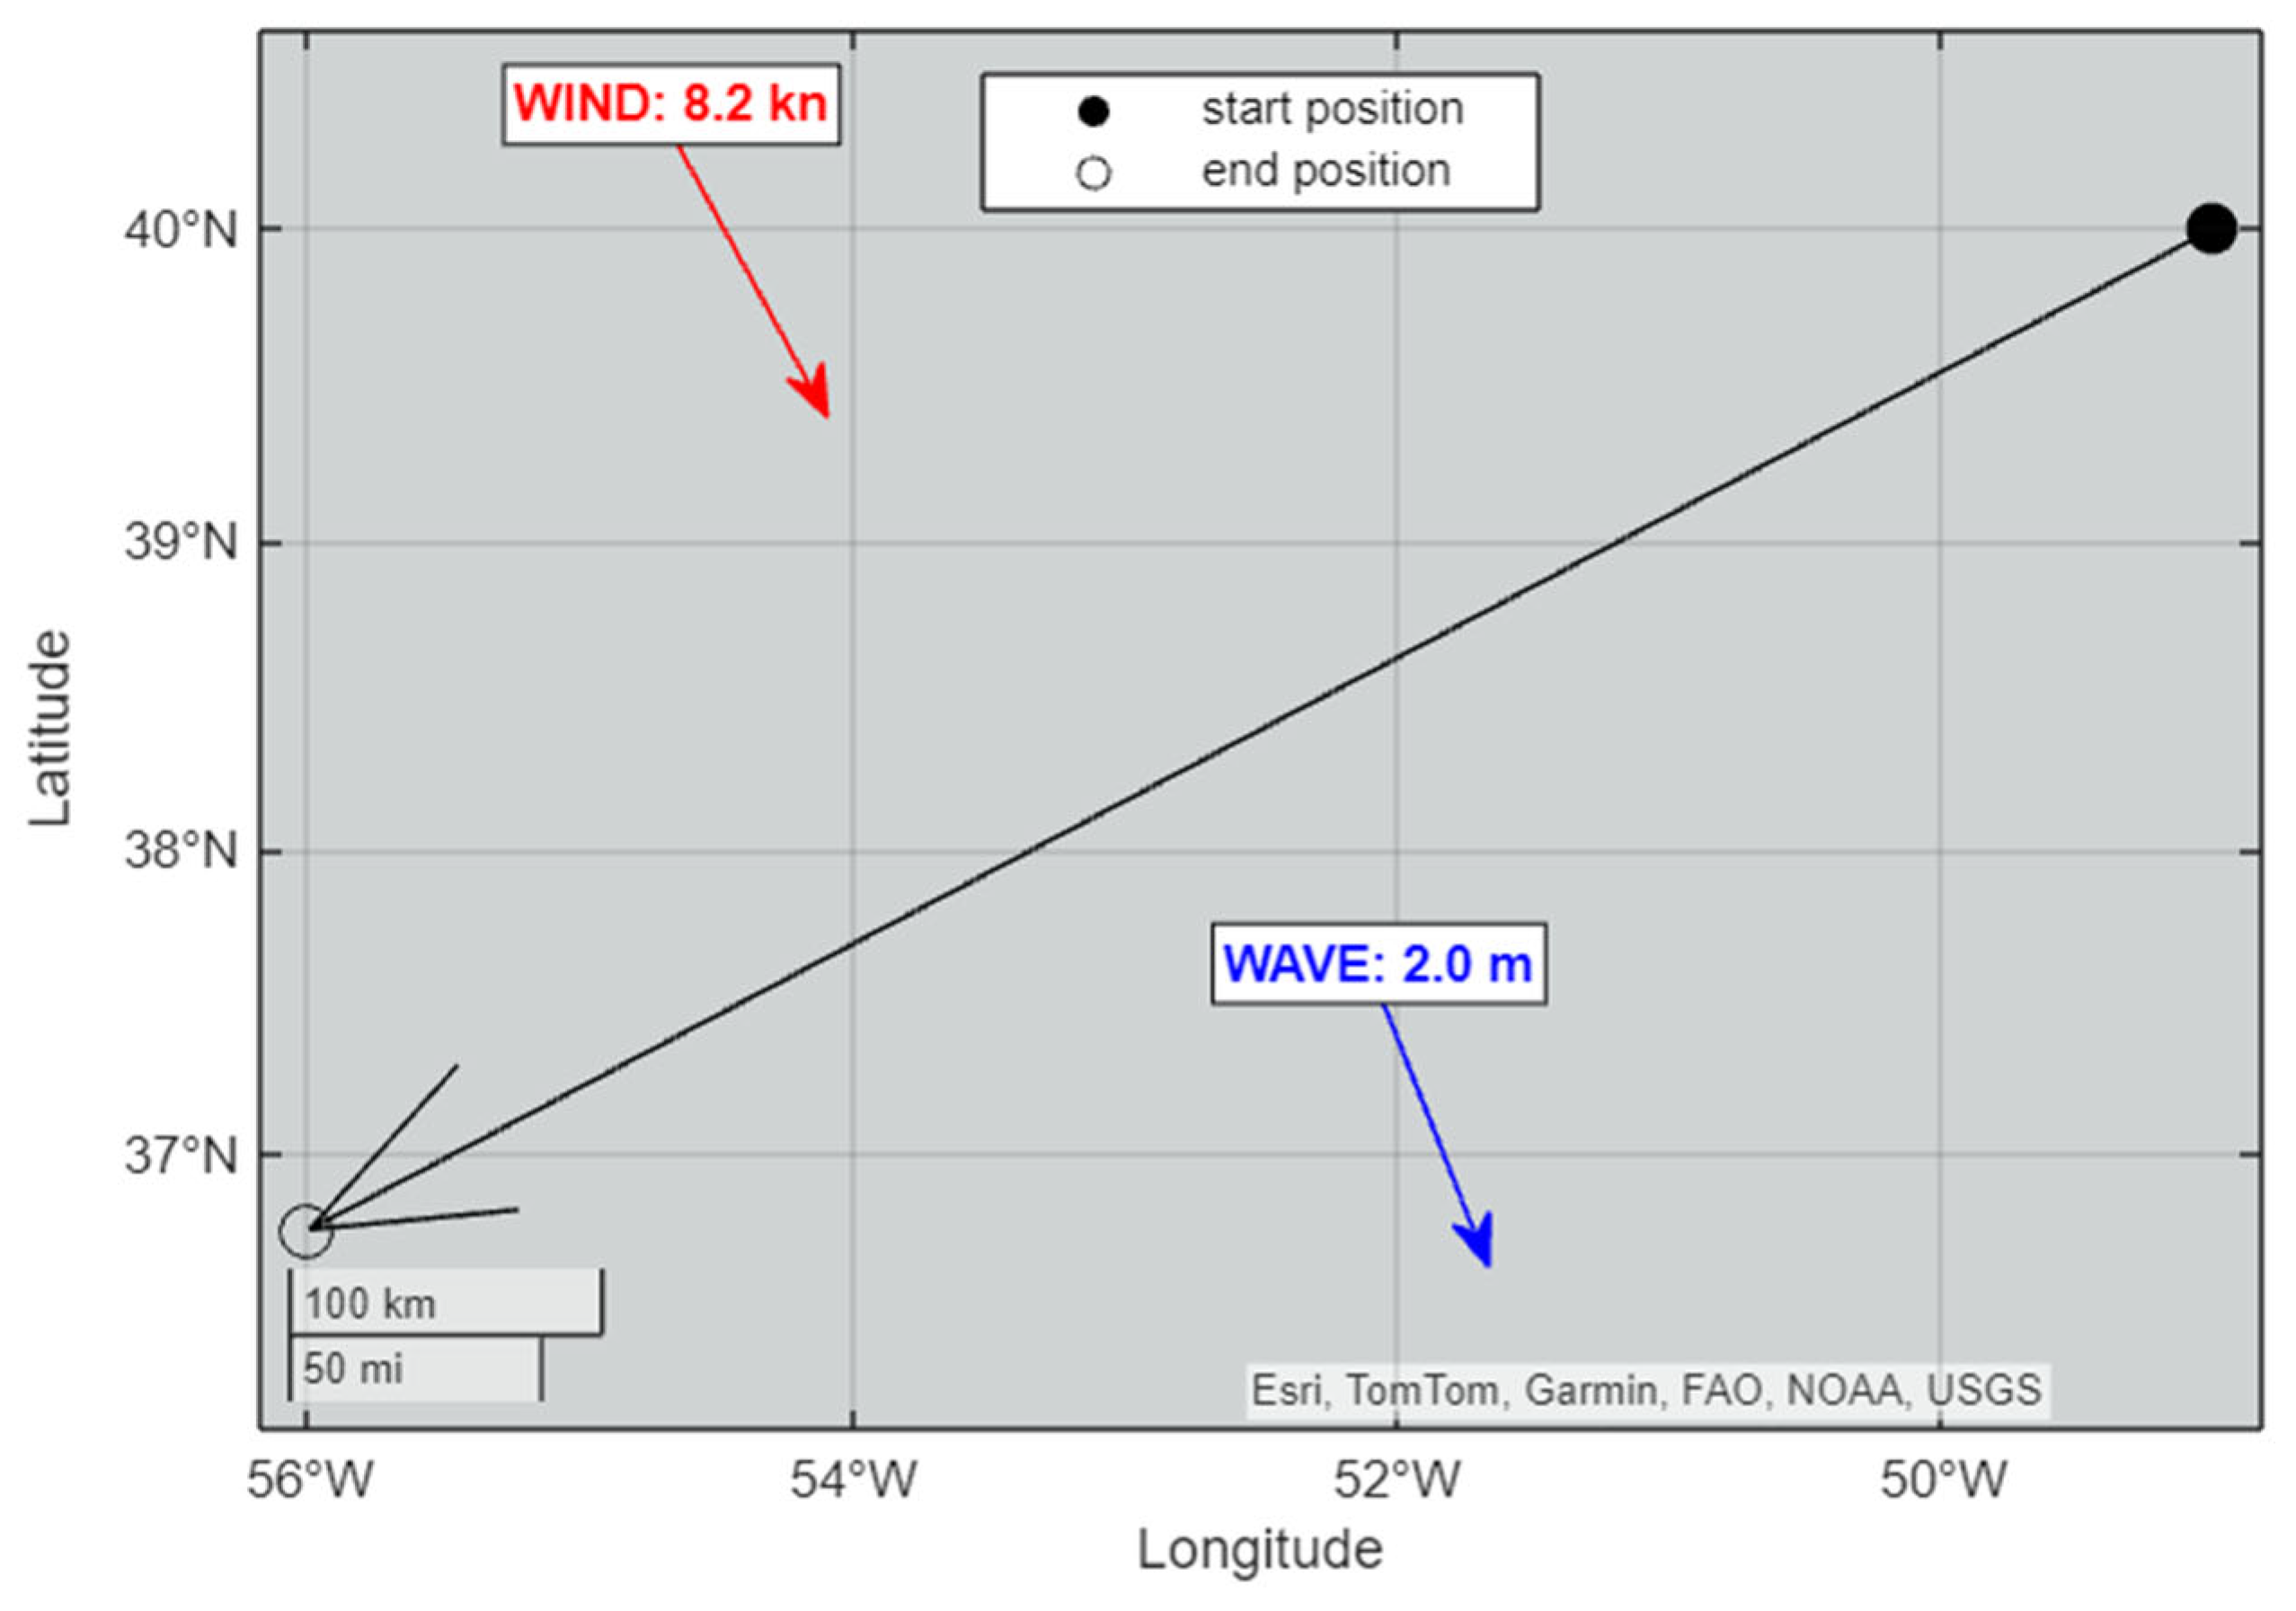
5.2. Selected Route and Weather Characteristics
6. Results
7. Summary and Conclusions
- The optimized VLCC tankers with WAPSs exhibit characteristics significantly different from conventional VLCC designs without WAPSs. Optimized designs tend to be slightly more slender and deeper. The observed design characteristics have a positive effect on sail thrust, as well as on calm water resistance and added wave resistance. These differences are likely to be even more pronounced for smaller vessels or other ship types, particularly when comparing volume carriers versus deadweight carriers.
- The estimated fuel savings (and GHG emissions reduction) and RFR improvement for the VLCC tanker are notable. Compared to the original vessel, multi-optimized designs showed an improvement of approximately 20% in terms of fuel consumption (and associated emissions), and likewise in terms of RFR. While these results may seem optimistic due to the simplified 1-DOF hydrodynamic modeling used, greater savings may be realized by optimizing the route for wind potential and utilizing advanced wing sail technologies, such as the Oceanbird concept, rather than the generic NACA wing profiles used in this study
- Ship design and operational parameters, including main dimensions, engine and propeller characteristics, route, speed, wing sail size/number/arrangement, logistics, and WAPS alternatives, all play a critical role when a ship is fitted with a WAPS. These factors must be integrated into a holistic ship design optimization process.
Author Contributions
Funding
Institutional Review Board Statement
Informed Consent Statement
Data Availability Statement
Acknowledgments
Conflicts of Interest
References
- European Maritime Safety Agency. Potential of Wind-Assisted Propulsion for Shipping; EMSA: Lisbon, Portugal, 2023. [Google Scholar]
- International Maritime Organization. Resolution MEPC.351(78)—2022 Guidelines on Survey and Certification of the Attained Energy Efficiency Existing Ship Index (EEXI); International Maritime Organization: London, UK, 2022. [Google Scholar]
- International Maritime Organization. Resolution MEPC.352(78)—2022 Guidelines on Operational Carbon Intensity Indicators and the Calculation Methods (CII Guidelines, G1); International Maritime Organization: London, UK, 2022. [Google Scholar]
- International Maritime Organization. ResolutionMEPC.364(79), 2022 Guidelines on the Method of Calculation of the Attained Energy Efficiency Design Index (EEDI) for New Ships; International Maritime Organization: London, UK, 2022. [Google Scholar]
- International Windship Association (IWSA). Wind Propulsion: Zero-Emissions Energy Solution for Shipping; IWSA: London, UK, 2024. [Google Scholar]
- Hansen, K.E.; Bloch, M.R.; Jens, O.V. Modern Windships; Technical Report; Pelmatic Knud E. Hansen A/S: Copenhagen, Denmark, 2000. [Google Scholar]
- Bentin, M.; Kotzur, S.; Schlaak, M.; Zastrau, D.; Freye, D. Perspectives for a Wind Assisted Ship Propulsion. Int. J. Marit. Eng. 2018, 160. [Google Scholar] [CrossRef]
- Talluri, L.; Nalianda, D.K.; Giuliani, E. Techno economic and environmental assessment of Flettner rotors for marine propulsion. Ocean. Eng. 2018, 154, 1–15. [Google Scholar] [CrossRef]
- Viola, I.M.; Sacher, M.; Xu, J.; Wang, F. A numerical method for the design of ships with wind-assisted propulsion. Ocean. Eng. 2015, 105, 32–42. [Google Scholar] [CrossRef]
- Ma, R.; Wang, Z.; Wang, K.; Zhao, H.; Jiang, B.; Liu, Y.; Xing, H.; Huang, L. Evaluation Method for Energy Saving of Sail-Assisted Ship Based on Wind Resource Analysis of Typical Route. J. Mar. Sci. Eng. 2023, 11, 789. [Google Scholar] [CrossRef]
- Tillig, F.; Ringsberg, J. A 4 DOF simulation model developed for fuel consumption prediction of ships at sea. Ships and Offshore Structures 2019, 14 (Suppl. S1), S112–S120. [Google Scholar] [CrossRef]
- Lu, R.; Ringsberg, J.W. Ship energy performance study of three wind-assisted ship propulsion technologies including a parametric study of the Flettner rotortechnology. Ships Offshore Struct. 2019, 15, 249–258. [Google Scholar] [CrossRef]
- Guzelbulut, C.; Badalotti, T.; Suzuki, K. Optimization techniques for the design of crescent-shaped hard sails for wind-assisted ship propulsion. Ocean. Eng. 2024, 312, 119142. [Google Scholar] [CrossRef]
- Hao, Z.; Ouyang, X.; Chen, J.; Wu, W.; Chen, L.; Feng, Y. Multiobjective optimization of low-speed sail-assisted VLCC performance. Ocean. Eng. 2024, 312 Pt 1, 119327. [Google Scholar] [CrossRef]
- Plessas, T.; Papanikolaou, A. Optimization of Ship Design for the Effect of Wind Propulsion. In Proceedings of the 15th International Marine Design Conference (IMDC-2024), Amsterdam, The Netherlands, 2–6 June 2024. [Google Scholar]
- MATLAB. Mathworks. 2024. Available online: www.mathworks.com (accessed on 1 July 2024).
- Papanikolaou, A.; Fournarakis, N.; Chroni, D.; Liu, S.; Plessas, T.; Sprenger, F. Simulation of the Maneuvering Behavior of Ships in Adverse Weather Conditions. In Proceedings of the 31st Symposium on Naval Hydrodynamics, Monterey, CA, USA, 11–16 September 2016. [Google Scholar]
- NAPA. 2024. Available online: www.napa.fi (accessed on 1 July 2024).
- Werner, S.; Kuttenkeuler, J.; Hörteborn, A. Route Evaluation Methods for Long-Distance Sailing Vessel Performance Predictions. In Proceedings of the 7th High Performance Yacht Design Conference, Auckland, New Zealand, 11–12 March 2021. [Google Scholar]
- ORCELLE (2023–2027) European Union/HORIZON CL-5, contract number 101096673. Available online: https://cordis.europa.eu/project/id/101096673 (accessed on 1 July 2024).
- Abbott, I.H.; VonDoenhoff, A.E. Theory of Wing Sections; Dover Publications: New York, NY, USA, 1959. [Google Scholar]
- Oceanbird. 2024. Available online: www.theoceanbird.com (accessed on 1 July 2024).
- Malmek, K.; Dhome, U.; Larsson, L.; Werner, S.; Ringsberg, J.W.; Finnsgard, C. Comparison of Two Rapid Numerical Methods for Predicting the Performance of Multiple Rigid Wing-Sails. In Proceedings of the 5th INNOV’SAIL Conference, Gothenburg, Sweden, 15–17 June 2020. [Google Scholar]
- Bordogna, G.; Keuning, J.A.; Huijsmans, R.H.M.; Belloli, M. Wind-tunnel experiments on the aerodynamic interaction between two rigid sails used for wind-assisted propulsion. Int. Shipbuild. Prog. 2018, 65, 93–125. [Google Scholar] [CrossRef]
- Gypa, I.; Jansson, M.; Gustafsson, R.; Werner, S.; Bensow, R. Controllable-pitch propeller design process for a wind-powered car-carrier optimising for total energy consumption. Ocean. Eng. 2023, 269, 113426. [Google Scholar] [CrossRef]
- Holtrop, J.; Mennen, G.G.J. An Approximate Power Prediction Method. Int. Shipbuild. Prog. 1982, 29, 166–170. [Google Scholar] [CrossRef]
- Holtrop, J. A statistical Re-Analysis of Resistance and Propulsion Data. Int. Shipbuild. Prog. 1984, 31, 363. [Google Scholar]
- Liu, S.; Papanikolaou, A. Regression analysis of experimental data for added resistance in waves of arbitrary heading and development of a semi-empirical formula. Ocean. Eng. 2020, 206, 107357. [Google Scholar] [CrossRef]
- ISO15016; Ships and Marine Technology—Guidelines for the Assessment of Speed and Power Performance by Analysis of Speed Trial Data. International Organization for Standardization: Geneva, Switzerland, 2015.
- Reche-Vilanova, M.; Bingham, H.B.; Psaraftis, H.N.; Fluck, M.; Morris, D. Preliminary Study on the Propeller and Engine Performance Variation with Wind Propulsion Technologies. In Proceedings of the WindPropulsion Conference 2023, London, UK, 16–17 February 2023. [Google Scholar]
- Lammeren, W.P.A.; van Manen, J.D.; Oosterveld, M.W.C. The Wageningen B-screw series. Trans. SNAME 1969, 269. [Google Scholar]
- Oosterveld, M.W.C.; Van Oossanen, P. Further computer-analyzed data of the Wageningen B-screw series. Int. Shipbuild. Prog. 1975, 22, 251–262. [Google Scholar] [CrossRef]
- Carlton, J.S. Marine Propellers and Propulsion, Butterworth-Heinemann; Elsevier: Amsterdam, The Netherlands, 2007. [Google Scholar]
- Papanikolaou, A. Holistic Ship Design Optimization. J. Comput.-Aided Des. 2010, 42, 1028–1044. [Google Scholar] [CrossRef]
- Papanikolaou, A. (Ed.) A Holistic Approach to Ship Design | Volume 1: Optimisation of Ship Design and Operation for Life Cycle; Springer: Berlin/Heidelberg, Germany, 2019. [Google Scholar]
- Bratley, P.; Fox, B.L. Algorithm 659 Implementing Sobol’s Quasi random Sequence Generator. ACM Trans. Math. Softw. 1988, 14, 88–100. [Google Scholar] [CrossRef]
- Agushaka, J.O.; Ezugwu, A.E. Initialisation Approaches for Population-Based Metaheuristic Algorithms: A Comprehensive Review. Appl. Sci. 2022, 12, 896. [Google Scholar] [CrossRef]
- Papanikolaou, A. Ship Design Methodologies of Preliminary Design; Springer: Berlin/Heidelberg, Germany, 2014. [Google Scholar]
- Burrill, L.C.; Emerson, A. Propeller cavitation: Further tests on 16 in. propeller models in the King’s College Cavitation Tunnel. Trans. NECIES 1963, 10, 119–131. [Google Scholar] [CrossRef]
- International Maritime Organization. Convention on Load Lines; International Maritime Organization: London, UK, 1966. [Google Scholar]
- International Maritime Organization. Guidelines for Determining Minimum Propulsion Power to Maintain the Manoeuvrability of Ships in Adverse Conditions; MEPC.1/Circ.850/Rev.3, 2021; International Maritime Organization: London, UK, 2021. [Google Scholar]
- StormGeo, Bergen, Norway. 2024. Available online: www.stormgeo.com (accessed on 1 July 2024).
- Hersbach, H.; Bell, B.; Berrisford, P.; Hirahara, S.; Horányi, A.; Muñoz-Sabater, J.; Nicolas, J.; Peubey, C.; Radu, R.; Schepers, D.; et al. The ERA5 global reanalysis. Q. J. R. Meteorol. Soc. 2020, 146, 1999–2049. [Google Scholar] [CrossRef]
- Werner, S.; Papanikolaou, A.; Razola, M.; Fagergren, C.; Dessen, L.; Kuttenkeuler, J.; Santen, V.; Steinbach, C. The Orcelle project—Towards Wind-Powered Ships for Deep Sea Cargo Transport. In Proceedings of the SNAME Maritime Convention 2023, San Diego, CA, USA, 27–29 September 2023. [Google Scholar]
- Kanellopoulou, A. Parametric Ship Design and Optimization. Ph.D. Thesis, National Technical University of Athens, Athens, Greece, July 2023. [Google Scholar]
- HOLISHIP (2016-2020), HORIZON 2020—EU funded project, Grant Agreement n° 689074. Available online: http://www.holiship.eu/ (accessed on 1 July 2024).


| Length B.P. | 322.00 m |
| Breadth Mld. | 60.00 m |
| Depth Mld. | 29.40 m |
| Design Draught | 20.50 m |
| CB | 0.796 |
| RFR (USD/ton cargo) | 8.27 |
| Annual Fuel Cons. (tons) | 13,253 |
| L (m) | B (m) | D (m) | T (m) | CB | CM | Engine MCR (kW) | P/D | AE/A0 | Annual Fuel Cons. (Tons) | RFR (USD/Ton Cargo) |
|---|---|---|---|---|---|---|---|---|---|---|
| 327.22 | 56.63 | 28.96 | 21.57 | 0.789 | 0.998 | 29,286 | 0.766 | 0.612 | 10,466.4 | 7.5 |
| 327.86 | 56.97 | 26.99 | 21.99 | 0.803 | 0.998 | 29,286 | 0.705 | 0.592 | 11,014.5 | 7.3 |
| 327.79 | 56.92 | 27.01 | 21.99 | 0.801 | 0.998 | 29,286 | 0.746 | 0.592 | 10,939.2 | 7.3 |
| 327.37 | 56.66 | 28.79 | 21.71 | 0.789 | 0.998 | 29,286 | 0.757 | 0.596 | 10,508.1 | 7.5 |
| 327.39 | 56.64 | 28.79 | 21.85 | 0.789 | 0.998 | 29,286 | 0.757 | 0.596 | 10,539.0 | 7.4 |
| 327.59 | 56.85 | 26.98 | 21.98 | 0.798 | 0.998 | 29,286 | 0.752 | 0.59 | 10,855.8 | 7.3 |
| 327.64 | 56.64 | 28.56 | 21.93 | 0.79 | 0.998 | 29,286 | 0.762 | 0.597 | 10,592.5 | 7.4 |
| 327.61 | 56.66 | 27.12 | 21.93 | 0.79 | 0.998 | 29,286 | 0.757 | 0.593 | 10,644.1 | 7.4 |
| 327.61 | 56.76 | 27.07 | 21.98 | 0.795 | 0.998 | 29,286 | 0.739 | 0.593 | 10,780.2 | 7.3 |
| 327.65 | 56.75 | 27.13 | 21.98 | 0.793 | 0.998 | 29,286 | 0.75 | 0.595 | 10,737.5 | 7.3 |
| 327.43 | 56.72 | 27.28 | 21.91 | 0.793 | 0.998 | 29,286 | 0.759 | 0.593 | 10,698.8 | 7.4 |
| 327.43 | 56.66 | 28.21 | 21.86 | 0.789 | 0.998 | 29,286 | 0.758 | 0.596 | 10,568.4 | 7.4 |
| 327.59 | 56.88 | 27.13 | 21.99 | 0.8 | 0.998 | 29,286 | 0.726 | 0.593 | 10,910.7 | 7.3 |
| 327.32 | 56.63 | 28.86 | 21.66 | 0.789 | 0.998 | 29,286 | 0.761 | 0.601 | 10,486.9 | 7.5 |
| 327.63 | 56.61 | 28.73 | 21.6 | 0.789 | 0.998 | 29,286 | 0.777 | 0.599 | 10,480.1 | 7.5 |
| 327.64 | 56.65 | 28.2 | 21.94 | 0.791 | 0.998 | 29,286 | 0.756 | 0.596 | 10,626.7 | 7.4 |
| 327.71 | 56.86 | 26.99 | 21.98 | 0.799 | 0.998 | 29,286 | 0.744 | 0.591 | 10,881.7 | 7.3 |
| 327.78 | 56.76 | 27.04 | 21.99 | 0.796 | 0.998 | 29,286 | 0.746 | 0.592 | 10,801.8 | 7.3 |
Disclaimer/Publisher’s Note: The statements, opinions and data contained in all publications are solely those of the individual author(s) and contributor(s) and not of MDPI and/or the editor(s). MDPI and/or the editor(s) disclaim responsibility for any injury to people or property resulting from any ideas, methods, instructions or products referred to in the content. |
© 2025 by the authors. Licensee MDPI, Basel, Switzerland. This article is an open access article distributed under the terms and conditions of the Creative Commons Attribution (CC BY) license (https://creativecommons.org/licenses/by/4.0/).
Share and Cite
Plessas, T.; Papanikolaou, A. Multi-Objective Optimization of Ship Design for the Effect of Wind Propulsion. J. Mar. Sci. Eng. 2025, 13, 167. https://doi.org/10.3390/jmse13010167
Plessas T, Papanikolaou A. Multi-Objective Optimization of Ship Design for the Effect of Wind Propulsion. Journal of Marine Science and Engineering. 2025; 13(1):167. https://doi.org/10.3390/jmse13010167
Chicago/Turabian StylePlessas, Timoleon, and Apostolos Papanikolaou. 2025. "Multi-Objective Optimization of Ship Design for the Effect of Wind Propulsion" Journal of Marine Science and Engineering 13, no. 1: 167. https://doi.org/10.3390/jmse13010167
APA StylePlessas, T., & Papanikolaou, A. (2025). Multi-Objective Optimization of Ship Design for the Effect of Wind Propulsion. Journal of Marine Science and Engineering, 13(1), 167. https://doi.org/10.3390/jmse13010167