Abstract
Oil spills pose significant threats to marine ecosystems, and while existing tools simulate spill dispersion and predict impacts, they often lack full integration of accident specifics, detailed drift simulations, and thorough impact analyses. This paper presents the EcoSensitivity decision support system, a comprehensive platform designed to improve oil spill responses by integrating immediate and cumulative environmental impact assessments. The EcoSensitivity system addresses these gaps by combining the Accidental Damage and Spill Assessment Model (ADSAM), oil drift modeling, and the PlanWise4Blue (PW4B) application, which enables high-resolution cumulative impact assessments. This unified tool provides decision-makers with rapid, data-driven insights, facilitating a more informed and effective response to oil spills. EcoSensitivity represents a substantial advancement in operational modeling, supporting ecosystem resilience and aiding in strategic planning for marine conservation.
1. Introduction
Oil spills are among the most destructive environmental incidents, with profound impacts on marine ecosystems, coastlines, and socio-economic activities [1]. When oil enters marine environments, it disrupts habitats, degrades water quality, and poses long-term threats to marine biodiversity and ecological health [2,3,4]. Oil impacts marine and coastal ecosystems through smothering, toxicity, and habitat alteration, causing increased mortality, reduced fitness, and changes in community structure and function [1,5].
A global analysis of oil spills reveals that most are concentrated near coastlines and shipping routes, with anthropogenic sources being overwhelmingly responsible, and have likely been underestimated [6]. High-profile incidents like the Exxon Valdez spill in 1989 and the Deepwater Horizon spill in 2010 have highlighted the shortcomings in oil spill management, which has struggled to achieve environmental sustainability [7,8]. Advancements in ship design and safety protocols have led to significant improvements, with statistics revealing a 71.7% and 43.75% reduction in medium- and large-scale oil spills, respectively, between 2010 and 2019 compared to the period between the years 2000 and 2009 [9]. Despite the decrease in incident frequency over recent decades, the challenges of mitigating and remediating oil spills persist [10]. Decision-makers often lack the necessary knowledge and time to protect all critical and vulnerable natural areas, emphasizing the urgent need for effective response strategies to mitigate environmental damage and support ecosystem recovery [3,11,12,13,14,15].
Oil spill response is a highly complex and cross-disciplinary process, requiring swift decision-making under emergency conditions. This involves assessing the type of oil spilled, its weathering and biodegradation, and the unique environmental sensitivities of affected regions [16,17]. Effective response planning must consider the local ecosystem’s vulnerability and the efficiency of the available cleanup technologies [4]. To minimize environmental damage, offshore responses aim to address spills close to the source. If an offshore response is impractical, nearshore strategies focus on containing and recovering oil, preventing it from reaching sensitive coastal zones, or redirecting it to less vulnerable areas [18]. If these measures fail, shoreline responses involve recovering oil onshore, along with natural attenuation, biological, and chemical treatments to mitigate environmental harm [17]. Due to the distributed nature of oil spill response operations, multiple stakeholders and agencies coordinate to address environmental and logistical challenges, often requiring cooperation across borders [19].
The immediate focus of emergency oil spill response includes predicting spill trajectory and short-term environmental impacts to guide tactical response actions, with most tools concentrating on oil weathering, transport, and acute ecosystem impacts [20]. Some response systems also incorporate factors such as oil occurrence and shoreline management [21]. Timely decision-making aims to mitigate environmental and socioeconomic damage by selecting response strategies that effectively reduce spill impacts. When oil spreads in coastal regions, cleanup efforts typically become more complex and expensive compared to offshore spills [22]. Here, Environmental Sensitivity Index (ESI) maps play a critical role, offering responders essential information on ecological and human-use sensitivities to guide rapid response and minimize harm [23,24,25,26].
Recent advancements in technology have enabled the development of web-based tools that significantly enhance oil spill responses and mitigation efforts. These tools are designed to simulate spill events, track oil dispersion, and predict the environmental impacts on sensitive ecosystems. By integrating real-time data with predictive models, they provide rapid insights for decision-makers and responders. Widely used models include OSCAR, SIMAP, GNOME, MEDSLIK-II, and ADIOS, each offering unique capabilities but also exhibiting specific limitations [27]. OSCAR offers comprehensive 3D simulations and advanced weathering capabilities like biodegradation, which makes it highly effective for both operational response and long-term risk assessment. However, some oil weathering processes, such as photo-oxidation and advanced biodegradation kinetics, may require further refinement [27]. SIMAP [28,29,30] simulates the three-dimensional trajectory, fate, and transport of spilled oil and fuels, [29], but lacks the advanced sedimentation and biodegradation processes seen, for example, in the OSCAR model [27]. GNOME is open-source and freely available, making it accessible for operational oil spill forecasting and academic purposes. GNOME stands out for its operational flexibility, real-time data integration, and backward spill tracking [27,31,32]. Its integration with TAMOC for subsurface blowouts and its user accessibility through NOAA tools make it a strong contender. However, GNOME’s limited handling of advanced weathering processes and lack of biological impact assessments distinguish it from more comprehensive models like OSCAR and SIMAP. In addition, while GNOME includes shoreline interaction, it has limited capabilities for simulating sedimentation processes and complex oil–ice interactions, which are covered in models like SIMAP [27]. MEDSLIK-II is effective for surface oil transport and vertical mixing but does not simulate biodegradation or complex sedimentation. Lastly, ADIOS is ideal for short-term (typically 1–2 days) spill response, offering rapid forecasts of weathering processes and quick insights for emergency response teams. ADIOS features a comprehensive oil database that includes the physical and chemical properties of numerous oil types, which simplifies the estimation of oil behaviors such as evaporation rates and viscosity changes. However, its limitations in 3D transport modeling, subsurface spill simulations, and advanced weathering processes make it less versatile compared to models like OSCAR or SIMAP [27]. In addition, the Response Options Calculator (ROC) and the Readiness Evaluation Tool for Oil Spills (RETOS™) support strategic planning by evaluating response options and readiness levels [33]. Seatrack Web and the Next-Generation Smart Response Web (NG-SRW) are operational tools that utilize oceanographic data, weather patterns, and environmental sensitivity indices to forecast oil spill trajectories in a quasi-real-time dynamic, facilitating timely and targeted response strategies [34]. Although SIMAP and OSCAR surpass other tools in their ability to evaluate the biological and environmental impacts of oil spills, their assessments are largely confined to model-predicted estimates of oiled wildlife, including fish, birds, and marine mammals. However, they do not provide predictions about the expected fate of populations and habitats in the affected area.
Despite these advancements, existing applications lack comprehensive integration of three critical elements: specifics of maritime accidents, detailed oil drift simulations, and thorough environmental impact analyses. The latter is often limited to Environmental Sensitivity Index maps, which leave users without detailed information on various natural assets in the region [10] and on how specific nature assets respond to oil spills, especially when considering additional pressures in the same area. The limited integration of these components results in significant knowledge and response gaps. Addressing these gaps requires the development of more holistic tools that combine precise accident data, predictive oil spill modeling, and localized impact assessments to improve response strategies and environmental resilience.
Recently, the PlanWise4Blue (PW4B, https://gis.sea.ee/bluebiosites/ (accessed on 23 December 2024)) application was developed as a data-driven decision support tool designed for cumulative impact assessments [35]. PW4B provides users with critical insights into how multiple human-induced pressures, such as oil spills and other stressors, interact within marine ecosystems. The tool integrates marine spatial use with advanced environmental asset modeling to predict both individual and cumulative impacts of human activities on a wide range of ecosystem assets and their associated ecosystem services. Unlike many cumulative impact tools that rely primarily on expert judgment, PW4B employs data-driven approaches. This is made possible by the substantial body of scientific literature that has emerged in recent decades, examining both the individual and interactive effects of multiple pressures on diverse ecosystem assets and services. This approach enables the inclusion of more complex and realistic responses to various pressures. While some impact coefficients still depend on expert judgment, PW4B is designed to increasingly integrate empirical data as they become available, enhancing its accuracy and reliability over time. One of PW4B’s notable strengths is its high-resolution predictive capability, with spatial granularity at 1 km2. By incorporating extensive empirical data from multiple sources, PW4B supports evidence-based marine spatial planning, enabling stakeholders to anticipate and mitigate cumulative impacts effectively [36].
In this paper, we present the innovative EcoSensitivity decision support system collaboratively developed by the authors. This system integrates the Accidental Damage and Spill Assessment Model (ADSAM), the Seatrack Web (STW) model for oil drift simulation, and the PW4B tool to perform comprehensive environmental impact assessments of oil spills. This unified, user-friendly, web-based tool streamlines various components of oil spill emergency responses, providing a more cohesive and informed approach to managing oil spill incidents. The EcoSensitivity app aims to improve decision-making by accounting for both immediate and cumulative environmental impacts, a capability previously unattainable in operational modeling.
2. EcoSensitivity Framework: Integrated Applications for Oil Spill Impact Assessment
The EcoSensitivity tool integrates three specialized applications, ADSAM, STW, and PW4B, to provide comprehensive environmental impact assessments related to oil spills (Figure 1). These applications, each serving a unique purpose within the broader oil spill response framework, are integrated into a shared SQL-based GIS database, enabling seamless data flow and consistent access across the platform. Each component is structured as a Model–View–Controller (MVC) application, supporting real-time data processing and inter-application data accessibility.

Figure 1.
The workflow of the EcoSensitivity tool guides users from an oil spill event through to the environmental impact assessment of the analyzed oil spill scenario.
The first component, the Accidental Damage and Spill Assessment Model (ADSAM), is based on accident specifics and estimates initial oil spill characteristics, including oil type, volume, and release rate. ADSAM’s calculations depend on parameters such as collision type (grounding or collision), penetration depth, and vessel particulars (e.g., length, draft, beam, and deadweight). Vessel characteristics, such as hull design, size, speed, and operational practices, influence oil dispersion, with double-hulled designs reducing leaks and larger, faster ships amplifying spill spread through turbulence. For cases where detailed ship specifications are unavailable, ADSAM accesses a database of standard ship particulars, using these inputs to approximate damage outcomes. The application also accounts for environmental factors like water salinity and ice cover, which influence initial spill behavior. ADSAM was developed in MATLAB (version R2024b), compiled as a DLL, and deployed via a web service to integrate smoothly within the EcoSensitivity web platform. Calculated spill data are stored in the shared Structured Query Language (SQL) database, making it accessible to SRW for subsequent oil drift modeling.
The SRW module, built as a map-based MVC application, simulates oil drift using the Seatrack Web (STW) model by the Swedish Meteorological and Hydrological Institute (SMHI). SRW utilizes ESRI’s JavaScript API to provide an interactive GIS interface where users can view and use various spatial layers for analysis, including shoreline classifications, biological sensitivity indices, and human activity data. These layers offer critical context for predicting oil drift based on regional environmental sensitivities and anthropogenic activities. After ADSAM produces spill characteristics, SRW initiates drift modeling by sending requests to the STW model API, specifying necessary parameters like spill location, initial time, and oil type. STW processes these data within its Nucleus for European Modeling of the Ocean (NEMO) model, simulating oil spread and movement under real-time oceanographic and atmospheric conditions. The model’s results, returned to SRW as drift points, are buffered into polygons (oil spill clouds) and stored in the GIS database, tagged with scenario-specific identifiers. To enhance situational awareness, SRW includes a known, publicly accessible maritime traffic map from MarineTraffic.com, displaying live Automatic Identification System (AIS) vessel locations near the spill zone.
PlanWise4Blue (PW4B), the third component, performs cumulative environmental impact assessments by combining SRW oil spill data with layers representing other human activities (e.g., shipping, fisheries, and wind farms). PW4B’s interface, also built on ESRI’s JavaScript API, enables users to configure specific scenarios by selecting relevant human activities and nature assets for the analyses. The cumulative impact assessment is conducted using an R script, which accesses local copies of each scenario’s geodatabase to optimize computational efficiency. This script generates TIFF raster files that represent the cumulative effects of all the selected pressures on the chosen nature assets. These raster files are subsequently converted into vector polygons using Python scripts, which then store the resulting layers in the GIS database with unique identifiers.
The EcoSensitivity platform uses Esri’s smart mapping feature to dynamically generate rendering styles for result layers, where the symbology is defined based on the values produced in each analysis. This functionality enables PW4B to render these layers interactively, allowing users to visualize the cumulative impacts of oil spills and other pressures on a map in real time.
The EcoSensitivity applications are single-page applications (SPAs) developed with JavaScript for the client side, supported by Knockout.js for data-binding and efficient interactivity. The server side, built in C# within an MVC framework, connects to an SQL server database, providing centralized data management across the platform. Esri ArcGIS Server facilitates GIS functionalities, supporting spatial queries, data visualization, and real-time rendering of analysis results. By integrating these technologies, EcoSensitivity establishes a cohesive pipeline for data processing, spatial analysis, and visualization, facilitating reliable and efficient impact assessments for oil spill response in marine environments.
3. Operationalizing the EcoSensitivity Tool
The EcoSensitivity tool is a user-friendly, web-based decision support platform designed to enhance response effectiveness during oil spills and maritime incidents. The tool enables users to simulate oil spill scenarios, visualize spill drift over time, and assess cumulative environmental impacts under various emergency situations. By combining detailed spill trajectory modeling with environmental sensitivity mapping, EcoSensitivity helps decision-makers prioritize response actions efficiently, based on real-time data and predictive models.
The tool can be used in real-time accident scenarios or as part of training sessions. In this study, we demonstrate the tool’s performance by simulating a plausible ship grounding scenario in the heavily trafficked Baltic Sea region.
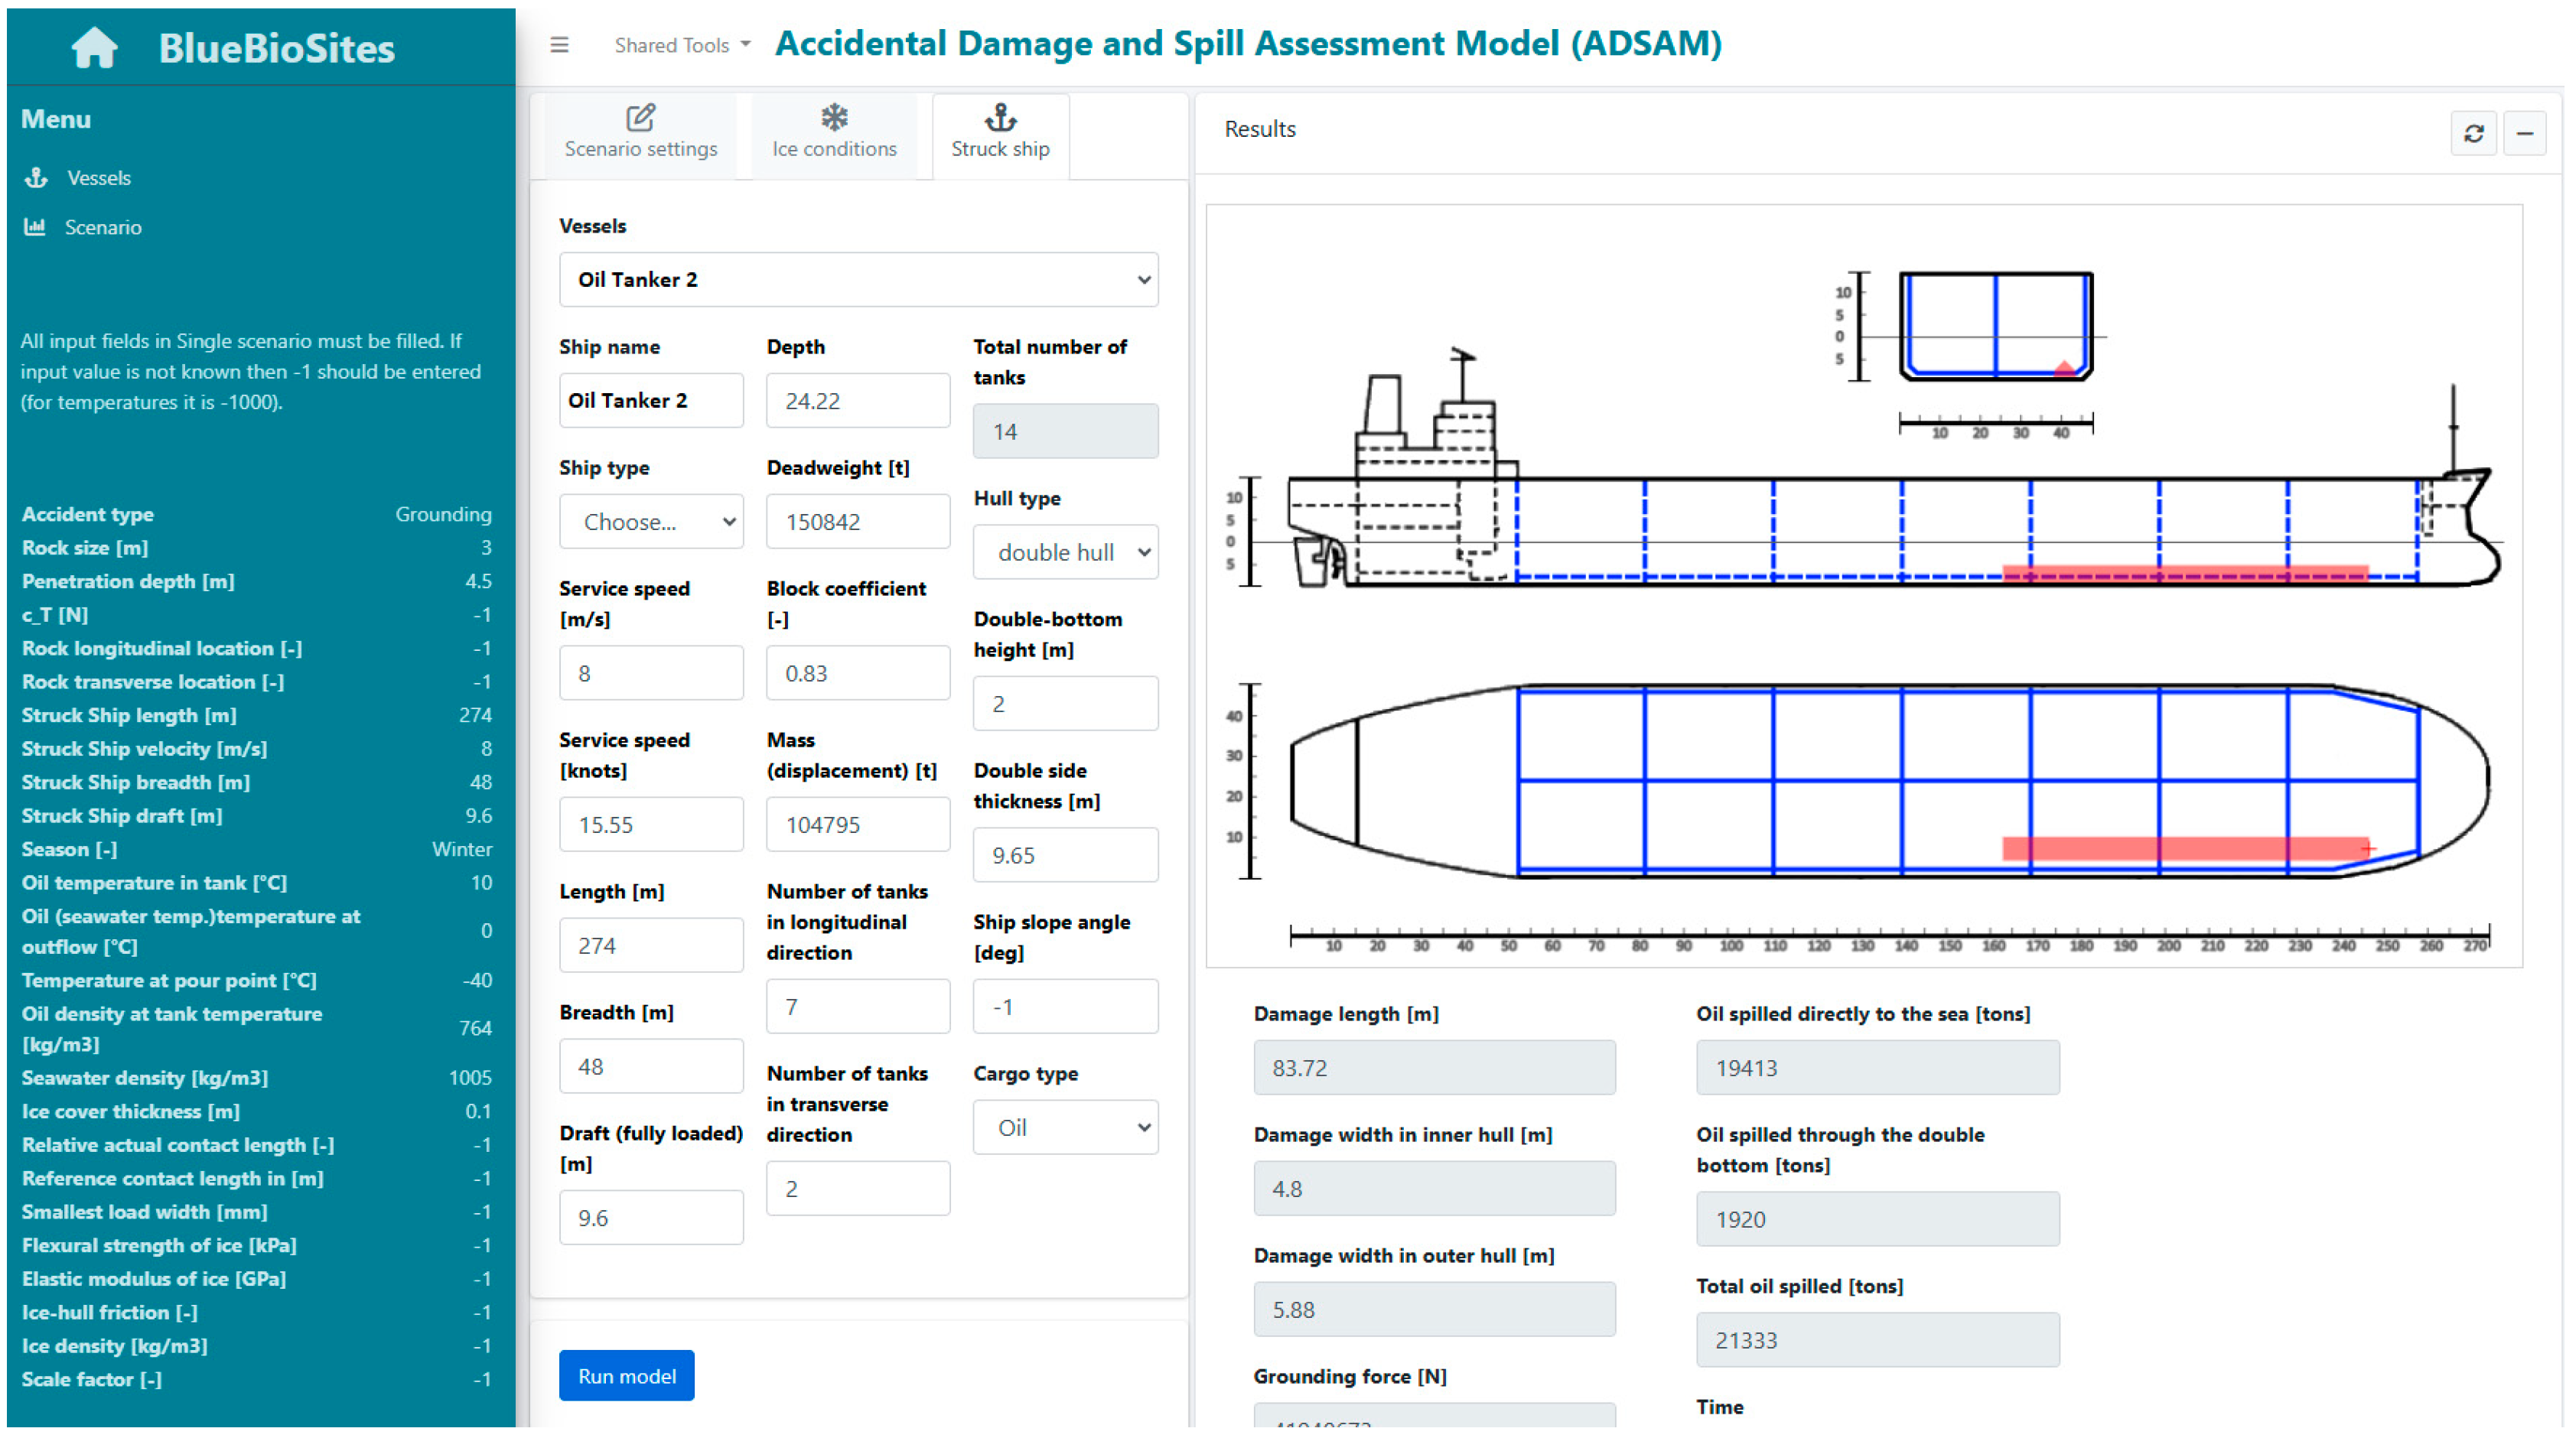
The process begins in the ADSAM tab, where users input all the necessary information for the model to predict the outcomes of an accident or scenario. If specific details are unavailable, placeholders such as − or −1000 (e.g., for temperature) can be entered. In such cases, the ADSAM model substitutes the most plausible default values for the missing data. In the ADSAM tab, users define accident characteristics, including the type and specifics of the incident. For this study, we modeled the grounding of an oil tanker with the following specifications: a length of 274 m, a breadth of 48 m, and a draft of 9.6 m. The rock size was set at 3 m, with a penetration depth of 4.5 m. At the time of the accident, the ship’s velocity was 8 m/s. Additional parameters, such as tank arrangements and oil properties, can also be specified. For fields where no information was available, we assumed unknown values. The user interface allows responders to input available accident details or select from a database of vessel types and characteristics, enabling rapid setup even with minimal information.
ADSAM’s calculations determine the initial scale of the response and provide precise data for subsequent models. The most critical output of the ADSAM model is determining the type, quantity, and timing of the oil spill into the sea. By streamlining the initial spill assessment, ADSAM enables first responders to make swift, informed decisions, establishing a strong foundation for further analysis and effective action (Figure 2).
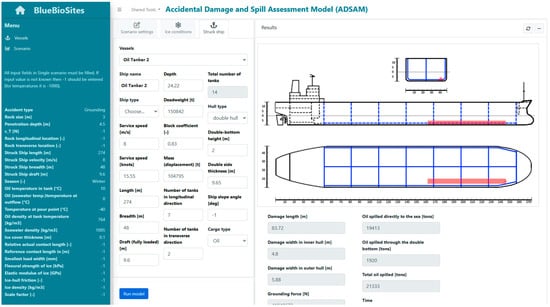
Figure 2.
Figure illustrating the ADSAM tab user interface. User should choose “Single scenario” from the left panel and, under that, the type of accident. Known information should be filled up according to the instructions from the left panel and, at the end, “Run model” is clicked. On the right, the user can see the results and screen information for further analysis. Blue squares represent tanks of the tanker, with seven tanks on one side of the vessel. Since there are two rows of tanks, this results in a total of 14 tanks. The red area indicates the ship’s damage caused by the rock during the grounding event. Parameter values such as “Oil spilled directly to the sea” and “Spill time” will be used in the next steps in STW.
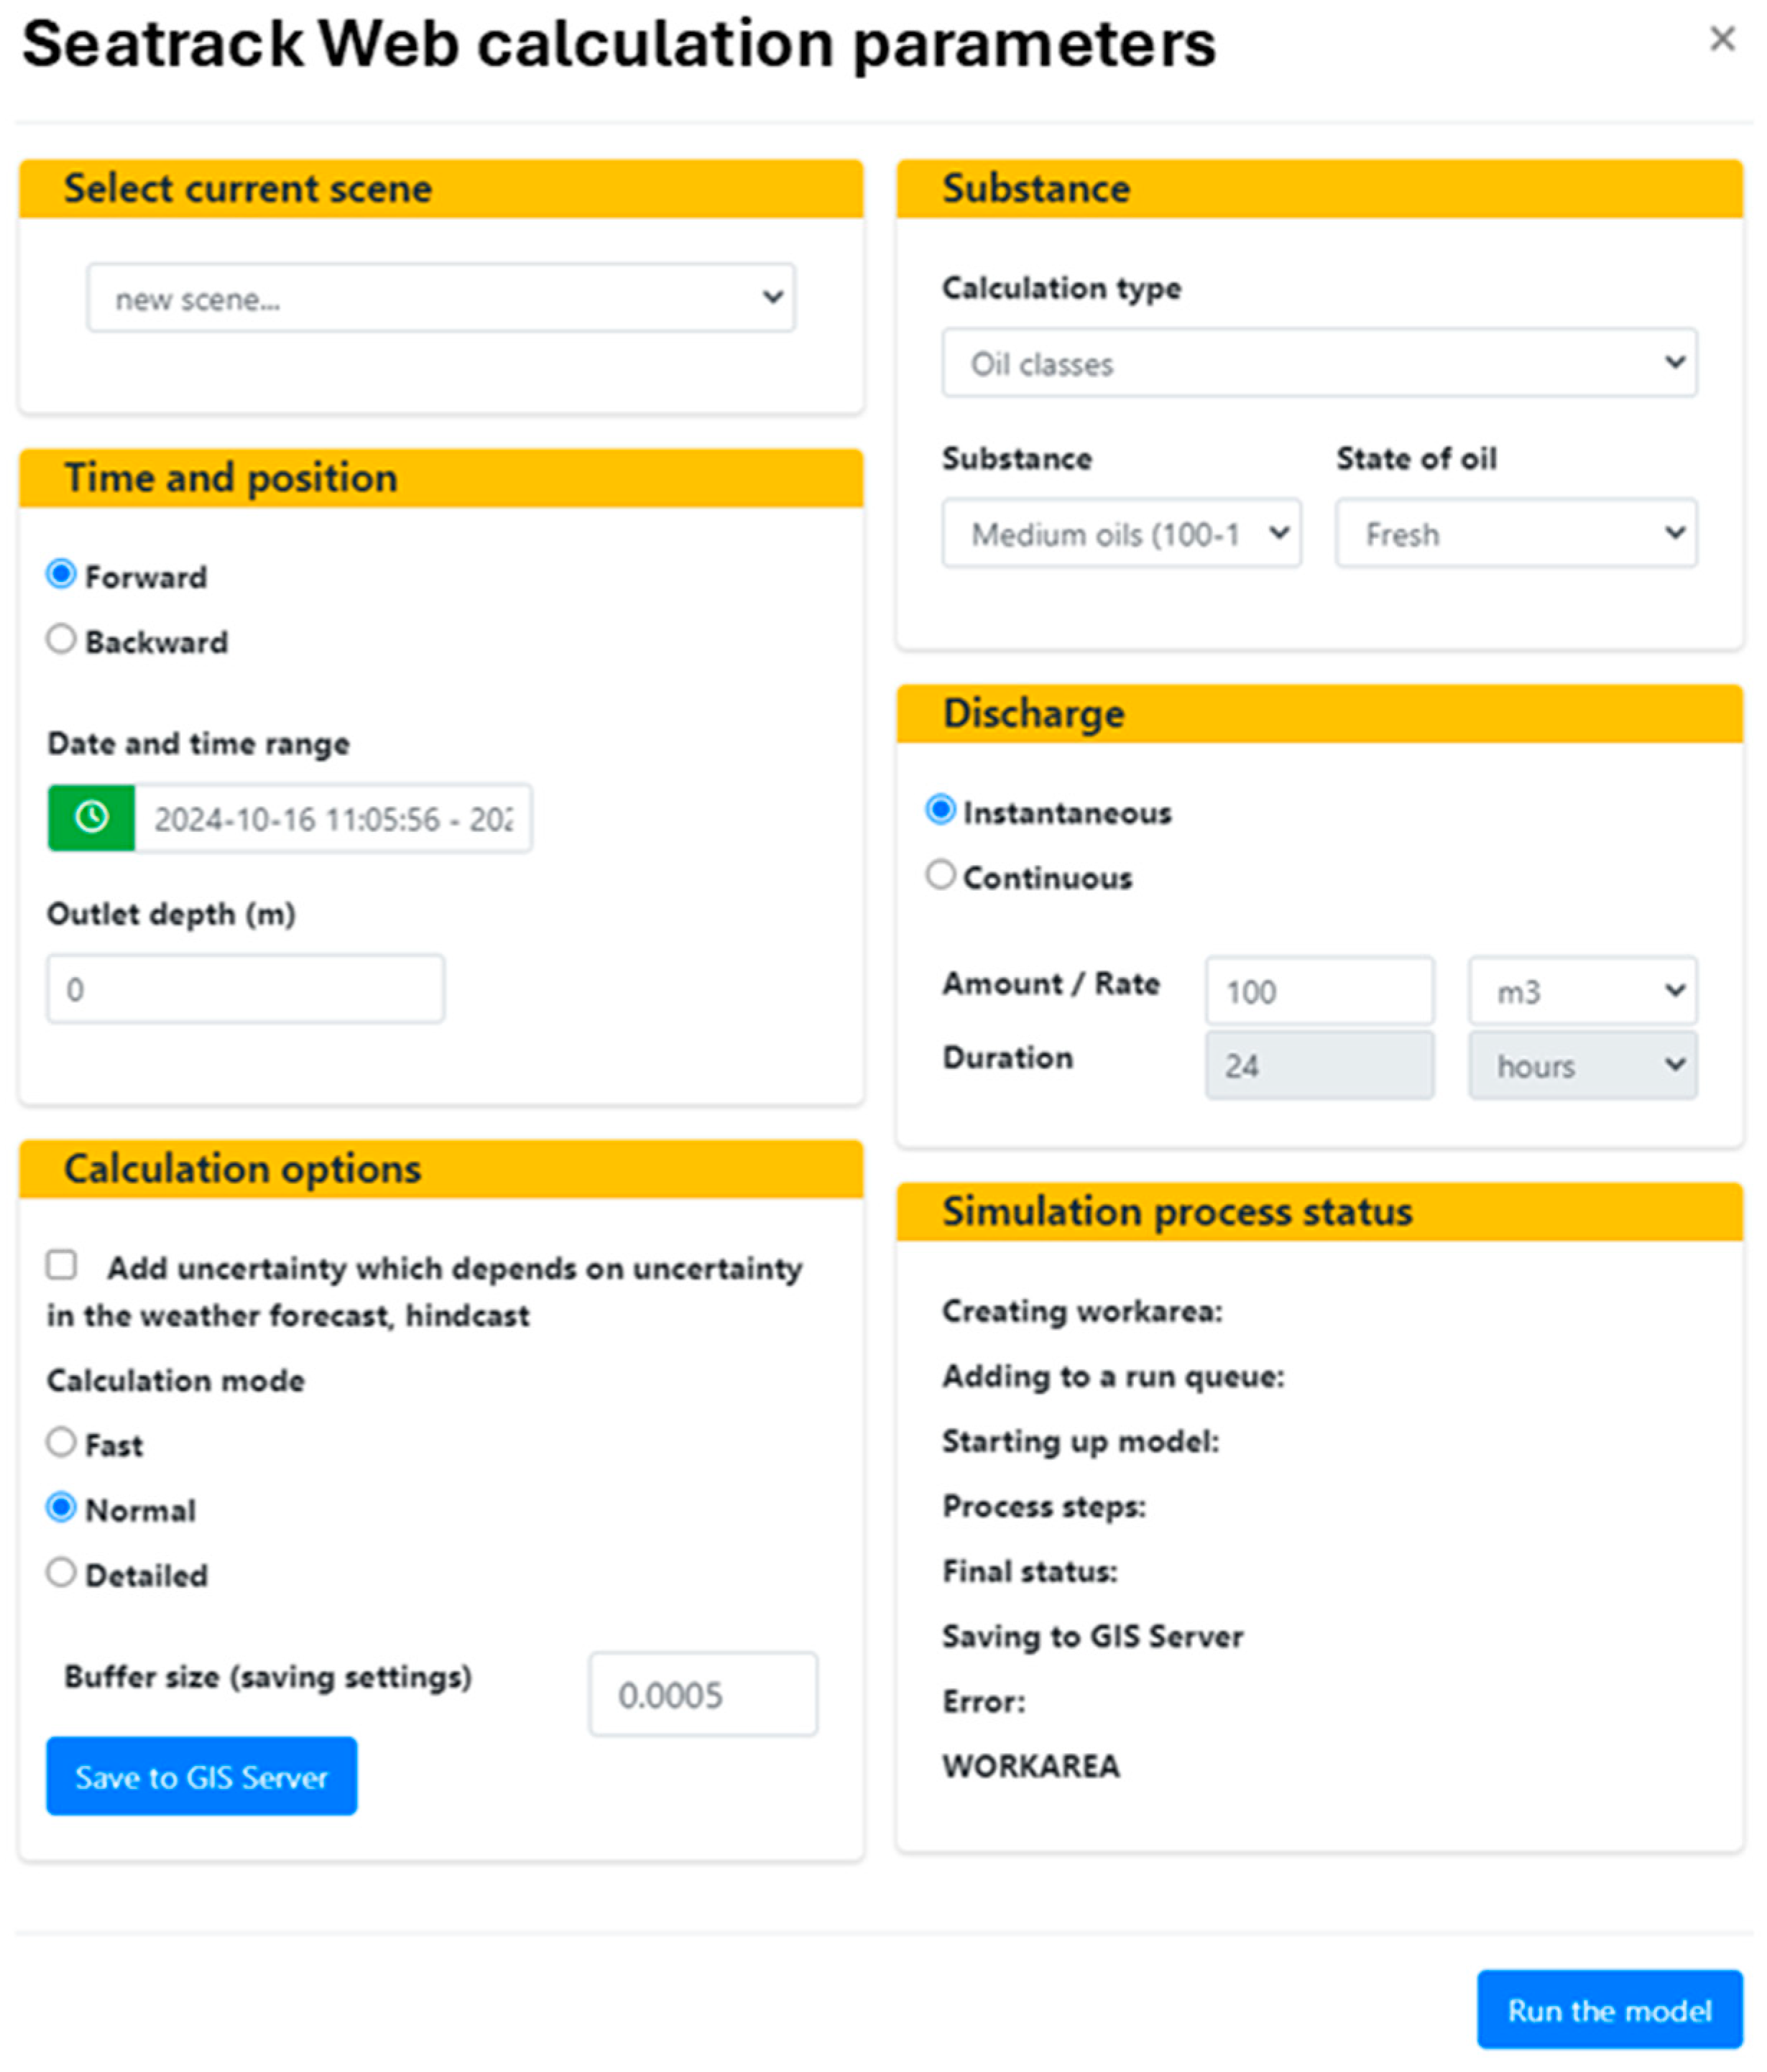
Once ADSAM has generated initial spill data, this information is transferred to the STW model (Figure 3). It is crucial to select the appropriate oil class, as different oil types behave differently in marine environments (see fields calculation type, substance, state of oil). STW uses real-time weather data, including wind and ocean current patterns, to simulate the trajectory and spread of the oil spill over time. Through its map-based interface, users can visualize the projected movement of the spill, identifying high-risk areas for environmental impact. The STW model provides both forward and backward tracking, allowing responders to either predict the future path of a spill or trace its origin. This flexibility is crucial for managing ongoing incidents and for conducting retrospective analyses to improve future preparedness. For instance, STW can simulate how varying conditions, such as wind shifts or changes in current speed, might alter the spill’s trajectory, helping responders to anticipate possible scenarios and prioritize sensitive areas accordingly. Moreover, STW’s interface includes a marine traffic layer, which displays live vessel locations to enhance situational awareness in the response area.
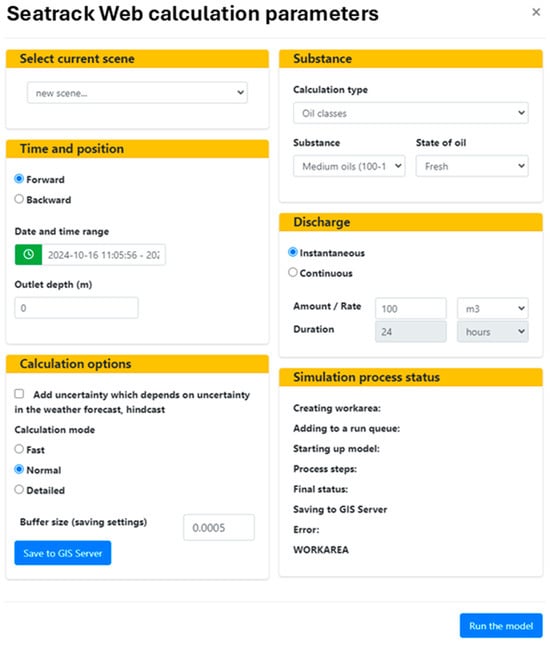
Figure 3.
STW calculation parameters: Users can specify and input key parameters such as oil type, discharge amount or rate, discharge time, and duration directly from the ADSAM model interface to run the STW model.
The final component, PW4B, brings a cumulative impact assessment capability to the EcoSensitivity tool, enabling responders to understand both the broader and specific implications of a spill in conjunction with other human-induced pressures on marine ecosystems. PW4B integrates results from STW with additional data layers, including maps of human activities (e.g., shipping lanes, fisheries, and wind farms) as well as essential natural assets. The natural assets include, but are not limited to, various marine habitat types such as those listed under the Habitat Directive and Marine Strategy Framework Directive, as well as key habitat-forming seaweeds, invertebrate species, fish spawning grounds, and habitats for birds and mammals. This integration enables users to evaluate not only the direct impacts of an oil spill but also the cumulative effects when combined with other environmental pressures. These synergistic effects are significant, as multiple human pressures often occur simultaneously. When seafloor habitats are already stressed by factors such as eutrophication or benthic trawling, they become more vulnerable to oil spills. For instance, in scenarios where a spill occurs near a heavily trafficked shipping lane or a sensitive marine habitat, PW4B provides a holistic assessment by quantifying the potential cumulative impacts on these areas, thereby informing response priorities more effectively. The results are converted into easily interpretable visualizations, helping decision-makers to quickly grasp the ecological significance of the spill in the context of other ongoing pressures.
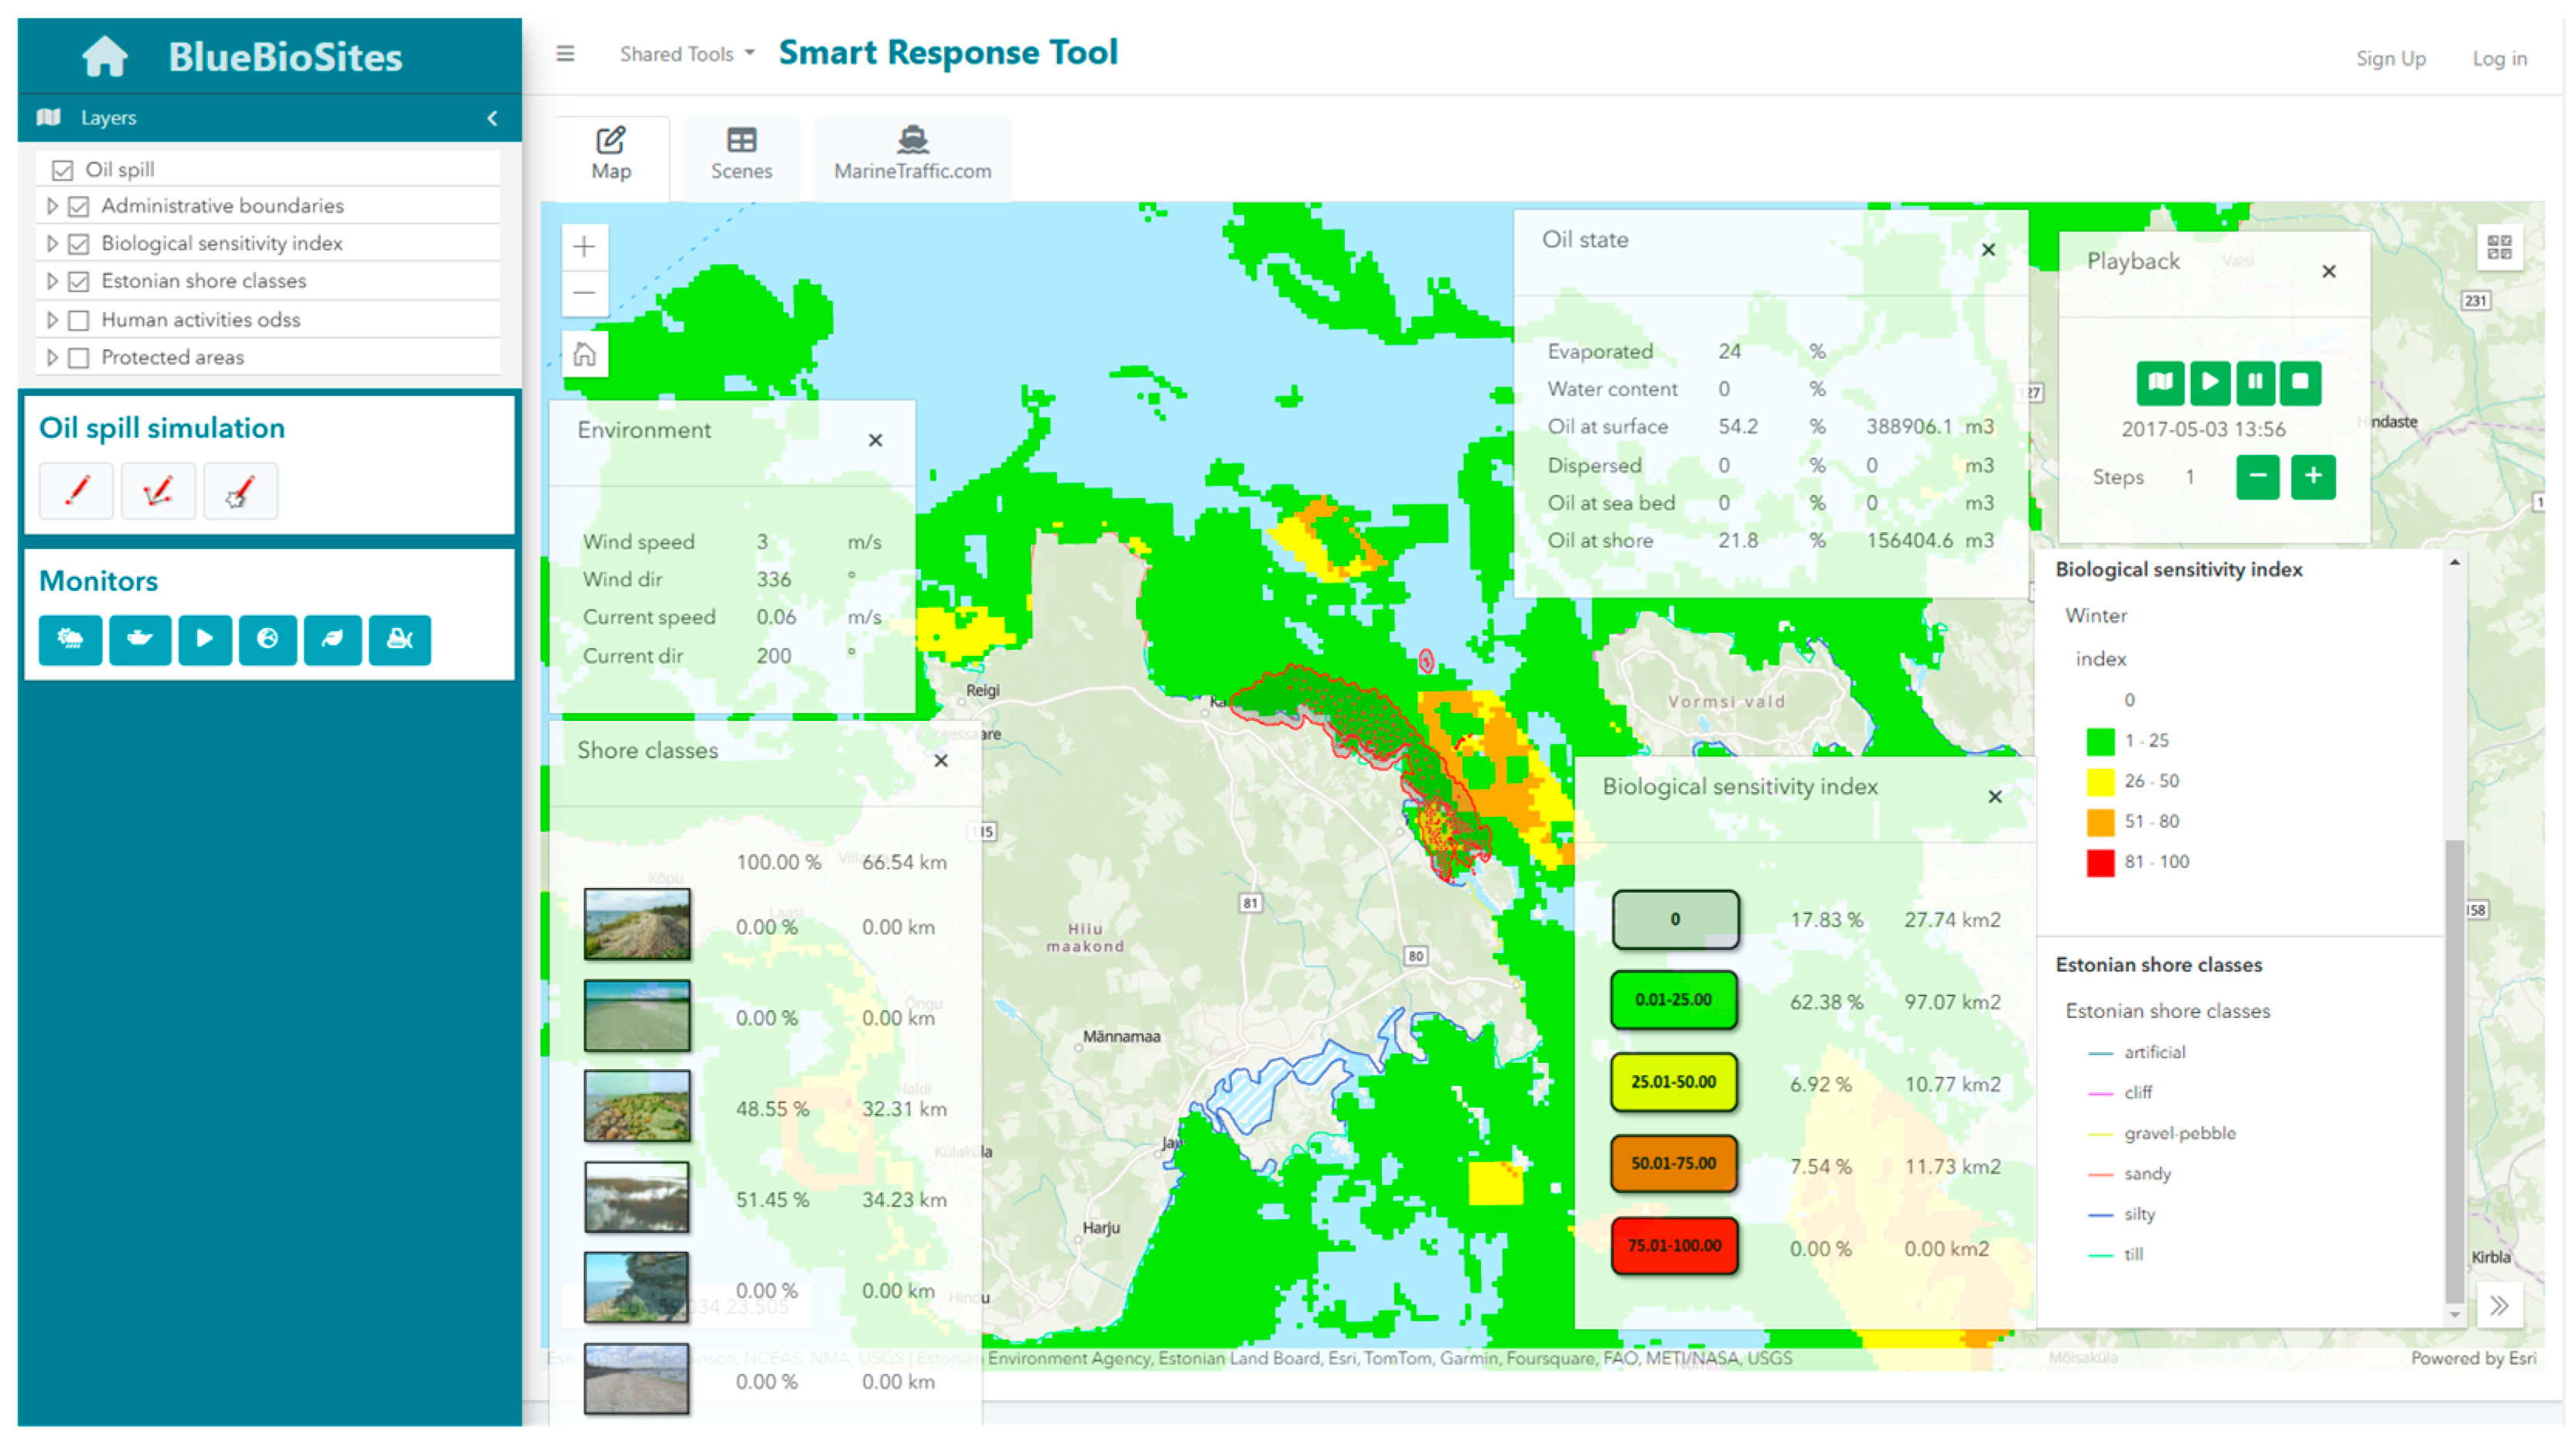
In our scenario, the spilled oil was distributed along the northeastern coastal area of Hiiumaa Island. The initial panel of the PW4B tool displays the spatial distribution of the oil spill along with detailed statistics, including the amount of oil evaporated, remaining on the surface, settled on the seabed, or washed up onshore. Within the affected area, the tool provides percentages of different biological sensitivity classes, helping assess the ecological value and sensitivity of the oiled region (https://metadata.helcom.fi/geonetwork/srv/api/records/9b2d1c32-7323-4e5e-aea4-3865ab9d6633) (accessed on 23 December 2024) [37]. It also displays the proportions of various shore types, aiding oil spill managers in planning appropriate response actions (Figure 4).
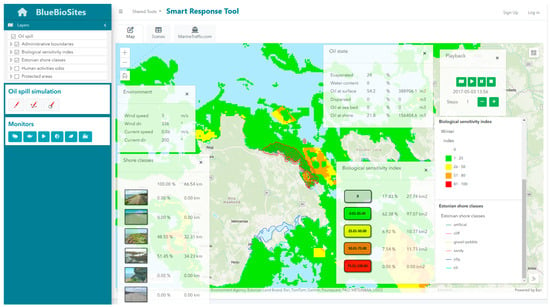
Figure 4.
After STW modeling, users are presented with key outcomes of the oil spill, including the distribution of the affected areas (oil spill footprint marked as an area filled with red dots) and details about the various fractions of the spilled oil. The map pane also displays the percentages of different biological sensitivity classes, enabling an assessment of the ecological value and sensitivity of the impacted region. In addition, it shows the proportions of various shore types, providing key insights to help oil spill managers plan appropriate response actions.
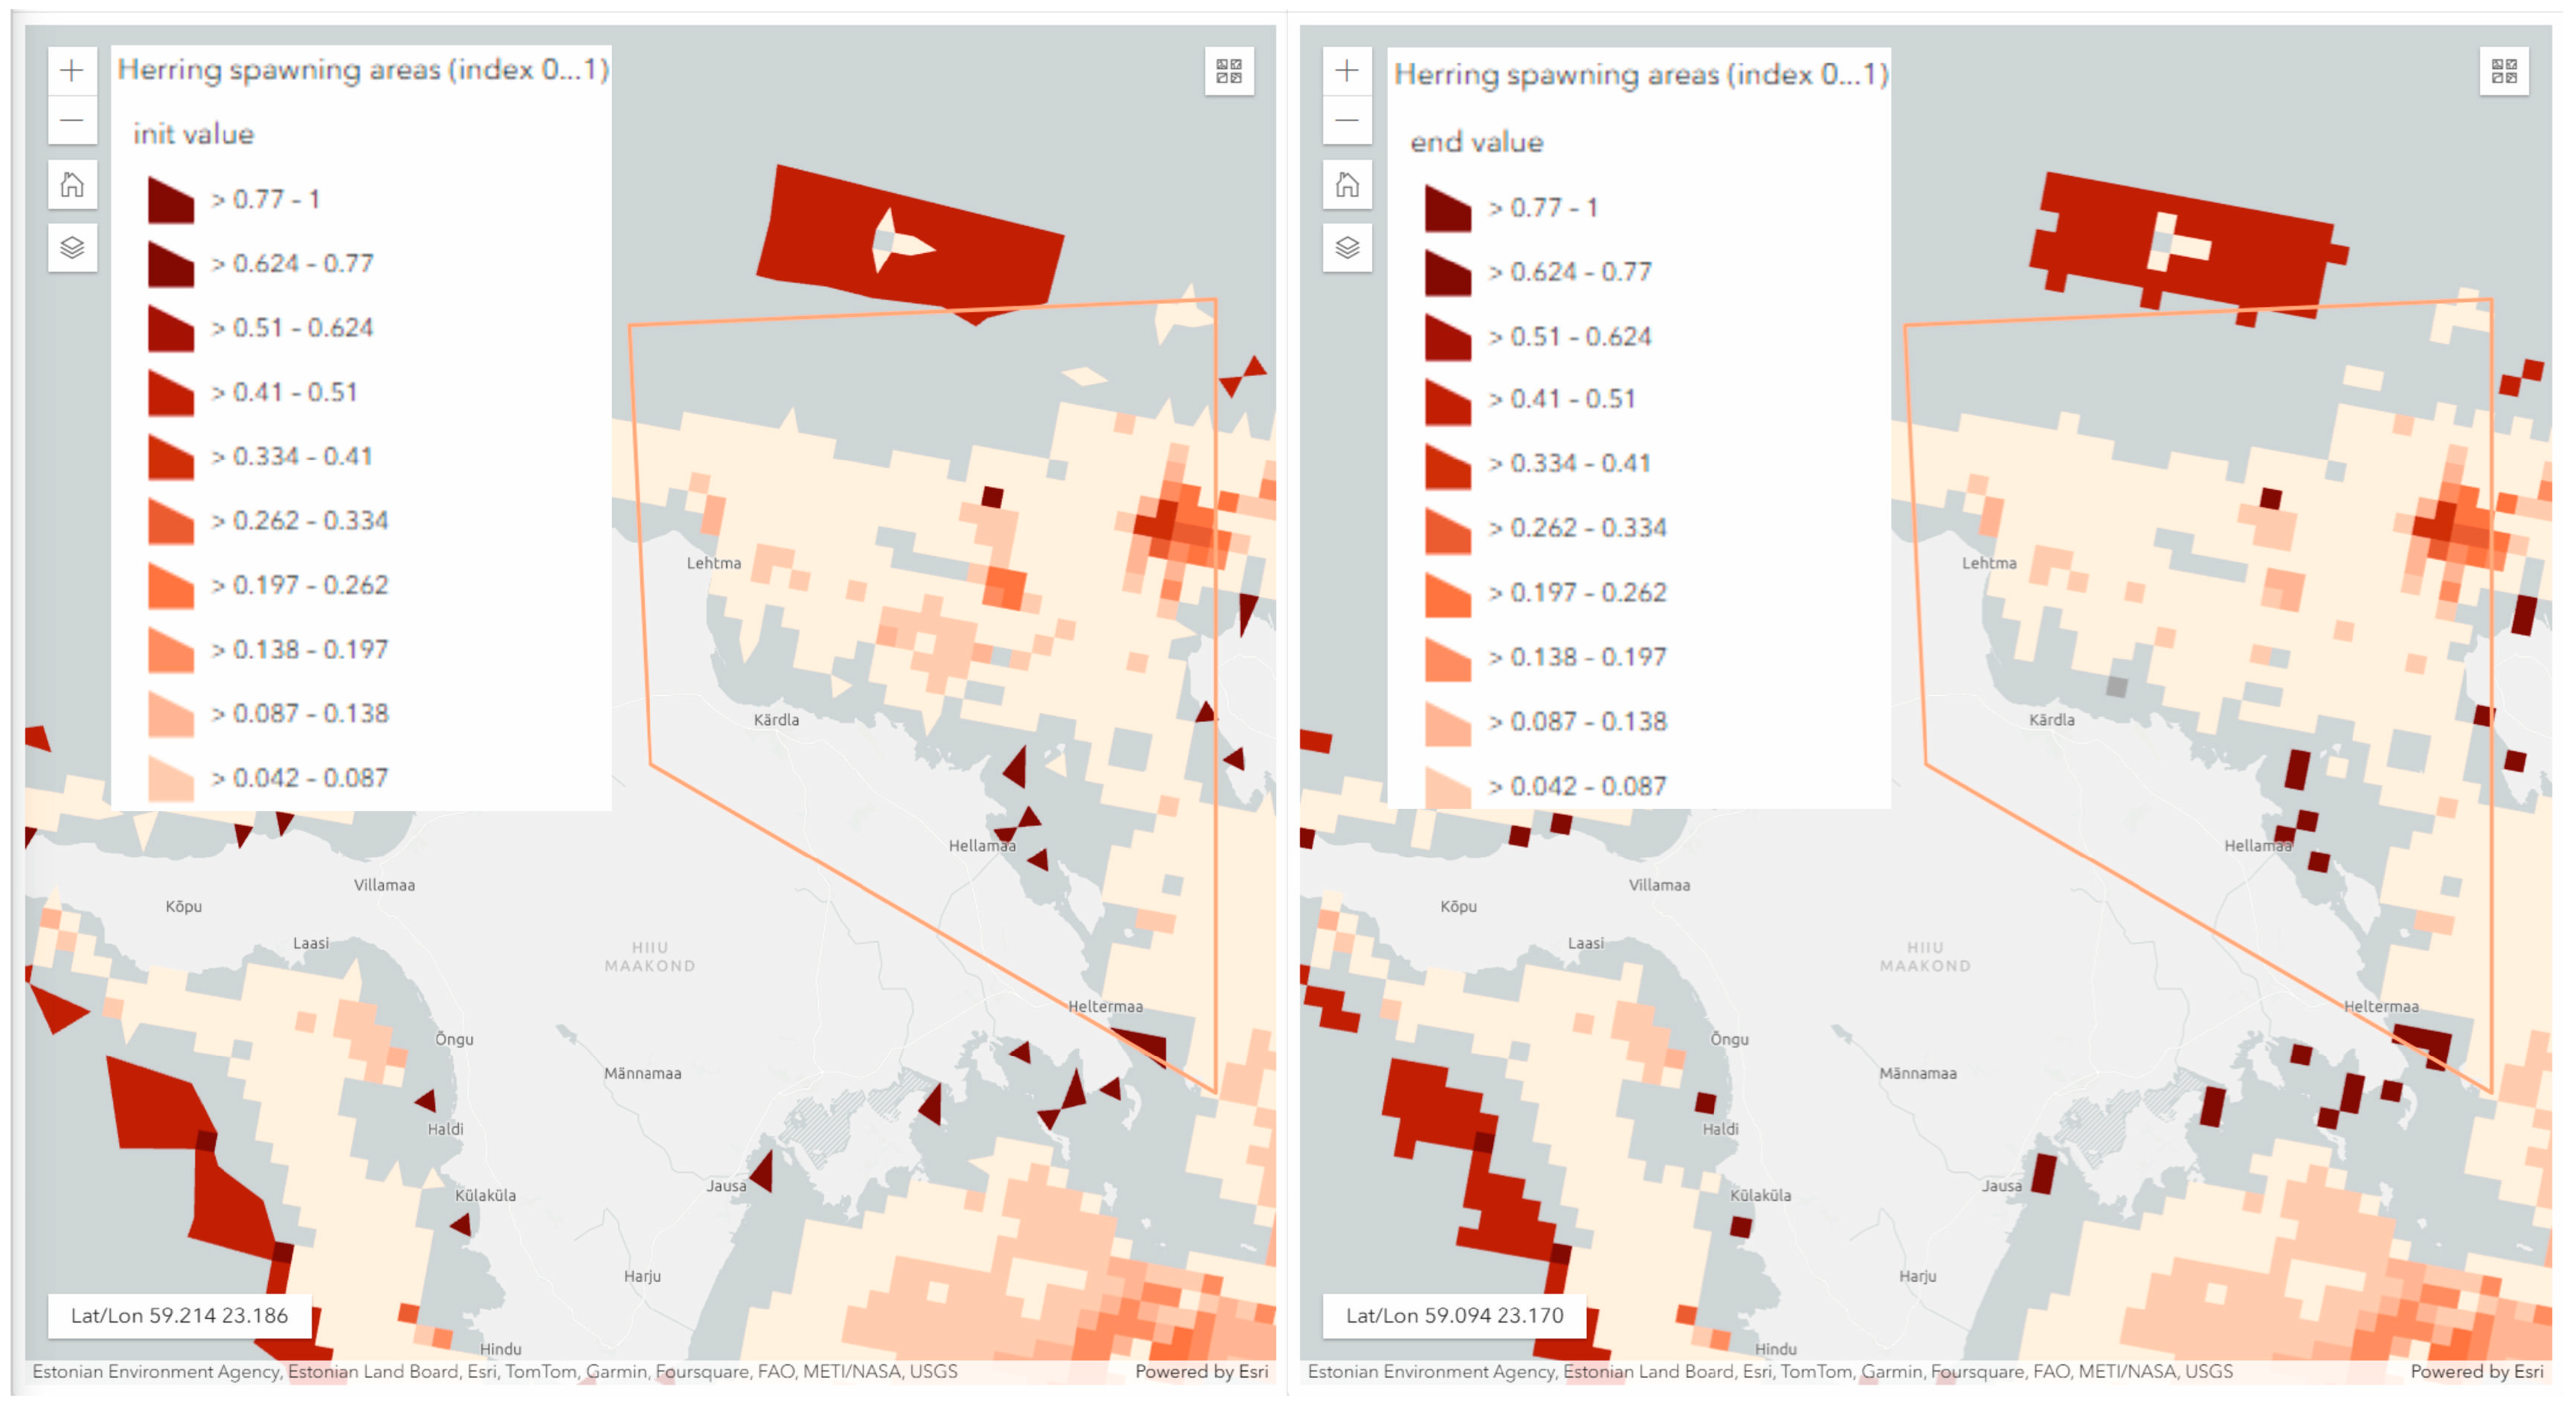
In addition, the tool allows for more advanced analyses. Users can focus on specific natural assets (e.g., seagrass beds, reef habitats, bird density maps) or related ecosystem services (e.g., the carbon sequestration potential of seafloor habitats) to evaluate the potential consequences of the selected oil spill scenario. Furthermore, users can incorporate other existing human pressures in the region to calculate the cumulative environmental impact on selected natural assets, providing a more comprehensive understanding of the combined effects of these pressures. Here, we illustrate the potential impacts of the current oil spill scenario on the quality of herring spawning areas. The analysis indicates that the oil spill is likely to cause a significant reduction in this crucial ecosystem service. The plot on the left shows the baseline extent of herring spawning grounds, while the plot on the right highlights the diminished spawning areas resulting from the oil spill (the affected areas highlighted by the red circle). This tool can similarly evaluate the impact of various scenarios on more than 500 nature asset map layers available in the region. The analyses are highly efficient, delivering results within just a few minutes (Figure 5).
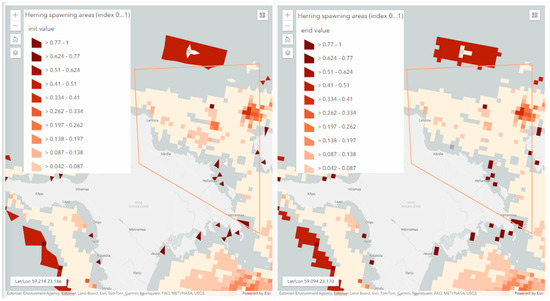
Figure 5.
The PW4B allows users to compare the initial map layers with the predicted outcome map generated by the cumulative effects analysis. Changes in biomass or area (whether increases or decreases) of selected natural assets or ecosystem services are also viewable. These changes can be attributed to the oil spill alone or its interaction with other human pressures, depending on the analysis criteria defined by the users. The figure illustrates the potential impact of the oil spill scenario on the quality of herring spawning grounds. The plot on the left shows the baseline extent of these spawning areas, while the plot on the right highlights the diminished spawning areas resulting from the oil spill, with the affected regions highlighted by the red circle.
The user experience of the EcoSensitivity tool is designed for simplicity and accessibility, ensuring that even users with minimal technical expertise can navigate the platform effectively. Through a straightforward interface, users can access ADSAM, STW, and PW4B seamlessly, with prompts and guides to assist them through each step of the process. For instance, once accident parameters are entered into ADSAM, the system automatically prepares the data for STW simulations, minimizing manual input and reducing the time needed to initiate predictive modeling. Similarly, PW4B’s intuitive interface allows users to select specific scenarios, adjust parameters, and view results with minimal effort, making it an ideal tool for use in high-stress emergency situations where rapid decision-making is critical.
EcoSensitivity’s applicability across various emergency scenarios makes it a versatile tool for oil spill response teams. In a large-scale spill scenario, such as one impacting multiple coastal habitats, responders can use ADSAM to assess the immediate severity of the spill and STW to predict its spread over time, identifying vulnerable ecosystems along its trajectory. PW4B then enables cumulative impact analysis, helping responders understand the potential long-term ecological effects of the spill, both as an isolated incident and in combination with other pressures in the area. This layered analysis is invaluable for formulating response strategies that not only address immediate containment needs but also account for sustained ecological recovery efforts. In smaller or more localized spills, the tool allows for targeted assessments, where users can focus solely on high-priority assets and direct resources to areas with the greatest environmental sensitivity.
4. Discussion
The EcoSensitivity tool marks a significant advancement in oil spill response by addressing critical gaps in existing systems through an integrated, user-friendly approach that combines spill severity assessment, operational oil drift prediction, and cumulative impact evaluation. In contrast to traditional oil spill response tools, which often function as standalone applications focused on real-time tracking, spill modeling, or environmental sensitivity, EcoSensitivity’s framework allows for a comprehensive understanding of spill dynamics and their broader but still detailed environmental implications. This multi-component platform—consisting of ADSAM, Seatrack Web (STW), and PlanWise4Blue (PW4B)—offers an unprecedented level of interactivity and data integration, enabling responders to make informed, scenario-based decisions in real time.
Unlike earlier tools that generally focused on tracking oil drift or providing isolated Environmental Sensitivity Index (ESI) maps, EcoSensitivity integrates data from multiple sources to model cumulative impacts. This capability is crucial for assessing not only the immediate effects of a spill but also its compounded impact when interacting with other environmental pressures, such as shipping traffic, fisheries, or coastal development. Specifically, effective management, restoration, and conservation of heavily used coastal ecosystems require a comprehensive understanding of how key species and habitats respond to various pressures. Reliance solely on ESI maps can risk overlooking critical ecosystem components, potentially leading to incomplete or biased assessments. At the same time, marine environments are facing an intensification and diversification of human-induced pressures, which together shape the ecosystem’s response to additional stressors. Ecosystems near tipping points, in particular, are likely to react more severely to incremental pressures. This is why, in recent years, research has increasingly emphasized the importance of evaluating the interactive effects of multiple pressures on diverse ecosystem assets and their services. This multi-pressure assessment is essential, as simplistic, single-pressure models often fail to capture complex ecological responses, producing inaccurate or misleading cumulative effects assessments (CEAs) (e.g., [38,39]).
The PlanWise4Blue (PW4B) tool addresses this limitation by integrating scientific evidence with expert judgment to assess the cumulative effects of human activities on marine environments through a data-driven approach. PW4B’s methodology relies on a knowledge matrix that quantifies both the individual and combined impacts of key pressures on various natural assets, offering tangible metrics such as species biomass changes or habitat loss and gain across different scenarios. While some coefficients still depend on expert input, PW4B continues to incorporate empirical data as it becomes available, enhancing its accuracy and relevance for ecosystem-based management. Accessible and easy to use, PW4B serves marine managers and policymakers by providing a practical tool to incorporate complex scientific insights into decision-making processes aimed at achieving environmental and socio-economic sustainability [35].
Tools like GNOME and ERMA have offered valuable baseline capabilities for tracking and predicting oil spills. However, EcoSensitivity takes these functionalities a step further by significantly improving the accuracy of predictions for both the distributions of oil spills and their environmental impacts. Additionally, it enhances accessibility and usability, making it equally effective for technical experts and non-technical stakeholders. Through its integration with PADM’s 3D weather-driven simulations, AIS data for navigation and situational awareness, and advanced mapping layers, EcoSensitivity offers a more holistic perspective on spill impact, tailored for diverse scenarios and environmental contexts [36,40].
In the scenario presented, we demonstrated the operational information flow across various components of the tool. This included describing accident specifics in ADSAM, real-time oil spill distribution modeling by STW, quick statistics on spill types and affected areas, and assessments of area sensitivities to oil spills and shoreline types by PW4B. In addition, PW4B performed more detailed analyses of the expected consequences of the current oil spill scenario on various natural assets within the affected region. When co-developed with stakeholders responsible for operational spill emergency response, the EcoSensitivity tool’s accessibility represents another significant advancement. Its intuitive interface enables responders to interact with and analyze complex datasets without requiring specialized training, a crucial feature for time-sensitive emergency situations. Past systems often suffered from high entry barriers due to complex interfaces or technical requirements, limiting their applicability in urgent scenarios where responders must act quickly and decisively [41,42,43,44,45]. In EcoSensitivity, users found that ADSAM allows for rapid spill characterization, feeding precise data into STW for drift prediction and facilitating real-time scenario adjustments in PW4B for cumulative impact analysis. The platform’s emphasis on simplicity without sacrificing analytical depth makes it an invaluable resource for coordinated, high-stakes response operations.
Further, EcoSensitivity offers flexibility across various spill scenarios, enhancing its effectiveness in real-world emergency responses. For instance, it allows responders to analyze both large-scale oil spills affecting extensive coastal regions and localized spills that threaten sensitive habitats directly, while also accommodating different types of oil released into the sea. The PW4B component allows users to evaluate cumulative effects, making EcoSensitivity an ideal tool for assessing the broader ecological footprint of a spill beyond immediate spill boundaries. This is particularly important in complex ecosystems, where spill impacts can interact with existing pressures to produce far-reaching, often unpredictable outcomes.
The EcoSensitivity tool also aligns with recent theoretical advancements in the field, such as the concepts of real-time collaborative GIS and common situation awareness [46,47], which emphasize the importance of shared understanding among stakeholders in emergency response scenarios. Preliminary tests with maritime professionals suggest that EcoSensitivity can effectively support these principles, fostering better coordination and situational awareness among response teams [48]. These capabilities are crucial, as oil spills are inherently multi-faceted disasters, often requiring input from diverse groups, including environmental scientists, policymakers, and logistical teams. The tool’s cloud-based infrastructure and user-centered design facilitate seamless collaboration across borders and agencies, overcoming some of the limitations of earlier, isolated systems [49].
A key advantage of the EcoSensitivity decision support system is its ability to streamline and enhance response efforts during environmental crises by addressing the challenges of cross-border coordination. This capability includes harmonizing resource allocation and fostering effective communication among stakeholders from different jurisdictions. By offering a centralized regional platform for data analysis and scenario modeling, it supports timely, well-informed decision-making, ensuring that response strategies are both efficient and aligned with regional and international protocols.
Despite its advantages, EcoSensitivity’s reliance on external data sources, including Web Map Service (WMS) and distributed databases, presents certain limitations. In areas where data on key natural assets are sparse or outdated, the tool’s predictive accuracy may suffer, especially when evaluating cumulative impacts. Addressing this gap requires ongoing collaboration with local agencies and regional data providers to improve data coverage and incorporate new environmental insights, particularly in data-poor regions. Moreover, simulation-based testing and real-world training exercises will be essential to refine the tool’s performance in diverse operational contexts, ensuring that it meets the needs of end-users under various environmental and operational conditions [50].
Another limitation arises from the adoption of novel fuel types. Specifically, the IMO 2020 regulation (https://www.imo.org/en/MediaCentre/PressBriefings/pages/34-IMO-2020-sulphur-limit-.aspx (accessed on 23 December 2024)) mandates a reduction in sulfur content in marine fuels, aiming to deliver significant health and environmental benefits, particularly for communities near ports and coastal areas. In line with this, ultra-low sulfur fuel oils (ULSFOs), containing less than 0.1% sulfur, have replaced traditional fuels like IFO 180 and IFO 380 in Sulfur Emission Control Areas (SECAs) in Europe and North America since 2015. Globally, a regulation implemented in January 2020 further lowered the sulfur cap on marine fuels to 0.5%, down from the previous 3.5% limit [51]. However, further research is needed to fully understand the implications of these changes and to develop effective response strategies for ULSFO spills. Current tools lack the ability to robustly predict the spread and fate of such fuels in the marine environment, and their environmental impacts on various natural assets remain poorly understood.
A comparative analysis between EcoSensitivity and other well-established oil spill tools, such as OSCAR, SIMAP, and GNOME, is currently missing. Benchmarking against these widely used models is important for assessing EcoSensitivity’s performance, reliability, and added value across various spill scenarios. Addressing this gap through thorough validation studies and comparative evaluations should be a key focus of future research efforts.
In conclusion, the EcoSensitivity tool is a transformative addition to oil spill response, offering comprehensive impact assessments and advanced decision-support capabilities that surpass traditional tools. By combining real-time data integration, predictive spill modeling, and cumulative impact analysis within an accessible, collaborative platform, EcoSensitivity enables decision-makers to manage complex spill scenarios proactively and effectively. Integrating ADSAM for initial spill assessment, STW for real-time drift modeling, and PW4B for cumulative impact analysis, this system provides a robust, data-driven approach to spill management. Continued development and testing will reinforce EcoSensitivity’s role in sustainable marine ecosystem protection, equipping responders to address future challenges in a dynamic maritime environment while minimizing both immediate and long-term ecological impacts. The EcoSensitivity tool is free to use, reflecting our commitment to making the latest scientific knowledge accessible for managing and protecting sensitive environments.
The key conclusions of this work are summarized as follows:
- Innovative Tool: EcoSensitivity enhances oil spill management with advanced impact assessments and decision support.
- Data-Driven Decisions: The tool ensures informed, efficient, and ecological spill response.
- Holistic Approach: It combines real-time data, predictive modeling, and cumulative impact analysis.
- Proactive Management: The platform enables effective handling of immediate and long-term spill impacts.
- Ecosystem Protection: It supports sustainable marine ecosystem preservation through continued development.
Author Contributions
Conceptualization, J.K. and M.F.; methodology, J.K. and M.F.; software, M.F. and J.K.; validation, A.K., M.F. and R.A.; formal analysis, J.K. and M.F.; investigation, M.F.; resources, J.K. and A.K.; data curation, M.F.; writing—original draft preparation, J.K., A.K. and H.O.-K.; writing—review and editing, R.A., V.L., M.L.-P. and M.R.; visualization, A.K.; supervision, J.K.; project administration, M.L.-P., M.R. and A.K.; funding acquisition, V.L., J.K. and R.A. All authors have read and agreed to the published version of the manuscript.
Funding
This research was funded by OpenRisk II (Tools for shared & dynamic maritime traffic risk picture of the Baltic Sea region) project (project number C041), co-funded by the Interreg Baltic Sea Region Programme 2021–2027, to support the transition toward a greener and more resilient Baltic Sea region and partly co-funded by Estonian Environmental Investment Centre and supported by the Horizon Europe 2023 programme (Grant Agreement No. 101186498) project MarTe (Marine technology excellence hub for sustainable blue economy in Baltics).
Institutional Review Board Statement
Not applicable.
Informed Consent Statement
Not applicable.
Data Availability Statement
No new data were generated in the current study.
Conflicts of Interest
The authors declare no conflicts of interest. The funders had no role in the design of the study; in the collection, analyses, or interpretation of data; in the writing of the manuscript; or in the decision to publish the results.
References
- NRC (National Research Council). Oil in the Sea III: Inputs, Fates, and Effects; National Academic Press: Washington, DC, USA, 2003.
- Paine, R.T.; Ruesink, J.L.; Sun, A.; Soulanille, E.L.; Wonham, M.J.; Harley, C.D.G.; Brumbaugh, D.R.; Secord, D.L. Trouble on Oiled Waters: Lessons from the Exxon Valdez Oil Spill. Annu. Rev. Ecol. Syst. 1996, 27, 197–235. [Google Scholar] [CrossRef]
- Peterson, C.H.; Rice, S.D.; Short, J.W.; Esler, D.; Bodkin, J.L.; Ballachey, B.E.; Irons, D.B. Long-term ecosystem response to the Exxon Valdez oil spill. Science 2003, 302, 2082–2086. [Google Scholar] [CrossRef] [PubMed]
- Ivshina, I.B.; Kuyukina, M.S.; Krivoruchko, A.V.; Elkin, A.A.; Makarov, S.O.; Cunningham, C.J.; Peshkur, T.A.; Atlas, R.M.; Philp, J.C. Oil spill problems and sustainable response strategies through new technologies. Environ. Sci. Process. Impacts 2015, 17, 1201–1219. [Google Scholar] [CrossRef]
- Albers, P.H. Petroleum and individual polycyclic aromatic hydrocarbons. In Handbook of Ecotoxicology; Hoffman, D.J., Rattner, B.A., Burton, G.A., Cairns, J., Eds.; CRC Press: Boca Raton, FL, USA, 2003; pp. 341–371. [Google Scholar]
- Dong, Y.; Liu, Y.; Chuanmin, H.; MacDonald, I.R.; Lu, Y. Chronic oiling in global oceans. Science 2022, 376, 1300–1304. [Google Scholar] [CrossRef] [PubMed]
- Pinto, J.; Athanassiou, A.; Fragouli, D. Surface modification of polymeric foams for oil spills remediation. J. Environ. Manag. 2018, 206, 872–889. [Google Scholar] [CrossRef]
- Helle, I.; Mäkinen, J.; Nevalainen, M.; Afenyo, M.; Vanhatalo, J. Impacts of oil spills on Arctic marine ecosystems: A quantitative and probabilistic risk assessment perspective. Environ. Sci. Technol. 2020, 54, 2112–2121. [Google Scholar] [CrossRef]
- Chen, J.; Zhang, W.; Wan, Z.; Li, S.; Huang, T.; Fei, Y. Oil spills from global tankers: Status review and future governance. J. Clean. Prod. 2019, 227, 20–32. [Google Scholar] [CrossRef]
- Asif, Z.; Chen, Z.; An, C.; Dong, J. Environmental impacts and challenges associated with oil spills on shorelines. J. Mar. Sci. Eng. 2022, 10, 762. [Google Scholar] [CrossRef]
- Maki, A.W. The Exxon Valdez oil spill: Initial environmental impact assessment. Environ. Sci. Technol. 1991, 25, 24–29. [Google Scholar] [CrossRef]
- U.S. Environmental Protection Agency (EPA). EPA Response to BP Spill in the Gulf of Mexico. 2010. Available online: https://archive.epa.gov/emergency/bpspill/web/html/ (accessed on 8 November 2024).
- Davies, A.J.; Hope, M.J. Bayesian inference-based environmental decision support systems for oil spill response strategy selection. Mar. Pollut. Bull. 2015, 96, 87–102. [Google Scholar] [CrossRef] [PubMed]
- Beyer, J.; Trannum, H.C.; Bakke, T.; Hodson, P.V.; Collier, T.K. Environmental effects of the Deepwater Horizon oil spill: A review. Mar. Pollut. Bull. 2016, 110, 28–51. [Google Scholar] [CrossRef] [PubMed]
- National Oceanic and Atmospheric Administration (NOAA). Deepwater Horizon Oil Spill: Final Programmatic Damage Assessment and Restoration Plan and Final Programmatic Environmental Impact Statement. NOAA. 2016. Available online: https://repository.library.noaa.gov/view/noaa/18084 (accessed on 8 November 2024).
- Fingas, M. (Ed.) Oil Spill Science and Technology; Gulf Professional Publishing: Houston, TX, USA, 2016. [Google Scholar]
- Yang, Z.; Chen, Z.; Lee, K.; Owens, E.; Boufadel, M.C.; An, C.; Taylor, E. Decision support tools for oil spill response (OSR-DSTs): Approaches, challenges, and future research perspectives. Mar. Pollut. Bull. 2021, 167, 112313. [Google Scholar] [CrossRef]
- BP Canada. Oil Spill Response Plan, Annex A—Offshore Containment and Recovery Tactical Response Plan; BP Canada Energy Group ULC: Calgary, AB, Canada, 2018. [Google Scholar]
- Luokkala, P.; Virrantaus, K. Developing information systems to support situational awareness and interaction in time-pressuring crisis situations. Saf. Sci. 2014, 63, 191–203. [Google Scholar] [CrossRef]
- Chang, S.E.; Stone, J.; Demes, K.; Piscitelli, M. Consequences of oil spills: A review and framework for informing planning. Ecol. Soc. 2014, 19, 26. [Google Scholar] [CrossRef]
- Li, P.; Cai, Q.; Lin, W.; Chen, B.; Zhang, B. Offshore oil spill response practices and emerging challenges. Mar. Pollut. Bull. 2016, 110, 6–27. [Google Scholar] [CrossRef] [PubMed]
- Bi, H.; An, C.; Owens, E.; Lee, K.; Chen, Z.; Mulligan, C.; Taylor, E.; Michel, B. A framework for the evaluation and selection of shoreline surface washing agents in oil spill response. J. Environ. Manag. 2021, 287, 112346. [Google Scholar] [CrossRef]
- Gundlach, E.R.; Hayes, M.O. Vulnerability of coastal environments to oil spill impacts. Mar. Technol. Soc. J. 1978, 12, 18–27. [Google Scholar]
- Jensen, J.R.; Halls, J.N.; Michel, J. A Systems Approach to Environmental Sensitivity Index (ESI) Mapping for Oil Spill Contingency Planning and Response. Photogramm. Eng. Remote Sens. 1998, 64, 1003–1014. [Google Scholar]
- Peterson, J. Environmental Sensitivity Index Guidelines: Version 3, NOAA Technical Memorandum Nos OR and R11; Hazardous Materials Response Division, Office of Response and Restoration, NOAA Ocean Service, National Oceanic and Atmospheric Administration: Seattle, WA, USA, 2002; 192p.
- Aps, R.; Tõnisson, H.; Suursaar, Ü.; Orviku, K. Regional Environmental Sensitivity Index (RESI) Classification of Estonian Shoreline (Baltic Sea). J. Coast. Res. 2016, 75, 972–976. [Google Scholar] [CrossRef]
- Keramea, P.; Spanoudaki, K.; Zodiatis, G.; Gikas, G.; Sylaios, G. Oil Spill Modeling: A Critical Review on Current Trends, Perspectives, and Challenges. J. Mar. Sci. Eng. 2021, 9, 181. [Google Scholar] [CrossRef]
- French-McCay, D. Development and application of damage assessment modeling: Example assessment for the North Cape oil spill. Mar. Pollut. Bull. 2003, 47, 341–359. [Google Scholar] [CrossRef] [PubMed]
- French-McCay, D.; Rowe, J.J. Evaluation of bird impacts in historical oil spill cases using the SIMAP oil spill model. In Proceedings of the Arctic and Marine Oilspill Program Technical Seminar, Edmonton, AB, Canada, 8–10 June 2004; pp. 421–452. [Google Scholar]
- Crowley, D.; French-McCay, D.; Santos, L.; Chowdhury, B.; Markussen, R. Modeling atmospheric volatile organic compound concentrations resulting from a deepwater oil well blowout–Mitigation by subsea dispersant injection. Mar. Pollut. Bull. 2018, 136, 152–163. [Google Scholar] [CrossRef] [PubMed]
- Zelenke, B.; O’Connor, C.; Barker, C.H.; Beegle-Krause, C.; Eclipse, L. General NOAA Operational Modeling Environment (GNOME) Technical Documentation; U.S. Department of Commerce: Seattle, WA, USA, 2012.
- National Oceanic and Atmospheric Administration (NOAA). Response Tools for Oil Spills. NOAA Office of Response and Restoration. 2021. Available online: https://response.restoration.noaa.gov/oil-and-chemical-spills/oil-spills/response-tools/response-tools-oil-spills.html (accessed on 8 November 2024).
- IPIECA. Oil Spill Preparedness and Response: An Introduction. 2019. Available online: https://www.ipieca.org/resources/oil-spill-preparedness-and-response-an-introduction-2019 (accessed on 8 November 2024).
- Fetissov, M.; Aps, R.; Goerlandt, F.; Jänes, H.; Kotta, J.; Kujala, P.; Szava-Kovats, R. Next-Generation Smart Response Web (NG-SRW): An operational spatial decision support system for maritime oil spill emergency response in the Gulf of Finland (Baltic Sea). Sustainability 2021, 13, 6585. [Google Scholar] [CrossRef]
- Kotta, J.; Fetissov, M.; Szava-Kovats, R.; Aps, R.; Martin, G. Online tool to integrate evidence-based knowledge into cumulative effects assessments: Linking human pressures to multiple nature assets. Environ. Adv. 2020, 2, 100026. [Google Scholar] [CrossRef]
- Vaher, A.; Kotta, J.; Szava-Kovats, R.; Kaasik, A.; Fetissov, M.; Aps, R.; Kõivupuu, A. Assessing cumulative impacts of human-induced pressures on reef and sandbank habitats and associated biotopes in the northeastern Baltic Sea. Mar. Pollut. Bull. 2022, 183, 114042. [Google Scholar] [CrossRef] [PubMed]
- Aps, R.; Tõnisson, H.; Anfuso, G.; Perales, J.A.; Orviku, K.; Suursaar, Ü. Incorporating dynamic factors to the Environmental Sensitivity Index (ESI) shoreline classification—Estonian and Spanish examples. J. Coast. Res. 2014, SI 70, 235–240. [Google Scholar] [CrossRef]
- Przeslawski, R.; Byrne, M.; Mellin, C. A review and meta-analysis of the effects of multiple abiotic stressors on marine embryos and larvae. Glob. Chang Biol. 2015, 21, 2122–2140. [Google Scholar] [CrossRef]
- Gunderson, A.R.; Armstrong, E.J.; Stillman, J.H. Multiple stressors in a changing world: The need for an improved perspective on physiological responses to the dynamic marine environment. Annu. Rev. Mar. Sci. 2016, 8, 357–378. [Google Scholar] [CrossRef] [PubMed]
- Fournier, M.; Hilliard, R.C.; Rezaee, S.; Pelot, R. Past, present, and future of the satellite-based automatic identification system: Areas of applications (2004–2016). WMU J. Marit. Aff. 2018, 17, 311–345. [Google Scholar] [CrossRef]
- Zodiatis, G.; De Dominicis, M.; Perivoliotis, L.; Radhakrishnan, H.; Georgoudis, E.; Sotillo, M.; Lardner, R.W.; Krokos, G.; Bruciaferri, D.; Clementi, E.; et al. The Mediterranean Decision Support System for Marine Safety dedicated to oil slicks predictions. Deep-Sea Res. II 2016, 133, 4–20. [Google Scholar] [CrossRef]
- Tabri, K.; Heinvee, M.; Laanearu, J.; Kollo, M.; Goerlandt, F. An online platform for rapid oil outflow assessment from grounded tankers for pollution response. Mar. Pollut. Bull. 2018, 135, 963–976. [Google Scholar] [CrossRef] [PubMed]
- Amir-Heidari, P.; Raie, M. Response planning for accidental oil spills in Persian Gulf: A decision support system (DSS) based on consequence modeling. Mar. Pollut. Bull. 2019, 140, 116–128. [Google Scholar] [CrossRef]
- Ciappa, A.C. Reverse trajectory study of oil spill risk in Cyclades Islands of the Aegean Sea. Reg. Stud. Mar. Sci. 2020, 41, 101580. [Google Scholar] [CrossRef]
- Ramachandran, G.; Groth, C.P.; Huynh, T.B.; Banerjee, S.; Stewart, P.A.; Engel, L.S.; Kwok, R.K.; Sandler, D.P.; Stenzel, M. Using real-time area VOC measurements to estimate total hydrocarbons exposures to workers involved in the Deepwater Horizon oil spill. Ann. Work Expo. Health 2022, 66 (Suppl. S1), i156–i171. [Google Scholar] [CrossRef] [PubMed]
- Sun, Y.; Li, S. Real-time collaborative GIS: A technological review. ISPRS J. Photogramm. Remote Sens. 2016, 115, 143–152. [Google Scholar] [CrossRef]
- Koski, C.; Rönneberg, M.; Kettunen, P.; Eliasen, S.; Hansen, H.S.; Oksanen, J. Utility of collaborative GIS for maritime spatial planning: Design and evaluation of Baltic Explorer. Trans. GIS 2021, 25, 1347–1365. [Google Scholar] [CrossRef]
- Goerlandt, F.; Laine, V.; Bal Beşikçi, E.; Baldauf, M.; Al-Quhali, M.A.; Koldenhof, Y. End-user and stakeholder views on selected risk assessment tools for marine oil spill preparedness and response, including future research and development needs. TransNav Int. J. Mar. Navig. Saf. Sea Transp. 2019, 13, 213–220. [Google Scholar] [CrossRef]
- Halonen, J.; Lanki, A. Efficiency of maritime simulator training in oil spill response competence development. TransNav Int. J. Mar. Navig. Saf. Sea Transp. 2019, 13, 199–204. [Google Scholar] [CrossRef]
- Luokkala, P.; Nikander, J.; Korpi, J.; Virrantaus, K.; Torkki, P. Developing a concept of a context-aware operational picture. Saf. Sci. 2017, 93, 277–295. [Google Scholar] [CrossRef]
- Daling, P.S.; Sørheim, K.R. Characterization of Low Sulfur Marine Fuel Oils (LSFO): A New Generation of Marine Fuel Oils. SINTEF Summary Report, 2020, 5. Available online: https://www.itopf.org/fileadmin/uploads/itopf/data/Documents/RDaward/Summary_Report_Sintef_Low_sulphur_fuel_oils.pdf (accessed on 7 December 2024).
Disclaimer/Publisher’s Note: The statements, opinions and data contained in all publications are solely those of the individual author(s) and contributor(s) and not of MDPI and/or the editor(s). MDPI and/or the editor(s) disclaim responsibility for any injury to people or property resulting from any ideas, methods, instructions or products referred to in the content. |
© 2024 by the authors. Licensee MDPI, Basel, Switzerland. This article is an open access article distributed under the terms and conditions of the Creative Commons Attribution (CC BY) license (https://creativecommons.org/licenses/by/4.0/).


