Article

Multi-Stage Screening Purification: A New and Effective Method for Cleaning Diatom Samples from Marine Sediments

1
Key Laboratory of Tectonics and Petroleum Resources, China University of Geosciences, Ministry of Education, Wuhan 430074, China
2
School of Earth Resources, China University of Geosciences, Wuhan 430074, China
3
College of Marine Science and Technology, China University of Geosciences, Wuhan 430074, China
4
Hubei Key Laboratory of Marine Geological Resources, China University of Geosciences, Wuhan 430074, China
5
State Key Laboratory of Deep Oil and Gas, China University of Petroleum (East China), Qingdao 266580, China
6
Power China Zhongnan Engineering Corporation Limited, Changsha 410014, China
7
Key Laboratory of Marine Mineral Resources, Ministry of Natural Resources, Guangzhou Marine Geological Survey, Guangzhou 510760, China
*
Authors to whom correspondence should be addressed.
J. Mar. Sci. Eng. 2025, 13(2), 187; https://doi.org/10.3390/jmse13020187
Submission received: 15 November 2024 / Revised: 14 January 2025 / Accepted: 16 January 2025 / Published: 21 January 2025
(This article belongs to the Section Geological Oceanography)

Abstract

:
Diatoms are critical indicators in marine paleoecology and contemporary ecosystem studies, yet the accuracy of diatom analysis depends on effective purification methods. Current screening and purification techniques often yield low accuracy. This study introduces a multi-stage screening purification method that integrates both physical and chemical techniques to enhance the extraction of diatom remains from marine sediments, thereby improving the reliability of subsequent analysis. Using surface sediment samples from the Pacific Ocean, we compared the effectiveness of three purification methods: heavy liquid suspension purification, single-layer screening purification, and the newly developed multi-stage screening purification method. The study aimed to evaluate the impact of each method on diatom abundance, valve size distribution, and the accuracy of taxonomic identification. The results revealed that the multi-stage method significantly improved the accuracy of diatom abundance calculation. With this method, diatom abundance was 21.9 times higher than that obtained using the heavy liquid suspension method and 6.5 times higher than that obtained using the single-stage method. This method also proved to be cost-effective, easy to use, and produced samples with low impurity levels, which enhanced microscopic observation, identification, and the reliability of taxonomic statistics. Key factors influencing diatom abundance included sieve pore size, heavy liquid concentration, and valve size and density, while the type of acid and oxidant had minimal effect. Additionally, the multi-stage screening method facilitated the classification of diatoms into various size categories, providing a comprehensive view of diatom size distribution, including nano-sized diatoms (diameter < 20 μm) that are often overlooked in traditional studies. These findings demonstrate that the multi-stage screening purification method is an effective tool for improving the analysis of diatom remains in sediments, potentially refining the accuracy of diatom-based environmental investigations and paleoceanographic reconstructions.

1. Introduction

Marine sediments are critical repositories of Earth’s geological, biological, and paleoenvironmental history. They house diverse biological, and geochemical records, serving as key proxies for understanding global climate change, Earth’s biogeochemical systems, and paleoenvironmental reconstruction. They also play an important role in biostratigraphy and dating [1]. Among the biological indicators preserved within marine sediments, diatoms—microalgae with siliceous valves—are especially valuable due to their high stability and preservation potential [2]. Diatom remains can contribute significantly to the biogenic fraction of marine sediments and serve as reliable proxies for tracing marine ecosystem evolution, past climate, and environmental changes over space and time [3].
Diatoms are widely distributed across the oceans and contribute significantly to marine primary productivity, playing pivotal roles in the nutrient cycles, energy flows, and self-regulation of marine ecosystems. Their ecological importance is underscored by their sensitivity to environmental changes. The species composition and abundance of diatoms in sediments are influenced by factors such as temperature, salinity, pH, and nutrient availability [4]. Distinct diatom taxa thrive in specific conditions: cold-water diatoms, for example, are prominent in polar regions, while warm-water taxa proliferate in equatorial and tropical zones. These distributions allow researchers to use diatoms as indicators of past climate variability [5]. Additionally, as primary producers, diatoms fix carbon dioxide through photosynthesis, providing the base energy for the marine food chain and influencing the marine carbon cycle [6]. Consequently, studying diatoms in marine sediments offers critical insights into both current and past environmental dynamics. Despite their scientific value, diatom-based studies in marine sediments face considerable challenges due to the complex composition of the sediment matrix, which often includes a mixture of inorganic minerals, organic compounds, and other impurities. This complexity complicates the purification, isolation, and analysis of diatom remains [7]. Furthermore, the siliceous structure of diatom valves, while generally robust, is prone to damage under certain physical and chemical conditions, making it essential to employ careful separation techniques to preserve the integrity of diatom valves and ensure the accuracy of data analysis [8]. These challenges have driven the development of diatom purification methods to enhance sample quality and ensure reliable analyses.
To address these challenges, researchers have developed various diatom separation and purification techniques, incorporating both physical and chemical methods. Each method offers specific advantages and limitations regarding purification efficiency, structural preservation, operational cost, and suitability across different sediment types. Early advancements in diatom purification include the work of Shemesh et al. (1988), who introduced differential sedimentation techniques to improve sediment separation efficiency [9]. This was later enhanced by incorporating heavy liquid flotation methods to achieve more refined purification outcomes [10,11]. A recent innovation by Vilhena et al. (2021) utilized split-flow lateral-transport thin fractionation (SPLITT), which uses gravity to separate particles based on size and density [12]. While physical methods are effective, they are sometimes limited by sample losses, which may bias the representation of the original diatom assemblage, affecting interpretations [13]. Chemical treatments offer an alternative purification approach, using oxidants and acids to remove organic matter and carbonates from sediment samples. For instance, mixed oxidant HClO4 + HNO3 or H2O2 + HCl are frequently used for the effective removal of contaminants. However, the strong oxidizing properties of these chemicals can damage diatom structures, as noted by Robinson et al. (2004), who recommended milder 30% H2O2 to avoid strong oxidants eroding the organic matter embedded in diatom frustules [14]. Similarly, Hatte et al. (2008) reported that CrO3/H2SO4 effectively removes organic matter but can also damage the diatom shell structure [15,16]. Therefore, to achieve optimal purification of diatom sediments, it is necessary to carefully adjust the type of oxidant, concentration, temperature, and treatment time, and further optimize experimental conditions to maximize both the purity and structural integrity of diatoms [17,18].
Considering factors such as individual diatom valve diameter, valve integrity, and the efficiency of impurity removal, this study builds on previous research by systematically reviewing existing diatom purification techniques and evaluating their applicability to marine sediments [19,20]. Using surface sediments from the Equatorial Western Pacific Warm Pool as a case study, we assess the effectiveness of various methods for isolating diatoms, considering parameters like valve diameter, impurity removal efficiency, and valve integrity. Based on these evaluations, we propose a newly developed multi-stage screening method approach that enhances the separation of diatoms across different sizes while maintaining valve integrity and improving treatment efficiency. Our findings provide a robust methodological foundation for future applications in paleoenvironmental reconstruction, ecological monitoring, and climate change research, advancing diatom analysis to meet the evolving needs of environmental science and ecological conservation [21].

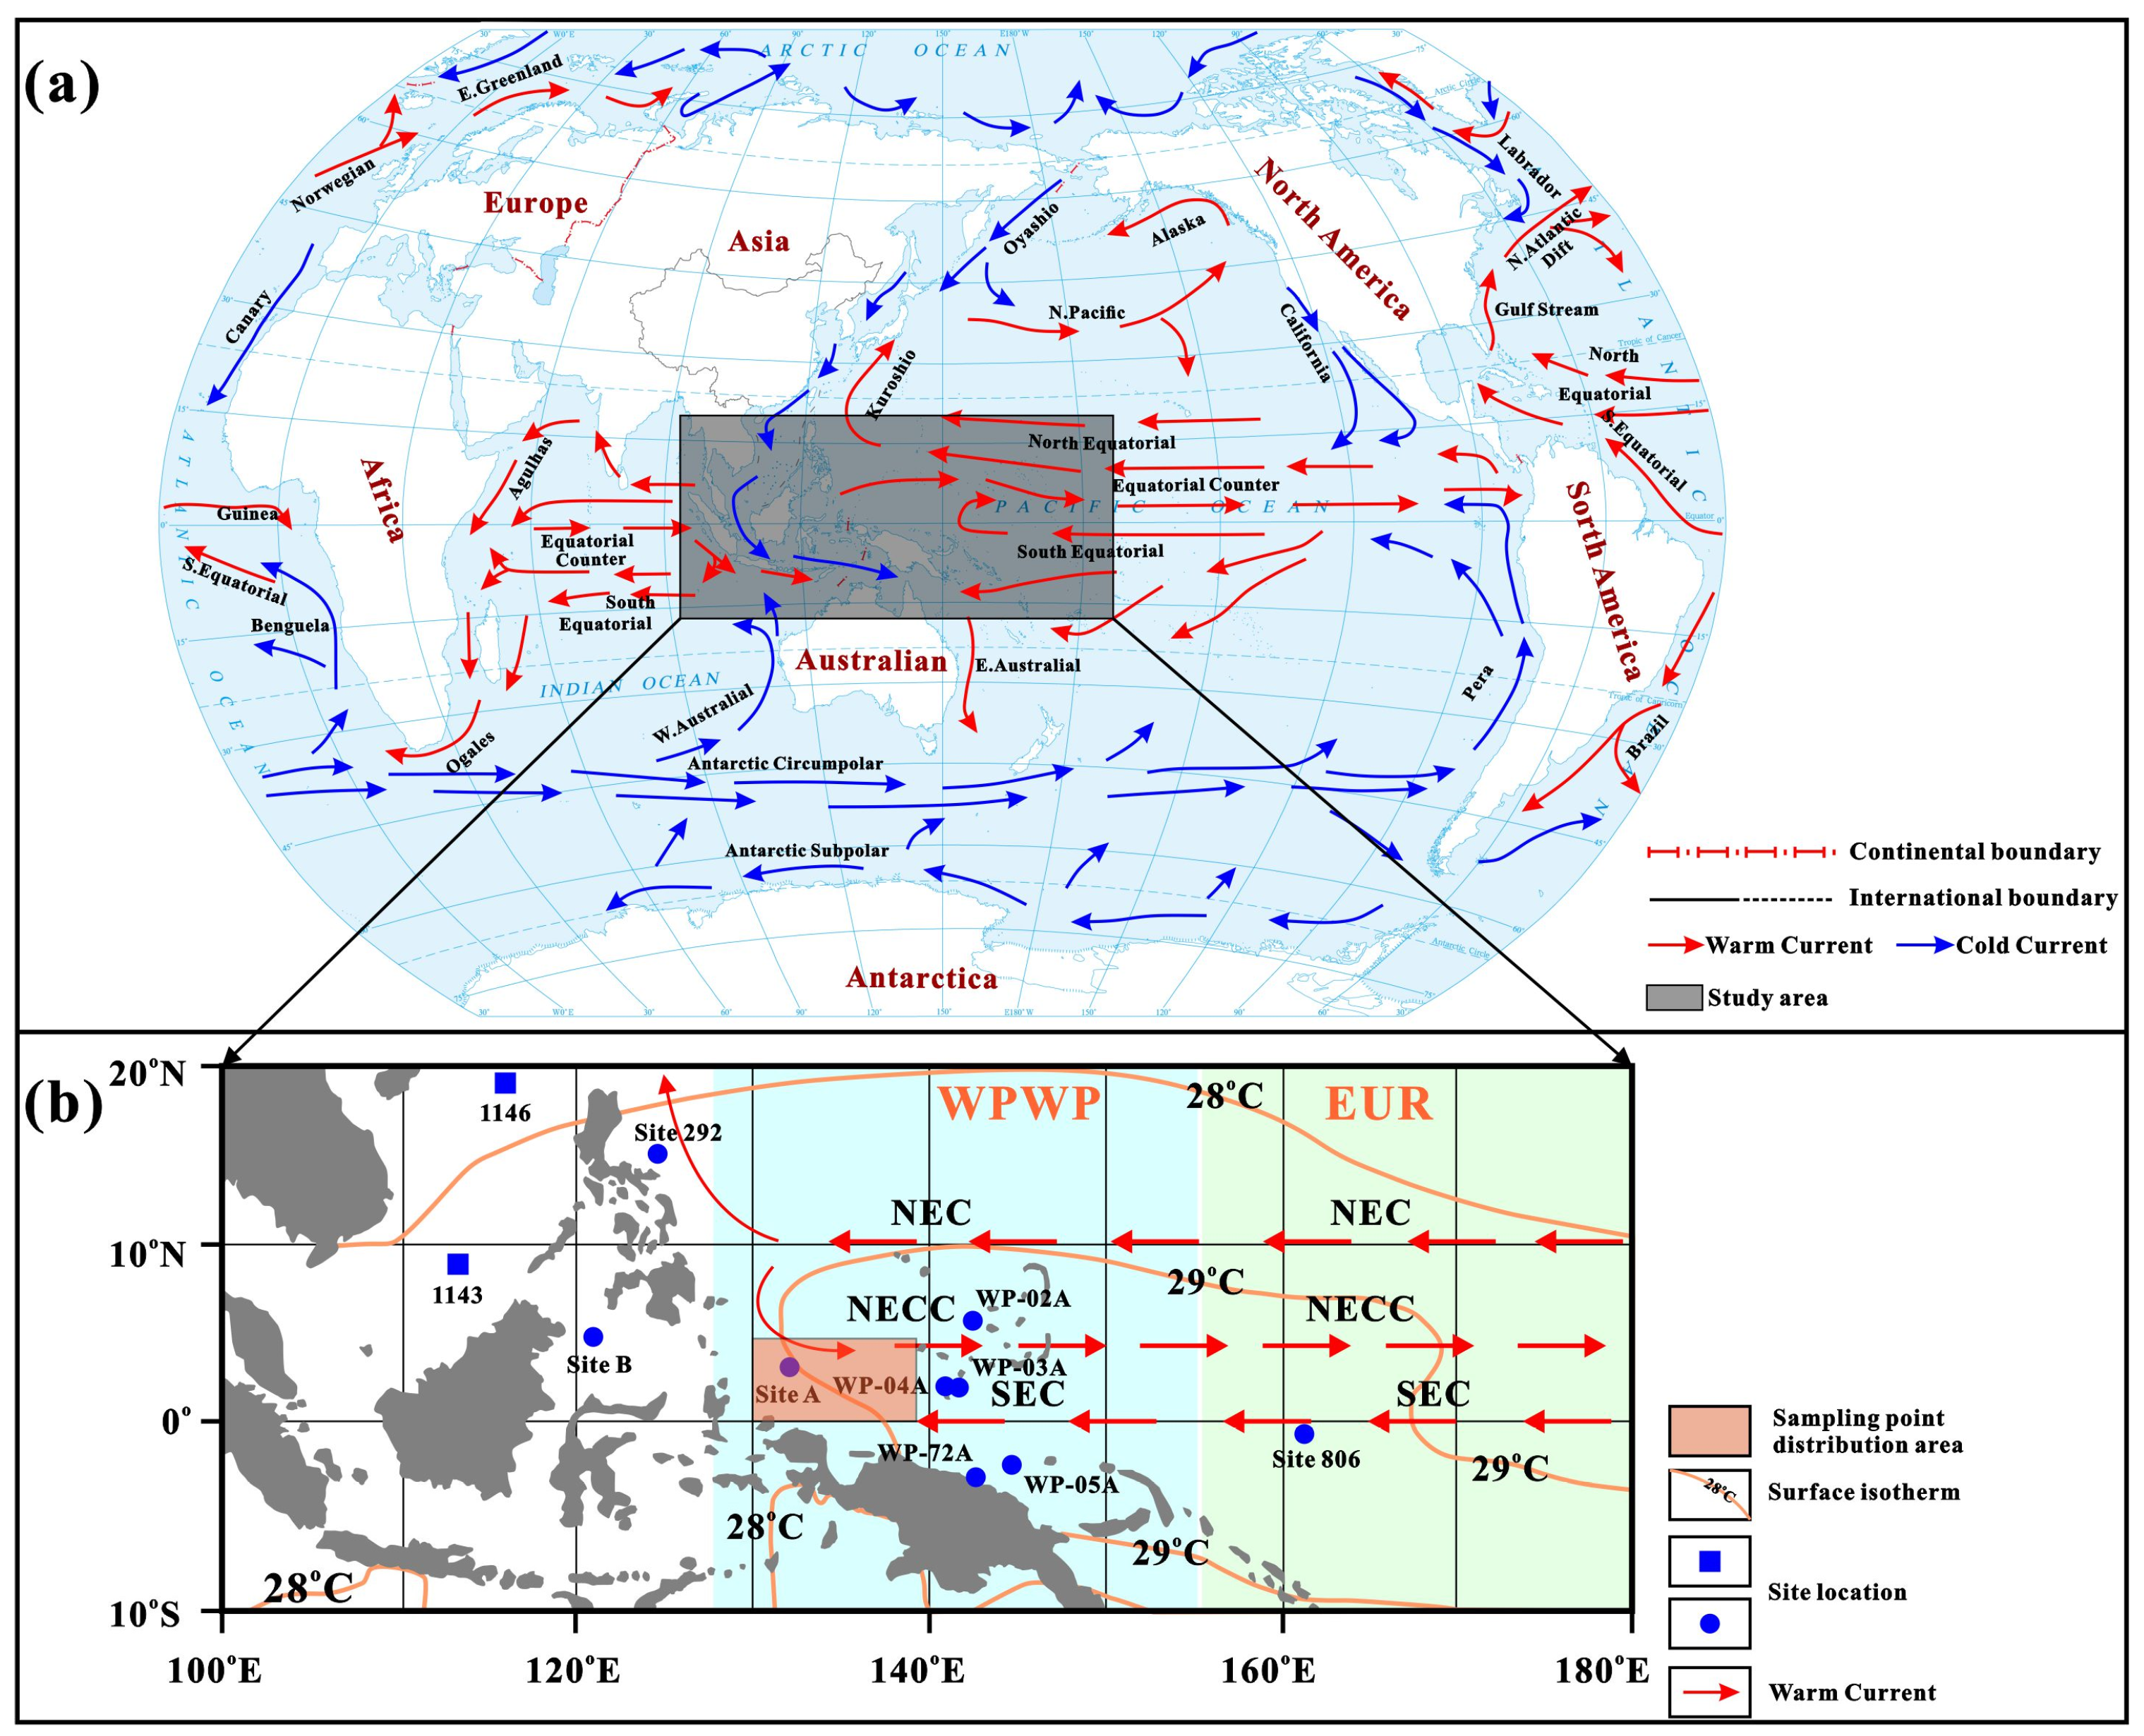
2. Geological Setting

The Western Pacific region hosts one of Earth’s most significant subduction zones, characterized by an irregular boundary marked by numerous islands and complex ocean current systems [22]. Three primary ocean currents dominate the western Pacific: the North Equatorial Current (NEC, 10 ºN–25 ºN), the North Equatorial Counter Current (NECC, 4 ºN–10 ºN), and the South Equatorial Current (SEC, 4 ºN–20 ºS) (Figure 1a,b) [23,24,25]. As the NEC flows westward around 14 ºN–15 ºN, it bifurcates upon encountering the Philippine Islands, dividing into the northward-flowing Kuroshio Current (KC) and the southward-flowing Mindanao Current (MC). The MC subsequently turns eastward near Halmahera Island, forming the NECC. The SEC veers north along New Guinea’s coast due to topographic influence while migrating westward, merging into the NEC around Halmahera Island. Additional coastal and subsurface currents exist near New Guinea, specifically the New Guinea Coastal Current (NGCC) and New Guinea Coastal Undercurrent (NGCUC). The NGCC is significantly impacted by seasonal monsoons, flowing eastward in winter and northwestward in summer, while the NGCUC consistently flows northwestward along the coast. Moreover, surface currents from the South China Sea pass through the Indonesian archipelago, merging with the NEC [26].
Prolonged solar radiation on both sides of the equator, combined with the westward flow of the South and North Equatorial Currents, creates the globally warmest region from the Western Pacific to the Eastern Indian Ocean. This results in the accumulation of warm water in the Western Equatorial Pacific, forming the world’s largest expanse of warm open-sea water, known as the Western Pacific Warm Pool. The warm pool maintains an annual water temperature above 28 °C, generally 2 to 6 °C higher than other equatorial regions, with the core area north of New Guinea averaging over 29 °C [25,27,28]. The thermocline within the warm pool reaches depths of 100 to 150 m (Figure 1b) [25]. Beyond high temperatures, the Western Pacific Warm Pool is the key source of oceanic heat and water vapor and serves as the convergence zone for three major monsoon systems. Its extensive heat reserves significantly influence global climate patterns, particularly in relation to the Southern Oscillation and El Niño [25]. In addition, the high heat and water vapor in this region contribute to abundant annual precipitation, low surface seawater salinity, and a deep nutrient layer, leading to elevated biological productivity. Consequently, sediments in this area are rich in diatom frustules. Previous studies have focused on the remains of these siliceous microorganisms preserved in the sediments, aiming to reconstruct past productivity and sedimentation regimes in the region [25,29].

3. Materials and Methods

3.1. Sampling

The samples were collected by a Chinese marine scientific research vessel near the Equator in the Western Pacific Ocean. A total of 9 drill sites were established at sampling points between 0 ºN–20 ºN, 100 ºE–180 ºE and 0 ºS–10 ºS, 100 ºE–180 ºE (Figure 1b). The marine sediments are black, brown, and brownish-yellow, containing abundant clay minerals, detrital minerals, and considerable amounts of shallow marine biological debris and diatom valves. In accordance with the sampling principles of previous studies [30], 27 surface sediment samples, particularly enriched in diatom remains, were selected for this study. The sample numbers are as follows: D 122-105, D 122-106, D 28-26, D 151-14, D 28-40, D 132-29, 122-68, D 122-123, D 122-222, D 91, D 87-15, D 28-22, D 69-5, D 87-6, D 132-23, D 81, D 72, D 69-14, D 28-2, D 133, D 87-1, D 122-10, D 119-29, D 57, D 51, D 45, and D 58. These samples consist mainly of soft oceanic mud, with a smooth and sticky texture, and colors ranging from milky white to dark brown. The selected samples were subjected to oxidation and acidification to remove impurities such as organic matter and carbonate minerals. Various experimental methods, as outlined in the following section, were then applied for both qualitative and quantitative statistical analyses of diatom content, enabling the evaluation of the efficacy of different screening methods.

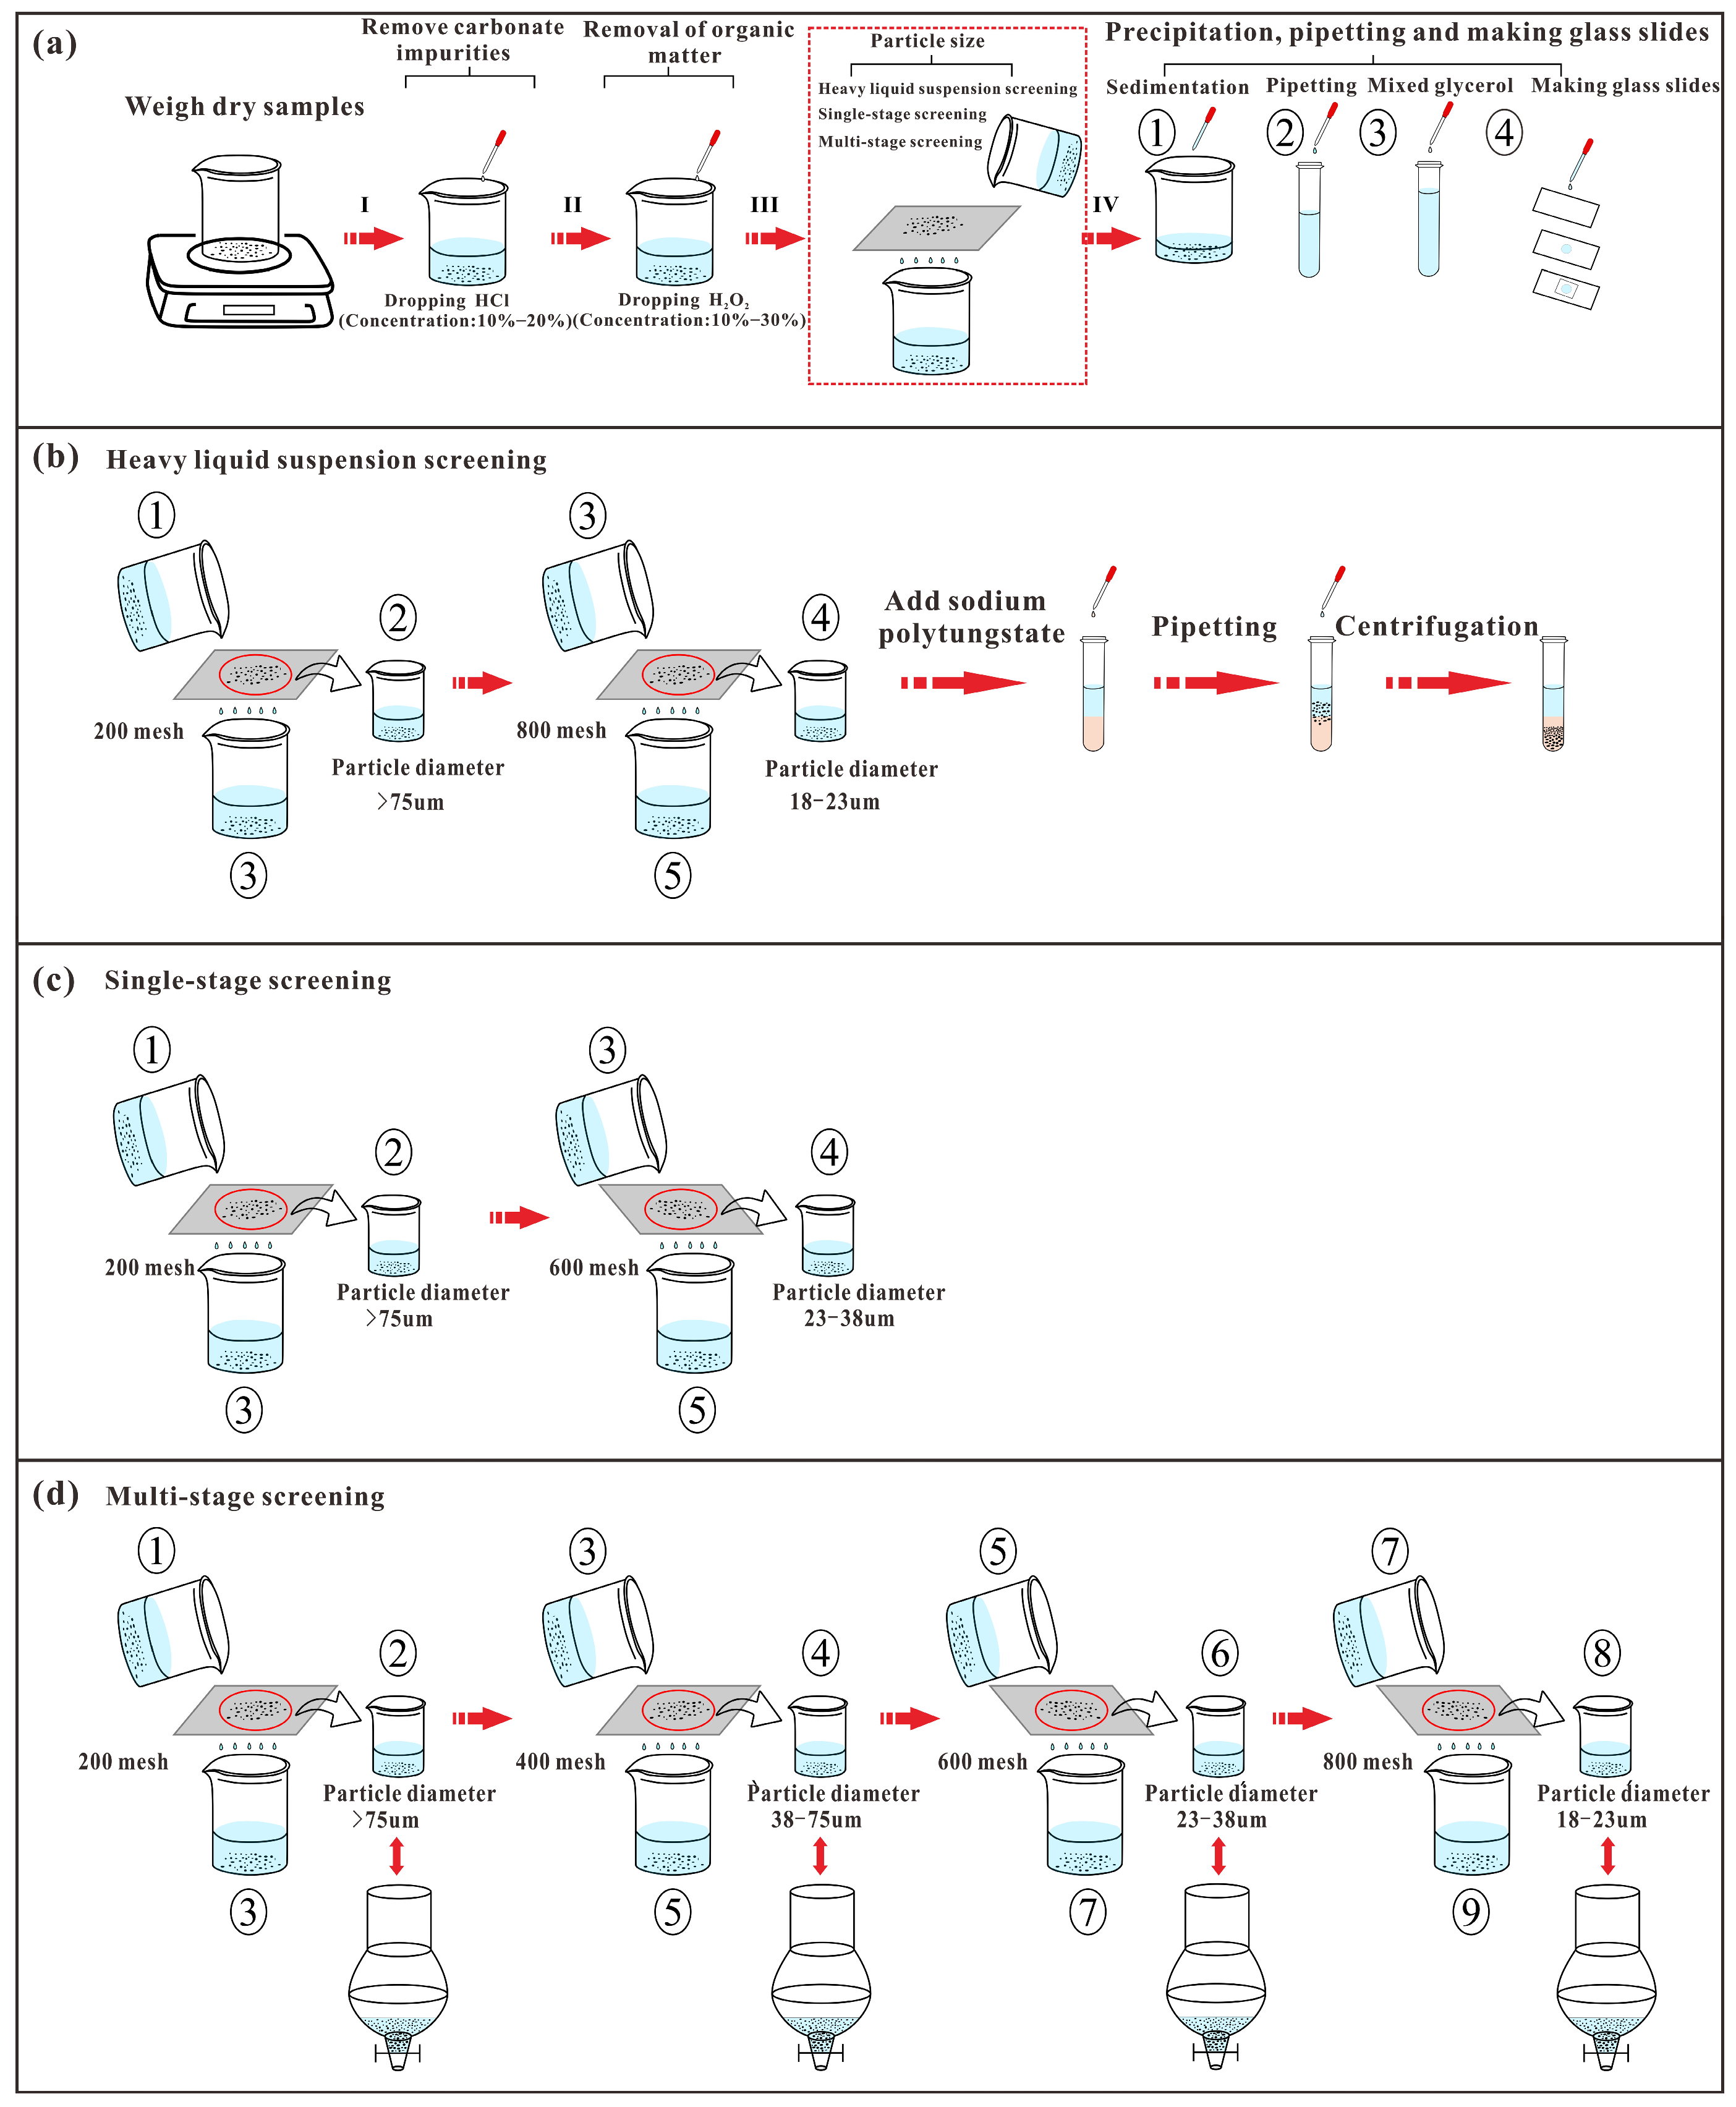
3.2. Experimental Method

Various diatom screening methods for marine sediments have been developed, with the primary techniques being chemical purification and physical separation (Figure 2a) [30,31]. Chemical treatment aims to remove impurities such as organic matter and carbonate minerals, while physical separation isolates diatoms from marine sediments to produce relatively pure samples. Both methods aim to enhance diatom purity by minimizing the content of impurities. To evaluate the advantages and limitations of different purification methods across various marine sediments, this study combines physical separation and chemical purification techniques. The diatom purification methods are classified into two categories: the heavy liquid suspension screening method (Figure 2b) and the single-stage screening purification method (Figure 2c) [9,11,30,31]. In this study, a new multi-stage screening purification method was established by combining physical separation and chemical purification theory (Figure 2d). Meanwhile, the same batch of samples was screened using the above three experimental methods.
The heavy liquid suspension screening method (Figure 2b) involves several key steps [9,11]. Firstly, approximately 3 to 5 g of dry sample was weighed and placed in a 200 mL beaker in a fume hood. Dilute hydrochloric acid (HCl, 10~20% concentration) was then added dropwise with a pipette, with the rate adjusted according to the intensity of the reaction between the sample and the acid. Then, after the reaction intensity of the sample was weakened, it was allowed to stand for 24 h, and the beaker was covered with a plastic wrap to make the sample fully react with hydrochloric acid. After standing, additional dilute HCl was added dropwise; if no bubbles are produced, this indicates the complete reaction of all carbonate minerals (Step I). Ultrapure water was added to dilute the solution, and the sample was left to stand for another 24 h. The supernatant was then removed, and this rinsing process was repeated until the pH was neutral or slightly acidic (around 7). In the second step, hydrogen peroxide (H2O2, 10~30% concentration) was added to remove organic matter (Step II). To control the reaction rate and prevent sample loss due to excessive bubbling, H2O2 was added in stages until all organic matter was eliminated, indicated by the cessation of bubbling. The sample was diluted again with ultrapure water, left to stand for 24 h, and the supernatant was removed. This rinsing step was repeated 3 to 5 times to thoroughly wash out excess H2O2 (Figure 2a). After the removal of carbonate minerals and organic matter, the preparation of the heavy liquid suspension was critical. A 1% (NaPO4)6 solution was added, and the mixture was shaken well and left to stand for 3 to 6 h. Ultrasonic oscillation and centrifugation were then used to remove the supernatant, followed by 3 to 5 rinses with ultrapure water to help remove clay and larger dispersed particles. Three types of heavy liquid suspension purification reagents were available: sodium polytungstate (2.1 g/cm3), a KI and CdI mixed solution (2.1 g/cm3), and zinc bromide solution at either 2.0 g/cm3 or 2.3 g/cm3. After centrifugation, the sample was carefully separated to remove the supernatant and avoid excessive dilution of the heavy liquid. The sample was shaken and recentrifuged, resulting in clear stratification. The upper layer was then transferred to a new centrifuge tube with a pipette, and these steps can be repeated as needed to ensure optimal purification of the diatoms.
The single-stage screening purification method (Figure 2c) follows the same initial steps as the heavy liquid suspension screening method for removing carbonates (Step I) and organic matter (Step II). The final and exclusive step in the single-stage screening method was impurity removal through sieving. Two sieves with pore sizes of 200 mesh (75 μm) and 600 mesh (23 μm) were used sequentially. Both sieves were rinsed with ultrapure water 6 to 8 times to ensure purity. The material retained on the 600 mesh sieve was collected in a 200 mL beaker, sealed, and left to stand for 24 h. After the supernatant was removed, the flocculent material at the bottom was transferred to a 20 mL test tube for further analysis.
To address the limitations of previous methods, this study introduces a multi-stage screening purification method (Figure 2d) as the core treatment technique. The early stage of the experiment for removing impurities such as carbonates (Step I) and organic matter (Step II) follows the same procedures as the heavy liquid suspension sieve purification method. Unlike the single-stage screening purification method, the final step in our experiment involved a multi-stage sieving process for further purification. The sieves used include 200 mesh (75 μm), 400 mesh (38 μm), 600 mesh (23 μm), and 800 mesh (18 μm). As shown in Figure 3d, the sieving process began with the 200 mesh sieve, which removes the majority of the larger debris particles. The solution was then passed through a 400 mesh sieve (38 μm), followed by sieves with progressively finer meshes: 600 mesh (23 μm) and 800 mesh (18 μm). Each sieve was rinsed with ultrapure water until the rinsing water was clear. The purified components collected on the sieves were transferred to a screening funnel, where diatom valves were further purified and concentrated through natural sedimentation. The flocculent material at the bottom was then collected in a 20 mL test tube for further analysis.

3.3. Analytical Method

After purification and enrichment, the solution containing diatom remains was carefully pipetted onto a clean glass slide. A small amount of the solution was evenly spread across the center of the slide, covering an area of approximately 2 cm × 2 cm. The slide was then left to air-dry naturally or placed on a low-temperature heating plate for faster drying. Once dried, a suitable amount of Canadian balsam or neutral resin was applied to the cover glass. The cover glass was gently pressed, and the sample was gently heated to ensure that the resin was fully diffused and any bubbles were completely expelled. The slide was then exposed to ultraviolet light for 10 to 15 min to cure the resin. Once the resin was fully cured, the slide was numbered and prepared for diatom identification. Identification and statistical analysis of the diatoms were performed primarily using a light microscope and a desktop scanning electron microscope (SEM). The light microscope was mainly used for counting the number of diatoms, while the SEM was employed to capture characteristic images of different diatom species. The glass slides were observed under the following magnifications: 10 × eyepiece, with objective lenses of 5 ×, 10 ×, 20 ×, 40 ×, 50 ×, and 60 ×. All diatom valves present on the slides were counted at a magnification of 400 ×, 500 × or 600 ×. During the identification process, photo-graphs of the main diatom taxa were taken, and detailed images of the microscopic features were captured using the SEM on newly prepared slides prepared without glass covers. The primary focus of this study was to count the number of diatoms, while identification was secondary. For each sample, 2 to 3 slides were prepared. According to the statistical principle for incomplete and fragmented diatoms, a diatom valve had to be more than half visible to be counted as a complete valve, and fragments within the central area of the diatom were recorded as complete valves [32]. The classification and identification of diatoms were based on established reference works, including the “European diatom identification system” [33], “China Marine Algae” [34], “China Marine planktonic diatoms” [35], and related diatom literature [36,37].
The abundance of diatom frustules in each sample was calculated after statistical identification. The formula for calculating the absolute abundance of diatom frustules in each sample is as follows:
N m = n m 1 + n m 2 + n m 3 + n m 4 G
n m i = u × L l
In the formula:
N m is the total abundance of m sample, and the unit is valves/g; n m i is the number of diatom frustules in sample i of sample m;
G is the dry weight of the sample, and the unit is g;
u is the number of diatom frustules observed;
L is the volume of the solution after the constant volume of the sample, and the unit is ml;
l is the sampling amount of the glass, and the unit is mL.
To evaluate the enrichment degree of diatom frustules across the four levels of screening defined by the multi-stage screening method, the Average Contribution Rate (ACR) was introduced. This method assesses how much each level contributes to the overall diatom fossil abundance. The formula for the average contribution rate is:
C i = 1 M ( n m i / N m ) M × 100 %
In the formula:
C i is the average abundance contribution rate, and the unit is %;
M is the total number of samples.
This average contribution rate helps in understanding the relative enrichment of diatom frustules at each screening level, providing insight into the distribution of diatoms across the different purification stages.

4. Results

4.1. Morphology and Size of Diatom Remains

Observations through the light microscope and SEM reveal a diverse range of diatom morphologies. A significant portion of the diatoms are disc-shaped, spherical, cylindrical, and triangular while a small number are needle-shaped, wedge-shaped, rectangular, and spindle-shaped. The internal characteristics of diatom valves are also noteworthy. SEM imaging shows that many disc-shaped diatoms possess numerous pores, arranged in a highly regular pattern. The internal pore structure of different diatom types is characterized by central radiation, central symmetry, or bilateral symmetry. The size of the diatom valves varies widely, with typical and well-preserved valves ranging from a few microns to several millimeters. Additionally, a large number of diatom fragments were observed, ranging from tens to hundreds of microns. Some samples contain a substantial amount of diatom valve fragments, which are likely the result of the diatom deposition process. (Figure 3) [33,34,35,36,37].

4.2. Distribution Characteristics of Diatom Abundance

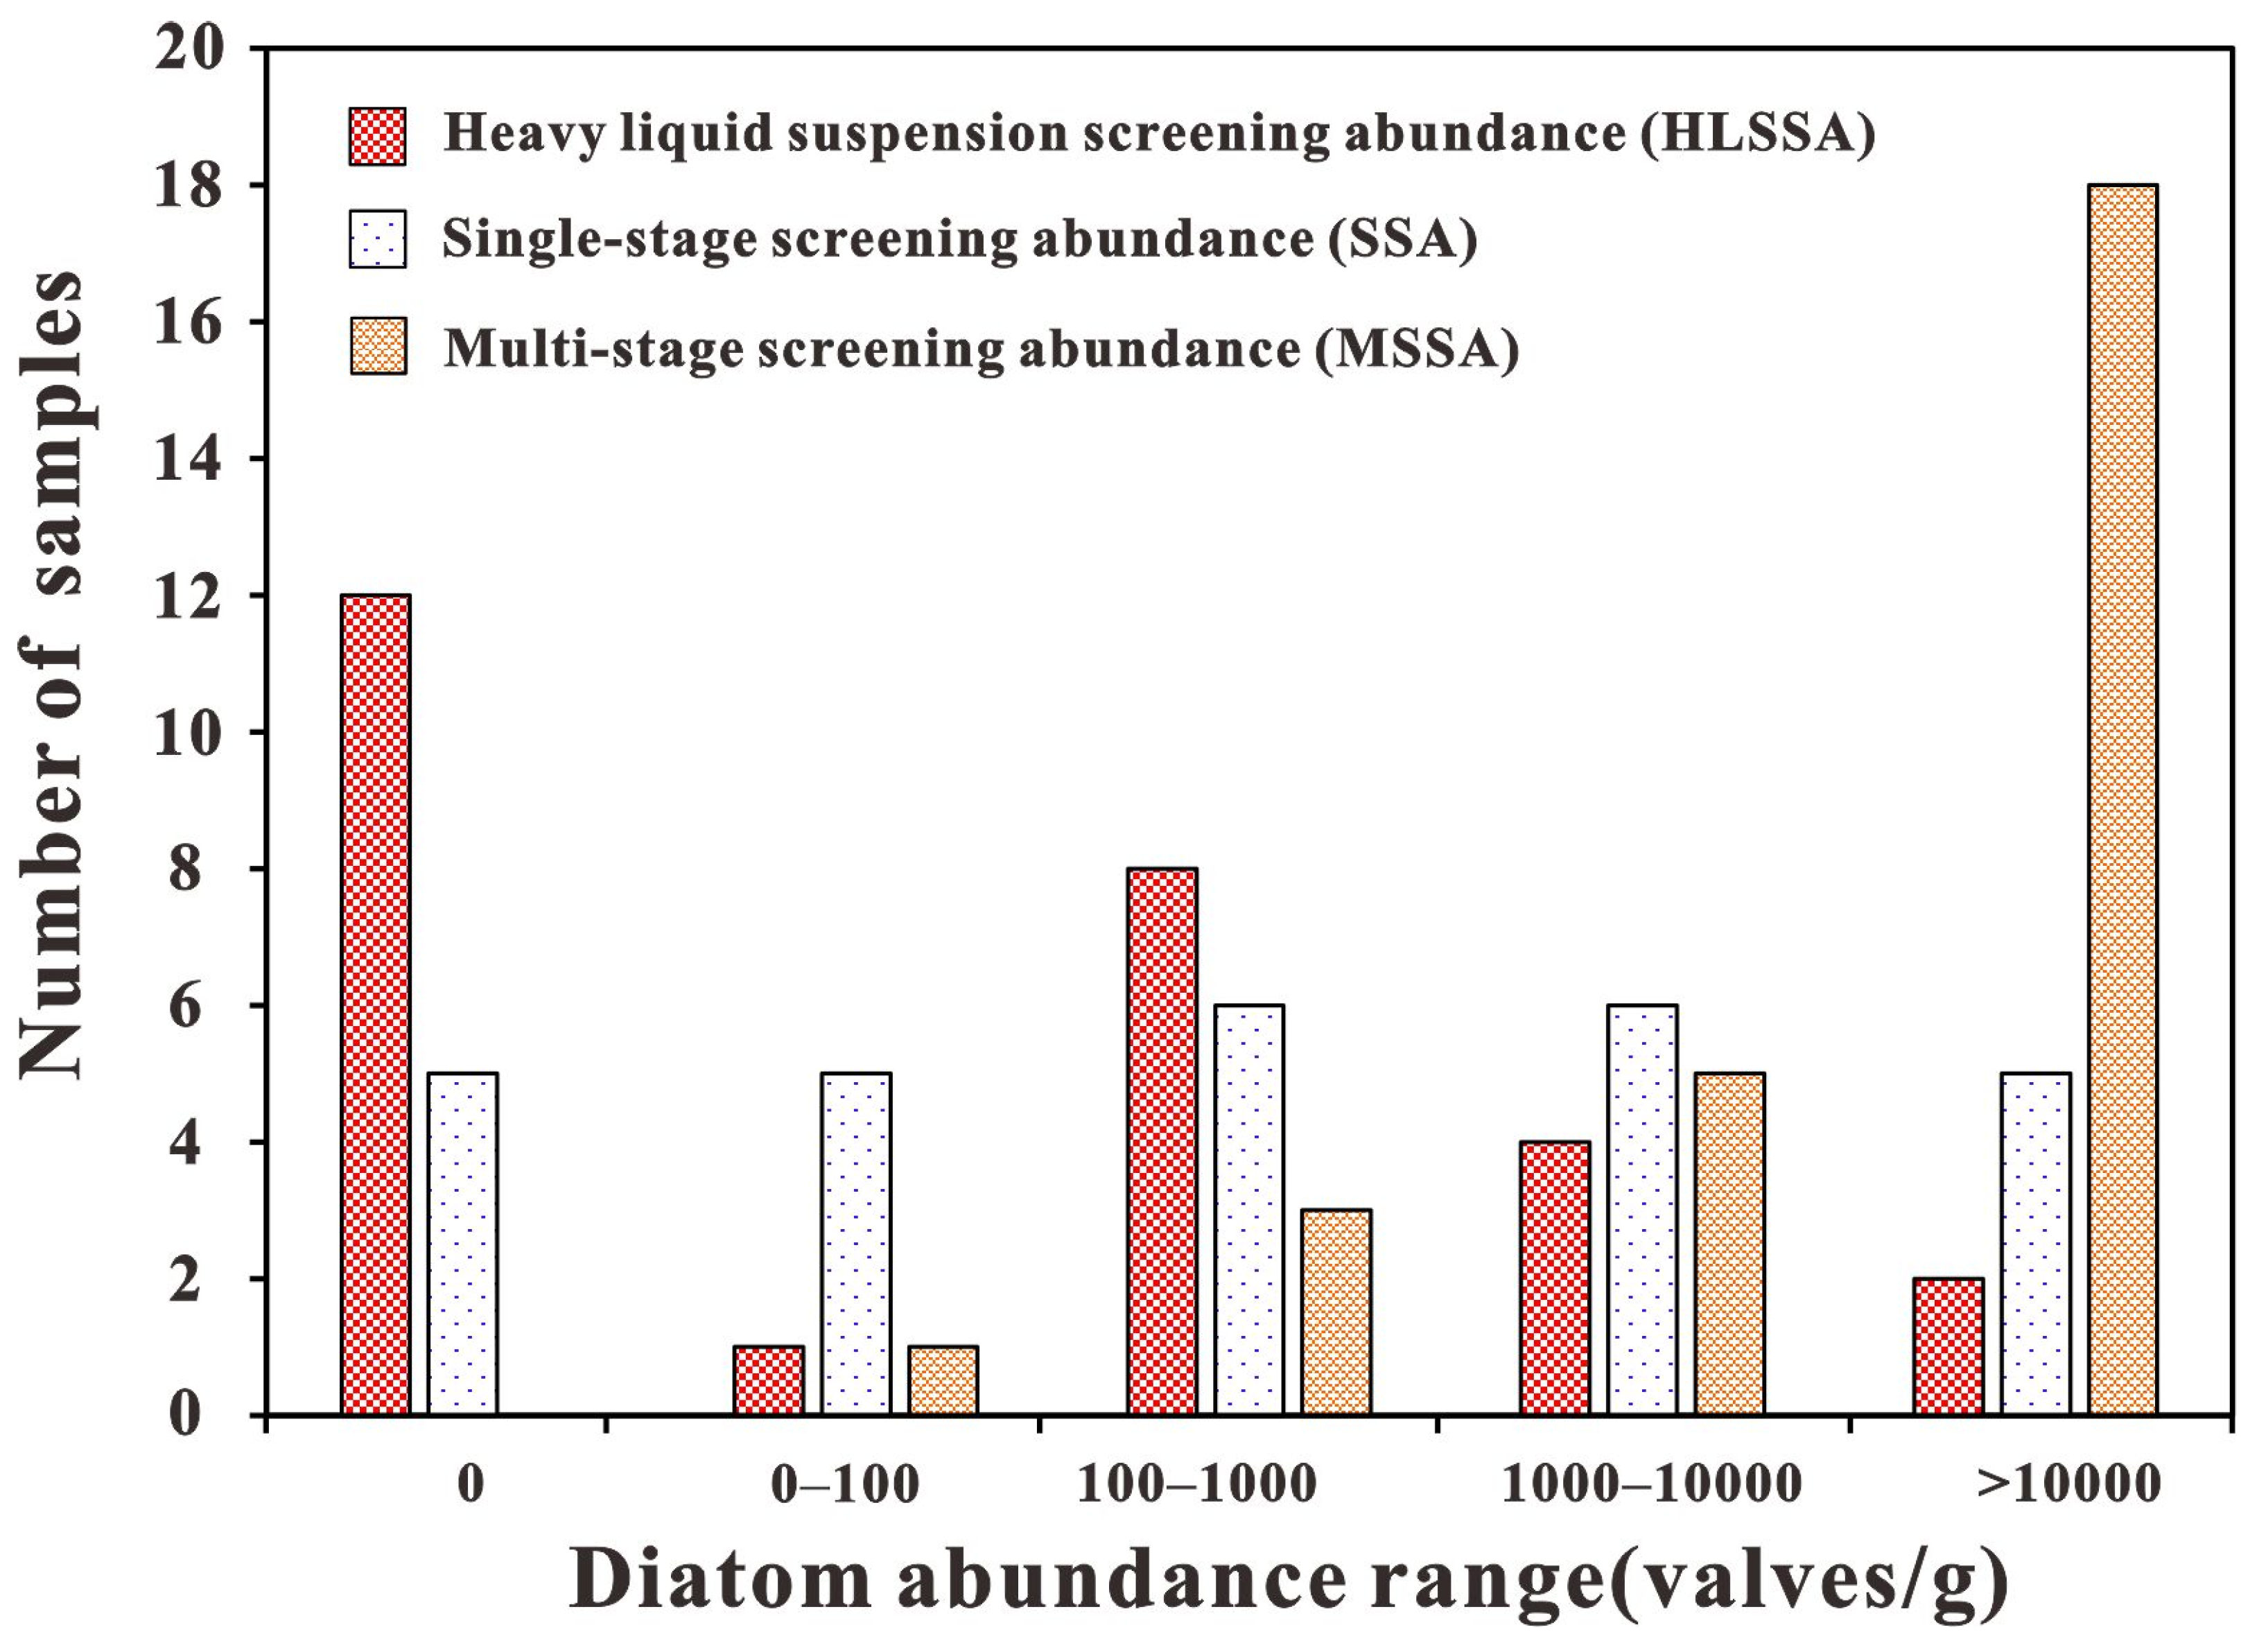
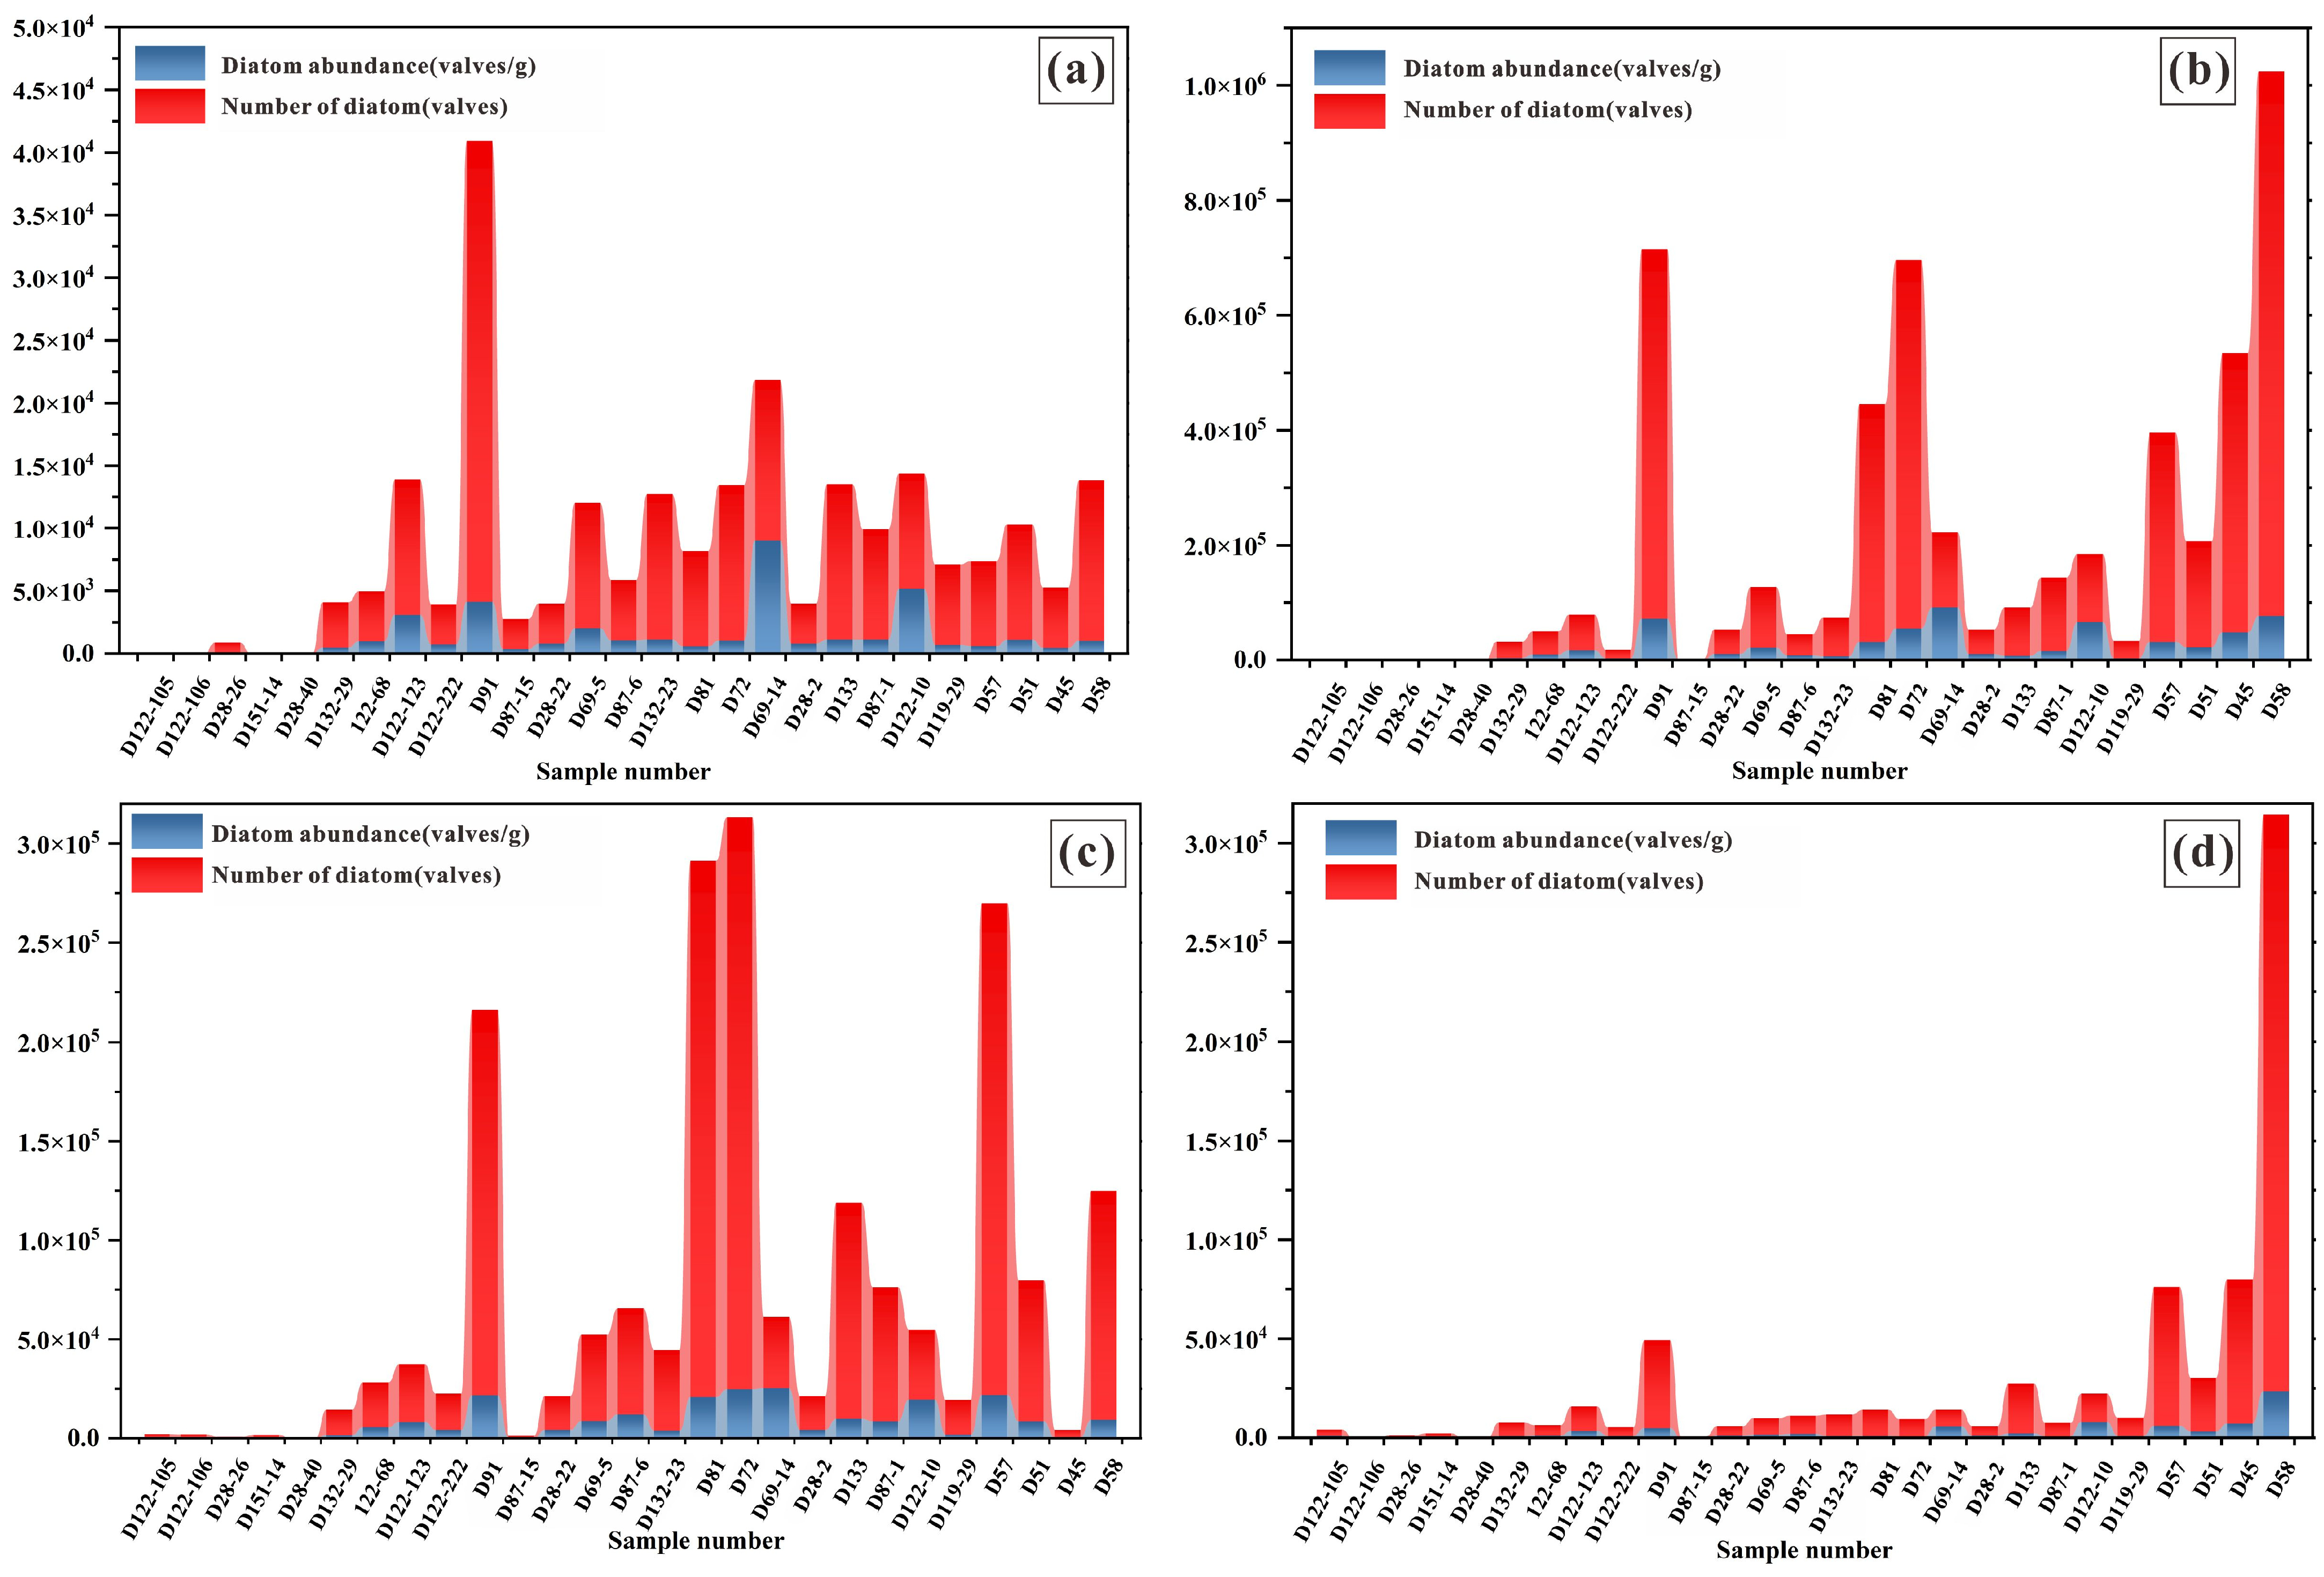
4.2.1. Heavy Liquid Suspension Purification

The diatom abundance ranges from 0.00 to 12,456.2 valves/g, with an average abundance of 1921.4 valves/g (Table 1, Table 2 and Table 3). In particular, in 12 samples (the proportion is 44.0%), no diatom valves were found. These samples are D 122-105, D 122-106, D 28-26, D 151-14, D 28-40, D 132-29, 122-68, D 122-123, D 91, D 28-22, D 87-6, and D 72; in one sample (4.00%), the abundance ranged from 0.00 to 100 valves/g, specifically sample D 87-15; in eight samples (30.0%), the abundance ranged from 100 to 1000 valves/g, with sample numbers D 122-222, D 69-5, D 132-23, D 81, D 69-14, D 122-10, D 133, and D 87-1; in four samples (15.0%), the abundance ranged from 1000 to 10,000 valves/g, represented by samples D 28-2, D 119-29, D 57, and D 45; in two samples (7.00%), the abundance exceeded 10,000 valves/g, specifically samples D 51 and D 58 (Figure 4). The sample with the highest diatom abundance was D 58, followed by D 51. Overall, the data indicate that the diatom abundance from the heavy liquid suspension purification method is primarily low, with the majority of samples falling within the 0 valves/g and 100–1000 valves/g range.

4.2.2. Single-Stage Screening Purification

The abundance of diatoms ranged from 0.00 to 52,106.9 valves/g, with an average of 6437.6 valves/g (Table 1, Table 2 and Table 3). Specifically, in five samples (19.0%), no diatom valves were found. These samples are D 122-105, D 122-106, D 28-26, D 151-14, and D 28-40. In five samples (19.0%), the abundance ranged from 0.00 to 100 valves/g, including samples D 132-29, D 122-68, D 122-123, D 122-222, and D 91. In six samples (22.0%), the abundance ranged from 100 to 1000 valves/g, represented by samples D 87-15, D 28-22, D 69-5, D 87-6, D 132-23, and D 81. In six samples (22.0%), the abundance ranged from 1000 to 10,000 valves/g, with sample numbers D 72, D 69-14, D 28-2, D 133, D 87-1, and D 122-10. In five samples (19.0%), the abundance exceeded 10,000 valves/g, including samples D 119-29, D 57, D 51, D 45, and D 58 (Figure 4). The sample with the highest diatom abundance was D 58, followed by samples D 45 and D 51. In contrast, the diatom abundance distribution for the single-layer screening purification method was relatively uniform, with the majority of diatom abundances falling within the 100 to 10,000 valves/g range (Figure 4).

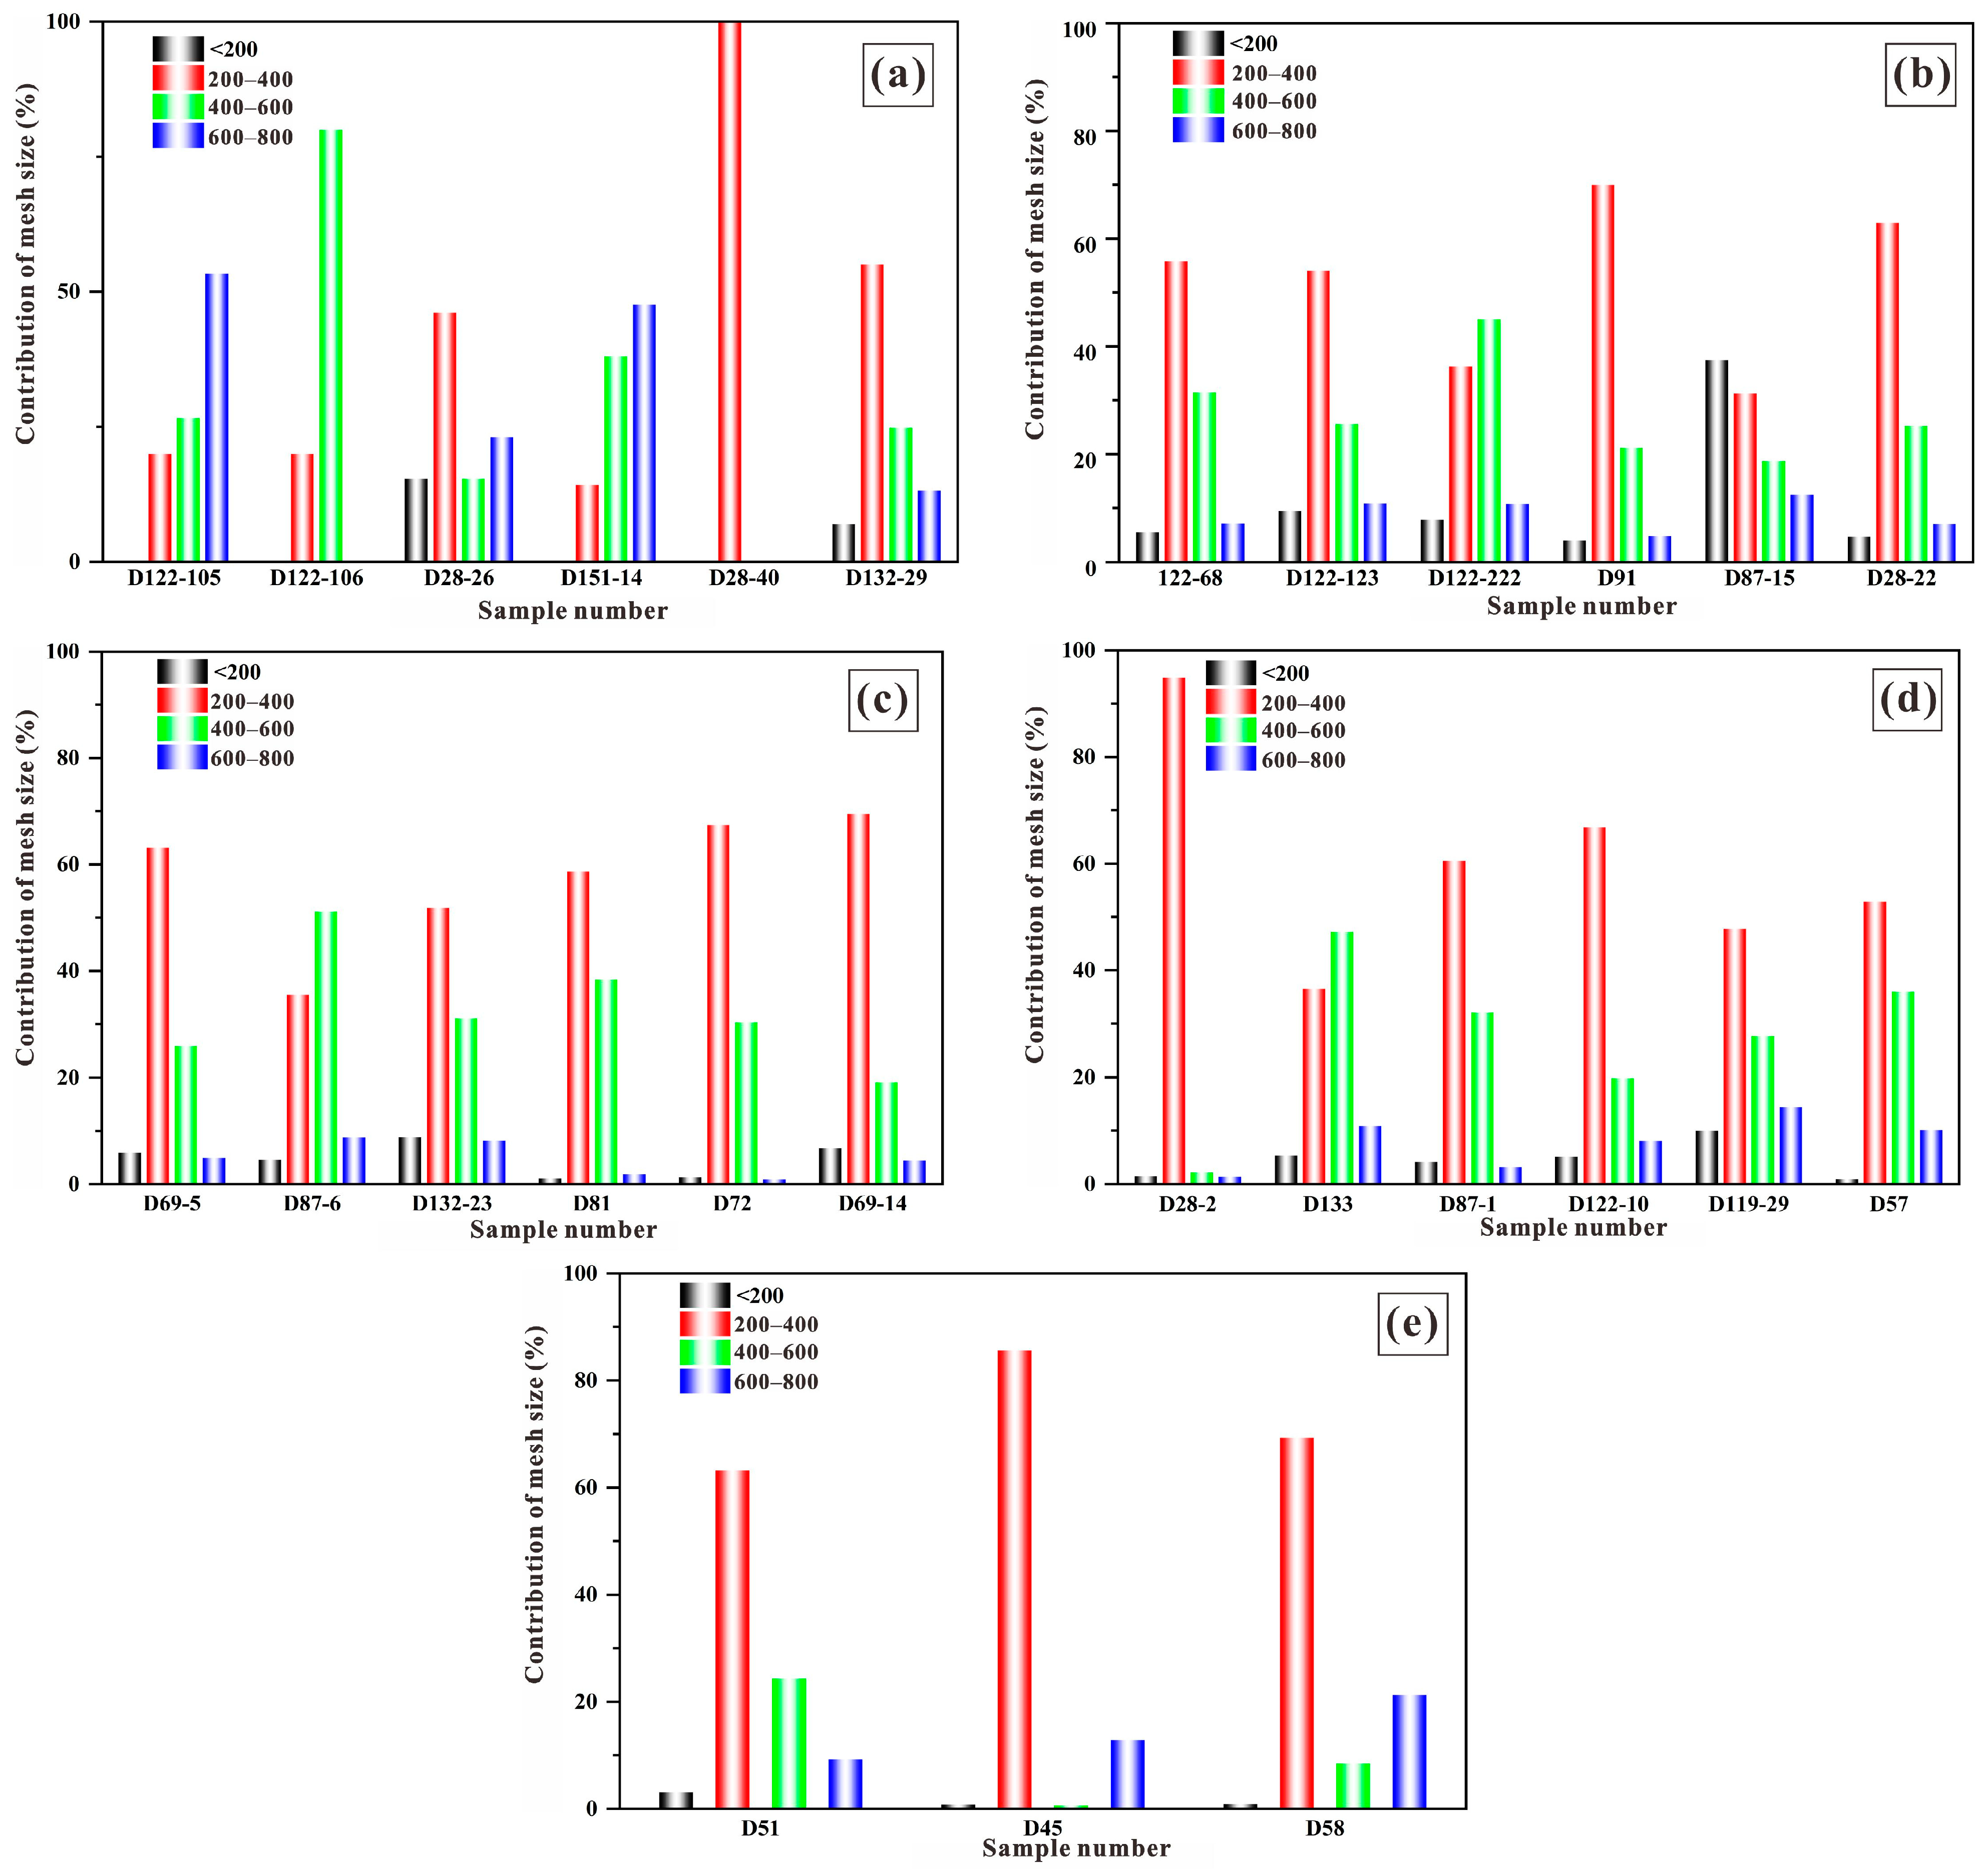
4.2.3. Multi-Stage Screening Purification

The distribution range of diatom abundance was from 57.3 to 181,244.1 valves/g, with an average abundance of 42,032.6 valves/g (Table 1 and Table 2, and Figure 5). Specifically, in one of the samples (0.00%) were no diatom valves found. In one sample (3.7%), the abundance ranged from 0.00 to 100 valves/g, represented by sample D 28-40. In three samples (11.1%), the abundance ranged from 100 to 1000 valves/g, including samples D 122-106, D 28-26, and D 151-14. In five samples (18.5%), the abundance ranged from 1000 to 10,000 valves/g, represented by samples D 69-5, D 122-105, D 132-29, D 87-15, and D 122-222. In 18 samples (66.7%), the abundance exceeded 10,000 valves/g, including samples D 132-23, D 28-22, D 122-68, D 133, D 87-6, D 87-1, D 122-123, D 122-10, D 51, D 81, D 45, D 57, D 72, D 119-29, D 91, D 58, D 69-14, and D 28-2. The diatom abundance was predominantly high, with the majority of the samples showing diatom abundances exceeding 10,000 valves/g. The sample with the highest diatom abundance was D 28-2 (Table 1, Table 2 and Table 3).
For the mesh size of 200 μm, diatom abundance ranged from 0 to 9045.9 valves/g, with a distribution range of contribution rates from 0% to 37.0%. The average abundance was 1405.7 valves/g, with an average contribution rate of 5.64%. For the 200–400 μm mesh size, diatom abundance ranged from 57.3 to 92,155.5 valves/g, with a distribution range of contribution rates from 14.3% to 100%. The average abundance was 23,031.5 valves/g, with an average contribution rate of 55.2%. For the 400–600 μm mesh size, diatom abundance ranged from 0 to 25,441.7 valves/g, with a distribution range of contribution rates from 0% to 80%. The average abundance was 8502.7 valves/g, with an average contribution rate of 27.7%. For the 600–800 μm mesh size, diatom abundance ranged from 0 to 23,758.2 valves/g, with a distribution range of contribution rates from 0.0% to 53.3%. The average abundance was 3014.9 valves/g, with an average contribution rate of 11.5% (Figure 5 and Figure 6).

5. Discussion

Marine sediments contain a substantial amount of organic and inorganic impurities, which pose significant challenges to the identification of diatom species and the accurate quantification of diatom abundance. To address these challenges and enhance the accuracy of diatom species identification and abundance statistics, it is essential to develop an efficient and precise diatom purification method. Previous studies have indicated that both physical screening purification and chemical purification are influenced by numerous factors, including particle size, type of liquid medium, treatment time, concentration and type of acid bath, type of oxidant, and temperature [38,39,40,41,42]. In this study, taking these factors into account, various screening purification methods were compared, the overall diatom purification process was optimized, and the most effective diatom screening purification method was proposed.

5.1. The Influencing Factors of Diatom Abundance in Different Purification Methods

The results indicate that the heavy liquid suspension purification method primarily yielded low diatom abundance, with 48% of the samples falling into this category. The single-layer screening purification method resulted in a more uniform distribution of diatom abundance, while the multi-stage screening purification method yielded a higher diatom abundance. Specifically, the distribution of diatom abundance was predominantly in the >1000 valves/g range, accounting for 66.7%. The diatom valve sizes were primarily between 200-400 mesh, which contributed most significantly to the diatom abundance. These findings highlight the effectiveness of the multi-stage screening purification method for quantitative diatom studies. In addition, the experiment suggests that factors such as the concentration and type of acid bath, the choice of oxidant, and treatment time are not the primary determinants of diatom abundance. Instead, the pore size of the sieve, the size and density of diatom valves, and the concentration of heavy liquid emerged as the key factors influencing diatom abundance.
Under the multi-stage screening purification method, the size distribution of diatoms in each sediment sample was clarified, revealing a broad size range. Specifically, when the mesh size was L < 200 (corresponding to diatoms with L > 75 μm), diatom abundance in samples D 122-105, D 122-106, D 151-14, and D 28-40 was 0 valves/g, and the abundance in sample D 28-26 was very low. When the mesh size was 200 < L < 400 (corresponding to diatoms with 38 μm < L < 75 μm), the diatom abundance was very high. For the mesh size 400 < L < 600 (corresponding to diatoms with 23 μm < L < 38 μm), only sample D 28-40 had 0 valves/g abundance. For the mesh size 600 < L < 800 (corresponding to diatoms with 18 μm < L < 23 μm), diatom abundance in samples D 122-106 and D 28-40 was 0 valves/g. The total diatom abundance in samples D 122-106, D 28-26, D 151-14, and D 28-40 was categorized as low to medium abundance. The results also revealed that all samples contained abundant diatoms, with the dominant diatom particle size being 38–75 μm, followed by 23–38 μm. In contrast, analysis of the single-stage screening purification method and heavy liquid suspension purification method showed that, in the single-stage screening method, diatom abundance was 0 valves/g for samples D 122-105, D 122-106, D 28-26, D 151-14, and D 28-40, while diatom abundance was extremely low for D 132-29, D 122-68, D 122-123, D 122-222, and D 91. In the heavy liquid suspension method, diatom abundance was 0 valves/g for samples D 122-105, D 122-106, D 28-26, D 151-14, D 28-40, D 132-29, D 122-68, D 122-123, D 91, D 28-22, D 87-6, and D 72, with extremely low abundance observed in sample D 87-15. For the above samples, diatom abundance was either 0 valves/g or extremely low in both the single-stage screening and heavy liquid suspension methods. However, in the multi-stage screening method, diatom abundance was significantly higher, with the exception of sample D 28-40, where diatom abundance remained very low. This suggests that the diatoms in this sample were not effectively enriched, leading to a low diatom count. Furthermore, the results underscore that diatom abundance is influenced by factors such as the degree of diatom enrichment, the particle size of diatoms, the mesh size of the sieve, and the concentration of heavy liquid. Specifically, in the single-stage screening purification method, the mesh size plays a crucial role in separating diatoms effectively. If the mesh aperture size is too large or too small, separation is inefficient. In the heavy liquid suspension purification method, the concentration of the heavy liquid and the size of diatom particles are the primary controlling factors. When the concentration of the heavy liquid is high, larger diatom particles are effectively separated, but smaller particles are difficult to isolate. Conversely, when the concentration of heavy liquid is low, both large and small diatom particles are challenging to separate.

5.2. Application and Significance of the Multi-Stage Screening Method for the Purification of Diatom Valves

The results clearly demonstrate that the multi-stage screening purification method stands out as the most effective and advantageous method for diatom purification in marine sediments. Statistical analysis of the overall abundance values shows a significant increase in diatom abundance with this method. On average, diatom abundance increased by 1.60 times, with the highest increase reaching 1030.8 times and the lowest reaching 1.12 times compared to the single-stage screening purification method. The average increase in diatom abundance with the multi-stage method was 21.9 times, and in comparison, the single-stage screening method showed an average increase of 6.53 times (Table 2). The results also revealed a noticeable trend when comparing different purification methods. In the heavy liquid suspension screening method, the abundance of diatoms gradually increased from low to high, but the number of high diatom abundance values decreased. In contrast, with the single-stage screening method, the diatom abundance intervals stabilized as abundance increased. However, in the multi-stage screening purification method, as diatom abundance increased, the number of high diatom abundance values also increased. This trend further confirms that the multi-stage screening method significantly improved diatom abundance values across all sediment samples and enhanced the accuracy of the data (Figure 4). Furthermore, the multi-stage screening method led to cleaner samples by reducing the residual impurities at each layer, which in turn resulted in more accurate microscopic observations. These improvements enhanced the precision of diatom frustule abundance statistics and taxonomic classification, providing a clearer understanding of the diatom community within the sediments.
In terms of diatom size distribution, the multi-stage screening purification method clarified that the diatom valves of different sizes in the Pacific sediments were primarily distributed in the 75 μm to 38 μm range, followed by a secondary distribution range of 38 μm to 23 μm (Table 4). Previous studies have shown that small and very small planktonic diatoms, with diameters between 2 μm and 20 μm, are crucial for marine productivity [36,42]. Traditional studies have mainly focused on larger diatom taxa (with diameters > 20 μm), often neglecting nano-scale planktonic diatoms. The multi-stage screening and purification method, however, enabled a more detailed analysis of diatom frustule size distributions, allowing for a more comprehensive assessment of diatom abundance across various size categories (Figure 6).
By dividing diatom frustules into multiple particle size classes, the multi-stage screening method provides a valuable tool for understanding the particle size distribution of dominant diatoms with relevant implications for paleoceanography studies based on the quantitative estimation of fossil diatom assemblages. This method also facilitates comparisons of diatom frustule abundance in sediments from different types of samples, offering insights into how diatom communities in past marine environments were structured based on particle size distribution.

6. Conclusions

In this study, we established a multi-stage screening purification method that combines both physical and chemical approaches to improve the purification of diatom valves from sediments. By applying this method to surface sediments from the Pacific Ocean, we compared the effectiveness of the heavy liquid suspension purification method, single-stage screening purification method, and multi-stage screening purification method in terms of diatom abundance and distribution characteristics. The key findings are as follows:
(1)
The multi-stage screening purification method greatly enhanced diatom abundance, yielding 21.9 times higher abundance than the heavy liquid suspension method and 6.53 times higher than the single-stage method. This method is also cost-effective, easy to operate, and results in low impurity residuals, significantly improving microscopic observation and the accuracy of diatom taxonomic identification.
(2)
The abundance of diatoms was primarily influenced by sieve pore size, heavy liquid concentration, and the size and density of diatom valves of different sizes. The type of oxidant had minimal impact on diatom abundance, highlighting the importance of sieve size and particle characteristics in effective diatom purification.
(3)
The multi-stage screening method allowed for the classification of diatom sizes, revealing a comprehensive distribution, including nano-sized diatoms (diameter < 20 μm).

Author Contributions

Conceptualization, K.D., Y.L. (Yangbo Lu), G.T., Y.L. (Yongchao Lu), F.Y. and Z.L.; methodology, K.D., Y.L. (Yangbo Lu), W.J., Y.L. (Yongchao Lu), F.Y. and Z.L.; investigation, W.J., Q.C. and D.Z.; resources, G.C.; data curation, G.T., G.C., Q.C. and Z.L.; writing—original draft, K.D. and Y.L. (Yangbo Lu); writing—review and editing, M.M. and Y.L. (Yangbo Lu); supervision, Y.L. (Yangbo Lu), Y.L. (Yongchao Lu) and Z.L. All authors have read and agreed to the published version of the manuscript.

Funding

This study was supported by the National Natural Science Foundation of China (Grant No. 42472201, 42072137, and 42472197), “CUG Scholar” Scientific Research Funds at China University of Geosciences (Wuhan) (Project No. 2023099), and the National Science and Technology Major Project (Grant Nos. 2022ZC06070001).

Institutional Review Board Statement

Not applicable.

Informed Consent Statement

Not applicable.

Data Availability Statement

Data are contained within the article.

Acknowledgments

The authors thank the Guangzhou Marine Geological Survey for its support and the suggestions and help from many anonymous reviewers.

Conflicts of Interest

Guanxiong Tang was employed by Power China Zhongnan Engineering Corporation Limited. The remaining authors declare that the research was conducted in the absence of any commercial or financial relationships that could be construed as a potential conflict of interest.

References

  1. Zhang, X.; Liu, Y. Marine sediments as archives of environmental change. Earth-Sci. Rev. 2020, 204, 103178. [Google Scholar]
  2. Round, F.E.; Crawford, R.M.; Mann, D.G. The Diatoms: Biology & Morphology of the Genera; Cambridge University Press: Cambridge, UK, 1990. [Google Scholar]
  3. Battarbee, R.W.; Donald, F.; Charles, C.B.; Cumming, B.F.; Renberg, I. Diatoms as indicators of surface water acidity. In The Diatoms: Applications for the Environmental and Earth Sciences; Cambridge University Press: Cambridge, UK, 2001; pp. 85–127. [Google Scholar]
  4. Smol, J.P.; Stoermer, E.F. The Diatoms: Applications for the Environmental and Earth Science; Cambridge University Press: Cambridge, UK, 2010. [Google Scholar]
  5. Reynolds, C.S. The Ecology of Phytoplankton; Cambridge University Press: Cambridge, UK, 2006. [Google Scholar]
  6. Armbrust, E.V. The life of diatoms in the world’s oceans. Nature 2009, 459, 185–192. [Google Scholar] [CrossRef] [PubMed]
  7. Zong, Y.; Horton, B.P. Diatom analysis in coastal environments. Quat. Int. 1999, 56, 155–168. [Google Scholar]
  8. Barker, P.; Williamson, D. Diatom preservation in lake sediments: An experimental study. Limnol. Oceanogr. 1988, 33, 785–793. [Google Scholar]
  9. Shemesh, A.; Mortlock, R.A.; Smith, R.J.; Froelich, P.N. Determination of Ge/Si in marine siliceous microfossils: Separation, cleaning and dissolution of diatoms and radiolaria. Mar. Chem. 1988, 25, 305–323. [Google Scholar] [CrossRef]
  10. Shemesh, A.; Burckle, L.H.; Hays, J.D. Late Pleistocene oxygen isotope records of biogenic silica from the Atlantic sector of the Southern Ocean. Paleoceanography 1995, 10, 179–196. [Google Scholar] [CrossRef]
  11. Smart, S.M.; Fawcett, S.E.; Ren, H.; Schiebel, R.; Tompkins, E.M.; Martínez-García, A.; Stirnimann, L.; Roychoudhury, A.; Haug, G.H.; Sigman, D.M. The nitrogen isotopic composition of tissue and shell-bound organic matter of planktic foraminifera in Southern Ocean surface waters. Geochem. Geophys. Geosystems 2020, 21, e2019GC008440. [Google Scholar] [CrossRef]
  12. Vilhena, J.C.; Amorim, A.; Ribeiro, L.; Ferreira, I.M.; Pombo, M. Assessing the efficiency of low-cost cleaning methods for diatoms from intertidal sediment samples. J. Microbiol. Methods 2021, 187, 106255. [Google Scholar] [CrossRef] [PubMed]
  13. Parr, J.F.; Sullivan, L.A. Distribution of diatoms in peat and lake sediments. J. Paleolimnol. 2005, 33, 465–482. [Google Scholar]
  14. Robinson, R.S.; Brunelle, B.G.; Sigman, D.M. Revisiting nutrient utilization in the glacial Antarctic: Evidence from a new method for diatom-bound N isotopic analysis. Paleoceanography 2004, 19, 2003PA000996. [Google Scholar] [CrossRef]
  15. Hatté, C.; Hodgins, G.; Jull, A.T.; Bishop, B.; Tesson, B. Marine chronology based on 14C dating on diatoms proteins. Mar. Chem. 2008, 109, 143–151. [Google Scholar] [CrossRef]
  16. Strugnell, J.M.; McGregor, H.V.; Wilson, N.G.; Meredith, K.T.; Chown, S.L.; Lau, S.C.; Robinson, S.A.; Saunders, K.M. Emerging biological archives can reveal ecological and climatic change in Antarctica. Glob. Change Biol. 2022, 28, 6483–6508. [Google Scholar] [CrossRef] [PubMed]
  17. Stoermer, E.F.; Smol, J.P. The diatoms: Indications for modern and fossil records. Phycologia 1999, 38, 388–408. [Google Scholar]
  18. Flower, R.J.; Battarbee, R.W. Diatoms and climate change. Quat. Sci. Rev. 2001, 20, 1829–1848. [Google Scholar]
  19. Westacott, S.; Planavsky, N.J.; Zhao, M.Y.; Hull, P.M. Revisiting the sedimentary record of the rise of diatoms. Proc. Natl. Acad. Sci. USA 2021, 118, e2103517118. [Google Scholar] [CrossRef]
  20. Saros, J.E.; Anderson, N. The ecology of the planktonic diatom Cyclotella and its implications for global environmental change studies. Biol. Rev. 2015, 90, 522–541. [Google Scholar] [CrossRef] [PubMed]
  21. Bailey-Watts, A.E.; Kirika, A. Integrating molecular and imaging technologies in diatom analysis. Prog. Oceanogr. 2001, 51, 275–303. [Google Scholar]
  22. Lelchat, F.; Dussauze, M.; Lemaire, P.; Theron, M.; Toffin, L.; Le Floch, S. Measuring the biological impact of drilling waste on the deep seafloor: An experimental challenge. J. Hazard. Mater. 2020, 389, 122132. [Google Scholar] [CrossRef] [PubMed]
  23. Sagawa, T.; Yokoyama, Y.; Ikehara, M.; Kuwae, M. Shoaling of the western equatorial Pacific thermocline during the last glacial maximum inferred from multispecies temperature reconstruction of planktonic foraminifera. Palaeogeogr. Palaeoclimatol. Palaeoecol. 2012, 346, 120–129. [Google Scholar] [CrossRef]
  24. Hu, D.; Wu, L.; Cai, W.; Gupta, A.S.; Ganachaud, A.; Qiu, B.; Gordon, A.L.; Lin, X.; Chen, Z.; Hu, S.; et al. Pacific western boundary currents and their roles in climate. Nature 2015, 522, 299–308. [Google Scholar] [CrossRef]
  25. Shi, J.; Jia, Q.; Nürnberg, D.; Li, T.; Xiong, Z.; Qin, B. Coupled nutricline and productivity variations during the Pliocene in the western Pacific warm pool and their paleoceanographic implications. Glob. Planet. Change 2022, 212, 103810. [Google Scholar] [CrossRef]
  26. Max, L.; Rippert, N.; Lembke-Jene, L.; Mackensen, A.; Nürnberg, D.; Tiedemann, R. Evidence for enhanced convection of North Pacific Intermediate Water to the low-latitude Pacific under glacial conditions. Paleoceanography 2017, 32, 41–55. [Google Scholar] [CrossRef]
  27. Ramos, R.D.; Goodkin, N.F.; Fan, T.Y. Coral records at the northern edge of the Western Pacific Warm Pool reveal multiple drivers of sea surface temperature, salinity, and rainfall variability since the end of the Little Ice Age. Paleoceanogr. Paleoclimatol. 2020, 35, e2019PA003826. [Google Scholar] [CrossRef]
  28. Ummenhofer, C.C.; Murty, S.A.; Sprintall, J.; Lee, T.; Abram, N.J. Heat and freshwater changes in the Indian Ocean region. Nat. Rev. Earth Environ. 2021, 2, 525–541. [Google Scholar] [CrossRef]
  29. Kobayashi, F.; Takahashi, K. Distribution of diatoms along the equatorial transect in the western and central Pacific during the 1999 La Niña conditions. Deep Sea Res. Part II Top. Stud. Oceanogr. 2002, 49, 2801–2821. [Google Scholar] [CrossRef]
  30. Morley, D.W.; Leng, M.J.; Mackay, A.W.; Sloane, H.J.; Rioual, P.; Battarbee, R.W. Cleaning of lake sediment samples for diatom oxygen isotope analysis. J. Paleolimnol. 2004, 31, 391–401. [Google Scholar] [CrossRef]
  31. Morley, D.W.; Leng, M.J.; Mackay, A.W.; Sloane, H.J. Late glacial and Holocene environmental change in the Lake Baikal region documented by oxygen isotopes from diatom silica. Glob. Planet. Change 2005, 46, 221–233. [Google Scholar] [CrossRef]
  32. Crosta, X.; Koç, N. Chapter eight diatoms: From micropaleontology to isotope geochemistry. Dev. Mar. Geol. 2007, 1, 327–369. [Google Scholar]
  33. Cristóbal, G.; Blanco, S.; Bueno, G. Modern Trends in Diatom Identification; Springer International Publishing: Cham, Switzerland, 2020. [Google Scholar]
  34. Tseng, C.K. The past, present and future of phycology in China. In Asian Pacific Phycology in the 21st Century: Prospects and Challenges, Proceeding of the Second Asian Pacific Phycological Forum, Hong Kong, China, 21–25 June 1999; Springer Netherlands: Dordrecht, The Netherlands, 21–25 June 2004; pp. 11–20. [Google Scholar]
  35. Guillard, R.; Kilham, P.E.T.E.R. The ecology of marine planktonic diatoms. Biol. Diatoms 1977, 13, 372–469. [Google Scholar]
  36. Leblanc, K.; Queguiner, B.; Diaz, F.; Cornet, V.; Michel-Rodriguez, M.; Durrieu de Madron, X.; Bowler, C.; Malviya, S.; Thyssen, M.; Grégori, G.; et al. Nanoplanktonic diatoms are globally overlooked but play a role in spring blooms and carbon export. Nat. Commun. 2018, 9, 953. [Google Scholar] [CrossRef]
  37. Tang, H.; Ye, H.; Yang, W.; Huang, Y.; Sun, T.; Ge, Y.; Xie, Z. East Asian Winter Monsoon and enhanced stratification in the western Pacific promoted giant marine diatom (Ethmodiscus rex) blooms during the last deglaciation. Quat. Sci. Rev. 2024, 336, 108798. [Google Scholar] [CrossRef]
  38. Hollstein, M.; Mohtadi, M.; Rosenthal, Y.; Moffa Sanchez, P.; Oppo, D.; Martínez Méndez, G.; Hebbeln, D. Stable oxygen isotopes and Mg/Ca in planktic foraminifera from modern surface sediments of the Western Pacific Warm Pool: Implications for thermocline reconstructions. Paleoceanography 2017, 32, 1174–1194. [Google Scholar] [CrossRef]
  39. Steinke, S.; Mohtadi, M.; Groeneveld, J.; Lin, L.C.; Löwemark, L.; Chen, M.T.; Rendle-Bühring, R. Reconstructing the southern South China Sea upper water column structure since the Last Glacial Maximum: Implications for the East Asian winter monsoon development. Paleoceanography 2010, 25. [Google Scholar] [CrossRef]
  40. Rutgers van der Loeff, M.; Kipp, L.; Charette, M.A.; Moore, W.S.; Black, E.; Stimac, I.; Charkin, A.; Bauch, D.; Valk, O.; Karcher, M.; et al. Radium isotopes across the Arctic Ocean show time scales of water mass ventilation and increasing shelf inputs. J. Geophys. Res. Ocean. 2018, 123, 4853–4873. [Google Scholar] [CrossRef]
  41. Gdaniec, S.; Roy-Barman, M.; Levier, M.; Valk, O.; van Der Loeff, M.R.; Foliot, L.; Andersson, P.S. 231Pa and 230Th in the Arctic Ocean: Implications for boundary scavenging and 231Pa230Th fractionation in the Eurasian Basin. Chem. Geol. 2020, 532, 119380. [Google Scholar] [CrossRef]
  42. Daniels, C.J.; Poulton, A.J.; Esposito, M.; Paulsen, M.L.; Bellerby, R.; St John, M.; Martin, A.P. Phytoplankton dynamics in contrasting early stage North Atlantic spring blooms: Composition, succession, and potential drivers. Biogeosciences 2015, 12, 2395–2409. [Google Scholar] [CrossRef]
Figure 1. (a) World surface ocean current distribution and location map of the study area; (b) location map of sampled stations and the surface ocean currents in the Western Pacific Warm Pool (WPWP) and the Equatorial Upwelling Region (EUR) (modified from Sagawa et al., 2012; Hu et al., 2015; Shi et al., 2022; Ramos et al., 2020; Ummenhifer et al., 2021) [23,24,25,27,28]. NEC: North Equatorial Current, NECC: North Equatorial Counter Current, SEC: South Equatorial Current, NGCC: New Guinea Coastal Current, NGCUC: New Guinea Coastal Under Current, and EUC: Equatorial Under Current.
Jmse 13 00187 g001
Figure 2. The experimental process chart of the purification method of diatoms: (a) complete flow chart of diatom purification experiment; (b) the heavy liquid suspension screening method; (c) the single-stage screening purification method; (d) the multi-stage screening purification method [9,11,30,31].
Jmse 13 00187 g002
Figure 3. Examples of diatom valves cleaned with the multi-stage screening purification method. (ac,fh,j) the central radiation and central symmetry diatom valves; (d,e,i,k,l) the bilateral symmetry diatom valves.
Jmse 13 00187 g003
Figure 4. Comparative distribution of diatom abundance by different purification methods.
Jmse 13 00187 g004
Figure 5. Distribution of diatom abundance in each sample for different mesh sizes: (a) 200 mesh; (b) 200–400 mesh; (c) 400–600 mesh; (d) 600–800 mesh.
Jmse 13 00187 g005
Figure 6. The contribution rate of different diatom sizes in the multi-stage screening purification method.
Jmse 13 00187 g006
Table 1. The number and percentage of each diatom abundance value.
Diatom Abundance Range (valves/g)Heavy Liquid Suspension Screening Abundance (HLSSA)Percentage of Each Abundance (%)Single-Stage Screening Abundance (SSA)Percentage of Each Abundance (%)Multi-Stage Screening Abundance (MSSA)Percentage of Each Abundance (%)
01244.40%518.50%00.00%
0–10013.70%518.50%13.70%
100–1000829.60%622.20%311.10%
1000–10,000414.80%622.20%518.50%
>10,00027.40%518.50%1866.70%
Table 2. The distribution range of diatom abundance in different samples and the abundance ratio of each method.
Sample NumberHeavy Liquid Suspension Screening Abundance (HLSSA)Single-Stage Screening Abundance (SSA)Multi-Stage Screening Abundance (MSSA)Ratio of Abundance (MSSA/HLSSA)Ratio of Abundance (MSSA/SSA)
D 122-1050.000.002056.91//
D 122-1060.000.00558.19//
D 28-260.000.00558.78//
D 151-140.000.00685.49//
D 28-400.000.0057.28//
D 132-290.0040.917117.24/173.97
122-680.0042.8618,023.40/420.55
D 122-1230.0044.9832,815.20/729.49
D 122-222103.5656.579606.24/169.82
D 910.0090.91103,282.37/1136.09
D 87-1569.17259.747266.08/27.97
D 28-220.00327.2717,150.06/52.40
D 69-5627.45467.531002.351.602.14
D 87-60.00556.8223,737.26/42.63
D 132-23341.25681.8112,797.5037.5018.77
D 81123.14686.8754,703.51444.2479.64
D 720.001036.3682,093.81/79.21
D 69-14128.621818.18132,579.511030.7872.92
D 28-21621.212102.27181,244.06111.8086.21
D 133721.832636.3621,042.0829.157.98
D 87-1952.443636.3627,214.0528.577.48
D 122-10644.134886.3634,395.4253.407.04
D 119-296985.7615,378.7999,550.5614.256.47
D 577296.3219,103.0361,074.668.373.20
D 5110,132.0231,846.1035,702.083.521.12
D 459675.2636,007.1356,930.795.881.58
D 5812,456.2352,106.95111,633.998.962.14
Total abundance of diatoms1921.46437.642,032.621.96.53
Table 3. Comparison table of the diatom abundance of different purification methods.
Experimental MethodAverage Abundance
(valves/g)
Lowest Abundance
(valves/g)
Highest Abundance
(valves/g)
Heavy liquid suspension screening abundance (HLSSA)1921.420.0012,456.23
Single-stage screening abundance (SSA)6437.560.0052,106.95
Multi-stage screening abundance (MSSA)42,032.5557.28181,244.06
Table 4. The average contribution rate of different diatom particle sizes in the multi-stage screening purification method.
Mesh Size (L)Average Contribution Rate of Diatoms
>75 μm5.64%
38~75 μm55.20%
23~38 μm27.70%
18~23 μm11.50%
Disclaimer/Publisher’s Note: The statements, opinions and data contained in all publications are solely those of the individual author(s) and contributor(s) and not of MDPI and/or the editor(s). MDPI and/or the editor(s) disclaim responsibility for any injury to people or property resulting from any ideas, methods, instructions or products referred to in the content.

