Article

Structural Failure Modes of Single-Story Timber Houses Under Tsunami Loads Using ASCE 7’S Energy Grade Line Analysis

by
Darko Otey
1,
Juan Carlos Vielma
1,* and
Patricio Winckler
2,3,4,*
1
Escuela de Ingeniería Civil, Pontificia Universidad Católica de Valparaíso, Brasil Ave. 2950, Valparaíso 2340025, Chile
2
Escuela de Ingeniería Oceánica, Universidad de Valparaíso, Valparaíso 2362844, Chile
3
National Research Center for Integrated Natural Disaster Management (CIGIDEN), Vicuña Mackenna 4860, Santiago de Chile 7820436, Chile
4
Centro de Observación Marino para Estudios de Riesgos del Ambiente Costero (COSTAR), Valparaíso 2362844, Chile
*
Authors to whom correspondence should be addressed.
J. Mar. Sci. Eng. 2025, 13(3), 484; https://doi.org/10.3390/jmse13030484
Submission received: 6 February 2025 / Revised: 24 February 2025 / Accepted: 25 February 2025 / Published: 28 February 2025
(This article belongs to the Special Issue Coastal Disaster Assessment and Response)

Abstract

:
The structural response of single-story timber houses subjected to the 27 February 2010 Chile tsunami is studied in San Juan Bautista, an island town located nearly 600 km westward from the earthquake’s rupture source, in the Pacific Ocean. The ASCE 7-22 energy grade line analysis (EGLA) is used to calculate flow depths and velocities as functions of the topography and recorded runup. To understand the structural response along the topography, reactions and displacements are computed at six positions every 50 m from the coastline. Houses are modeled using the Robot software, considering dead and live loads cases under the Load and Resistance Factor Design (LRFD) philosophy. The results show that houses located near the coastline experience severe displacements and collapse due to a combination of hydrodynamic forces, drag and buoyancy, which significantly reduces the efficiency of the foundations’ anchorage. Structures far from the coastline are less exposed to reduced velocities, resulting in decreased displacements, structural demand and a tendency to float. Finally, the methodology is validated by applying a nonlinear analysis of the structures subjected to tsunami loads at the different positions considered in this study. Despite their seismic resistance, lightweight timber houses are shown to not be suitable for areas prone to tsunamis. Tsunami-resilient design should therefore consider heavier and more rigid materials in flooding areas and the relocation of lightweight structures in safe zones.

1. Introduction

Tsunamis have posed persistent threats throughout human history, causing devastating material and human losses. While tsunamis can be triggered by several phenomena, their most significant source are large megathrust earthquakes such as those in the Indian Ocean (2004), Chile (2010) and Japan (2011). The increasing exposure of coastal settlements to these events highlights the need to study their effects on infrastructure [1,2] to ensure structural integrity and facilitate evacuation. Various design codes have been developed to design tsunami resilient structures, with a particular emphasis on reinforced concrete and structural steel buildings [3,4,5]. However, the behavior of smaller, lightweight residential buildings near potential tsunami inundation zones has been overlooked.

1.1. Impacts of Tsunamis on Buildings

Tsunami impacts on coastal structures have been well-documented following the large megathrust earthquakes that occurred in the 20th century. For example, Ghobarah et al. [6] conducted a detailed analysis of the impact of the 2004 Indian Ocean tsunami on buildings, bridges and infrastructure in Thailand and Indonesia. Similarly, Fritz et al. [7], Robertson et al. [8] and Zareian et al. [9] documented the extensive damage to residential and industrial facilities following the 2010 Maule earthquake and tsunami, emphasizing the need for robust design and construction practices to mitigate future risks. In addition, Jayaratne et al. [10] identified key failure mechanisms and proposed a validated model for predicting scour depth in coastal structures impacted by the 2011 Tohoku tsunami in Japan, while Koshimura et al. [11] focused on tsunami impact on structures for the same event.
Several studies have addressed the response of structures affected by tsunamis, focusing on different aspects of the phenomena; some have highlighted the role of the environment (e.g., topography and location) on the impact on buildings [12,13] while others have noted that the urban configuration may either channel the flow, thus increasing speeds, or reduce the impact in presence of robust structures on the front line [14]. It has been noted that typical timber and masonry housing structures experience significant damage under moderate flows, with high chances of collapse for depths above 2 m [12,13], while reinforced concrete and steel structures are more resilient [13,15]. Overall, the structural damage depends largely on the material, the suitability of the design [15] and the year of construction [16]. As preventive measures against structural failure, a series of recommendations focused on reinforced concrete structures have been offered [15].
Experimental studies have significantly advanced the understanding of tsunami forces and their impact on structures. For example, Kihara et al. [17,18] conducted large-scale experiments on concrete vertical walls, identifying critical response characteristics under tsunami wave pressures and debris impacts. Similarly, Naito et al. [19,20] explored the effects of shipping containers on coastal structures, highlighting the need for site-specific assessments of debris impact potential. The importance of these findings is further emphasized by Robertson et al. [8], who provided valuable insights into the hydrodynamic loading required to cause structural failures during tsunamis.

1.2. Methods Used to Compute the Structural Response of Buildings

Recent advancements in tsunami-resilient design standards have significantly contributed to enhancing the structural reliability of coastal infrastructure. Existing methodologies for structural analysis in the context of tsunamis range from complex numerical models to physical models. Linton et al. [21], for example, assessed the hydrodynamic conditions and structural response of several full-scale light-frame wood walls subjected to tsunamis using the Large Wave Flume of the NEES Tsunami Facility at Oregon State University. Alternatively, Krautwald et al. [22] challenged the common assumption that buildings remain rigid during hydrodynamic loading by testing the deformation of an idealized light-frame timber structure at the Large Wave Flume of the Coastal Research Center in Hannover.
Fragility curves, which describe the probability of structural failure using empirical data, have been widely used. For instance, Suppasri et al. [23] developed fragility curves based on data from 250,000 buildings affected by the 2011 Japan tsunami. However, while fragility curves provide valuable insights, they are often generalized and empirical. On the other hand, the nonlinear static pushover analysis offers a more precise method for analyzing specific structures but requires significant computational resources, making it impractical for widespread application. Examples include the publications by Baiguera et al. [24] and Aegerter et al. [25], which performed pushover analysis on structures using OpenSees [26] and ETABS [27] software, respectively. Another alternative for structural analysis is the energy grade line analysis (EGLA) method of the ASCE 7-22 [28], which provides a simplified yet useful tool for designing structures to withstand tsunami loads.
Among the methodologies used to assess the structural response to tsunamis, the energy grade line analysis (EGLA) has been incorporated into the ASCE 7-22 standard as a practical approach for estimating flood depths and flow velocities based on runup data and topography. Its simplicity and applicability in exploratory studies have made it an attractive tool for evaluating hydrodynamic loads on coastal structures. However, as a method based on simplified assumptions about tsunami flow, EGLA does not explicitly capture transient effects, local turbulence, or three-dimensional interactions between the flow and the built environment. Therefore, its application should be considered within a preliminary estimation framework and supplemented with other tools whenever possible.

1.3. The ASCE 7′s EGLA

This research analyzes the behavior of a single-family timber structure subjected to loads generated by a tsunami, characterized by the ASCE 7-22 [28] method called energy grade line, which relates the hydraulic energy line with the data of a previously recorded tsunami, such as runups and the topography of the study site, with their respective horizontal flood distances; all of this is to interpret the heights and velocities that occur throughout the analysis area [29,30]. The introduction of the ASCE 7-16 standard marked a major step forward in establishing guidelines for designing structures to withstand tsunami loads [31]. Carden et al. [32] demonstrated the application of the EGLA and ASCE 7-16 provisions in mitigating structural failures during the 2011 Tohoku tsunami, highlighting the method’s reliability and the conservative nature of the load estimates. Along this line, Chock et al. [33] conducted a comprehensive structural reliability analysis for tsunami hydrodynamic loads, utilizing Monte Carlo simulations to validate the probabilistic limit state reliabilities for various structural components, further affirming the robustness of ASCE 7-16 provisions. Chock [34] provided a detailed explanation of the technical basis and methodology underlying the tsunami-resilient design requirements in the ASCE 7-16 standard, emphasizing the integration of probabilistic hazard analysis, tsunami physics and fluid mechanics into a unified design framework. The EGLA, as outlined in the updated ASCE 7-22, offers a simplified yet effective tool for designing tsunami-resistant structures. Carden et al. [32] showed its effectiveness in mitigating structural failures during the 2011 Tohoku tsunami while Tada et al. [35] analyzed over 500 inundation measurements in Sendai, enhancing its accuracy for predicting tsunami-induced inundation heights.
In this study, we analyze the structural response of a timber single-story house using ASCE 7-22‘s EGLA in the insular town of San Juan Bautista, Robinson Crusoe Island, Juan Fernández Archipelago (Figure 1). The results obtained with EGLA are further validated with nonlinear structural analyses of the structure under equivalent tsunami loads.
While the EGLA method provides a reasonable estimation of tsunami hydrodynamic parameters, its application should be considered an approximation tool in structural design. ASCE 7-22 states that this method is suitable for initial estimations and exploratory studies but does not replace more detailed approaches based on numerical modeling. In this study, EGLA is used as a practical approach to obtain a preliminary estimation of hydrodynamic loads and to evaluate the structural response of timber houses in San Juan Bautista, analyzing its applicability in the context of lightweight buildings exposed to tsunamis; however, its results should be interpreted with caution and adjusted when possible.

2. The 27 February 2010 Tsunami in San Juan Bautista

On 27 February 2010, a Mw = 8.8 earthquake occurred off the coast of Chile, generating a destructive tsunami along the continental coast, Easter Island and the small town of San Juan Bautista on Robinson Crusoe Island. Located 680 off the coast of Chile, San Juan Bautista was impacted by the first tsunami 49 min after the main shock as a slow-moving flood followed by a violent wave caused the total destruction of 160 houses and 18 casualties [7,37]. The loss of the buildings accounted for 40.1% housing and a great portion of basic services [36]. The aftermath was recorded in documentaries by UV [38]. According to Breuer et al. [36], this tsunami is part of a long-lasting list of 56 events affecting the island since 1591, some of which were destructive (1730, 1751, 1835, 1868, 1877, 1946, 1960).
Immediately following the earthquake, a series of post-tsunami surveys were launched to characterize the impact on the town. Two sites within Robinson Crusoe were surveyed by Fritz et al. [7] (Figure 8a) but the profile in San Juan Bautista (Figure 8b) coincided with the most affected area. The lower part of the town was severely affected by the tsunami, leaving 16 casualties, 160 ruined houses and most of the public facilities destroyed [36]. As Breuer et al. [36] observed during a survey conducted one month following the tsunami, weak structural joints connecting the houses to their foundations could explain why the structures floated, since this created buoyancy on the higher ground (Figure 1a), while near the coast, scour and high impact loads due to the high speeds also contributed to the overall damage (Figure 1b). These hypothetical failure modes, however, have not undergone a rigorous structural analysis, which could inform future design guidelines.
There are two reasons implied by Breuer et al. [36] that explain the huge structural damage in San Juan Bautista: (a) building materials are scarce and maintenance costs high as they sometimes rely on offshore supply and (b) the limited usable space due to the volcanic structure of the island has promoted the construction of single-story family houses in tsunami-exposed areas. Additionally, the existing Communal Regulating Plan enforced by the time of the 2010 tsunami authorized the construction of housing, commercial buildings and public facilities in exposed areas, without prescribing structural types (e.g., frames, walls, cables) and materials (e.g., masonry, reinforced concrete, wood, steel). Consequently, the prevailing structural typology prior to the 2010 tsunamis consisted of single-story timber houses with weak anchoring systems (aimed to transfer dead and live loads to the ground) and a low ratio between window-to-wall areas, which made them highly impermeable to the tsunami. It should be noted that all 160 buildings in the flooded area were fully damaged, regardless of whether they were affected by strong currents or water depths. However, the failure modes slightly differed with the distance to the shore. According to Breuer et al. [36], weak structural joints connecting the houses to their foundations explain why some houses floated due to buoyancy on the higher ground where the flow was relatively slow (Figure 8a), which is a structural failure documented earlier in past events [39,40]. Our analysis is conducted on a topographic profile along La Pólvora Street, where a maximum penetration and runup within the town were recorded by Fritz et al. [7].

3. Methodology

Following ASCE 7-22, Chapter 6, in this study, it is assumed that structures are subjected to hydrostatic and hydrodynamic forces, waterborne debris accumulation and impact loads. Due to the in situ evidence later discussed, the scour or geotechnical damage of the soil are disregarded. Seismic ground motion effects on structures are disregarded, as the triggering earthquake occurred in the Chile–Perú subduction zone, nearly 600 km east from Robinson Crusoe Island, and islanders did not feel the shaking. Our focus is on single-story timber houses, disregarding critical facilities which were completely destroyed during the 27 February 2010 tsunami [37].

3.1. EGLA of Maximum Inundation Depths and Flow Velocity

The analysis is conducted on a topographic profile along La Pólvora Street (Figure 2), where a runup of 18.3 m was recorded at an inundation distance of 295 m and two records of flow depths were recorded by Fritz et al. [7]. The maximum inundation depths and flow velocity along the ground elevation profile up to the runup are determined using the EGLA (Figure 3). The ground elevation along the transect is represented as a series of linear sloped segments each with a Manning’s coefficient consistent with the equivalent terrain macroroughness friction of that terrain segment. The EGLA is performed incrementally across the topographic transect in a stepwise procedure from the runup (where the hydraulic head is zero and the water elevation is equal to the runup) to the mean water shoreline using Equation (1)
E i = E i 1 + φ i + s i x i
where E i is the hydraulic head at point i , given by
E i = h i + u i 2 / 2 g = h i 1 + F r i 2 / 2 .
Here, h i is the inundation depth, u i the maximum flow velocity, φ i the average ground slope between i and i 1 , F r i = u i / g h i the Froude number, x i the increment of horizontal distance between the consecutive points of coordinate x i measured inland from the still water level (SWL as in Figure 3) and s i the friction slope of the energy grade line between consecutive points, calculated as follows:
s i = u i 2 n 2 / h i 4 / 3
where n = 0.025 is the Manning’s coefficient, defined for open land or field according to ASCE 7-22. This value neglects the frictional effects of the houses and built environment that existed before and was washed away by the tsunamis. Velocity is determined as a function of inundation depth, in accordance with the prescribed value of the Froude number calculated according to Equation (4).
F r = α 1 x / X R
where α = 1.0 and X R is the design inundation distance inland from Medium High Water (MHW) shoreline. No bore correction is conducted as the nearshore bathymetry is too steep to generate a bore. Table 1 shows the parameters used in the EGLA. The resulting flow depth and velocities are then corrected to fit the flow depths obtained by Fritz et al. [7].

3.2. Tsunami Hydrodynamic Loads

The methodology includes the estimation of flow depths and depth-averaged horizontal flow speeds using the ASCE 7-22′s EGLA, from which computed hydrostatic, drag and impact forces are used in the structural analysis of a timber single-story house. The application is based on the combination of a proprietary Matlab (R2022a) script for the computation of hydrodynamic loads and the use of the software Robot Structural Analysis Professional 2024 (referred as Robot hereafter) [42] to compute the structural response on several locations within a topographic profile of La Pólvora Street, where a maximum penetration of 295 m and a runup of 18.3 were reported by Fritz et al. [7].
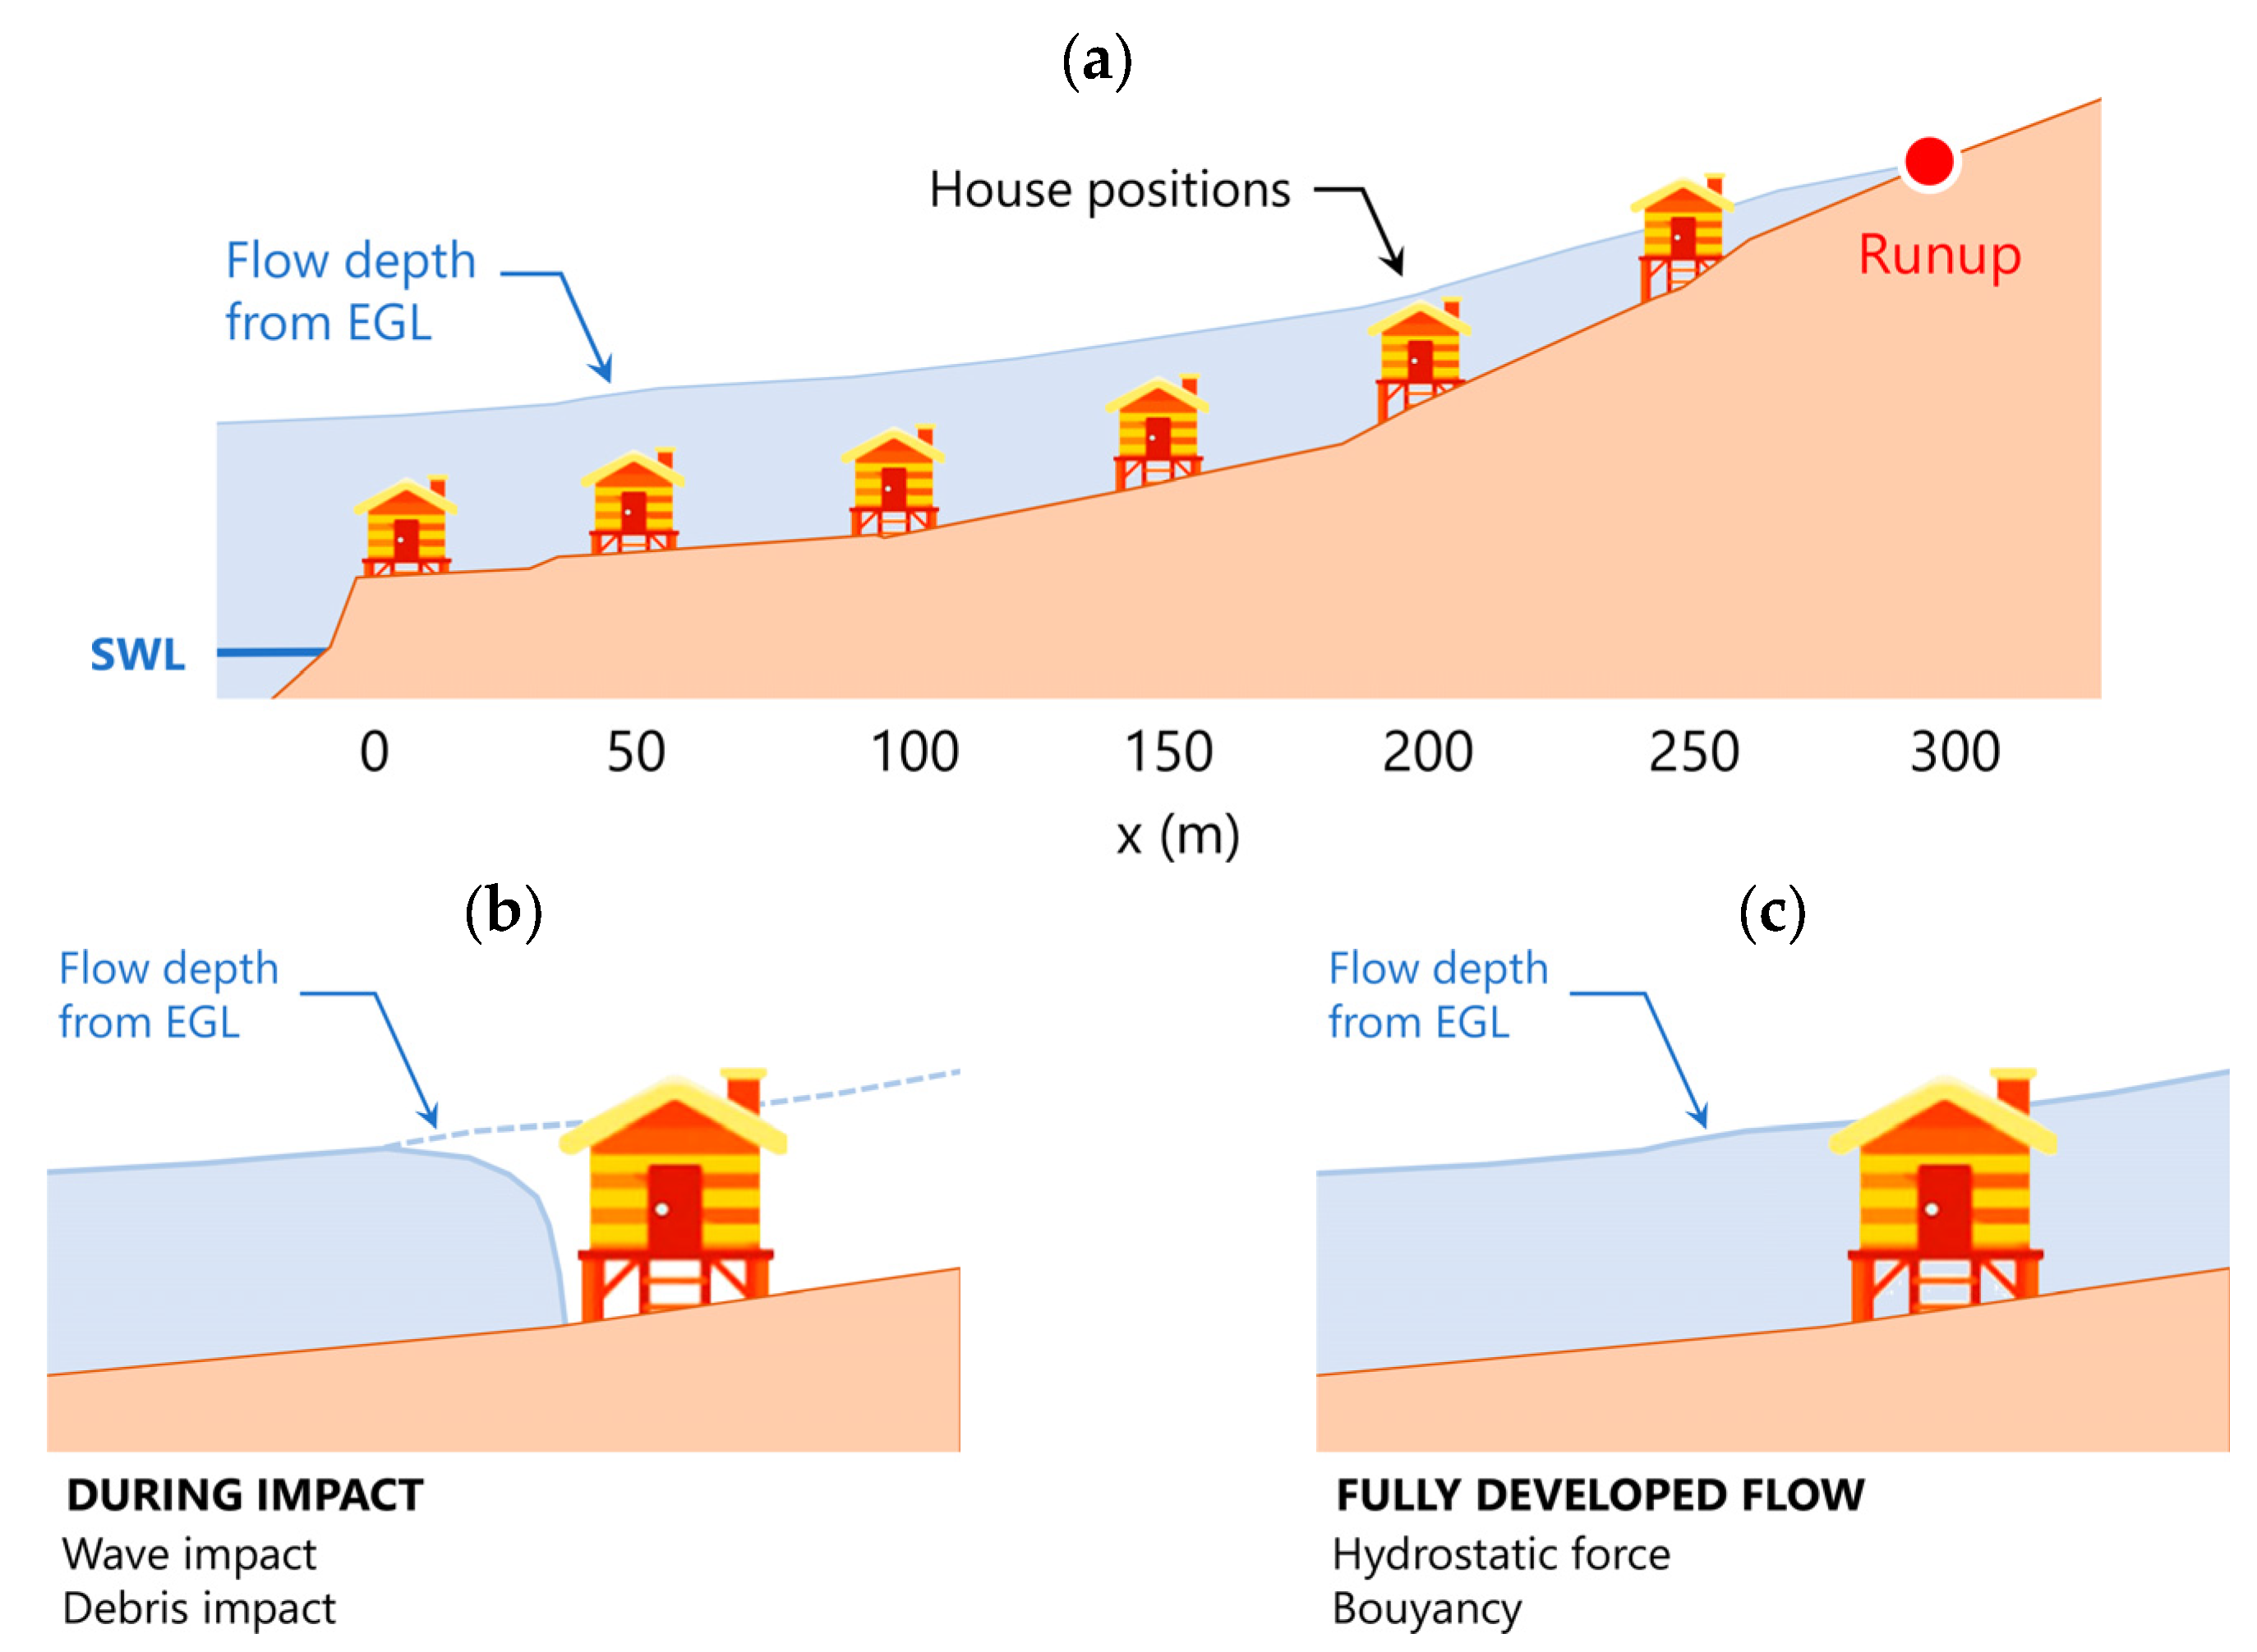
Figure 4 shows the flow depth obtained from the EGLA and different house positions where the structural analysis is conducted, as well as the dominant hydrostatic and hydrodynamic loads during and after the impact of a tsunami. The buoyancy force, the unbalanced lateral hydrostatic force, the drag force and the impact of wood logs are evaluated following ASCE 7-22, FEMA P-646 [43] and NCh3363 2015 [44].

3.2.1. Buoyancy Force

The buoyancy force F b is evaluated in accordance with Equation (5):
F b = γ s   V W
where γ s is the minimum fluid weight density for design hydrostatic loads and V W is the displaced water volume. For modeling purposes, this force is applied as a pressure, since this facilitates the modeling of the claddings. The buoyancy of the vertical walls is discarded as these have an almost negligible volume and thus a small buoyancy compared to the other acting forces.

3.2.2. Unbalanced Lateral Hydrostatic Force

The unbalanced hydrostatic lateral force F h , when the flow does not overtop the wall, is determined using Equation (6):
F h = 1 / 2   γ s b h 2
where b is the width of the building subject to force and h the tsunami inundation depth above the grade plane at the structure. Where the flow overtops the wall, the lateral hydrostatic force on the wall is determined using Equation (7):
F b = 0.6 γ s ( 2 h h w )   b h w
where h w is the height of wall. The forces in Equations (2) and (3) were applied as the equivalent distributed forces of triangular and trapezoidal shapes on walls.

3.2.3. Drag Force

The drag force is computed with Equation (8):
F d x = 0.5 ρ s I t s u C d C c x b h s x u 2
where ρ s is the minimum fluid mass density for hydrodynamic design, I t s u the importance factor for tsunami forces to account for additional uncertainty in estimated parameters, C d the drag coefficient based on quasi-steady forces, C c x the proportion of closure coefficient, b the width of the building subject to force and u the tsunami flow velocity.

3.2.4. Impact of Wood Logs

The nominal maximum instantaneous debris impact force was preliminarily computed using ASCE 7-22 (Equations (6.11-2) and (6.11-3)) but the resulting value (130 tonf) was considered excessive (Appendix A). Alternatively, we calculate the impact force F I F by floating objects from NCh3363 2015 [44], which assumes a debris of 500 kg impacting on a time interval ( t = 1 s for timber structures) at the speed of the tsunami u .
F I F = 500 u / t
This force is applied to the front wall at the level reached by the tsunami inundation depth when it is lower than the height of the structure h > h w and at its centroid when the depth exceeds the structure. Impact forces are applied when the tsunami impacts the structure (Figure 4b) and once the flow has reached a relatively uniform and stationary pattern around the house (Figure 4c).

3.2.5. Load Cases

Load cases are based on the LRFD philosophy from ASCE 7-22, which is integrated into Robot. A seismic nature is assigned to tsunami load so that its amplification factor corresponds to an accidental combination.

3.3. Structural Modeling of a Timber Single-Story House

A 60 m2 timber single-story house with a gable roof is modeled using Robot. To compute the hydrodynamic loads, we conservatively disregard the openings (e.g., doors and windows). The timber structure is modeled using Grade C16 Pinus radiata [45], a material locally used according to the Chilean code NCh1198 [46]. The timber structure’s configuration includes 7.5 cm × 7.5 cm elements for corner supports, 5 cm × 5 cm elements spaced every 50 cm for walls and roofing, 5 cm × 7.5 cm elements for roof beams, 15 cm × 2.5 cm bars for trusses and 15 cm × 10 cm elements for floor beams. The 20 cm × 20 cm concrete pedestals spaced 1.5 m and braced to the floor beams are considered as the top of the foundation (Figure 5). Structural failure modes include failures due to bending, shear, buckling, torsion and fatigue. Emphasis is placed on the structural failure under combined loads in an Ultimate Limit State (ULS).
Dead, live and roof live loads are considered constant and valued according to the Chilean code NCh1537 [47]. The dead load is considered for the entire structure, except for the house’s floor, where a distributed surface dead load of 0.1 kPa is assumed for a 1-inch-thick floor made of white pine wood elements of 420 kgf/m3 [45] with enclosures. Uniformly distributed live loads of 2 kPa are considered for floors and roofs, with this load applied to general use areas and bedrooms. A 0.3 kPa uniformly distributed live load for the roof (3.3 m long, 1.94 m high and a slope of 58%) is determined based on the slope and tributary area of each structural frame. Tsunami loads (hydrostatic, hydrodynamic and debris impact) are assumed to act perpendicular to timber single-story houses positioned every 50 m along La Pólvora Street (e.g., x = 0, 50, 100, 150, 200 and 250 m, being x = 0 m the coastline and 250 m near the runup). Table 2 summarizes the flow depths immediately before (seaward), in the centroid of and immediately after (landward) each house’s location.

3.4. Load Combinatios

Load cases and weighting factors prescribed in ASCE 7-22 are used herein (Table 3). The following combinations are used:
1.4 D
1.2 D + 1.6 L + 0.5 L r   o r   0.3 S   o r   0.5 R
1.2 D + 1.6 L r   o r   1.0 S   o r   1.6 R + L   o r   0.5 W
where D is the dead load, L the live load, L r the roof live load, S the snow load, R the rain load and W the wind load. The combinations considering the interaction of tsunami loads with gravity loads are as follows:
0.9 D + F T S U + H T S U
1.2 D + F T S U + 0.5 L + 0.2 S + H T S U
where F T S U is the direct tsunami load, H T S U the load induced by earth pressure under submerged conditions, L the live load and S the snow load. We disregard snow, rain and wind loads due to the location of the study. Load cases are considered during the impact of the tsunami (I), as in Figure 4b, and when the flow has completely flooded the surrounding area of the house (F), as in Figure 4c. The pressures obtained on the different faces of the structure are shown schematically in Figure 6.

3.5. Nonlinear Analysis

The results obtained with EGLA are further validated with nonlinear structural analyses of the structure under equivalent tsunami loads. For this, the structure is modeled considering two sources of nonlinearity: (1) the constitutive nonlinearity, linked to the response of the constituent materials of the structure and (2), the geometric nonlinearity, which affects very flexible structures [48]. As described above, the structure is composed of reinforced concrete members for the pedestals that support the timber superstructure and transmit the loads to the foundations. Concrete and reinforcing steel are modeled using Mander et al.’s [49] and Menegotto and Pinto’s [50] models, respectively. Timber elements are modeled using the elastic-plastic model with a small hardening fraction (0.5%) [51]. The details of these models are shown in Table 4, Table 5 and Table 6.
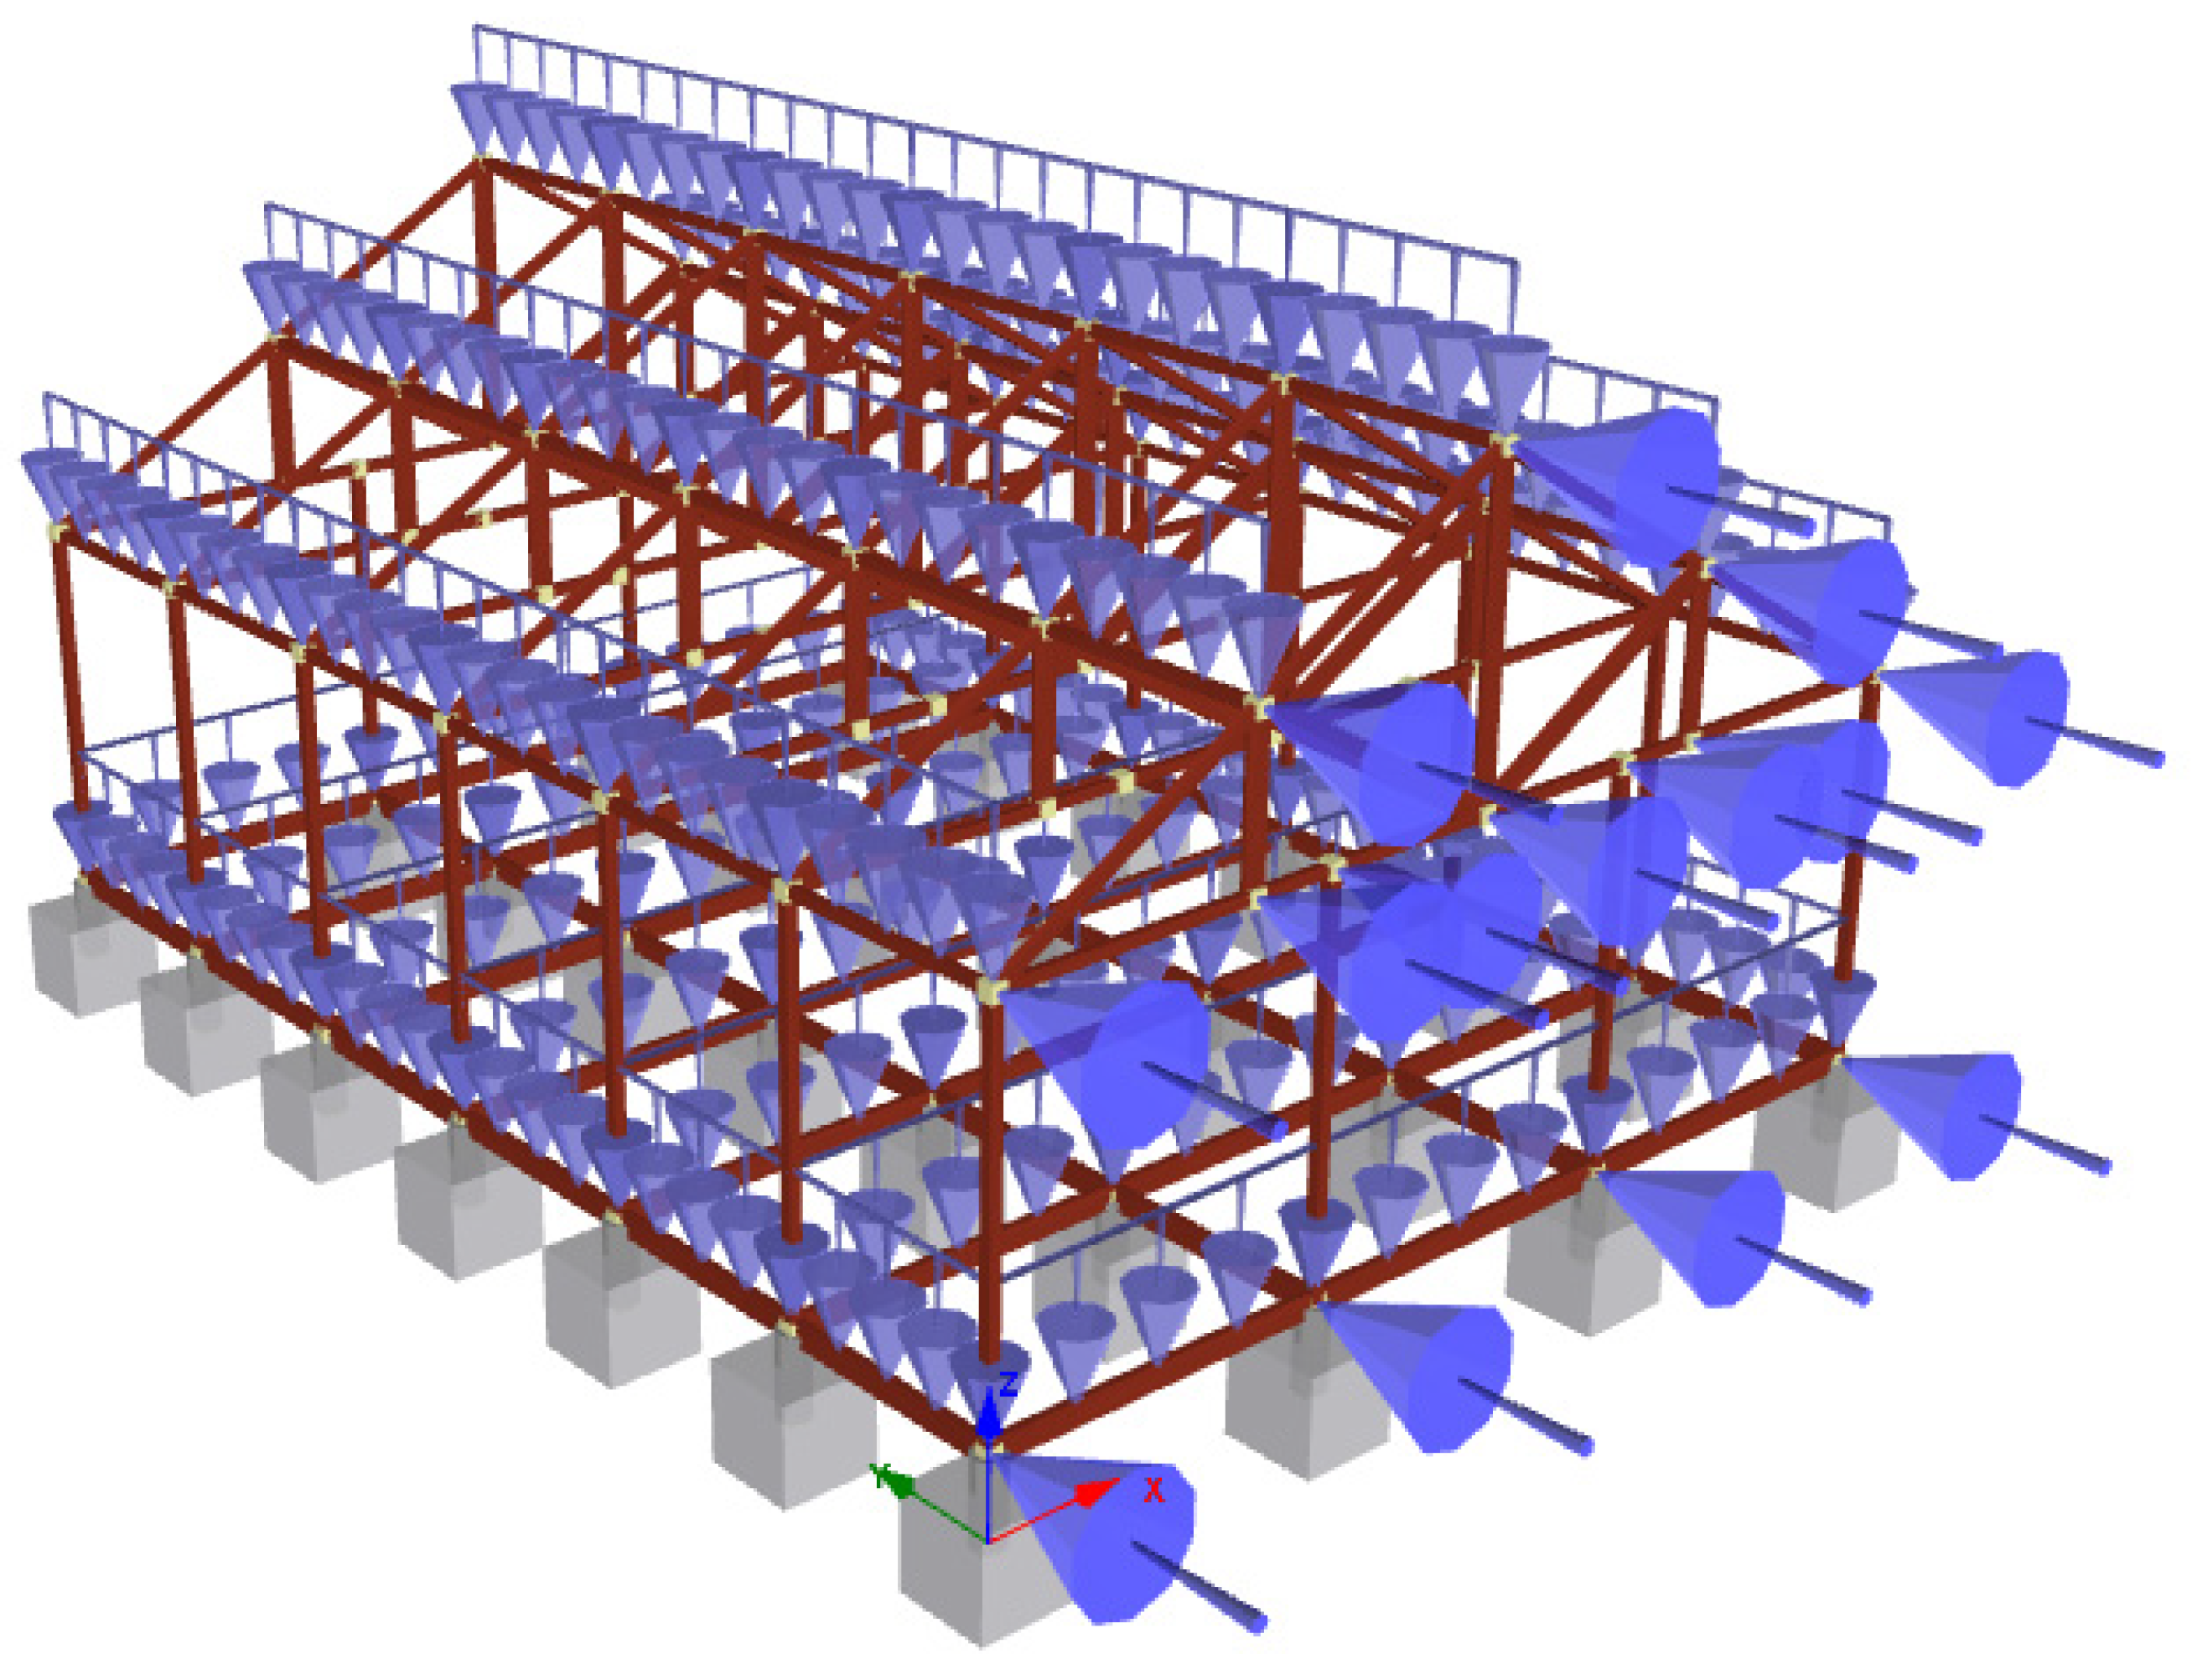
The gravity loads applied to the nonlinear model are the same as those described above for the linear model (Section 3.3). Loads produced by the tsunami are applied sequentially, considering their variation with respect to the flood height. The tsunami pressure acts on the façade (main elevation in Figure 5). Figure 7 shows an isometric view of the nonlinear model, with the gravity and tsunami loads applied at the nodes of the façade. The nonlinear analysis is carried out, having, as the main variable, the flood height indicated for each position with respect to at x = 0 m (Table 2). The procedure contained in ASCE 7-22 is applied to determine the loads on the façade; the SeismoStruct V-24 [52] software is used to perform the analysis.
It should be noted that the nonlinear analysis model is based on the fiber approach, in which the cross-sections of structural members are discretized into fibers adapted to the section geometry. In the case of reinforced concrete structural members, the fibers consist of cover concrete, core concrete and composite fibers made of core concrete and reinforcing steel. For the timber components, homogeneous fibers of this material are considered.
The analysis framework established in ASCE 7-22 follows an incremental approach, where the loads are progressively applied in a series of finite steps. In each step, a load increment is applied to the nodes of the façade, as illustrated in Figure 7. These load increments correspond to the hydrostatic height, which is updated at each step of the analysis. As the loads increase, the internal stresses within the fibers of the structural members also rise. When these stresses exceed the strength limits specified in Table 4, Table 5 and Table 6, plasticization begins, leading to the progressive damage of the components.
For each load increment, the displacements at the center of gravity of the roof and the base shear in the direction of the incoming wave are computed. By plotting the base shear force against the roof displacement, a capacity curve is obtained, from which critical points of structural response are analyzed. The nonlinear analysis only considers the application of the aforementioned loads, excluding other forces such as impact and buoyancy.
To evaluate the progression of tsunami-induced damage to the structure, two performance criteria are defined based on the strain limits of radiata pine timber [53]. The first strain threshold corresponds to the point where the material ceases to exhibit approximately linear behavior, while the second threshold marks the peak stress point, beyond which the material begins to lose its load-bearing capacity. Determining the displacements at which these limit values are reached allows for the monitoring of the evolution of damage in the different structural members.

4. Results

4.1. EGLA of Maximum Inundation Depths and Flow Velocities

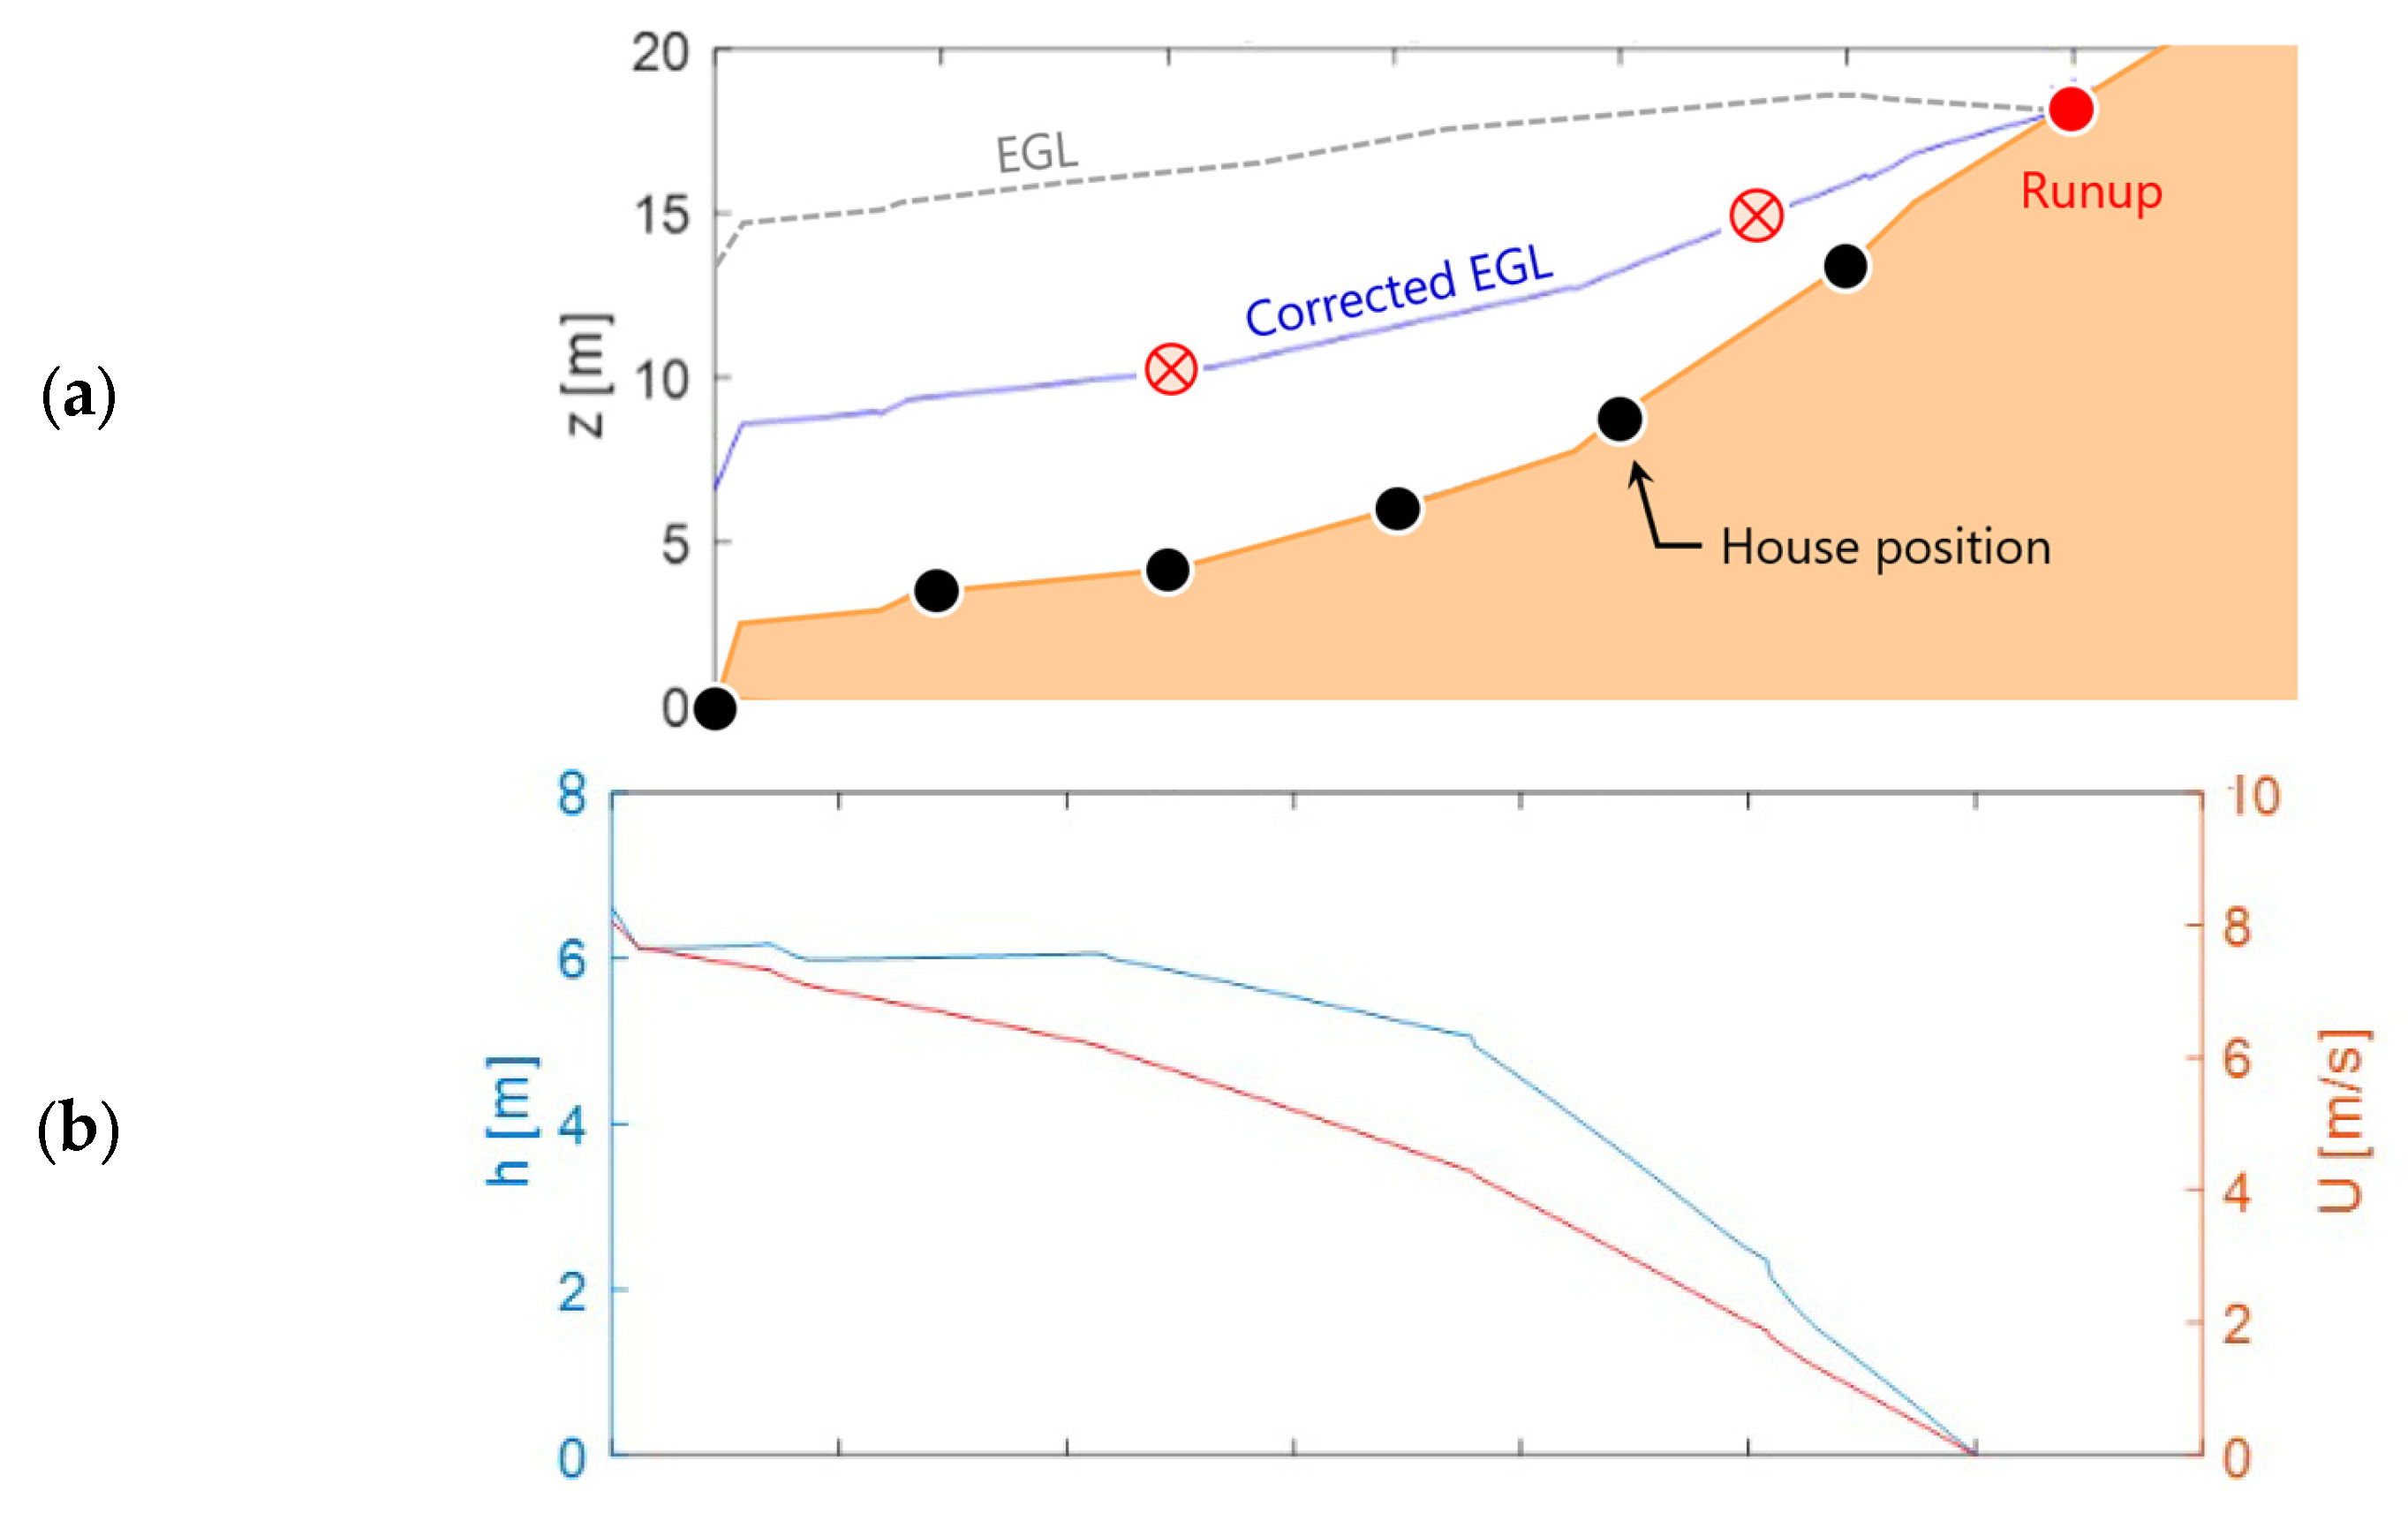
Figure 8a shows the EGL in a gray dashed line at different house positions where the structural analysis is conducted, as well as the flow depths and runup recorded by Fritz et al. [7]. As the reported flow depths are smaller than the EGL, the latter is reduced by a factor of 0.5 to fit the data. The EGL and corrected flow depths differ by as much as 6.2 m at x = 100 m, which could be attributed to several causes, as later discussed. Figure 8b shows the flow depth and velocity as obtained from the Corrected EGL.

4.2. Relative Displacements

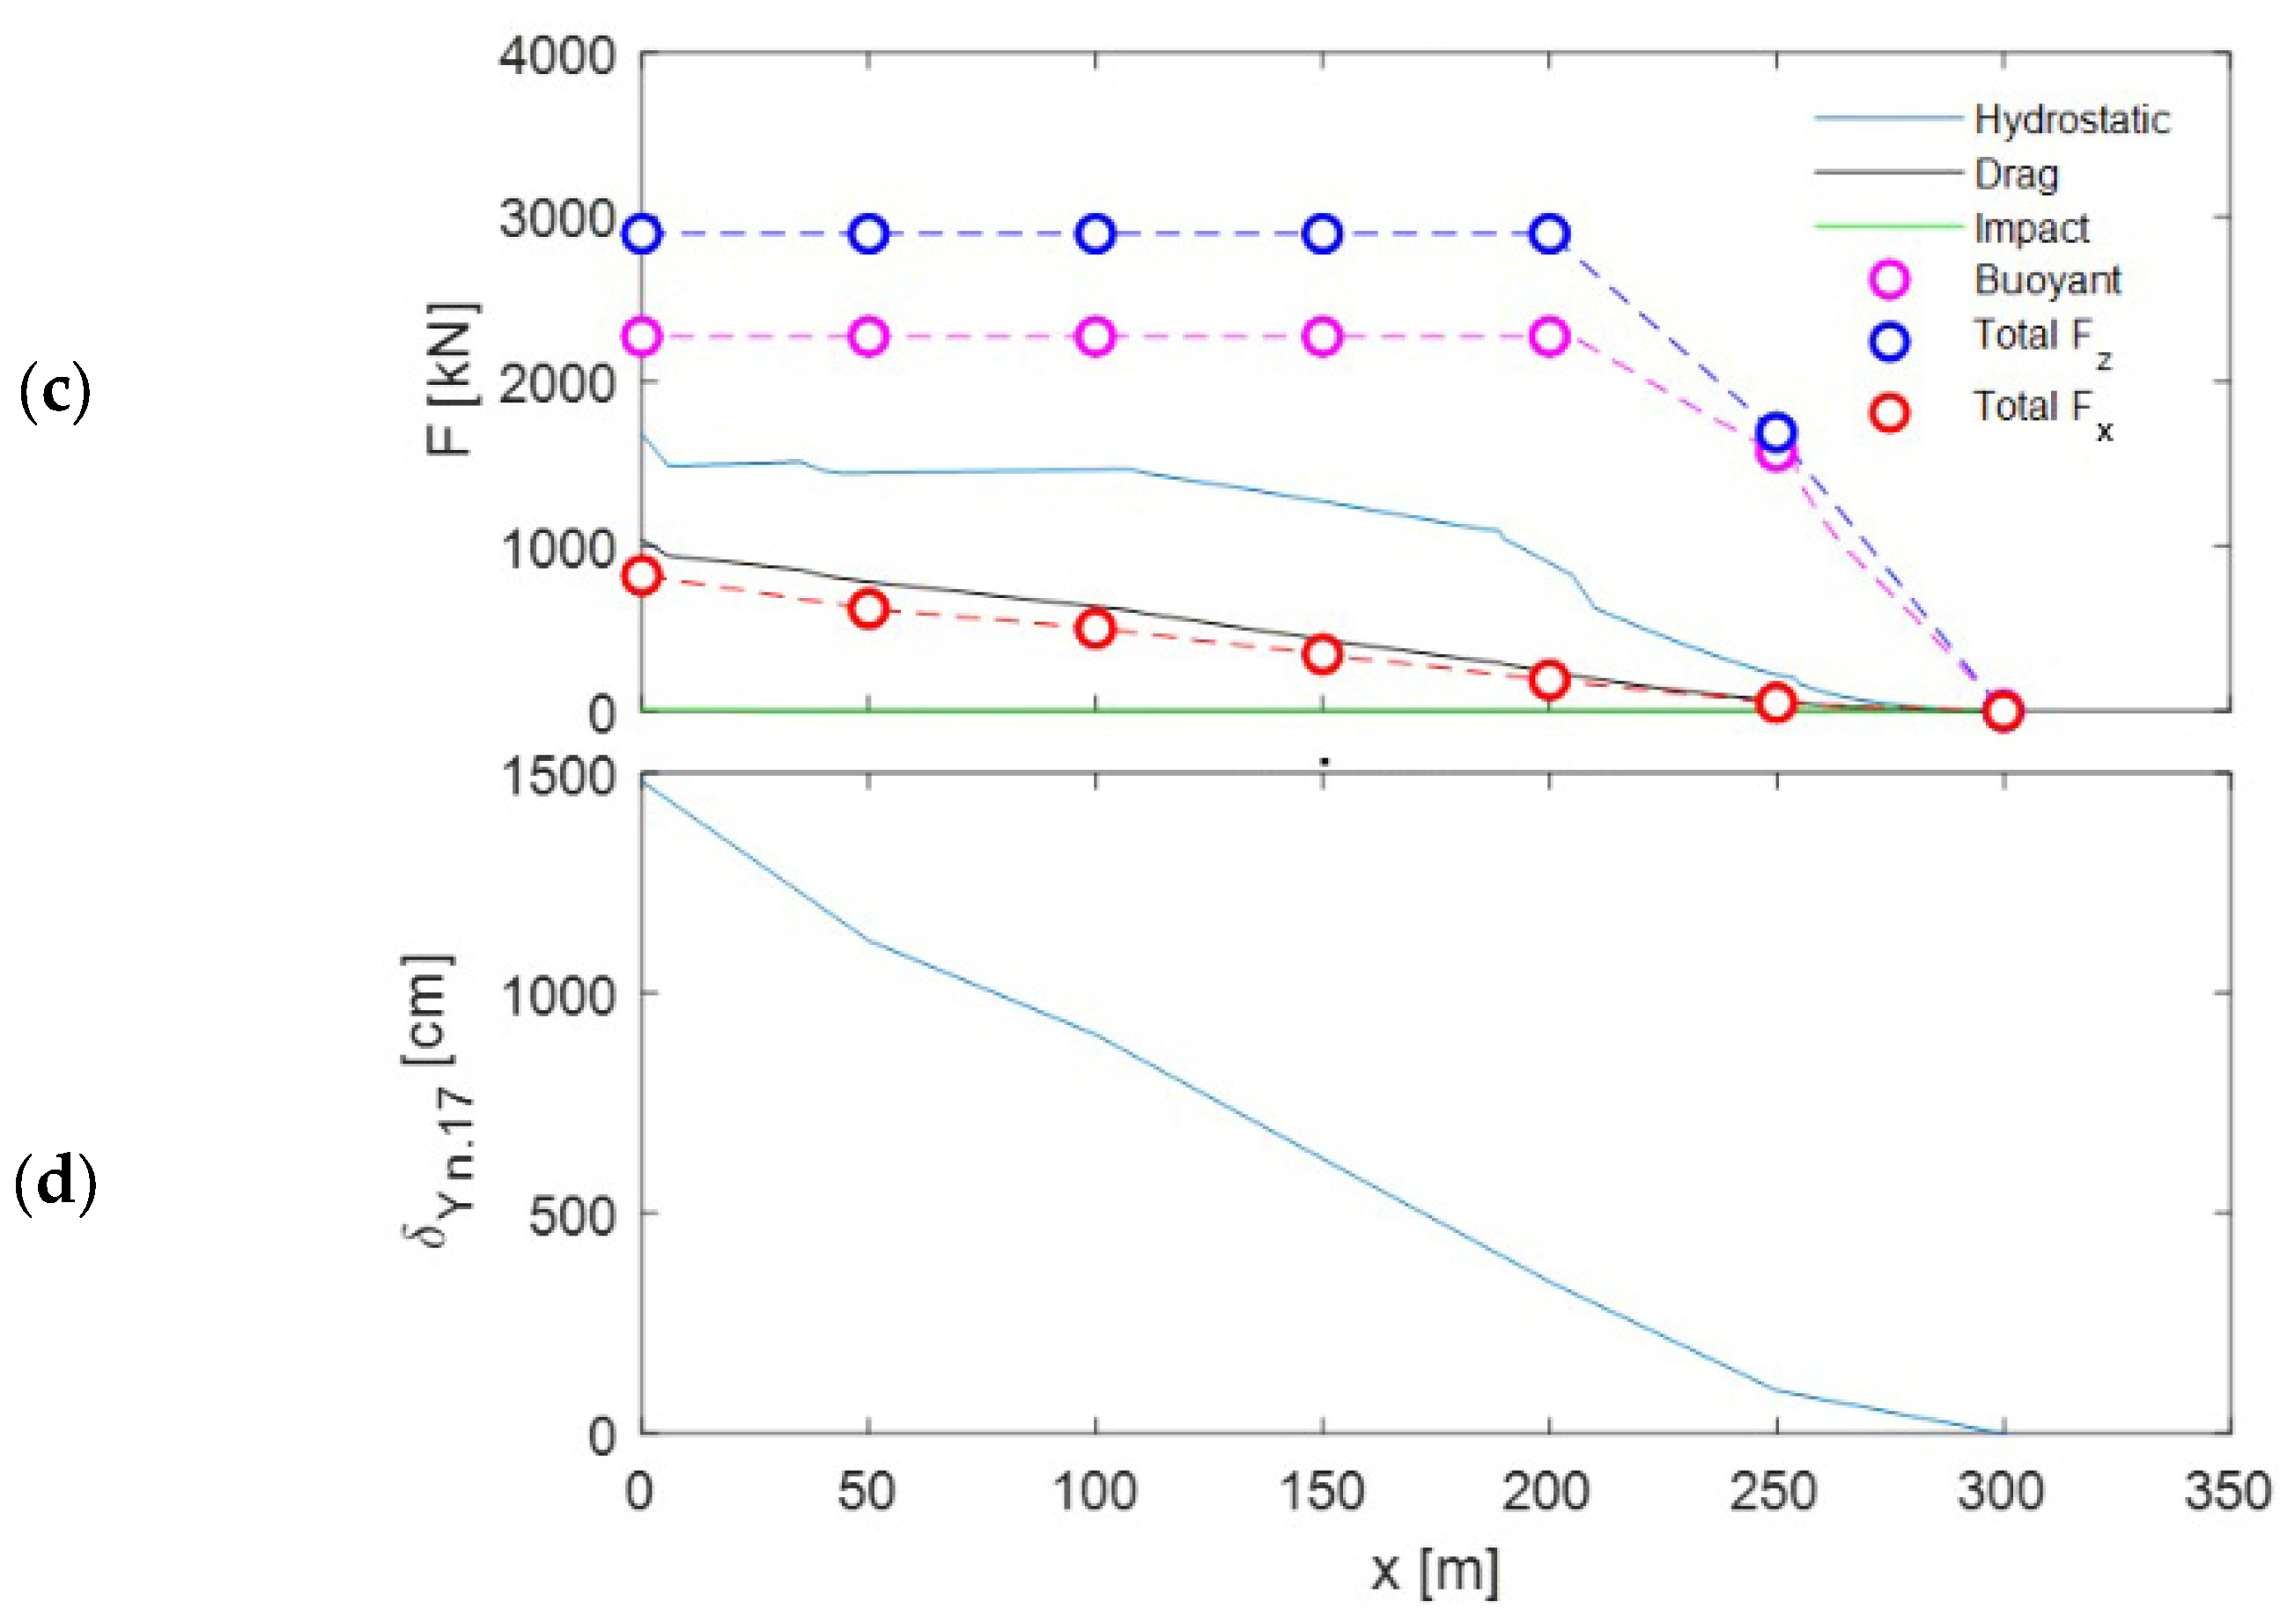
The structural damage was determined based on the criterion of relative displacements caused by the tsunami. As inferred from the structural analysis of all house positions, the structural node of maximum displacement along the x -axis corresponds to node 17 (Figure 6) at x = 0 m in load case C10 (I). Then, the maximum displacement at x = 0 m is compared with the other house positions, resulting in Figure 8d. We found that relative displacements exceeding tens of meters would occur under linear elastic behavior, leading to structural collapse due to the fragility of the material and the connections of the timber structures.

4.3. Supports Reactions

Figure 8c shows a significant reduction in the shear force in the flow direction between x = 0 m and 250 m. The high values of the shear force for the position x = 0 explain the collapse experienced in houses close to the coastline, as observed in Figure 1d. This decrease can explain the dominant failure mode of the buildings closest to the coastline, which were probably separated from their supports as a result of the shear (e.g., Figure 1d). As for the moment, there is not such a drastic reduction when comparing the house positions, thus their influence in house position located at x = 0 m may mean that the failure mode far from the coastline is caused more by the overturning of the structure.
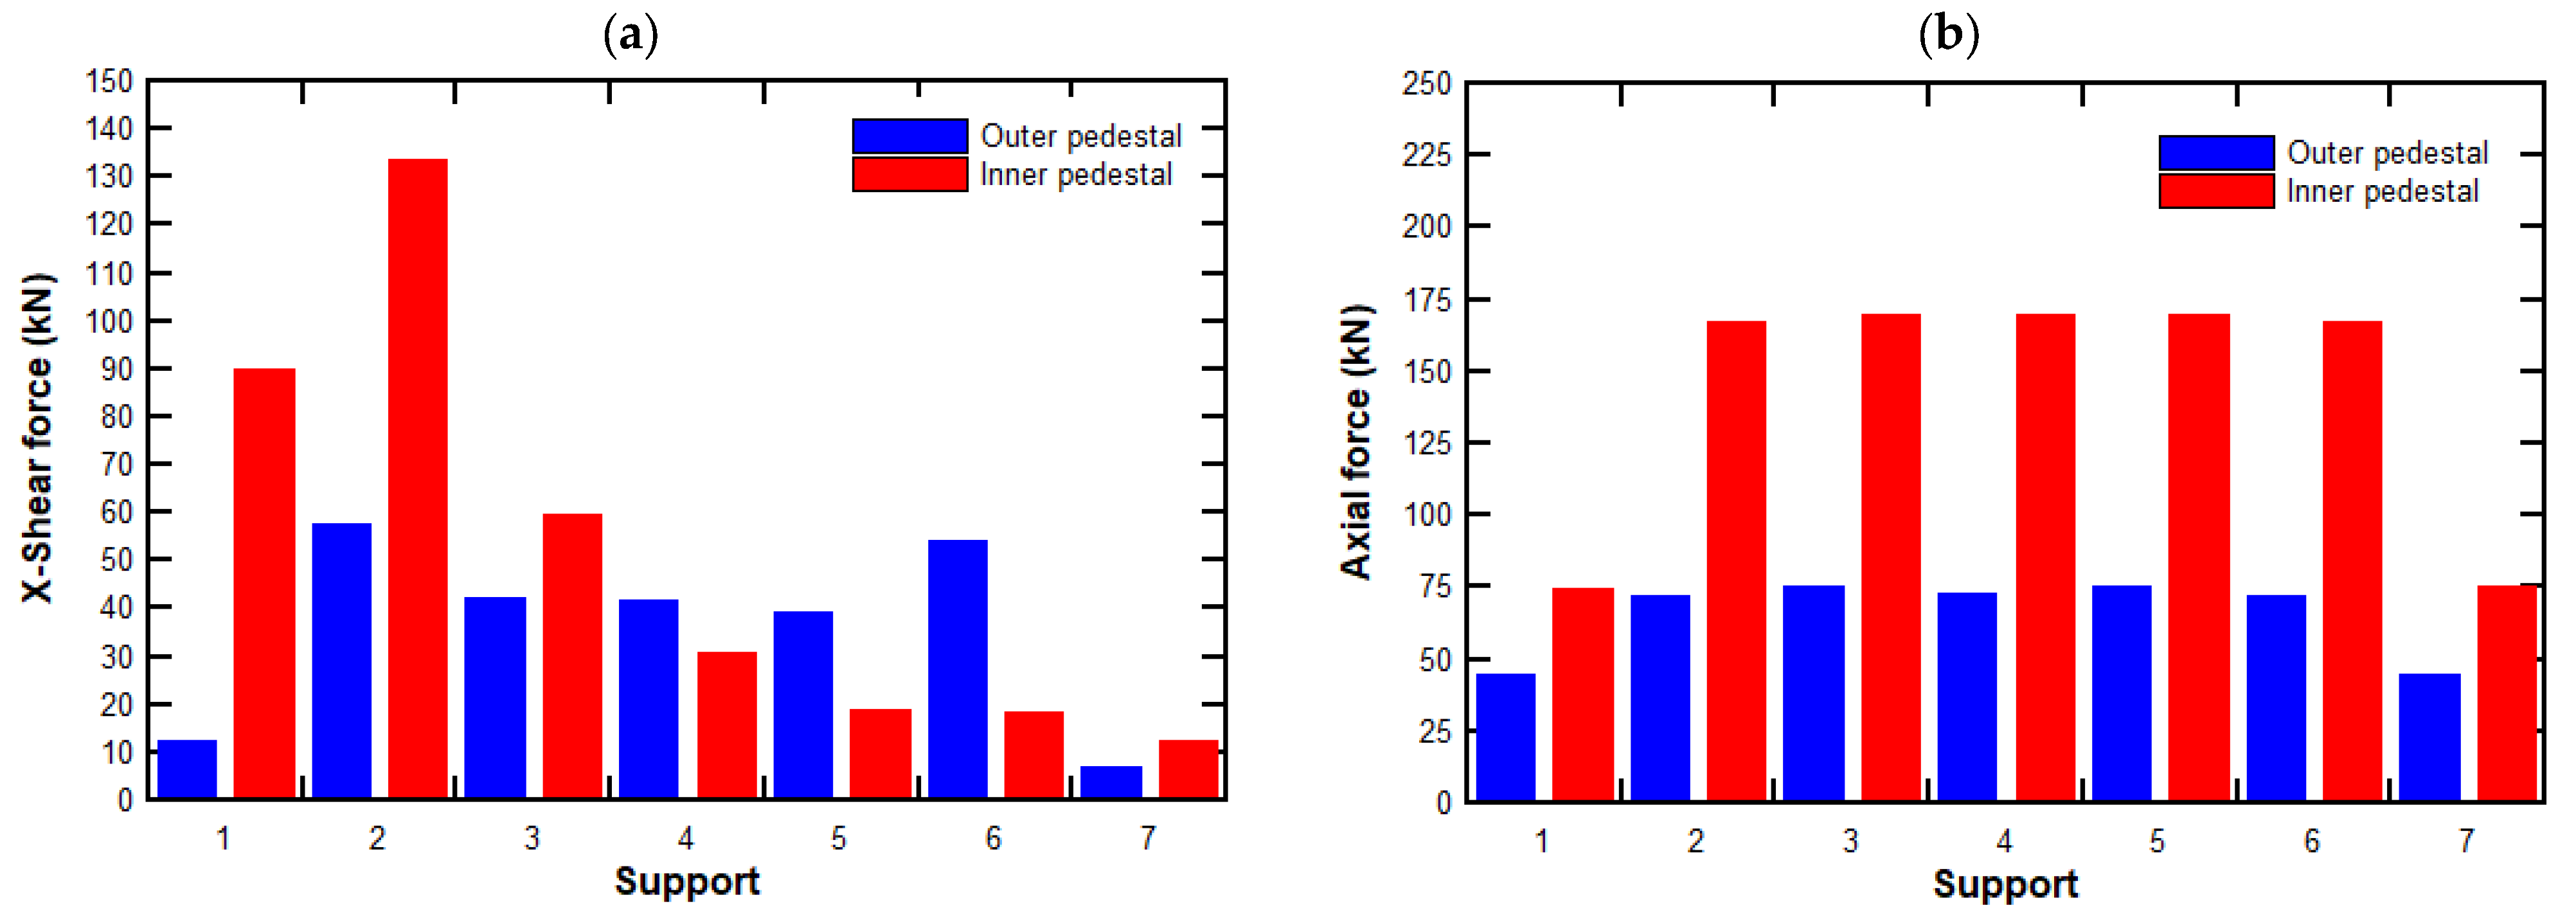
The forces and moments at each of the supports of the structure for the C12 load case (the combination with largest resultant in x -axis) at the two loading instants are presented in Figure 9 and Figure 10 for the positions 0 m and 250 m, respectively. The reactions correspond to the combined and factored loads as indicated above. Table 7 and Table 8 shows the resulting load cases for a house position located at x = 0 m and x = 250 m, respectively. The reactions shown in Figure 8a are obtained from Table 7 and Table 8. Figure 8c summarizes the results of the forces caused by the tsunami in the x - and z -axes, for all house positions.
The nonlinear analysis applied to the structure has allowed the obtainment of the capacity curves for each of the positions considered in the study. These curves are shown in Figure 11. Note that for the positions between 0 m and 200 m, the capacity curves are similar, since the tsunami loads are produced by flood heights that generate loads that cause the structure to collapse. On the contrary, for the position 250 m from the coast, the flood height has been significantly reduced, producing an effect of reducing the loads on the façade that practically maintains the elastic behaviour of the structural elements.
The curves in Figure 11 show points at which the first member reaches plastic deformation and points at which the first failure deformation is reached in one of the members. As soon as damage begins to occur, the curves flatten progressively until reaching the point at which the greatest shear force is reached at the base, whose values are shown in Figure 11. Note that for the positions between x = 0 m and 200 m, the point of maximum shear force has practically the same value. From that point onwards, there is a sustained reduction in the lateral force resistance capacity, reaching the point corresponding to the ultimate displacement.
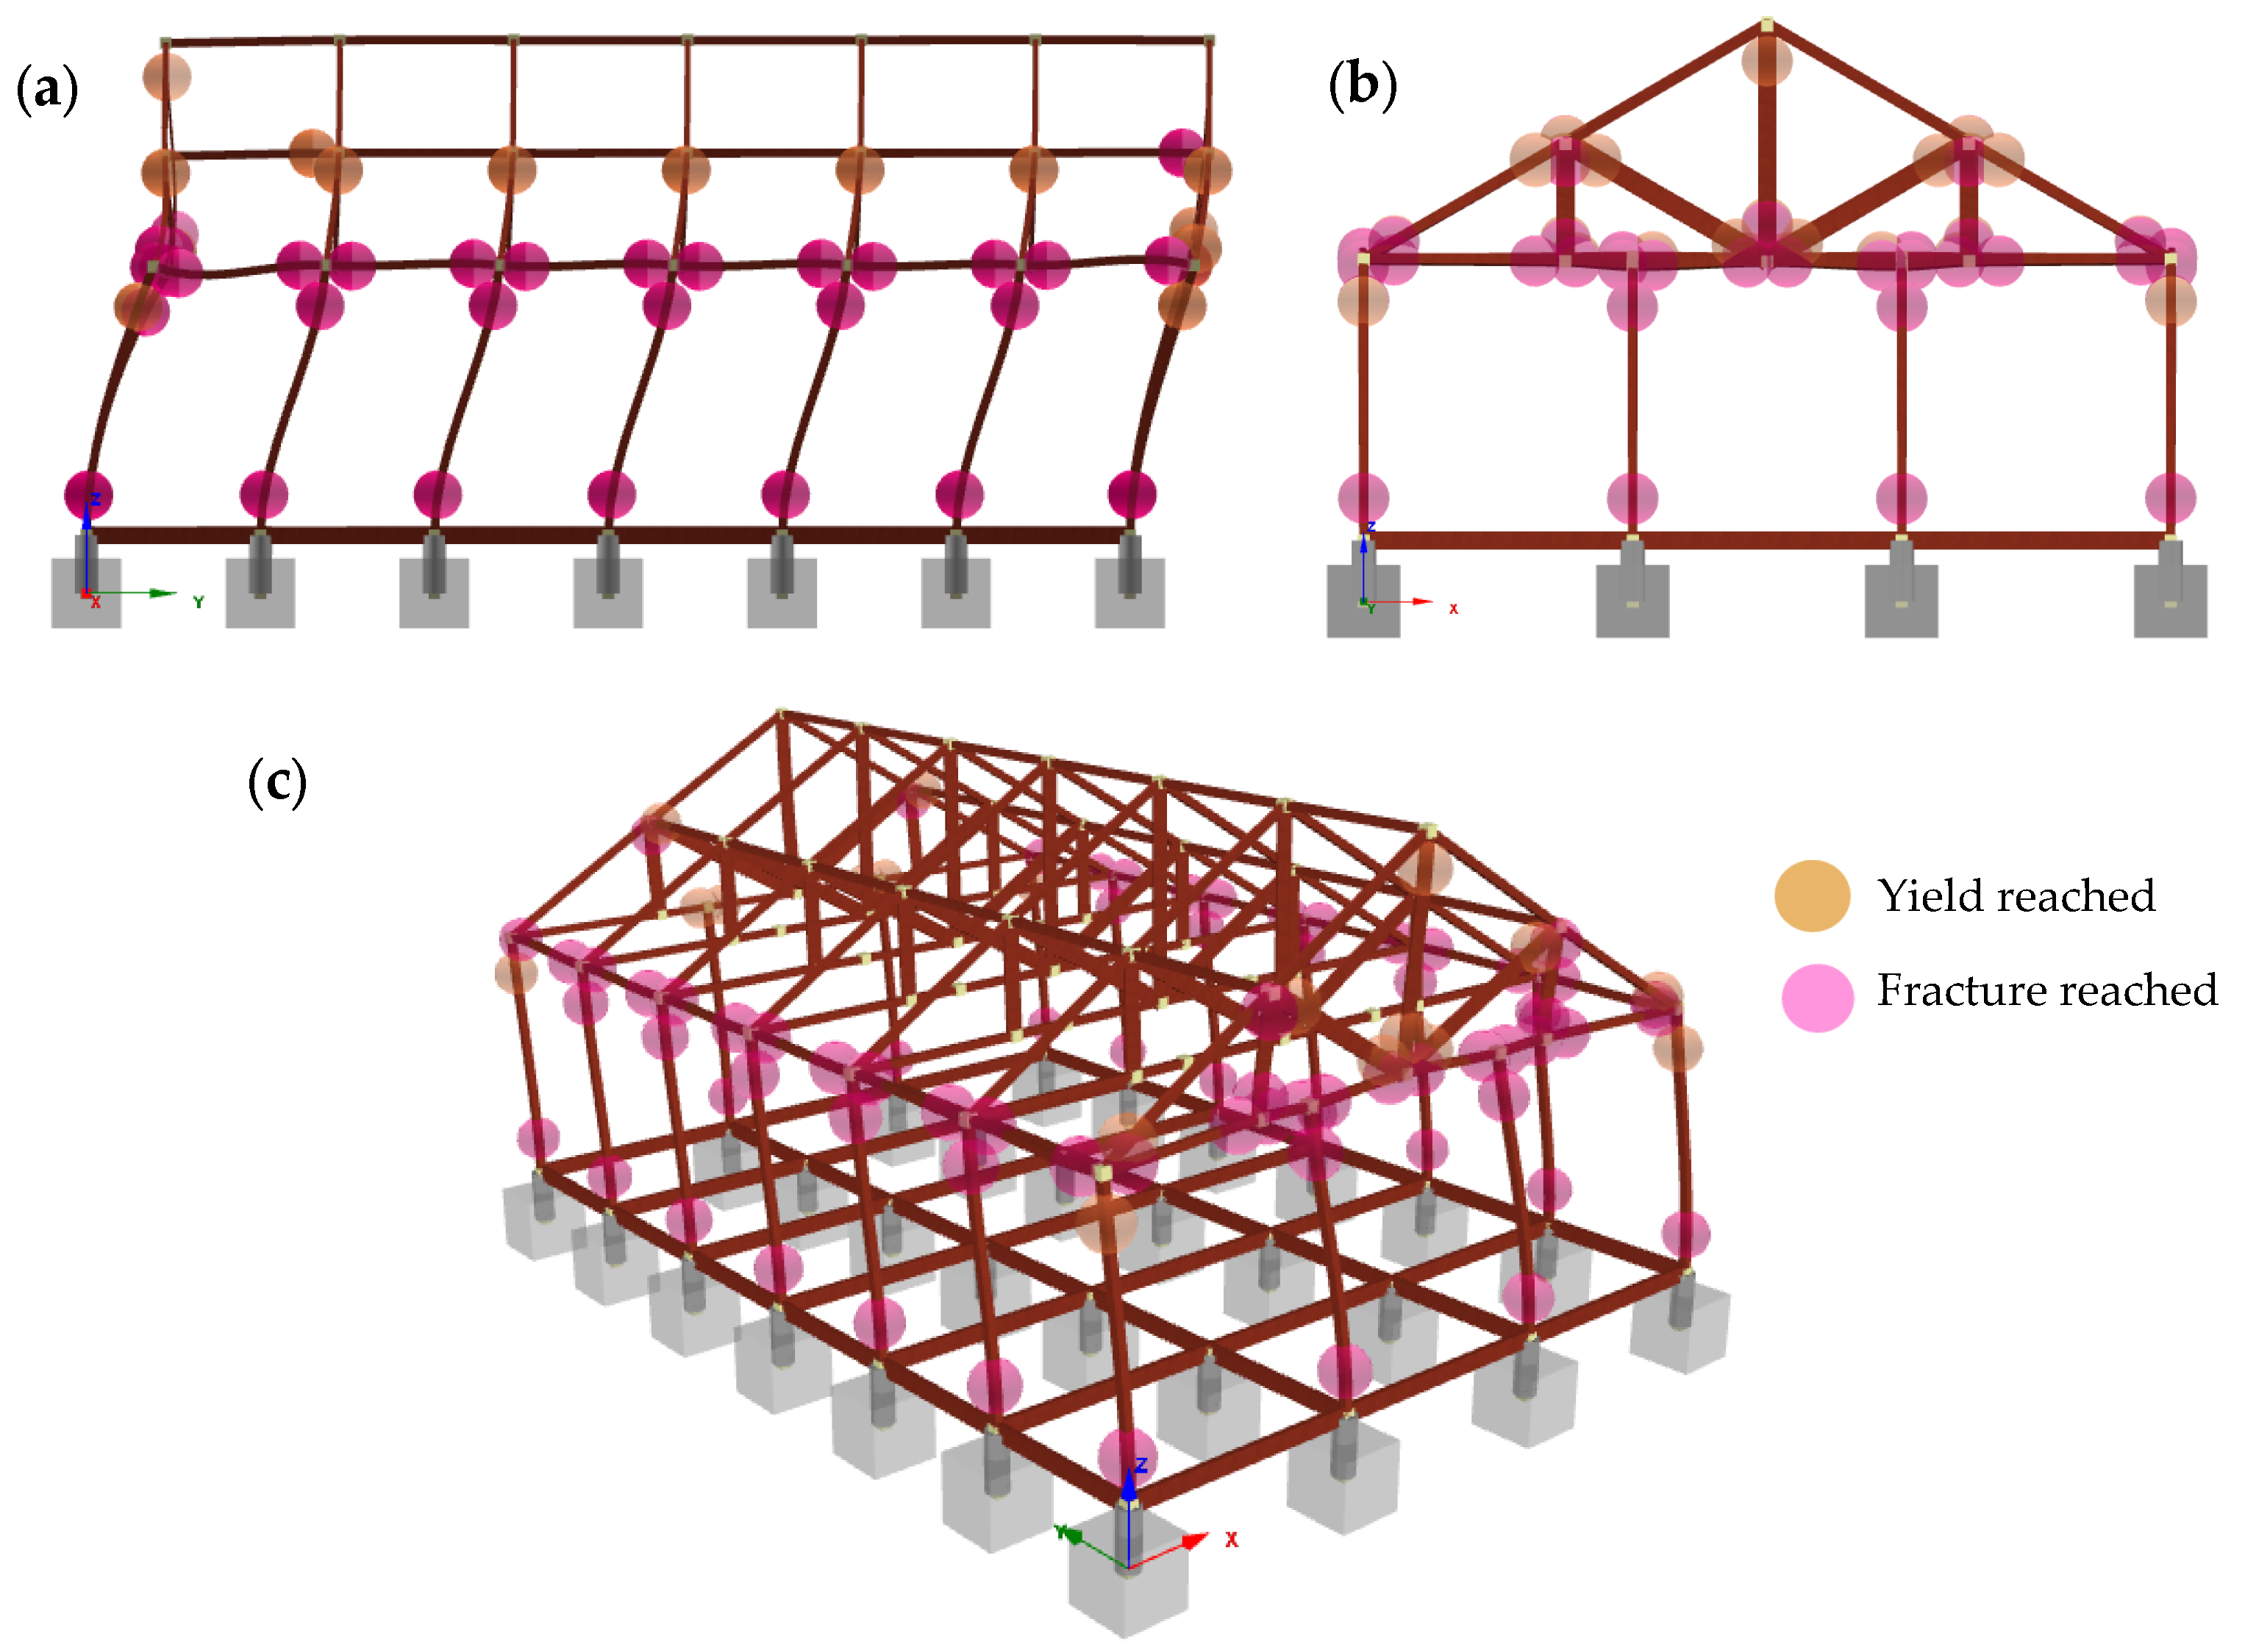
Figure 12 shows the damage at the point of maximum shear force, including points where both plastic deformations (ochre circles) and breaking deformations in the timber elements (pink circles) have occurred. The figure shows the damage for the position x = 200 m; however, it shows similar damage to other positions ( x = 0 m to 150 m). The model located at x = 250 m does not show damage and is thus omitted herein. The noticeable damage in Figure 12a shows that the well-known floor mechanism is formed, where a kinematically unstable structure having all the ends of columns with ball joints cannot sustain greater lateral forces, causing it to collapse. Similarly, Figure 12b shows that tsunami loads cause serious damage to the structural members of the façade at the analysis point for which the maximum shear force is reached, being an indication that these members have collapsed. Finally, note that the reinforced concrete pedestals and the floor frame beams do not show damage, coinciding with the damage observed in houses located near the runup line, as shown in Figure 1c and noticed by Breuer et al. [36].

5. Discussion

5.1. Hydrodynamic Loads Using the EGLA

The application of the EGLA provides an easy way to estimate flow depths and velocities throughout La Pólvora’s topographic profile, given that in situ records are available. However, as shown in Figure 8a, its straightforward application provides a significant overestimation of flow depths, which in turn results in an overestimation of the hydrodynamic forces.
One of the challenges in applying EGLA is the propagation of uncertainties in the estimation of hydrodynamic loads. As shown in Figure 8a, the uncorrected EGL curve overestimates flood depths compared to the field data recorded by Fritz et al. [7]. To mitigate this discrepancy, a correction factor was applied to the EGL curve, ensuring better agreement with the observed values. However, it is important to note that in scenarios where field data are not available to make adjustments, EGLA may introduce variations in the determination of structural loads. Consequently, the loads obtained herein should be considered conservative estimates, useful for assessing trends in structural response but not necessarily representative of the actual loads experienced during a tsunami.
This difference could be attributed to the highly transient and nonuniform flow which is neglected in the EGLA (e.g., stationary flow, neglected vertical accelerations, friction parametrization based on Manning’s formula for uniform stationary flow) or the reliability of the in situ records of flow depths, which are assumed to be reliable herein. For the analyzed case, the use of an ad hoc reduction coefficient to the EGL is a simplified but reasonable alternative given that in situ data are available. However, in applications where only modeled runups are available (e.g., flooding charts), sensitivity analyses and/or calibration processes should be conducted to constrain the uncertainty of the method.
No attempts to compute inundation depths and flow velocities from a time history inundation analysis are conducted herein, as the tide gauge in the pier of San Juan Bautista was destroyed during the tsunami [41]. Therefore, maximum inundation depths and velocities are assumed to be in phase, thus providing a conservative estimation of tsunami loads. Additionally, the flow is assumed to be parallel to La Pólvora’s topographic profile and to all houses’ positions considered herein, thus neglecting the transverse effects (along the y -axis) on the structural response of each structure. An improvement from EGLA could be achieved by means of more sophisticated methods which could recover the transient nature of the flow, the phase lag of flow depths and velocities, the horizontal pattern of the flow (e.g., Shallow Water Equations or Boussinesq type of equations) and, eventually, the three-dimensional nature of the flow triggered by the steep nearshore bathymetry characterizing the neighboring San Juan Bautista (e.g., Reynolds-Averaged Navier–Stokes equations, Large Eddy Simulations).
While more advanced methods—such as numerical modeling based on Shallow Water Equations (SWE) or Reynolds Averaged Navier–Stokes (RANS) equations—would allow for a more accurate representation of the temporal and spatial evolution of tsunami flow, our study does not aim to provide a comprehensive validation of hydrodynamic parameters other than water levels captured in situ. Instead, our approach focuses on the structural response of timber houses under hydrodynamic loads estimated using a practical method. Future research could complement this analysis with more detailed studies incorporating advanced numerical modeling to assess the degree of uncertainty associated with the use of EGLA in this type of application.

5.2. Structural Analysis Using the EGLA

According to ASCE 7-22, Chapter 6, buildings in tsunami-exposed areas are subjected to hydrostatic and hydrodynamic forces, waterborne debris accumulation and impact loads, subsidence and scour. In this study, we disregard scour or the geotechnical damage of the soil, as there was no ubiquitous evidence of such phenomena during the field surveys by Fritz et al. [7] and Breuer et al. [36]. Additionally, being far from the rupture, there is no evidence of subsidence following the 27 February 2010 earthquake in the town of San Juan Bautista.
As for the structural analysis, Figure 8a and Figure 9a show that the support reactions in the x -axis at the coastline ( x = 0 m) is 16 times larger than those in the farthest position ( x = 250 m). In contrast, along the z -axis, the ratio is 1.8 for the same positions. The total forces in the y -axis are zero in all cases, as the flow depth is assumed to be equal on both sides of the structure, causing the lateral hydrostatic forces to cancel each other out.
Figure 8a and Figure 9a also show that the shear forces in the x -axis decrease as the house location is further from the coastline. This is because the drag and impact forces of floating objects scale with the square of the flow velocity, the latter of which decreases as the flow depth does. In the z -axis, forces remain constant up to x = 200 m as the structure is completely submerged (i.e., the displaced volume is equal to the house’s volume), then decrease considerably at x = 250 m, as the house becomes partially flooded.
Upon examining the resulting structural deformations, the maximum inter-story drift of 4.94 is observed at node 17 in the x -axis for the structure’s position at the coastline ( x = 0 m) under the most unfavorable load case. This value significantly exceeds the maximum inter-story drift considered in the design of timber frame structures [54,55], suggesting that the structures experience complete collapse due to the tsunami. Such a large inter-story drift is obtained by considering the linear elastic behavior of structural elements, which, due to their flexibility, tend to deform under combined loading actions. Additionally, displacements are significant across all positions of the structure, indicating that the house reaches collapse as it can no longer support its own weight due to the overturning moments produced by the shifting centers of gravity of the structural components.

5.3. Failure Due to Buoyancy

Our results do not provide sufficient details to conclude whether houses float or fail due to tsunami impact, but provide spatial estimates of force magnitudes prompting the latter (i.e., buoyancy) or former (i.e., hydrodynamic and impact forces) failure modes. The few houses that presumably floated (Figure 1c) were constrained to the last few meters before the runup, which were not fully captured with the spatial spacing of 50 m considered for each house position. This could be further improved by increasing the spatial resolution of the analysis for this particular case, by conducting sensitivity analyses for simplified flow conditions and structures or more sophisticated methods. Additionally, from the three post-tsunami field surveys conducted by the Ocean Engineering team at Universidad de Valparaíso [41], structural damage was only assessed on 28 March 2010, nearly one month after the tsunami, and after reconstruction works had concluded. By this time, clear evidence of structural damage was scarce and likely modified.
Fortunately, structural failure due to buoyancy has been investigated by several researchers. Yeh et al. [56], for example, found that buoyancy reduces the net force on the structural body, thereby diminishing the recovery forces needed to resist sliding and overturning failures. They concluded that the failure patterns of buildings following the 2011 Tohoku earthquake and tsunami were diverse: some buildings inland failed during the runup while others failed during the drawdown, being pushed towards the sea. This suggests that forces of the external flow alone may not govern the failure mode, but the stability of buildings previously weakened by buoyancy force may have played a role in their failure. Conversely, del Zoppo et al. [57] showed that buoyancy can lead to failure in combination with other effects associated with tsunamis.
Buoyancy can be a critical factor when coastal buildings feature fragile vertical enclosures, such as walls, doors and windows. Indeed, Yeh et al. [58,59] showed that precarious constructions with vertical enclosures survived the tsunami following the Tohoku earthquake, allowing us to deduce that buoyancy played a decisive role in San Juan Bautista, as single-story houses exhibited similar features of fragile vertical enclosures. This digression is, however, tentative in San Juan Bautista, as the majority of timber houses were fully destroyed, their parts scattered and then mixed with the flow, thus making the identification of failure modes hard.

5.4. Contribution to the Resilience of Coastal Communities

The resilience of specific urban or rural communities to tsunamis is very sensitive to the location and distance of buildings with respect to the coast [60]. This is especially true for timber structures, which despite their ductile performance, are highly vulnerable to the action of tsunamis [60,61]. To reduce the impact of tsunamis, a “location criterion” where timber houses are located above the flooding line should therefore be combined with the design of mitigation works, the use of other structural typologies or reinforcements at the most stressed points of structures [61]. However, localized damage in exposed houses due to the impact of floating objects [62] is highly expected, regardless of the typology or materials used. To plan effective interventions, the planning process should also be based on resilience metrics [63] and the use of fragility curves and/or surfaces, such as those developed in earthquake-resistant design [60,64]. Last but not least, the resilience of communities should be improved by matching urban planning with the implementation of early warning systems to evacuate the population to safe shelters, designed in accordance with regulatory provisions [65].

6. Conclusions

This study assesses the structural response of single-story timber houses subjected to tsunami-induced loads using the EGLA method in different positions along a topographic profile in San Juan Bautista. We aimed to understand the failure modes of these lightweight structures and to determine whether the distance from the coast can be considered a factor in improving the safety of such constructions against future events.
As for the estimation of hydrodynamic loads, the EGLA provides a simple approach whenever in situ records are available. However, more sophisticated hydrodynamic models (e.g., SWE or RANS) could improve accuracy by capturing transient flow behaviors and three-dimensional effects which are not considered in EGLA.
Structural (linear) analyses reveal that, near the coastline, timber houses experience excessively large displacements and structural collapse as a result of a combination of buoyancy, impact, hydrodynamic and drag forces. The presence of buoyant forces (~290 ton-f) exacerbates structural instability in houses near the shore, reducing the foundations’ anchorage efficiency and contributing to structural flotation. On the contrary, the farther from the coastline, the lower the depths and flow velocities, which leads to a decrease in drag forces and results in decreased displacements and reduced structural demand.
The nonlinear analysis confirms the results obtained from the linear analysis, since the structure collapses in all positions in the first 200 m from the coastline, while presenting a very low demand near the maximum runup, for which the structure remains elastic, without any of its members showing damage. Consequently, the methodology based on EGLA provides consistent results of the behavior of structures subjected to large tsunami forces, without requiring very sophisticated and laborious analyses such as those involving the nonlinearity characteristics of the structures.
Given the limitations of nonlinear analysis, the analysis applied to the structure located at x = 250 m only considers the lateral forces caused by the tsunami acting on the façade. However, it is expected that the buoyancy forces will cause the collapse of the structure, since they reach a value close to 1600 kN.
Despite their seismic resistance, lightweight timber structures are not suitable for areas prone to tsunamis. The use of heavier and more rigid materials, such as reinforced concrete, is recommended to withstand hydrodynamic and buoyant forces effectively. An interesting exercise would be to implement nonlinear analysis in steel, reinforced concrete and masonry structures responding to tsunami loads, aiming to provide guidelines for the design of structures of different materials, e.g., [66,67,68,69]. Future research should also evaluate the performance of different configurations (e.g., two or more story houses, elevated houses, the use of composite materials) to establish comprehensive design guidelines for tsunami-prone areas. Overall, the study highlights the need for stricter building codes in coastal regions, the use of tsunami-resilient design materials and the relocation of lightweight structures further inland to mitigate risk.
While EGLA provides practical estimates of tsunami-induced loads on coastal structures, its application in structural design should be approached with caution. ASCE 7-22 acknowledges that EGLA is a useful method for exploratory studies and preliminary estimations; however, its use as the sole tool for designing tsunami-resilient structures should be supplemented with more rigorous approaches whenever feasible. In particular, combining EGLA with detailed structural analyses or advanced hydrodynamic modeling could offer a more accurate assessment of structural performance under extreme loads. Additionally, land-use planning and the selection of appropriate construction materials remain key factors in mitigating damage in tsunami-prone areas.
Future research should explore the performance of different building materials under tsunami-induced loads, particularly reinforced concrete, steel and hybrid structural systems. Conducting nonlinear analyses on these materials could provide a comparative assessment of their resistance to hydrodynamic forces and their failure mechanisms, contributing to the development of more robust design guidelines. Additionally, optimizing disaster-resistant designs through computational techniques, such as performance-based design approaches or topology optimization, could help to enhance structural resilience in tsunami-prone areas. These studies could also incorporate experimental validations to further refine numerical modeling techniques and improve the accuracy of failure predictions for different structural typologies.

Author Contributions

Conceptualization, P.W. and D.O.M.; methodology, P.W.; software, D.O.M., P.W. and J.C.V.; validation, P.W. and J.C.V.; formal analysis, D.O.M., P.W. and J.C.V.; investigation, D.O.M.; resources, P.W. and J.C.V.; data curation, P.W. and J.C.V.; writing—original draft preparation, D.O.M.; writing—review and editing, P.W. and J.C.V.; visualization, P.W.; supervision, P.W. and J.C.V. All authors have read and agreed to the published version of the manuscript.

Funding

This research received no external funding.

Institutional Review Board Statement

Not applicable.

Informed Consent Statement

Not applicable.

Data Availability Statement

The research data are available in the authors’ files and may be provided to interested parties upon direct request by email.

Acknowledgments

The authors wish to express their gratitude to the Pontificia Universidad Católica de Valparaíso and the Universidad de Valparaíso, in whose facilities this research was carried out.

Conflicts of Interest

The authors declare no conflicts of interest.

Appendix A. Impact of Wood Logs Using ASCE 7-22

The nominal maximum instantaneous debris impact force F n i is determined in accordance with Equation (A1)
F n i = u m a x k   m d
where u m a x is the maximum flow velocity at depths sufficient to float the debris, k the effective stiffness of the impacting debris or the lateral stiffness of the impacted structural element(s) deformed by the impact, whichever is less and m d the mass of the debris. The instantaneous debris impact force F i is determined with Equation (A2)
F i = I t s u C o F n i
where C o is the orientation coefficient ( C o = 0.65 for logs and poles). Logs are assumed to strike longitudinally for the calculation of debris stiffness in the equation. The stiffness of logs is calculated as k = E A / L , in which E is the longitudinal modulus of elasticity of the log, A its cross-sectional area and L its length. A Pinus radiata wood log, 2.5 m long and 75 cm in diameter with a density of 420 kg/m3 and an elastic modulus of 7900 MPa, is considered. Along with Eucalyptus, Pinus radiata is the most abundant species in the lower part of San Juan Bautista. With these assumptions, the impact force resulted in F i = 130 tonf, which was considered excessive.
Table A1. Parameters used to compute impact of wood logs using ASCE 7-22.
ParameterSymbolDimensionValue
Effective stiffness of the impacting logskkN/m1.39 × 106
Maximum velocity at depths of debris u m a x m/s8.05
Mass of debris object m d kg500
Orientation coefficient C o -0.65

References

  1. Stolle, J.; Takabatake, T.; Nistor, I.; Mikami, T.; Nishizaki, S.; Hamano, G.; Ishii, H.; Shibayama, T.; Goseberg, N.; Petriu, E. Experimental investigation of debris damming loads under transient supercritical flow conditions. Coast. Eng. 2018, 139, 16–31. [Google Scholar] [CrossRef]
  2. Aguiniga, F.; Jaiswal, M.; Sai, J.; Cox, D.; Gupta, R.; Lindt, J. Experimental study of tsunami forces on structures. In Coastal Hazards; American Society of Civil Engineers: Reston, VA, USA, 2013; pp. 111–118. [Google Scholar] [CrossRef]
  3. Bremm, G.; Goseberg, N.; Schlurmann, T.; Nistor, I. Long Wave Flow Interaction with a Single Square Structure on a Sloping Beach. J. Mar. Sci. Eng. 2015, 3, 821–844. [Google Scholar] [CrossRef]
  4. Goseberg, N.; Schlurmann, T. Non-stationary Flow around Buildings during Run-up of Tsunami Waves on a Plain Beach. Coast. Eng. Proc. 2014, 1, 21. [Google Scholar] [CrossRef]
  5. Goseberg, N.; Wurpts, A.; Schlurmann, T. Laboratory-Scale Generation of Tsunami and Long Waves. Coast. Eng. 2013, 79, 57–74. [Google Scholar] [CrossRef]
  6. Ghobarah, A.; Saatcioglu, M.; Nistor, I. The Impact of the 26 December 2004 Earthquake and Tsunami on Structures and Infrastructure. Eng. Struct. 2006, 28, 312–326. [Google Scholar] [CrossRef]
  7. Fritz, H.; Petroff, C.; Catalán, P.; Cienfuegos, R.; Winckler, P.; Kalligeris, N.; Weiss, R.; Barrientos, S.; Meneses, G.; Valderas-Bermejo, C.; et al. Field Survey of the 27 February 2010 Chile Tsunami. Pure Appl. Geophys. 2011, 168, 1989–2010. [Google Scholar] [CrossRef]
  8. Robertson, I.; Chock, G.; Morla, J. Structural Analysis of Selected Failures Caused by the 27 February 2010 Chile Tsunami. Earthq. Spectra 2012, 28, 215–243. [Google Scholar] [CrossRef]
  9. Zareian, F.; Aguirre, C.; Beltran, J.; Cruz, E.; Herrera, R.; Leon, R.; Millan, A.; Verdugo, A. Reconnaissance Report of Chilean Industrial Facilities Affected by the 2010 Chile Offshore Bío-Bío Earthquake. Earthq. Spectra 2012, 28, 513–532. [Google Scholar] [CrossRef]
  10. Jayaratne, M.; Premaratne, B.; Adewale, A.; Mikami, T.; Matsuba, S.; Shibayama, T.; Esteban, M.; Nistor, I. Failure Mechanisms and Local Scour at Coastal Structures Induced by Tsunami. Coast. Eng. J. 2016, 58, 1640017-1–1640017-38. [Google Scholar] [CrossRef]
  11. Koshimura, S.; Hayashi, S.; Gokon, H. The Impact of the 2011 Tohoku Earthquake Tsunami Disaster and Implications to the Reconstruction. Soils Found. 2014, 54, 560–572. [Google Scholar] [CrossRef]
  12. Amakuni, K.; Terazono, N.; Yamamoto, T.; Enomoto, T. Basic Analysis on Building Damages by Tsunami Due to the 2011 Great East Japan Earthquake Disaster Using GIS. In Proceedings of the 15th World Conference on Earthquake Engineering, Lisbon, Portugal, 24–28 September 2012. [Google Scholar]
  13. Charvet, I.; Suppasri, A.; Imamura, F. Empirical Fragility Analysis of Building Damage Caused by the 2011 Great East Japan Tsunami in Ishinomaki City Using Ordinal Regression, and Influence of Key Geographical Features. Stoch. Environ. Res. Risk Assess. 2014, 28, 1853–1867. [Google Scholar] [CrossRef]
  14. Chock, G.; Robertson, I.N. Tsunami Design Criteria and Load Cases of the ASCE 7-16 Chapter 6, Tsunami Loads and Effects. In Proceedings of the 16th World Conference on Earthquake Engineering, 16WCEE, Santiago de Chile, Chile, 9–13 January 2017. [Google Scholar]
  15. Robertson, I.N.; Thomas, S.A. Prototype Building Tsunami Design Examples. In Proceedings of the 16th World Conference on Earthquake Engineering, 16WCEE, Santiago de Chile, Chile, 9–13 January 2017. [Google Scholar]
  16. Charvet, I.; Macabuag, J.; Rossetto, T. Estimating Tsunami-Induced Building Damage through Fragility Functions: Critical Review and Research Needs. Front. Built Environ. 2017, 3, 36. [Google Scholar] [CrossRef]
  17. Kihara, N.; Kaida, H.; Shibayama, A.; Miyagawa, Y. Responses of Concrete Vertical Walls to Tsunami Wave Pressures and Debris Impact. Coast. Eng. Proc. 2018, 1, 38. [Google Scholar] [CrossRef]
  18. Kihara, N.; Niida, Y.; Takabatake, D.; Kaida, H.; Shibayama, A.; Miyagawa, Y. Large-Scale Experiments on Tsunami-Induced Pressure on a Vertical Tide Wall. Coast. Eng. 2015, 99, 46–63. [Google Scholar] [CrossRef]
  19. Naito, C.J.; Riggs, H.R.; Wei, Y.; Cercone, C. Shipping-Container Impact Assessment for Tsunamis. J. Waterw. Port Coast. Ocean Eng. 2016, 142, 05016003. [Google Scholar] [CrossRef]
  20. Naito, C.J.; Cercone, C.; Riggs, H.R.; Cox, D. Procedure for Site Assessment of the Potential for Tsunami Debris Impact. J. Waterw. Port Coast. Ocean Eng. 2014, 140, 223–232. [Google Scholar] [CrossRef]
  21. Linton, D.; Gupta, R.; Cox, D.; van de Lindt, J.; Oshnack, M.E.; Clauson, M. Evaluation of Tsunami Loads on Wood-Frame Walls at Full Scale. J. Struct. Eng. 2013, 139, 1318–1325. [Google Scholar] [CrossRef]
  22. Krautwald, C.; von Häfen, H.; Niebuhr, P.; Vögele, K.; Stolle, J.; Schimmels, S.; Schürenkamp, D.; Sieder, M.; Goseberg, N. Collapse Processes and Associated Loading of Square Light-Frame Timber Structures Due to Bore-Type Waves. Coast. Eng. 2022, 177, 104178. [Google Scholar] [CrossRef]
  23. Suppasri, A.; Mas, E.; Charvet, I.; Gunasekera, R.; Imai, K.; Fukutani, Y.; Abe, Y.; Imamura, F. Building Damage Characteristics Based on Surveyed Data and Fragility Curves of the 2011 Great East Japan Tsunami. Nat. Hazards 2013, 66, 319–341. [Google Scholar] [CrossRef]
  24. Baiguera, M.; Rossetto, T.; Robertson, I.N.; Petrone, C. Towards a Tsunami Nonlinear Static Analysis Procedure for the ASCE 7 Standard. In Proceedings of the 2nd International Conference on Natural Hazards & Infrastructure 2019, Chania, Greece, 23–26 June 2019. [Google Scholar]
  25. Aegerter, D.W.; Robertson, I.N. Push-over Tsunami Analysis Using ETABS. In Proceedings of the Current Perspectives and New Directions in Mechanics, Modelling and Design of Structural Systems, Proceedings of the 8th International Conference on Structural Engineering, Mechanics and Computation 2022, Cape Town, South Africa, 5–7 September 2022; CRC Press/Balkema: Boca Raton, FL, USA, 2023; pp. 221–227. [Google Scholar]
  26. McKenna, F.; Fenves, G.L.; Scott, M.H.; Jeremic, B. Open system for earthquake engineering simulation (OpenSees). In Computer Program; University of California: Berkeley, CA, USA, 2000; Available online: https://opensees.berkeley.edu/ (accessed on 15 June 2024).
  27. CSI (Computers and Structures, Inc.). ETABS Integrated Building Design Software, Version 2018; CSI: Walnut Creek, CA, USA, 2018; Available online: https://www.csiamerica.com/products/etabs (accessed on 1 December 2024).
  28. American Society of Civil Engineers. Minimum Design Loads and Associated Criteria for Buildings and Other Structures; ASCE7-22: Reston, VA, USA, 2022; ISBN 9780784415788. [Google Scholar]
  29. Kriebel, D.L.; Lynett, P.J.; Cox, D.T.; Petroff, C.; Robertson, I.N.; Chock, G.Y.K. Energy method for approximating overland tsunami flows. J. Waterw. Port Coast. Ocean Eng. 2017, 143, 1–19. [Google Scholar] [CrossRef]
  30. Wiebe, D.M. Tsunami Inundation: Estimating Damage and Predicting Flow. Properties. Master’s Thesis, Oregon State University, Corvallis, OR, USA, 2013. [Google Scholar]
  31. American Society of Civil Engineers. Minimum Design Loads for Buildings and Other Structures; ASCE 7-16: Reston, VA, USA, 2017. [Google Scholar]
  32. Carden, L.; Chock, G.; Yu, G.; Robertson, I. The New ASCE Tsunami Design Standard Applied to Mitigate Tohoku Tsunami Building Structural Failure Mechanisms. In Handbook of Coastal Disaster Mitigation for Engineers and Planners; Shibayama, T., Esteban, M., Takagi, H., Eds.; Elsevier: Amsterdam, The Netherlands, 2015; pp. 461–490. [Google Scholar] [CrossRef]
  33. Chock, G.; Yu, G.; Thio, H.; Lynett, P. Target Structural Reliability Analysis for Tsunami Hydrodynamic Loads of the ASCE 7 Standard. J. Struct. Eng. 2016, 142, 04016092. [Google Scholar] [CrossRef]
  34. Chock, G. Design for Tsunami Loads and Effects in the ASCE 7-16 Standard. J. Struct. Eng. 2016, 142, 04016093. [Google Scholar] [CrossRef]
  35. Tada, T.; Miyata, Y.; Bathurst, R. Energy Grade Line Analysis of Tsunami Run-up on the Sendai Plain after the 2011 Tohoku Earthquake. Coast. Eng. 2018, 140, 306–315. [Google Scholar] [CrossRef]
  36. Breuer, W.A.; Igualt, F.; Contreras-López, M.; Winckler, P.; Zambra, C. Tsunami Impact and Resilience Cycle in an Insular Town: The Case of Robinson Crusoe Island, Chile. Ocean Coast. Manag. 2021, 209, 105714. [Google Scholar] [CrossRef]
  37. Contreras, M.; Winckler, P. Pérdidas de vidas, viviendas, infraestructura y embarcaciones por el Tsunami del 27 de Febrero de 2010 en la costa central de Chile. Obras Proy. 2013, 14, 6–19. [Google Scholar] [CrossRef]
  38. UV. El Sonido de Robinson. Escuela de Ingeniería Civil Oceánica, Universidad de Valparaíso and Mosca Films. 2010. Available online: https://www.youtube.com/watch?v=pWtCDsXpWcE (accessed on 1 November 2023).
  39. Chock, G.; Carden, L.; Robertson, I.; Olsen, M.; Yu, G. Tohoku tsunami-induced building failure analysis with implications for US tsunami and seismic design codes. Earthq. Spectra 2013, 29 (Suppl. S1), 99–126. [Google Scholar] [CrossRef]
  40. Chock, G.; Robertson, I.; Kriebel, D.; Francis, M.; Nistor, I. Tohoku, Japan, Earthquake and Tsunami of 2011: Performance of Structures under Tsunami Loads; Book Set: Tohoku Earthquake; American Society of Civil Engineers: Reston, VA, USA, 2013. [Google Scholar]
  41. Winckler, P.; Reyes, M.; Sepúlveda, I.; Molina, M. El Tsunami del 27-02-2010 en Isla Robinson Crusoe, Archipiélago Juan Fernández. Preparado Para la Ilustre Municipalidad de Juan Fernández. Technical Report. 2010. Available online: http://ingenieriaoceanica3.uv.cl/sitio/index.php/documentos-ico/84-el-tsunami-del-27-02-2010-en-isla-robinsoncrusoe-archipielago-juan-fernandez (accessed on 1 November 2023).
  42. Autodesk. Robot Structural Analysis Professional; Version 2024; Autodesk, Inc.: San Rafael, CA, USA, 2024; Available online: https://www.autodesk.com/products/robot-structural-analysis/overview (accessed on 1 July 2023).
  43. FEMA (Federal Emergency Management Agency). Guidelines for Design of Structures for Vertical Evacuation from Tsunamis, 3rd ed.; US Department of Homeland Security, Federal Emergency Management Agency: Washington, DC, USA, 2019. [Google Scholar]
  44. INN (Instituto Nacional de Normalización). NCh 3363 of. 2015. Diseño Estructural-Edificaciones en Áreas de Riesgo de Inundación Por Tsunami o Seiche; INN: Santiago, Chile, 2015. [Google Scholar]
  45. CMPC Maderas SpA, Pino Radiata. Available online: www.cmpcmaderas.com (accessed on 5 February 2024).
  46. INN (Instituto Nacional de Normalización). NCh 1198 of. 2014. Madera-Construcción en Madera-Cálculo; INN: Santiago, Chile, 2014. [Google Scholar]
  47. INN (Instituto Nacional de Normalización). NCh 1537 of. 2009. Diseño Estructural-Cargas Permanentes y Cargas de Uso; INN: Santiago, Chile, 2009. [Google Scholar]
  48. Vielma-Quintero, J.C.; Carvallo, J.; Vielma, J.C. Comparative assessment of performance-based design methodologies applied to a R.C. shear-wall building. Buildings 2023, 13, 1492. [Google Scholar] [CrossRef]
  49. Mander, J.B.; Priestley, M.J.N.; Park, R. Theoretical Stress-Strain Model for Confined Concrete. J. Struct. Eng. 1988, 114, 1804–1826. [Google Scholar] [CrossRef]
  50. Menegotto, M.; Pinto, P.E. Method of analysis for cyclically loaded R.C. plane frames including changes in geometry and nonelastic behavior of elements under combined normal force and bending. In Symposium on the Resistance and Ultimate Deformability of Structures Acted on by Well Defined Repeated Loads, International Association for Bridge and Structural Engineering; IABSE: Zurich, Switzerland, 1973; pp. 15–22. [Google Scholar]
  51. Perez, A. Comparison of Compression Tests on Structural Wood Using UNE and ASTM Standards. Master Thesis, University of Valladolid, Valladolid, Spain, 2014. (In Spanish). [Google Scholar]
  52. Seismosoft Ltd. SeismoStruct 2024 User Manual—A Computer Program for Static and Dynamic Nonlinear Analysis of Framed Structures; Seismosoft Ltd.: Pavia, Italy, 2021; Available online: https://seismosoft.com/ (accessed on 11 December 2024).
  53. Ariete, N. Characterization of Pinus radiata D. Don wood subjected to a thermal modification process using an immersion environment. Bachelor Thesis, Austral University of Chile, Valdivia, Chile, 2010. (In Spanish). [Google Scholar]
  54. van de Lindt, J.W.; Pei, S.; Pang, W.; Rosowsky, D.V. IDA Comparison of IBC-Designed and DDD-Designed Six-Story Light-Frame Wood Buildings. J. Perform. Constr. Facil. 2011, 25, 138–142. [Google Scholar] [CrossRef]
  55. Namba, T.; Nakagawa, T.; Isoda, H.; Kado, Y.; Odani, R.; Takino, A. Seismic Response Comparison of Full-Scale Moment-Resisting Timber Frame and Joint Test Result. J. Struct. Eng. 2023, 149, 04023079. [Google Scholar] [CrossRef]
  56. Yeh, H.; Barbosa, A.; Ko, H.; Cawley, J. Tsunami loadings on structures: Review and analysis. Int. Conf. Coastal. Eng. 2014, 1, 4. [Google Scholar] [CrossRef]
  57. del Zoppo, M.; Rossetto, T.; Ludovico, M.d.; Prota, A. Effect of buoyancy loads on the tsunami fragility of reinforced concrete frames including consideration of blow-out slabs. Res. Sq. 2022, preprint. [Google Scholar] [CrossRef]
  58. Yeh, H.; Sato, S.; Tajima, Y. The 11 March 2011 East Japan Earthquake and Tsunami: Tsunami Effects on Coastal Infrastructure and Buildings. Pure Appl. Geophys. 2013, 170, 1019–1031. [Google Scholar] [CrossRef]
  59. Manawasekara, C.; Mizutani, N.; Nakamura, T.; Aoki, S. Failure of concrete structure under tsunami loading. J. JSCE 2014, 2, 214–223. [Google Scholar] [CrossRef] [PubMed]
  60. Harati, M.; Van De Lindt, J.W. Community-Level Resilience Analysis Using Earthquake-Tsunami Fragility Surfaces. Resilient Cities Struct. 2024, 3, 101–115. [Google Scholar] [CrossRef]
  61. Villagra, P.; Herrmann, M.G.; Quintana, C.; Sepúlveda, R.D. Community Resilience to Tsunamis along the Southeastern Pacific: A Multivariate Approach Incorporating Physical, Environmental, and Social Indicators. Nat. Hazards 2017, 88, 1087–1111. [Google Scholar] [CrossRef]
  62. Frucht, E.; Salamon, A.; Rozelle, J.; Levi, T.; Calvo, R.; Avirav, V.; Burns, J.N.; Zuzak, C.; Gal, E.; Trapper, P.; et al. Tsunami Loss Assessment Based on Hazus Approach–The Bat Galim, Israel, Case Study. Eng. Geol. 2021, 289, 106175. [Google Scholar] [CrossRef]
  63. Mebarki, A.; Jerez, S.; Prodhomme, G.; Reimeringer, M. Natural Hazards, Vulnerability and Structural Resilience: Tsunamis and Industrial Tanks. Geomat. Nat. Hazards Risk 2016, 7, 5–17. [Google Scholar] [CrossRef]
  64. Attary, N.; Unnikrishnan, V.U.; Van De Lindt, J.W.; Cox, D.T.; Barbosa, A.R. Performance-Based Tsunami Engineering Methodology for Risk Assessment of Structures. Eng. Struct. 2017, 141, 676–686. [Google Scholar] [CrossRef]
  65. León, J.; March, A. Urban Morphology as a Tool for Supporting Tsunami Rapid Resilience: A Case Study of Talcahuano, Chile. Habitat Int. 2014, 43, 250–262. [Google Scholar] [CrossRef]
  66. Petrone, C.; Rossetto, T.; Goda, K. Fragility assessment of a RC structure under tsunami actions via nonlinear static and dynamic analyses. Eng. Struct. 2017, 136, 36–53. [Google Scholar] [CrossRef]
  67. Petrone, C.; Rossetto, T.; Baiguera, M.; Bustamante, C.; Ioannou, I. Fragility functions for a reinforced concrete structure subjected to earthquake and tsunami in sequence. Eng. Struct. 2020, 205, 110120. [Google Scholar] [CrossRef]
  68. Tagle, S.J.; Jünemann, R.; Vásquez, J.; de la Llera, J.C.; Baiguera, M. Performance of a reinforced concrete wall building subjected to sequential earthquake and tsunami loading. Eng. Struct. 2021, 238, 111995. [Google Scholar] [CrossRef]
  69. Karafagka, S.; Fotopoulou, S.; Pitilakis, K. Analytical tsunami fragility curves for seaport RC buildings and steel light frame warehouses. Soil Dyn. Earthq. Eng. 2018, 112, 118–137. [Google Scholar] [CrossRef]
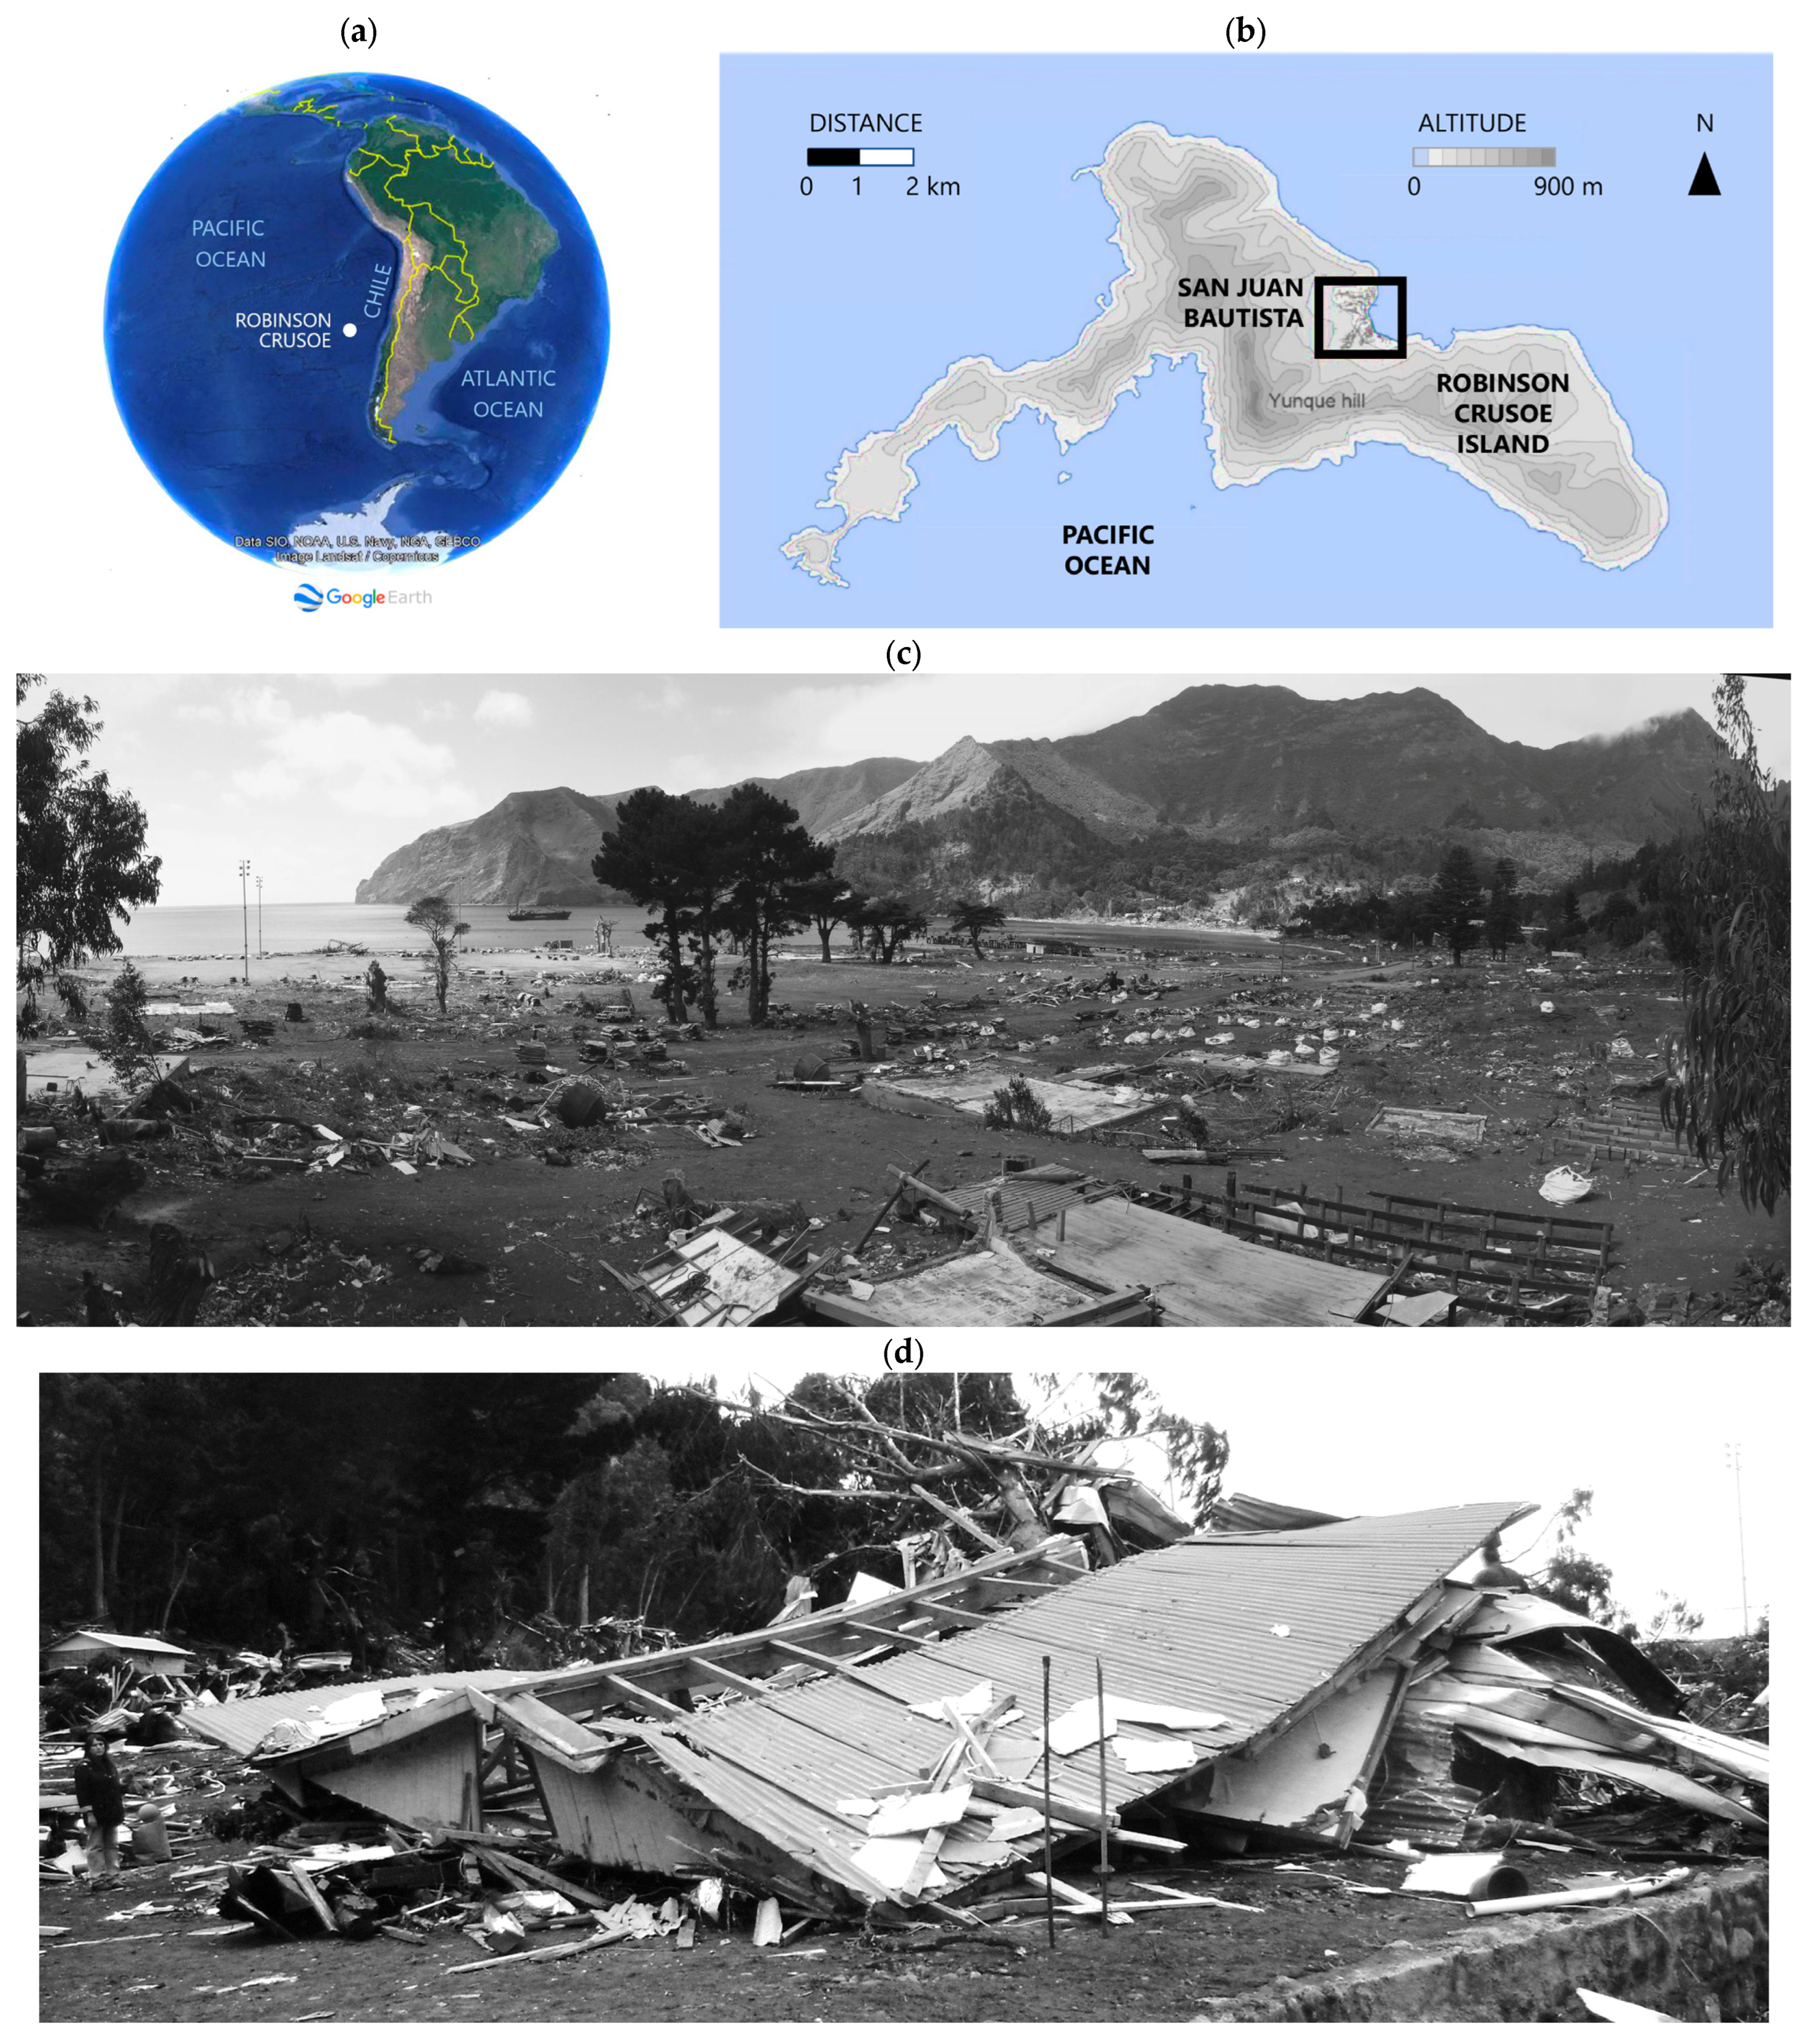
Figure 1. Location of (a) Robinson Crusoe Island and (b) the town of San Juan Bautista. The different failure modes caused by 27 February 2010 tsunami in San Juan Bautista are shown in (c,d). At the shore, houses were washed away by strong currents (c) whereas near the flooding line, houses floated due to buoyant forces (b). (c) is reproduced from Breuer et al. [36].
Jmse 13 00484 g001
Figure 2. (a) Topographic profile used in the EGLA, with flow depths recorded by Fritz et al. [7], maximum runup by Winckler et al. [41] and buildings identified before and after the 2010 tsunami by Breuer et al. [36]. (b) Elevation and plan view of the area neighboring La Pólvora Street including gymnasium [a], school [b], houses [c], touristic and commercial infrastructure [d], church [e] and warehouses for fishing activities [f]. (c) La Pólvora Street, as observed from its lower section.
Jmse 13 00484 g002
Figure 3. Illustration of the EGLA across an inundated transect, where the incident tsunami flow is from left to right. EGL: energy grade line. SWL: still water level. Adapted from ASCE 7-22.
Jmse 13 00484 g003
Figure 4. (a) Flow depth obtained from the EGLA and different house positions (0, 50, 100, 150, 200 and 250 m) where the structural analysis is conducted. (b,c) show the dominant hydrostatic and hydrodynamic loads during the impact of a tsunami and when the flow is fully developed around the house, respectively.
Jmse 13 00484 g004
Figure 5. Drawings of the timber single-story house used in the analysis. Relevant dimensions are shown. Windows and doors are not considered in the structural model.
Jmse 13 00484 g005
Figure 6. Hydrostatic force in kN/m in (a) position x = 0 m and (b) position x = 250 m. Structural node 17 is the one with maximum displacement along the x -axis at x = 0 m in load case C10 (I).
Jmse 13 00484 g006
Figure 7. Isometric view of the nonlinear structural model, with gravity loads and tsunami loads.
Jmse 13 00484 g007
Figure 8. (a) EGL and corrected EGL for flow depths (crossed circles) and runup recorded by Fritz et al. [7] at different house positions ( x = 0, 50, 100, 150, 200 and 250 m) where the structural analysis is conducted. (b) Flow depth and velocity inferred from the EGLA. (c) Forces generated by the tsunami and reactions of the structure in the x -axis and z-axis and (d) displacement of node 17 that deforms the most in the analysis performed.
Jmse 13 00484 g008aJmse 13 00484 g008b
Figure 9. Reactions in the supports for the loading corresponding to a house position at x = 0 m from the coastline (a) in the x -axis and (b) z -axis. The numbers from 1 to 7 represent the positions of the pedestals shown in Figure 6.
Jmse 13 00484 g009
Figure 10. Reactions in the supports for the loading corresponding to a house position at x = 250 m from the coastline (a) in the x-axis and (b) z -axis. The numbers from 1 to 7 represent the positions of the pedestals shown in Figure 6.
Jmse 13 00484 g010
Figure 11. Capacity curves obtained from the nonlinear analysis for the positions from the shoreline of (a) x = 0 m, (b) 50 m, (c) 100 m, (d) 150 m, (e) 200 m and (f) 250 m.
Jmse 13 00484 g011aJmse 13 00484 g011b
Figure 12. Deformed and damaged structure at the point of maximum shear force reached. (a) Right side elevation view, (b) front elevation view and (c) isometric view.
Jmse 13 00484 g012
Table 1. Parameters used in the EGLA.
ParameterSymbolDimensionValue
Overall building widthBm6.6
Manning’s roughness coefficient n -0.025
Height of wall h w m2.4
Width subject to force b m6.6
Minimum fluid specific weight density γ s kN/m311
Minimum fluid mass density ρ s g/cm31.1
Importance factor I t s u -1
Drag coefficientCd-1.25
Proportion of closure coefficient C c x -4.42
Story height of story x h s x m4.35
Time interval t s1
Table 2. Flow depths and loads acting on a timber single-story house positioned every 50 m along La Pólvora Street. h s , h c and h l are the flow depths immediately seaward, in the centroid and immediately inland of each house, respectively. P b is the buoyancy pressure, P h the lateral hydrostatic pressure, P d the drag pressure and F i f the impact force from floating objects.
x
m
h s
m
h c
m
h l
m
P b
kPa
P h
kPa
P d
kPa
F i f
kN
2502.482.151.8127.3113.662.271.01
2004.554.364.1647.8531.408.341.93
1505.545.485.4147.8544.3715.202.61
1006.056.026.0047.8551.1022.143.14
505.996.006.0047.8550.3827.423.50
06.626.376.1247.8558.6436.354.03
Table 3. Load cases corresponding to the ultimate limit state (ULS). In this table, D represents the dead load, L the live load, F d the drag force, F i f the impact force from floating objects, F b the buoyant force and F h the lateral hydrostatic force. The value corresponds to the amplification in the load cases. The sign is positive for a force acting landwards and negative seaward. Parentheses (I) and (F) correspond to load cases during the impact of the tsunami and when the flow has completely flooded the surrounding area of the house, respectively.
Load Case D L F d F i f F b F h
C11.4-----
C21.21.6----
C31.2-----
C41.20.5----
C50.9-----
C6 (I)1.20.511--
C7 (I)1.2-11--
C8 (I)1.20.5−1−1--
C9 (I)1.2-−1−1--
C10 (I)0.9-11--
C11 (I)0.9-−1−1--
C6 (F)1.20.5--11
C7 (F)1.2---11
C8 (F)1.20.5--−1−1
C9 (F)1.2---−1−1
C10 (F)0.9---11
C11 (F)0.9---−1−1
Table 4. Constitutive model parameters for timber elements of Pinus Radiata.
ParameterDimensionsValue
Compression strengthMPa4.26
Strength lower boundMPa3.7
Bending strengthMPa8.6
Modulus of elasticityMPa8829
Specific weightkN/m34.9
Table 5. Constitutive model parameters by Mander et al. for concrete grade G25.
ParameterDimensionsValue
Compression strengthMPa33
Strength lower boundMPa25
Tension strengthMPa2.6
Modulus of elasticityMPa26,999
Specific weightkN/m324
Table 6. Constitutive model parameters by Menegotto and Pinto for steel grade A630–420H. A1, A2, A3 and A4 correspond to transition curve shape calibrating coefficients.
ParameterDimensionsValue
Modulus of elasticity E MPa200,000
Yield strength F y MPa490
Strain hardening parameter-0.005
Transition curve initial shape parameter-20
Coefficient A1-18.5
Coefficient A2-0.15
Coefficient A3-0
Coefficient A4-1
Fracture/buckling strain-1
Specific weightkN/m378
Table 7. Resulting load cases for a house position located at x = 0 m from the shoreline. F x , F y and F z are the resulting forces in the x -, y - and z -axes, respectively, while M x , M y and M z are the resulting moments in the x-, y- and z-axes, respectively. Parentheses (I) and (F) correspond to load cases during the impact of the tsunami and when the flow has completely flooded the surrounding area of the house, respectively.
Load Case F x
kN
F y
kN
F z
kN
M x
kNm
M y
kNm
M z
kNm
C10018.2000
C200241.500.010
C30015.6000
C40086.2000
C50011.7000
C6 (I)−825.5086.20540.20
C7 (I)−825.5015.60540.20
C8 (I)825.5086.20−540.20
C9 (I)825.5015.60−540.20
C10 (I)−825.5011.70540.20
C11 (I)825.5011.70−540.20
C6 (F)00−2727.6000
C7 (F)00−2798.20−0.010
C8 (F)002900.100.010
C9 (F)002829.500.010
C10 (F)00−2802.20−0.010
C11 (F)002825.600.010
Table 8. Resulting load cases for a house position located at x = 250 m from the shoreline. F x , F y and F z are the resulting forces in the x -, y - and z -axes, respectively, while M x , M y and M z are the resulting moments in the x-, y- and z-axes, respectively. Parentheses (I) and (F) correspond to load cases during the impact of the tsunami and when the flow has completely flooded the surrounding area of the house, respectively.
Load Case F x
kN
F y
kN
F z
kN
M x
kNm
M y
kNm
M z
kNm
C10018.23000
C200241.5300.010
C30015.63000
C40086.22000
C50011.72000
C6 (I)−52.32086.22034.420
C7 (I)−52.32015.63034.410
C8 (I)52.32086.220−34.410
C9 (I)52.32015.630−34.410
C10 (I)−52.32011.72034.410
C11 (I)52.32011.720−34.410
C6 (F)00−1520000
C7 (F)312.360−1590.6000
C8 (F)−312.36052.3200.010
C9 (F)001621.8600.010
C10 (F)00−1594.51000
C11 (F)001617.9500.010
Disclaimer/Publisher’s Note: The statements, opinions and data contained in all publications are solely those of the individual author(s) and contributor(s) and not of MDPI and/or the editor(s). MDPI and/or the editor(s) disclaim responsibility for any injury to people or property resulting from any ideas, methods, instructions or products referred to in the content.