Article

A Numerical Simulation Study on Hydrogen-Enriched Gas Explosions on Hydrogen Fuel Cell Ships Based on OpenFOAM

1
Navigation College, Dalian Maritime University, Dalian 116026, China
2
Dalian Key Laboratory of Safety & Security Technology for Autonomous Shipping, Dalian 116026, China
3
School of Construction Engineering, Shenzhen Polytechnic University, Shenzhen 518000, China
4
School of Mechanical-Electronic and Vehicle Engineering, Beijing University of Civil Engineering and Architecture, Beijing 102616, China
*
Author to whom correspondence should be addressed.
J. Mar. Sci. Eng. 2025, 13(4), 667; https://doi.org/10.3390/jmse13040667
Submission received: 22 February 2025 / Revised: 22 March 2025 / Accepted: 23 March 2025 / Published: 26 March 2025

Abstract

:
In the maritime industry, hydrogen fuel cell ships demonstrate significant potential for development due to their environmental friendliness and high efficiency. However, the risks of fire and explosion caused by hydrogen leakage pose severe challenges to their safety. To enhance the safety of hydrogen fuel cell ships and mitigate the explosion hazards caused by leakage, this study employs the XiFoam solver in the OpenFOAM v9 to establish an explosion model for a full-scale hydrogen fuel cell compartment within a hydrogen fuel cell ship. The model simulates the transient explosion process following high-pressure hydrogen leakage under varying initial hydrogen concentrations and premixed fuel conditions. By analyzing the temporary evolution of temperature distribution, flame front propagation, and explosion pressure, the study provides a comprehensive understanding of the safety implications of hydrogen leakage at different locations within the fuel cell. Specifically, increasing the hydrogen concentration from ΦH2 = 0.10 to ΦH2 = 0.18 and ΦH2 = 0.20 significantly elevates the overpressure peak and accelerates the flame speed from 250 m/s to 370 m/s, with local pressure gradients approaching the deflagration to detonation transition threshold. The simulation results contribute valuable insights into optimizing hydrogen fuel cell design, formulating effective fire safety strategies, and improving overall ship safety.

1. Introduction

The global shipping industry accounts for approximately 2.4% of total anthropogenic greenhouse gas emissions, and this figure is likely to rise further in the future. Carbon dioxide (CO2) is the main component of greenhouse gases in the shipping sector due to its high concentration and long-term retention in the atmosphere, resulting in its significant contribution to global warming. This emission characteristic highlights the need to promote the development of low-carbon technologies, among which hydrogen fuel cell ships, as a potential green alternative, have important research value [1]. The full utilization of renewable energy, including solar radiation, wind energy, geothermal energy, and tidal energy, is a prerequisite for sustainable development [2], but their products all contain different pollutants [3]. Hydrogen is seen as an ideal fuel for the future due to its high energy density, light weight, clean zero emissions, and wide availability. The basic fuel cell principle was first demonstrated by Sir William Grove in 1839. A fuel cell is an electrochemical device that generates electricity by reacting hydrogen with oxygen to produce water and heat directly, without relying on the traditional combustion process [4]. It can be seen that hydrogen fuel cells, as a power supply device, have broad development prospects in the future shipping industry. Germany previously introduced the world’s first hydrogen fuel cell-powered ship concept, a hybrid hydrogen–electric propulsion vessel named Elektra [5]. In addition, the United States developed a 21-meter-long passenger vessel named “Water-Go-Round” equipped with proton exchange membrane fuel cells (PEMFCs) in the “SF Breeze” project [6,7]. The project’s final iteration, Sea Change, achieved the distinction of becoming the world’s first commercial passenger ship powered exclusively by PEMFC technology in 2021 [8,9]. In the same year, Norway successfully constructed and launched the world’s first hydrogen-powered vessel, the Hydra ferry, which subsequently completed its inaugural commercial voyage utilizing hydrogen propulsion technology [10].

1.1. Current Status of Safety Research on Hydrogen Fuel Cell Ships

Hydrogen possesses distinct characteristics such as high diffusivity, propensity to leak, extremely low ignition energy, elevated explosion likelihood, and substantial energy release [11]. Its flammability range spans an ignition volume fraction of 4% to 74%, while its explosion volume fraction ranges from 18% to 59%, with a minimum ignition energy as low as 0.02 mJ [12]. Consequently, the utilization of hydrogen fuel cells is inherently associated with notable safety risks. In maritime applications, to satisfy the demands for extended range and sufficient power, fuel cell ships require significant hydrogen storage capacity. However, ships, being large-scale and complex systems, operate in challenging and harsh environments over long service lives, where equipment aging and maintenance challenges are inevitable. Any hydrogen leakage resulting from inadequate sealing or mechanical damage to supply pipelines or valves could readily lead to fires or explosions, posing severe safety threats. Generally speaking, the systematic study of hydrogen safety includes the initial concentration of hydrogen, ignition, flame propagation, fire, and explosion [13,14,15,16,17,18,19,20].
McConnell’s research reviewed the wide application of fuel cells in ships, demonstrating the diversified development of fuel cell technology in the marine field and its future application prospects [21]. Choi developed and demonstrated a hybrid system based on polymer electrolyte membrane (PEM) fuel cells and lithium-ion batteries that can be used to propel a 20-meter-long tourist boat while improving safety [22]. Shirvill’s experimental results verified the hydrogen cloud model and hydrogen jet model in the hydrogen pipeline, and showed that the explosion power is closely related to the hydrogen concentration [23]. Mao used ANSYS Fluent to simulate and analyze hydrogen leakage and explosion behavior in different compartments of hydrogen fuel cell ships. Hydrogen leakage was calculated based on the leakage model, and the change process of hydrogen concentration distribution during the leakage time was simulated. The overpressure and high-temperature effects under ignition conditions (i.e., fuel cell compartments) were analyzed, and optimization design and risk management suggestions were proposed to improve ship safety [24].
Seyam developed a hybrid ship system based on a mixture of hydrogen and clean fuels, combining internal combustion engines, gas turbines, solid oxide fuel cells, and thermoelectric generators to improve environmental protection and safety [25].

1.2. Application of Numerical Simulations in Hydrogen Explosion Research

Currently, research on hydrogen leakage and diffusion primarily focuses on experimental investigations and numerical simulations [26,27]. However, the significant hazards associated with hydrogen and the substantial costs of experimental studies have resulted in a relative scarcity of experimental data in this area. As a result, numerical simulation has emerged as the predominant approach for exploring hydrogen leakage and diffusion processes [28,29,30,31]. Among these methods, computational fluid dynamics (CFD) software has gained extensive application, demonstrating its critical role in advancing understanding in this domain [32,33,34].
Lipatnikov comprehensively reviewed numerical modeling studies, conducted from 2023 to the present, on the ignition and propagation of explosions induced by air–hydrogen mixtures, while also providing insights into future development trends in this field [35]. Bédard-Tremblay summarized two hydrogen explosion case studies, obtaining the hydrogen dispersion pattern from numerical simulations of dispersion. This dispersion cloud was then used as the initial condition for inviscid, compressible, reacting flow simulations, and the authors then reviewed its limitations [36]. Swain et al. used multiple gases to simulate and experiment the leakage simulation of hydrogen in a known geometric space [37]. Schefer used CFD-ACE to simulate the safety hazards in hydrogen pipelines. The results showed that hydrogen leaks quickly, and the danger zone generated under the same conditions is smaller than that generated by natural gas [38]. Rigas employed CFX to simulate safety risks associated with liquid hydrogen leakage in storage systems, highlighting its higher susceptibility compared to high-pressure hydrogen. Schmidt used Fluent to model hydrogen cloud dimensions and morphology in urban settings, considering variables like leakage volume, rate, duration, wind speed, direction, and pressure [39]. Olvera employed STAR-CD numerical simulations to reveal that hydrogen leakage in urban buildings poses significantly greater risks compared to natural gas leakage [40]. Wilkening confirmed that CFD simulation of hydrogen leakage is very effective and reliable in the field of hydrogen fuel cells [41]. Liu used STAR-CCM to simulate hydrogen fuel cell leakage and found that although ventilation equipment effectively prevented hydrogen accumulation, the nonlinear growth of hydrogen after leakage still caused very dangerous flammability [42]. Li used Fluent simulation to determine the impact of different sensor placements on hydrogen leaks [43].
The current status of safety research on hydrogen fuel cell ships [44] shows that ships, as large and complex systems, are inevitably prone to equipment aging and maintenance problems when operating in harsh environments for a long time [45]. Any occurrence of hydrogen leakage caused by poor sealing or mechanical damage may cause fire or explosion, posing a serious safety threat [46]. Existing studies have explored hydrogen leakage and explosion behaviors through experiments and numerical simulations [47], and proposed optimization design and risk management recommendations [48]. The application of numerical simulation in hydrogen explosion research provides an important theoretical basis and technical support for the numerical simulation of hydrogen leakage and explosion.
Based on the above research status, this study aims to simulate the hydrogen leakage process using buoyantReactingFoam in OpenFOAM v9, and then use the results as the initial field environment as the initial condition to carry out numerical simulation research on hydrogen explosion simulation using XiFoam. The study will focus on the leakage and explosion behavior of hydrogen in the ship environment, and analyze the influence of factors such as leakage rate, leakage amount, leakage time, hydrogen concentration, ignition energy, and environmental conditions on hydrogen concentration distribution, overpressure, and high-temperature effects [49,50,51]. Through the simulation results, the study will further propose design optimization and risk management suggestions in order to improve the safety of hydrogen fuel cell ships and provide a theoretical basis and technical support for the safe design and operation of hydrogen fuel cell ships.

2. Materials and Methods

2.1. Theoretical Basis

To numerically simulate hydrogen combustion within a ship’s fuel cell compartment, the Reynolds-averaged Navier–Stokes (RANS) equations, k ϵ turbulence model, and flame wrinkling combustion model were employed to describe the turbulent combustion process. The governing equations and models are as follows
The mass conservation equation is:
ρ t + x i ρ u ˜ i = 0 ,
where ρ denotes the Reynolds-averaged density, t represents time, and u ˜ i is the mass-averaged velocity component. The momentum conservation equation is:
t ρ u ˜ i + x j ρ u ˜ i u ˜ j = p x i + x j τ i j ρ u i u j + ρ f i ,
where p is the pressure, τ i j is the viscous stress tensor, ρ u ˜ i u ˜ j represents the Reynolds stress term, and f i denotes body forces.
The viscous stress tensor τ i j is defined as:
τ i j = μ u ˜ i x j + u ˜ j x i 2 3 δ i j u ˜ k x k ,
where μ is the dynamic viscosity and δ i j is the Kronecker delta function.
To close the RANS equations, the k ϵ turbulence model was introduced, involving the turbulent kinetic energy k and its dissipation rate ϵ . Their transport equations are:
t ( ρ k ) + x j ρ u ˜ j k = x j μ + μ t σ k k x j + P k ρ ϵ ,
t ( ρ ϵ ) + x j ρ u ˜ j ϵ = x j μ + μ t σ ϵ ϵ x j + C ϵ 1 ϵ k P k C ϵ 2 ρ ϵ 2 k .
In these equations, μ t is the turbulent viscosity, P k is the production term of turbulent kinetic energy, σ k and σ ϵ are the turbulent Prandtl numbers, and C ϵ 1 and C ϵ 2 are model constants.
The turbulent viscosity μ t is expressed as:
μ t = C μ ρ k 2 ϵ ,
where C μ is a constant.
Applying the Boussinesq approximation, the Reynolds stress term ρ u i u j can be modeled as:
ρ u i u j = μ t u ˜ i x j + u ˜ j x i 2 3 δ i j u ˜ k x k + 2 3 ρ k δ i j .
To simulate the interaction between turbulence and flame propagation, the flame wrinkling combustion model was utilized. The transport equation for flame propagation is:
t ( ρ b ˜ ) + ( ρ u ˜ b ˜ ) μ t S c t b ˜ = ρ u S L Ξ | b ˜ | .
Here, b ˜ is the progress variable determined by the combustion temperature [52], S c t is the turbulent Schmidt number, ρ u is the density of the unburned mixture, S L is the laminar flame speed, and Ξ is the turbulent flame velocity and laminar flame velocity ratio [30].
The laminar flame speed S L can be expressed by Equation (9), and the empirical parameters involved are usually determined through the following experiments [28], where α and β are dimensionless coefficients:
S L = W Φ η e x p ξ ( Φ 1.075 ) 2 T u T 0 α p u p 0 β .

2.2. Computational Model Validation

In order to verify the reliability and stability of the computational model, we conducted a verification simulation based on a simulation carried out in a previous study [53]. The explosion device was designed as a 3 m × 3 m × 3 m cubic frame and was sealed. The ignition point was placed on the central axis of the device, which was 1.5 m × 1.5 m × 1.5 m. The schematic diagram of the experimental model is shown in Figure 1. The experiments were all conducted at a stoichiometric concentration ΦH2 = 1, with an average temperature of about 300 K and an average pressure of about 1 standard atmosphere. Two high-speed cameras were used to capture the flame propagation distance during the explosion, and the flame propagation distance on the right side of the explosion was obtained as the experimental result.
In order to save computing resources and time costs, we selected 1/8 of the experimental device for simulation, which is shown in Figure 2. As indicated by the red cube in Figure 1, this section represents the portion utilized for model verification. The initial conditions of this verification simulation were exactly the same as the experimental configuration. The mesh characteristics are shown in Table 1 below. Reference [53] notes that the experimental results exhibit a predominantly spherical shape, making it challenging to discern differences visually. However, the flame propagation distances monitored by the equipment in various directions show slight variations. Reference [53] further explains that the asymmetry in flame propagation distance observed in the experiment is attributed to the experimental setup and instrumentation.
Figure 3 presents the experimental results of the explosion’s flame propagation at various time intervals. The corresponding simulation results of the explosion’s flame propagation are depicted in Figure 4, demonstrating agreement with the experimental observations of hydrogen explosion behavior.
In the verification simulation, the Contour filter in Paraview v5.11 was employed to extract the flame edge, with the contour line set as the threshold for flame edge detection to generate the flame edge surface. Subsequently, the “integrate variables” filter was utilized to compute the surface area A F of the flame edge, and the area value was recorded. Following this, the equivalent flame radius R e was determined using Equation (10), representing the flame propagation distance.
π R e 2 = A F ,
The blue curve in Figure 5 was adapted from the flame propagation distance data on the right of the experimental results, while the red curve represents the verification simulation results. Both datasets exhibit a consistent increase over time, from the initial detection of propagation distance to the cessation of recording.
Figure 6 presents the comparison of flame propagation velocity between experimental and simulated data, depicting the flame propagation speed derived from the differentiation of the equivalent flame radius R e . The two curves exhibit similar trends. Both initially rise to a first extreme value of approximately 30 m/s, followed by fluctuations in speed. The overall trend shows a gradual increase, reflecting the positive feedback mechanism of flame propagation. At the final stage, the speed reaches its maximum value at the position where the flame has propagated the farthest.

2.3. Numerical Configuration

This study selected the SF-BREEZE passenger ship as the research object. The ship was funded by the United States Department of Transportation Maritime Administration and creat by Sandia National Laboratories in Livermore, CA, USA. This ship type uses a hydrogen fuel cell propulsion system, achieves zero-emission operation, and has the typical characteristics of a high-speed passenger transport system. Further parameters are shown in Table 2 [54].
The geometric model size of the research object was 10 m in width, 14 m in length, and 2.8 m in height. Its structure mainly consisted of two functional modules: the fuel cell room and the control room. The hydrogen leakage area was 0.3 m × 0.4 m in the simulated pipeline on one side of the fuel cell compartment. SolidWork v2022 was used for geometric modeling. The object’s solid structure and obstacle surface were configured as a “wall” boundary type, and the hydrogen leakage location was configured as a “patch” boundary type to simulate hydrogen leakage. The model size and details are shown in Figure 7 below. The geometric origin can be seen in the lower left corner of the model in the figure. The names of the various parts in the geometric model, as well as the mesh characteristics, are shown in Table 3 and Table 4.
The partial results from the hydrogen leakage in the first part of the study were used as the initial hydrogen environment field using the mapFields command; this was then used to simulate the hydrogen explosion in the second part of the study. The simulation was used to study the explosions at different key locations and at different hydrogen concentrations. The different locations of the hydrogen explosion are shown in Figure 8, which simulate the fuel cell room explosion and the ventilation duct explosion, respectively. Among them, three groups of hydrogen explosion simulations with different concentrations were conducted at explosion point 1. The three different (average) hydrogen concentrations were 0.2, 0.18, and 0.1, respectively, according to the simulation results (i.e., the average hydrogen to air ratio at the explosion location was 0.2, 0.18, and 0.1).
Three mesh sizes of 0.01 m, 0.08 m, and 0.1 m were used for comparison. Figure 9 shows that the simulation results of detection point 1 of three different meshes have roughly the same line graph trend and value. It can be seen from the figure that there are large differences between the 0.01 m mesh and the other meshes, while the difference between the 0.08 m and 0.1 m meshes is small. Therefore, in order to ensure accuracy and operating efficiency, this study uses a 0.08 m mesh.

3. Results

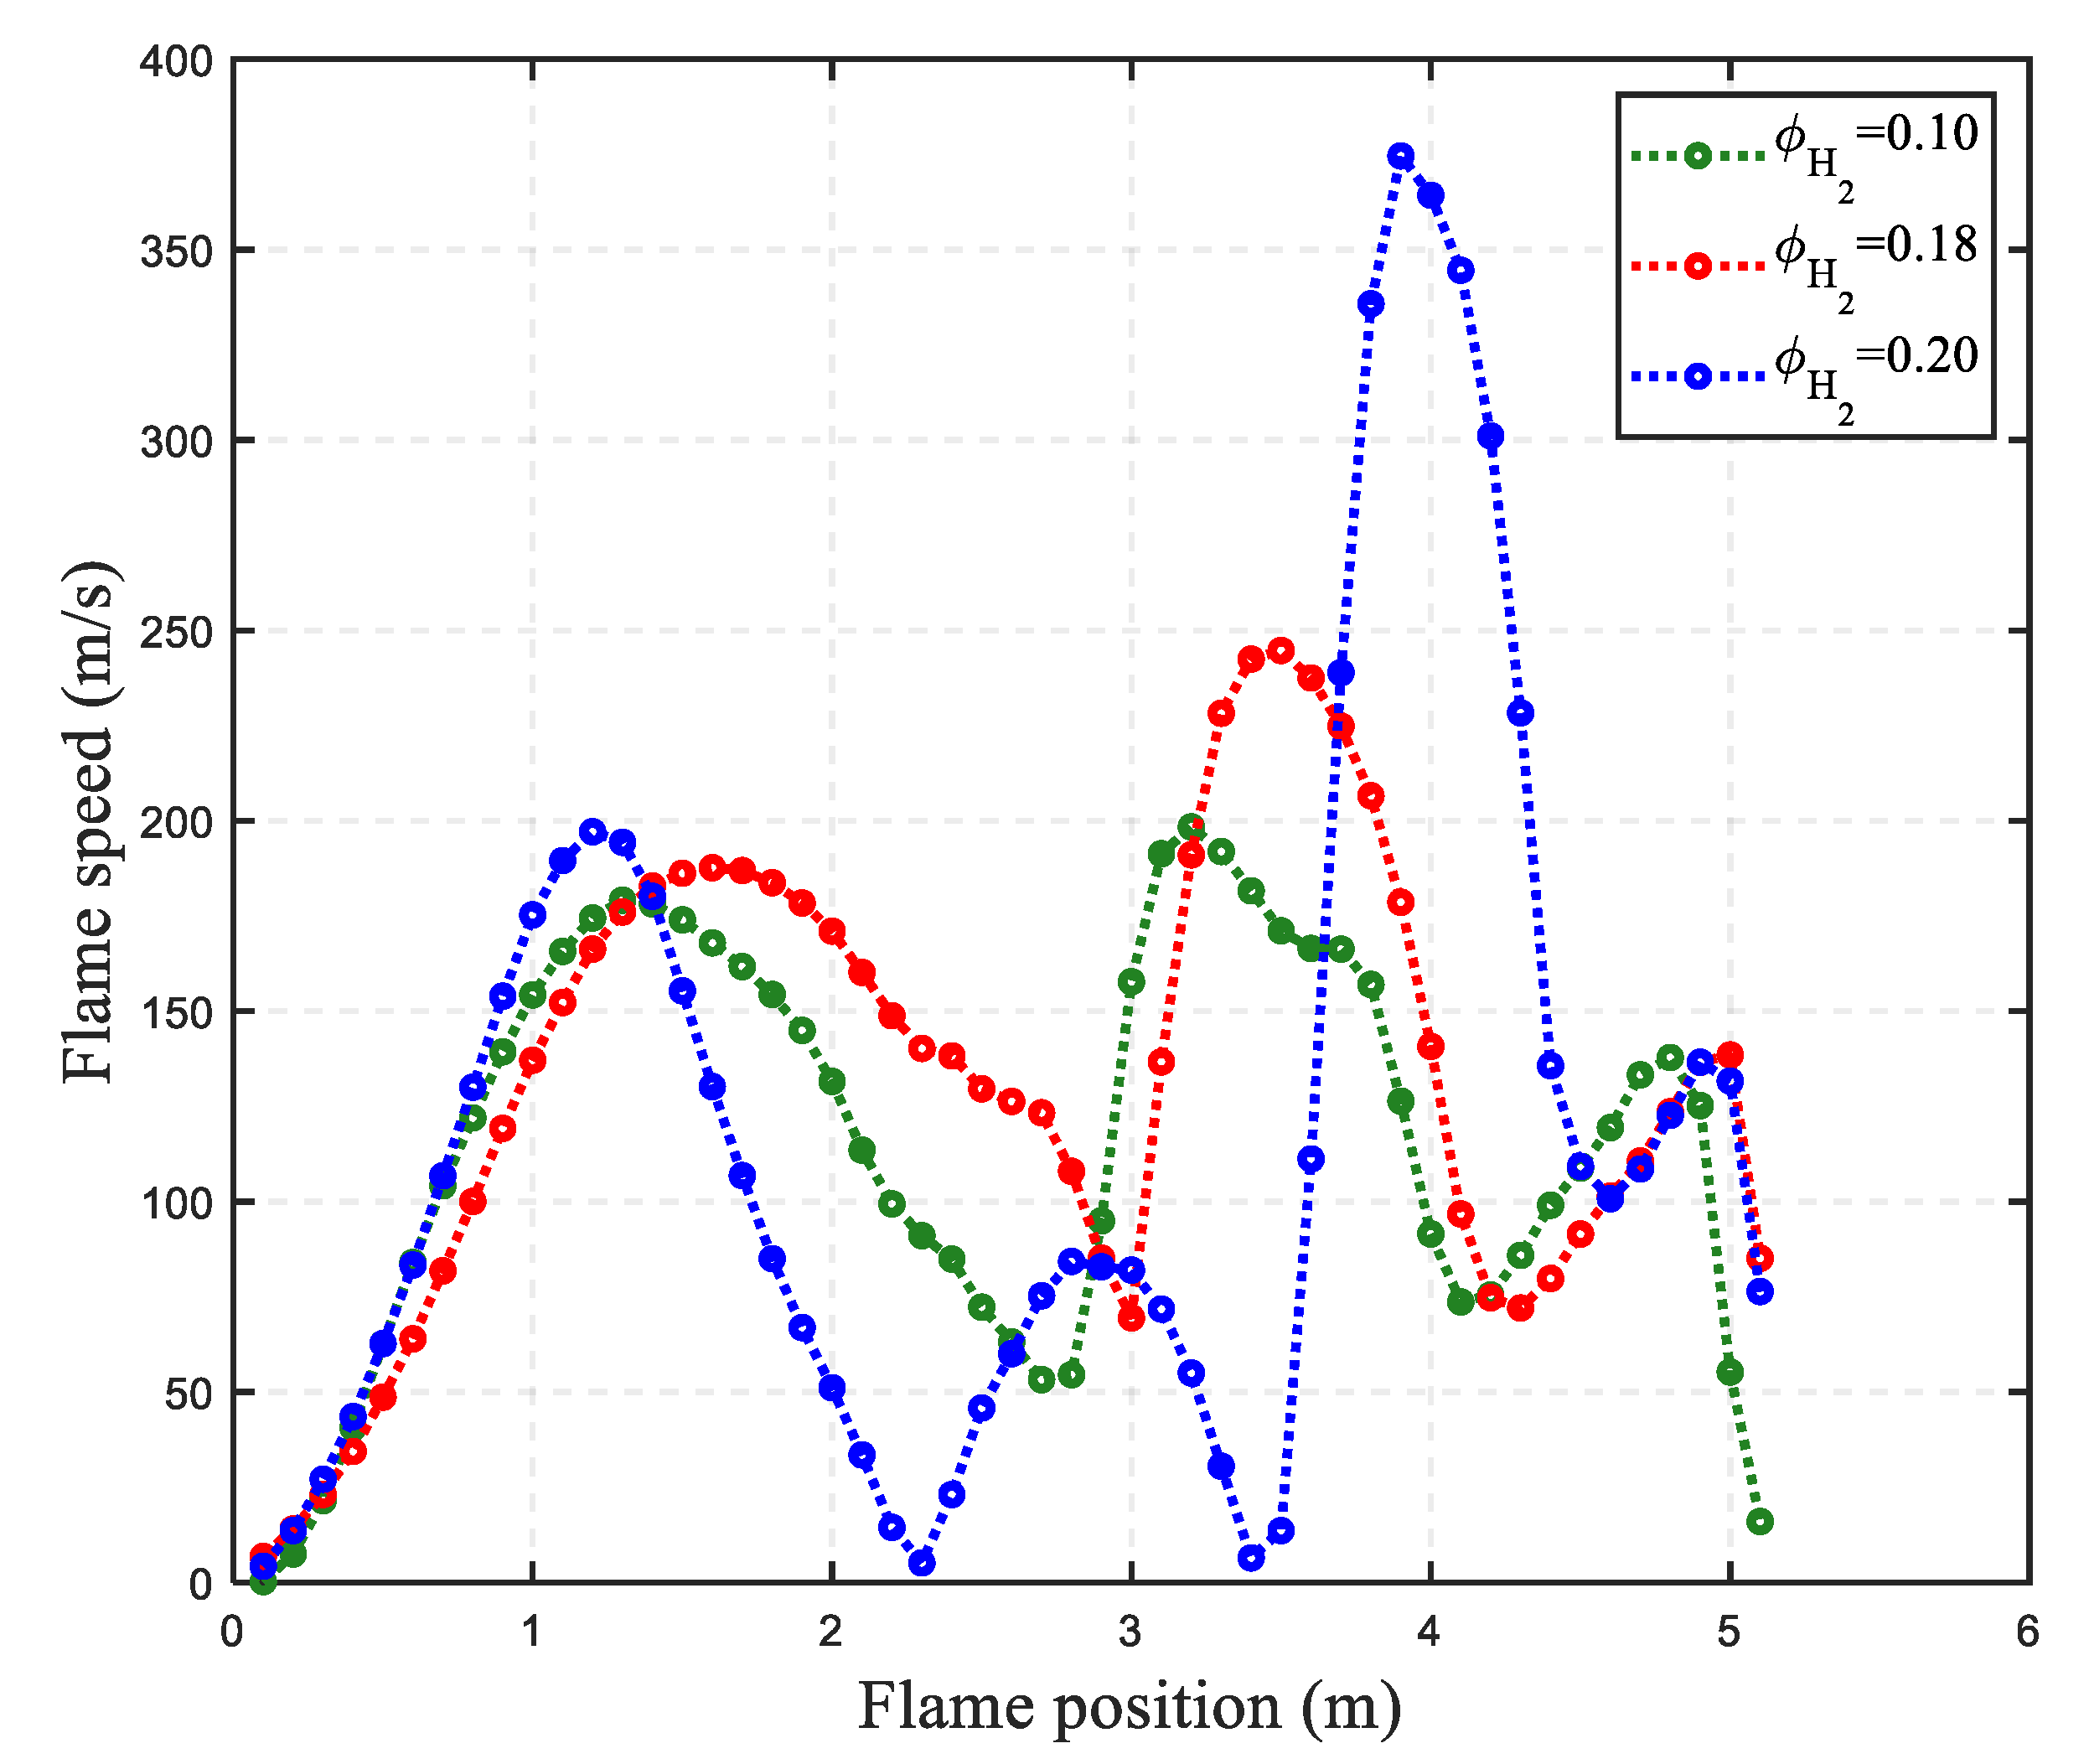
3.1. Effect of Hydrogen Concentration on Hydrogen Explosion

Figure 10 illustrates the overpressure curves obtained by the four probes set at explosion point 3 under three distinct hydrogen leakage concentrations. The four probe points exhibit varying curve patterns. For probe point 1, point 2, and point 3, the three concentrations demonstrate consistent overall trends. The overpressure initially surges to 3.8 × 10⁵ Pa due to the direct explosion impact, followed by a sharp decline. As the explosion propagates rapidly, all concentrations attain secondary relative peaks simultaneously, demonstrating the continuity and impact of the explosion shock wave. Notably, probe point 4 displays significant variations, particularly at ΦH2 = 0.20, where the curve exhibits rapid fluctuations within a brief timeframe. The absolute differential between the maximum and minimum overpressures after the initial peak exceeds 2.5 × 10⁵ Pa.
OpenFOAM does not produce the heat release rate directly in its results, but instead gives the temperature and density. The heat release rate can be obtained by converting the temperature and density, as shown in Equation (11):
H R R = ρ C p T t ,
We post-processed the data in ParaView v5.11 and calculated the change in the heat release rate of the whole field according to Equation (11). The heat release rates at the four explosion locations are illustrated in Figure 11. All four figures exhibit a consistent pattern of initial increase, followed by a decrease, and then a subsequent increase, aligning with the fundamental principles of heat release dynamics. The highest heat release rate occurs at the sharpest peak, particularly at explosion point 4. During the initial 0.0004 s, the heat release rate remains exceptionally stable. Upon completion of the explosion, it instantaneously surges to several times its previous value, reaching 4.6 × 10⁸ W/m3.
The figure below is a slice cloud of the explosion, measured at Y = 2 m and Z = 1.6 m at 0.0055 s. Explosions of different concentrations produce different explosion shocks at the same time and position, corresponding to three different initial hydrogen concentrations (ΦH2 = 0.10, ΦH2 = 0.18, and ΦH2 = 0.20). Figure 12 and Figure 13 display the various stress conditions, illustrating the range of stress levels, from about 9.32 × 10⁴ Pa to 1.48 × 10⁸ Pa; the colors change from blue to red, indicating that the stress changes from low to high. The high-stress areas are concentrated in certain corners and on the edges of the cube, especially near the vents, which indicates that these parts may be the weak links of the structure under temperature loads, prone to the concentration of stress and possible failure. The low-stress areas are mainly distributed in the middle part of the structure and on some planes, indicating that these parts are less stressed and relatively stable. Since this is a stress analysis based on temperature loads, it is speculated that the areas where stress is concentrated may be specifically affected by thermal expansion or contraction. During heating or cooling, the thermal stress of the steel structure can cause deformation and internal stress distribution, especially near the vents and other discontinuous areas.
It can be observed from the figure that with an increase in the initial hydrogen concentration, the pressure distribution and the propagation characteristics of the explosion shock wave change significantly. When ΦH2 = 0.10, the explosion pressure is low and the propagation form of the shock wave is relatively uniform, indicating that the combustion rate is low at this time and no drastic pressure peak is formed. When the initial hydrogen concentration increases to ΦH2 = 0.18, the local pressure increases significantly, especially in the upper area where a significant high-pressure area appears. This indicates that the combustion process is more intense, and the impact range of the explosion shock wave is expanded. Further increasing the initial hydrogen concentration to ΦH2 = 0.20, the pressure cloud shows that the high-pressure area is more concentrated, and a higher-pressure peak is formed in the local area. This indicates that the concentration may have approached or reached the deflagration to detonation transition (DDT) condition, further enhancing the destructive power of the explosion shock wave. In addition, it can be seen from the figure that with an increase in the initial hydrogen concentration, the pressure gradient changes more dramatically, indicating that the combustion reaction rate is accelerated, the propagation form of the shock wave is more complex, and the overpressure phenomenon in the local area is more significant. In summary, the change in the initial hydrogen concentration has an important influence on the propagation characteristics and pressure peak of the explosion shock wave. A higher hydrogen concentration may lead to a more violent explosion and higher destructiveness.
Figure 14 shows the Y-axis flame velocity component of the peak value of the flame surface at 0.0044 s. It can be observed from the figure that there are obvious differences in the spatial variation trend of the flame propagation velocity under different initial hydrogen concentrations. For the case of ΦH2 = 0.10, the flame velocity is relatively low overall, and shows a relatively gentle variation trend during the propagation process, with the maximum velocity not exceeding 250 m/s. This indicates that under low hydrogen concentration conditions, the combustion reaction is relatively weak, the flame propagation velocity is limited, and the combustion inhomogeneity is small. When the hydrogen concentration increases to ΦH2 = 0.18, the flame propagation velocity increases significantly, especially between 2 m and 4 m, forming a large fluctuation amplitude. This indicates that the turbulence effect is enhanced, the flame is affected by the combustion shock wave, and the propagation rate is locally enhanced. When ΦH2 = 0.20, the flame propagation velocity reaches its maximum, with the highest peak value close to 370 m/s. There is also a significant velocity surge near the 4 m position, indicating that combustion instability may have occurred at this position, such as flame folds or flame acceleration caused by an enhancement of the local pressure wave. In general, the flame propagation velocity increases with an increase in the hydrogen equivalence ratio, but its changing trend also shows stronger instability, especially under high equivalence ratio conditions. In conclusion, the flame propagation process is easily affected by turbulent disturbances and pressure waves, resulting in violent local velocity fluctuations.

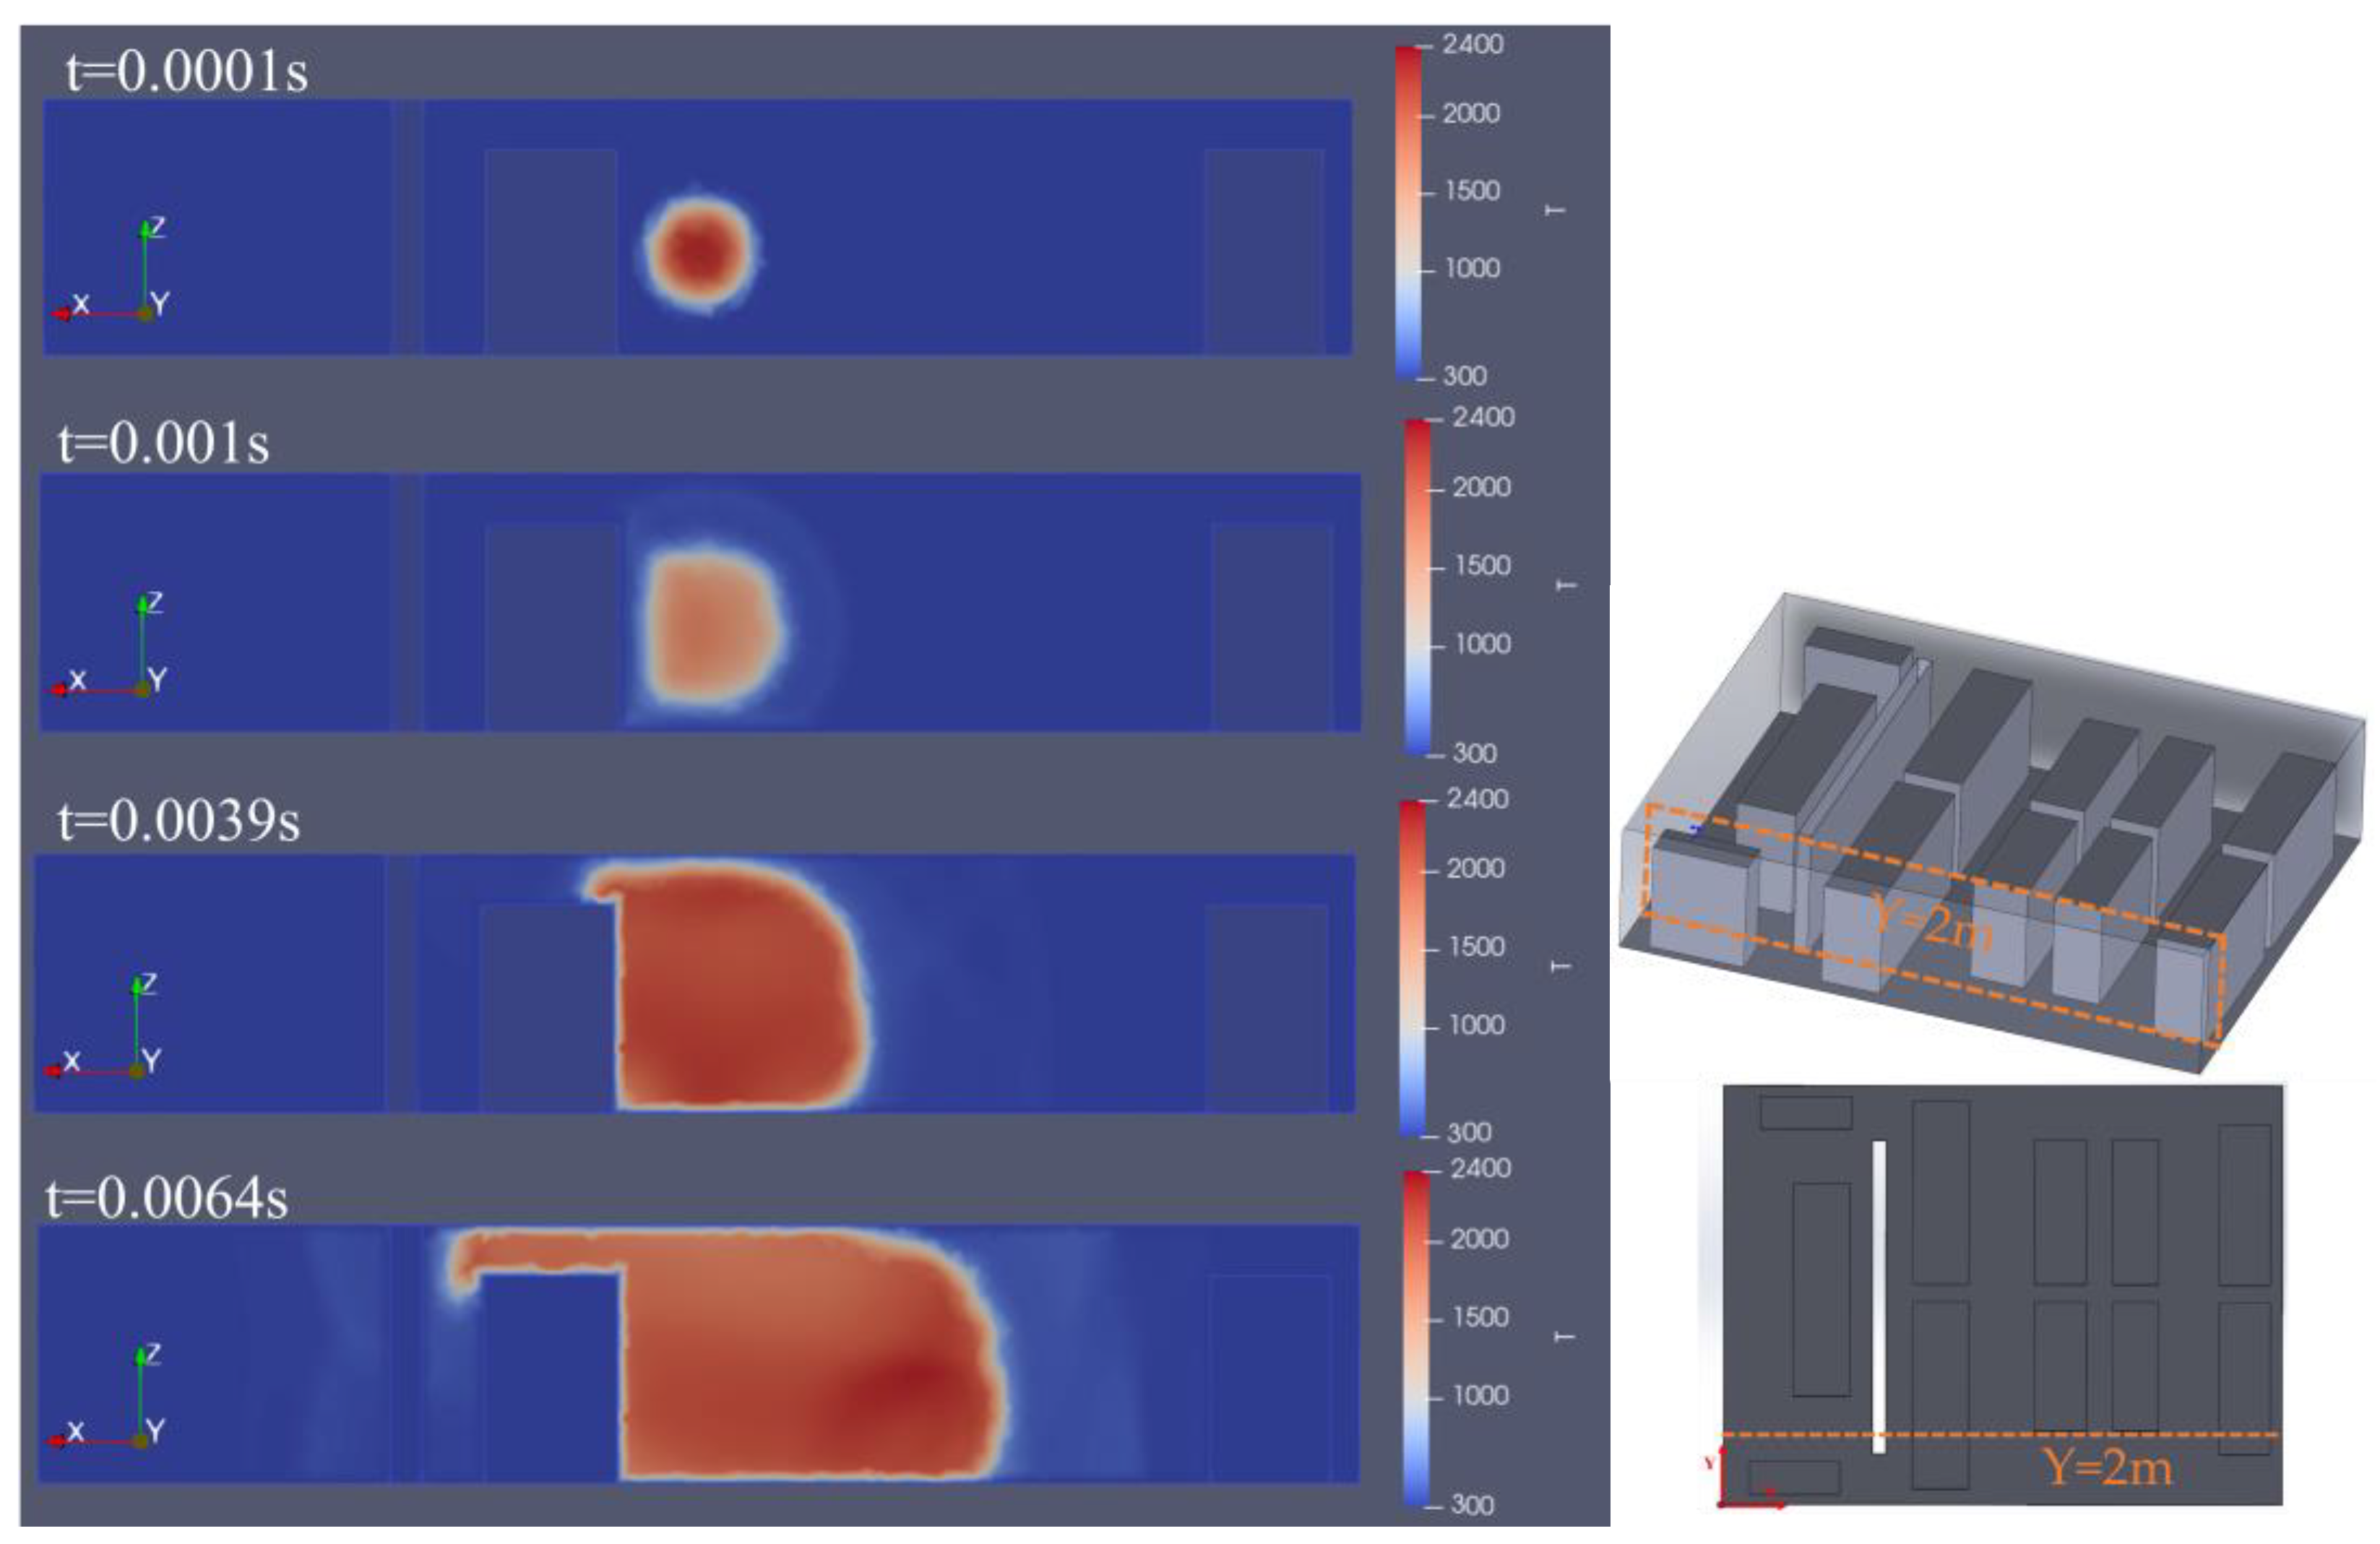
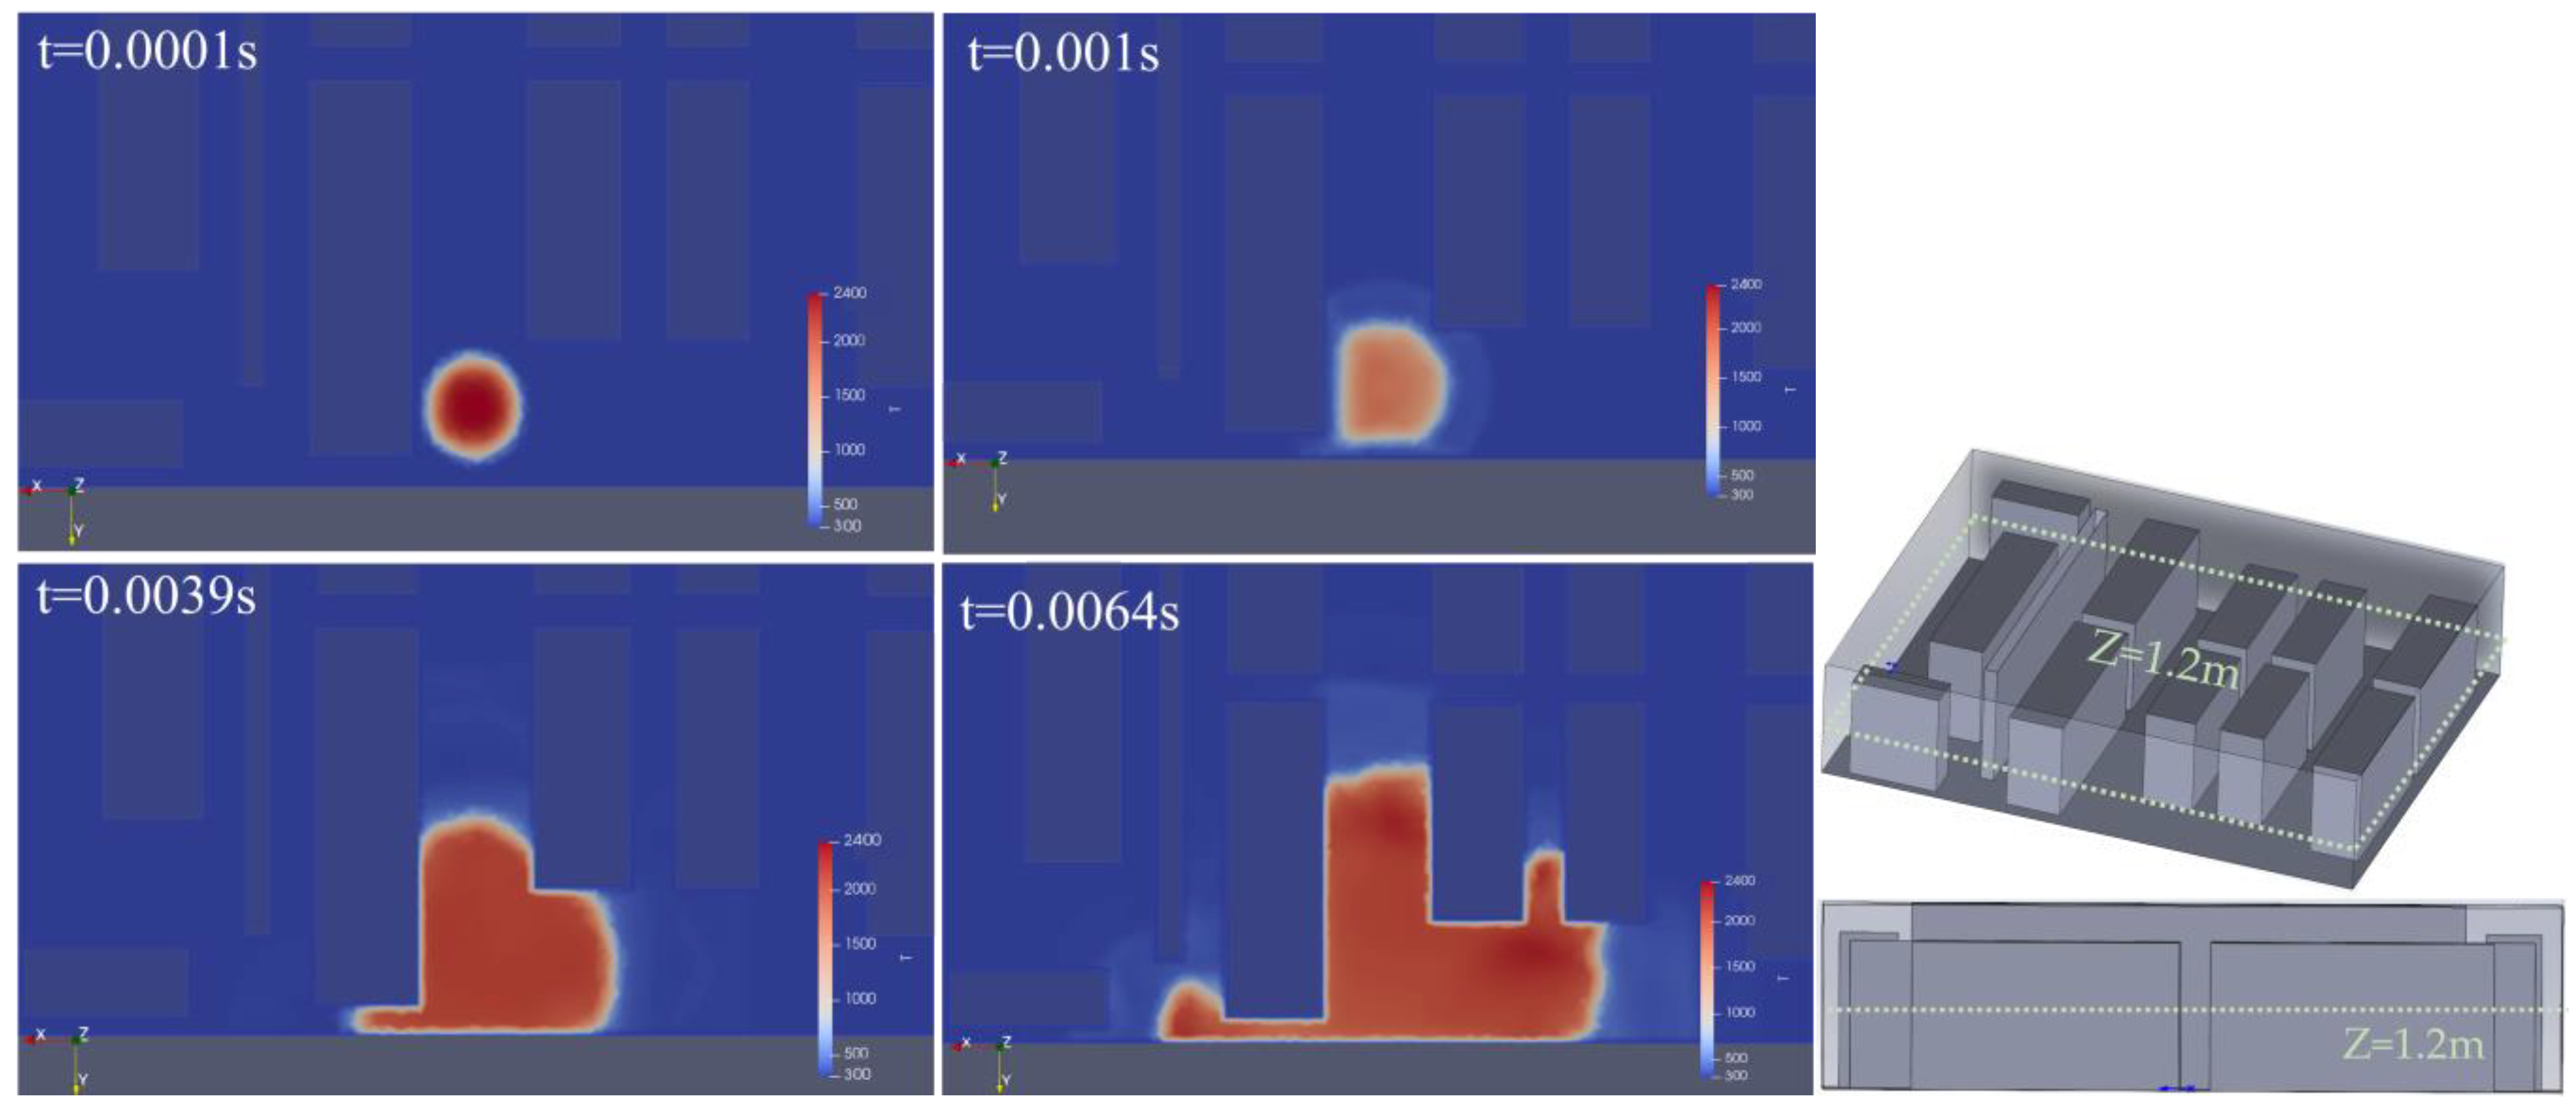
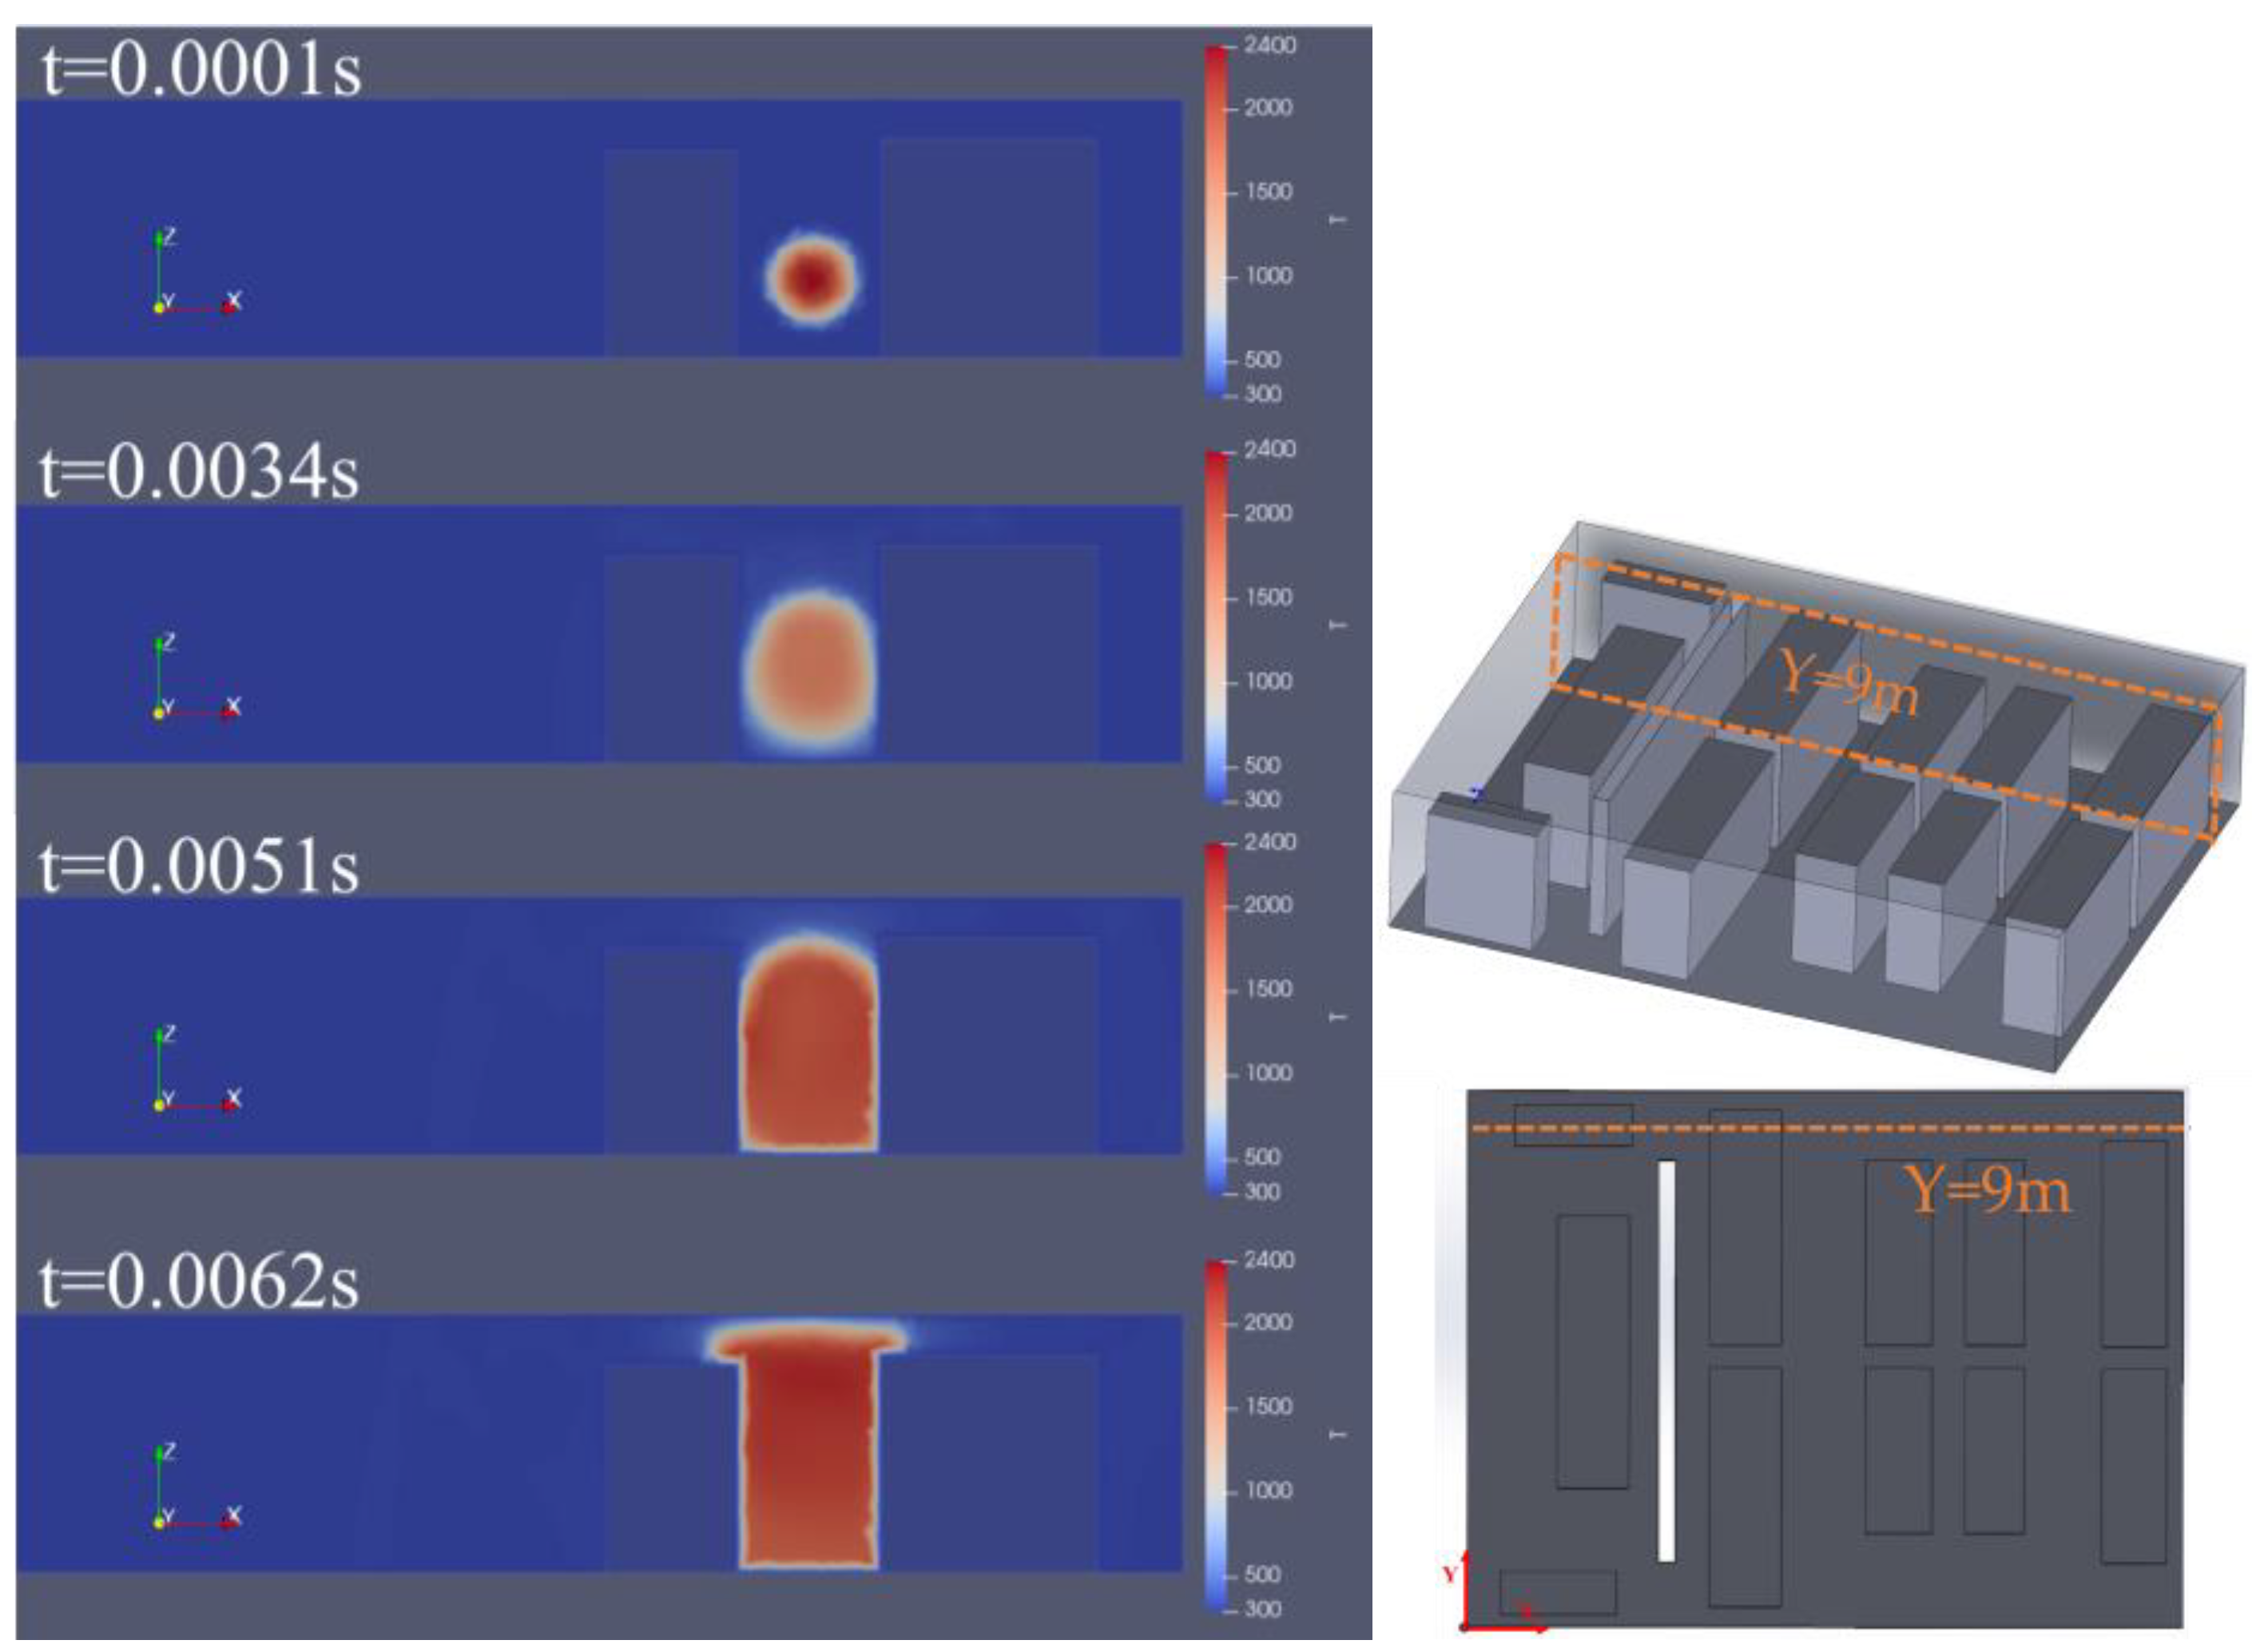
3.2. The Impact of Hydrogen Leak Explosion Location

In the simulations, the hydrogen leakage was kept consistent, and the hydrogen explosions were obtained at three different locations, namely the inside of the fuel cell room, the center of the fuel cell room, and the ventilation duct connecting the fuel cell room and the control room.
For the explosion inside the fuel cell room, it can be observed from Figure 15 and Figure 16 that the temperature field distribution after the hydrogen explosion showed obvious non-uniformity. The high-temperature area was mainly concentrated at the front position of the combustion flame propagation, while the low-temperature area was distributed in the unburned area and the surrounding environment. In the initial stage (t = 0.0001 s), the high-temperature area was concentrated around the ignition source, forming a relatively symmetrical spherical temperature distribution, and the flame expanded evenly outward. At t = 0.001 s, the expansion range of the flame front increased, and an obvious temperature gradient was formed at the boundary, indicating that the combustion reaction was in a stage of intense development, and thermal radiation and convective heat transfer accelerated the expansion of the temperature field. At t = 0.0039 s, the influence of the confined space of flame propagation gradually emerged; the flame front advanced toward the local obstacle, and formed a local high-temperature area near it, while the temperature of the area far away from the propagation direction was still low, indicating that the combustion was constrained by the structural arrangement, which could cause the acceleration of local flow or the enhancement of turbulence. By t = 0.0064 s, the temperature of the high-temperature core area of the flame reached above 2000 K and expanded along the structural gap area and ventilation ducts, forming a local combustion enhancement phenomenon under the influence of surrounding obstacles. The boundary of the high-temperature area showed a clear transition area. This indicates that when the propagation conditions of the flame front meet the requirements, it will extend to a farther position or even the entire geometric space. At the same time, a lower temperature area appeared behind the obstacle; this may be due to the obstruction of the flow field, resulting in a weakened combustion reaction or limited flame propagation. The mechanical structure and wall effectively organized the flame propagation. Overall, flame propagation is affected by the complex flow field and geometric structure, forming an irregular combustion area. Its propagation speed and combustion intensity may fluctuate due to the enhancement of local turbulence or the formation of reflow areas, thereby affecting the overall explosion pressure distribution and combustion rate.
After the hydrogen explosion occurred in the center of the fuel cell room, the evolution of the temperature field showed obvious dynamic characteristics. The temperature propagation characteristics and influencing factors during the explosion can be observed in Figure 17 and Figure 18, which show the temperature slice cloud map at Y = 2 m and Z = 1.6 m, respectively.
In the initial stage of the explosion (t = 0.0001 s), the high-temperature area was mainly concentrated around the ignition source, and the temperature peak reached 2000 K, indicating that a large amount of energy was released during the hydrogen combustion process. At this time, the temperature field was symmetrically distributed without significant diffusion, and a steep temperature gradient (1500 K to 500 K) formed outside the high-temperature area, reflecting the rapid accumulation of energy in the local area. The lowest temperature in the background area was stable at 290 K, indicating that the ambient temperature was not significantly disturbed, which was consistent with the characteristics of local high temperature in the early stage of the explosion.
As time progressed to t = 0.0019 s, the high-temperature area began to expand rapidly outward, and the temperature stratification in the Y direction was significant (from 2000 K to 500 K), while the temperature field in the Z direction showed a certain asymmetry. At t = 0.0042 s, the explosion energy continued to be released, and the area of the high-temperature area expanded significantly. Although the peak temperature remained at 2000 K, the temperature gradient tended to be flat, and the peripheral area was gradually covered by high temperature, indicating that the propagation of the explosion wave was accompanied by the enhancement of heat diffusion and convective heat transfer.
At t = 0.0056 s, the temperature field entered the attenuation stage, and the high-temperature area expanded to the maximum range, but the peak temperature decreased, which may be related to energy dissipation and the mixing of the surrounding medium. At this time, the temperature gradient further weakened, and the observation scale in the Z direction expanded, indicating that the explosion wave was propagated to a farther area. The heat energy gradually diffused to the environment and eventually tended to be evenly distributed. Although the central area still maintained a high temperature (above 500 K), the temperature of the peripheral area gradually returned to the ambient level, reflecting the process of energy transfer to a larger space during the explosion.
In the vents connecting the fuel cell room and the control room, the temperature field evolution of the hydrogen explosion showed significant spatial propagation characteristics (shown in Figure 19 and Figure 20). Based on the temperature slice cloud map of the Y = 2 m and Z = 1.6 m planes, the influence of the ventilation structure on the temperature field distribution during the explosion can be observed, revealing the dynamic evolution law of energy transfer and heat diffusion.
At the beginning of the explosion, the high-temperature area was rapidly formed, and the temperature peak near the vents reached 2400 K, indicating that hydrogen burned violently in this area due to the optimization of local mixing conditions. The temperature field distribution showed obvious high-gradient characteristics, and there was a steep temperature change between the core area and the surrounding environment, indicating that the energy release was mainly limited by the geometric constraints of the ventilation structure. With the propagation of the explosion wave, the vents became the main discharge channel for high-temperature gas. In the Y direction, the temperature stratification phenomenon was significant, and the high-temperature area expanded along the axial direction. The temperature field distribution in the Z direction showed a certain asymmetry, which may be related to the disturbance effect of the ventilation structure and the turbulent mixing effect.
As time went on, the explosion temperature field further expanded under the guidance of the ventilation structure. At 0.0034 s, the temperature in the core area remained at 2400 K, indicating that the explosion combustion process was still in a high-intensity stage. At the same time, the high-temperature area developed along the vent direction, and the range of the intermediate temperature layer from 1500 K to 500 K expanded, indicating that the heat transport at the vent was intensified. By 0.0051 s, the temperature distribution tended to be balanced, and the area of the high-temperature zone further increased, showing the phenomenon of continuous combustion and heat redistribution after the explosion. The diversion effect of the vent significantly affected the migration path of the high-temperature gas, causing the heat to diffuse preferentially toward the control room, but did not cause a significant drop in the temperature of the core area, reflecting the complex balance between the energy release rate and ventilation efficiency.
By 0.0062 s, the spatial expansion of the temperature field tended to saturation; the core area still maintained high temperature, but the proportion of low temperature in the peripheral area gradually decreased, indicating that the high-temperature gas covered a wider range. In the Z direction, the temperature field distribution was stable, and the medium-temperature area gradually dominated, suggesting that thermal convection became the main mechanism for energy dissipation. Compared with the explosion mode in the center of the fuel cell room, the existence of the ventilation structure changed the heat transfer path, causing the high-temperature gas to diffuse mainly along the axial direction rather than radially and symmetrically. This characteristic inhibited the asymmetric development of the shock wave to a certain extent, and also maintained the high-temperature state of the core area for a long time, indicating that the vents played an important regulatory role between energy release and combustion stability.
The flame propagation speed was significantly affected by the ignition position, and the three ignition methods showed different propagation characteristics (Figure 21). When the side of the fuel cell room was ignited (green curve), the initial flame velocity was low. However, due to the geometric constraints and the enhancement of turbulent disturbance, the velocity increased nonlinearly, with a peak value of 450 m/s, indicating that the local turbulence was significantly enhanced. This phenomenon may be due to the coupling of the wall shear effect and the reflected wave, which accelerates the flame to approach the critical speed of the DDT.
As seen in Figure 21, the flame speed of the center ignition (red curve) is relatively high overall, and multiple peaks appear during the propagation process, with the highest being about 420 m/s. Compared with the side ignition, the center flame propagates more evenly, and the acceleration stage is earlier; this may be due to the high energy concentration and the enhancement of the turbulent flame effect, resulting in rapid acceleration of the flame. The speed suddenly increases at 3 m, which may be affected by geometric constraints and energy concentration. This area may be the key point for flame acceleration. Moreover, the flame speed of the vent ignition (blue curve) is low and fluctuates violently. In the early stage, it is affected by strong convection and grows slowly, but the speed increases sharply at 2.5–3.5 m, reaching a peak value (370 m/s) at 3 m, indicating that the vents not only affect the flame propagation path, but also induce local turbulence enhancement. In the subsequent stage, the high-temperature gas diffuses axially, and the flame speed decays rapidly.
In general, the ignition position determines the flame acceleration mechanism and velocity fluctuation characteristics. Side ignition is dominated by the wall effect, the center ignition accelerates faster due to energy concentration, and the vent ignition is guided by ventilation (with large fluctuations in velocity). Studies have shown that the explosion-proof design of hydrogen fuel cell compartments should fully consider the influence of geometric structure on flame propagation, optimize the ventilation system to control the flame rate, and strengthen the impact resistance of key areas to reduce the risk of explosion damage.

4. Discussion

The results show that the interaction between shock waves and flames plays a key role in pressure accumulation under complex geometric structures and turbulent flow environments. The multiple fluctuation characteristics presented in Figure 21 reflect this nonlinear coupling effect, which makes the evolution of explosion overpressure more complicated. In practical engineering applications, the influence of the hydrogen equivalence ratio on explosion overpressure and pressure wave propagation characteristics should be fully considered, and the explosion risk under high equivalence ratio conditions can be effectively reduced through reasonable ventilation design, flameproof measures, and ignition source control strategies.
In addition, the temperature evolution of hydrogen explosions proceeds through three typical stages: energy accumulation, rapid release, and diffusion attenuation. The initial high temperature is concentrated in the ignition core. Then, the explosion wave pushes the high-temperature gas to propagate outward and interact with the ambient medium to form a complex flow structure. The asymmetric distribution of the temperature field may be caused by the geometric constraints of the cabin or the turbulent effect, while the local abnormal temperature value may be related to the scale definition in the numerical calculation. It is worth noting that simulating the explosion near the vents caused the high-temperature gas to diffuse preferentially in the axial direction due to the diversion effect, which inhibited the development of radial shock waves. However, the high temperature in the core area was maintained for a longer time, indicating that ventilation efficiency has a significant effect on the combustion rate. This phenomenon suggests that in the design of ship hydrogen fuel cell compartments, the ventilation structure should be optimized to accelerate energy release and avoid local high-temperature accumulation, which can cause secondary disasters.
Overall, explosion protection design needs to comprehensively consider hydrogen concentration monitoring, spatial layout optimization, and structural impact resistance. For high-concentration leakage scenarios, a rapid response suppression device can be introduced to block the DDT process; in key areas (such as near the control room), ventilation parameters (such as flow rate and cross-sectional area) should be optimized to reduce the intensity of explosion wave propagation. In addition, in areas with dense obstacles, the drastic fluctuations in flame propagation speed may induce turbulence enhancement effects, thereby aggravating the impact load. Therefore, high-strength impact-resistant materials are required to improve the explosion resistance of the structure.

5. Conclusions

Based on the XiFoam solver of the OpenFOAM software, this study constructed a full-scale hydrogen fuel cell compartment explosion model to systematically simulate the explosion process under varying hydrogen concentrations and leakage positions, thereby revealing its key influencing factors.
It is essential to consider the three elements required for combustion: fuel (hydrogen), oxidant (oxygen in air), and an ignition source. In this study, the leakage was simulated within a fuel cell compartment, where hydrogen is stored or processed. Potential leakage causes include mechanical failures, corrosion, or operational errors. The environment in which hydrogen leakage occurs is typically air, containing approximately 21% oxygen. When hydrogen leaks into this environment, it disperses and mixes with the surrounding air, providing the necessary oxidant for combustion. The study emphasizes that the initial hydrogen concentration in the air is a critical factor in determining explosion intensity. Higher hydrogen concentrations result in more severe explosions due to increased fuel availability. Common ignition sources include electrical sparks, static discharge, hot surfaces, or small flames. In this study, ignition was simulated at specific positions within the fuel cell compartment. The results demonstrate that the ignition location significantly affects the temperature field and energy transfer path. For example, ignition near vents promotes axial diffusion, while central ignition leads to symmetric energy accumulation. The results indicate that the initial hydrogen concentration plays a decisive role in determining both the explosion intensity and propagation characteristics.
Hydrogen leakage explosions exhibit pronounced multi-physics coupling among temperature, pressure, and flame characteristics. Temperature evolution proceeds through three stages—energy accumulation, rapid release, and diffusion attenuation—with initial high temperatures concentrated at the ignition core and then axially diffusing under shock wave influence, constrained by cabin geometry and turbulence to yield asymmetric or locally abnormal distributions. The pressure field experiences multiple fluctuations and rebounds due to shock–flame interactions, especially under high hydrogen concentrations where the instantaneous overpressure peak significantly increases, thereby exacerbating explosion destructiveness. Flame propagation is affected by both hydrogen concentration and ignition position; while initial speeds are low due to local obstacles and turbulence, rapid acceleration follows energy accumulation, with local speeds approaching detonation conditions and exhibiting violent fluctuations. Specifically, increasing the hydrogen concentration from ΦH2 = 0.10, ΦH2 = 0.18, to ΦH2 = 0.20 markedly raises the overpressure peak and accelerates the flame from 250 m/s to 370 m/s, with local pressure gradients nearing the deflagration to detonation transition threshold. Moreover, the explosion location significantly influences the temperature field and energy transfer path. Explosions within the fuel cell room generate localized high-temperature zones and asymmetric gradients due to geometric constraints, central explosions display symmetric diffusion with rapid energy accumulation, and explosions near vents promote axial diffusion that inhibits radial shock development while maintaining high core temperatures. The influence of ventilation on explosion characteristics is a promising research direction for future studies.
This study provides theoretical support for the safe design of hydrogen fuel cells for ships and reveals the key factors in the hydrogen explosion process. Future research can further combine velocity field data to quantitatively analyze the relationship between ventilation efficiency and combustion rate. Through numerical simulation, the comprehensive prevention and control systems of hydrogen leakage risks can be improved, promoting the coordinated development of hydrogen fuel ships in terms of safety and environmental benefits.

Author Contributions

Conceptualization, Y.Z.; methodology, Z.M.; software, Z.M.; validation, Y.Z., Q.W. and D.A.; formal analysis, Z.M.; investigation, Y.L.; resources, Y.Z.; data curation, Z.M.; writing—original draft preparation, Z.M.; writing—review and editing, Z.M.; visualization, Z.M.; supervision, Y.Z.; project administration, Y.Z.; funding acquisition, Y.Z. All authors have read and agreed to the published version of the manuscript.

Funding

This research received no external funding.

Data Availability Statement

Data are provided in this article.

Conflicts of Interest

The authors declare no conflicts of interest.

Abbreviations

The following abbreviations are used in this manuscript:
OpenFOAMOpen field operation and manipulation
DDTDeflagration to detonation transition
STAR-CCMSimulation of turbulent flow in arbitrary regions—computational continuum mechanics
CFD-ACEComputational fluid dynamics—advanced computational environment
CFXComputational fluid dynamics eXtreme—ANSYS CFX
PEMPolymer electrolyte membrane
CFDComputational fluid dynamics
RANSReynolds-averaged Navier–Stokes

References

  1. Styhre, L.; Winnes, H.; Black, J.; Lee, J.; Le-Griffin, H. Greenhouse Gas Emissions from Ships in Ports—Case Studies in Four Continents. Transp. Res. Part D Transp. Environ. 2017, 54, 212–224. [Google Scholar] [CrossRef]
  2. Tollefson, J. Hydrogen Vehicles: Fuel of the Future. Nature 2010, 464, 1262–1264. [Google Scholar]
  3. Dodds, P.E.; Staffell, I.; Hawkes, A.D.; Li, F.; Grünewald, P.; McDowall, W.; Ekins, P. Hydrogen and Fuel Cell Technologies for Heating: A Review. Int. J. Hydrogen Energy 2015, 40, 2065–2083. [Google Scholar]
  4. Grove, W.R., XXIV. On Voltaic Series and the Combination of Gases by Platinum. Lond. Edinb. Dublin Philos. Mag. J. Sci. 1839, 14, 127–130. [Google Scholar]
  5. Radojčić, D.; Simić, A.; Momčilović, N.; Motok, M.; Friedhoff, B. Concepts of Contemporary and Innovative Vessels. In Design of Contemporary Inland Waterway Vessels: The Case of the Danube River; Radojčić, D., Simić, A., Momčilović, N., Motok, M., Friedhoff, B., Eds.; Springer International Publishing: Cham, Switzerland, 2021; pp. 269–325. ISBN 978-3-030-77325-0. [Google Scholar]
  6. Fuel Cell Ferry Water Go Round Finds Fleet Investment—Electrive.Com. Available online: https://www.electrive.com/2019/06/13/fuel-cell-ferry-water-go-round-finds-fleet-investment/ (accessed on 18 March 2025).
  7. Garancini, C. Water Go Round, il Traghetto Passeggeri a Idrogeno. Available online: https://www.lifegate.it/traghetto-idrogeno (accessed on 18 March 2025).
  8. AAM and Switch Launch Hydrogen Fuel Cell-Driven Ferry ‘Sea Change’. Available online: https://www.ship-technology.com/news/aam-switch-launch-hydrogen-ferry/ (accessed on 18 March 2025).
  9. 70′ Hydrogen Fuel Cell Passenger Ferry for Switch Maritime. Available online: https://www.allamericanmarine.com/vessels-gallery/sea-change-hydrogen/ (accessed on 18 March 2025).
  10. Johansson, S. Norwegian Hydra Is the First Ship to Run on Liquid Hydrogen. MannTek 2023. Available online: https://www.manntek.se/hydra/ (accessed on 22 September 2023).
  11. Ragland, K.W.; Bryden, K.M.; Kong, S.-C. Combustion Engineering; CRC Press: Boca Raton, FL, USA, 2011; ISBN 1-4200-9250-2. [Google Scholar]
  12. Herath, I.; Madeley, D.; Bradshaw, B. Hydrogen Fuel Cell Taxi: Safety Analysis Experiences. In Proceedings of the 4th IET International Conference on Systems Safety 2009. Incorporating the SaRS Annual Conference, London, UK, 26–28 October 2009; pp. 1–6. [Google Scholar]
  13. Dorofeev, S.; Kuznetsov, M.; Alekseev, V.; Efimenko, A.; Breitung, W. Evaluation of Limits for Effective Flame Acceleration in Hydrogen Mixtures. J. Loss Prev. Process Ind. 2001, 14, 583–589. [Google Scholar]
  14. Groethe, M.; Colton, J.; Chiba, S. Hydrogen Deflagration Safety Studies in a Semi-Open Space. In Proceedings of the 14th World Hydrogen Energy, Montreal, QC, Canada, 9–13 June 2002. [Google Scholar]
  15. Kuznetsov, M.; Alekseev, V.; Yankin, Y.; Dorofeev, S. Slow and Fast Deflagrations in Hydrocarbon-Air Mixtures. Combust. Sci. Technol. 2002, 174, 157–172. [Google Scholar]
  16. Breitung, W.; Dorofeev, S.; Kotchourko, A.; Redlinger, R.; Scholtyssek, W.; Bentaib, A.; L’Heriteau, J.-P.; Pailhories, P.; Eyink, J.; Movahed, M. Integral Large Scale Experiments on Hydrogen Combustion for Severe Accident Code Validation-HYCOM. Nucl. Eng. Des. 2005, 235, 253–270. [Google Scholar]
  17. Molkov, V. Hydrogen Safety Research: State-of-the-Art. In Proceedings of the 5th International Seminar on Fire and Explosion Hazards, Edinburgh, UK, 23–27 April 2007; Volume 23, p. 27. [Google Scholar]
  18. Ng, H.D.; Lee, J.H. Comments on Explosion Problems for Hydrogen Safety. J. Loss Prev. Process Ind. 2008, 21, 136–146. [Google Scholar]
  19. Dorofeev, S.B. Flame Acceleration and Explosion Safety Applications. Proc. Combust. Inst. 2011, 33, 2161–2175. [Google Scholar]
  20. Xiao, H. Experimental and Numerical Study of Dynamics of Premixed Hydrogen-Air Flames Propagating in Ducts; Springer: Berlin/Heidelberg, Germany, 2015; ISBN 3-662-48379-3. [Google Scholar]
  21. McConnell, V.P. Now, Voyager? The Increasing Marine Use of Fuel Cells. Fuel Cells Bull. 2010, 2010, 12–17. [Google Scholar]
  22. Choi, C.H.; Yu, S.; Han, I.-S.; Kho, B.-K.; Kang, D.-G.; Lee, H.Y.; Seo, M.-S.; Kong, J.-W.; Kim, G.; Ahn, J.-W.; et al. Development and Demonstration of PEM Fuel-Cell-Battery Hybrid System for Propulsion of Tourist Boat. Int. J. Hydrogen Energy 2016, 41, 3591–3599. [Google Scholar] [CrossRef]
  23. Takeno, K.; Okabayashi, K.; Kouchi, A.; Nonaka, T.; Hashiguchi, K.; Chitose, K. Dispersion and Explosion Field Tests for 40 MPa Pressurized Hydrogen. Int. J. Hydrogen Energy 2007, 32, 2144–2153. [Google Scholar] [CrossRef]
  24. Mao, X.; Ying, R.; Yuan, Y.; Li, F.; Shen, B. Simulation and Analysis of Hydrogen Leakage and Explosion Behaviors in Various Compartments on a Hydrogen Fuel Cell Ship. Int. J. Hydrogen Energy 2021, 46, 6857–6872. [Google Scholar] [CrossRef]
  25. Seyam, S.; Dincer, I.; Agelin-Chaab, M. An Innovative Study on a Hybridized Ship Powering System with Fuel Cells Using Hydrogen and Clean Fuel Blends. Appl. Therm. Eng. 2023, 221, 119893. [Google Scholar] [CrossRef]
  26. Sato, Y.; Iwabuchi, H.; Groethe, M.; Merilo, E.; Chiba, S. Experiments on Hydrogen Deflagration. J. Power Sources 2006, 159, 144–148. [Google Scholar] [CrossRef]
  27. Middha, P.; Hansen, O.R.; Storvik, I.E. Validation of CFD-Model for Hydrogen Dispersion. J. Loss Prev. Process Ind. 2009, 22, 1034–1038. [Google Scholar]
  28. Lipatnikov, A.N.; Chomiak, J. Turbulent Flame Speed and Thickness: Phenomenology, Evaluation, and Application in Multi-Dimensional Simulations. Prog. Energy Combust. Sci. 2002, 28, 1–74. [Google Scholar] [CrossRef]
  29. Kang, H.-S.; Kim, S.-M.; Kim, J. Safety Issues of a Hydrogen Refueling Station and a Prediction for an Overpressure Reduction by a Barrier Using OpenFOAM Software for an SRI Explosion Test in an Open Space. Energies 2022, 15, 7556. [Google Scholar] [CrossRef]
  30. Aung, T.T.; Terada, A.; Ryutaro, H.; Nagaishi, R.; Kadowaki, S. Simulation of the Self-Propagating Hydrogen-Air Premixed Flame in a Closed-Vessel by an Open-Source CFD Code. J. Nucl. Sci. Technol. 2022, 59, 573–579. [Google Scholar] [CrossRef]
  31. Shi, J.; Zhang, H.; Xiao, J.; Wen, J.; Usmani, A.S. Numerical Investigation of the Effect of Riser Spacing on Gas Explosion from Semi-Submersible Platform. Process Saf. Environ. Prot. 2024, 188, 239–250. [Google Scholar] [CrossRef]
  32. Blaylock, M.; Klebanoff, L. Hydrogen Gas Dispersion Studies for Hydrogen Fuel Cell Vessels I: Vent Mast Releases. Int. J. Hydrogen Energy 2022, 47, 21506–21516. [Google Scholar]
  33. Choi, S.; Jeong, B. CFD Simulation of Gas Dispersion at Hydrogen Bunkering Station. J. Int. Marit. Saf. Environ. Aff. Shipp. 2023, 7, 2261350. [Google Scholar]
  34. Kim, B.; Hwang, K.-I. Numerical Validation of a Hydrogen Leakage and Dispersion Experiment Considering Ship Kinetic Characteristics. J. Adv. Mar. Eng. Technol. (JAMET) 2023, 47, 352–359. [Google Scholar]
  35. Pasculescu, V.M.; Ghicioi, E.; Vlasin, N.I.; Suvar, M.C.; Morar, M.S. Numerical Modelling as a Tool for Investigating Hydrogen Explosions. Inżynieria Miner. 2024, 1, 71–76. [Google Scholar]
  36. Bédard-Tremblay, L.; Fang, L.; Bauwens, L.; Cheng, Z.; Tchouvelev, A.V. Numerical Simulation of Hydrogen–Air Detonation for Damage Assessment in Realistic Accident Scenarios. J. Loss Prev. Process Ind. 2008, 21, 154–161. [Google Scholar] [CrossRef]
  37. Swain, M.R.; Filoso, P.; Grilliot, E.S.; Swain, M.N. Hydrogen Leakage into Simple Geometric Enclosures. Int. J. Hydrogen Energy 2003, 28, 229–248. [Google Scholar]
  38. Schefer, R.W.; Groethe, M.; Houf, W.G.; Evans, G. Experimental Evaluation of Barrier Walls for Risk Reduction of Unintended Hydrogen Releases. Int. J. Hydrogen Energy 2009, 34, 1590–1606. [Google Scholar] [CrossRef]
  39. Venetsanos, A.; Baraldi, D.; Adams, P.; Heggem, P.; Wilkening, H. CFD Modelling of Hydrogen Release, Dispersion and Combustion for Automotive Scenarios. J. Loss Prev. Process Ind. 2008, 21, 162–184. [Google Scholar]
  40. Rigas, F.; Sklavounos, S. Evaluation of Hazards Associated with Hydrogen Storage Facilities. Int. J. Hydrogen Energy 2005, 30, 1501–1510. [Google Scholar]
  41. Wilkening, H.; Baraldi, D. CFD Modelling of Accidental Hydrogen Release from Pipelines. Int. J. Hydrogen Energy 2007, 32, 2206–2215. [Google Scholar] [CrossRef]
  42. Liu, Y.; Qin, Y.; Sheng, S.; Chen, H.; Wang, B. Numerical Investigation on Dispersion of Hydrogen in Hydrogen Powered Automobile. J. Saf. Sci. Technol. 2009, 5, 5–8. [Google Scholar]
  43. Li, J.; Zhao, Y.; Zheng, J. Simulation and Analysis on Leakage and Explosion of High Pressure Hydrogen in Hydrogen Refueling Station. Eng. Sci. 2015, 49, 1389–1394. [Google Scholar]
  44. Li, J.-C.; Xu, H.; Zhou, K.; Li, J.-Q. A Review on the Research Progress and Application of Compressed Hydrogen in the Marine Hydrogen Fuel Cell Power System. Heliyon 2024, 10, e25304. [Google Scholar] [CrossRef]
  45. Dongxing, W.; Zhe, W.; Fan, Z.; Fenghui, H.; Yulong, J. State-of-the-Art and Prospect of Technical Standards for the Ships Powered by Hydrogen Fuel Cells. J. Transp. Inf. Saf. 2023, 41, 157–167. [Google Scholar]
  46. Inal, O.B.; Deniz, C. Assessment of Fuel Cell Types for Ships: Based on Multi-Criteria Decision Analysis. J. Clean. Prod. 2020, 265, 121734. [Google Scholar] [CrossRef]
  47. Wang, X.; Zhu, J.; Han, M. Industrial Development Status and Prospects of the Marine Fuel Cell: A Review. J. Mar. Sci. Eng. 2023, 11, 238. [Google Scholar] [CrossRef]
  48. Elkafas, A.G.; Rivarolo, M.; Gadducci, E.; Magistri, L.; Massardo, A.F. Fuel Cell Systems for Maritime: A Review of Research Development, Commercial Products, Applications, and Perspectives. Processes 2022, 11, 97. [Google Scholar] [CrossRef]
  49. Bauwens, C.R.; Chao, J.; Dorofeev, S.B. Effect of Hydrogen Concentration on Vented Explosion Overpressures from Lean Hydrogen–Air Deflagrations. Int. J. Hydrogen Energy 2012, 37, 17599–17605. [Google Scholar] [CrossRef]
  50. Rui, S.; Wang, C.; Guo, S.; Jing, R.; Li, Q. Hydrogen-Air Explosion with Concentration Gradients in a Cubic Enclosure. Process Saf. Environ. Prot. 2021, 151, 141–150. [Google Scholar] [CrossRef]
  51. Ma, X.; Nie, B.; Wang, W.; Zhao, D.; Zhang, Y.; Yang, Y.; Ma, C.; Hu, B.; Chang, L.; Yang, L. Effect of Hydrogen Concentration, Initial Pressure and Temperature on Mechanisms of Hydrogen Explosion in Confined Spaces. Combust. Flame 2024, 269, 113696. [Google Scholar] [CrossRef]
  52. Yasari, E.; Runsten, J.; Andric, J. Tutorial XiFoam; Chalmers University of Technology: Gothenburg, Sweden, 2010. [Google Scholar]
  53. Zhou, Y.; Li, Y.; Gao, W. Experimental Investigation on Unconfined Hydrogen Explosion with Different Ignition Height. Int. J. Hydrogen Energy 2023, 48, 20112–20123. [Google Scholar] [CrossRef]
  54. Pratt, J.W.; Klebanoff, L.E. Feasibility of the SF-BREEZE: A Zero-Emission, Hydrogen Fuel Cell, High-Speed Passenger Ferry; U.S. Department of Transportation: Washington, DC, USA, 2016. [Google Scholar]
  55. Klebanoff, L. Hydrogen and Fuel Cells for Maritime Applications: From Sandia Feasibility Studies to First Demonstrations; Sandia National Lab. (SNL-CA): Livermore, CA, USA, 2022. [Google Scholar]
Figure 1. Experimental model.
Jmse 13 00667 g001
Figure 2. The simulation part is in the verification simulation.
Jmse 13 00667 g002
Figure 3. Flame propagation images at 1.5 m ignition height in experiment, reproduced from reference [53], with permission from Elsevier, 2025.
Jmse 13 00667 g003
Figure 4. Flame propagation images at 1.5 m ignition height in simulation.
Jmse 13 00667 g004
Figure 5. Comparison of flame propagation distance (h = 1.5 m).
Jmse 13 00667 g005
Figure 6. Comparison of flame propagation velocity between experimental and simulated data.
Jmse 13 00667 g006
Figure 7. Model size.
Jmse 13 00667 g007
Figure 8. Simulating the velocity field of hydrogen leakage in the X–Y–Z directions at 2 s.
Jmse 13 00667 g008
Figure 9. Mesh sensitivity analysis.
Jmse 13 00667 g009
Figure 10. Overpressure at four probes at three hydrogen concentrations (ΦH2 = 0.10, ΦH2 = 0.18, and ΦH2 = 0.20): (a) probe 1; (b) probe 2; (c) probe 3; (d) probe 4.
Jmse 13 00667 g010
Figure 11. The heat release rate at the explosion point.
Jmse 13 00667 g011
Figure 12. The explosion overpressure cloud diagram at 0.0055 s at Y = 2 m (explosion position 3).
Jmse 13 00667 g012
Figure 13. The explosion overpressure cloud diagram at 0.0055 s at Z = 1.6 m (explosion position 3).
Jmse 13 00667 g013
Figure 14. The Y-axis velocity component of the flame front at 0.0055 s at X = 12 m.
Jmse 13 00667 g014
Figure 15. Flame front temperature distribution cloud diagram at 0.0001 s, 0.001 s, 0.0039 s, and 0.0064 s at Y = 2 m (explosion position 1).
Jmse 13 00667 g015
Figure 16. Flame front temperature distribution cloud diagram at 0.0001 s, 0.001 s, 0.0039 s, and 0.0064 s at Z = 1.2 m (explosion position 1).
Jmse 13 00667 g016
Figure 17. Flame front temperature distribution cloud diagram at 0.0001 s, 0.001 s, 0.0039 s, and 0.0064 s at Y = 5 m (explosion position 2).
Jmse 13 00667 g017
Figure 18. Flame front temperature distribution cloud diagram at 0.0001 s, 0.001 s, 0.0039 s, and 0.0064 s at Z = 1.2 m (explosion position 2).
Jmse 13 00667 g018
Figure 19. Flame front temperature distribution cloud diagram at 0.0001 s, 0.001 s, 0.0039 s, and 0.0064 s at Y = 9 m (explosion position 4).
Jmse 13 00667 g019
Figure 20. Flame front temperature distribution cloud diagram at 0.0001 s, 0.001 s, 0.0039 s, and 0.0064 s at Z = 1.2 m (explosion position 4).
Jmse 13 00667 g020
Figure 21. The flame front velocity at the side, center, and vent explosion positions at the final moment of the explosion.
Jmse 13 00667 g021
Table 1. Mesh characteristics of verification simulation.
Mesh SizePointsFacesCellsMeshing Method
0.08 m71,498200,88064,800Block Mesh
Table 2. The parameters of SF-BREEZE [55].
Configuration NameParameter
Overall length33 m
Molded breadth10 m
Load draught1.4 m
Overall displacement135 t
Specified fuel consumption2400 kg LH2 per day
Total installed power4.92 MW
Standard passenger capacity150
Range100 nautical miles (NM)
Service speed35 knots
Endurance time4 h
Table 3. The correlation of numerical values with respective placements.
No.Position
1DC–DC converter and DC–AC inverter
2Switchboard
3Control room and fuel cell room partition wall
4Leak location
5Vents
6Hydrogen fuel cells
7Explosion point 1
8Explosion point 2
9Explosion point 3
10Explosion point 4
Table 4. Mesh characteristics.
Mesh SizePointsFacesCellsMeshing Method
0.08 m7,202,04874,723,712567,992Tetrahedral mesh
Disclaimer/Publisher’s Note: The statements, opinions and data contained in all publications are solely those of the individual author(s) and contributor(s) and not of MDPI and/or the editor(s). MDPI and/or the editor(s) disclaim responsibility for any injury to people or property resulting from any ideas, methods, instructions or products referred to in the content.

